Embed Size (px)
Citation preview
Addressing Barriers to Learning that Create Inequality In Kent School District
Secondary Data Analysis RESULTS
7-‐11-‐14
Education is the most powerful tool that you can use to change the world
-‐ Nelson Mandela
Prepared for Kent School District with support from Multicare Health Systems by:
Carolyn Kramer, MPH
CK Consulting 206-‐240-‐3989
[email protected] www.ckconsults.com
Copyright © 2014 CK Consulting. All Rights Reserved.
1
Table of Contents
I. Executive Summary ........................................................................................................................................ 2
II. Background ...................................................................................................................................................... 3
A. The Health-‐Learning-‐Poverty/Race/Ethnicity Connection ...................................................... 3
B. A Hybrid Approach ..................................................................................................................................... 5
III. Results of Secondary Data Analysis .................................................................................................... 7
A. City of Kent ..................................................................................................................................................... 7
B. Kent School District ................................................................................................................................. 10
IV. Kent’s Educationally Relevant Health Disparities ....................................................................... 14
A. Vision ............................................................................................................................................................. 14
B. Asthma .......................................................................................................................................................... 14
C. Teen Pregnancy ......................................................................................................................................... 15
D. Aggression and Violence ....................................................................................................................... 15
E. Physical Activity ........................................................................................................................................ 17
F. Breakfast ...................................................................................................................................................... 19
G. Inattention and Hyperactivity ............................................................................................................ 20
V. Conclusions ..................................................................................................................................................... 21
VI. A note about the author, Carolyn J Kramer, MPH ........................................................................ 22
VII. References .................................................................................................................................................. 23
Copyright © 2014 CK Consulting. All Rights Reserved.
2
You cannot educate a youth who is not healthy and you cannot keep a youth healthy who is not educated.
–Dr. Jocelyn Elders, former US Surgeon General
I. Executive Summary Education should be the pathway out of poverty. However, in the United States, it is not. Most kids who are born in poverty will die in poverty. The best teachers, most well intentioned principals, and most advanced curriculum cannot overcome the barriers to learning that kids living in poverty struggle with. A ‘double dose’ of reading or math will not be effective if the youth is distracted by an untreated cavity, or spent the night in an ER due to an asthma attack, or was harassed on their way to school. Youth are profoundly affected by the world around them, and when that environment is in crisis, the youth will also be in crisis. It is a simple truth: if a youth is not motivated and ready to learn, they will not learn Addressing barriers to learning is not a simple process that schools can or should undertake on their own. Throughout the country, schools, like Pioneer Elementary School in Auburn, WA and Rainier Beach High School and their community partner Communities in Schools Seattle, have shown that when school leaders, families, students, and community-‐based organizations work together, barriers to learning can be overcome and students can thrive socially, emotionally, physically, and academically. Key to these efforts is a comprehensive and coordinated team effort, guided by Coordinated School Health (CSH), a strategy where schools and their surrounding communities work in partnership to create a seamless system of support to address student needs. In the fall of 2014, Kent School District’s Wellness Committee, through financial support from Multicare Health Systems, engaged Carolyn Kramer of CK Consulting to complete an analysis of secondary data to review community health data and academic indicators, particularly health data that are known to impact educational outcomes. This purpose of this report is twofold: 1) to outline the full approach a district can take to address barriers to learning in a coordinated and comprehensive way, and 2) to share findings from the analysis of secondary data. The findings indicate that teen pregnancy, aggression and violence, and lack of participation in school breakfast are the most significant barriers to learning that youth in Kent School District face. Addressing any of these three areas can have a major impact on reducing the amount of inequality in the district. This report is the beginning of a comprehensive process that will allow Kent School District’s leaders to plan and prioritize their efforts to allow for more efficient use of resources to address the most critical barriers to learning for students in the District’s schools. By prioritizing and targeting needed services with the surrounding community, Kent School District can improve both academic and health outcomes for all youth in the district and, in time, narrow the achievement gap.
Copyright © 2014 CK Consulting. All Rights Reserved.
3
II. Background
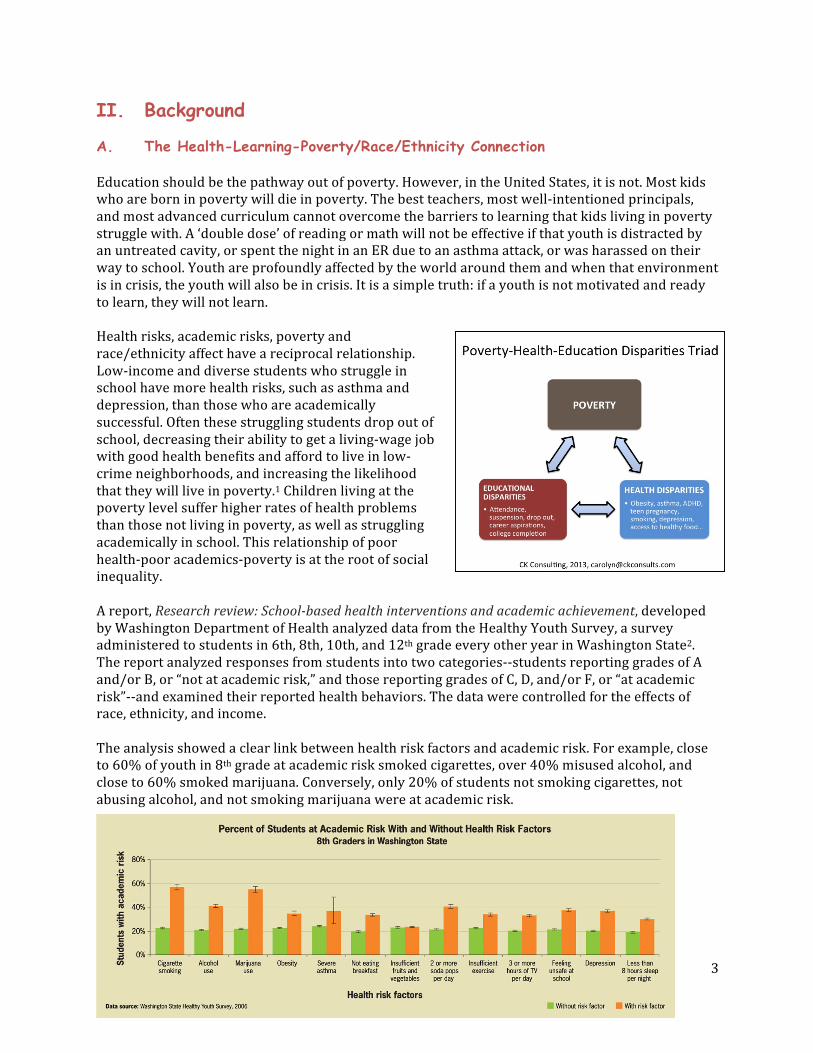
A. The Health-Learning-Poverty/Race/Ethnicity Connection Education should be the pathway out of poverty. However, in the United States, it is not. Most kids who are born in poverty will die in poverty. The best teachers, most well-‐intentioned principals, and most advanced curriculum cannot overcome the barriers to learning that kids living in poverty struggle with. A ‘double dose’ of reading or math will not be effective if that youth is distracted by an untreated cavity, or spent the night in an ER due to an asthma attack, or was harassed on their way to school. Youth are profoundly affected by the world around them and when that environment is in crisis, the youth will also be in crisis. It is a simple truth: if a youth is not motivated and ready to learn, they will not learn. Health risks, academic risks, poverty and race/ethnicity affect have a reciprocal relationship. Low-‐income and diverse students who struggle in school have more health risks, such as asthma and depression, than those who are academically successful. Often these struggling students drop out of school, decreasing their ability to get a living-‐wage job with good health benefits and afford to live in low-‐crime neighborhoods, and increasing the likelihood that they will live in poverty.1 Children living at the poverty level suffer higher rates of health problems than those not living in poverty, as well as struggling academically in school. This relationship of poor health-‐poor academics-‐poverty is at the root of social inequality. A report, Research review: School-‐based health interventions and academic achievement, developed by Washington Department of Health analyzed data from the Healthy Youth Survey, a survey administered to students in 6th, 8th, 10th, and 12th grade every other year in Washington State2. The report analyzed responses from students into two categories-‐-‐students reporting grades of A and/or B, or “not at academic risk,” and those reporting grades of C, D, and/or F, or “at academic risk”-‐-‐and examined their reported health behaviors. The data were controlled for the effects of race, ethnicity, and income. The analysis showed a clear link between health risk factors and academic risk. For example, close to 60% of youth in 8th grade at academic risk smoked cigarettes, over 40% misused alcohol, and close to 60% smoked marijuana. Conversely, only 20% of students not smoking cigarettes, not abusing alcohol, and not smoking marijuana were at academic risk.
Copyright © 2014 CK Consulting. All Rights Reserved.
4
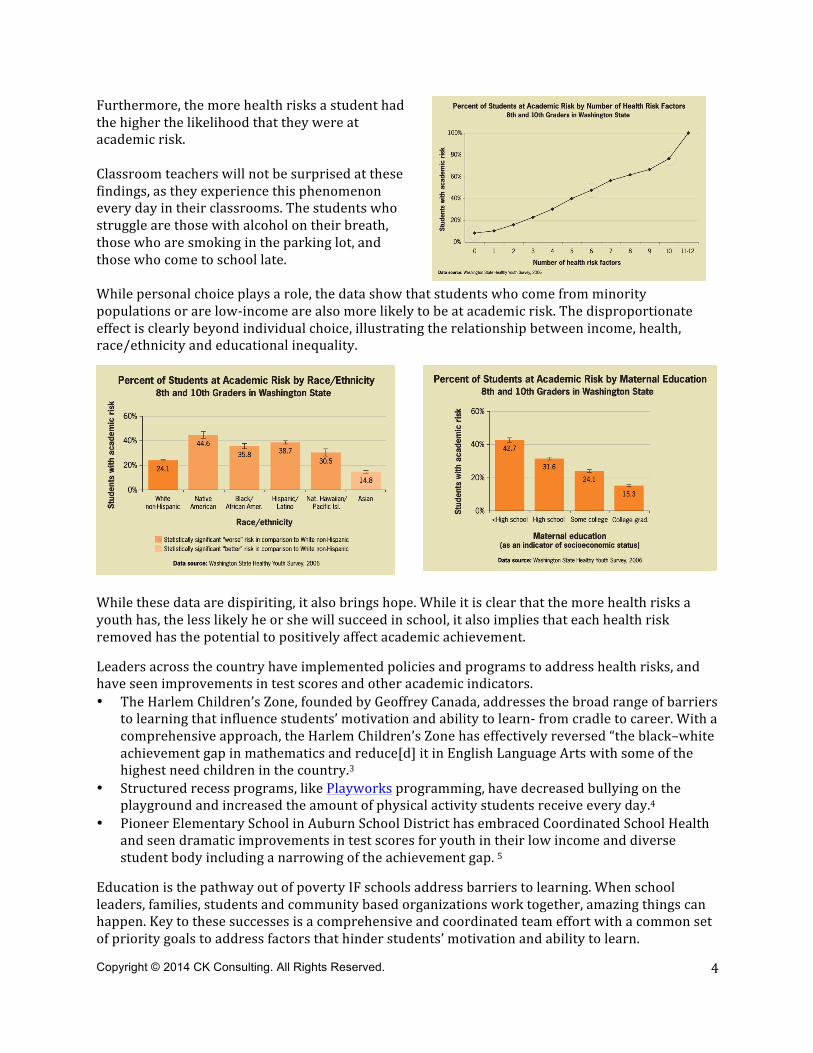
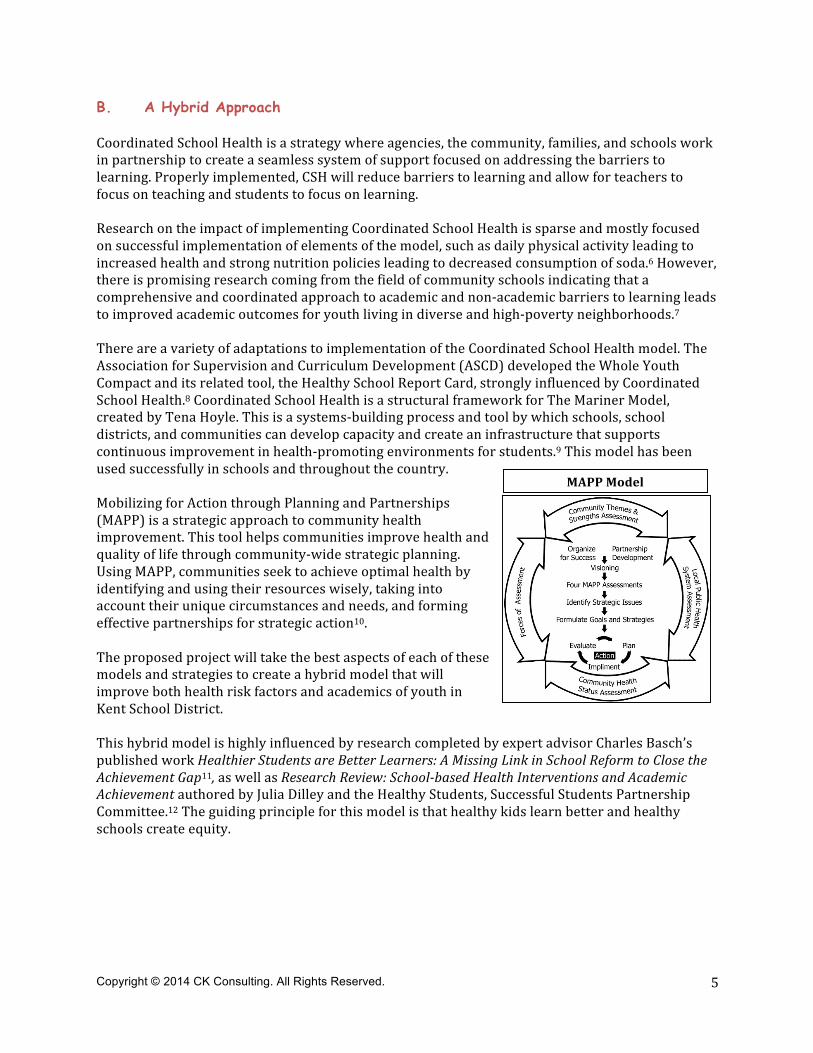
Furthermore, the more health risks a student had the higher the likelihood that they were at academic risk. Classroom teachers will not be surprised at these findings, as they experience this phenomenon every day in their classrooms. The students who struggle are those with alcohol on their breath, those who are smoking in the parking lot, and those who come to school late. While personal choice plays a role, the data show that students who come from minority populations or are low-‐income are also more likely to be at academic risk. The disproportionate effect is clearly beyond individual choice, illustrating the relationship between income, health, race/ethnicity and educational inequality.
While these data are dispiriting, it also brings hope. While it is clear that the more health risks a youth has, the less likely he or she will succeed in school, it also implies that each health risk removed has the potential to positively affect academic achievement. Leaders across the country have implemented policies and programs to address health risks, and have seen improvements in test scores and other academic indicators. • The Harlem Children’s Zone, founded by Geoffrey Canada, addresses the broad range of barriers
to learning that influence students’ motivation and ability to learn-‐ from cradle to career. With a comprehensive approach, the Harlem Children’s Zone has effectively reversed “the black–white achievement gap in mathematics and reduce[d] it in English Language Arts with some of the highest need children in the country.3
• Structured recess programs, like Playworks programming, have decreased bullying on the playground and increased the amount of physical activity students receive every day.4
• Pioneer Elementary School in Auburn School District has embraced Coordinated School Health and seen dramatic improvements in test scores for youth in their low income and diverse student body including a narrowing of the achievement gap. 5
Education is the pathway out of poverty IF schools address barriers to learning. When school leaders, families, students and community based organizations work together, amazing things can happen. Key to these successes is a comprehensive and coordinated team effort with a common set of priority goals to address factors that hinder students’ motivation and ability to learn.
Copyright © 2014 CK Consulting. All Rights Reserved.
5
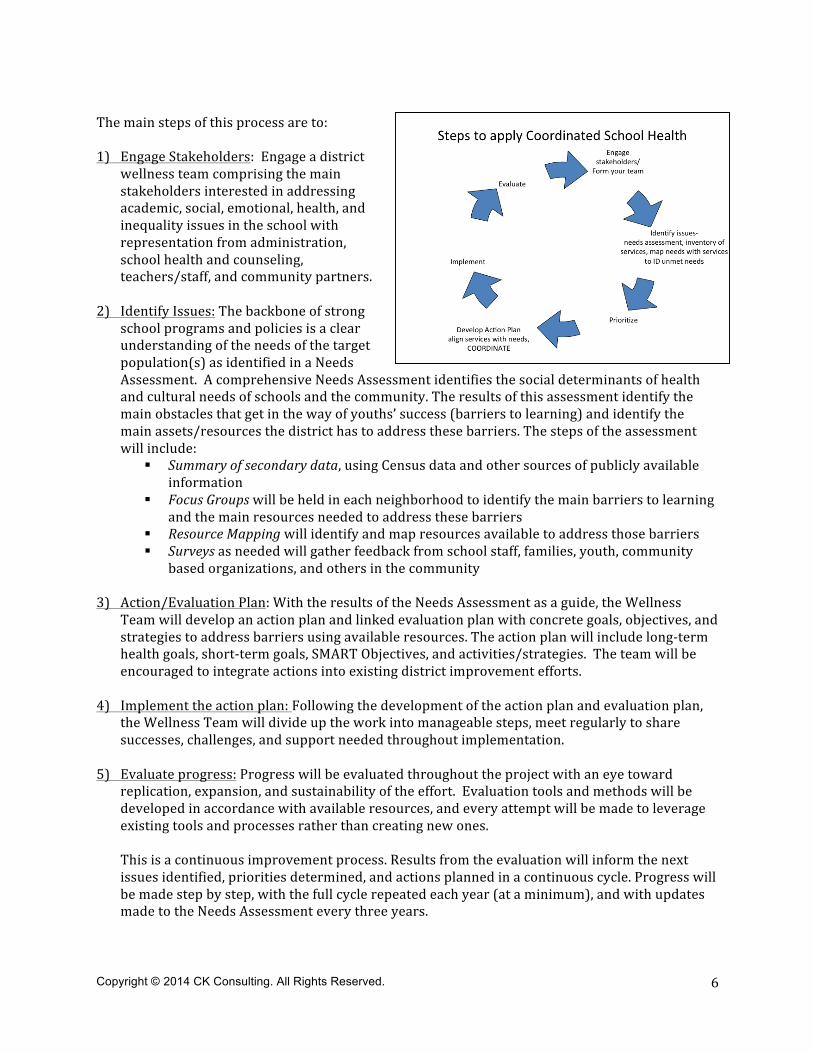
B. A Hybrid Approach Coordinated School Health is a strategy where agencies, the community, families, and schools work in partnership to create a seamless system of support focused on addressing the barriers to learning. Properly implemented, CSH will reduce barriers to learning and allow for teachers to focus on teaching and students to focus on learning. Research on the impact of implementing Coordinated School Health is sparse and mostly focused on successful implementation of elements of the model, such as daily physical activity leading to increased health and strong nutrition policies leading to decreased consumption of soda.6 However, there is promising research coming from the field of community schools indicating that a comprehensive and coordinated approach to academic and non-‐academic barriers to learning leads to improved academic outcomes for youth living in diverse and high-‐poverty neighborhoods.7 There are a variety of adaptations to implementation of the Coordinated School Health model. The Association for Supervision and Curriculum Development (ASCD) developed the Whole Youth Compact and its related tool, the Healthy School Report Card, strongly influenced by Coordinated School Health.8 Coordinated School Health is a structural framework for The Mariner Model, created by Tena Hoyle. This is a systems-‐building process and tool by which schools, school districts, and communities can develop capacity and create an infrastructure that supports continuous improvement in health-‐promoting environments for students.9 This model has been used successfully in schools and throughout the country. Mobilizing for Action through Planning and Partnerships (MAPP) is a strategic approach to community health improvement. This tool helps communities improve health and quality of life through community-‐wide strategic planning. Using MAPP, communities seek to achieve optimal health by identifying and using their resources wisely, taking into account their unique circumstances and needs, and forming effective partnerships for strategic action10. The proposed project will take the best aspects of each of these models and strategies to create a hybrid model that will improve both health risk factors and academics of youth in Kent School District. This hybrid model is highly influenced by research completed by expert advisor Charles Basch’s published work Healthier Students are Better Learners: A Missing Link in School Reform to Close the Achievement Gap11, as well as Research Review: School-‐based Health Interventions and Academic Achievement authored by Julia Dilley and the Healthy Students, Successful Students Partnership Committee.12 The guiding principle for this model is that healthy kids learn better and healthy schools create equity.
MAPP Model
Copyright © 2014 CK Consulting. All Rights Reserved.
6
The main steps of this process are to: 1) Engage Stakeholders: Engage a district
wellness team comprising the main stakeholders interested in addressing academic, social, emotional, health, and inequality issues in the school with representation from administration, school health and counseling, teachers/staff, and community partners.
2) Identify Issues: The backbone of strong school programs and policies is a clear understanding of the needs of the target population(s) as identified in a Needs Assessment. A comprehensive Needs Assessment identifies the social determinants of health and cultural needs of schools and the community. The results of this assessment identify the main obstacles that get in the way of youths’ success (barriers to learning) and identify the main assets/resources the district has to address these barriers. The steps of the assessment will include:
§ Summary of secondary data, using Census data and other sources of publicly available information
§ Focus Groups will be held in each neighborhood to identify the main barriers to learning and the main resources needed to address these barriers
§ Resource Mapping will identify and map resources available to address those barriers § Surveys as needed will gather feedback from school staff, families, youth, community
based organizations, and others in the community 3) Action/Evaluation Plan: With the results of the Needs Assessment as a guide, the Wellness
Team will develop an action plan and linked evaluation plan with concrete goals, objectives, and strategies to address barriers using available resources. The action plan will include long-‐term health goals, short-‐term goals, SMART Objectives, and activities/strategies. The team will be encouraged to integrate actions into existing district improvement efforts.
4) Implement the action plan: Following the development of the action plan and evaluation plan, the Wellness Team will divide up the work into manageable steps, meet regularly to share successes, challenges, and support needed throughout implementation.
5) Evaluate progress: Progress will be evaluated throughout the project with an eye toward replication, expansion, and sustainability of the effort. Evaluation tools and methods will be developed in accordance with available resources, and every attempt will be made to leverage existing tools and processes rather than creating new ones.
This is a continuous improvement process. Results from the evaluation will inform the next issues identified, priorities determined, and actions planned in a continuous cycle. Progress will be made step by step, with the full cycle repeated each year (at a minimum), and with updates made to the Needs Assessment every three years.
Copyright © 2014 CK Consulting. All Rights Reserved.
7
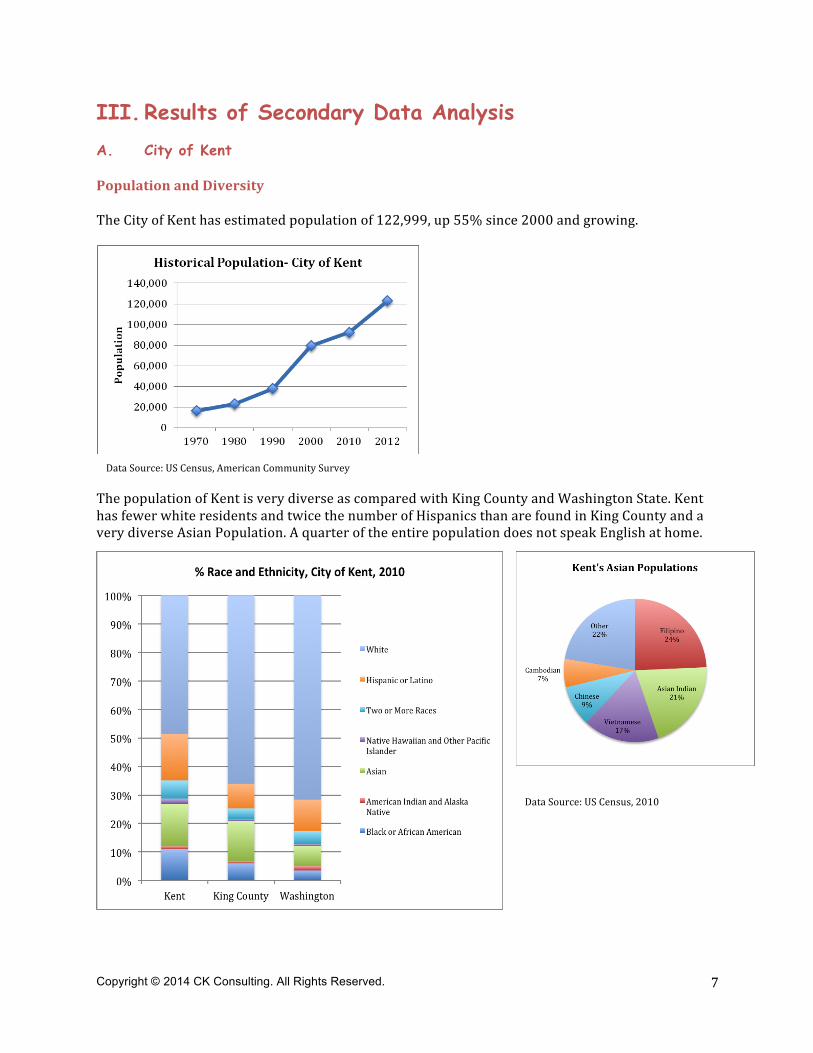
III. Results of Secondary Data Analysis A. City of Kent Population and Diversity The City of Kent has estimated population of 122,999, up 55% since 2000 and growing.
The population of Kent is very diverse as compared with King County and Washington State. Kent has fewer white residents and twice the number of Hispanics than are found in King County and a very diverse Asian Population. A quarter of the entire population does not speak English at home.
Data Source: US Census, American Community Survey
Data Source: US Census, 2010
Copyright © 2014 CK Consulting. All Rights Reserved.
8
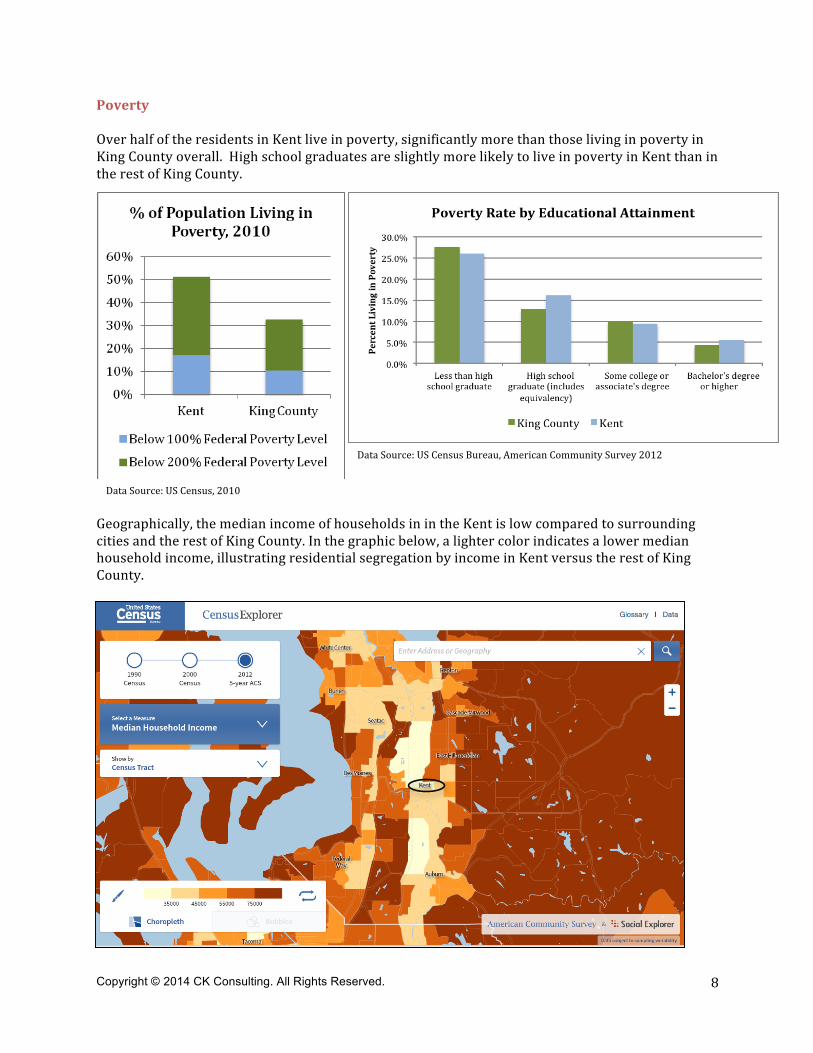
Poverty Over half of the residents in Kent live in poverty, significantly more than those living in poverty in King County overall. High school graduates are slightly more likely to live in poverty in Kent than in the rest of King County.
Geographically, the median income of households in in the Kent is low compared to surrounding cities and the rest of King County. In the graphic below, a lighter color indicates a lower median household income, illustrating residential segregation by income in Kent versus the rest of King County.
Data Source: US Census, 2010
Data Source: US Census Bureau, American Community Survey 2012
Copyright © 2014 CK Consulting. All Rights Reserved.
9
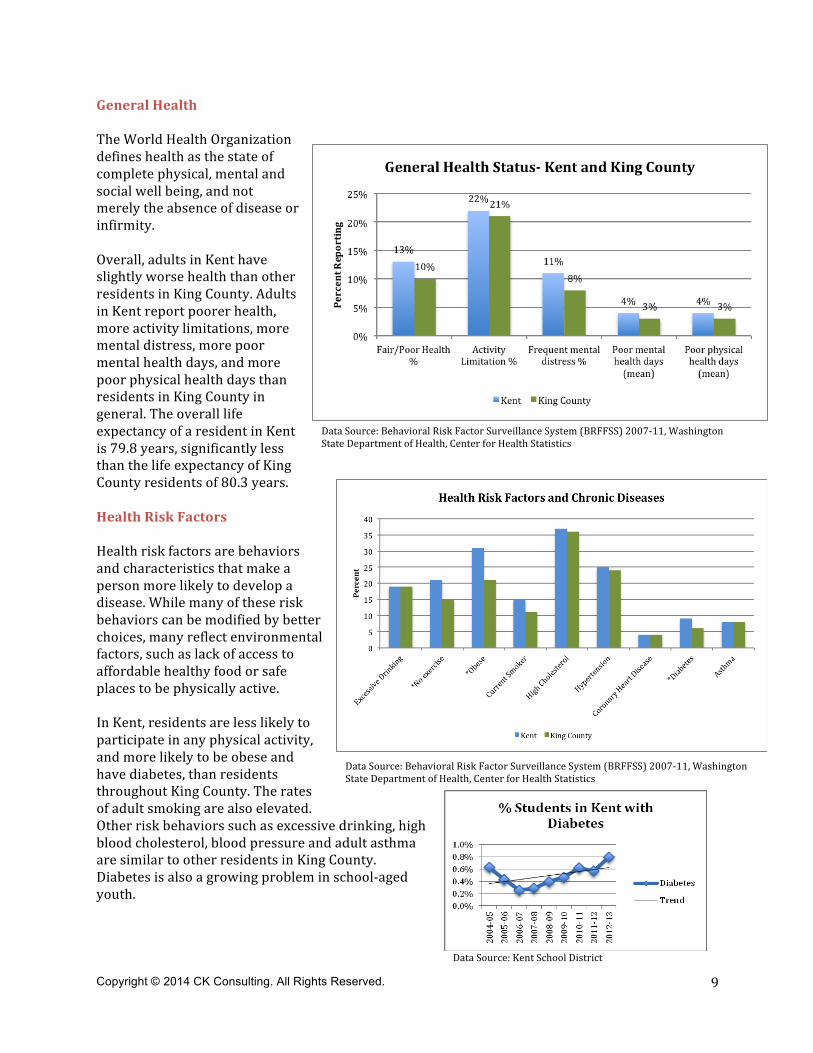
General Health The World Health Organization defines health as the state of complete physical, mental and social well being, and not merely the absence of disease or infirmity. Overall, adults in Kent have slightly worse health than other residents in King County. Adults in Kent report poorer health, more activity limitations, more mental distress, more poor mental health days, and more poor physical health days than residents in King County in general. The overall life expectancy of a resident in Kent is 79.8 years, significantly less than the life expectancy of King County residents of 80.3 years. Health Risk Factors Health risk factors are behaviors and characteristics that make a person more likely to develop a disease. While many of these risk behaviors can be modified by better choices, many reflect environmental factors, such as lack of access to affordable healthy food or safe places to be physically active. In Kent, residents are less likely to participate in any physical activity, and more likely to be obese and have diabetes, than residents throughout King County. The rates of adult smoking are also elevated. Other risk behaviors such as excessive drinking, high blood cholesterol, blood pressure and adult asthma are similar to other residents in King County. Diabetes is also a growing problem in school-‐aged youth.
Data Source: Behavioral Risk Factor Surveillance System (BRFFSS) 2007-‐11, Washington State Department of Health, Center for Health Statistics
Data Source: Behavioral Risk Factor Surveillance System (BRFFSS) 2007-‐11, Washington State Department of Health, Center for Health Statistics
Data Source: Kent School District
Copyright © 2014 CK Consulting. All Rights Reserved.
10
Data Source: Washington Office of the Superintendent of Public Instruction (OSPI)
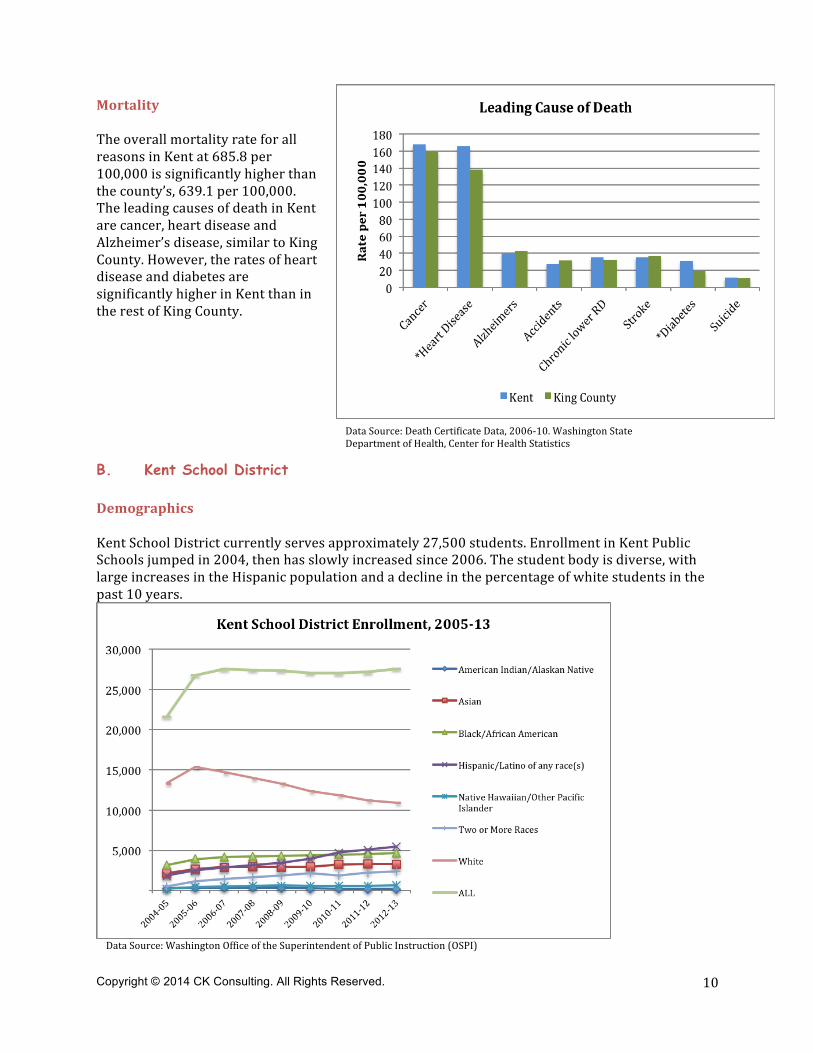
Mortality The overall mortality rate for all reasons in Kent at 685.8 per 100,000 is significantly higher than the county’s, 639.1 per 100,000. The leading causes of death in Kent are cancer, heart disease and Alzheimer’s disease, similar to King County. However, the rates of heart disease and diabetes are significantly higher in Kent than in the rest of King County.
B. Kent School District Demographics Kent School District currently serves approximately 27,500 students. Enrollment in Kent Public Schools jumped in 2004, then has slowly increased since 2006. The student body is diverse, with large increases in the Hispanic population and a decline in the percentage of white students in the past 10 years.
Data Source: Death Certificate Data, 2006-‐10. Washington State Department of Health, Center for Health Statistics
Copyright © 2014 CK Consulting. All Rights Reserved.
11
Data Source: Washington Office of the Superintendent of Public Instruction (OSPI), Kent School District Youth Nutrition Services
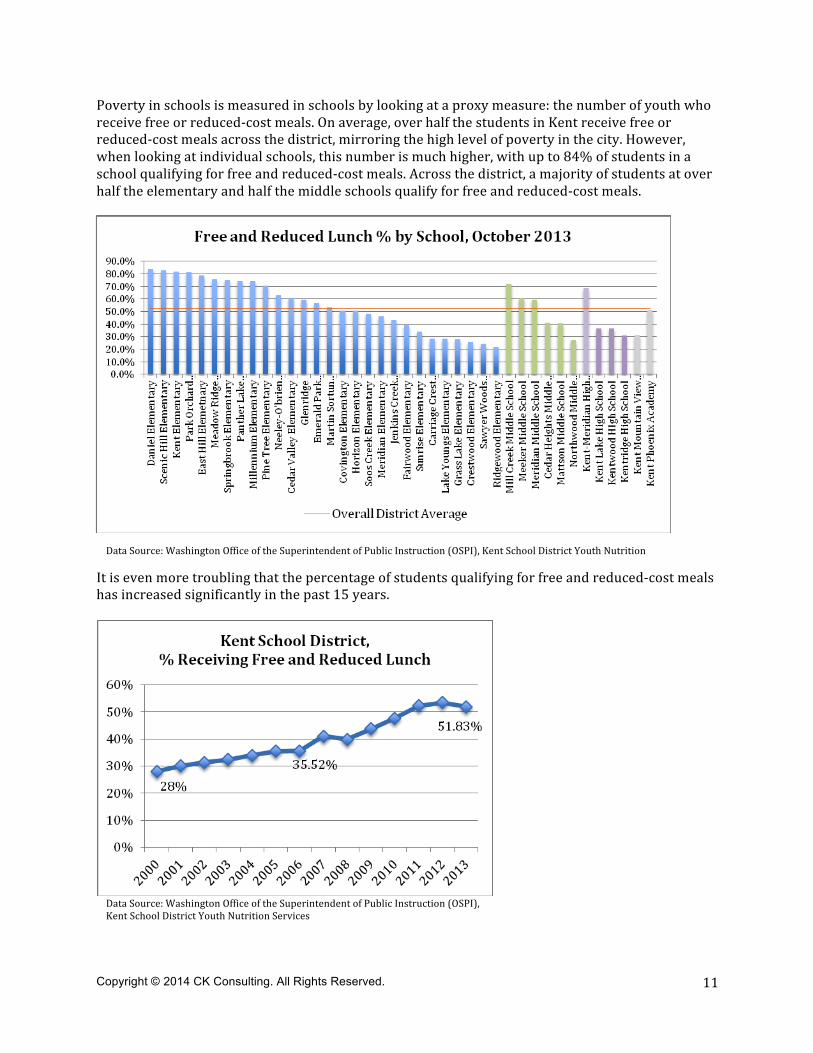
Poverty in schools is measured in schools by looking at a proxy measure: the number of youth who receive free or reduced-‐cost meals. On average, over half the students in Kent receive free or reduced-‐cost meals across the district, mirroring the high level of poverty in the city. However, when looking at individual schools, this number is much higher, with up to 84% of students in a school qualifying for free and reduced-‐cost meals. Across the district, a majority of students at over half the elementary and half the middle schools qualify for free and reduced-‐cost meals.
It is even more troubling that the percentage of students qualifying for free and reduced-‐cost meals has increased significantly in the past 15 years.
Data Source: Washington Office of the Superintendent of Public Instruction (OSPI), Kent School District Youth Nutrition Services
Copyright © 2014 CK Consulting. All Rights Reserved.
12
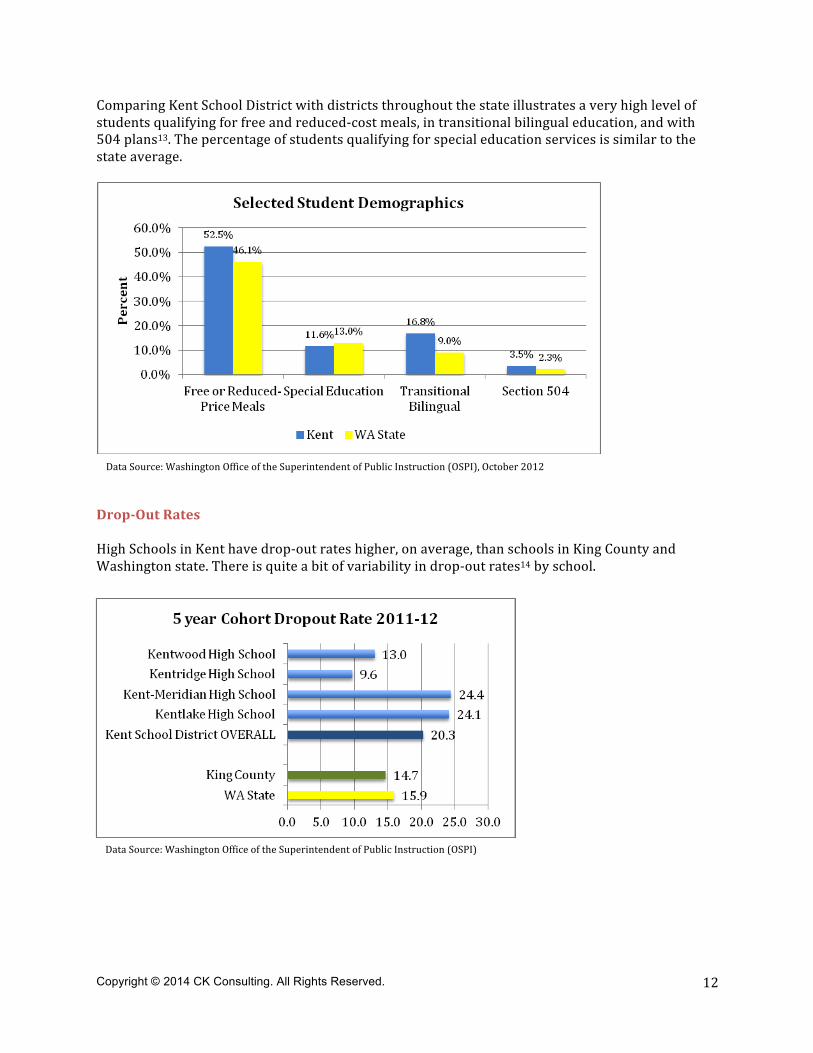
Comparing Kent School District with districts throughout the state illustrates a very high level of students qualifying for free and reduced-‐cost meals, in transitional bilingual education, and with 504 plans13. The percentage of students qualifying for special education services is similar to the state average.
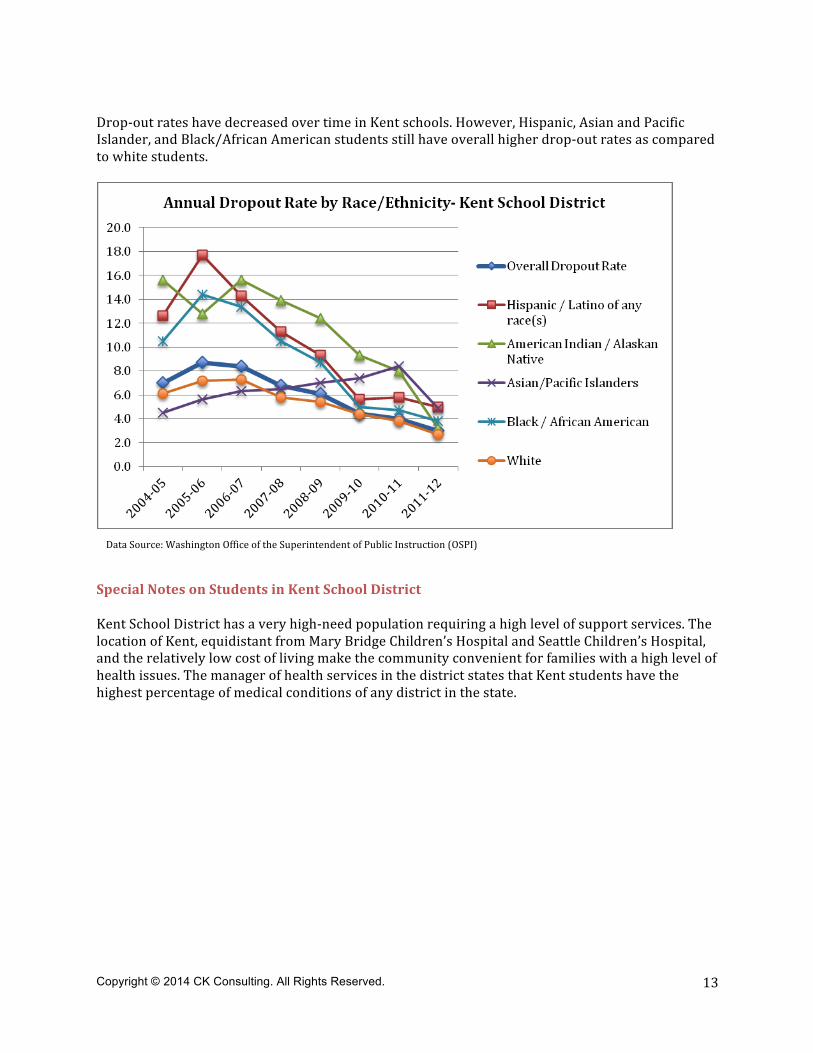
Drop-‐Out Rates High Schools in Kent have drop-‐out rates higher, on average, than schools in King County and Washington state. There is quite a bit of variability in drop-‐out rates14 by school.
Data Source: Washington Office of the Superintendent of Public Instruction (OSPI)
Data Source: Washington Office of the Superintendent of Public Instruction (OSPI), October 2012
Copyright © 2014 CK Consulting. All Rights Reserved.
13
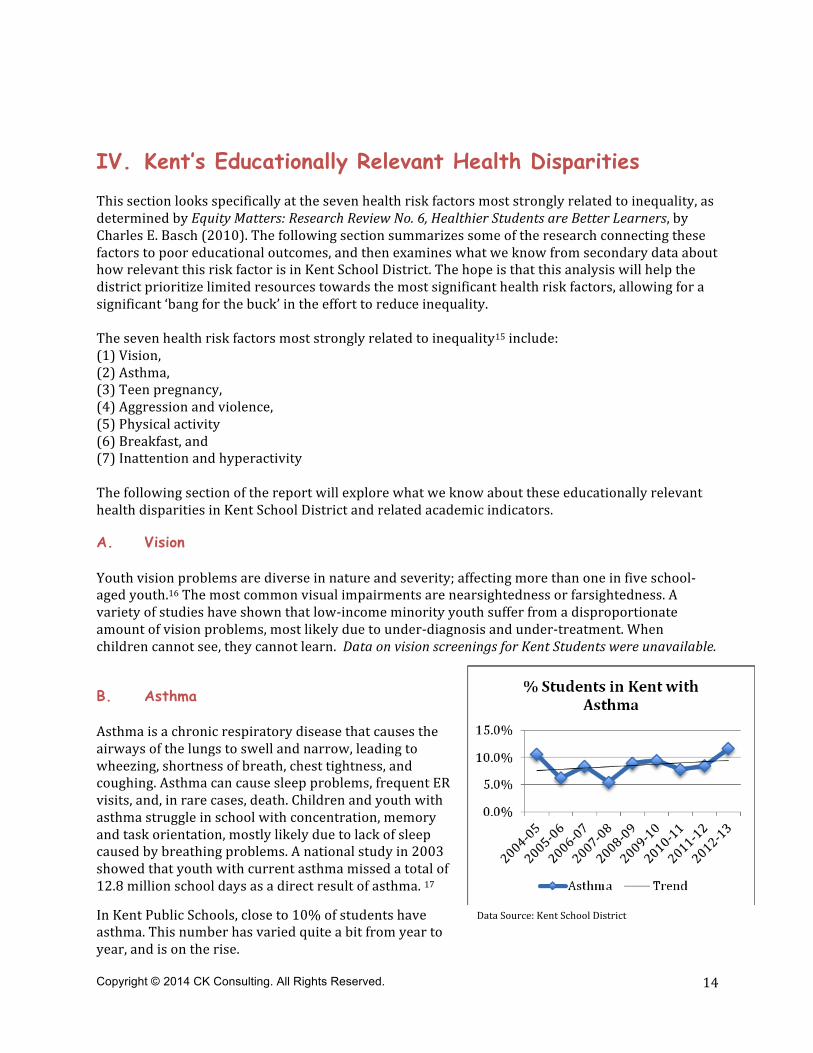
Drop-‐out rates have decreased over time in Kent schools. However, Hispanic, Asian and Pacific Islander, and Black/African American students still have overall higher drop-‐out rates as compared to white students.
Special Notes on Students in Kent School District Kent School District has a very high-‐need population requiring a high level of support services. The location of Kent, equidistant from Mary Bridge Children’s Hospital and Seattle Children’s Hospital, and the relatively low cost of living make the community convenient for families with a high level of health issues. The manager of health services in the district states that Kent students have the highest percentage of medical conditions of any district in the state.
Data Source: Washington Office of the Superintendent of Public Instruction (OSPI)
Copyright © 2014 CK Consulting. All Rights Reserved.
14
IV. Kent’s Educationally Relevant Health Disparities This section looks specifically at the seven health risk factors most strongly related to inequality, as determined by Equity Matters: Research Review No. 6, Healthier Students are Better Learners, by Charles E. Basch (2010). The following section summarizes some of the research connecting these factors to poor educational outcomes, and then examines what we know from secondary data about how relevant this risk factor is in Kent School District. The hope is that this analysis will help the district prioritize limited resources towards the most significant health risk factors, allowing for a significant ‘bang for the buck’ in the effort to reduce inequality. The seven health risk factors most strongly related to inequality15 include: (1) Vision, (2) Asthma, (3) Teen pregnancy, (4) Aggression and violence, (5) Physical activity (6) Breakfast, and (7) Inattention and hyperactivity The following section of the report will explore what we know about these educationally relevant health disparities in Kent School District and related academic indicators.
A. Vision Youth vision problems are diverse in nature and severity; affecting more than one in five school-‐aged youth.16 The most common visual impairments are nearsightedness or farsightedness. A variety of studies have shown that low-‐income minority youth suffer from a disproportionate amount of vision problems, most likely due to under-‐diagnosis and under-‐treatment. When children cannot see, they cannot learn. Data on vision screenings for Kent Students were unavailable.
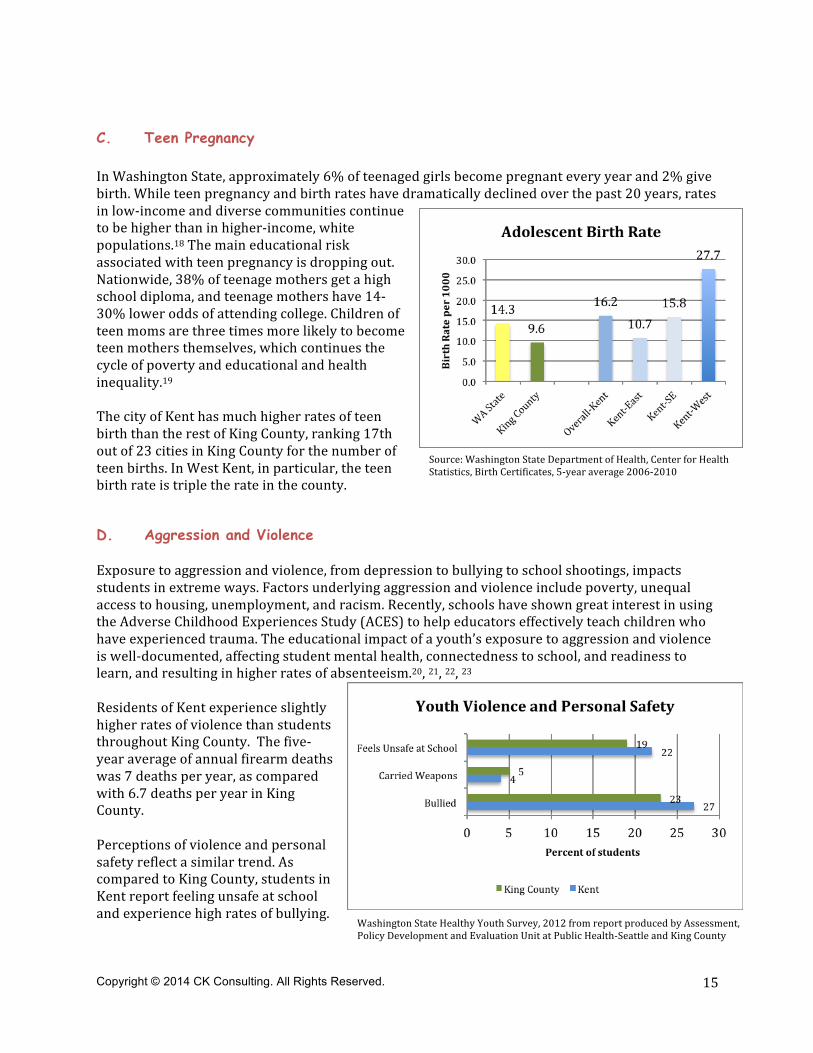
B. Asthma Asthma is a chronic respiratory disease that causes the airways of the lungs to swell and narrow, leading to wheezing, shortness of breath, chest tightness, and coughing. Asthma can cause sleep problems, frequent ER visits, and, in rare cases, death. Children and youth with asthma struggle in school with concentration, memory and task orientation, mostly likely due to lack of sleep caused by breathing problems. A national study in 2003 showed that youth with current asthma missed a total of 12.8 million school days as a direct result of asthma. 17
In Kent Public Schools, close to 10% of students have asthma. This number has varied quite a bit from year to year, and is on the rise.
Data Source: Kent School District
Copyright © 2014 CK Consulting. All Rights Reserved.
15
C. Teen Pregnancy In Washington State, approximately 6% of teenaged girls become pregnant every year and 2% give birth. While teen pregnancy and birth rates have dramatically declined over the past 20 years, rates in low-‐income and diverse communities continue to be higher than in higher-‐income, white populations.18 The main educational risk associated with teen pregnancy is dropping out. Nationwide, 38% of teenage mothers get a high school diploma, and teenage mothers have 14-‐30% lower odds of attending college. Children of teen moms are three times more likely to become teen mothers themselves, which continues the cycle of poverty and educational and health inequality.19 The city of Kent has much higher rates of teen birth than the rest of King County, ranking 17th out of 23 cities in King County for the number of teen births. In West Kent, in particular, the teen birth rate is triple the rate in the county.
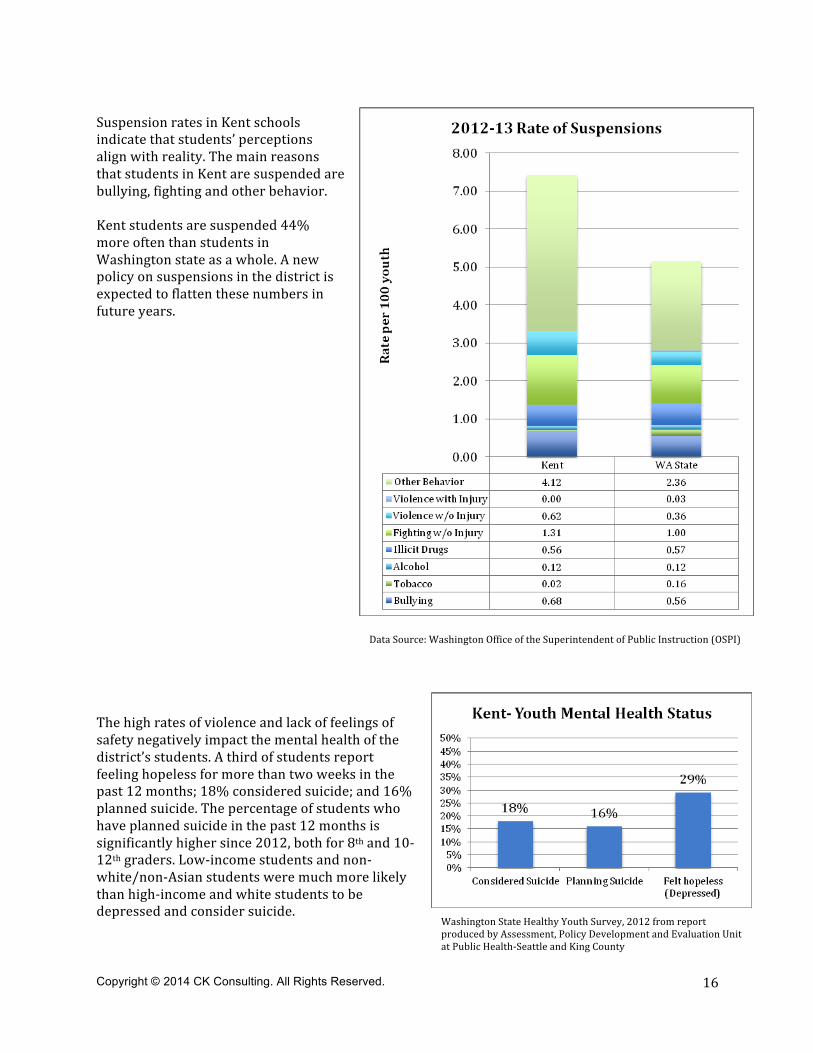
D. Aggression and Violence Exposure to aggression and violence, from depression to bullying to school shootings, impacts students in extreme ways. Factors underlying aggression and violence include poverty, unequal access to housing, unemployment, and racism. Recently, schools have shown great interest in using the Adverse Childhood Experiences Study (ACES) to help educators effectively teach children who have experienced trauma. The educational impact of a youth’s exposure to aggression and violence is well-‐documented, affecting student mental health, connectedness to school, and readiness to learn, and resulting in higher rates of absenteeism.20, 21, 22, 23 Residents of Kent experience slightly higher rates of violence than students throughout King County. The five-‐year average of annual firearm deaths was 7 deaths per year, as compared with 6.7 deaths per year in King County. Perceptions of violence and personal safety reflect a similar trend. As compared to King County, students in Kent report feeling unsafe at school and experience high rates of bullying.
Source: Washington State Department of Health, Center for Health Statistics, Birth Certificates, 5-‐year average 2006-‐2010
Data Source: Death Certificate data, 2006-‐10. Washington State Department of Health, Center for Health Statistics
Washington State Healthy Youth Survey, 2012 from report produced by Assessment, Policy Development and Evaluation Unit at Public Health-‐Seattle and King County
Copyright © 2014 CK Consulting. All Rights Reserved.
16
Suspension rates in Kent schools indicate that students’ perceptions align with reality. The main reasons that students in Kent are suspended are bullying, fighting and other behavior. Kent students are suspended 44% more often than students in Washington state as a whole. A new policy on suspensions in the district is expected to flatten these numbers in future years. The high rates of violence and lack of feelings of safety negatively impact the mental health of the district’s students. A third of students report feeling hopeless for more than two weeks in the past 12 months; 18% considered suicide; and 16% planned suicide. The percentage of students who have planned suicide in the past 12 months is significantly higher since 2012, both for 8th and 10-‐12th graders. Low-‐income students and non-‐white/non-‐Asian students were much more likely than high-‐income and white students to be depressed and consider suicide.
Data Source: Washington Office of the Superintendent of Public Instruction (OSPI)
Washington State Healthy Youth Survey, 2012 from report produced by Assessment, Policy Development and Evaluation Unit at Public Health-‐Seattle and King County
Copyright © 2014 CK Consulting. All Rights Reserved.
17
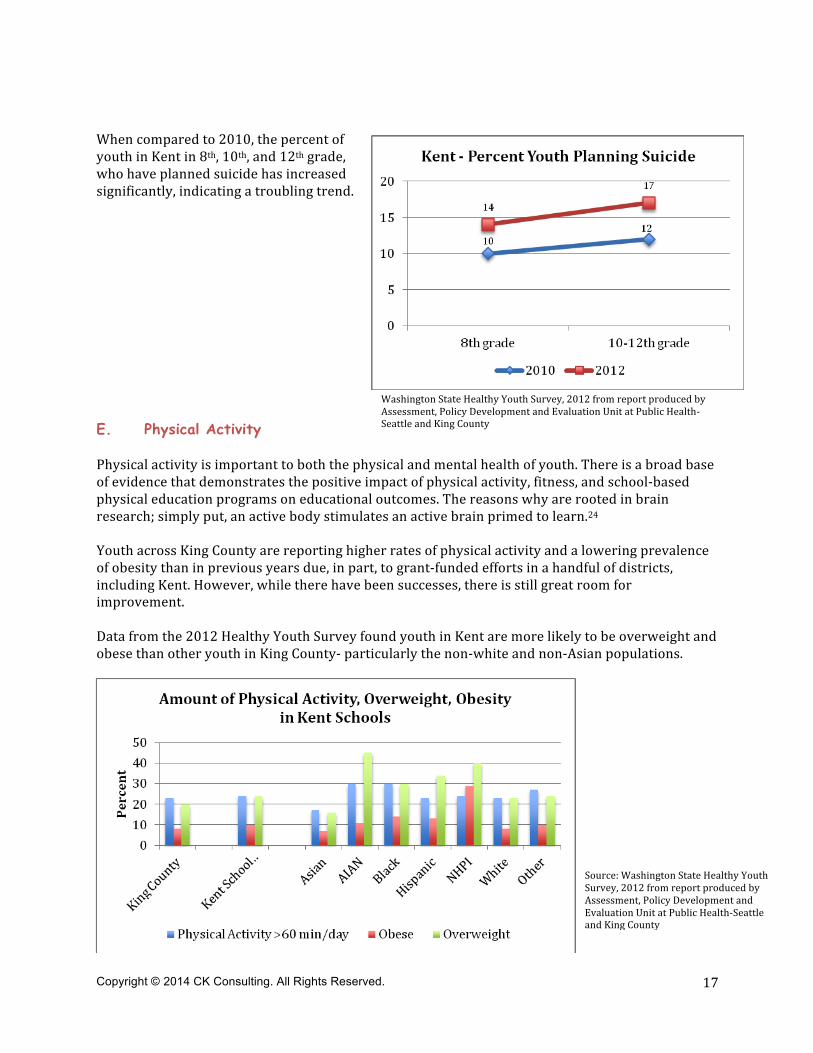
When compared to 2010, the percent of youth in Kent in 8th, 10th, and 12th grade, who have planned suicide has increased significantly, indicating a troubling trend.
E. Physical Activity Physical activity is important to both the physical and mental health of youth. There is a broad base of evidence that demonstrates the positive impact of physical activity, fitness, and school-‐based physical education programs on educational outcomes. The reasons why are rooted in brain research; simply put, an active body stimulates an active brain primed to learn.24 Youth across King County are reporting higher rates of physical activity and a lowering prevalence of obesity than in previous years due, in part, to grant-‐funded efforts in a handful of districts, including Kent. However, while there have been successes, there is still great room for improvement. Data from the 2012 Healthy Youth Survey found youth in Kent are more likely to be overweight and obese than other youth in King County-‐ particularly the non-‐white and non-‐Asian populations.
Washington State Healthy Youth Survey, 2012 from report produced by Assessment, Policy Development and Evaluation Unit at Public Health-‐Seattle and King County
Source: Washington State Healthy Youth Survey, 2012 from report produced by Assessment, Policy Development and Evaluation Unit at Public Health-‐Seattle and King County
Copyright © 2014 CK Consulting. All Rights Reserved.
18
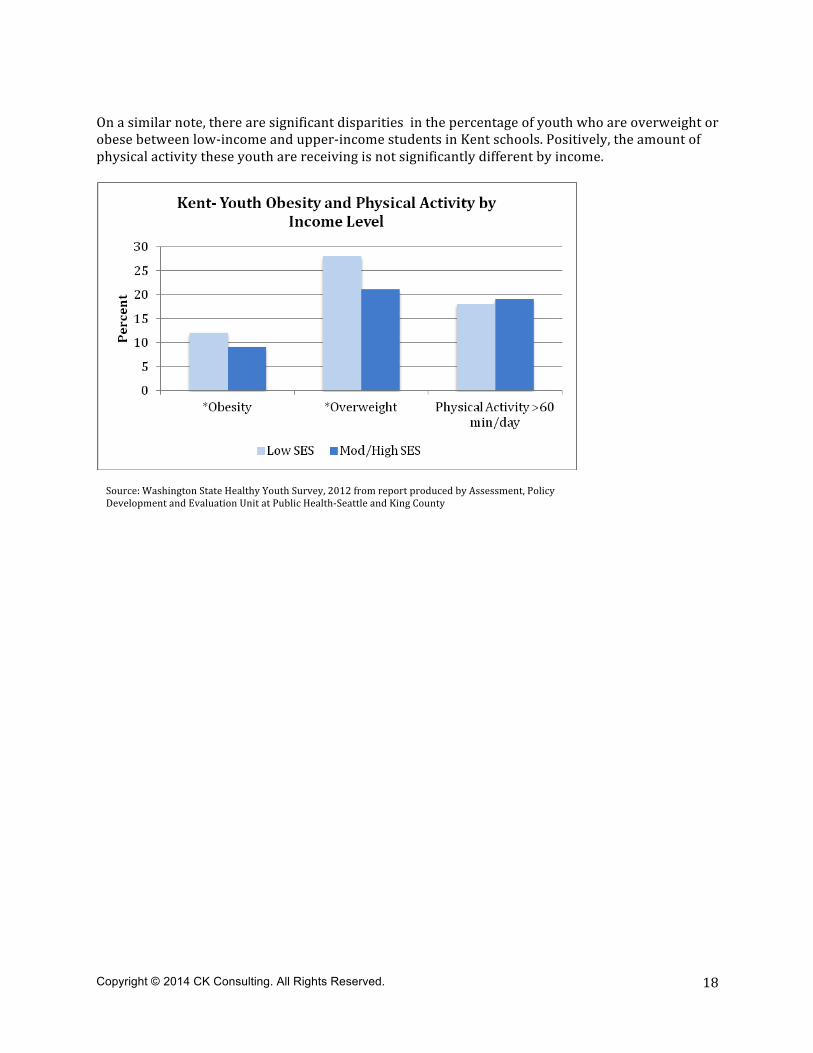
On a similar note, there are significant disparities in the percentage of youth who are overweight or obese between low-‐income and upper-‐income students in Kent schools. Positively, the amount of physical activity these youth are receiving is not significantly different by income.
Source: Washington State Healthy Youth Survey, 2012 from report produced by Assessment, Policy Development and Evaluation Unit at Public Health-‐Seattle and King County
Copyright © 2014 CK Consulting. All Rights Reserved.
19
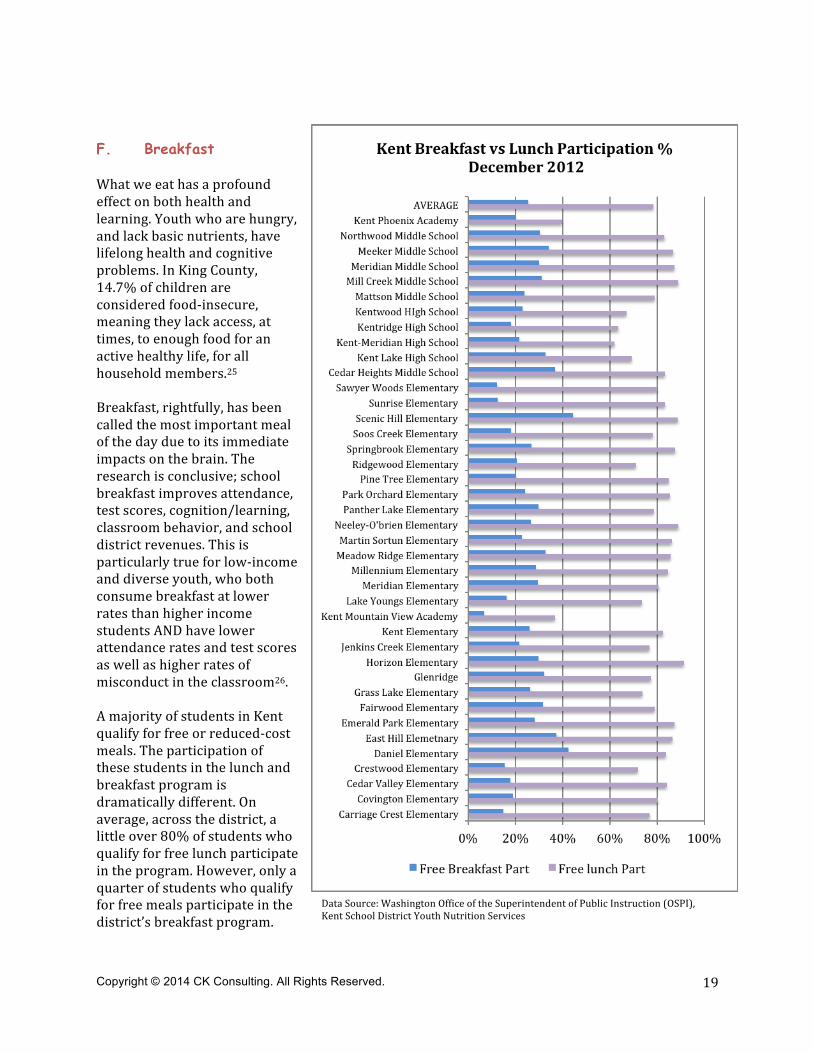
F. Breakfast What we eat has a profound effect on both health and learning. Youth who are hungry, and lack basic nutrients, have lifelong health and cognitive problems. In King County, 14.7% of children are considered food-‐insecure, meaning they lack access, at times, to enough food for an active healthy life, for all household members.25 Breakfast, rightfully, has been called the most important meal of the day due to its immediate impacts on the brain. The research is conclusive; school breakfast improves attendance, test scores, cognition/learning, classroom behavior, and school district revenues. This is particularly true for low-‐income and diverse youth, who both consume breakfast at lower rates than higher income students AND have lower attendance rates and test scores as well as higher rates of misconduct in the classroom26. A majority of students in Kent qualify for free or reduced-‐cost meals. The participation of these students in the lunch and breakfast program is dramatically different. On average, across the district, a little over 80% of students who qualify for free lunch participate in the program. However, only a quarter of students who qualify for free meals participate in the district’s breakfast program.
Data Source: Washington Office of the Superintendent of Public Instruction (OSPI), Kent School District Youth Nutrition Services
Copyright © 2014 CK Consulting. All Rights Reserved.
20
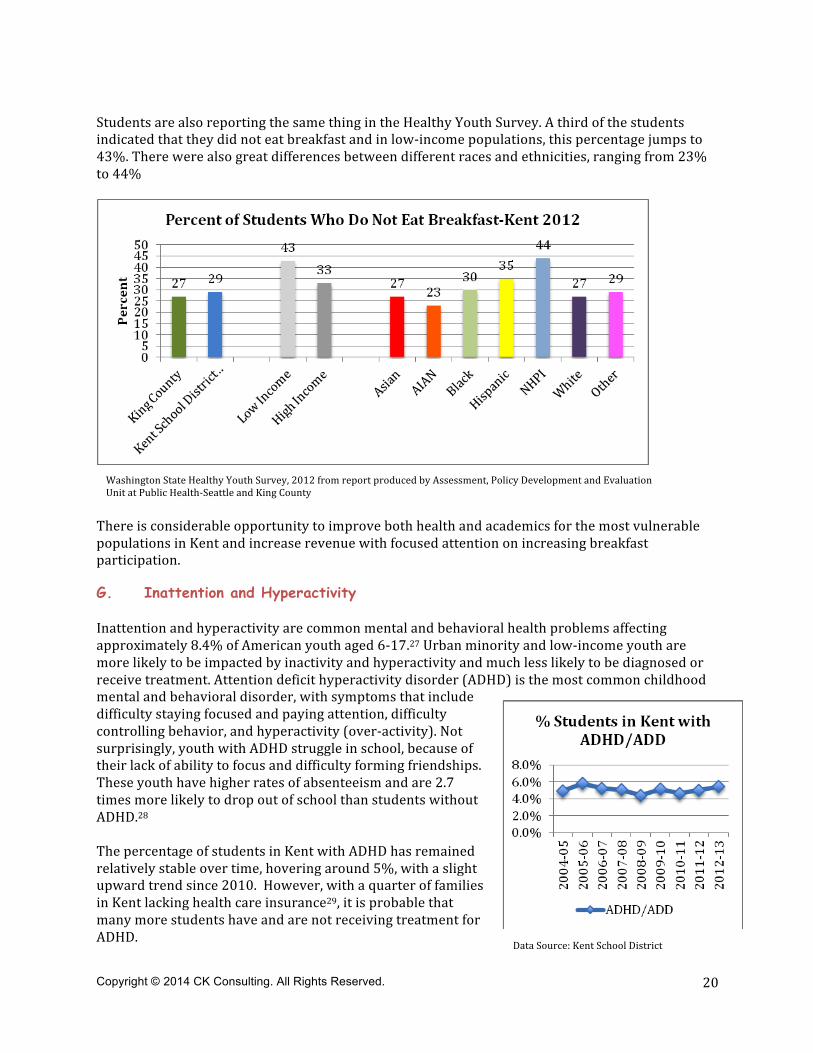
Students are also reporting the same thing in the Healthy Youth Survey. A third of the students indicated that they did not eat breakfast and in low-‐income populations, this percentage jumps to 43%. There were also great differences between different races and ethnicities, ranging from 23% to 44%
There is considerable opportunity to improve both health and academics for the most vulnerable populations in Kent and increase revenue with focused attention on increasing breakfast participation.
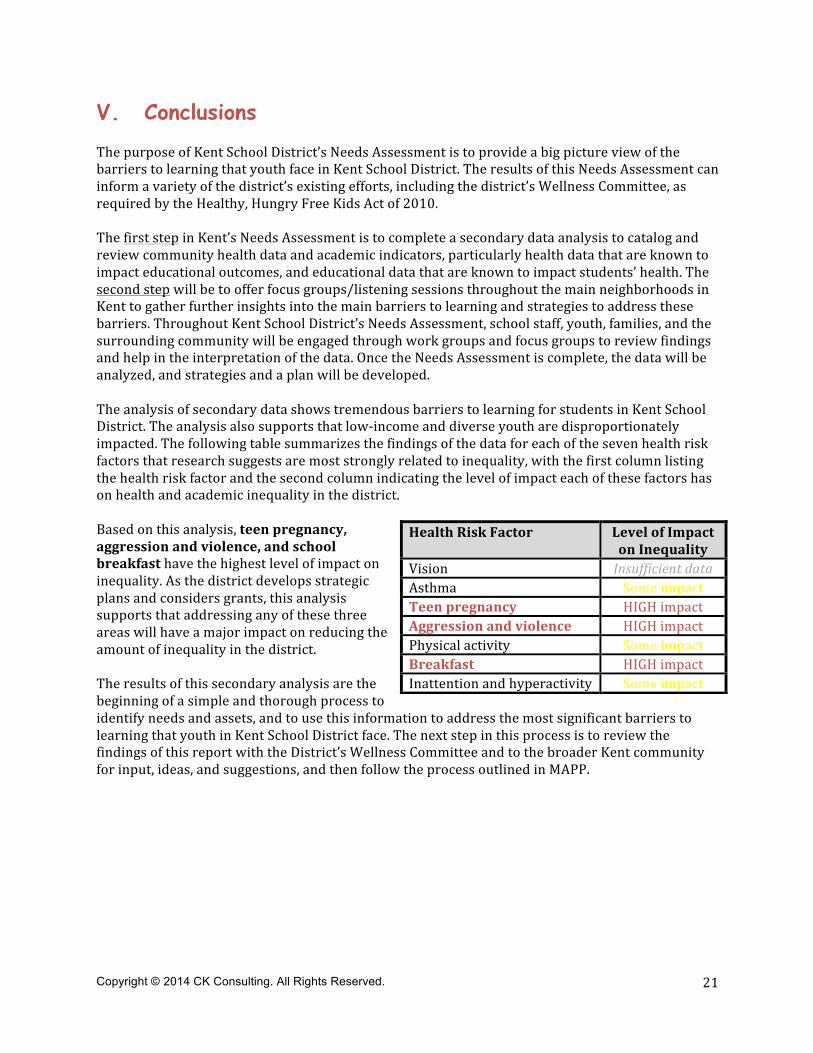
G. Inattention and Hyperactivity Inattention and hyperactivity are common mental and behavioral health problems affecting approximately 8.4% of American youth aged 6-‐17.27 Urban minority and low-‐income youth are more likely to be impacted by inactivity and hyperactivity and much less likely to be diagnosed or receive treatment. Attention deficit hyperactivity disorder (ADHD) is the most common childhood mental and behavioral disorder, with symptoms that include difficulty staying focused and paying attention, difficulty controlling behavior, and hyperactivity (over-‐activity). Not surprisingly, youth with ADHD struggle in school, because of their lack of ability to focus and difficulty forming friendships. These youth have higher rates of absenteeism and are 2.7 times more likely to drop out of school than students without ADHD.28 The percentage of students in Kent with ADHD has remained relatively stable over time, hovering around 5%, with a slight upward trend since 2010. However, with a quarter of families in Kent lacking health care insurance29, it is probable that many more students have and are not receiving treatment for ADHD.
Washington State Healthy Youth Survey, 2012 from report produced by Assessment, Policy Development and Evaluation Unit at Public Health-‐Seattle and King County
Data Source: Kent School District
Copyright © 2014 CK Consulting. All Rights Reserved.
21
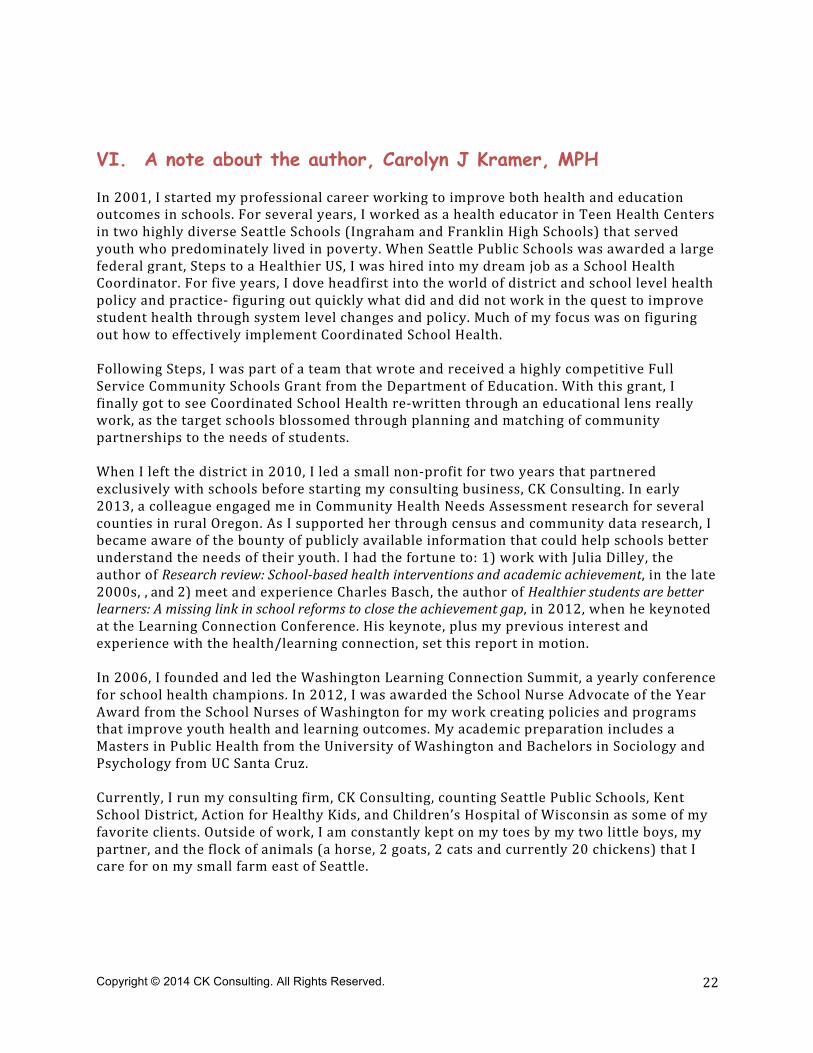
V. Conclusions The purpose of Kent School District’s Needs Assessment is to provide a big picture view of the barriers to learning that youth face in Kent School District. The results of this Needs Assessment can inform a variety of the district’s existing efforts, including the district’s Wellness Committee, as required by the Healthy, Hungry Free Kids Act of 2010. The first step in Kent’s Needs Assessment is to complete a secondary data analysis to catalog and review community health data and academic indicators, particularly health data that are known to impact educational outcomes, and educational data that are known to impact students’ health. The second step will be to offer focus groups/listening sessions throughout the main neighborhoods in Kent to gather further insights into the main barriers to learning and strategies to address these barriers. Throughout Kent School District’s Needs Assessment, school staff, youth, families, and the surrounding community will be engaged through work groups and focus groups to review findings and help in the interpretation of the data. Once the Needs Assessment is complete, the data will be analyzed, and strategies and a plan will be developed. The analysis of secondary data shows tremendous barriers to learning for students in Kent School District. The analysis also supports that low-‐income and diverse youth are disproportionately impacted. The following table summarizes the findings of the data for each of the seven health risk factors that research suggests are most strongly related to inequality, with the first column listing the health risk factor and the second column indicating the level of impact each of these factors has on health and academic inequality in the district. Based on this analysis, teen pregnancy, aggression and violence, and school breakfast have the highest level of impact on inequality. As the district develops strategic plans and considers grants, this analysis supports that addressing any of these three areas will have a major impact on reducing the amount of inequality in the district. The results of this secondary analysis are the beginning of a simple and thorough process to identify needs and assets, and to use this information to address the most significant barriers to learning that youth in Kent School District face. The next step in this process is to review the findings of this report with the District’s Wellness Committee and to the broader Kent community for input, ideas, and suggestions, and then follow the process outlined in MAPP.
Health Risk Factor Level of Impact on Inequality
Vision Insufficient data Asthma Some impact Teen pregnancy HIGH impact Aggression and violence HIGH impact Physical activity Some impact Breakfast HIGH impact Inattention and hyperactivity Some impact
Copyright © 2014 CK Consulting. All Rights Reserved.
22
VI. A note about the author, Carolyn J Kramer, MPH In 2001, I started my professional career working to improve both health and education outcomes in schools. For several years, I worked as a health educator in Teen Health Centers in two highly diverse Seattle Schools (Ingraham and Franklin High Schools) that served youth who predominately lived in poverty. When Seattle Public Schools was awarded a large federal grant, Steps to a Healthier US, I was hired into my dream job as a School Health Coordinator. For five years, I dove headfirst into the world of district and school level health policy and practice-‐ figuring out quickly what did and did not work in the quest to improve student health through system level changes and policy. Much of my focus was on figuring out how to effectively implement Coordinated School Health. Following Steps, I was part of a team that wrote and received a highly competitive Full Service Community Schools Grant from the Department of Education. With this grant, I finally got to see Coordinated School Health re-‐written through an educational lens really work, as the target schools blossomed through planning and matching of community partnerships to the needs of students. When I left the district in 2010, I led a small non-‐profit for two years that partnered exclusively with schools before starting my consulting business, CK Consulting. In early 2013, a colleague engaged me in Community Health Needs Assessment research for several counties in rural Oregon. As I supported her through census and community data research, I became aware of the bounty of publicly available information that could help schools better understand the needs of their youth. I had the fortune to: 1) work with Julia Dilley, the author of Research review: School-‐based health interventions and academic achievement, in the late 2000s, , and 2) meet and experience Charles Basch, the author of Healthier students are better learners: A missing link in school reforms to close the achievement gap, in 2012, when he keynoted at the Learning Connection Conference. His keynote, plus my previous interest and experience with the health/learning connection, set this report in motion. In 2006, I founded and led the Washington Learning Connection Summit, a yearly conference for school health champions. In 2012, I was awarded the School Nurse Advocate of the Year Award from the School Nurses of Washington for my work creating policies and programs that improve youth health and learning outcomes. My academic preparation includes a Masters in Public Health from the University of Washington and Bachelors in Sociology and Psychology from UC Santa Cruz. Currently, I run my consulting firm, CK Consulting, counting Seattle Public Schools, Kent School District, Action for Healthy Kids, and Children’s Hospital of Wisconsin as some of my favorite clients. Outside of work, I am constantly kept on my toes by my two little boys, my partner, and the flock of animals (a horse, 2 goats, 2 cats and currently 20 chickens) that I care for on my small farm east of Seattle.
Copyright © 2014 CK Consulting. All Rights Reserved.
23
VII. References 1 Freudenberg, N., & Ruglis, J. (2007). Reframing school dropout as a public health issue. Preventing Chronic Disease, 4, 1-‐11. 2 Dilley, Julia A. (2009) Research review: School-‐based health interventions and academic achievement. Washington State Department of Health. 3 Dobbie W & Fryer, Jr. RJ, (2009). ARE HIGH QUALITY SCHOOLS ENOUGH TO CLOSE THE ACHIEVEMENT GAP? EVIDENCE FROM A SOCIAL EXPERIMENT IN HARLEM. National Bureau of Economic Research. Working Paper 15473, as found at: http://www.nber.org/papers/w15473. 4 Playworks (2012), Mathematica Policy Research and Stanford University, as found at: http://www.playworks.org/research-‐reveals-‐playworks-‐reduces-‐bullying 5 Closing the gap: Auburn school tries a different approach. (May 20, 2007). The Seattle Times. Karen Johnson, as found at http://community.seattletimes.nwsource.com/archive/?date=20070520&slug=pioneer20s1 6 Murray, N. G., Low, B. J., Hollis, C., Cross, A. W. and Davis, S. M. (2007), Coordinated School Health Programs and Academic Achievement: A Systematic Review of the Literature. Journal of School Health, 77: 589–600. doi: 10.1111/j.1746-‐1561.2007.00238.x 7Top Community School Research. Coalition for Community Schools. As found at: http://www.communityschools.org/aboutschools/top_community_schools_research.aspx 8 The learning compact redefined: A call to action (2007). Association for Supervision and Curriculum Development. . As found at: http://www.ascd.org/ASCDpdf/Whole%20Youth/WCC%20Learning%20Compact.pdf 9 Hoyle, T. B. (2007). The mariner model: charting the course for health-‐promoting school communities. Ohio: American School Health Association. 10 Mobilizing Action through Planning and Partnership. National Association of County and City Officials (NACCHO). As found at: http://www.naccho.org/topics/infrastructure/mapp/ 11 Basch, C. E. (2010). Healthier students are better learners: A missing link in school reforms to close the achievement gap. 12 Ibid, Dilley, J.A. (2007) 13 Definition of “504 plan”-‐ The 504 Plan is a plan developed to ensure that a youth who has a disability identified under the law and is attending an elementary or secondary educational institution receives accommodations that will ensure their academic success and access to the learning environment. http://www.washington.edu/doit/Stem/articles?52 14 Definition: Five-‐Year Adjusted Cohort Graduation Rate . This calculation is based on a five-‐year timeframe for graduation after students first enter ninth grade. This report provides information on the cohort of students who first entered ninth grade in 2007–08 and tracks their enrollment status through 2011–12. Report to the Legislature. Graduation and Dropout: Statistics Annual Report. 2012–13 Prepared by: Deb Came, Ph.D., Director of Student Information. Lisa Ireland, Research Analyst. Office of Superintendent of Public Instruction, As found at: http://www.k12.wa.us/legisgov/2014documents/GraduationAndDropoutStatisticsAnnualReport.pdf. School specific data retrieved from: http://www.k12.wa.us/DataAdmin/default.aspx 15 Ibid. Basch, C (2010) 16 Ferebee, A. (2004). Childhood vision: Public challenges and opportunities. A policy brief. Washington, DC: Center for Health and Health Care in Schools, School of Public Health, George Washington University Medical Center. 17 Akinbami, L.J. (2006). The state of childhood asthma, United States, 1980-‐2005. Advance data from Vital and Health Statistics: No. 381, Hyattsville, MD: National Center for Health Statistics. 18 The National Campaign to Prevent Teen and Unplanned Pregnancy, Washington Data: http://thenationalcampaign.org/data/state/washington 19 Amato, P.R., & Maynard, R.A. (2007). Decreasing non-‐marital births and strengthening marriage to reduce poverty. Future of Children, 17, 117-‐141. 20 Glew, G.M., Fan, M.Y., Katon, W., Rivara, F.P., & Kernic, M.A. (2005). Bullying, psychological adjustment, and
Copyright © 2014 CK Consulting. All Rights Reserved.
24
academic performance in elementary school. Archives of Pediatrics & Adolescent Medicine, 159, 1026-‐1031. 21 Glew, G.M., Fan, M.Y., Katon, W., & Rivara, F.P. (2008). Bullying and school safety. Journal of Pediatrics, 152, 123-‐128. 22 Juvonen, J., Nishina, A., & Graham, S. (2000). Peer harassment, psychological adjustment, and school functioning in early adolescence. Journal of Educational Psychology, 92, 349-‐359. 23 Nishina, A., Juvonen, J., & Wirkow, M.R. (2005). Stick and stones may break my bones, but names will make me feel sick: The psychological, somatic, and scholastic consequences of peer harassment. Journal of Clinical Child & Adolescent Psychology, 34, 37-‐48. 24 Sibley, B.A., & Etnier, J.L. (2003). The relationship between physical activity and cognition in children: A metaanalysis. Pediatric Exercise Science, 15, 243-‐256. 25 Map the Meal Gap, Feeding America, 2011. As found at: http://feedingamerica.org/hunger-‐in-‐america/hunger-‐studies/map-‐the-‐meal-‐gap/printable-‐county-‐2011.aspx 26 The Future of School Breakfast-‐ an analysis of evidence practices to improve school breakfast participation in WA State. WA Appleseed. 2013. Retrieved from: http://www.waappleseed.org/#!publications/c1tsl 27 Pastor, P.N., & Reuben, C.A. (2008). Diagnosed attention deficit hyperactivity disorder and learning disability: United States,2004-‐2005. Vital & Health Statistics, 10, 1-‐14. 28 Barbaresi, W.J., Katusi, S.K., Colligan, R.C., Weaver, A.L., & Jacobsen, S.J. (2007a). Long-‐term outcomes for children with attention-‐deficit/hyperactivity disorder: A population-‐based perspective. Journal of Developmental and Behavioral Pediatrics, 28, 265-‐273. 29 Rates of Un-‐Insurance, American Communities Survey, 3 year average, 2009-‐11.