Embed Size (px)
DESCRIPTION
Acoustics Research Institute. Austrian Academy of Sciences. Additivity of auditory masking using Gaussian-shaped tones a Laback, B., a Balazs, P., a Toupin, G., b Necciari, T., b Savel, S., b Meunier, S., b Ystad, S., and b Kronland-Martinet, R. - PowerPoint PPT Presentation
Citation preview
Additivity of auditory masking using Gaussian-shaped tones
aLaback, B., aBalazs, P., aToupin, G., bNecciari, T., bSavel, S., bMeunier, S., bYstad, S., and bKronland-Martinet, R.
aAcoustics Research Institute, Austrian Acad. of Sciences, AustriabLaboratoire de Mécanique et d'Acoustique, CNRS Marseille, France
MULAC Meeting, ViennaSept 24rd, 2008
[email protected]://www.kfs.oeaw.ac.at
Acoustics Research Institute
Austrian Academy of Sciences
Motivation
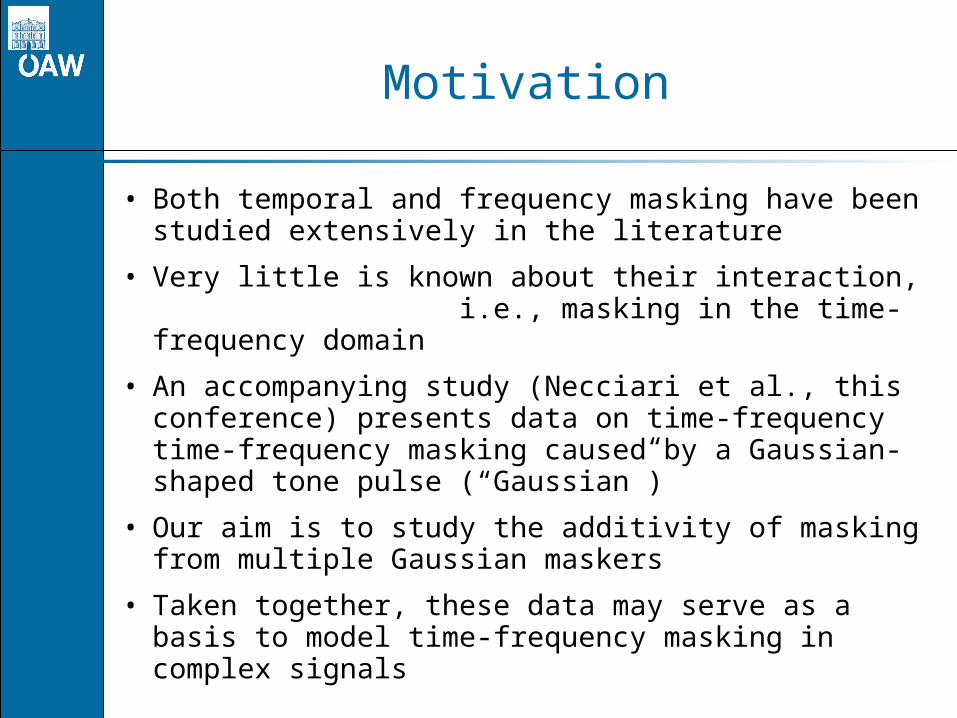
• Both temporal and frequency masking have been studied extensively in the literature
• Very little is known about their interaction, i.e., masking in the time-frequency domain
• An accompanying study (Necciari et al., this conference) presents data on time-frequency time-frequency masking caused by a Gaussian-shaped tone pulse (“Gaussian”)
• Our aim is to study the additivity of masking from multiple Gaussian maskers
• Taken together, these data may serve as a basis to model time-frequency masking in complex signals
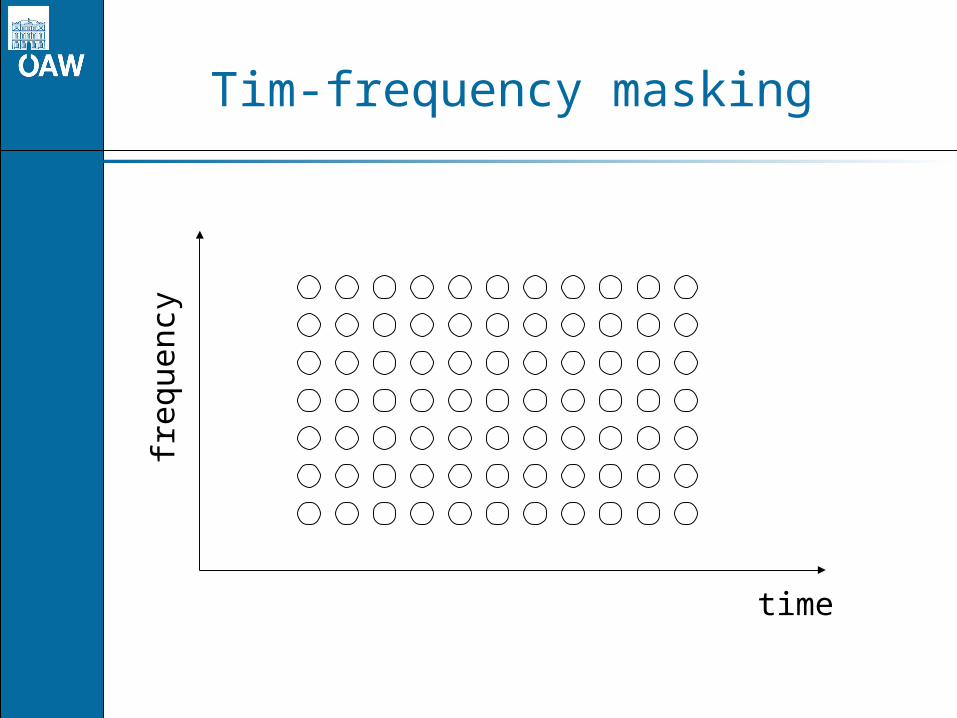
Tim-frequency masking
time
freq
uenc
y
time
freq
uenc
y
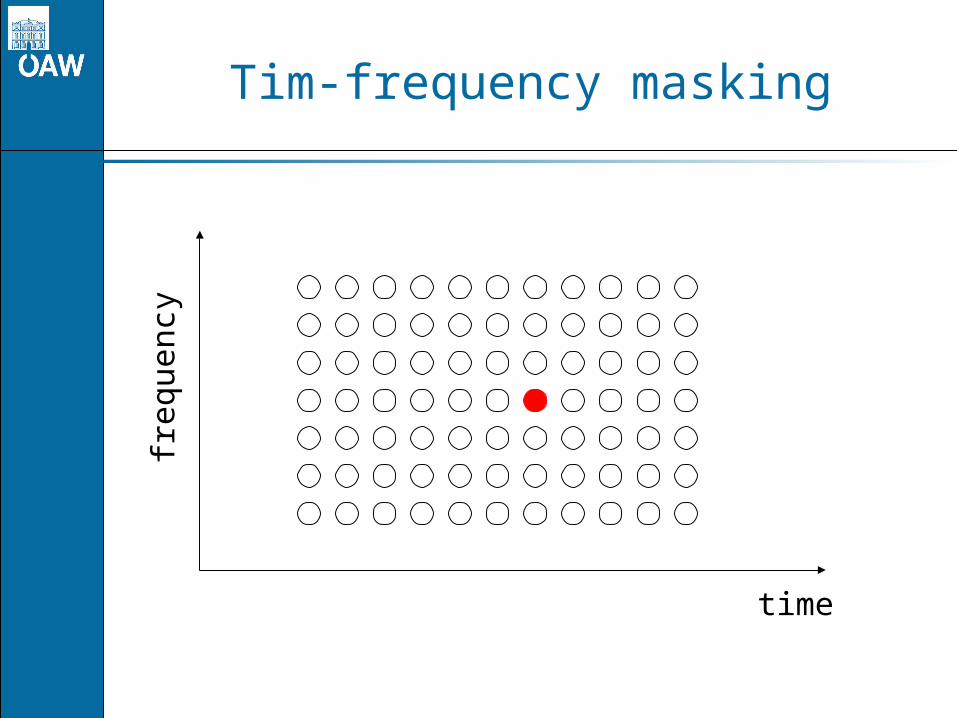
Tim-frequency masking
time
freq
uenc
y
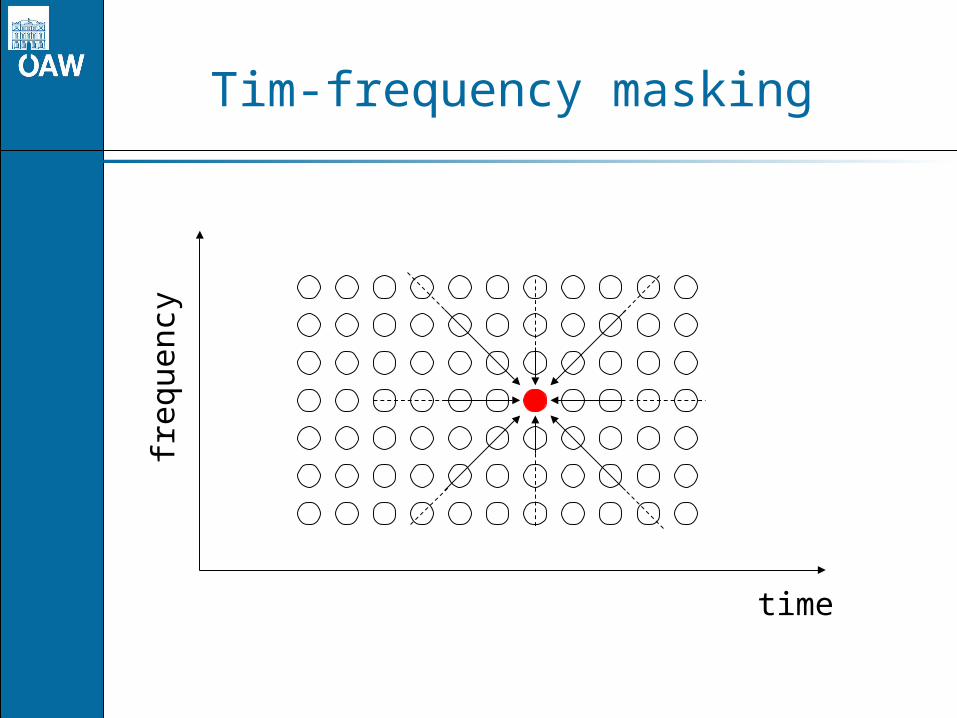
Tim-frequency masking
Outline
• 3 steps:
• Additivity of temporal masking
• Additivity of frequency masking
• Additivity of time-frequency masking (not presented today)
Experiment design
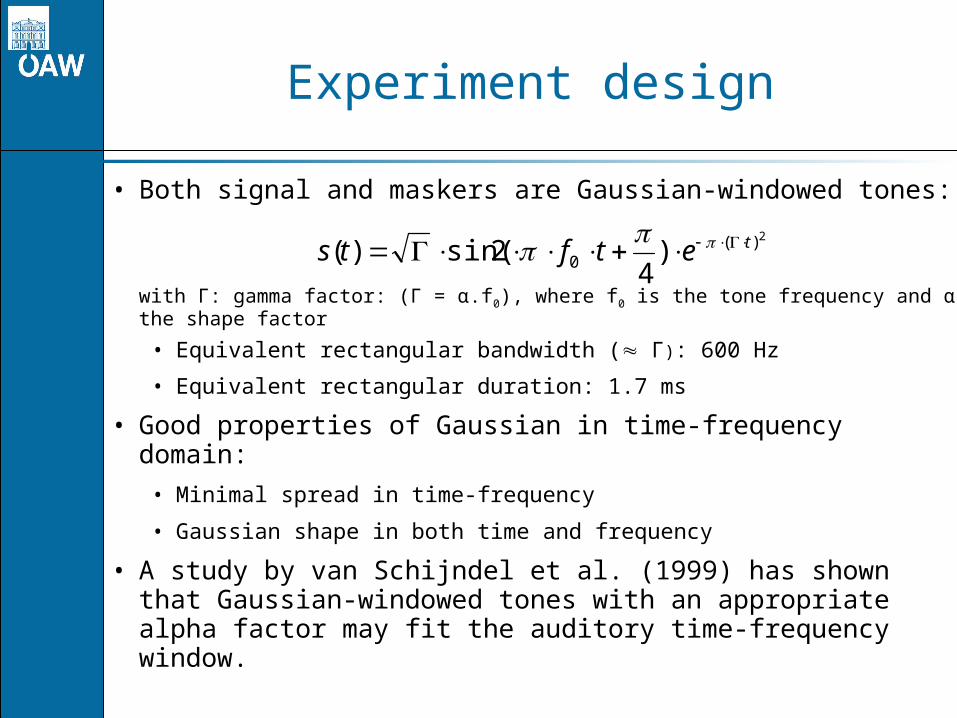
• Both signal and maskers are Gaussian-windowed tones:
with Γ: gamma factor: (Γ = α.f0), where f0 is the tone frequency and α the shape factor
• Equivalent rectangular bandwidth ( Γ): 600 Hz
• Equivalent rectangular duration: 1.7 ms
• Good properties of Gaussian in time-frequency domain:
• Minimal spread in time-frequency
• Gaussian shape in both time and frequency
• A study by van Schijndel et al. (1999) has shown that Gaussian-windowed tones with an appropriate alpha factor may fit the auditory time-frequency window.
2)(0 )
42sin()( tetfts
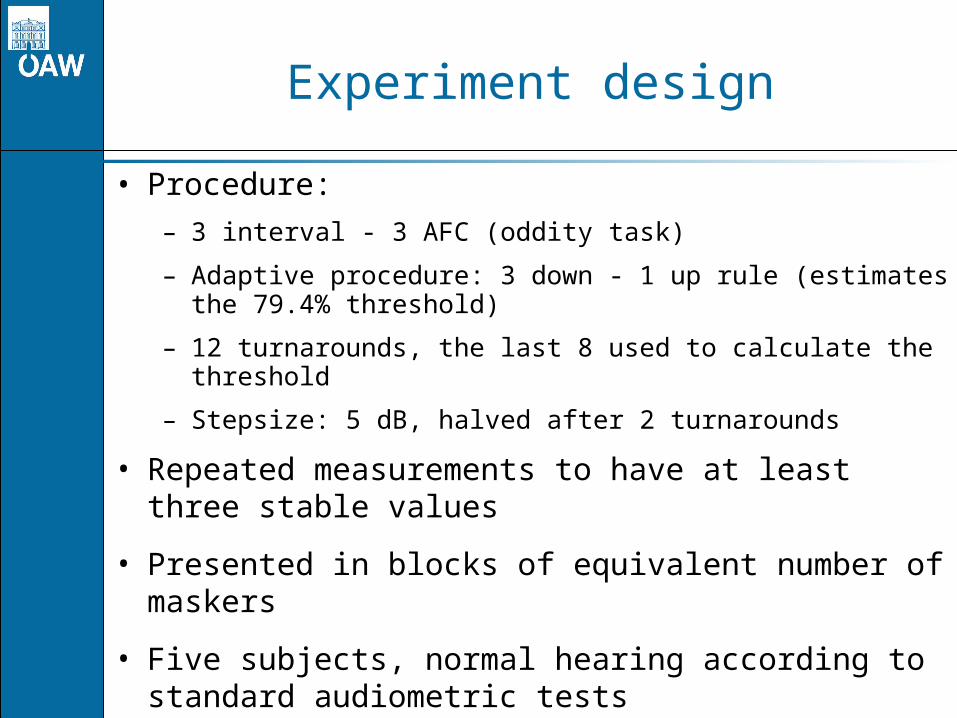
• Procedure:
– 3 interval - 3 AFC (oddity task)
– Adaptive procedure: 3 down - 1 up rule (estimates the 79.4% threshold)
– 12 turnarounds, the last 8 used to calculate the threshold
– Stepsize: 5 dB, halved after 2 turnarounds
• Repeated measurements to have at least three stable values
• Presented in blocks of equivalent number of maskers
• Five subjects, normal hearing according to standard audiometric tests
Experiment design
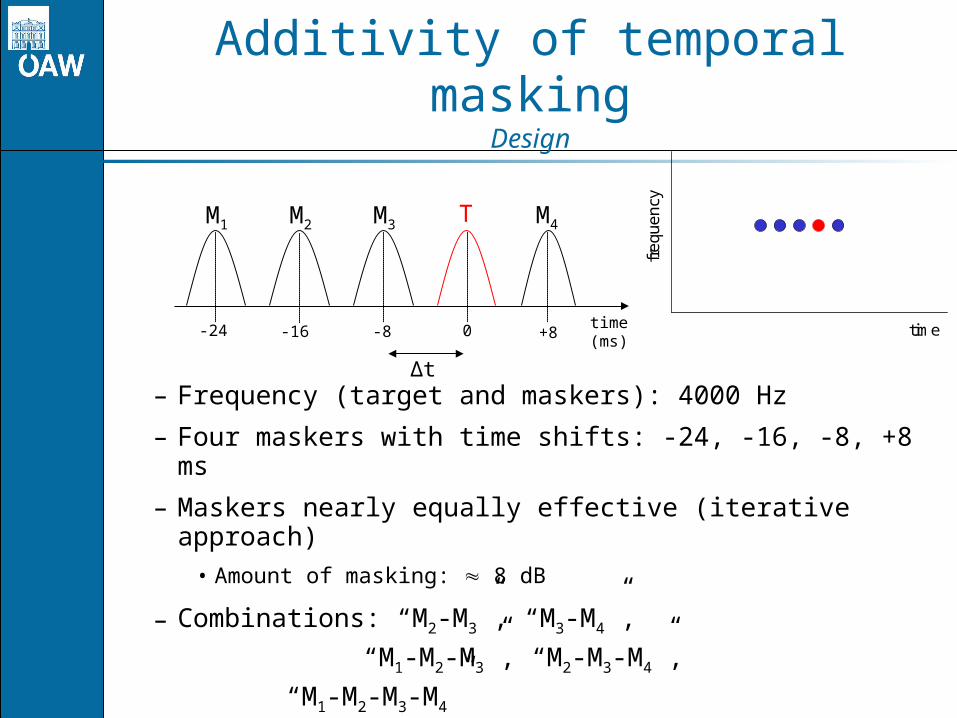
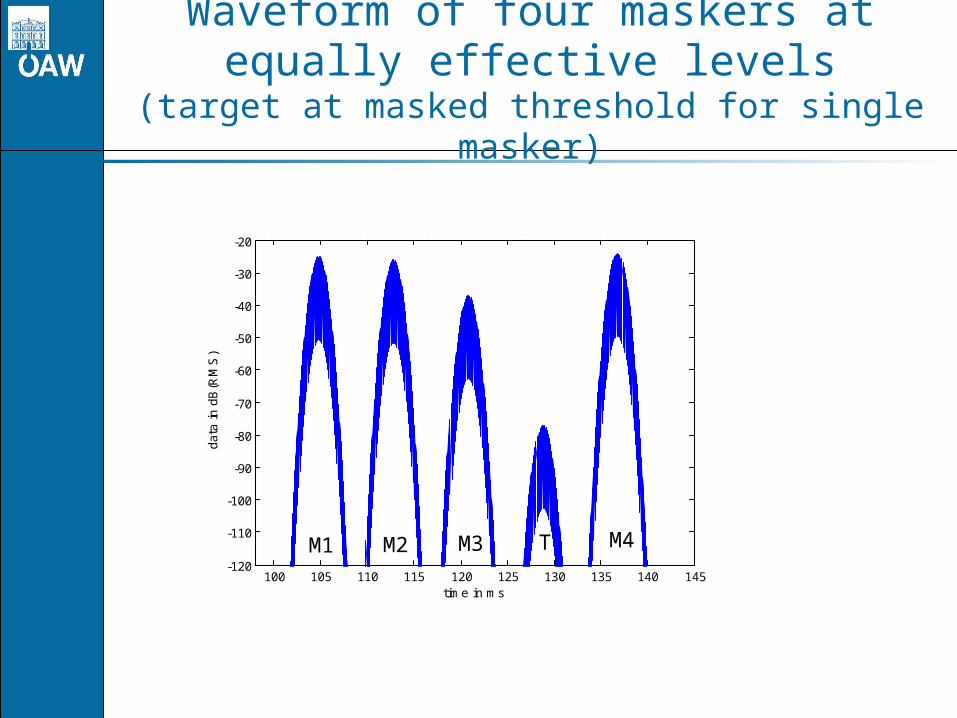
Additivity of temporal maskingDesign
– Frequency (target and maskers): 4000 Hz
– Four maskers with time shifts: -24, -16, -8, +8 ms
– Maskers nearly equally effective (iterative approach)
• Amount of masking: 8 dB
– Combinations: “M2-M3”, “M3-M4”,
“M1-M2-M3”, “M2-M3-M4”,
“M1-M2-M3-M4”
Δt
M3 TM2
time (ms)
M1 M4
time
fre
que
ncy
0 +8-8-16-24
100 105 110 115 120 125 130 135 140 145-120
-110
-100
-90
-80
-70
-60
-50
-40
-30
-20
time in ms
da
ta i
n d
B(R
MS
)77.0040000000020a25.004000-024b26.004000-016c37.004000-008d24.004000008.wav
Waveform of four maskers at equally effective levels
(target at masked threshold for single masker)
M1 M2 M3 M4T
Δt
M3 TM2
time
M1 M4M3 TM2
time
M1 M4
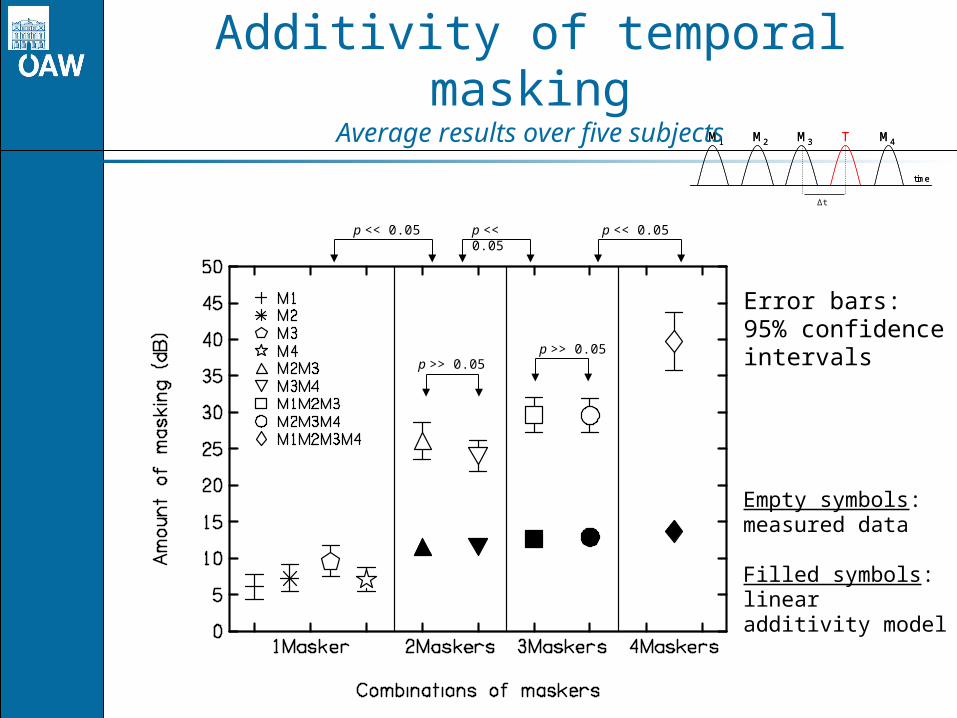
Additivity of temporal maskingAverage results over five subjects
p << 0.05 p << 0.05 p << 0.05
p >> 0.05p >> 0.05
Empty symbols: measured data
Filled symbols: linear additivity model
Error bars:95% confidence intervals
Δt
M3 TM2
time
M1 M4M3 TM2
time
M1 M4
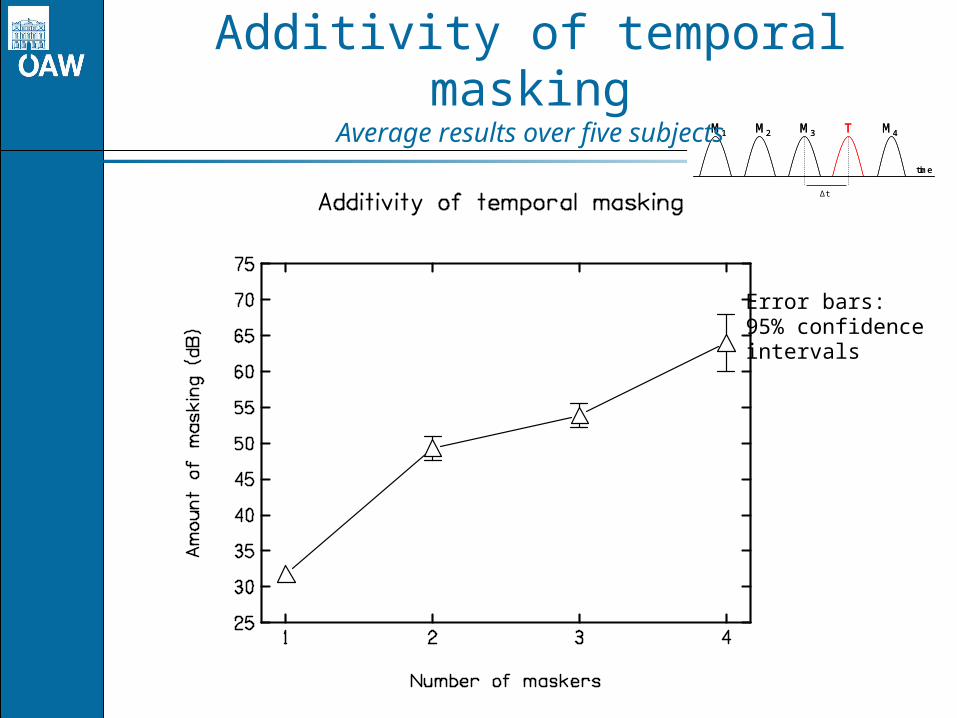
Additivity of temporal maskingAverage results over five subjects
Error bars:95% confidence intervals
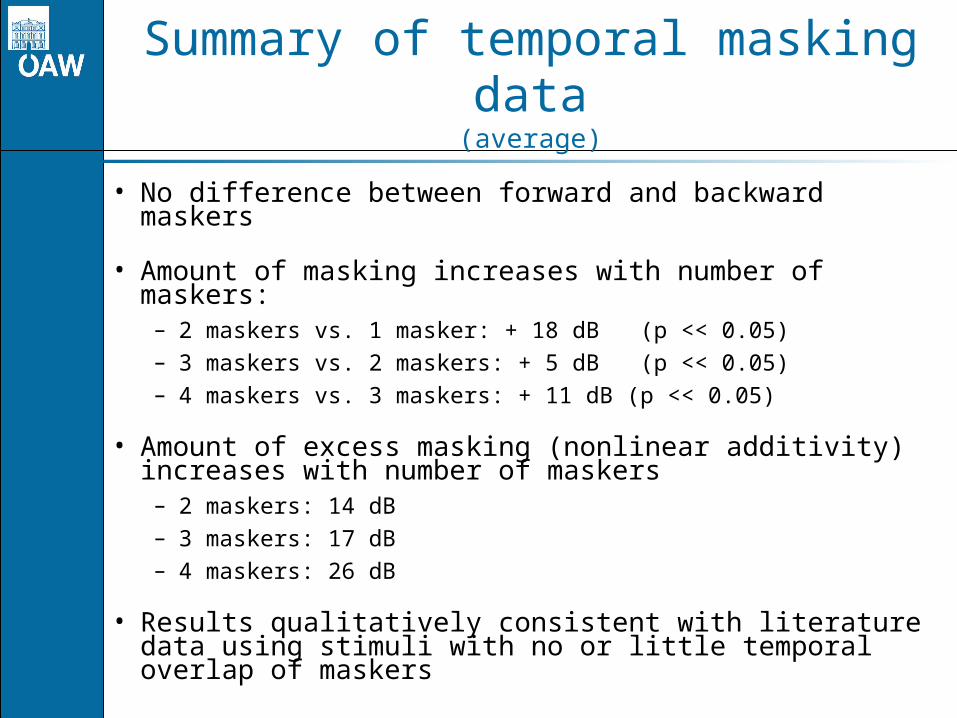
Summary of temporal masking data(average)
• No difference between forward and backward maskers
• Amount of masking increases with number of maskers:– 2 maskers vs. 1 masker: + 18 dB (p << 0.05)– 3 maskers vs. 2 maskers: + 5 dB (p << 0.05)– 4 maskers vs. 3 maskers: + 11 dB (p << 0.05)
• Amount of excess masking (nonlinear additivity) increases with number of maskers
– 2 maskers: 14 dB– 3 maskers: 17 dB– 4 maskers: 26 dB
• Results qualitatively consistent with literature data using stimuli with no or little temporal overlap of maskers
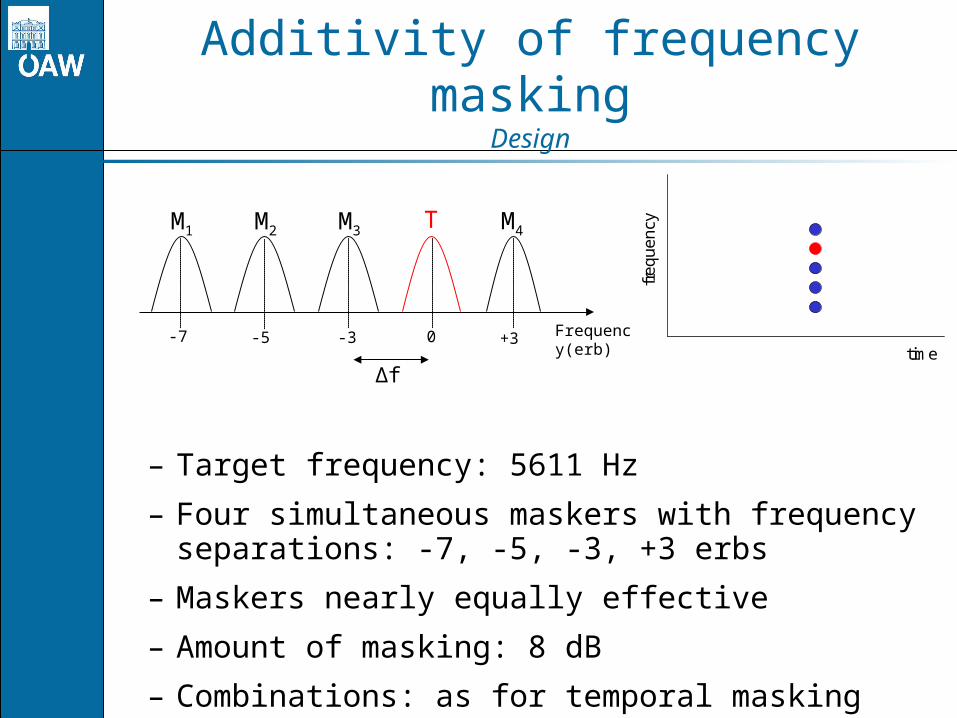
Additivity of frequency maskingDesign
– Target frequency: 5611 Hz
– Four simultaneous maskers with frequency separations: -7, -5, -3, +3 erbs
– Maskers nearly equally effective
– Amount of masking: 8 dB
– Combinations: as for temporal masking
time
fre
que
ncy
Δf
M3 TM2
Frequency(erb)
M1 M4
0 +3-3-5-7
Additivity of frequency maskingDesign
• Cochlear distortions (combination tones) could be detection cues
• Therefore, lowpass-filtered background noise was added
• The most critical condition (M3+T) was tested with/without noise on two subjects
• No difference in threshold: so finally NO masking noise!
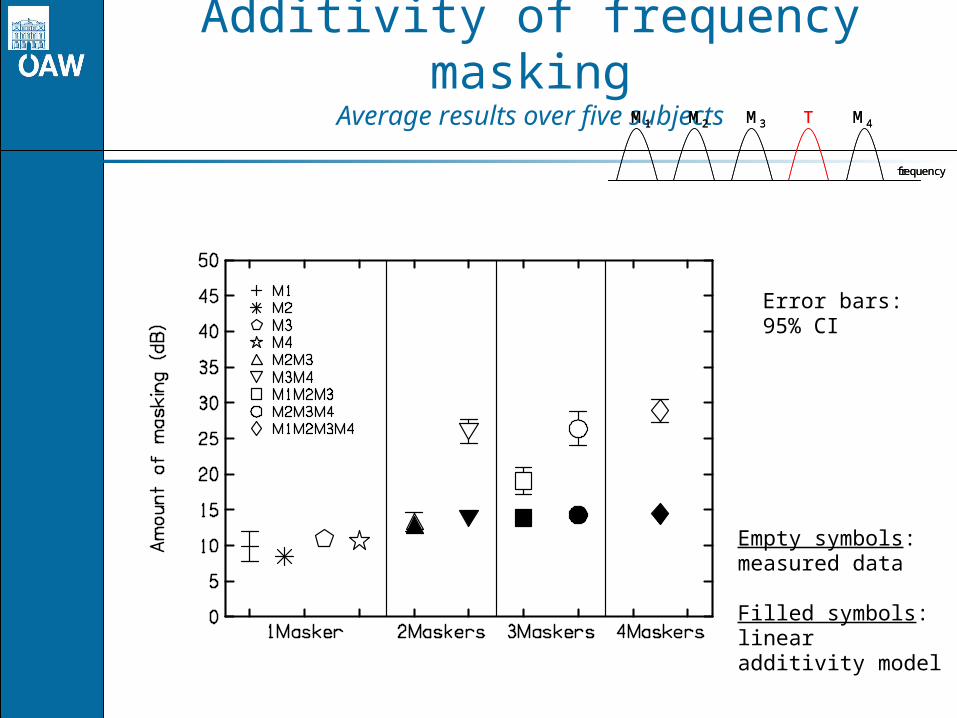
Additivity of frequency maskingAverage results over five subjects
Error bars:95% CI
M3 TM2
frequency
M1 M4M3 TM2
frequency
M1 M4
Empty symbols: measured data
Filled symbols: linear additivity model
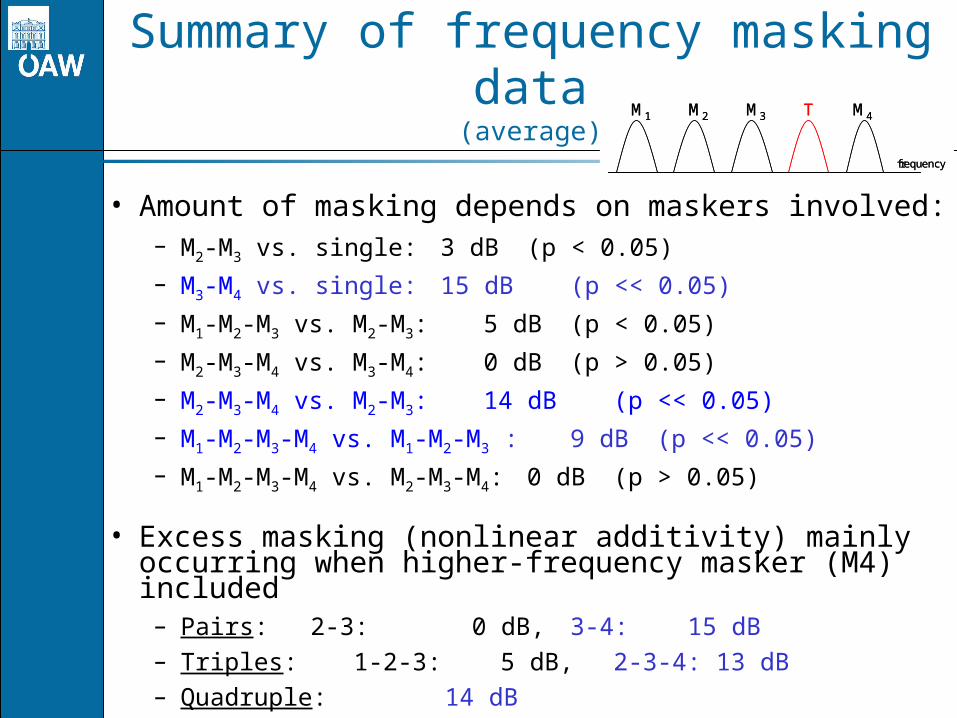
Summary of frequency masking data(average)
• Amount of masking depends on maskers involved:– M2-M3 vs. single: 3 dB (p < 0.05)
– M3-M4 vs. single: 15 dB (p << 0.05)
– M1-M2-M3 vs. M2-M3: 5 dB (p < 0.05)
– M2-M3-M4 vs. M3-M4: 0 dB (p > 0.05)
– M2-M3-M4 vs. M2-M3: 14 dB (p << 0.05)
– M1-M2-M3-M4 vs. M1-M2-M3 : 9 dB (p << 0.05)
– M1-M2-M3-M4 vs. M2-M3-M4: 0 dB (p > 0.05)
• Excess masking (nonlinear additivity) mainly occurring when higher-frequency masker (M4) included
– Pairs: 2-3: 0 dB, 3-4: 15 dB– Triples: 1-2-3: 5 dB, 2-3-4: 13 dB – Quadruple: 14 dB
M3 TM2
frequency
M1 M4M3 TM2
frequency
M1 M4
0 1 2 3 4 5 6 7 8 9 10-80
-70
-60
-50
-40
-30
-20
-10
0
frequency in kHz
da
ta i
n d
B(R
MS
)
60.0056110080420a38.002521000b40.003181000c45.004000000d30.007836000.wav
M1
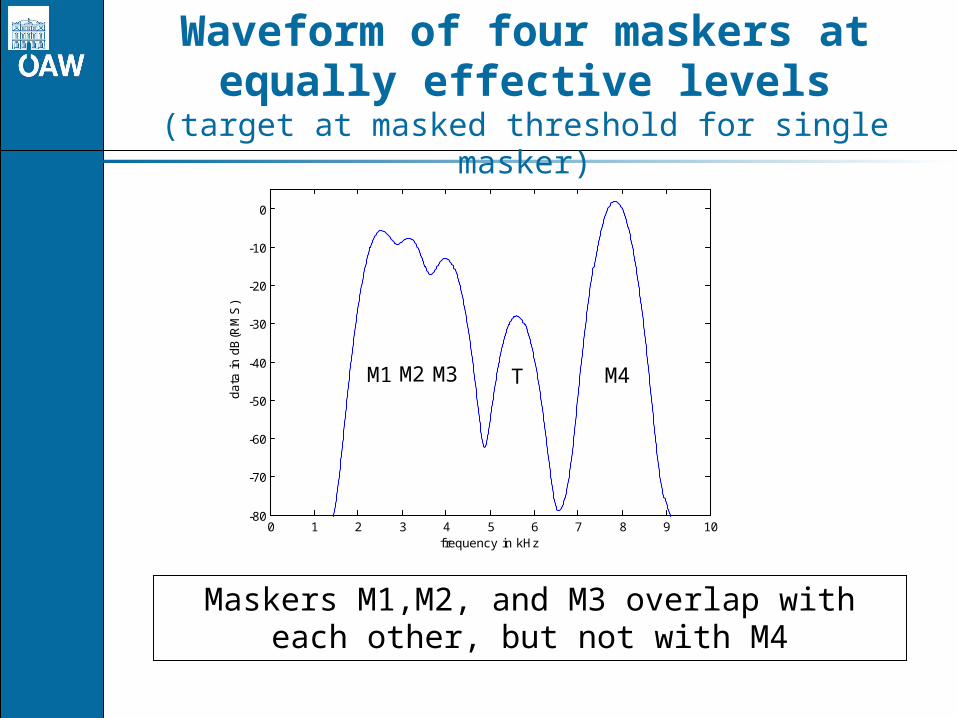
Maskers M1,M2, and M3 overlap with each other, but not with M4
M2 M3 M4
Waveform of four maskers at equally effective levels
(target at masked threshold for single masker)
T
Discussion and Conclusions
• Strong excess masking for Gaussian maskers if they are physically non-overlapping
• Amount of excess masking increases monotonically with number of non-overlapping maskers
• Excess masking is thought to be related to the compressivity of BM vibration (e.g. Humes and Jesteadt, 1989)
• Thus, our Gaussians seem to be subject to BM compression, even though they are rather short (ERD = 1.7 ms)
• This is consistent with the physiological finding that the BM starts to be highly compressive already 0.5 to 0.7 ms after the onset of a signal (Recio et al., 1998)
Modeling of Results
Linear Energy Summation Model
• Assumption: Masked threshold proportional to masker energy at out put of integrator stage
• Combining two equally effective maskers A and B should produce X + 3 dB of masking
• Valid for completely overlapping maskers
Nonlinear Model
• Assumption: Compressive nonlinearity in auditory system is preceding the integrator stage
• Combining maskers A and B results in more than linear additivity (excess masking)
• Valid for non-overlapping maskers
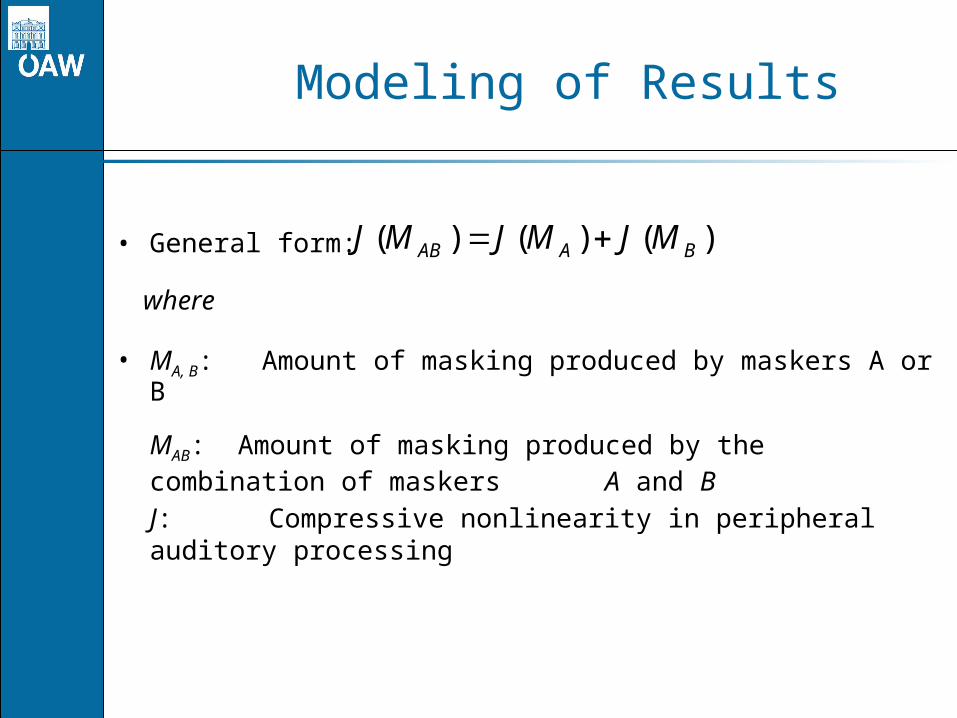
Modeling of Results
• General form:
where
• MA, B: Amount of masking produced by maskers A or B
MAB: Amount of masking produced by the combination of maskers A and B
J: Compressive nonlinearity in peripheral auditory processing
)()()( BAAB MJMJMJ
Modeling of Results
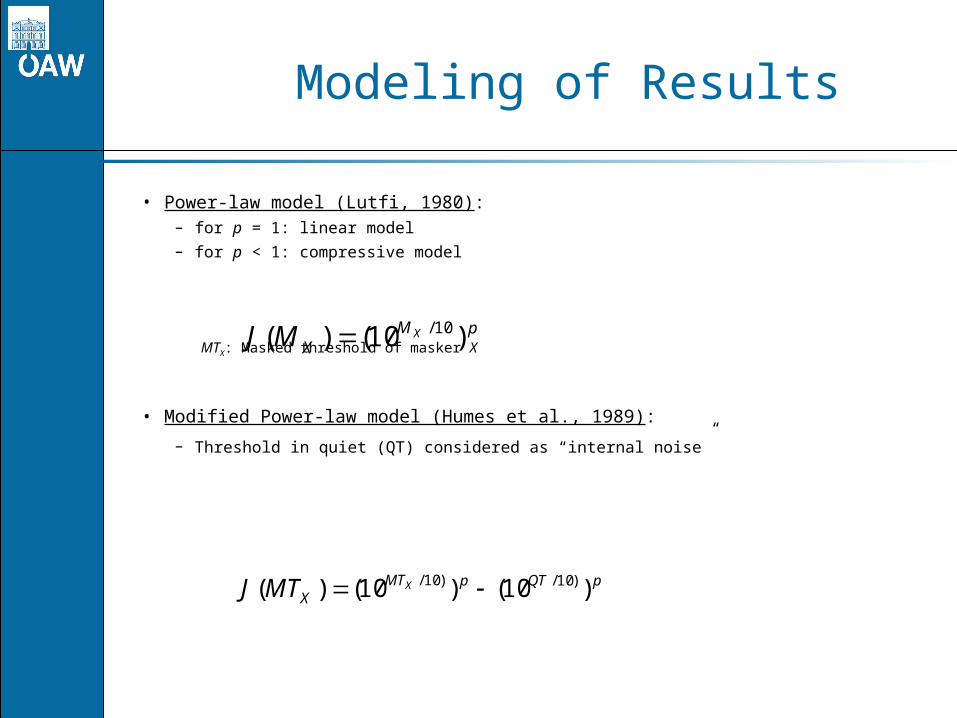
• Power-law model (Lutfi, 1980):– for p = 1: linear model
– for p < 1: compressive model
MTX: Masked threshold of masker X
• Modified Power-law model (Humes et al., 1989):
– Threshold in quiet (QT) considered as “internal noise”
pMX
XMJ )10()( 10/
pQTpMTX
XMTJ )10()10()( )10/)10/
M2M3 M3M4 M1M2M3 M2M3M4 M1M2M3M45
10
15
20
25
30
35
40
45
50
55
60Subject: Mean
Am
ou
nt
of
ma
sk
ing
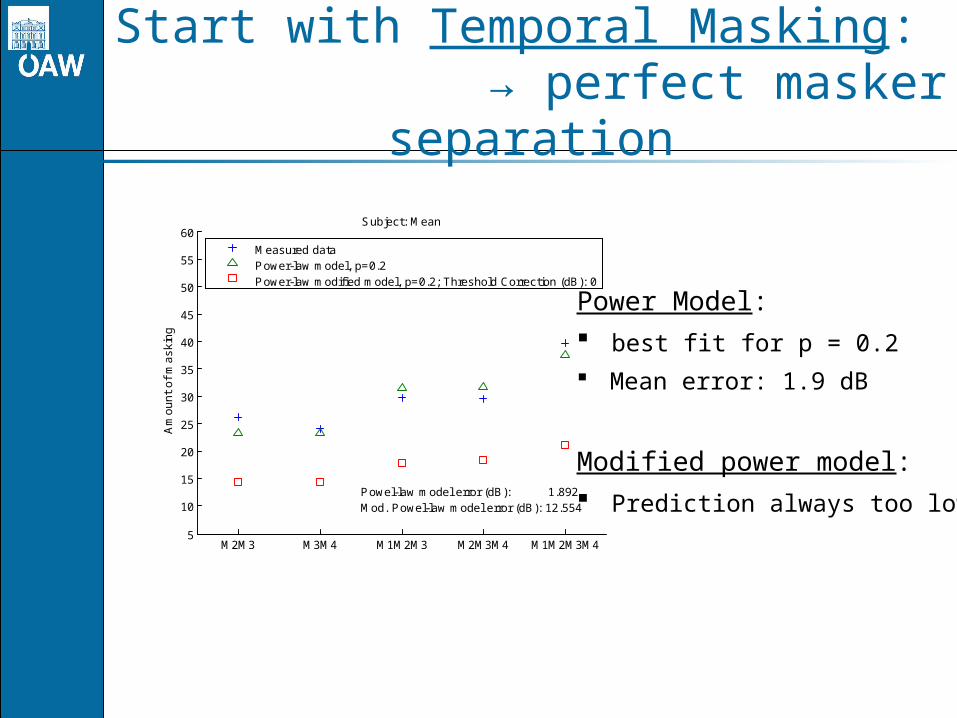
Powel-law model error (dB): 1.892Mod. Powel-law model error (dB): 12.554
Measured dataPower-law model, p=0.2Power-law modified model, p=0.2; Threshold Correction (dB): 0
Start with Temporal Masking: → perfect masker separation
Power Model: best fit for p = 0.2
Mean error: 1.9 dB
Modified power model: Prediction always too low
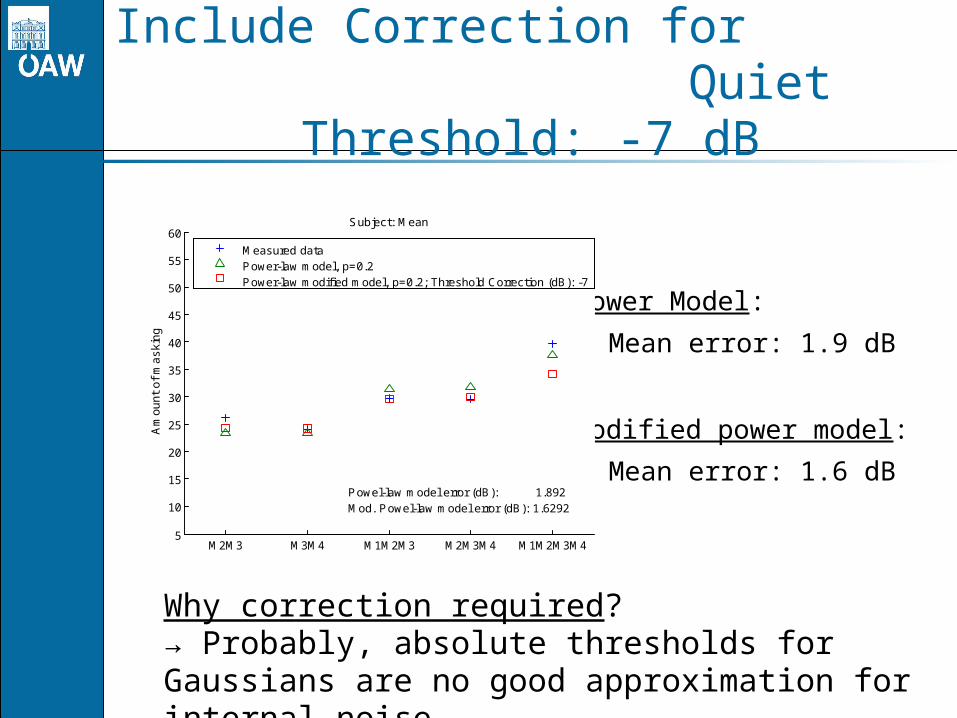
Include Correction for Quiet Threshold: -7 dB
Power Model:
Mean error: 1.9 dB
Modified power model:
Mean error: 1.6 dB
M2M3 M3M4 M1M2M3 M2M3M4 M1M2M3M45
10
15
20
25
30
35
40
45
50
55
60Subject: Mean
Am
ou
nt
of
ma
sk
ing
Powel-law model error (dB): 1.892Mod. Powel-law model error (dB): 1.6292
Measured dataPower-law model, p=0.2Power-law modified model, p=0.2; Threshold Correction (dB): -7
Why correction required? → Probably, absolute thresholds for Gaussians are no good approximation for internal noise
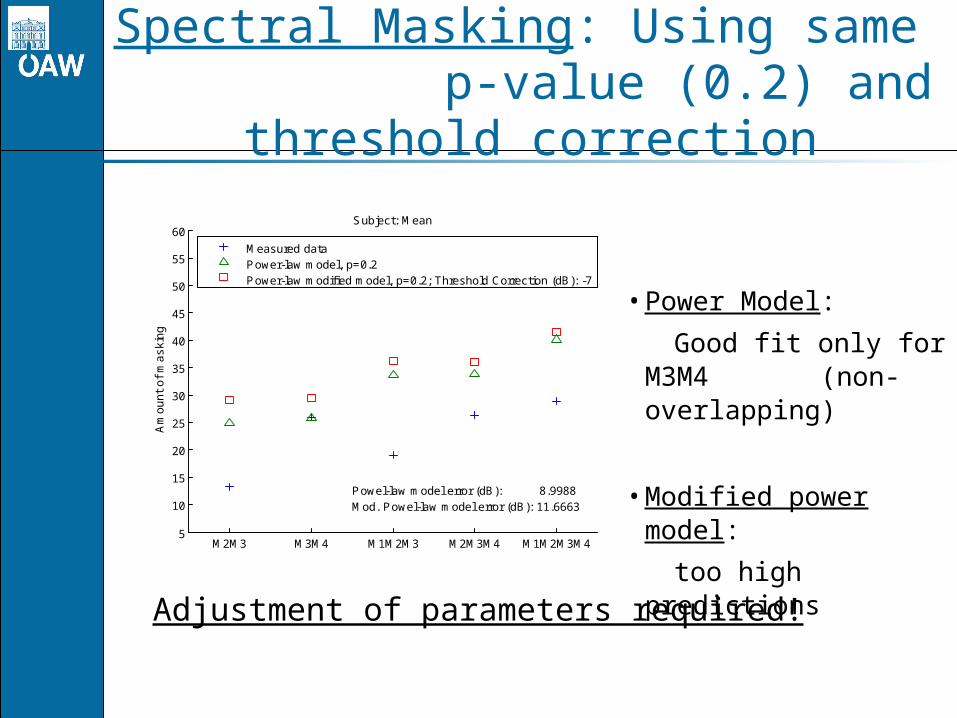
Spectral Masking: Using same p-value (0.2) and threshold correction
• Power Model:
Good fit only for M3M4 (non-overlapping)
• Modified power model:
too high predictionsM2M3 M3M4 M1M2M3 M2M3M4 M1M2M3M4
5
10
15
20
25
30
35
40
45
50
55
60Subject: Mean
Am
ou
nt
of
ma
sk
ing
Powel-law model error (dB): 8.9988Mod. Powel-law model error (dB): 11.6663
Measured dataPower-law model, p=0.2Power-law modified model, p=0.2; Threshold Correction (dB): -7
Adjustment of parameters required!
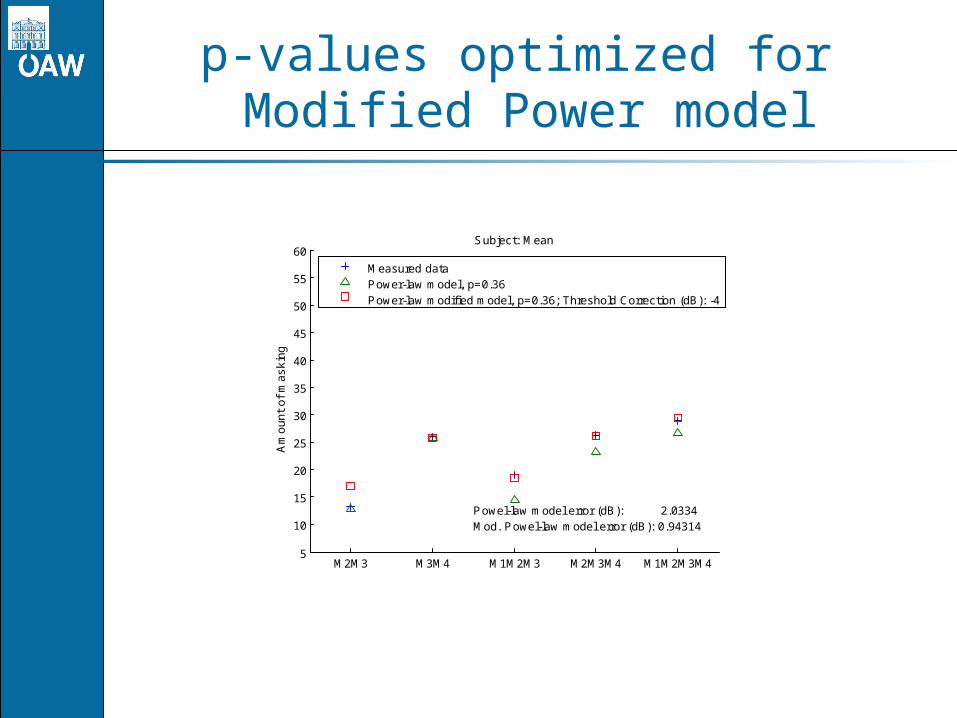
p-values optimized for Modified Power model
M2M3 M3M4 M1M2M3 M2M3M4 M1M2M3M45
10
15
20
25
30
35
40
45
50
55
60Subject: Mean
Am
ou
nt
of
ma
sk
ing
Powel-law model error (dB): 2.0334Mod. Powel-law model error (dB): 0.94314
Measured dataPower-law model, p=0.36Power-law modified model, p=0.36; Threshold Correction (dB): -4
Some questions
• Can we derive appropriate p-values from amount of overlap between maskers?
• Can the (modified) power model be included into the Gabor-Multiplier framework to predict time-frequency masking effects for complex signals?
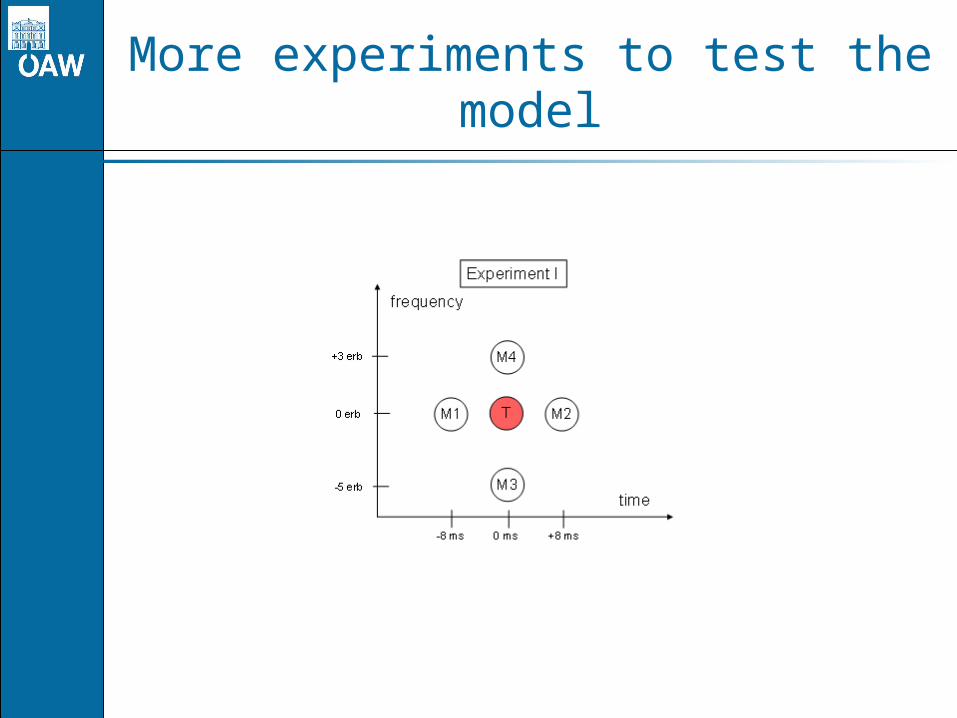
More experiments to test the model
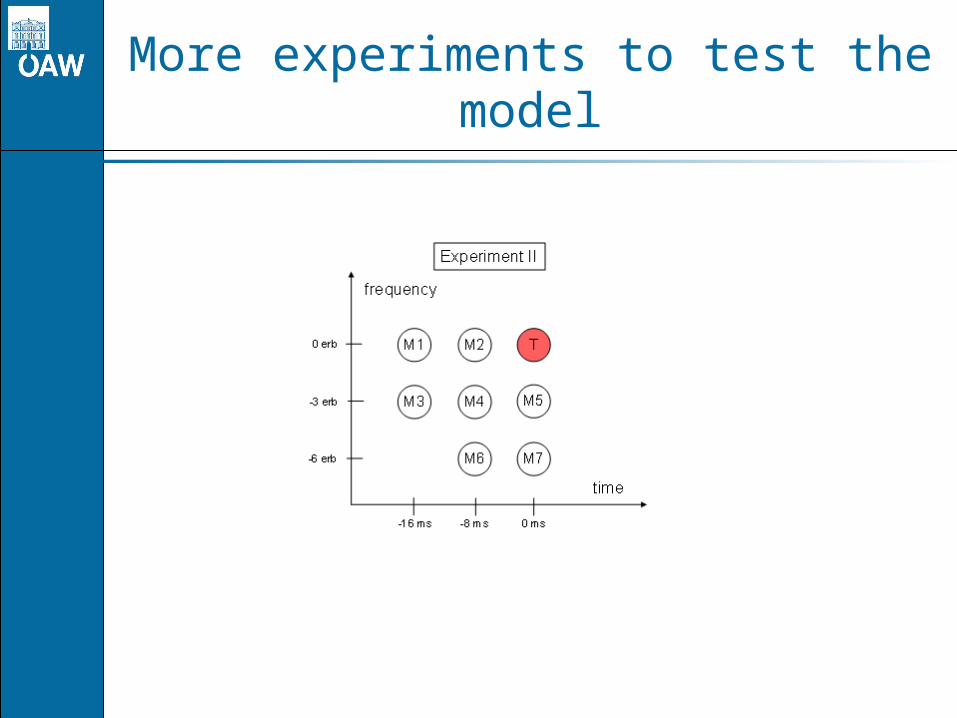
More experiments to test the model
Acknowledgements
• We would like to thank
– the subjects for their patience
– Piotr Majdak for providing support in the development of the software for the experiments
• Work partly supported by WTZ (project AMADEUS) and WWTF (project MULAC)
End of talk
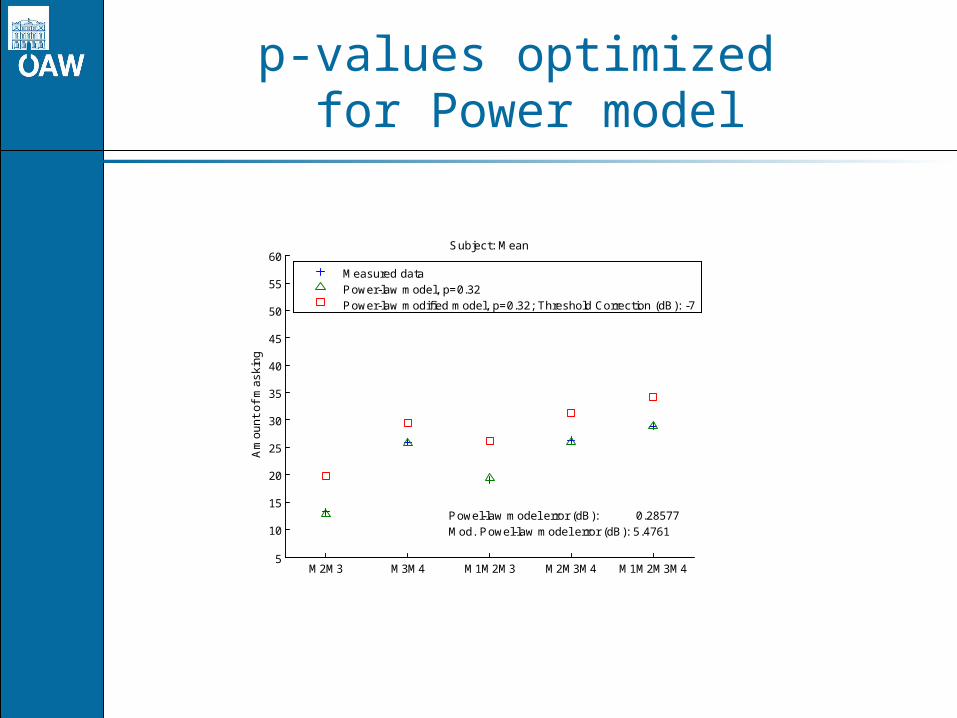
p-values optimized for Power model
M2M3 M3M4 M1M2M3 M2M3M4 M1M2M3M45
10
15
20
25
30
35
40
45
50
55
60Subject: Mean
Am
ou
nt
of
ma
sk
ing
Powel-law model error (dB): 0.28577Mod. Powel-law model error (dB): 5.4761
Measured dataPower-law model, p=0.32Power-law modified model, p=0.32; Threshold Correction (dB): -7
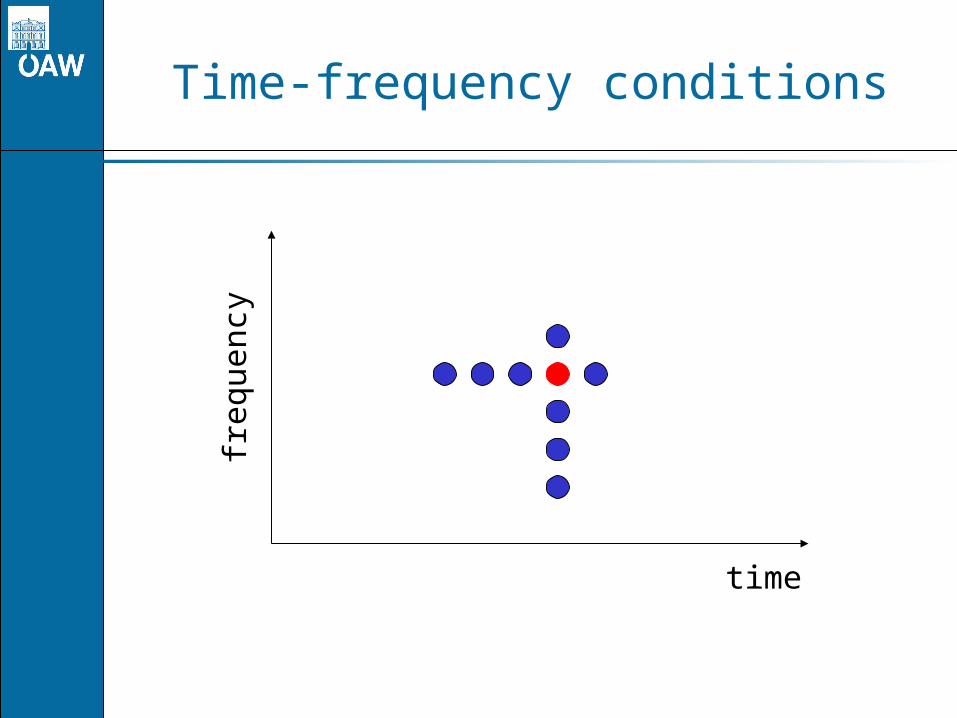
Time-frequency conditions
time
freq
uenc
y