Embed Size (px)
Citation preview
Additional Road Investments Needed to Support Oil & Gas Production and Distribution in
North Dakota
Upper Great Plains Transportation InstituteUpper Great Plains Transportation Institute
North Dakota State UniversityNorth Dakota State University
Presentation TopicsPresentation Topics
Overview of study and results Details of analysis Details of unpaved road analysis
Types of improvements and analysis methods
Details of paved road analysis Types of improvements, costs, and effects
Conclusions and discussion
2

Study OverviewStudy Overview
Purpose: Forecast road investment needs in oil and gas
producing counties of North Dakota over the next 20 years
Objective:Quantify the additional investments necessary
for efficient year-round transportation for the oil industry while providing travelers with acceptable roadway service
3
Study OverviewStudy Overview
Scope: The focus is on roads owned or maintained by local governments – e.g. counties and townships.
Study Area: 17 oil and gas producing counties Counties include: Billings, Bottineau, Bowman,
Burke, Divide, Dunn, Golden Valley, McHenry, McKenzie, Mclean, Mercer, Mountrail, Renville, Slope, Stark, Ward, and Williams
4

Primary Data SourcesPrimary Data Sources
Analysis based on: oil production forecasts, traffic data, county road surveys
Types of roads analyzed: paved, graveled, and graded & drained
2010 survey→ information on impacted routes and conditions
2008 survey→ information on typical road characteristics
5
Production ForecastingProduction Forecasting
Oil &Gas Division of North Dakota Industrial CommissionExisting and near-term drilling locationsBased upon current rig activity and permit
applications through end of 2010 Future locations of rigs estimated from
lease data from North Dakota Land Department
6
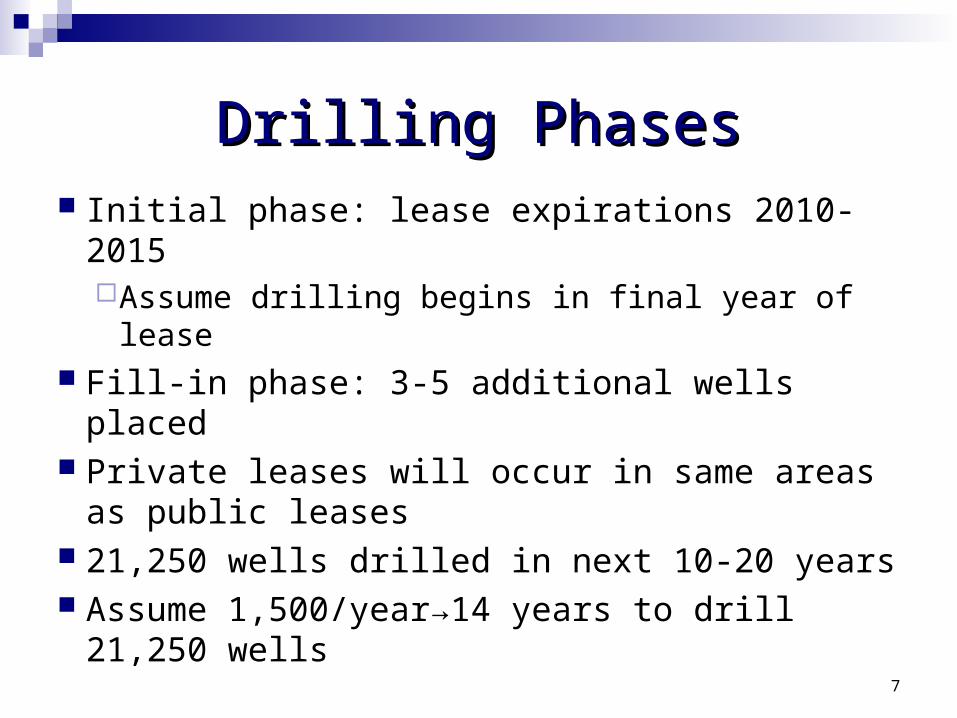
Drilling PhasesDrilling Phases Initial phase: lease expirations 2010-2015
Assume drilling begins in final year of lease Fill-in phase: 3-5 additional wells placed Private leases will occur in same areas as
public leases 21,250 wells drilled in next 10-20 years Assume 1,500/year→14 years to drill
21,250 wells
7

Traffic Prediction ModelTraffic Prediction Model Forecasted output of wells is routed over
road network using detailed GIS model Oil movements converted to equivalent
truck trips following least-cost routes Projected inputs (e.g., sand and water) and
outbound movements (salt water) similarly routed
Movements of specialized equipment (such as workover rigs) included
8

Road Investment AnalysisRoad Investment Analysis
Predicted inbound and outbound movements accumulated for each impacted segment
Oil-related trips combined with baseline (non-oil) traffic to estimate total traffic load on each road
Economic/engineering methods used to estimate additional investment needs
9
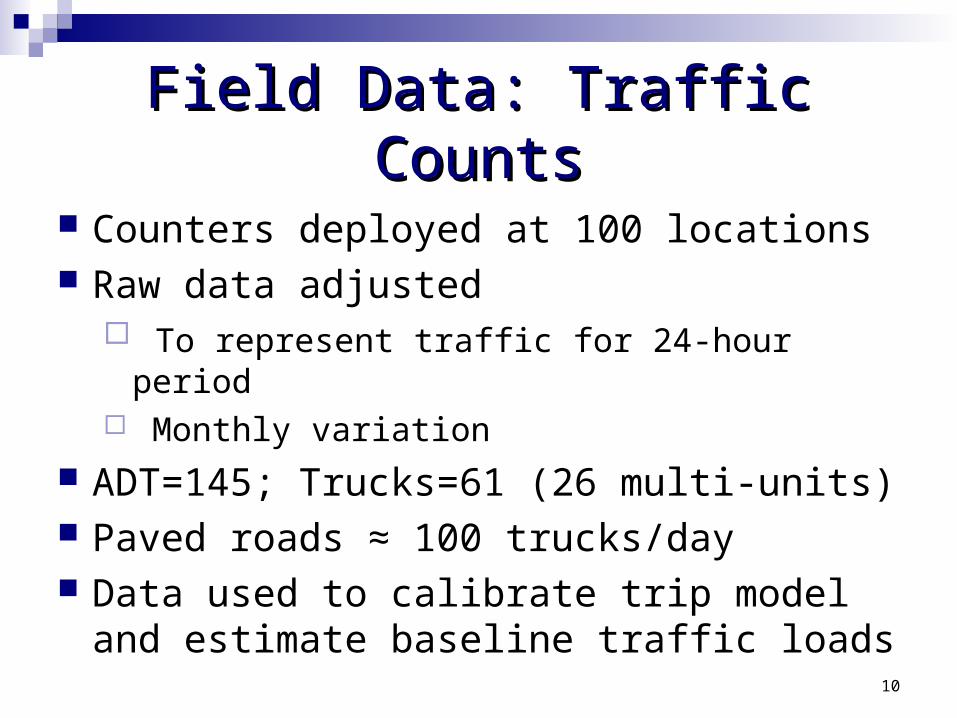
Field Data: Traffic CountsField Data: Traffic Counts
Counters deployed at 100 locations Raw data adjusted
To represent traffic for 24-hour period Monthly variation
ADT=145; Trucks=61 (26 multi-units) Paved roads ≈ 100 trucks/day Data used to calibrate trip model and
estimate baseline traffic loads
10

Estimated Investment NeedsEstimated Investment Needs2012-2013 -- 2030-2031 (Millions)2012-2013 -- 2030-2031 (Millions)
11
Unpaved Roads $567.00
Paved Roads $340.10
All Roads $907.10
3% Inflation $1,099.30
5% Inflation $1,266.57

Investment Needs by Biennium Investment Needs by Biennium (Millions)(Millions)
12
Biennium Unpaved Paved Total
2012-2013 $114.90 $118.20 $233.10
2014-2015 $114.90 $149.90 $264.80
2016-2017 $75.90 $17.00 $92.90
2018-2019 $36.90 $20.70 $57.60

Details of AnalysisDetails of Analysis
Data Collection Network Flow Modeling Unpaved Analysis Paved Analysis
13
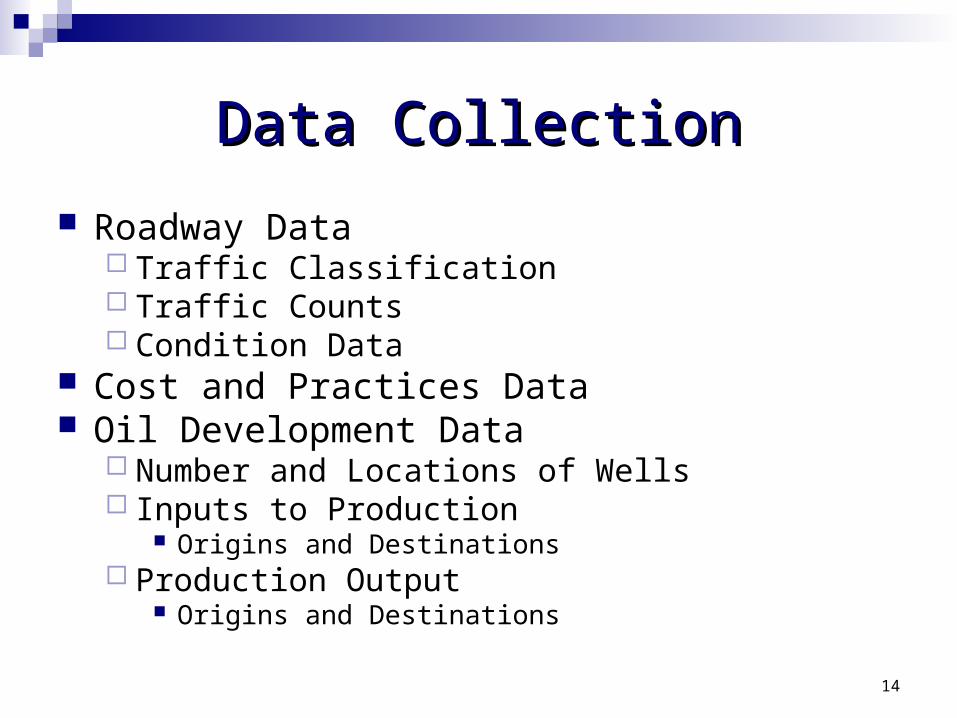
Data CollectionData Collection
Roadway Data Traffic Classification Traffic Counts Condition Data
Cost and Practices Data Oil Development Data
Number and Locations of Wells Inputs to Production
Origins and Destinations Production Output
Origins and Destinations
14

Roadway DataRoadway Data
Traffic Classification Maps sent to county point person with instructions to
classify roadways by traffic levels Used to identify potential sample traffic count sites
Traffic Counts Selected using the classification data provided by the
county point people Used to calibrate the GIS network routing model and
to verify vehicle classification Photos were taken of many of the road segments
where counters were placed, and used to verify surface type and condition data
15

Cost and Practices DataCost and Practices Data
Survey of County ContactsComponent costs - Unpaved
Gravel Blading Location Delivery Placement Dust suppressant Paving costs
16
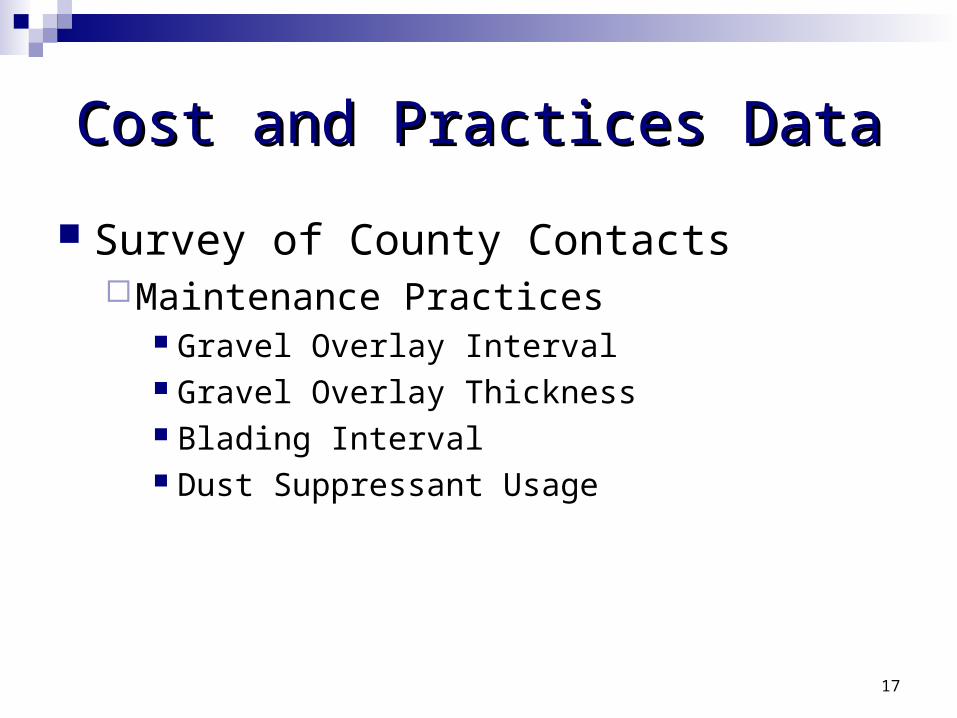
Cost and Practices DataCost and Practices Data
Survey of County ContactsMaintenance Practices
Gravel Overlay Interval Gravel Overlay Thickness Blading Interval Dust Suppressant Usage
17
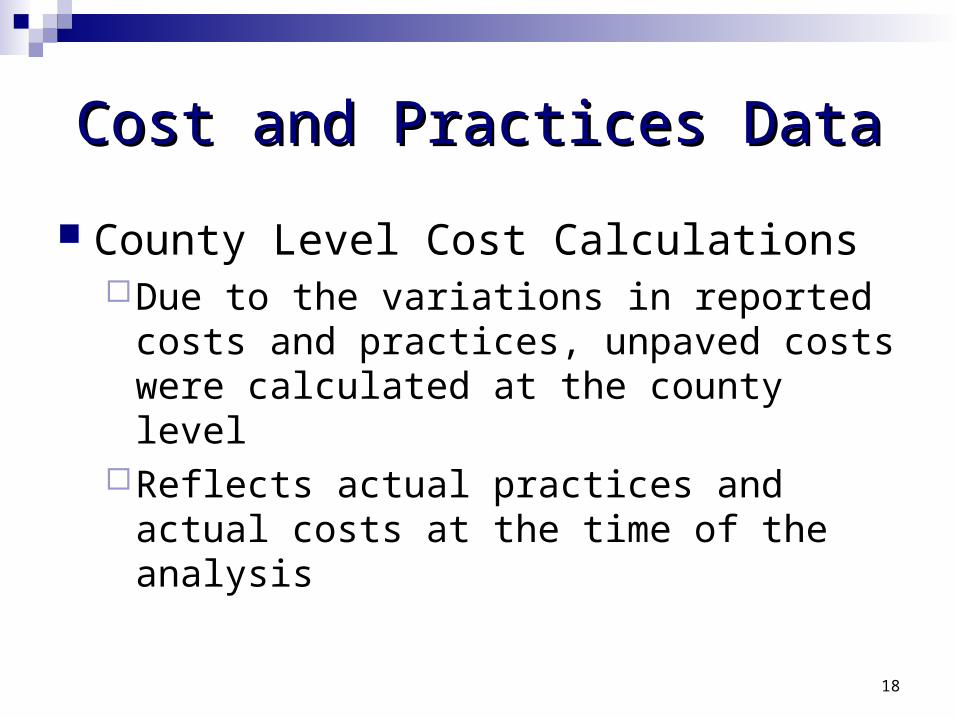
Cost and Practices DataCost and Practices Data
County Level Cost CalculationsDue to the variations in reported costs and
practices, unpaved costs were calculated at the county level
Reflects actual practices and actual costs at the time of the analysis
18
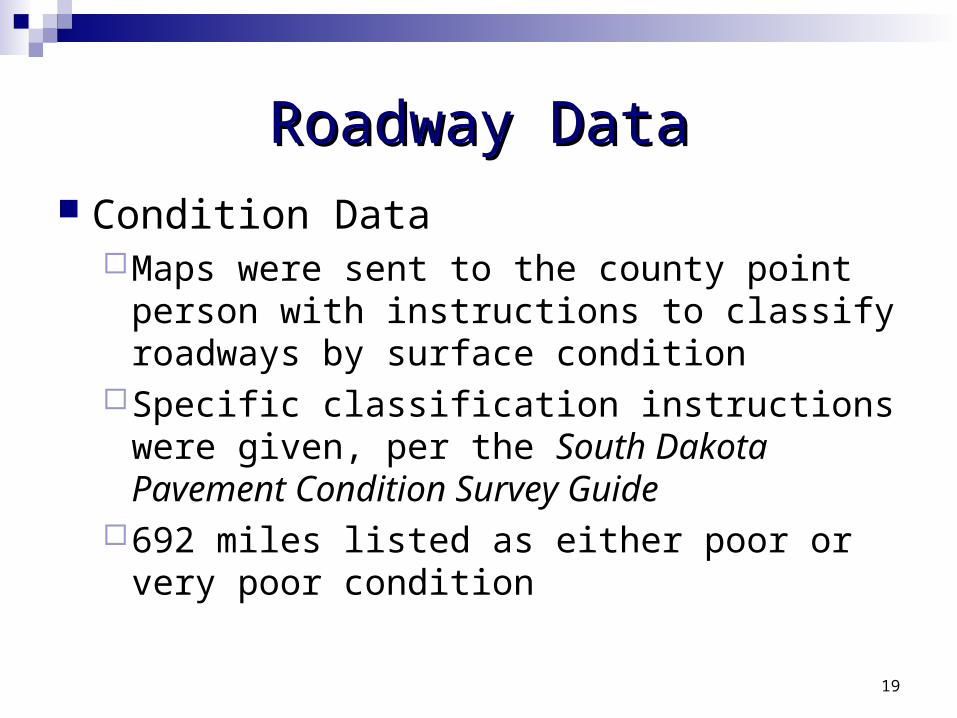
Roadway DataRoadway Data Condition Data
Maps were sent to the county point person with instructions to classify roadways by surface condition
Specific classification instructions were given, per the South Dakota Pavement Condition Survey Guide
692 miles listed as either poor or very poor condition
19
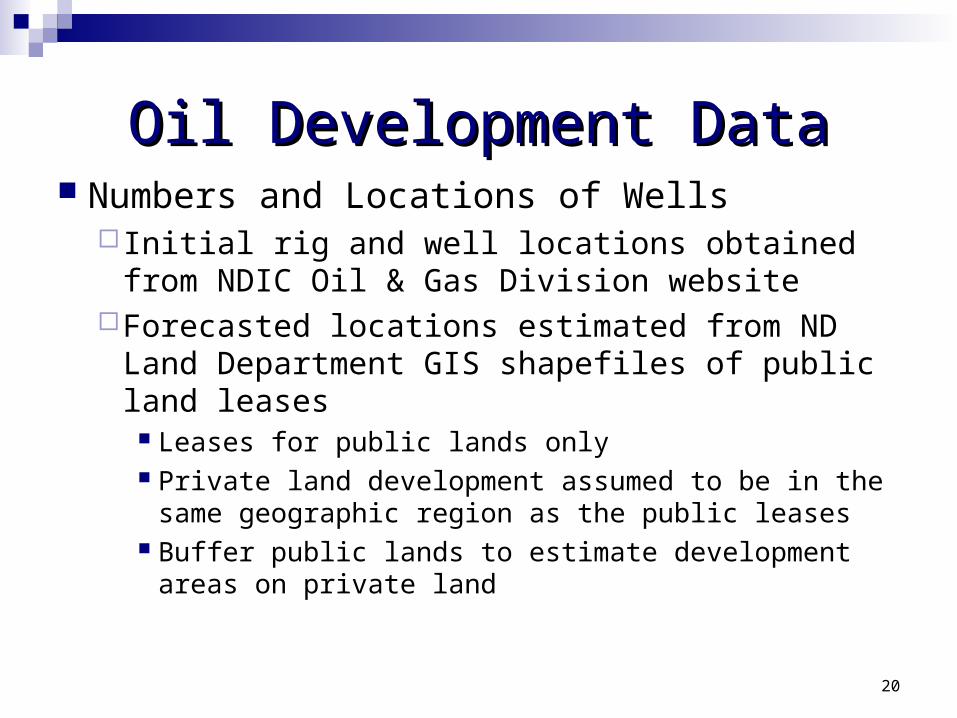
Oil Development DataOil Development Data Numbers and Locations of Wells
Initial rig and well locations obtained from NDIC Oil & Gas Division website
Forecasted locations estimated from ND Land Department GIS shapefiles of public land leases
Leases for public lands only Private land development assumed to be in the same
geographic region as the public leases Buffer public lands to estimate development areas on
private land
20

Oil Development DataOil Development Data Forecasted locations estimated from ND Land
Department GIS shapefiles of public land leases ND Land Department data has lease expiration dates Assumption that drilling will occur in the final year of the
lease, and is a single well Oil & Gas estimates 1,450-2,940 wells/year – 2,140
expected, 21,250 in 10 to 20 years Lease expirations available through 2015 Post 2015 – filling in phase of drilling
4-6 additional wells on the site
21

Oil Development DataOil Development Data
InputsData collected from Oil & Gas, NDDOT, and
industry representativesThe goal was to quantify the number and type
of truck trips that the well drilling process generates
The major trip generators were water, equipment and sand
22
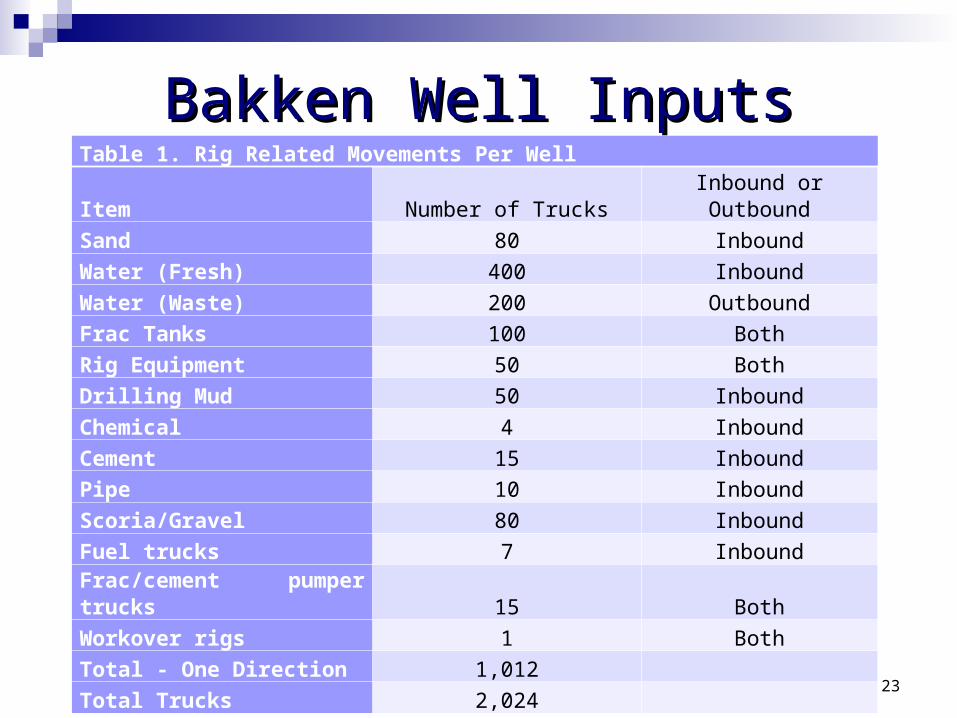
Bakken Well InputsBakken Well InputsTable 1. Rig Related Movements Per Well
Item Number of Trucks Inbound or Outbound
Sand 80 Inbound
Water (Fresh) 400 Inbound
Water (Waste) 200 Outbound
Frac Tanks 100 Both
Rig Equipment 50 Both
Drilling Mud 50 Inbound
Chemical 4 Inbound
Cement 15 Inbound
Pipe 10 Inbound
Scoria/Gravel 80 Inbound
Fuel trucks 7 Inbound
Frac/cement pumper trucks 15 Both
Workover rigs 1 Both
Total - One Direction 1,012
Total Trucks 2,024
23

Oil Development DataOil Development Data
OutputsProduction (Oil & Gas)
County average IP rates Production curve and pipeline access Saltwater production
Oil collection/transload sites (Oil & Gas) Current list of operating oil collection points
Saltwater Disposal Sites (Oil & Gas) Current list of operating SWD sites
24
Network Flow ModelingNetwork Flow Modeling
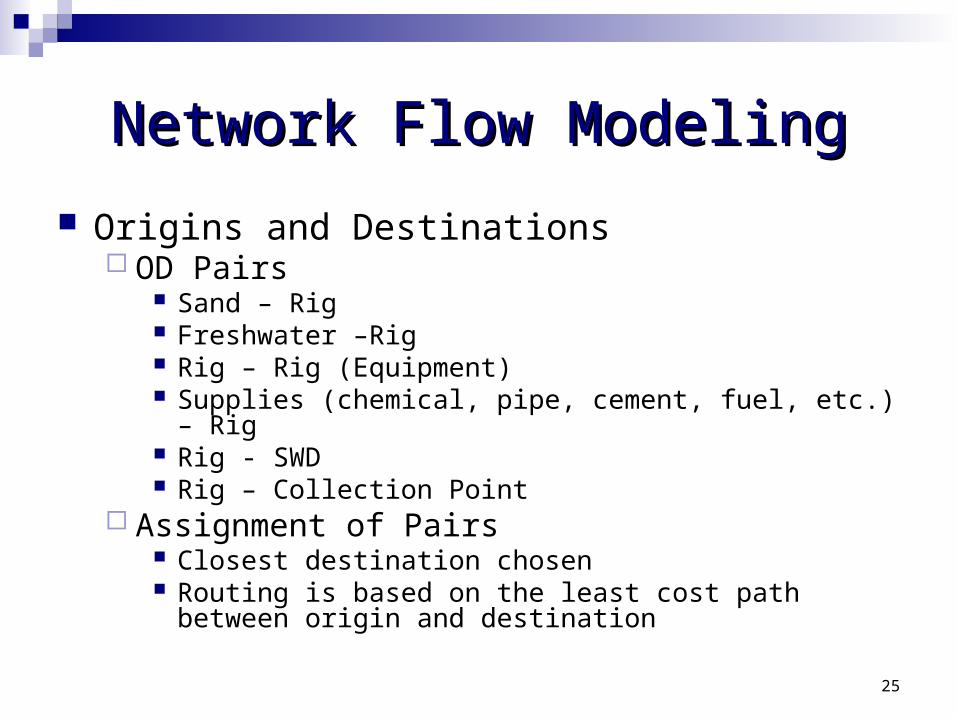
Origins and Destinations OD Pairs
Sand – Rig Freshwater –Rig Rig – Rig (Equipment) Supplies (chemical, pipe, cement, fuel, etc.) – Rig Rig - SWD Rig – Collection Point
Assignment of Pairs Closest destination chosen Routing is based on the least cost path between origin and
destination
25
Network Flow ModelingNetwork Flow Modeling
ScenariosBaseline – Summer 2010
June Oil Sales Existing Well and Rig Locations Network Development and Refinement
26
Network Flow ModelingNetwork Flow Modeling
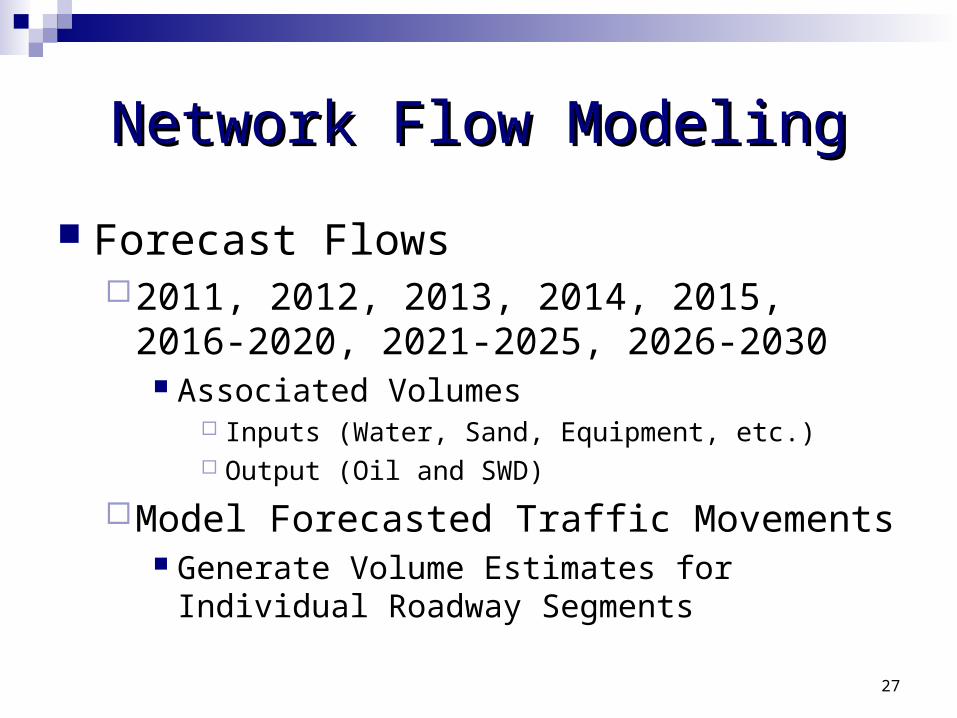
Forecast Flows2011, 2012, 2013, 2014, 2015, 2016-2020,
2021-2025, 2026-2030 Associated Volumes
Inputs (Water, Sand, Equipment, etc.) Output (Oil and SWD)
Model Forecasted Traffic Movements Generate Volume Estimates for Individual
Roadway Segments
27

Unpaved Road AnalysisUnpaved Road Analysis Estimation of the additional maintenance
and improvement activities due to oil development
Impacted Miles: 11,834 gravel, 884 graded & drained
28
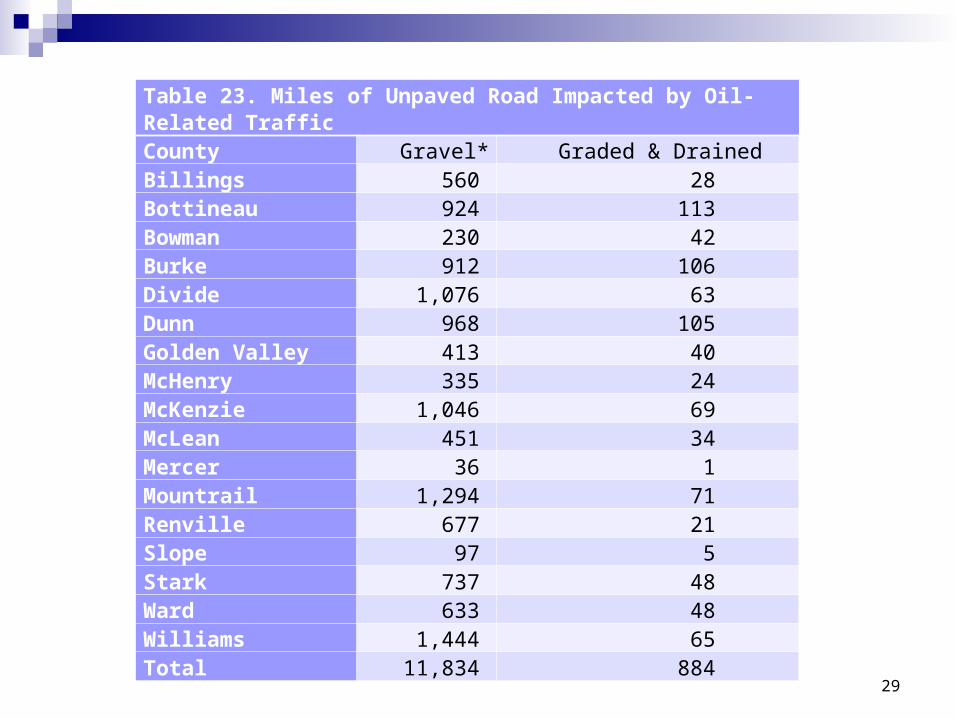
Unpaved RoadsUnpaved RoadsTable 23. Miles of Unpaved Road Impacted by Oil-Related TrafficCounty Gravel* Graded & DrainedBillings 560 28Bottineau 924 113Bowman 230 42Burke 912 106Divide 1,076 63Dunn 968 105Golden Valley 413 40McHenry 335 24McKenzie 1,046 69McLean 451 34Mercer 36 1Mountrail 1,294 71Renville 677 21Slope 97 5Stark 737 48Ward 633 48Williams 1,444 65Total 11,834 884
29

Unpaved RoadsUnpaved Roads
Impacted means that at least one oil related truck was routed over the section in the network flow model Impacts and needs vary by traffic levels
Impact Classification Low: 0-25 (10,930 miles) Elevated: 25-50 (1,094 miles) Moderate: 50-100 (409 miles) High: 100+ (284 miles)
30

Unpaved RoadsUnpaved Roads Improvement Types
Graded and Drained Low: No additional improvements Elevated: Maintenance increase Moderate: Upgrade to gravel roadway (reconstruct) High: Upgrade to gravel roadway (reconstruct)
Roadway Width Initial condition of graded and drained roads are often
deficient with respect to roadway width Reconstruction includes regrading the road, and
addition of width to a minimum of 24 feet with gravel overlay
31
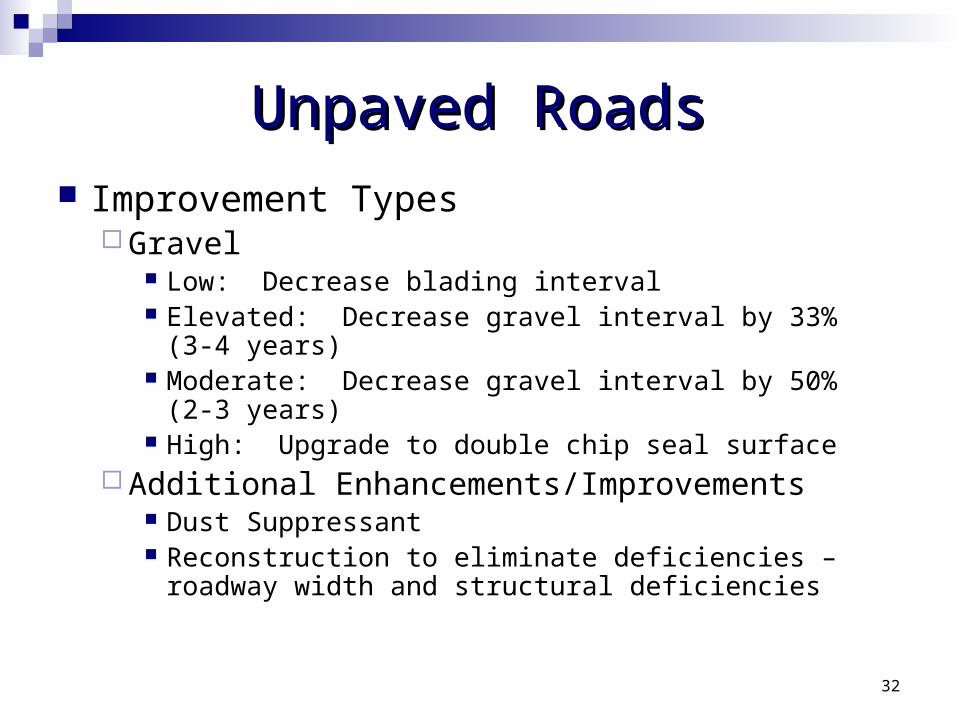
Unpaved RoadsUnpaved Roads Improvement Types
Gravel Low: Decrease blading interval Elevated: Decrease gravel interval by 33% (3-4 years) Moderate: Decrease gravel interval by 50% (2-3 years) High: Upgrade to double chip seal surface
Additional Enhancements/Improvements Dust Suppressant Reconstruction to eliminate deficiencies – roadway
width and structural deficiencies
32

Unpaved RoadsUnpaved Roads Chip Seal Improvement
Single Chip Seal Constructed from a single application of binder
followed by a single application of uniformly graded aggregate
Selected for normal situations where no special considerations would indicate that a special type of chip seal is warranted
33
Source: TRB: Chip Seal Best Practices

Unpaved RoadsUnpaved Roads Chip Seal Improvement
Double Chip Seal Constructed from two consecutive applications of both the
bituminous binder followed by a single application of uniformly graded aggregate
Double chip seals have less noise from traffic, provide additional waterproofing, and a more robust seal in comparison with a single chip seal
Used in high stress situations, such as areas that have a high percentage of truck traffic or steep grades
34Source: TRB: Chip Seal Best Practices
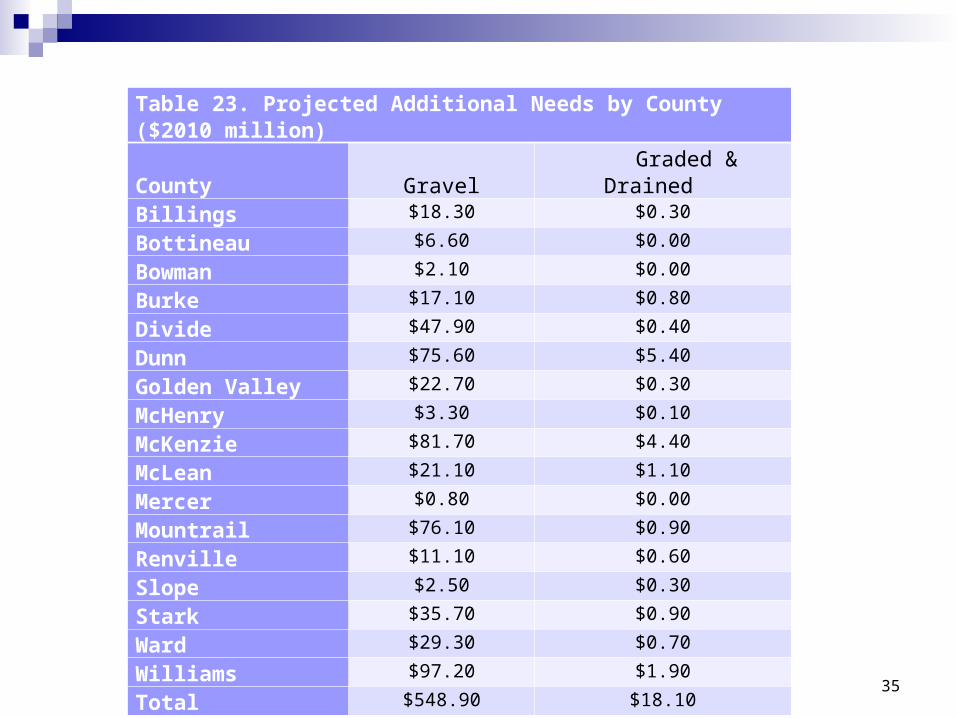
Table 23. Projected Additional Needs by County ($2010 million)County Gravel Graded & DrainedBillings $18.30 $0.30
Bottineau $6.60 $0.00
Bowman $2.10 $0.00
Burke $17.10 $0.80
Divide $47.90 $0.40
Dunn $75.60 $5.40
Golden Valley $22.70 $0.30
McHenry $3.30 $0.10
McKenzie $81.70 $4.40
McLean $21.10 $1.10
Mercer $0.80 $0.00
Mountrail $76.10 $0.90
Renville $11.10 $0.60
Slope $2.50 $0.30
Stark $35.70 $0.90
Ward $29.30 $0.70
Williams $97.20 $1.90
Total $548.90 $18.10
35

Table S.3 Additional Unpaved Road Costs by County: 2012-2015 ($ 2010 Million)
County 2012-2013 2014-20152012-2013
Reconstruction2014-2015
ReconstructionBillings $3.9 $3.9 $2.5 $2.5Bottineau $0.8 $0.8 $0.3 $0.3Bowman $0.5 $0.5 $0.3 $0.3Burke $3.2 $3.2 $1.8 $1.8Divide $9.4 $9.4 $6.0 $6.0Dunn $17.3 $17.3 $11.8 $11.8Golden Valley $4.3 $4.3 $2.9 $2.9McHenry $0.1 $0.1 $0.0 $0.0McKenzie $18.2 $18.2 $11.6 $11.6McLean $4.0 $4.0 $2.9 $2.9Mercer $0.2 $0.2 $0.1 $0.1Mountrail $15.9 $15.9 $10.1 $10.1Renville $1.9 $1.9 $1.1 $1.1Slope $0.6 $0.6 $0.5 $0.5Stark $8.1 $8.1 $5.7 $5.7Ward $6.2 $6.2 $5.0 $5.0Williams $20.2 $20.2 $13.6 $13.6Total $114.9 $114.9 $76.3 $76.3
36

Key Factors: Paved Road AnalysisKey Factors: Paved Road Analysis
Thickness of aggregate base and asphalt surface layers
Condition (extent of deterioration) Graded width Soil support (spring load restrictions) Truck weights and axle configurations Volume of oil-related traffic and other
trucks37
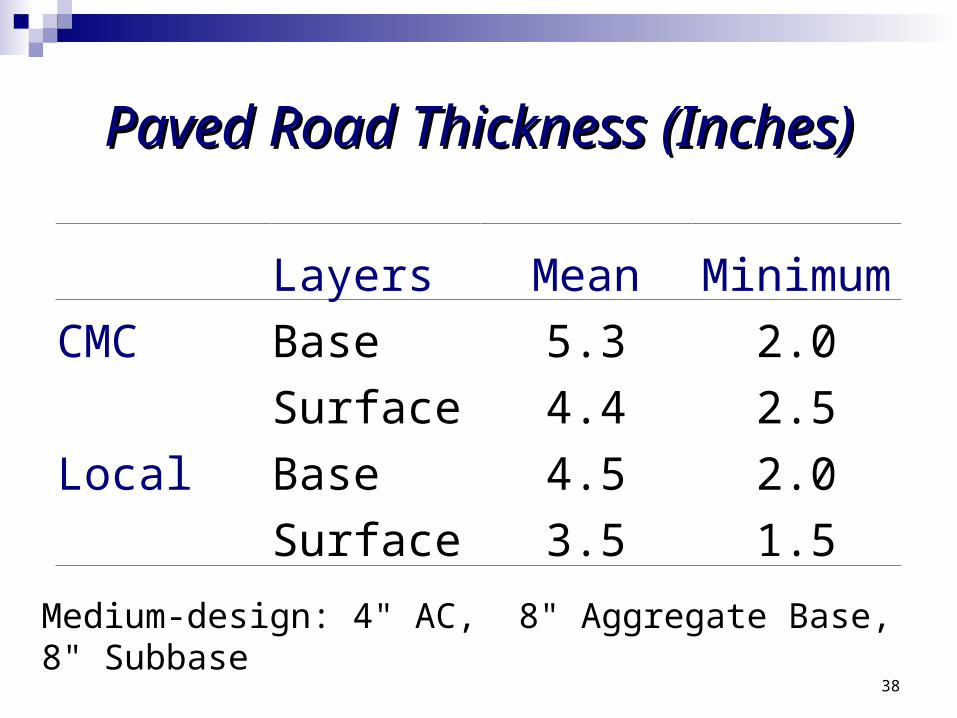
Paved Road Thickness (Inches)Paved Road Thickness (Inches)
38
Layers Mean Minimum
CMC Base 5.3 2.0
Surface 4.4 2.5
Local Base 4.5 2.0
Surface 3.5 1.5
Medium-design: 4" AC, 8" Aggregate Base, 8" Subbase
Paved Road ConditionsPaved Road Conditions
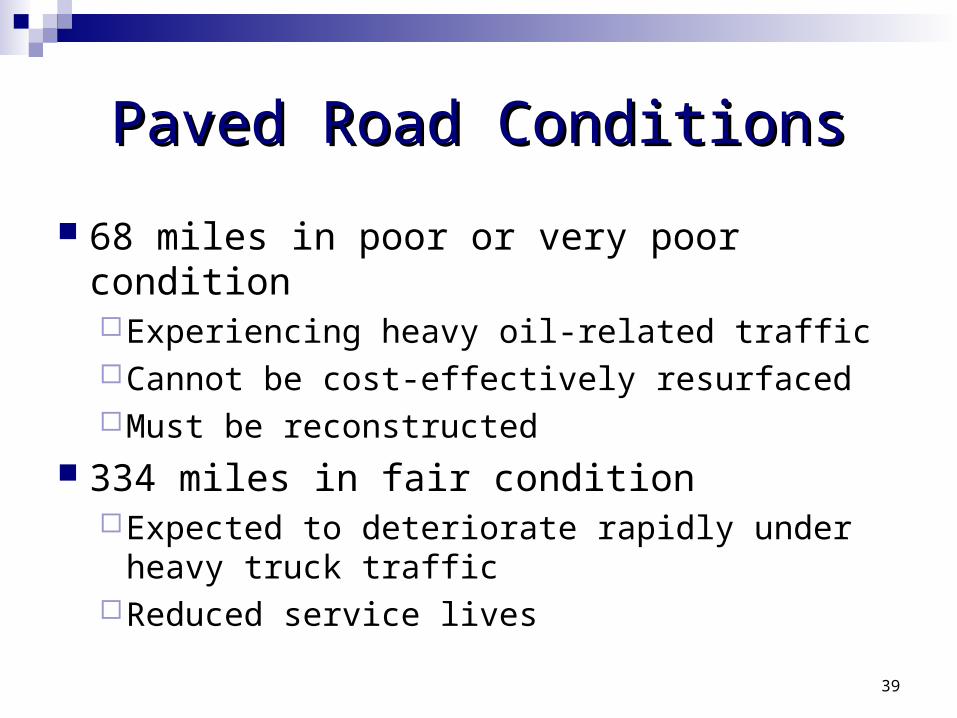
68 miles in poor or very poor conditionExperiencing heavy oil-related trafficCannot be cost-effectively resurfacedMust be reconstructed
334 miles in fair conditionExpected to deteriorate rapidly under heavy
truck trafficReduced service lives
39

Spring Load Restrictions Spring Load Restrictions
Relative damage from load may increase by 400%
> 80% of miles are subject to 6- or 7-ton load restrictions or 65,000-lb gross weightReduced payloads for trucks
Ideally, the most heavily traveled oil routes should be free from seasonal restrictions
Reconstruction only guaranteed solution40
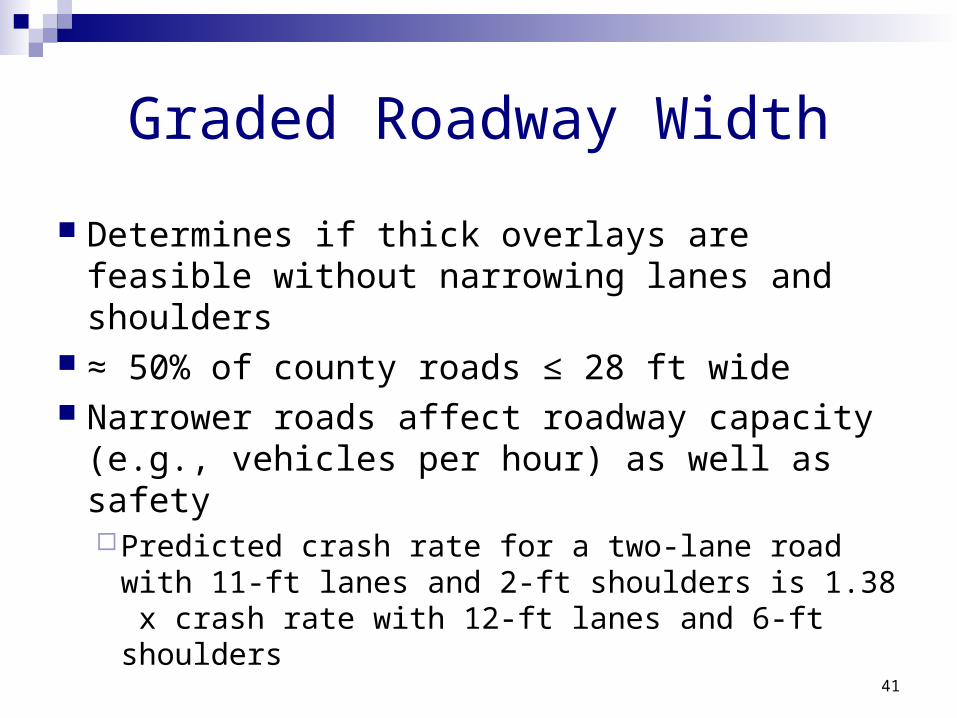
Graded Roadway Width
Determines if thick overlays are feasible without narrowing lanes and shoulders
≈ 50% of county roads ≤ 28 ft wide Narrower roads affect roadway capacity
(e.g., vehicles per hour) as well as safetyPredicted crash rate for a two-lane road with
11-ft lanes and 2-ft shoulders is 1.38 x crash rate with 12-ft lanes and 6-ft shoulders
41

Reduced Road Service LivesReduced Road Service Lives
Using AASHTO design equations, the service life of each impacted road is projected with and without oil traffic
The average reduction in life is five years Williams, McKenzie, and Mountrail
Counties have the most predicted miles with reduced service lives
42
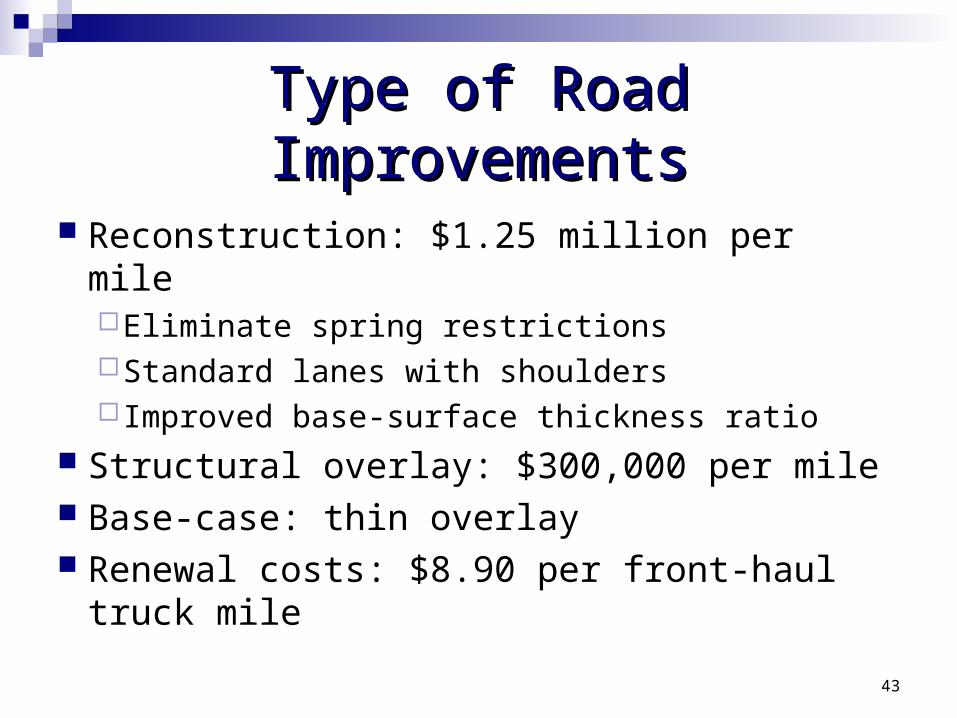
Type of Road ImprovementsType of Road Improvements
Reconstruction: $1.25 million per mileEliminate spring restrictionsStandard lanes with shoulders Improved base-surface thickness ratio
Structural overlay: $300,000 per mile Base-case: thin overlay Renewal costs: $8.90 per front-haul truck
mile43
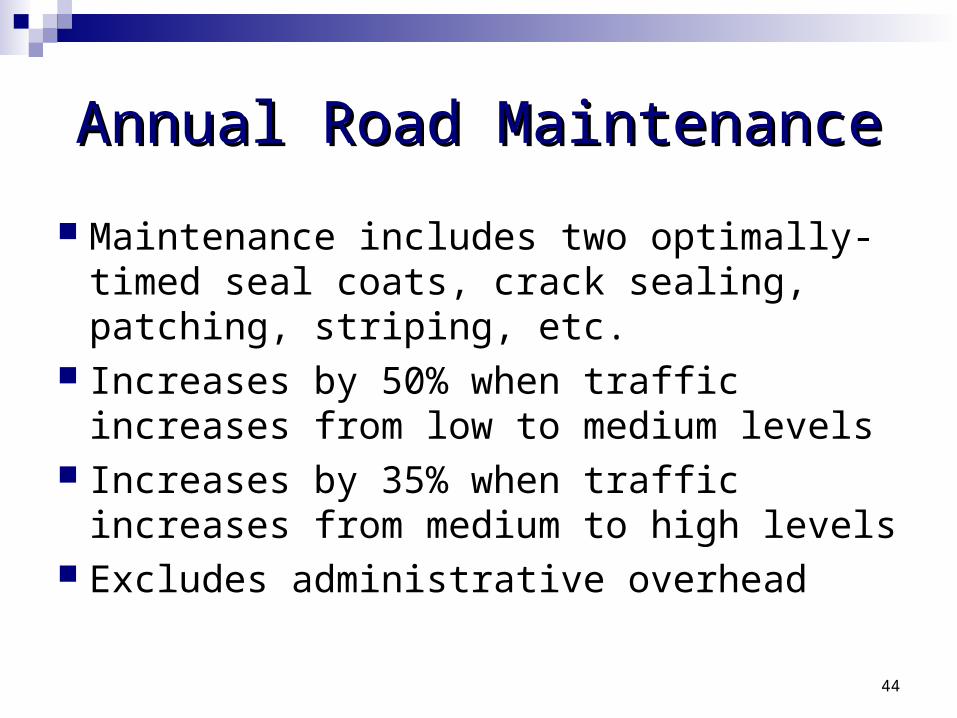
Annual Road MaintenanceAnnual Road Maintenance
Maintenance includes two optimally-timed seal coats, crack sealing, patching, striping, etc.
Increases by 50% when traffic increases from low to medium levels
Increases by 35% when traffic increases from medium to high levels
Excludes administrative overhead44
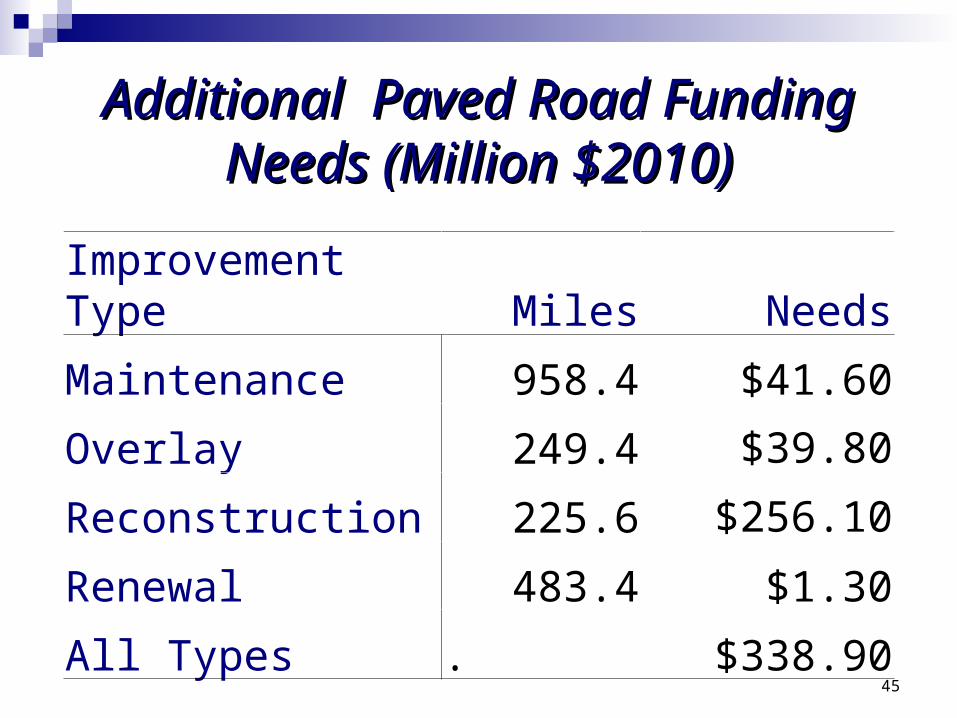
Additional Paved Road Funding Additional Paved Road Funding Needs (Million $2010)Needs (Million $2010)
45
Improvement Type Miles Needs
Maintenance 958.4 $41.60
Overlay 249.4 $39.80
Reconstruction 225.6 $256.10
Renewal 483.4 $1.30
All Types . $338.90

Estimated Investment NeedsEstimated Investment Needs2012-2013 -- 2030-2031 (Millions)2012-2013 -- 2030-2031 (Millions)
46
Unpaved Roads $567.00
Paved Roads $340.10
All Roads $907.10
3% Inflation $1,099.30
5% Inflation $1,266.57

Conclusion and DiscussionConclusion and Discussion
Estimates for oil-impacted roads only Needs in addition to other road needs Investments will provide improved service for
all road users; benefits include: Year-round legal loads on key paved roads Wider safer roads with more capacity Reduced transportation cost Lower life-cycle costs (incl. road user cost)
47


![Plains Talk - North Dakota...North Dakota History Article Available Online d Z µ u u î ì í ò ] µ } ( E } Z l } , ] } Ç ( µ v o } v](https://img.pdfslide.us/doc/110x75/5f0698717e708231d418c5e1/plains-talk-north-dakota-north-dakota-history-article-available-online-d-z.jpg)