Embed Size (px)
Citation preview

Additional Design Considerations
2013 PDCA Professor Driven Pile Institute
Patrick Hannigan
GRL Engineers, Inc.
Additional Design Considerations
• Time Effects
• Scour
• Densification
• Plugging
• Drivability
Time Effects on Pile Capacity
Time dependent changes in pile capacity
occur with time.
Soil Setup Relaxation
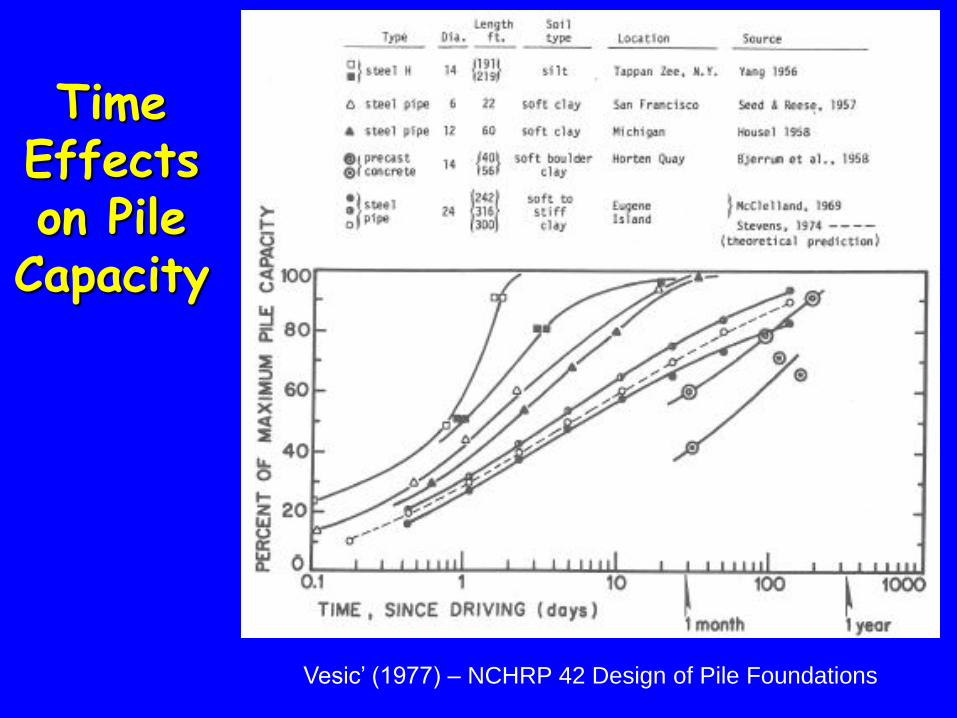
Vesic’ (1977) – NCHRP 42 Design of Pile Foundations
Time Effects on Pile
Capacity
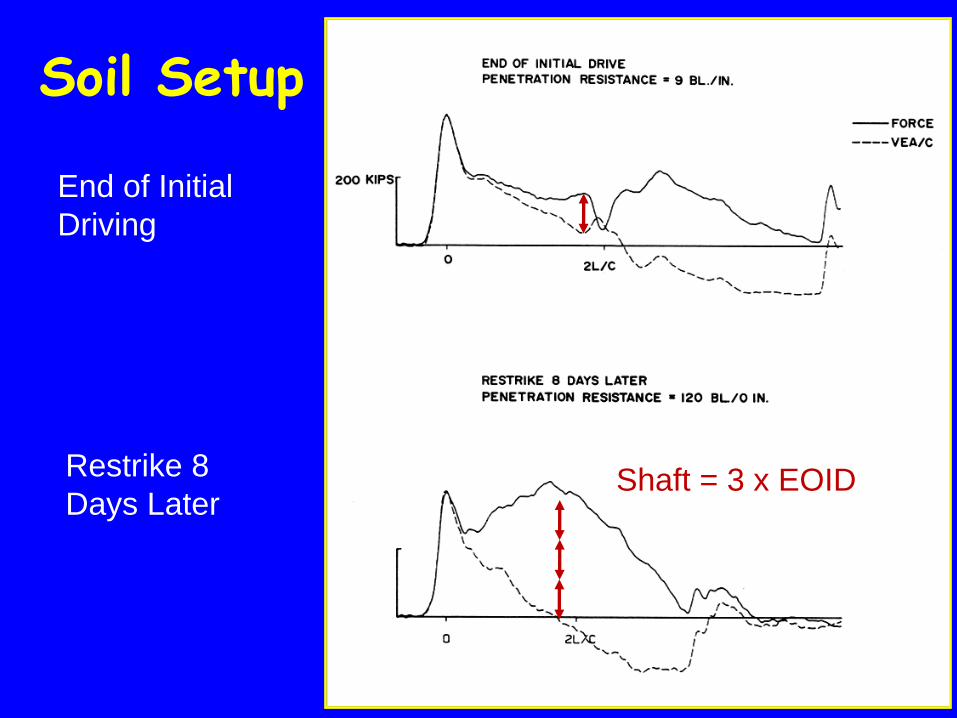
Soil Setup
End of Initial
Driving
Restrike 8
Days Later Shaft = 3 x EOID
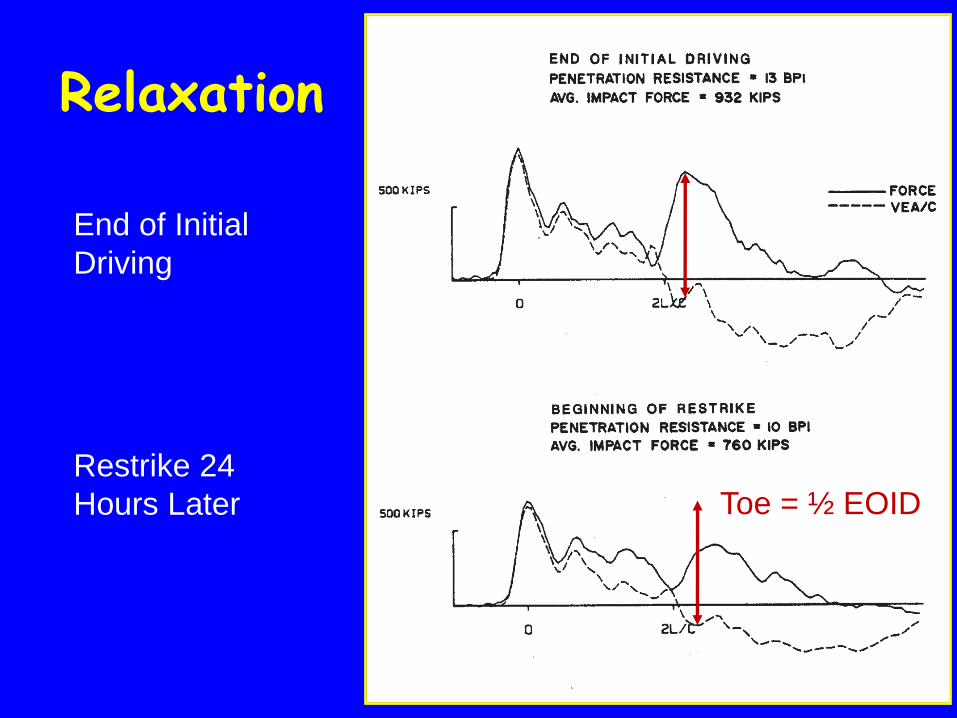
Relaxation
Restrike 24
Hours Later
End of Initial
Driving
Toe = ½ EOID
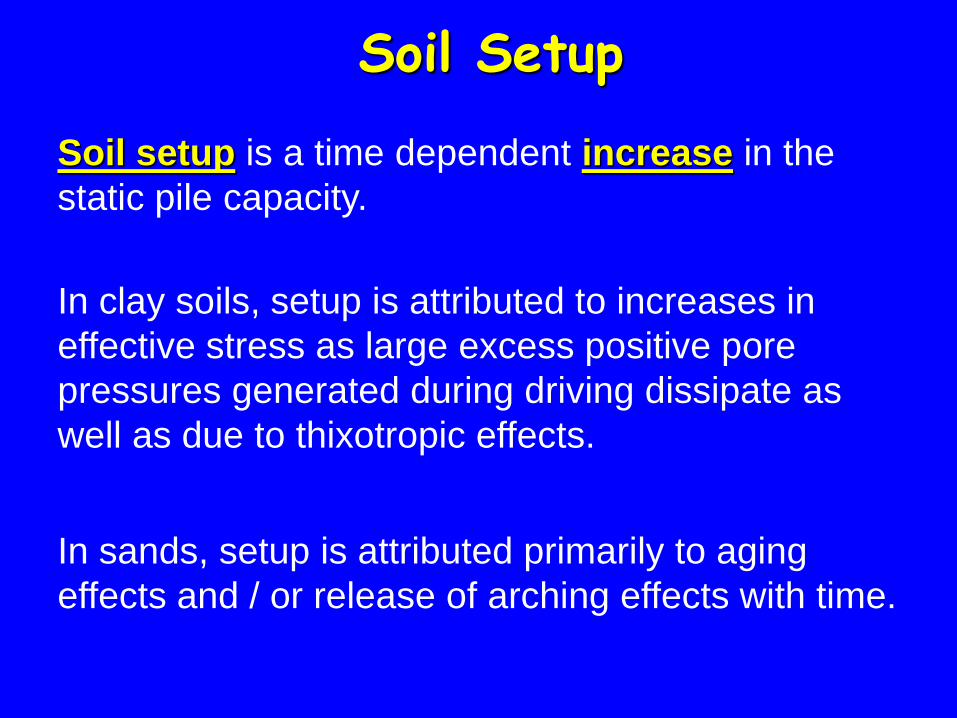
Soil setup is a time dependent increase in the
static pile capacity.
In clay soils, setup is attributed to increases in
effective stress as large excess positive pore
pressures generated during driving dissipate as
well as due to thixotropic effects.
Soil Setup
In sands, setup is attributed primarily to aging
effects and / or release of arching effects with time.
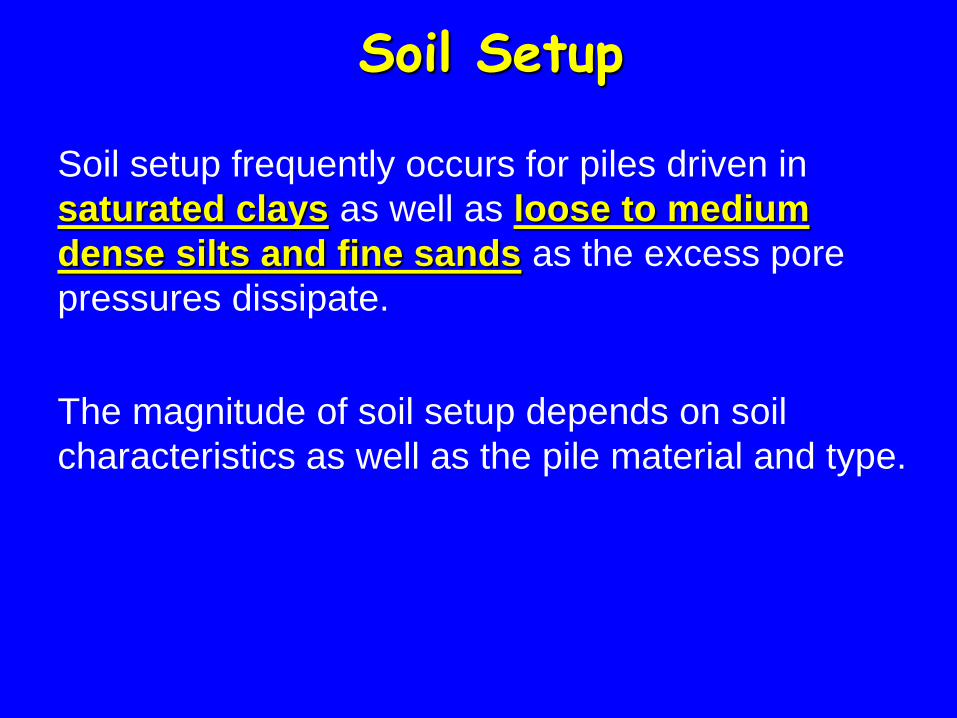
Soil setup frequently occurs for piles driven in
saturated clays as well as loose to medium
dense silts and fine sands as the excess pore
pressures dissipate.
The magnitude of soil setup depends on soil
characteristics as well as the pile material and type.
Soil Setup
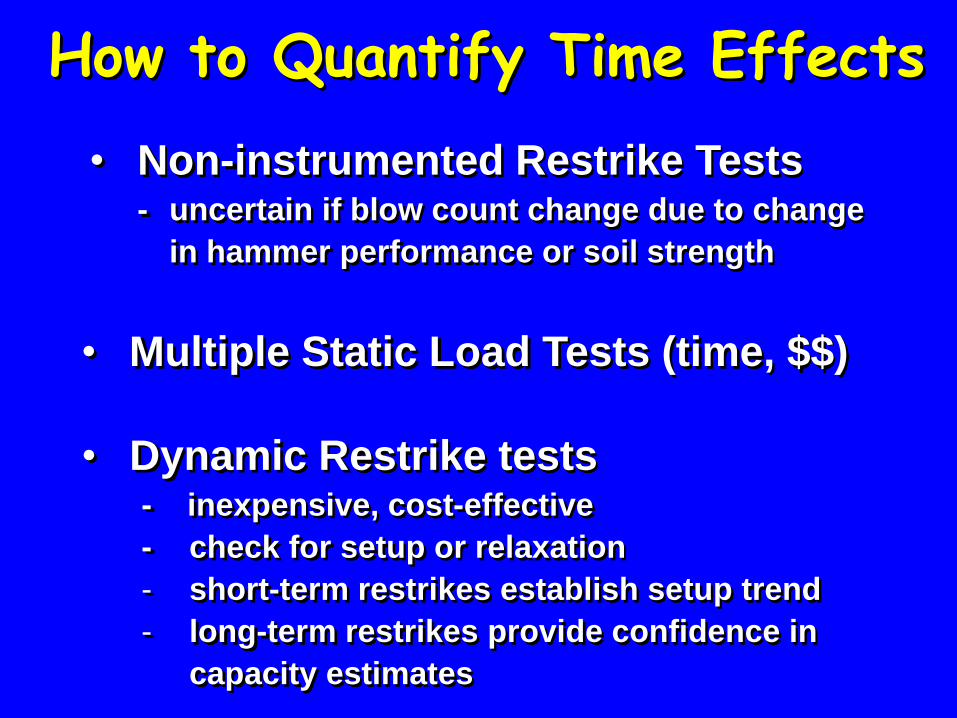
• Multiple Static Load Tests (time, $$)
How to Quantify Time Effects
• Dynamic Restrike tests - inexpensive, cost-effective
- check for setup or relaxation
- short-term restrikes establish setup trend
- long-term restrikes provide confidence in
capacity estimates
• Non-instrumented Restrike Tests - uncertain if blow count change due to change
in hammer performance or soil strength
1 d
ay
10 d
ays
100 d
ays
1000 d
ays
log time
pil
e c
ap
acit
y
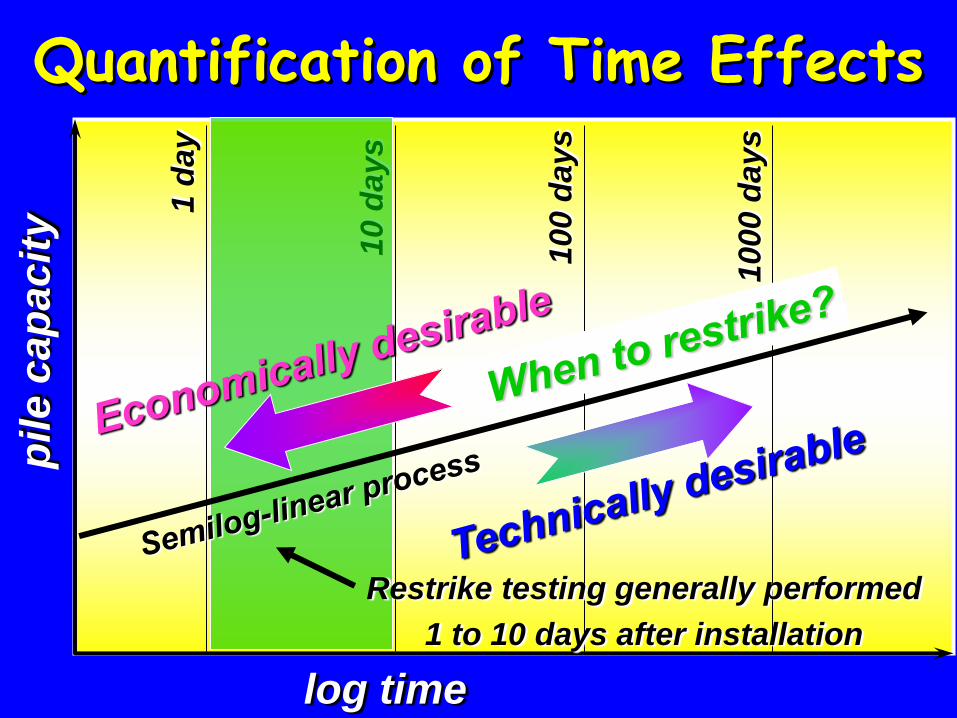
Restrike testing generally performed
1 to 10 days after installation
Quantification of Time Effects
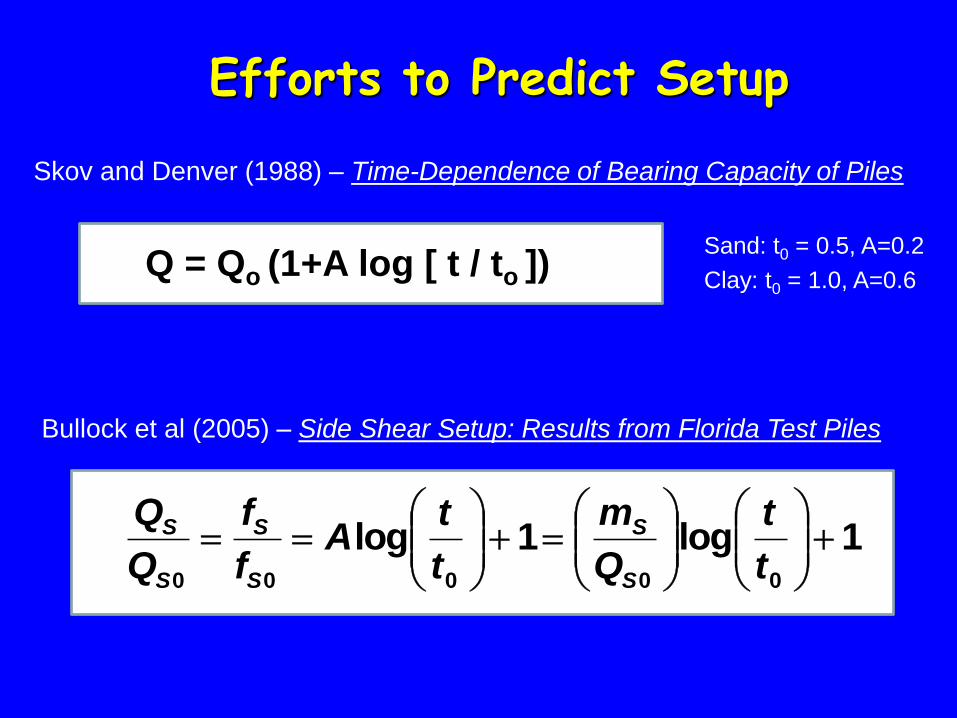
Efforts to Predict Setup
Bullock et al (2005) – Side Shear Setup: Results from Florida Test Piles
Skov and Denver (1988) – Time-Dependence of Bearing Capacity of Piles
1log1log00000
t
t
Q
m
t
tA
f
f
Q
Q
S
S
S
S
S
S
Q = Qo (1+A log [ t / to ]) Sand: t0 = 0.5, A=0.2
Clay: t0 = 1.0, A=0.6
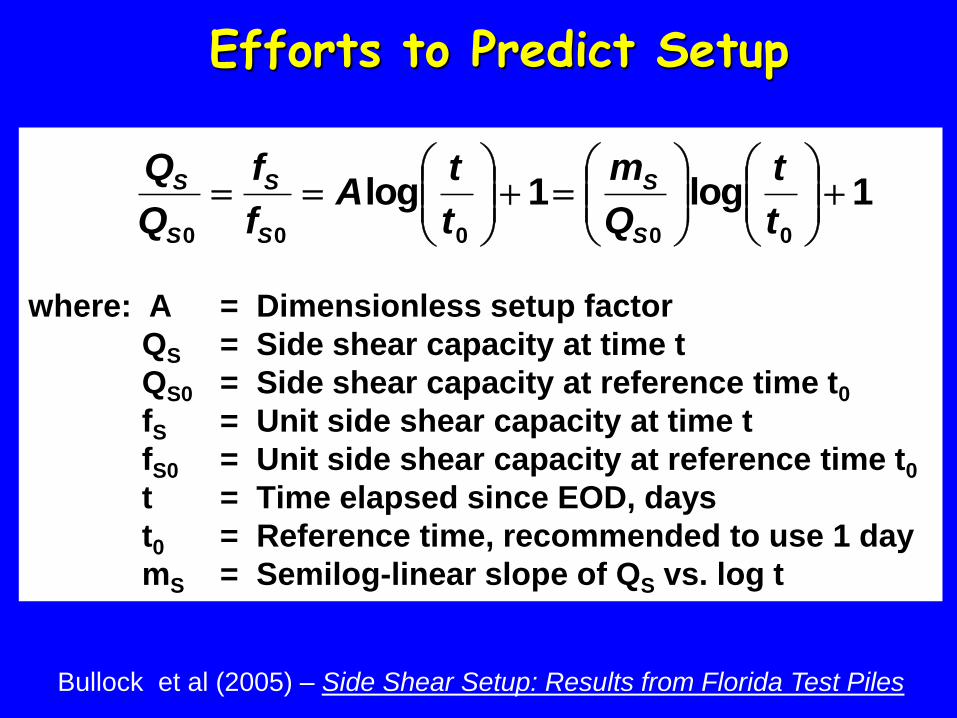
where: A = Dimensionless setup factor
QS = Side shear capacity at time t
QS0 = Side shear capacity at reference time t0
fS = Unit side shear capacity at time t
fS0 = Unit side shear capacity at reference time t0
t = Time elapsed since EOD, days
t0 = Reference time, recommended to use 1 day
mS = Semilog-linear slope of QS vs. log t
1log1log00000
t
t
Q
m
t
tA
f
f
Q
Q
S
S
S
S
S
S
Efforts to Predict Setup
Bullock et al (2005) – Side Shear Setup: Results from Florida Test Piles
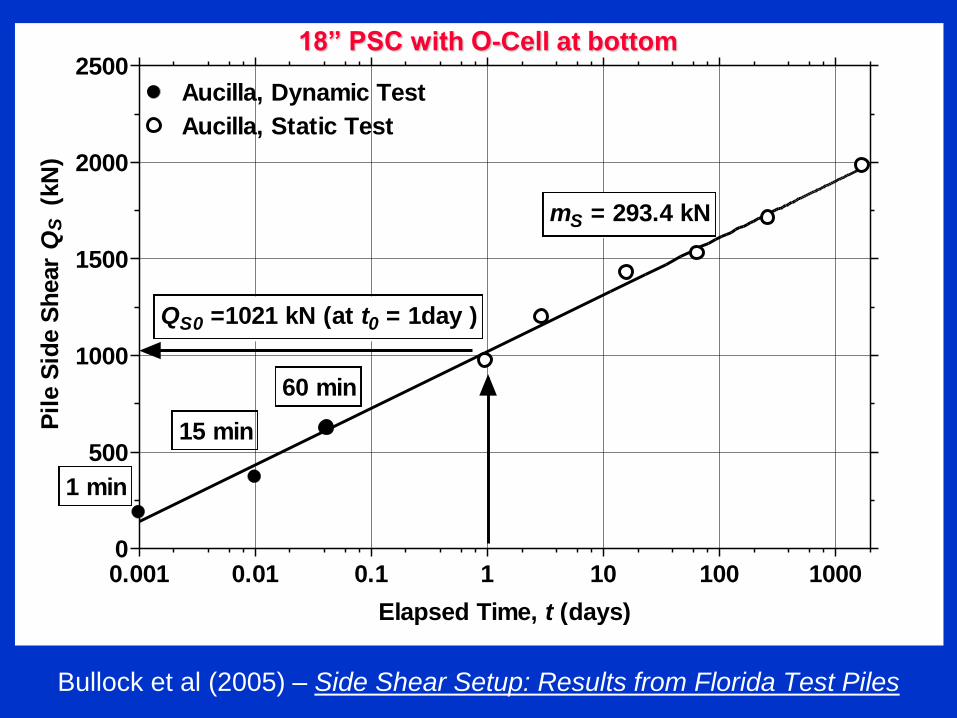
0.001 0.01 0.1 1 10 100 10000
500
1000
1500
2000
2500
Aucilla, Static Test
Aucilla, Dynamic Test
1 min
15 min
60 min
QS0 =1021 kN (at t0 = 1day )
mS = 293.4 kN
Elapsed Time, t (days)
Pil
e S
ide S
hear
QS
(kN
)18” PSC with O-Cell at bottom
Bullock et al (2005) – Side Shear Setup: Results from Florida Test Piles
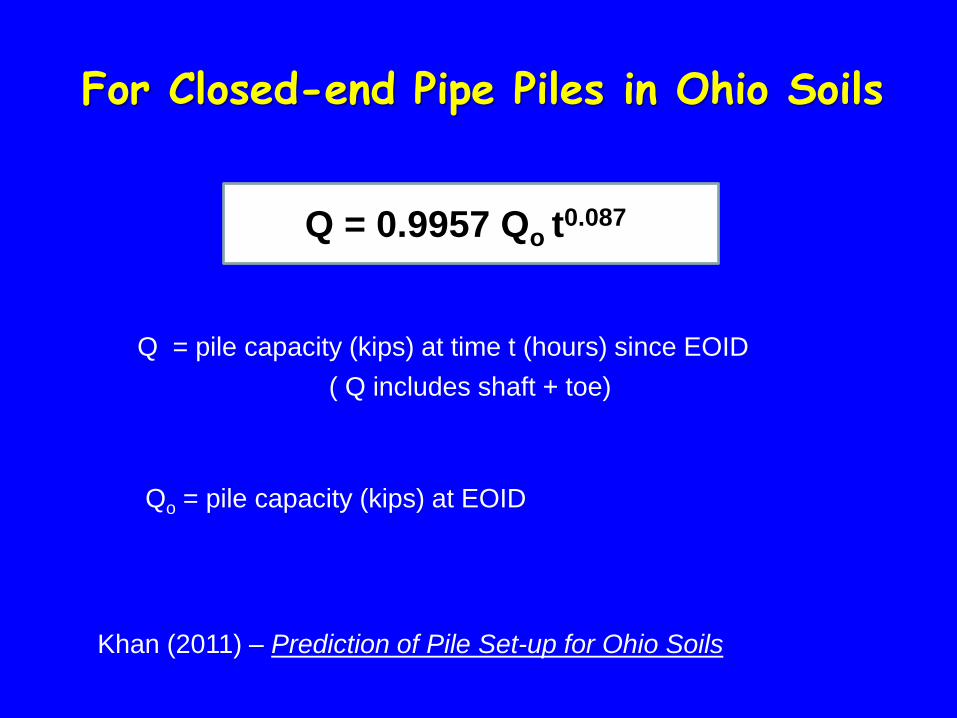
For Closed-end Pipe Piles in Ohio Soils
Q = pile capacity (kips) at time t (hours) since EOID
Qo = pile capacity (kips) at EOID
Khan (2011) – Prediction of Pile Set-up for Ohio Soils
( Q includes shaft + toe)
Q = 0.9957 Qo t0.087
5 80
-4000
0
4000
8000
ms
kN
9 L/c
Force Msd
Velocity Msd
5 80
-4000
0
4000
8000
ms
kN
9 L/c
Force Msd
Velocity Msd
5 80
-4000
0
4000
8000
ms
kN
9 L/c
Force Msd
Velocity Msd
5 102
-4000
0
4000
8000
ms
kN
9 L/c
Force Msd
Velocity Msd
5 102
-4000
0
4000
8000
ms
kN
9 L/c
Force Msd
Velocity Msd
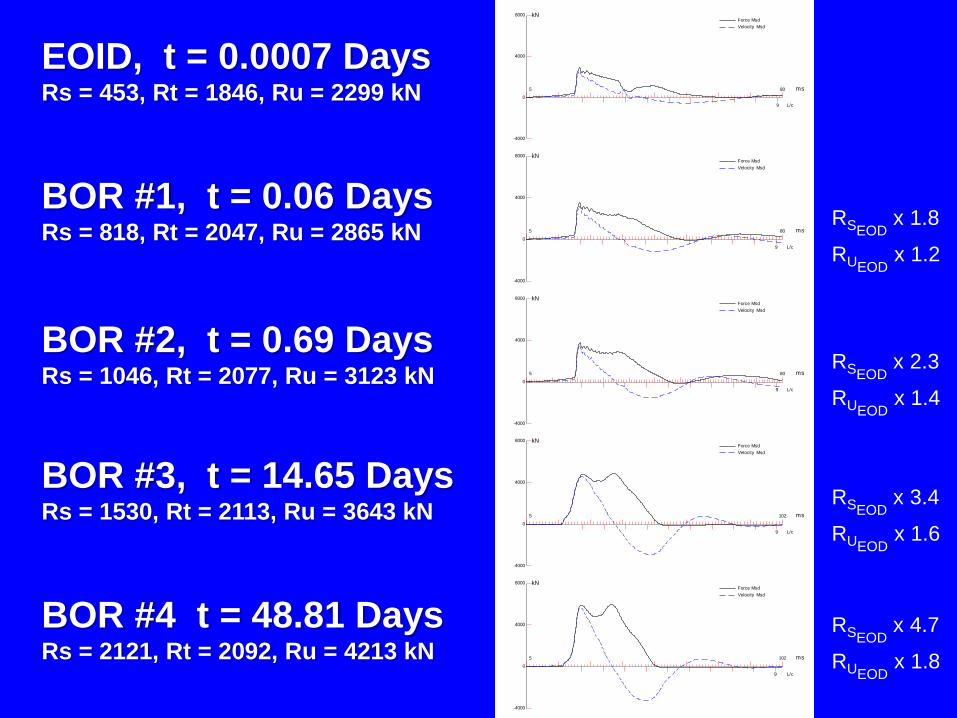
EOID, t = 0.0007 Days Rs = 453, Rt = 1846, Ru = 2299 kN
BOR #2, t = 0.69 Days Rs = 1046, Rt = 2077, Ru = 3123 kN
BOR #3, t = 14.65 Days Rs = 1530, Rt = 2113, Ru = 3643 kN
BOR #4 t = 48.81 Days Rs = 2121, Rt = 2092, Ru = 4213 kN
BOR #1, t = 0.06 Days Rs = 818, Rt = 2047, Ru = 2865 kN
RSEOD x 4.7
RUEOD x 1.8
RSEOD x 3.4
RUEOD x 1.6
RSEOD x 2.3
RUEOD x 1.4
RSEOD x 1.8
RUEOD x 1.2
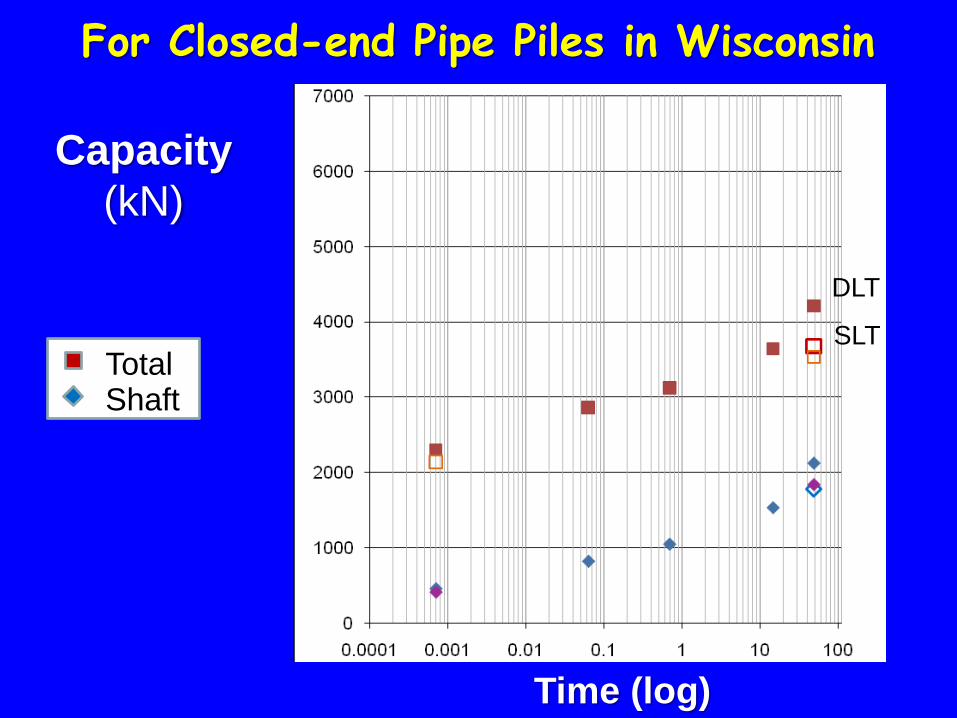
Time (log)
Capacity
(kN)
Total Shaft
SLT
DLT
For Closed-end Pipe Piles in Wisconsin
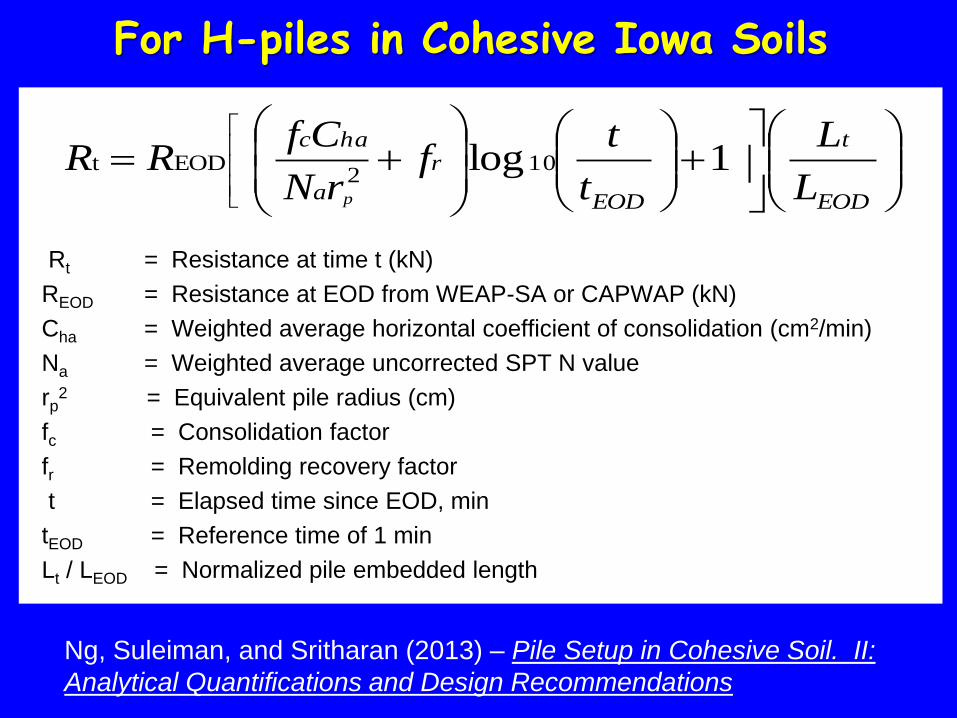
Ng, Suleiman, and Sritharan (2013) – Pile Setup in Cohesive Soil. II:
Analytical Quantifications and Design Recommendations
Rt = Resistance at time t (kN)
REOD = Resistance at EOD from WEAP-SA or CAPWAP (kN)
Cha = Weighted average horizontal coefficient of consolidation (cm2/min)
Na = Weighted average uncorrected SPT N value
rp2
= Equivalent pile radius (cm)
fc = Consolidation factor
fr = Remolding recovery factor
t = Elapsed time since EOD, min
tEOD = Reference time of 1 min
Lt / LEOD = Normalized pile embedded length
EOD
t
EOD
r
a
hac
L
L
t
tf
rN
CfRR
p
1log 102
EODt
For H-piles in Cohesive Iowa Soils
Soil Setup Factor
The soil setup factor is defined as failure load
determined from a static load test divided by the
ultimate capacity at the end of driving.
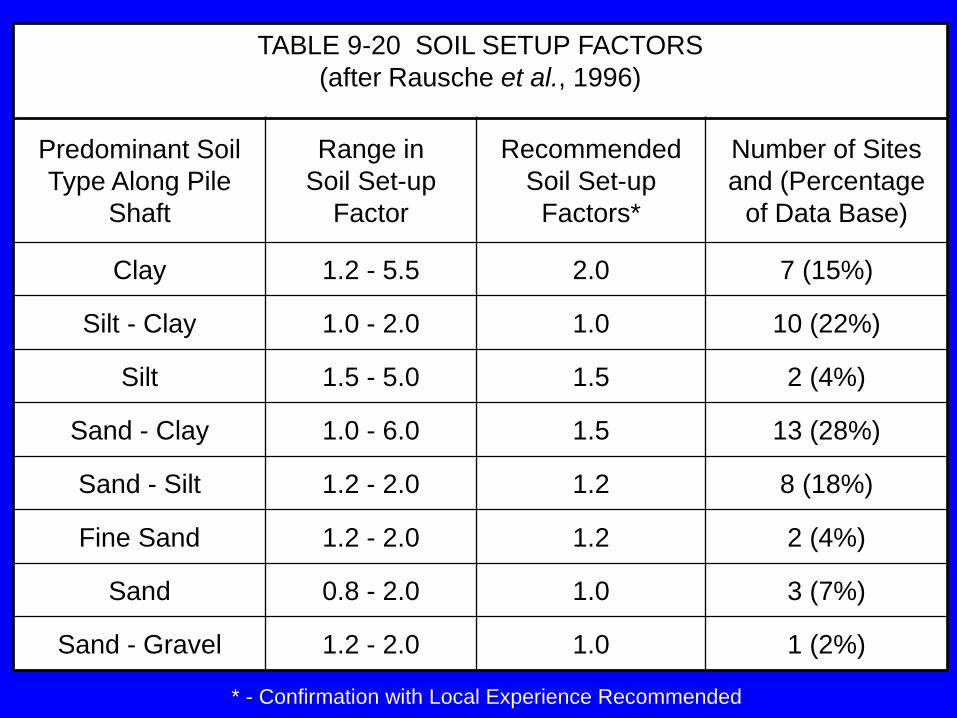
TABLE 9-20 SOIL SETUP FACTORS
(after Rausche et al., 1996)
Predominant Soil
Type Along Pile
Shaft
Range in
Soil Set-up
Factor
Recommended
Soil Set-up
Factors*
Number of Sites
and (Percentage
of Data Base)
Clay 1.2 - 5.5 2.0 7 (15%)
Silt - Clay 1.0 - 2.0 1.0 10 (22%)
Silt 1.5 - 5.0 1.5 2 (4%)
Sand - Clay 1.0 - 6.0 1.5 13 (28%)
Sand - Silt 1.2 - 2.0 1.2 8 (18%)
Fine Sand 1.2 - 2.0 1.2 2 (4%)
Sand 0.8 - 2.0 1.0 3 (7%)
Sand - Gravel 1.2 - 2.0 1.0 1 (2%)
* - Confirmation with Local Experience Recommended
Relaxation is a time dependent decrease in the
static pile capacity.
During pile driving, dense soils may dilate thereby
generating negative pore pressures and
temporarily higher soil resistance.
Relaxation has been observed for piles driven in
dense, saturated non-cohesive silts, fine sands,
and some shales.
Relaxation
The relaxation factor is defined as failure load
determined from a static load test divided by the
ultimate capacity at the end of driving.
Relaxation factors of 0.5 to 0.9 have been reported
in case histories of piles in shales.
Relaxation factors of 0.5 and 0.8 have been
observed in dense sands and extremely dense
silts, respectively.
Relaxation Factor
Time Effects on Pile Drivability and Pile Capacity
Time dependent soil strength changes should
be considered during the design stage.
• SPT – torque and vane shear tests
• CPTu with dissipation tests
• Model piles
• Soil setup / relaxation factors
Tools that have been used include:
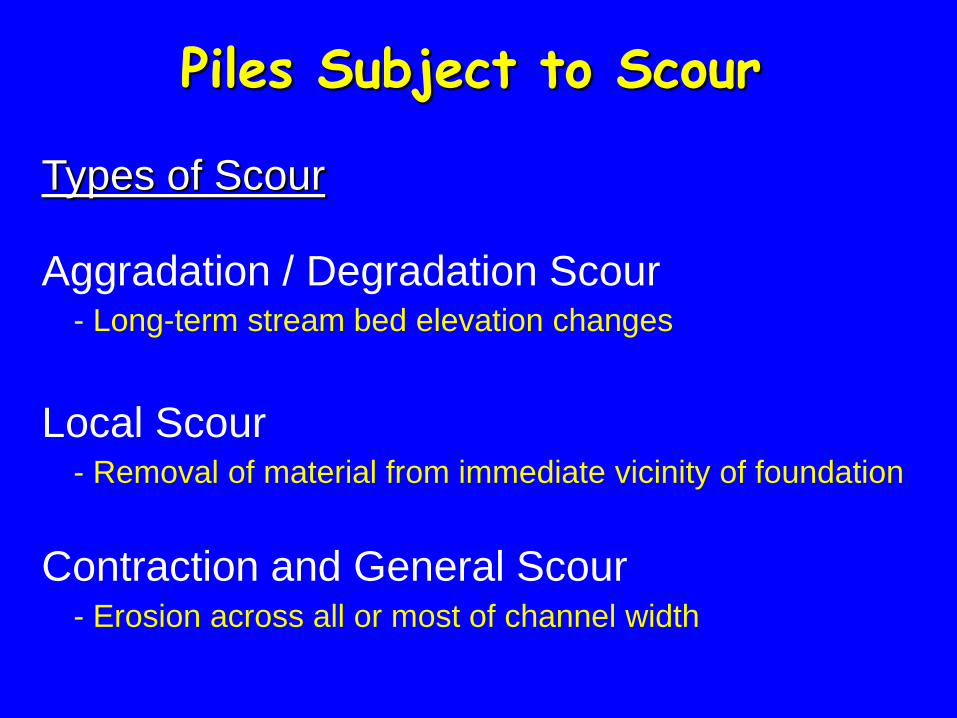
Piles Subject to Scour
Aggradation / Degradation Scour
Types of Scour
Local Scour
Contraction and General Scour
- Long-term stream bed elevation changes
- Removal of material from immediate vicinity of foundation
- Erosion across all or most of channel width
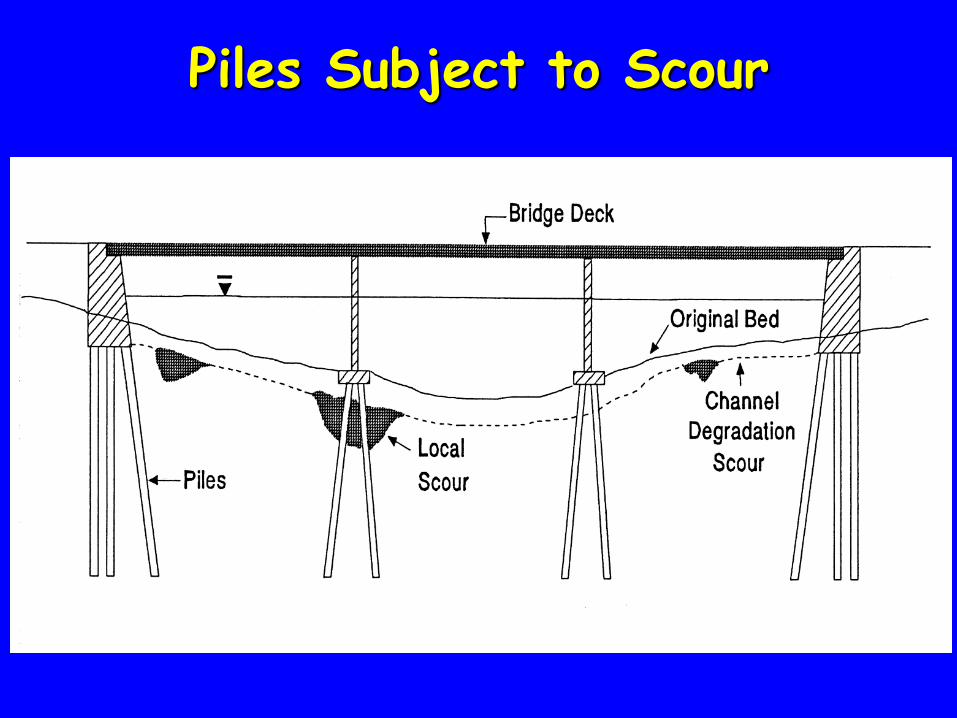
Piles Subject to Scour
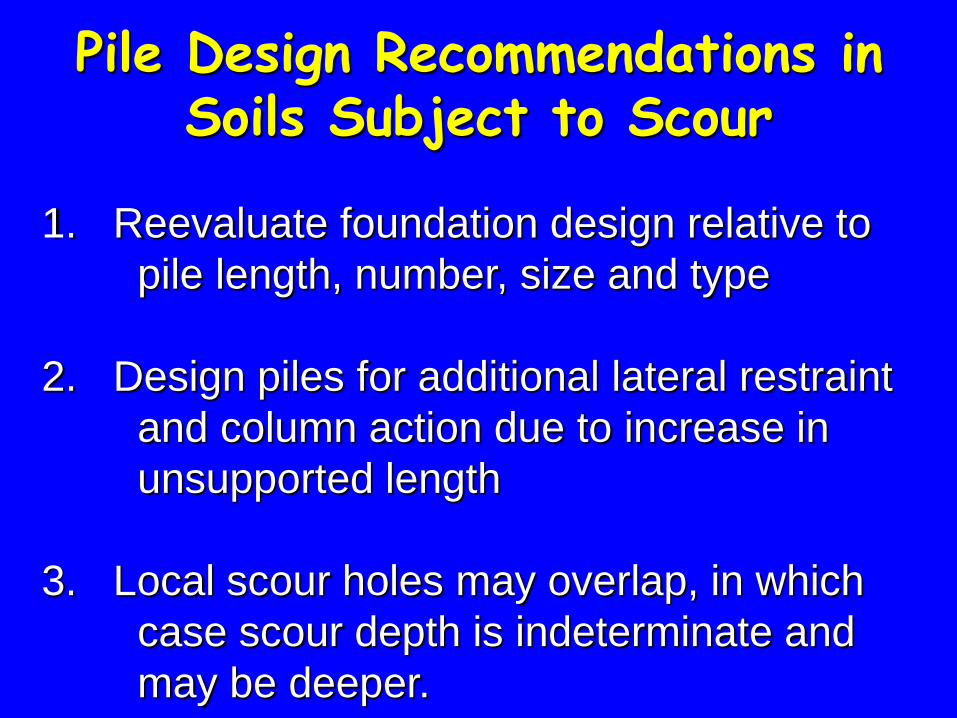
Pile Design Recommendations in Soils Subject to Scour
1. Reevaluate foundation design relative to
pile length, number, size and type
2. Design piles for additional lateral restraint
and column action due to increase in
unsupported length
3. Local scour holes may overlap, in which
case scour depth is indeterminate and
may be deeper.

Pile Design Recommendations in Soils Subject to Scour
4. Perform design assuming all material above
scour line has been removed.
5. Place top of footing or cap below long-term
scour depth to minimize flood flow
obstruction.
6. Piles supporting stub abutments in
embankments should be driven below the
thalweg elevation.
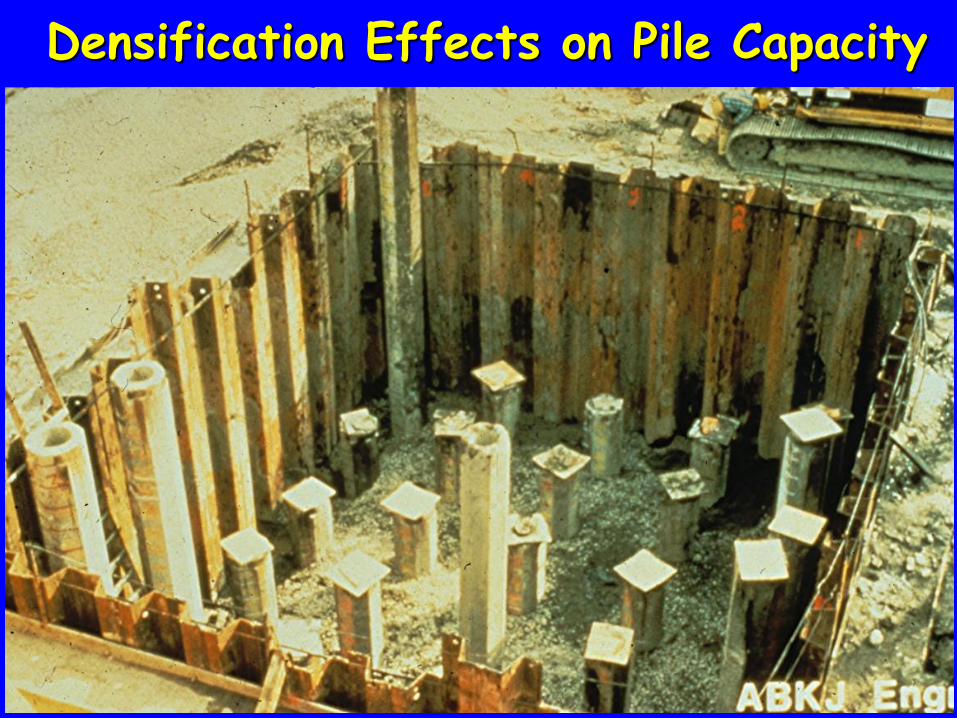
Densification Effects on Pile Capacity
Densification Effects on Pile Capacity
Densification can result in the pile capacity as
well as the pile penetration resistance to
driving being significantly greater than that
calculated for a single pile.
Added confinement from cofferdams or the
sequence of pile installation can further
aggravate a densification problem.

Densification Effects on Pile Capacity
Potential densification effects should be
considered in the design stage. Studies
indicate an increase in soil friction angle of up
to 4˚ would not be uncommon for piles in loose
to medium dense sands.
A lesser increase in friction angle would be
expected in dense sands or cohesionless soils
with a significant fine content.
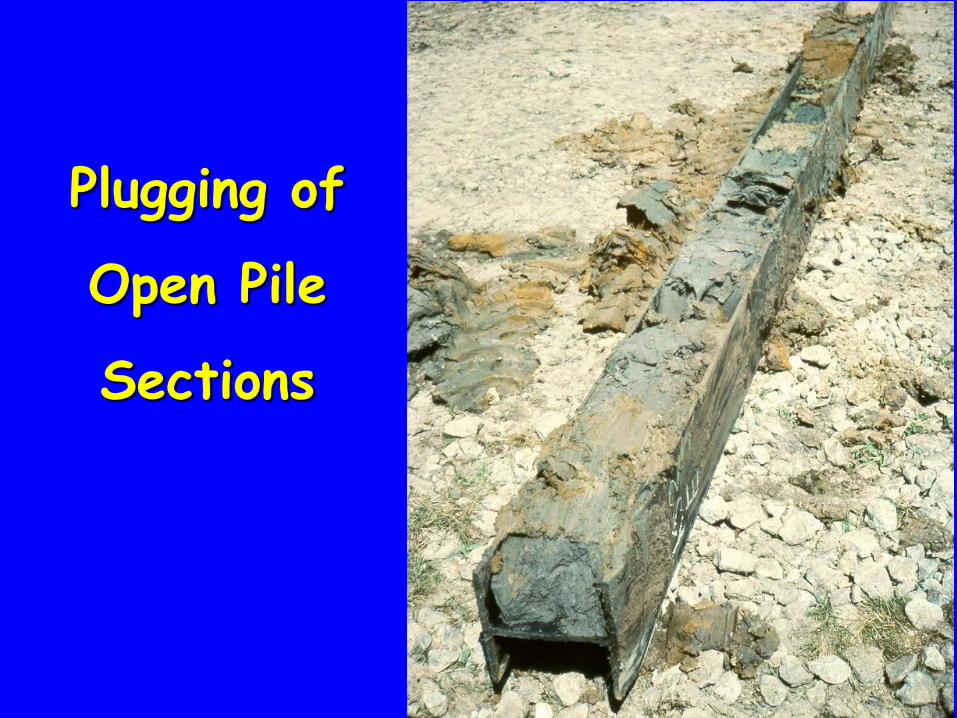
Plugging of
Open Pile
Sections

Plugging of Open Pile Sections
Open end sections include open end pipe
piles and H-piles.
It is generally desired that the open sections
remain unplugged during driving and behave
plugged under static loading conditions.
Why ?
Plugging of Open Pile Sections
Factors influencing plug development include
hammer size and penetration to pile
diameter ratio (D/b)
Plugging of Open Pile Sections
During driving:
Large hammer plug slippage
Small hammer plug formation
Therefore size pile for larger hammer.
See Reference Manual Page 9-185
Plugging of Open Pile Sections
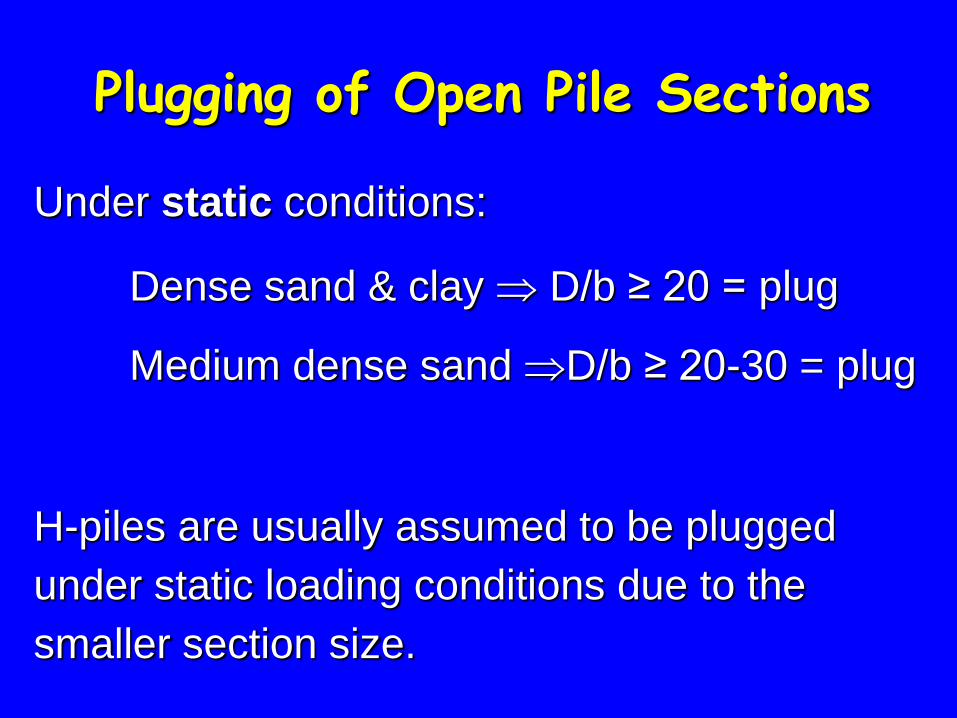
Under static conditions:
Dense sand & clay D/b ≥ 20 = plug
Medium dense sand D/b ≥ 20-30 = plug
H-piles are usually assumed to be plugged
under static loading conditions due to the
smaller section size.
PILE DRIVABILITY

PILE DRIVABILITY
Pile drivability refers to the ability of a pile to be
driven to the desired depth and / or capacity at
a reasonable driving resistance without
exceeding the material driving stress limits.
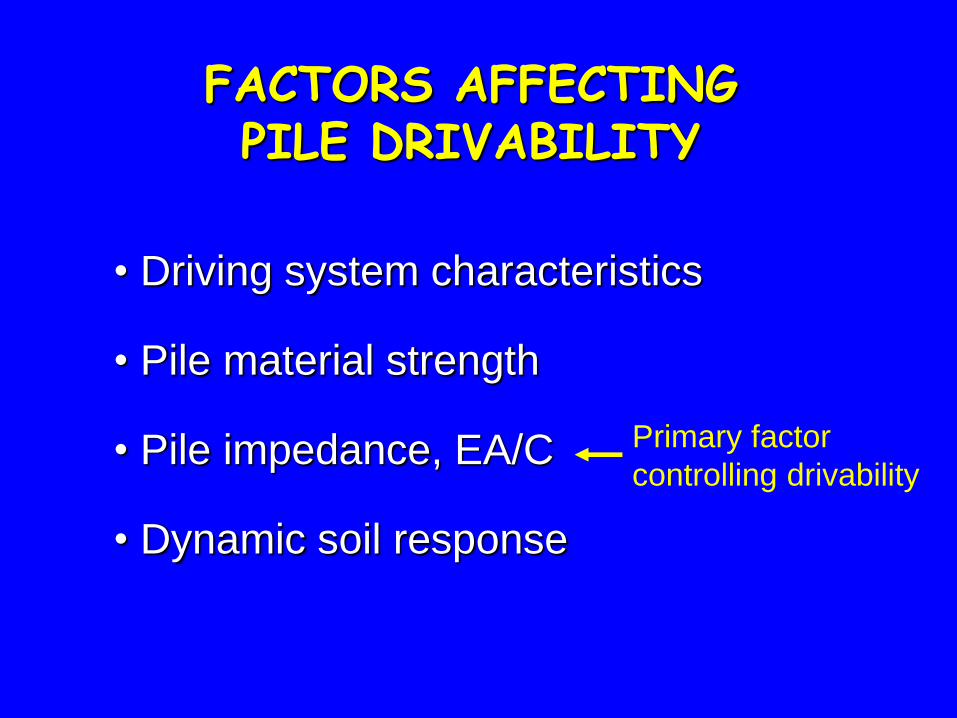
FACTORS AFFECTING PILE DRIVABILITY
• Driving system characteristics
• Pile material strength
• Pile impedance, EA/C
• Dynamic soil response
Primary factor
controlling drivability

PILE DRIVABILITY
Pile drivability should be checked during the
design stage for all driven piles.
Pile drivability is particularly critical for closed end
pipe piles.

PILE DRIVABILITY EVALUATION DURING DESIGN STAGE
1. Wave Equation Analysis
Computer analysis that does not require a pile to be driven.
2. Dynamic Testing and Analysis
Requires a pile to be driven and dynamically tested.
3. Static Load Tests
Requires a pile to be driven and statically load tested.
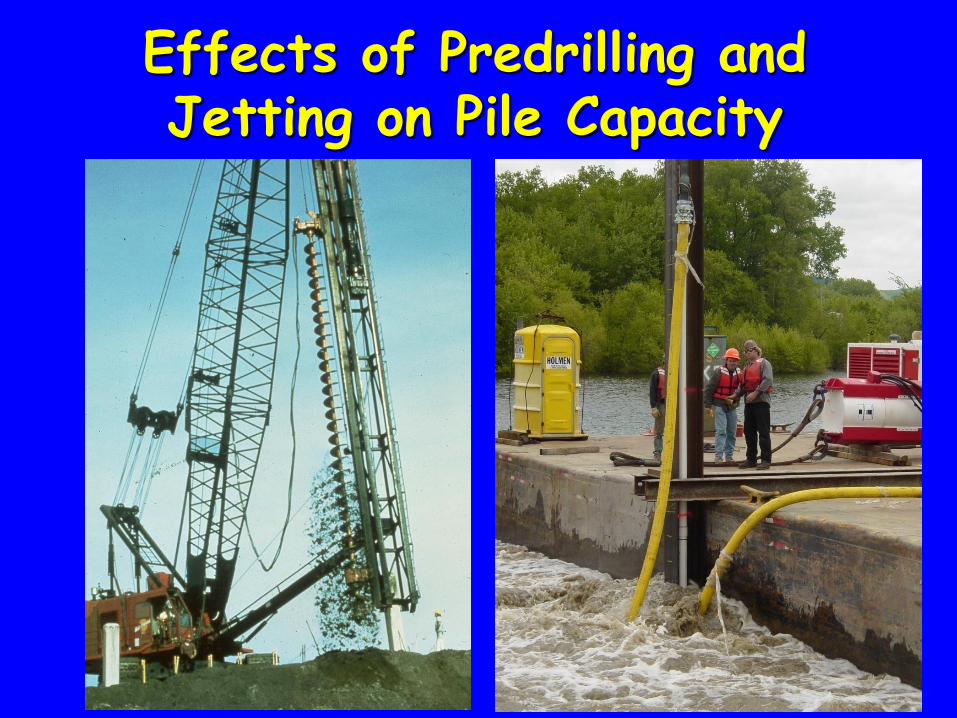
Effects of Predrilling and Jetting on Pile Capacity
Effects of Predrilling and Jetting on Pile Capacity
Predrilling in cohesive soils and jetting in
cohesionless soils are sometimes used to
achieve minimum penetration requirements.
Both predrilling and jetting will effect the axial,
lateral, and uplift capacity that can be
developed.
Effects of Predrilling and Jetting on Pile Capacity
Depending upon the predrilled hole diameter,
the shaft resistance in the predrilled zone
may be reduced to between 50 and 85% of
the shaft resistance without predrilling.
In jetted zones, shaft resistance reductions of
up to 50% have been reported.

Effects of Predrilling and Jetting on Pile Capacity
It is important that the effect of predrilling or
jetting be evaluated by design personnel
whenever it is proposed.

Questions ? ? ?


![Vector Quantization (LBG Algorithm) filelog 5 = 0,698 log 7 = 0,845 5 [TTG4J3] Koding dan Kompresi Pengantar Teori Informasi Dikembangkan oleh Elwood Shannon, electrical engineer di](https://img.pdfslide.us/doc/110x75/5d4e654a88c993d15f8b85ca/vector-quantization-lbg-algorithm-5-0698-log-7-0845-5-ttg4j3-koding-dan.jpg)