Embed Size (px)
Citation preview
This article was downloaded by: [Moskow State Univ Bibliote]On: 16 September 2013, At: 13:44Publisher: Taylor & FrancisInforma Ltd Registered in England and Wales Registered Number: 1072954Registered office: Mortimer House, 37-41 Mortimer Street, London W1T 3JH,UK
Journal of Applied AnimalResearchPublication details, including instructions forauthors and subscription information:http://www.tandfonline.com/loi/taar20
Addition of Condensed TanninSources to Broiler Litter BeforeDeep-StackingZ. S. Wang a , A. L. Goetsch b , K. K. Park a , A. R.Patil a , B. Kouakou a , D. L. Galloway Sr. a & J. E.Rossi aa Department of Animal Science, University ofArkansas, Fayetteville, AR, 72701, USAb South Central Family Farm Research Centre,USDA-ARS, 6883 So. St. Hwy 23, Booneville, AR,72927-9214, USAPublished online: 11 Nov 2011.
To cite this article: Z. S. Wang , A. L. Goetsch , K. K. Park , A. R. Patil , B. Kouakou ,D. L. Galloway Sr. & J. E. Rossi (1996) Addition of Condensed Tannin Sources to BroilerLitter Before Deep-Stacking, Journal of Applied Animal Research, 10:1, 59-79, DOI:10.1080/09712119.1996.9706131
To link to this article: http://dx.doi.org/10.1080/09712119.1996.9706131
PLEASE SCROLL DOWN FOR ARTICLE
Taylor & Francis makes every effort to ensure the accuracy of all theinformation (the “Content”) contained in the publications on our platform.However, Taylor & Francis, our agents, and our licensors make norepresentations or warranties whatsoever as to the accuracy, completeness,or suitability for any purpose of the Content. Any opinions and viewsexpressed in this publication are the opinions and views of the authors, andare not the views of or endorsed by Taylor & Francis. The accuracy of theContent should not be relied upon and should be independently verified with

primary sources of information. Taylor and Francis shall not be liable for anylosses, actions, claims, proceedings, demands, costs, expenses, damages,and other liabilities whatsoever or howsoever caused arising directly orindirectly in connection with, in relation to or arising out of the use of theContent.
This article may be used for research, teaching, and private study purposes.Any substantial or systematic reproduction, redistribution, reselling, loan,sub-licensing, systematic supply, or distribution in any form to anyone isexpressly forbidden. Terms & Conditions of access and use can be found athttp://www.tandfonline.com/page/terms-and-conditions
Dow
nloa
ded
by [
Mos
kow
Sta
te U
niv
Bib
liote
] at
13:
44 1
6 Se
ptem
ber
2013
J. Appl. Anim. Res. 10 (1996) : 59-79
Addition of Condensed Tannin Sources to Broiler Litter Before Deep-Stacking132,3
Z.S. Wang, A.L. Goetsch4, K.K. Park, A.R. Patil, B. Kouakou, D.L. Galloway, Sr., J.E. Rossi
Department of Animal Science, University of Arkansas, Fayetteville,
AR 72701, USA and
South Central Family Farm Research Centre USDA-ARS, 6883 So. St. Hwy 23, Booneville,
4
AR 72927-9214, USA
(Received February 22, 1996; accepted May 25, 1996)
Abstract Wang, Z.S., Goetsch, A.L., Park, KK, Patil, A.R., Kouakou, B., Galloway, D.L., Sr. and Rossi, J.E. 1996. Addition of condensed tannin sources to broiler litter before deep-stacking. J. Appl. Anim. Res., 10: 59-79.
Different sources and levels of condensed tannins were thoroughly mixed (M) or covered (C) with broiler litter in plastic vessels fitted with a dacron top. Containers were placed in a deep-stack for 3 or
'Published with the approval of the' Director of the Arkansas Agricultural Experiment Station, Manuscript Number 96009. 'Appreciation is expressed to the NRI Competitive Grants ProgramRTSDA (Award Number 93-37500-9152) for partial financial support, and to Jim Hornsey (Planters-Lifesavers, Fort Smith, AR), Northrup King (New Deal, TX), Tannin Corp. (Peabody, MA) and Larry Morrison (Monett, MO) for providing materials. 3Mention of a trademark or proprietary product in this paper does not constitute a guarantee or warranty of the product by the USDA or the ARS and does not imply its approval to the exclusion of other products that may be suitable. 4 F ~ r reprint requests-Phone : 501/675-3834; Fax : 501/675-2940.
59
J. Appl. Anim. Res. 0971-2119/96/$05.00 8 GSP, India
Dow
nloa
ded
by [
Mos
kow
Sta
te U
niv
Bib
liote
] at
13:
44 1
6 Se
ptem
ber
2013
60 Z.S. Wang and coworkers
9 wk to determine effects on constituent concentrations, recoveries and in aitu ruminal disappearances. Added substrates were commercial vegetable extract WE; quebrach), peanut skins (PS), bird-resistant sorghum grain (BS) and regular sorghum grain (S), with condensed tannin (catechin equivalents) concentrations of 68.4, 24.7, 0.6 and O.O%, respectively. Levels (total dry matter basis) were 0, 0.04, 0.09, 0.17, 0.35, 1.3, 2.6, 5.1 and 10.3% VE; 0, 3.6, 7.1, 14.2 and 28.4% PS; and 0, 5, 10, 20 and 40% BS and S. Condensed tannin recovery for VE [DO, 113, 105, 98, 63, 27, 18, 12 and 10% for M and 125, 118, 107, 84, 59, 37, 23, 20 and 23% for C at 3 wk (SE 2.8); 87, 74, 66, 61, 44, 22, 16, 9 and 11% at 9 wk (SE 3.3) with 0, 0.04, 0.09, 0.17, 0.35, 1.3, 2.6, 5.1 and 10.3% VE, respectively], PS [139, 29, 18, 14 and 20% for M and 126, 37, 27, 25 and 46% for C at 3 wk (SE 4.9); 52, 21, 12, 9 and 6% for M and 91, 23, 14, 10 and 17% for C at 9 wk (SE 4.9) with 0, 3.5, 7.1, 14.2 and 28.4% PS,respectively] and BS 1135, 99, 109, 75 and 50% at 3 wk and 97, 88, 88, 68 and 48% at 9 wk (SE 5.1) with 0, 5, 10, 20 and 40% BS, respectively] generally was less for 9 us 3 wk of deep-stacking and decreased with increasing level of condensed tannin source. Addition of condensed tannin sources did not markedly alter concentrations of nitrogen fractions, recoveries of organic matter or nitrogen or in situ dry matter or nitrogen disappearances. In conclusion, addition of condensed tannin sources to broiler litter before deep-stacking decreased recovery of assayable condensed tannins, with effects varying with level and method of addition.
Key words : Broiler litter, condensed tannins, deep-stack, peanut skins, sorghum grain.
Introduction Tannins are high molecular weight polyphenolic compounds of plant origin classified as hydrolyzable (polymers of gallic acid and various sugars) or condensed (polymers of flavenoid phenols; Kumar and Singh, 1984). A variety of feedstuffs contain condensed tannins, the nature of which varies considerably among feedstuffs (Kumar and Singh, 1984; Robbins et al., 1987; Jansman, 1993; Reed, 1995). Examples of feedstuffs high in condensed tannins include some vegetables (Jansman, 1993), peanut skins (Hale and McCormick, 1981; McBrayer et al., 1983) and bird-resistant sorghum grain (Mitaru et al., 1984). Typically, only limited amounts of feedstuffs high in condensed tannins are consumed by ruminants because
Dow
nloa
ded
by [
Mos
kow
Sta
te U
niv
Bib
liote
] at
13:
44 1
6 Se
ptem
ber
2013
Condensed tannins and broiler litter 61
of protein binding and precipitation, which interefere with digestion and (or) impair palatability (Kumar and Vaithiyanathan, 1990; Jansman, 1993; Reed, 1995). Therefore, inexpensive means to avert or lessen adverse effects of condensed tannins on ruminant digestion and feed intake are of interest.
Broiler litter is abundant and relatively inexpensive in many parts of the world. Frequently broiler litter is processed for feeding to ruminants by a method known as deep-stacking. Conditions in broiler litter deep-stacks include 20 to 30% moisture, a pH of 7 to 9 and temperature of 40 to 60C (Ruffin and McCaskey, 1990). Ammonia in broiler litter is approximately 14% of total nitrogen; uric acid initially contributes a greater proportion of total nitrogen (e.g., 30%; Fontenot and Jurubescu, 1980), although its concentration declines with conversion to urea and ammonia (Oltjen and Dinius, 1976).
Various treatments of high-tannin sorghum grain decrease assayable condensed tannin concentration, increasing nutritional value and lessening or eliminating feeding limits, although exact modes of action are unclear (Reichert et al., 1980). Ammonia reacts with condensed tannins, involving binding or chemical changes of functional groups necessary for protein binding (Price et al., 1978a). However, Price et al. (1979) concluded that moist alkaline conditions, rather than an effect of ammonia per se, were responsible for decreases in assayable condensed tannins and increased feeding value. Effectiveness of such treatments appears enhanced by increased temperature (e.g., 60 us 25C; Russell and Lolley, 1989) and moisture concentration (e.g., 25 > 15%; Mitaru et al., 1984). Hence, exposing feedstuffs containing condensed tannins to conditions in a broiler litter deep-stack might decrease condensed tannin concentration and improve nutritive value. In this regard, Patil et al. (1993) increased nitrogen and decreased condensed tannin concentrations by deep-stacking a mixture of peanut skins and broiler litter compared with broiler litter alone, suggesting that changes resulted from ammonia binding to and cleavage of condensed tannins (Kumar and Singh, 1984; Hill et al., 1986). Therefore, objectives of this experiment were to determine effects on nutrient composition and recovery of addition of different sources and various levels of condensed. tannins by thorough mixing or covering with broiler litter before deep-stacking for 3 or 9 wk.
Materials and Methods Broiler litter was obtained from a commercial production unit after six growing periods, each approximately 42 d in length. Initial moisture
Dow
nloa
ded
by [
Mos
kow
Sta
te U
niv
Bib
liote
] at
13:
44 1
6 Se
ptem
ber
2013
62 Z.S. Wang and coworkers
concentration was 20.8%. Bedding was a mixture of pine shavings and rice hulls applied before the first growing period; packed litter was broken up and mixed with other litter after each growing period. An aliquot of litter passing through a 4.3 x 1.9 cm screen was used to construct substrates for incubation.
Substrates (250 g dry matter and 25% moisture) were constructed and placed in duplicate l-L plastic beakers (11.1 cm top id., 8.9 cm bottom id . and 14.3 cm tall) with a dacron cloth top (50 to 75 micron pores). Vessels were placed in the center of a 1.4 x 2.0 m deep-stack, approximately 1.6 m tall and at 25% moisture, of the same broiler litter used for substrate preparation. Deep-stacking was for 3 or 9 wk. Perforated polyvinylchloride pipes (7.0 cm i.d. and 7.6 cm o.d.), open at one end, were placed at the bottom of the bay to promote oxygen entry.
Substrates consisted of different levels of broiler litter and commercial vegetable extract [ 0%) cold soluble quebracho spray-dried powder; Tannin Corp. , Peabody, MA], peanut skins (PS; Planters- Lifesavers, Fort Simth, AR), ground (2-mm screen) bird-resistant sorghum grain [(BS) Savanna 5 ; Northrup King, New Deal, TX] or ground (2-mm screen) regular sorghum grain [(S) KS 7144; Northrup King, New Deal, TX]. Substrates were comprised of 0, 0.04, 0.09, 0.17, 0.35, 1.3, 2.6, 5.1 and 10.3% VE; 0, 3.6, 7.1, 14.2 and 28.4% PS; and 0, 5 , 10, 20 and 40% BS and S. Levels of added condensed tannins for 3.6, 7.1, 14.2 and 28.4% PS were similar to those for 1.3, 2.6, 5.1 and 10.3% VE respectively. Likewise, condensed tannin additions with 5, 10, 20 and 40% BS were comparable to those for 0.04, 0.09, 0.17 and 0.35% VE, respectively. Substrate ingredients were thoroughly hand-mixed in a plastic bag before placement in beakers, or broiler litter was placed at the bottom of the beaker and covered with VE, PS, BS or S.
Temperature was measured daily for 21 d and once weekly thereafter with a commercial thermometer placed in the center of the deep-stack. After removal of vessels, substrates were hand-mixed. Substrate pH was measured subsequent to mixing 20 g with 50 mL of deionized water. Remaining substrate was stored at -132, later thawed and ground to pass a 2-mm screen.
Substrates were analyzed for dry matter, ash, Kjeldahl nitrogen (N; Association of Official Analytical Chemists, 1984), acid detergent fiber N (Goering and Van Soest, 1970) and soluble N (0.15 M NaC1; Waldo and Goering, 1979). Ammonia N concentration was determined @roderick and Kang, 1980) after placing 1 g of substrate in 100 mL of 0.15 M NaCl and
Dow
nloa
ded
by [
Mos
kow
Sta
te U
niv
Bib
liote
] at
13:
44 1
6 Se
ptem
ber
2013
Condensed tannins and broiler litter 63
filtering, and soluble protein was measured by the procedure of Prigge et al. (1976). Nonprotein N and nonammonia nonprotein N concentrations were determined by difference. The concentration of catechin equivalents was determined by the moditied vanillin-HC1 method of Price et al. (197813).
In situ ruminal dry matter and N disappearances were determined for 0, 0.17, 2.6 and 10.3% VE, 0, 7.1 and 28.4% PS, and 0 and 20% BS and S. A ruminally cannulated beef steer consuming long-stemmed bermudagrass hay at 1.6% of body weight (dry matter basis), with water and trace mineralized salt available free-choice was used for incubation. Duplicate dacron bags (53ilO micron pores; 8 x 5 cm) containing 1 g of substrate were incubated for 12 or 48 h. Upon removal, bags were washed by hand until rinse fluid was clear and residue was analyzed for dry matter and N. Additional bags incubated for 48 h were subjected to pepsin digestion (Association of Official Analytical Chemists, 1984) before N analysis. Predicted intestinal digestion of N was estimated as the difference between residual N after 12 h of ruminal incubation and residual pepsin insoluble N at 48 h. In addition to treatment substrates, broiler litter, VE, PS, BS and S sampled before deep-stacking were subjected to aforementioned procedures to estimate recovery or net change in concentration with deep-stacking (i.e., difference between final or actual and initial or expected concentration).
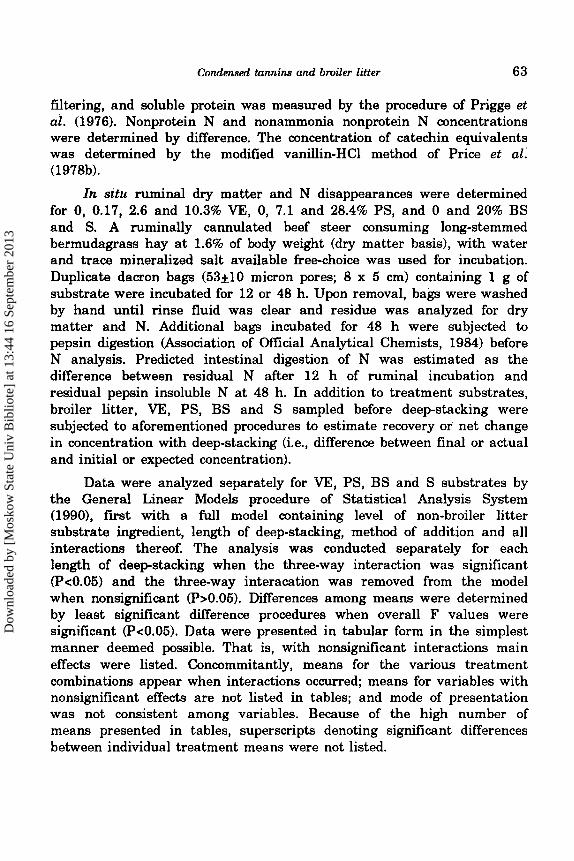
Data were analyzed separately for VE, PS, BS and S substrates by the General Linear Models procedure of Statistical Analysis System (1990), first with a full model containing level of non-broiler litter substrate ingredient, length of deep-stacking, method of addition and all interactions thereof. The analysis was conducted separately for each length of deep-stacking when the three-way interaction was significant (P<0.05) and the three-way interacation was removed from the model when nonsignificant (P>0.05). Differences among means were determined by least significant difference procedures when overall F values were significant (P<0.05). Data were presented in tabular form in the simplest manner deemed possible. That is, with nonsignificant interactions main effects were listed. Concommitantly, means for the various treatment combinations appear when interactions occurred; means for variables with nonsignificant effects are not listed in tables; and mode of presentation was not consistent among variables. Because of the high number of means presented in tables, superscripts denoting significant differences between individual treatment means were not listed.
Dow
nloa
ded
by [
Mos
kow
Sta
te U
niv
Bib
liote
] at
13:
44 1
6 Se
ptem
ber
2013
Tab
le 1
C
ompo
sitio
n of
sub
stra
te in
gred
ient
s Q
, Ip
Item
B
roile
r V
eget
able
Pe
anut
B
ird-
resi
stan
t R
egul
ar
litt
er
extr
act
skin
s so
rghu
m g
rain
so
rghu
m g
rain
Org
anic
mat
ter
(% o
f DM)
Tot
al n
itrog
en (
% o
f DM)
Solu
ble
N (
% o
f to
tal
N)
75.2
86
.8
97.3
98
.2
98.3
4.98
0.
19
2.43
2.
11
1.86
61.4
10
0.0
7.8
12.3
17
.3
Aci
d de
terg
ent f
iber
N (9% o
f to
tal
N)
7.9
20.3
18
.6
20.6
19
.5
Inso
lubl
e av
aila
ble
N (
% o
f to
tal
N)
30.7
0.
0 73
.6
67.1
63
.2
Solu
ble
true
pro
tein
N (
% o
f to
tal
N)
12.8
65
.5
5.8
8.9
12.7
N
onpr
otei
n N
(%
of
tota
l N
) 48
.6
34.5
2.
0 3.
4 4.
6
Am
mon
ia N
(%
of
tota
l N
) 6.
7 0.
0 0.
0 0.
0 0.
0 N
onam
mon
ia n
onpr
otei
n N
('3%
of t
otal
N)
41.9
34
.5
2.0
3.4
4.G
Con
dens
ed t
anni
ns2
(% o
f DM)
0.2
68.4
24
.7
0.6
0.0
In situ DM d
isap
pear
ance
, 12
h (%
) 70
.0
48.8
68
.3
65.0
In situ DM d
isap
pear
ance
, 48
h (
%)
In situ
N d
isap
pear
ance
, 12
h (
%)
85.0
88.1
91.9
In situ
N d
isap
pear
ance
, 48
h (
%)
Peps
in i
nsol
uble
N a
fter
48
h of
77.5
94
.2
95.0
36.4
41
.8
43.7
54
.6
75.3
75
.9
rum
inal
incu
batio
n (%
of
tota
l N
) 4.
4 35
.9
4.4
2.4
Pred
icte
d in
test
inal
N d
iges
tion3
(%
of
tota
l N
) 3.
7 9.
5 20
.3
21.7
'DM
= dr
y m
atte
r; N=
nitr
ogen
. 'C
atec
hin
equi
vale
nts.
3Diff
eren
ce b
etw
een
resi
dual
N a
fter
12 h
of
rum
inal
incu
batio
n an
d re
sidu
al p
epsi
n in
solu
ble
N af
ter 4
8 h
of r
umin
al in
cuba
tion.
N
YJ,
Dow
nloa
ded
by [
Mos
kow
Sta
te U
niv
Bib
liote
] at
13:
44 1
6 Se
ptem
ber
2013
Condensed tannins and broiler litter 65
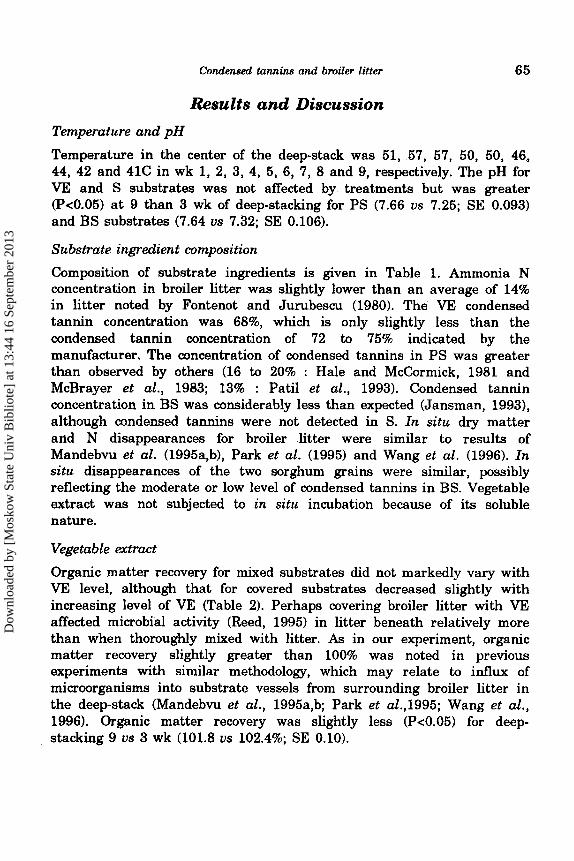
Results and Discussion Temperature and pH Temperature in the center of the deep-stack was 51, 57, 57, 50, 50, 46, 44, 42 and 41C in wk 1, 2, 3, 4, 5, 6, 7, 8 and 9, respectively. The pH for VE and S substrates was not affected by treatments but was greater (P<0.05) at 9 than 3 wk of deep-stacking for PS (7.66 us 7.25; SE 0.093) and BS substrates (7.64 us 7.32; SE 0.106).
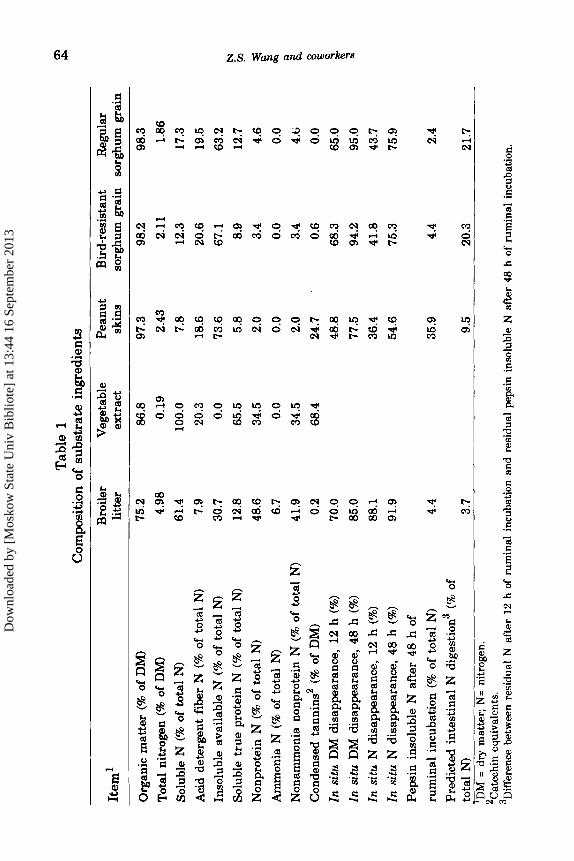
Substrate ingredient composition Composition of substrate ingredients is given in Table 1. Ammonia N concentration in broiler litter was slightly lower than an average of 14% in litter noted by Fontenot and Jurubescu (1980). The VE condensed tannin concentration was 68%, which is only slightly less than the condensed tannin concentration of 72 to 75% indicated by the manufacturer. The concentration of condensed tannins in PS was greater than observed by others (16 to 20% : Hale and McCormick, 1981 and McBrayer et al., 1983; 13% : Patil et al., 1993). Condensed tannin concentration in BS was considerably less than expected (Jansman, 1993), although condensed tannins were not detected in S. In situ dry matter and N disappearances for broiler litter were similar to results of Mandebvu et al. (1995a,b), Park et al. (1995) and Wang et al. (1996). In situ disappearances of the two sorghum grains were similar, possibly reflecting the moderate or low level of condensed tannins in BS. Vegetable extract was not subjected to in situ incubation because of its soluble nature.
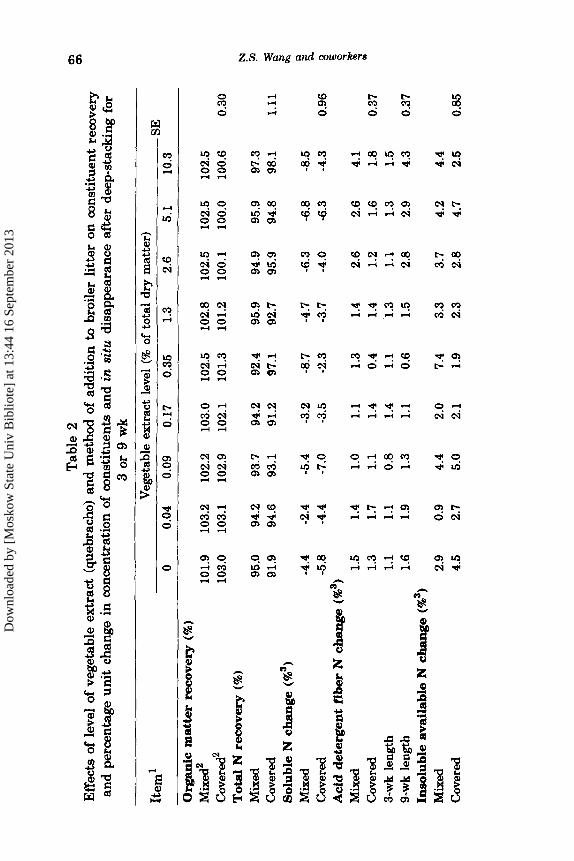
Vegetable extract Organic matter recovery for mixed substrates did not markedly vary with VE level, although that for covered substrates decreased slightly with increasing level of VE (Table 2). Perhaps covering broiler litter with VE affected microbial activity (Reed, 1995) in litter beneath relatively more than when thoroughly mixed with litter. As in our experiment, organic matter recovery slightly greater than 100% was noted in previous experiments with similar methodology, which may relate to influx of microorganisms into substrate vessels from surrounding broiler litter in the deep-stack (Mandebvu et al., 1995a,b; Park et ~1.~1995; Wang et al., 1996). Organic matter recovery was slightly less (P<0.05) for deep- stacking 9 us 3 wk (101.8 us 102.4%; SE 0.10).
Dow
nloa
ded
by [
Mos
kow
Sta
te U
niv
Bib
liote
] at
13:
44 1
6 Se
ptem
ber
2013
Q)
Tab
le 2
Q
)
Effects o
f le
vel o
f ve
geta
ble
extr
act
(que
brac
ho)
and
met
hod
of a
dditi
on to
bro
iler
litt
er o
n co
nstit
uent
rec
over
y an
d pe
rcen
tage
unit
chan
ge i
n co
ncen
trat
ion
of c
onst
ituen
ts a
nd in s
itu d
isap
pear
ance
aft
er d
eep-
stac
king
for
3 or
9 wk
~
Veg
etab
le e
xtra
ct l
evel
(% o
f to
tal
dry
mat
ter)
It
em'
SE
0 0.
04
0.09
0.
17
0.35
1.
3 2.
6 5.
1 10
.3
Org
anic
mat
ter
reco
very
(%)
Mix
ed2
101.
9 10
3.2
102.
2 10
3.0
102.
5 10
2.8
102.
5 10
2.5
102.
5 co
vere
d2
103.
0 10
3.1
102.
9 10
2.1
101.
3 10
1.2
100.
1 10
0.0
100.
6 0.
30
Y Total
N r
ecov
ery
(%)
Mix
ed
95.0
94
.2
93.7
94
.2
92.4
95
.9
94.9
95
.9
97.3
!n
Cov
ered
91
.9
94.6
93
.1
91.2
97
.1
92.7
95
.9
94.8
98
.1
1.11
3
Solu
ble
N c
hang
e (%
') G i
Aci
d d
eter
gen
t fi
ber
N c
hang
e (%
') s i+
Mix
ed
-4.4
-2
.4
-5.4
-3
.2
-8.7
-4
.7
-6.3
-6
.8
-8.5
C
over
ed
-5.8
-4
.4
-7.0
-3
.5
-2.3
-3
.7
-4.0
-6
.3
-4.3
0.
96
8
Mix
ed
1.5
1.4
1.0
1.1
1.3
1.4
2.6
2.6
4.1
Cov
ered
1.
3 1.
7 1.
1 1.
4 0.
4 1.
4 1.
2 1.
6 1.
8 0.
37
3-w
k le
ngth
1.
1 1.
1 0.
8 1.
4 1.
1 1.
3 1.
1 1.
3 1.
5 9-
wk
leng
th
1.6
1.9
1.3
1.1
0.6
1.5
2.8
2.9
4.3
0.37
In
solu
ble
avai
lab
le N
cha
nge
(%')
Mix
ed
2.9
0.9
4.4
2.0
7.4
3.3
3.7
4.2
4.4
Cov
ered
4.
5 2.
7 5.
0 2.
1 1.
9 2.
3 2.
8 4.
7 2.
5 0.
85
a
Dow
nloa
ded
by [
Mos
kow
Sta
te U
niv
Bib
liote
] at
13:
44 1
6 Se
ptem
ber
2013
Solu
ble
tru
e p
rote
in N
cha
nge
(%'I
Mix
ed
-3.9
C
over
ed
-8.1
N
onpr
otei
n N c
hang
e (%
') 3-
wk
leng
th
Mix
ed
2.3
Cov
ered
-2
.4
9-w
k le
ngth
1.
8 A
mm
onia
N c
hang
e (%
'09)
-1.6
N
onam
mon
ia n
onpr
otei
n N
cha
nge
(%3)
9-w
k le
ngth
1.
4 C
hang
e in
in s
itu
12-
h N
pi
sapp
eara
nce (%3~
0.3
3-w
k le
ngth
3.
5
-0.3
-0
.2
1.7
-3.7
-0
.8
-2.4
-6
.7
-4.5
-0
.6
-3.2
-4.0
-4
.6
-2.4
-0
.1
-1.4
-2
.5
-4.6
-3
.5
-3.4
-4
.4
-0.9
1.
2 1.
0 -5
.0
-1.6
-1
.3
0.6
1.0
2.3
2.7
0.2
-2.8
-2
.3
-2.3
-2
.0
-1.6
-2
.9
-3.6
-9
.0
-7.9
-0.7
C
hang
e in
pep
sin
inso
lubl
e N
aft
er 4
8-h
rum
inal i
ncub
atio
n, 9
-wk
leng
th (%
') M
ixed
1.
3 1.
3 C
over
ed
1.9
2.3
Cha
nge
in p
redi
cted
inte
stin
al N
dig
esti
on, 9
-wk
len
gth
(%')
Mix
ed
0.3
-0.7
C
over
ed
-0.9
-1
.1
Con
dens
ed ta
nnin
' re
cove
ry (%
) 3-
wk
leng
th
Mix
ed
119.
6 11
2.8
104.
7 98
.4
63.3
27
.2
Cov
ered
12
4.7
118.
1 10
7.1
84.0
59
.3
37.4
0.3
-2.8
-6.1
-3
.7
-2.8
2.
9
-5.5
-8
.0
-1.1
2.8
1.9
-0.7
-0
.5
18.4
23
.2
-5.1
-0
.6
-1.8
-2
.5
-5.3
1.
9
-1.6
-9
.6
12.4
19
.7
0.2
-3.1
-7.2
-3
.2
-4.6
2.
7
-5.9
-9
.4
-1.7
5.2
1.9
-3.0
-1
.1
10.2
22
.5
1.66
1.17
1.
31
0.51
1.25
0.43
0.44
0.39
2.79
9-
wk
leng
th
86.7
73
.5
66.2
61
.3
43.7
22
.3
15.9
9.
3 11
.4
3.29
*N =
nitr
ogen
. 'V
eget
able
ext
ract
and
bro
iler
litt
er w
ere
thor
ough
ly m
ixed
, or
vege
tabl
e ex
trac
t w
as p
lace
d ab
ove
broi
ler
litt
er in
sep
arat
e la
yers
. 'P
erce
ntag
e un
it c
hang
e (f
inal
min
us i
nitia
l).
'Cat
echi
n eq
uiva
lent
s.
Dow
nloa
ded
by [
Mos
kow
Sta
te U
niv
Bib
liote
] at
13:
44 1
6 Se
ptem
ber
2013
60 Z.S. Wang and ooworkers
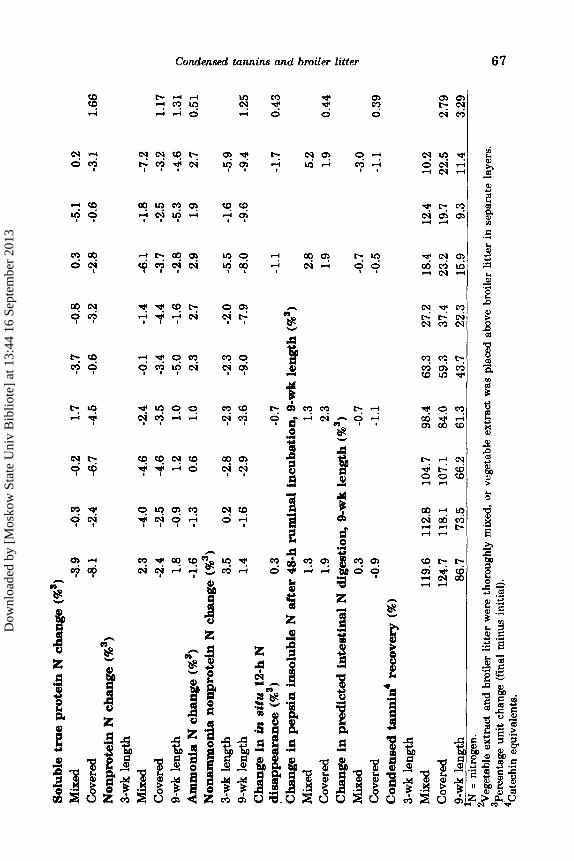
No consistent effects of VE level or method of addition on N recovery were observed (Table 2). Solubility of N was slightly less after than before deep-stacking, although consistent effects of VE level or differences between addition methods did not occur. Magnitude of change in soluble N concentration was greater (P<0.05) after 9 than 3 wk of deep-stacking (-5.8 us -4.4%; SE 0.32). Two-way interactions in change in acid detergent fiber N concentration were observed between VE level and incubation length and method of addition. It appeared that acid detergent fiber N concentration in mixed substrates and after 9 wk of deep-stacking was increased slightly by increasing the level to 12.6% of total DM. However, corresponding changes in concentration of insoluble available N were not observed. Change in soluble true protein was negative, although differences between methods of addition or among levels of VE were inconsistent. Likewise, implications of significant interactions and treatment effects in change in nonprotein N concentration were not apparent.
Ammonia N concentration was slightly less than expected with 0 and 0.04% VE but greater for VE levels 10.35% (Table 2). Change in nonammonia nonprotein N concentration was positive for 0% VE at 3 and 9 wk but negative for ~ 0 . 0 9 % VE. Magnitude of change for these VE levels was generally greater at 9 us 3 wk of deep-stacking. Changes in concentrations of ammonia and nonammonia nonprotein N may reflect that, particularly at 9 wk, VE addition increased ammonia formation from nonammonia nonprotein nitrogenous compounds (i.e., primarily uric acid and urea) without markedly altering ammonia concentration. Thus, condensed tannins in VE may not have facilitated retention of all ammonia initially present or formed in litter. Level of VE, addition method and length of deep-stacking had no or relatively small effects on change in in situ dry matter and N disappearances and residual pepsin insoluble N following in situ ruminal incubation. Magnitude of change in in situ N disappearance with 48 h of ruminal incubation was greater (P<0.05) at 9 us 3 wk of deep-stacking (1.4 us 0.8%; SE 0.13).
Recovery of condensed tannins at 3 wk of deep-stacking was greater than 100% for 0, 0.04 and 0.09% VE, although recovery generally decreased as VE level increased form 0 to 10.3% of total dry matter (Table 2). High recovery of condensed tannins in substrates with low initial concentrations may have resulted from analytical problems involving reaction of non-tannin substances with vanillin (Burns, 1971). This procedure can overestimate concentration of condensed tannins in samples with low concentrations relatively more than do other
Dow
nloa
ded
by [
Mos
kow
Sta
te U
niv
Bib
liote
] at
13:
44 1
6 Se
ptem
ber
2013
Condensed tannins and broiler litter 69
procedures (Maxson and Rooney, 1972). For substrates deep-stacked for 3 wk, condensed tannin recovery at all but two VE levels was less for mixed than for covered substrates, possibly indicative of greater exposure of condensed tannins in mixed substrates to ammonia or moist alkaline conditions. Condensed tannin recovery was less at 9 us 3 wk of deep-stacking and at 9 wk of deep-stacking recovery was similar between addition methods. This suggests that prolonged exposure to deep-stack conditions of condensed tannins in covered substrates compensated for possibly less exposure per unit time when mixed. In accordance, Price et al., (1979) observed that dilute alkali treatments of BS required longer treatment times than with more concentrated solutions. It appears that rate of condensed tannin deactivation in our experiment may have been lower than rates for reconstituted BS with added urea of 44 and 89% per day at 25 and 60 C, respectively, noted by Russell and Lolley (1989).
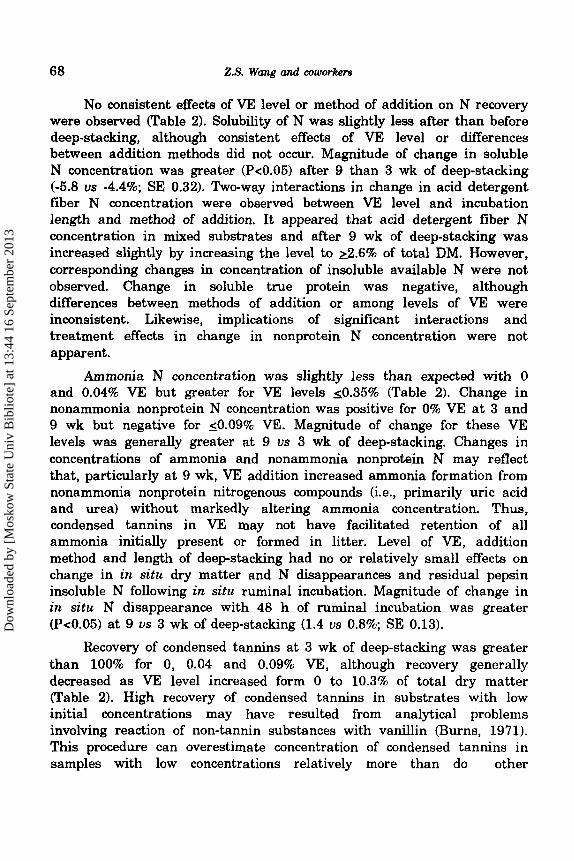
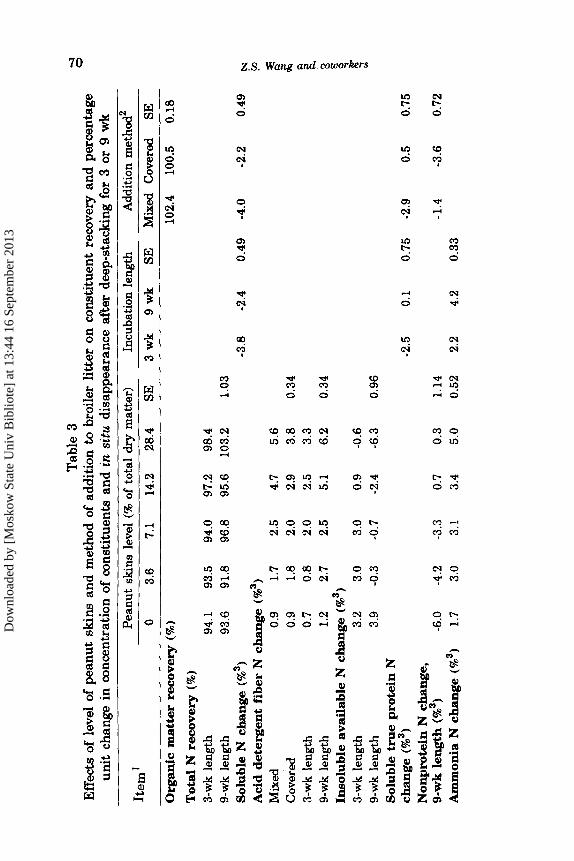
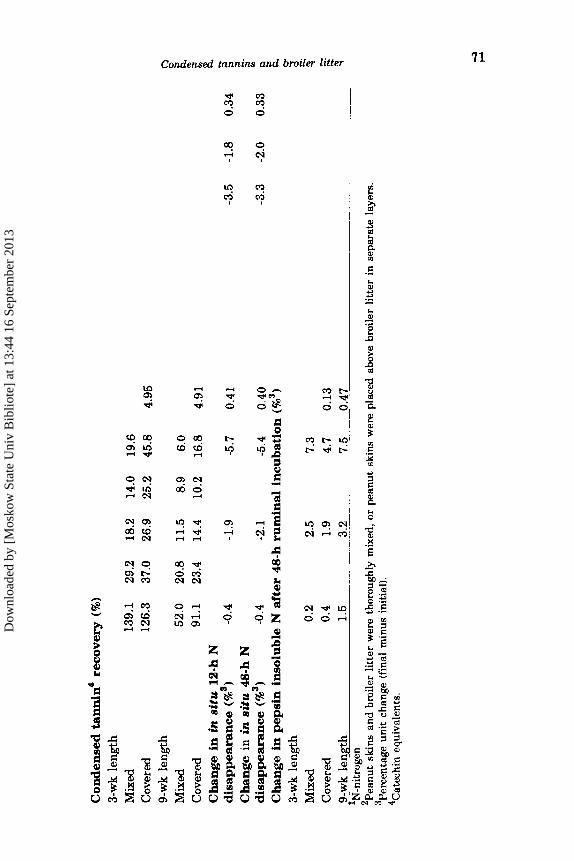
Peanut skins Organic matter recovery was not influenced by level of PS and was greater (P<0.05) for mixed than for covered substrates (Table 3). An interaction (P<0.05) in N recovery between deep-stacking length and PS level was observed, which appeared primarily the result of relatively high recovery for 28.4% PS with 9 wk of deep-stacking. Patil et al. (1993) observed an effect of mixing broiler litter with PS (27% of total dry matter) in a deep-stack. Reasons for comparatively little effect of PS addition on N recovery in our experiment are unclear but could involve use of small quantities of substrate contained in plastic beakers with a dacron cloth top rather than employment of an entire deep-stack. The difference between lengths of deep-stacking in change in soluble N concentration was opposite that noted for VE substrates. Likewise, magnitude of change in soluble N concentration was greater (P<0.05) for mixed us covered substrates; whereas, differences between addition methods were inconsistent among substrate VE levels.
As noted for VE substrates, change in acid detergent fiber N concentration between that before and after deep-stacking was greater for high PS levels compared with lower levels (Table 3). Change in acid detergent fiber N concentration with high PS levels was greater (P<0.05) for mixed us covered substrates and for all PS levels a t 9 us 3 wk deep-stacking. Factors responsible for these interactions are unclear. For both VE and PS substrates, generally corresponding changes in residual pepsin insoluble N were noted. However, change in predicted intestinal N digestion was not appreciably altered by VE or PS levels. Perhaps binding of condensed tannins to proteins, quite possibly of microbial origin, were
Dow
nloa
ded
by [
Mos
kow
Sta
te U
niv
Bib
liote
] at
13:
44 1
6 Se
ptem
ber
2013
4
0
Tab
le 3
E
ffec
ts o
f le
vel o
f pe
anut
ski
ns a
nd m
etho
d of
add
ition
to
broi
ler
litt
er o
n co
nstit
uent
rec
over
y an
d pe
rcen
tage
un
it c
hang
e in
con
cent
ratio
n of
con
stitu
ents
and
in
situ
dis
appe
aran
ce a
fter
dee
p-st
acki
ng f
or 3
or
9 wk
Add
ition
met
hod'
Pe
anut
ski
ns l
evel
(% o
f to
tal dr
y m
atte
r)
0 3.
6 7.
1 14
.2
28.4
SE
3
wk
9 w
k SE
Mixed
Cov
ered
SE
In
cuba
tion
leng
th
Item
Org
anic
mat
ter
reco
very
(%
)
Total
N r
ecov
ery
(%)
3-w
k le
ngth
94
.1
93.5
9-
wk
leng
th
93.6
91
.8
Solu
ble
N c
han
ge (%
') A
cid
det
erge
nt
fib
er N
ch
ange
(%')
Mixed
0.9
1.7
Cov
ered
0.
9 1.
8 3-
wk
leng
th
0.7
0.8
9-w
k le
ngth
1.
2 2.
7 In
solu
ble
avai
lab
le N
cha
nge
(%')
3-w
k le
ngth
3.
2 3.
0
Solu
ble
true
pro
tein
N
chan
ge (%
') N
onpr
otei
n N
ch
ange
,
Ammo
nia
N c
hang
e (%
'I 1.
7 3.
0
9-w
k le
ngth
3.
9 -0
.3
9-wk le
ngt
h (%
'I -6
.0
-4.2
102.
4 10
0.5
0.18
94.0
97
.2
98.4
96
.8
95.6
10
3.2
1.03
-3
.8
-2.4
0.
49
-4.0
-2
.2
0.49
p
!n
2.5
4.7
5.6
3 2.
0 2.
9 3.
0 0.
34
Gz E
2.0
2.5
3.3
2.5
5.1
6.2
0.34
3.0
0.9
-0.6
-0
.7
-2.4
-6
.3
0.96
-2.5
0.
1 0.
75
-2.9
0.
5 0.
75
-3.3
0.
7 0.
3 1.
14
-1.4
-3.6
0.72
3.
1 3.
4 5.
0 0.
52
2.2
4.2
0.33
4 F 2
Dow
nloa
ded
by [
Mos
kow
Sta
te U
niv
Bib
liote
] at
13:
44 1
6 Se
ptem
ber
2013
Con
dens
ed t
anni
n'
reco
very
(%
) 3-
wk
leng
th
Mix
ed
139.
1 29
.2
18.2
14
.0
19.6
C
over
ed
126.
3 37
.0
26.9
25
.2
45.8
4.
95
9-w
k le
ngth
M
ixed
52
.0
20.8
11
.5
8.9
6.0
8
Cov
ered
91
.1
23.4
14
.4
10.2
16
.8
4.91
E
Cha
nge
in i
n s
itu
12-
h N
8. F :. E. -3
.5
-1.8
0.
34
disa
ppea
ranc
e (%
') -0
.4
-1.9
-5
.7
0.41
disa
ppea
ranc
e (%
') -0
.4
-2.1
-5
.4
0.40
-3
.3
-2.0
0.
33
Cha
nge
in i
n S
ifU
48-h N
Cha
nge
in p
epsi
n i
nso
lub
le N
aft
er 4
8-h
ru
min
al in
cuba
tion
(%3)
3-w
k le
ngth
a
Mix
ed
0.2
2.5
7.3
2 C
over
ed
0.4
1.9
4.7
0.13
9-
wk
leng
th
1.5
3.2
7.5
0.47
IN
-nit
roge
n 'P
eanu
t sk
ins
and
broi
ler
litte
r w
ere
thor
ough
ly m
ixed
, or
pean
ut s
kins
wer
e placed a
bove
bro
iler
litte
r in
sep
arat
e la
yers
. 3P
e~en
tage
unit
cha
nge
(fin
al m
inus
ini
tial
). 4C
atec
hin
equi
vale
nts.
W
c = - K
Dow
nloa
ded
by [
Mos
kow
Sta
te U
niv
Bib
liote
] at
13:
44 1
6 Se
ptem
ber
2013
4
Tab
le 4
N
Eff
ects
of
leve
l of
bird
-res
ista
nt s
orgh
um g
rain
and
met
hod
of a
dditi
on t
o br
oile
r li
tter
on
cons
titue
nt r
ecov
ery
and
perc
enta
ge u
nit
chan
ge i
n co
ncen
trat
ion
of c
onst
ituen
ts a
nd in
situ
dis
appe
aran
ce a
fter
dee
p-st
acki
ng f
or
3 or
9 wk
Item
' B
ird-
resi
stan
t so
rghu
m g
rain
In
cuba
tion
leng
th
Add
ition
met
hod2
(%
of
tota
l dr
y m
atte
r)
0 5
10
20
40
SE
3 w
k 9
wk
SE
Mix
ed C
over
ed
SE
Org
anic
mat
ter
reco
very
(%)
101.
7 10
1.6
101.
6 10
1.2
100.
5 0.
23
101.
6 10
1.0
0.14
10
2.1
100.
5 0.
14
Tot
al N
rec
over
y (%
) 95
.5
93.5
0.
58
3-w
k le
ngth
93
.8
93.2
96
.6
91.6
95
.3
ol
9-w
k le
ngth
90
.9
92.9
95
.7
95.8
99
.4
1.29
3
Solu
ble
N c
hang
e (%
') -2
.1
-3.7
0.
39
z 8 A
cid
det
erge
nt
fib
er N
Inso
lubl
e av
aila
ble
N
Non
prot
ein
N c
han
ge (%
')
chan
ge (%
'I 0.
3 1.
7 2.
0 3.
3 4.
2 0.
40
1.9
2.7
0.25
chan
ge (%
') 3.
7 1.
5 -0
.4
-0.5
-1
.7
0.71
9 2
3-w
k le
ngth
Covered
1.6
0.3
3.0
4.4
4.6
1.44
9-
wk
leng
th
-1.9
1.
0 0.
25
Mixed
-0.7
-3
.4
-0.2
12
.4
6.9
Am
mon
ia N
ch
ange
(%3)
2.1
2.4
1.9
2.4
3.9
0.42
1.
6 3.
5 0.
27
Dow
nloa
ded
by [
Mos
kow
Sta
te U
niv
Bib
liote
] at
13:
44 1
6 Se
ptem
ber
2013
Non
amm
onia
non
pro
tein
N c
han
ge (%
') 3-
wk
leng
th
Mix
ed
-2.5
-3
.9
-1.2
8.
3 4.
4 C
over
ed
1.3
-1.6
1.
1 3.
0 2.
2 1.
16
9-w
k le
ngth
Mixed
-7.8
-4
.9
-5.5
-4
.5
-3.8
C
over
ed
-0.4
-6
.2
-2.3
-1
.8
-1.9
1.
18
Cha
nge
in in
sit
u 1
2-h
N
Cha
nge
in in
eit
u 4
8.h
N
Cha
nge
in p
epsi
n in
solu
ble
N a
fter
48-
h r
umin
al in
cuba
tion,
9-wk le
ngt
h (%
')
dis
app
eara
nce
(%3)
-0
.3
-2.3
0.
34
dis
app
eara
nce
(%')
-0.7
-3
.8
0.57
3-w
k le
ngth
0.
9 2.
3 9-
wk
leng
th
1.6
1.5
0.25
9-w
k le
ngth
(%')
-0.9
2.
4 0.
36
Cha
nge
in p
red
icte
d i
nte
stin
al N
dig
esti
on,
Con
dens
ed t
anni
n*
reco
very
(%)
3-w
k le
ngth
13
4.6
99.0
10
8.6
75.0
49
.7
9-w
k le
ngth
97
.4
88.4
87
.6
67.9
48
.1
5.05
'N
= ni
trog
en
'Bir
d-re
sist
ant
sorg
hum
gra
in a
nd b
roile
r li
tter
wer
e th
orou
ghly
mixed,
or b
ird-
resi
stan
t so
rghu
m g
rain
was
pla
ced
abov
e br
oile
r li
tter
in
sepa
rate
laye
rs.
'Per
cent
age
unit
cha
nge
(fin
al m
inus
ini
tial)
. *C
atec
hin
equi
vale
nts.
a a 8 c
h
w.
*c P 4
w
Dow
nloa
ded
by [
Mos
kow
Sta
te U
niv
Bib
liote
] at
13:
44 1
6 Se
ptem
ber
2013
74 Z.S. Wang and wworkrs
responsible. Level of PS did not affect change in soluble true protein concentration. Treatment effects on change in nonprotein N concentration did not occur with 3 wk of deep-stacking. However, at 9 wk change generally increased, from -6.0% for 0% PS to 0.7 and 0.3% for 14.2 and 28.4% PS, respectively. Change in ammonia N concentration with increasing PS level was fairly similar to that with increasing VE level, although the increase in magnitude of ammonia N concentration change was slightly greater for PS than for VE. Effects of level of PS on change in in situ N disappearances and residual pepsin insoluble N after ruminal incubation were not marked but do reflect increasing acid detergent fiber N concentration with increasing PS level.
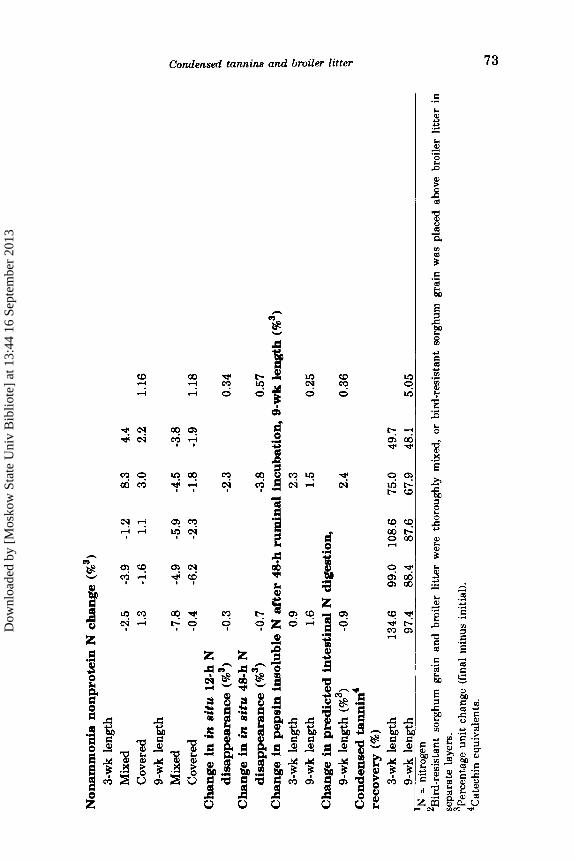
Change in condensed tannin recovery with increasing PS level (Table 3) was in accordance with that for increasing level of VE. Also, disappearance was greater for 9 us 3 wk of deepatacking. However, condensed tannin disappearance was greater (P<0.05) for mixed than for covered substrates with nonzero PS levels at both 3 and 9 wk; whereas, similar differences for VE substrates with comparable CT levels (1.3, 2.6, 5.1 and 10.3% VE) were noted only at 3 wk. Factors responsible for these effects are not apparent but could involve differences between VE and PS in the nature of condensed tannins or physical charcteristics affecting degree of tannin exposure to conditions in the deep-stack. Alternatively, greater organic matter degradable by microorganisms in PS than may have increased microbial utilization of ammonia, thereby decreasing exposure to condensed tannins.
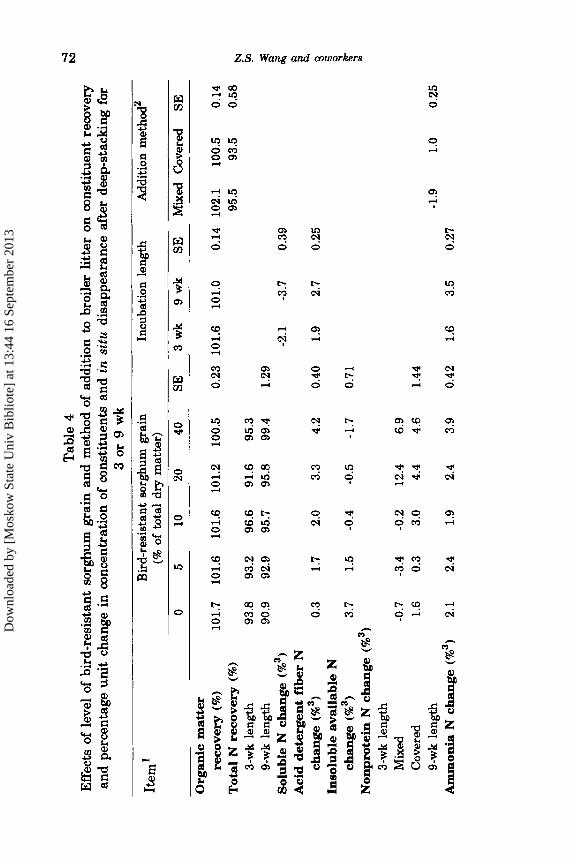
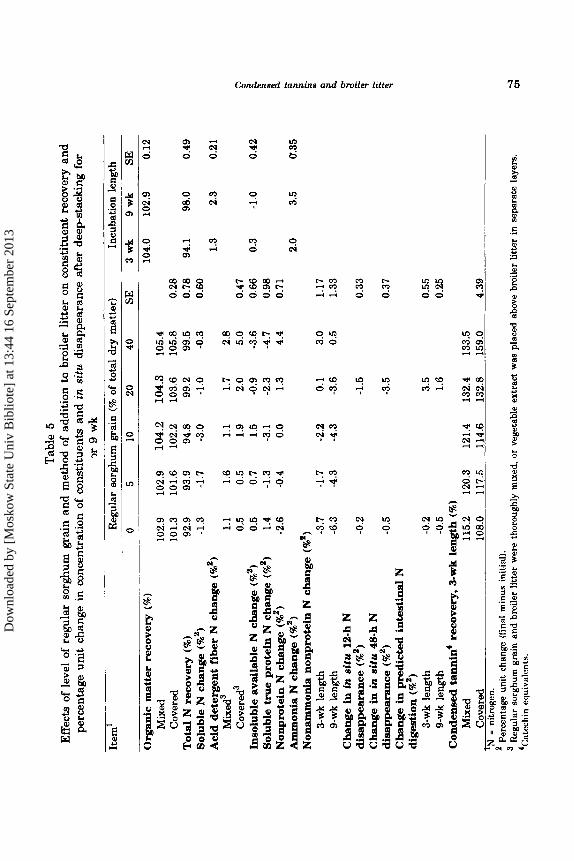
BS and S Organic matter recovery differed (P<0.05) among BS levels and between lengths of deep-stacking and addition methods, although magnitudes of change were not appreciable (Tables 4 and 5). Organic matter recovery for S substrates increased with increasing S level. Differences in N recovery between deep-stacking for 3 or 9 wk varied with level of BS in substrates, although for S substrates N recovery was greater (P<0.05) for 9 us 3 wk and increased with increasing S level. Magnitudes of change in soluble N concentration were not significantly (BS substrates) or markedly (S substrates) affected by BS or S levels. Change in acid detergent fiber N concentration increased with increases in BS or S level. Thus, these effects did not appear related to condensed tannins in BS. Higher levels of BS and S generally resulted in nonprotein N concentration greater than expected based on concentrations before deep-stacking. Change in ammonia N concentration was greatest (Pc0.05) among BS levels for 40%;
Dow
nloa
ded
by [
Mos
kow
Sta
te U
niv
Bib
liote
] at
13:
44 1
6 Se
ptem
ber
2013
Tab
le 5
E
ffec
ts o
f le
vel o
f re
gula
r so
rghu
m g
rain
and
met
hod
of a
dditi
on t
o br
oile
r li
tter
on
cons
titue
nt r
ecov
ery
and
perc
enta
ge u
nit
chan
ge i
n co
ncen
trat
ion
of c
onst
ituen
ts a
nd in
situ
dis
appe
aran
ce a
fter
dee
p-st
acki
ng f
or
7r 9
wk
Item
' R
egul
ar s
orgh
um grain (9% o
f to
tal
dry
mat
ter)
0
5 10
20
40
SE
3
wk
9w
k
SE
Incu
batio
n le
ngth
Org
anic
mat
ter
reco
very
(%
) Mixed
102.
9 C
over
ed
101.
3 Total
N r
ecov
ery
(%)
92.9
Mix
ed3
1.1
Sol
uble
N c
hang
e (2
')
-1.3
A
cid
det
erg
ent f
iber
N c
hang
e (%
')
cove
red3
0.
5 0.
5 1.
4 In
solu
ble
avai
labl
e N
cha
nge
(%')
Sol
uble
tru
e pro
tein
N c
hang
e (9%')
Am
mon
ia N c
hang
e (%
') N
onam
mon
ia n
onpro
tein
N c
hang
e (%
')
Non
prot
ein
N c
hang
e (9%')
-2.6
3-w
k le
ngth
-3
.7
dis
app
eara
nce
(%')
-0.2
9-w
k le
ngth
-6
.3
Cha
nge
in i
n e
ifu
12-
h N
Cha
nge
in in
eif
u 4
8-h
N
Cha
nge
in p
redic
ted in
test
inal
N
dige
stio
n (9%')
dis
app
eara
nce
(%')
-0.5
3-w
k le
ngth
-0
.2
9-w
k le
n&h
-0.5
102.
9 104.2
104.3
105.
4 10
1.6
102.
2 10
3.6
105.
8 93
.9
94.8
99
.2
99.5
-1
.7
-3.0
-1.0
-0
.3
1.6
1.1
1.7
2.8
0.5
1.9
2.0
5.0
0.7
1.5
-0.9
-3
.6
-1.3
-3
.1
-2.3
-4
.7
-0.4
0.
0 1.
3 4.
4
-1.7
-2
.2
0.1
3.0
-4.3
-4
.3
-3.6
0.
5
-1.5
-3.5
3.5
1.6
Con
dens
ed -
Wn
4 re
cove
ry, 3-wk l
engt
h (%
) M
ked
115.
2 12
0.3
121.
4 13
2.4
133.
5 C
over
ed
108.
0 11
7.5
114.
6 13
2.8
159.
0 'N
= ni
trog
en.
0.28
0.
78
0.60
0.47
0.
66
0.98
0.
71
1.17
1.
33
0.33
0.37
0.55
0.
25
104.
0
94.1
1.3
0.3
2.0
102.
9 0.
12
98.0
0.
49
2.3
0.21
-1.0
0.
42
H i;
3.5
0.35
g.
4.39
Perc
enta
ge u
nit
chan
ge (
fina
l m
inus
ini
tial
).
4
UI
Reg
ular
sor
ghum
gra
in a
nd b
mile
r li
tter
wer
e th
orou
ghly
mix
ed,
or v
eget
able
ext
ract
was
pla
ced
abov
e br
oile
r li
tter
in
sepa
rate
lay
ers.
'C
atec
hin
equi
vale
nts.
Dow
nloa
ded
by [
Mos
kow
Sta
te U
niv
Bib
liote
] at
13:
44 1
6 Se
ptem
ber
2013
76 Z.S. Wang and coworkers
whereas, S level did not affect change in ammonia N concentration. Change in nonammonia nonprotein N concentration was inconsistent among BS levels, although nonammonia nonprotein N concentration change increased with increasing S level. Changes in in sitzr disappearances were not markedly or consistently affected by BS or S level in substrates.
Condensed tannin recovery decreased as BS level increased (Table 41, as also was noted for VE and PE substrates. However, BS substrate condensed tannin recoveries were not greatly different from those for VE with levels providing comparable initial substrate condensed tannin concentrations (0.04, 0.09, 0.17 and 0.35% VE). Also in accordance with results for VE and PS substrates, condensed tannin recovery was lower for 9 us 3 wk of deep-stacking. Because of the low level of analyzed condensed tannins in broiler litter and a nondetectable concentration in S, condensed tannin recovery for all S substrates was above 100% and increased slightly with increasing S level.
Summary
The lack of marked effects of condensed tannin source addition on change in concentration of most N fractions in situ disappearances and organic matter and N recoveries indicate no or relatively minor effects on activity of microorganisms in substrate during deep-stacking or of ruminal microbes during in situ incubation. Subjection to broiler litter deep-stack conditions drastically reduced recovery of assayable condensed tannins regardless of source. The decrease in condensed tannin recovery with increasing level of addition indicates that capacity for change elicited by responsible factors (e.g., exposure to ammonia or moist alkaline conditions) was not exceeded. However, it appeared that condensed tannin loss increased with increasing length of deep-stacking and the influence of method of condensed tannin addition differed among sources. With the source highest in condensed tannins (i.e., VE), thoroughly mixing broiler litter with the condensed tannin source resulted in lower condensed tannin recovery than did covering at 3 wk but not at 9 wk; whereas, with the source moderate in condensed tannin concentration (i.e., PS) a difference between addition methods occurred with both lengths of deep- stacking, although it was of lesser magnitude a t 9 wk. Conversely, for the source lowest in condensed tannins (i.e., BS), method of addition did not affect recovery with either deep-stacking length. In conclusion, there appears considerable potential to decrease assayable condensed tannin
Dow
nloa
ded
by [
Mos
kow
Sta
te U
niv
Bib
liote
] at
13:
44 1
6 Se
ptem
ber
2013
concentration in feedstuffs by addition to broiler litter before deep-stacking.
References Association of Official Analytical Chemists. 1984. Official Methods of Analysis.
Page 152-157. Association of Official Analytical Chemists, Washington, DC .
Broderick, G.A. and Kang, AH. 1980. Automated simultaneous determination of ammonia and total amino acids in ruminal fluid and in uitm media. J . Dairy Sci., 63 : 64-75.
Burns, R.E. 1971. Method for estimation of tannin in grain sorghum. Agron. J.,
Fontenot, J .P. and Jurubescu, V. 1980. Processing of animal waste by feeding to ruminants. Page 641-662. In : Y. Ruckebusch and P. Thivend, ed. Digesfiue Physiology and Mefaholism in Ruminants. AVI, Westport, CT.
63 : 511-512.
Goering, H.K. and Van Soest, P.J. 1970. Forage Fiber Ancdyses. Apparatus, Reagents, h x e d u r e s and Some Applications. Page 1-20. Agricultural Handbook No. 379. Agricultural Research Service, U.S. Dep. Agric., Washington, DC.
Hale, O.M. and McGrmick, W.C. 1981. Value of peanut skins (testa) a s a fwd ingredient for growingfinishing swine. J. Anim. Sci., 53 : 1006-1010.
Hill, G.M., Utley, P.R. and Newton, G.L. 1986. Digestibility and utilization of ammonia-treated and urea-supplemented peanut skins fed to cattle. J . h i m . Sci., 63 : 705-714.
Jansman, A.J.M. 1993. Tannins in feedstuffs for simple-stomached animals. Nutr. Res. Rev., 6 : 209-236.
Kumar, R. and Singh, M. 1984. Tannins: Their adverse role in ruminant nutrition. J. Agric. Food Chem., 32 : 447-453.
Kumar, R. and Vaithiyanathan, S . 1990. Occurrence, nutritional significance and effect on animal productivity of tannins in leaves. Anim. Feed Sci. Technol., 30 : 21-38.
Mandebvu, P., Goetsch, A.L. and Kellogg, D.W. 1995a. Effects of alkaline hydrogen peroxide treatment of broiler litter and roughages before deep-stacking on nutrient composition, recovery and in uitm digestibility J. Appl. h i m . Res., 8 : 145-169.
Maridebvu, P., Goetsch, A.L. Kellogg, D.W., Park, K.K., Patil, A.R. and Kouakou, B. 1995b. Effects of alkaline hydrogen peroxide treatment of broiler litter on nutrient coniposition, recovery and digestibility. J. Appl. Anim. Res., 8 : 29-54.
Dow
nloa
ded
by [
Mos
kow
Sta
te U
niv
Bib
liote
] at
13:
44 1
6 Se
ptem
ber
2013
70 Z.S. Wang and coworkers
Mason, E.D.and Rooney, L.W. 1972. Evaluation of methods for tannin analysis in sorghum grain. Cereal Chem., 49 : 719-729.
McBrayer, A.C., Utley, P.R., Lowrey, R.S. and McCormick, W.C. 1983. Evaluation of peanut skins (testa) as a feed ingredient for growing- finishing cattle. J. h i m . Sci., 56 : 173-183.
Mitaru, B.N., Reichert, R.D. and Blair, R. 1984. Kinetics of tannin deactivation during anaerobic storage and boiling treatments of high tannin sorghums. J. Food Sci., 49 : 1566-1568.
Oltjen, R.R. and Dinius, D.A. 1976. Processed poultry waste compared with uric acid, sodium urate, urea and biuret as nitrogen supplemects for beef cattle fed forage diets. J . Anim. Sci., 43 : 201-208.
Park, K.K., Goetsch,,A.L., Patil, A.R., Kouakou, B., Forster, L.A., Jr., Galloway, D.L., Sr. and Johnson, Z.B. 1995. Effects of xylose and soybean meal additions to deep-stacked broiler litter on nutritive characteristics for ruminants. J. Appl. Anim. Res., 7 : 1-26.
Patil, A.R., Goetsch, A.L., Galloway, D.L., Sr. and Forster, L.A., Jr . 1993. Intake and digestion by Holstein steer calves consuming grass hay supplemented with broiler litter. Anim. Feed Sci. Technol., 44 :
Price, M.L., Butler, J.C., Featherston, W.R. and Rogler, J.C. 1978a. Detoxification of high tannin sorghum grain. Nutr. Rep. Int., 17 : 229-236.
Price, M.L., Butler, J.C., Rogler, J.C. and Featherston, W.R. 1979. Overcoming the nutritionally harmful effects of tannin in sorghum grain by treatment with inexpensive chemicals. J. Agric. Food Chem., 27 : 441-445.
Price, M.L., Van Scoyoc, S. and Butler, L.G. 1978b. A critical evaluation of the vanillin reaction as an assay for tannin in sorghum grain. J . Agric. Food Chem., 26 : 1214-1218.
Prigge, E.C., Johnson, R.R., Owens, F.N. and Williams, D. 1976. Soluble nitrogen and acid production of high moisture corn. J. Anim. Sci., 42 : 490-496.
Reed, J.D. 1995. Nutritional toxicology of tannins and related polyphenols in forage legumes. J . Anim. Sci., 73 : 1516-1528.
Reichert, R.D., Fleming, S.E. and Schwab, D.J. 1980. Tannin deactivation and nutritional improvement of sorghum by anaerobic storage of HZO-,HCl-, or NaOH-treated grain. J. Agric. Food Chem., 28 : 824-829.
Robbins, C.T., Hanley, T.A., Hagerman, A.E., Hjeljord, O., Baker, D.L., Schwartz, C.C. and Mautz, W.W. 1987. Role of tannins in defending plants against ruminants : Reduction in protein availability. Ecology, 68( 1):
Ruffin, B.G. and McCaskey, T.A. 1990. Broiler litter can serve as a feed
251-263.
98-107.
ingredient for beef cattle. Feedstuffs, 62 (15) : 13-17.
Dow
nloa
ded
by [
Mos
kow
Sta
te U
niv
Bib
liote
] at
13:
44 1
6 Se
ptem
ber
2013
Condensed tannins and broiler litter 79
Russell, R.W. and Lolley, J.R. 1989. Deactivation of tannin in high tannin milo by treatment with urea. J. Dairy Sci., 72 : 2427-2430.
Statistical Analysis System. 1990. SASISTAT User's Guide, Version 6, 4th edn. Statistical Analysis System, Cary, NC.
Waldo, D.R. and b r i n g , H.K. 1979. Insolubility of proteins in ruminant feeds by four methods. J. h i m . Sci., 49 : 1560-1568.
Wang, Z.S., Goetsch, A.L., Park, K.K., Patil, A.R., Kouakou, B., Galloway, D.L., Jr. and Rossi, J.E. 1996. Addition of different sources and levels of amino acids and sugars to broiler litter before deep-stacking. Bioresource Technol., in press.
3rsolqTo ?bT, q o V T 0 *-, & O i h d, q o w o m, $0 mwfm, aoT!p r n , T i t o , + o f o M I W ~ @ r n r n . i f . f m m * * d - T I
&m 3vmJr 3 ?lbm Fllf%!3 4 M . 3 m M 3 m -crsf;m & 4 k-k wml ;f ~ R 7 4 ~ ~ ~ 3 m ~ ~ m ~ ~ ~ ~ ~ ~ m ~ ~ ~ hW I ?7d%* 3 W i T 7 T l "R?tT?FRT@$i9e4Wl~~&' f i9z ;F?T iTRl ,
9;1: Yli% 7Rl R F d F;h ;t r m 7iRi * Tit I m 3%R7 ZJRT: 68.4, 24.7, 0.6 ? 0.0%
m 837 m ym m w!4& m (a TII), yuit * + 5T TFT m (7 w), ~ - r n w * + ( 9 w ) S h i m w ( m w ) * + $ I m 3TmHyvmf4 W4l? m a TT * TI% WIT: 0, 0.04, 0.09, 0.17, 0.35, 1.3,2.6, 5.1 &i 10.3%; STI 0, 3.6,7.1, 14.2 shi28.4;?1$1mO, 5,10,20 &i 40% 3 I ift;rTl"R Q7q TII md-zf wJf%%r$ y: mfir @kf Sm 3 120,105,98,63,27,18,12? 10% ?[ell & 3 & d ;f 125,118,107,
84,59,37,23,20 23% &i'9 T14m m 87,74,66,61,44,22, 16, 9 4 11% pll I 7 139,29,18,14 is 20% ?wI & aTif 3 126,
37,27,25 B 45% 8 I @ 54 3 9T14m Q7 3 m 3 52,21,12,9 ? 6% ?7'l& ;f 91,23, 10 B 17% $ I 9 9 TRR T 97, 88,88,68 ? 4 8 % ~ : ~ ~ ~ l m f % & * ~ ? ~ ~ ~ ~ ~ ~ ~ ~ l ~ ~
T$ ;t t f 3 Tm 3 Tl"R Q7 m * T$3 3 T14m m 135, 99,109,75 a 50%
*m6I m** m, * S h i e d 4y: mfir m R & p d 3h * 3 f%pT m qp11Tjt m 33 mm Wl I ?FRTqm?Jl-zf $ m R7 3 mf%& & * m f i ~ y : ~ ~ ~ g & v m m m m $ $ m ~ I
Dow
nloa
ded
by [
Mos
kow
Sta
te U
niv
Bib
liote
] at
13:
44 1
6 Se
ptem
ber
2013