Embed Size (px)
Citation preview
Adding Value to Commodity Services
Presenter: Edi Osborne, CEO Mentor Plus Business Intuitive
Scaling New Heights 2014 San Antonio, Texas
©Mentor Plus 2014 All Rights Reserved
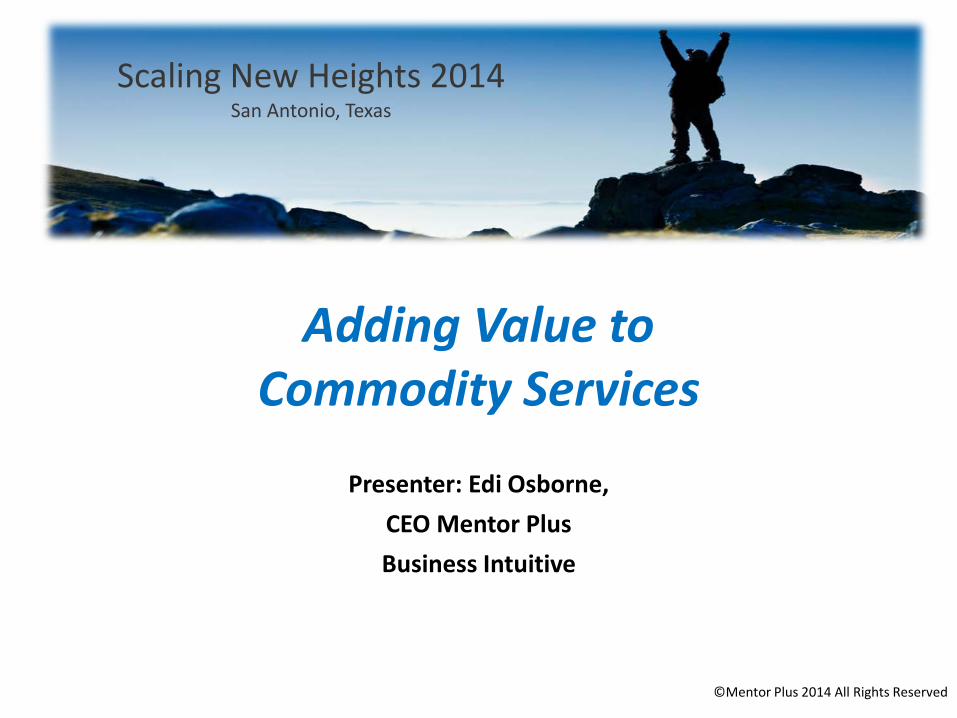
What we’ll cover: You’ll learn how to:
• Improve and clearly articulate your value proposition using
the Level 5 Service model • Focus on relevance as much as accuracy • Expand what you are “accounting for” • Conduct a Chart of Accounts Analysis (CAA) • Use this exercise as a foundation for producing more
meaningful management information for your client
Scaling New Heights 2014
©Mentor Plus 2014 All Rights Reserved
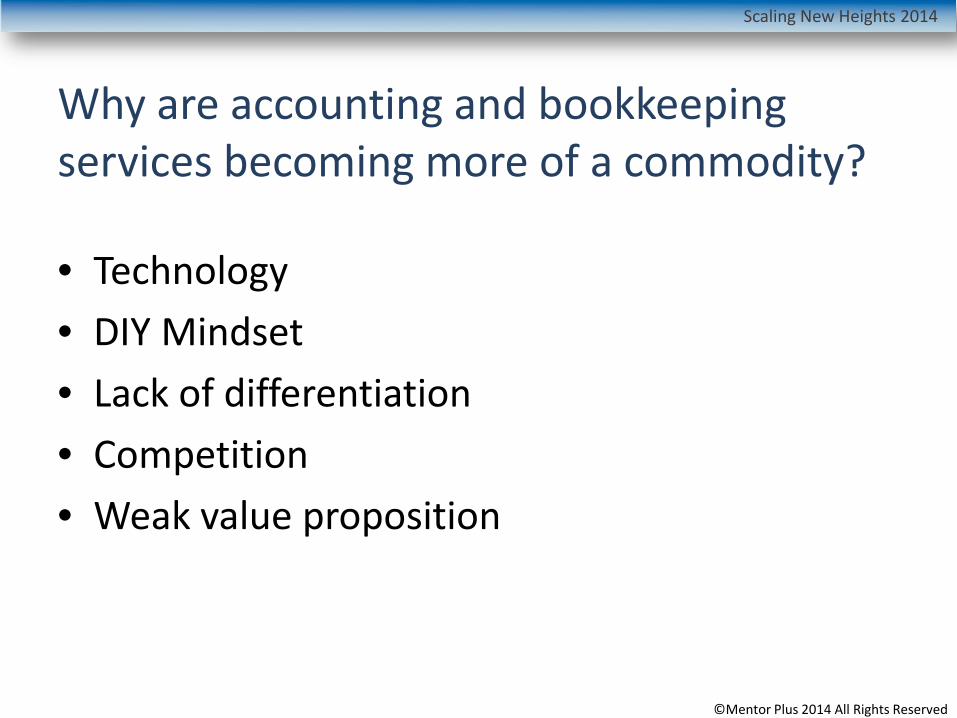
Why are accounting and bookkeeping services becoming more of a commodity?
• Technology • DIY Mindset • Lack of differentiation • Competition • Weak value proposition
Scaling New Heights 2014
©Mentor Plus 2014 All Rights Reserved
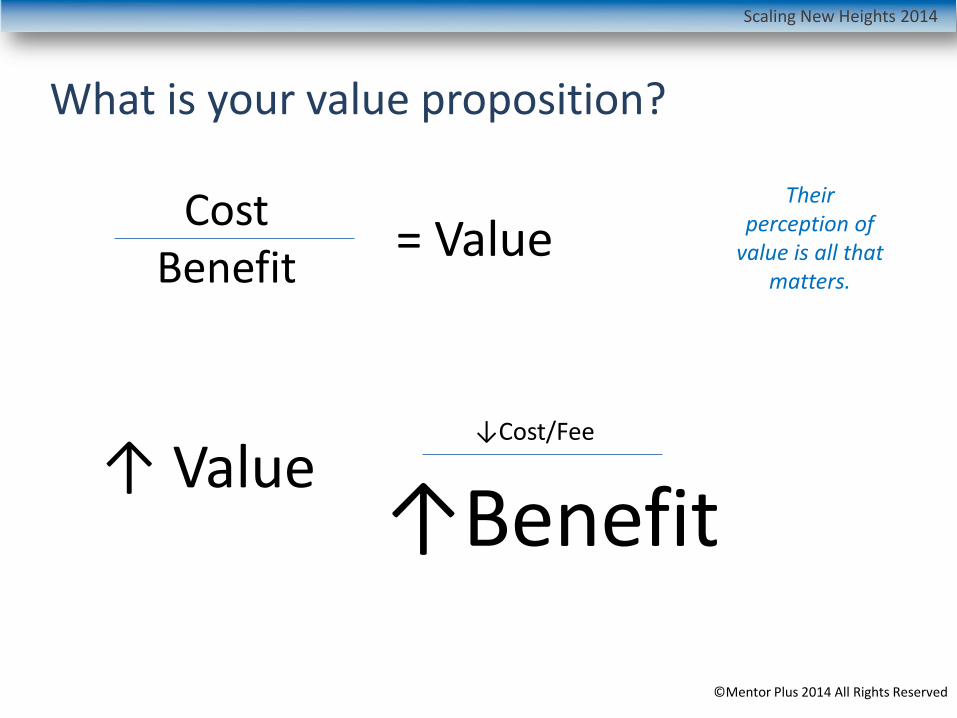
What is your value proposition?
Scaling New Heights 2014
©Mentor Plus 2014 All Rights Reserved
Cost Benefit = Value
↓Cost/Fee
↑ Value ↑Benefit
Their perception of
value is all that matters.
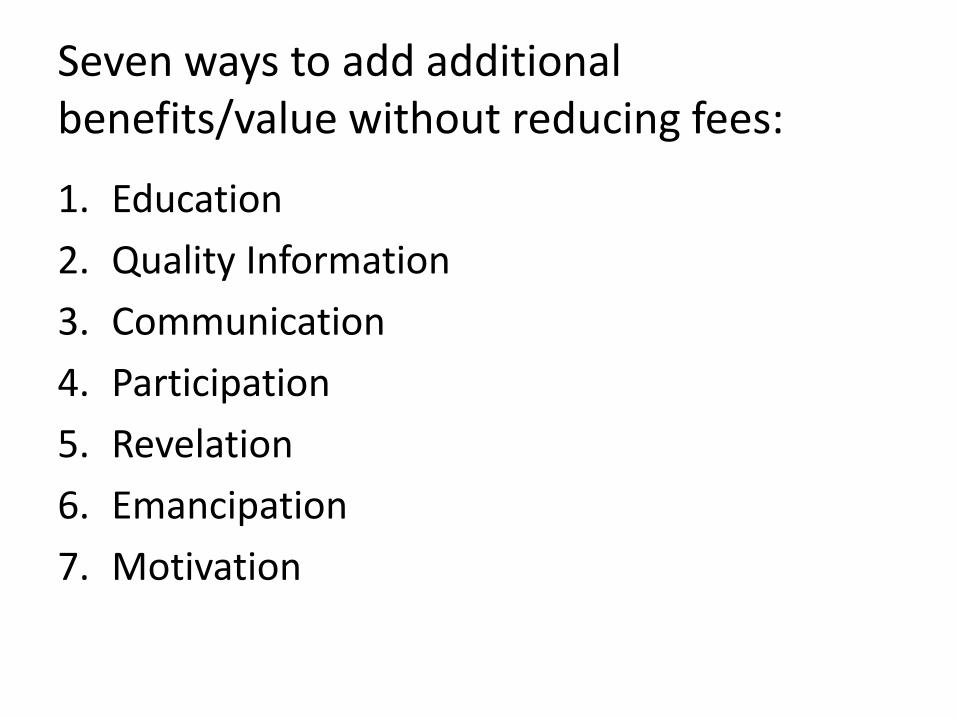
Seven ways to add additional benefits/value without reducing fees:
1. Education 2. Quality Information 3. Communication 4. Participation 5. Revelation 6. Emancipation 7. Motivation

No More Random Acts of Consulting!
Move up the value chain from Hindsight, to providing cloud based Oversight, delivering value added Insight, and mission critical Foresight.

Level 1 Technical Foundation • Bookkeeping • Tax Return • Audit - Review • Accounting
Level 2a & 2b Thorough Analysis •Level 2a: Analyze & Educate clients about Critical Ratios
•Level 2b: Conduct What If scenarios
Level 3 Future Focus • Help clients set
goals and associated strategies for improvement
Level 4 Link to Performance •Link financial goals with business activities
•Measure outcomes of business activities
Level 5 Continuous Improvement •Help clients monitor critical activities and strategically manage business activities
The Mentor Plus®
Level 5 Service Continuum
Accuracy Relevance

Strategic Intelligence
Data Information Knowledge Wisdom
Level 5 Decision Support
Manual Data Gathering
General Ledger & Other Info Systems
Excel Input
Analytics
Excel Flash Reports & Planners
$COPE IT! Software
Line of Sight Feedback
People X Process
Activities
Collect Organize Analysis Apply
Strategically Oriented Decision Making
? ©Mentor Plus 2014 All Rights Reserved
Accuracy Relevance
Accuracy Vs. Relevance Service Centric Vs. Client Centric
Scaling New Heights 2014
©Mentor Plus 2014 All Rights Reserved
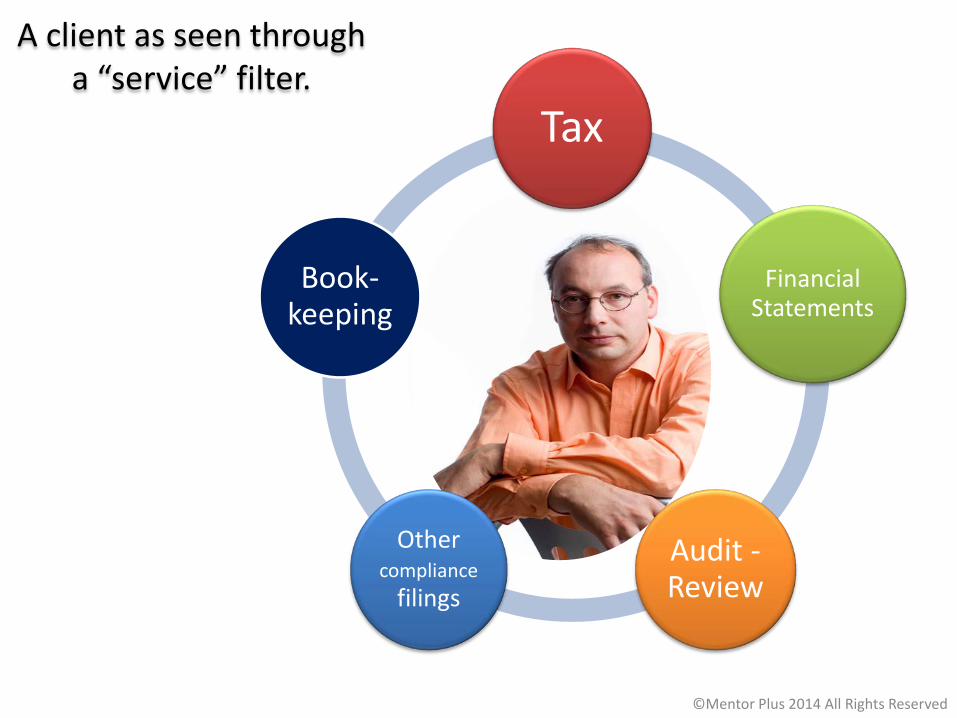
Tax
Financial Statements
Audit - Review
Other compliance
filings
Book-keeping
A client as seen through a “service” filter.
©Mentor Plus 2014 All Rights Reserved
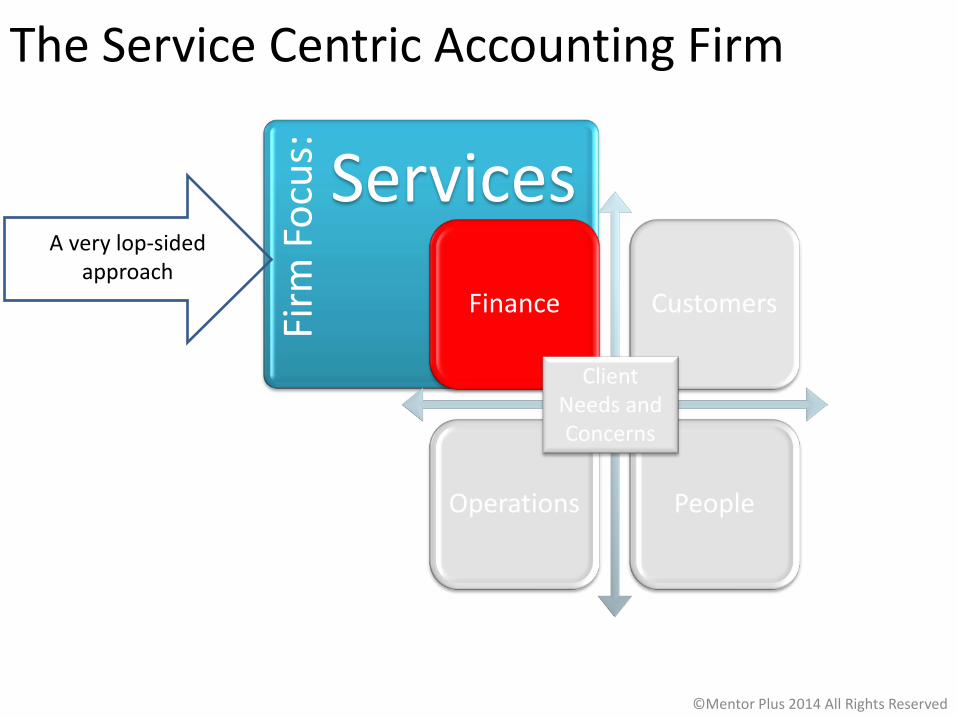
Firm
Foc
us:
Services
The Service Centric Accounting Firm
Finance Customers
Operations People
Client Needs and Concerns
A very lop-sided approach
©Mentor Plus 2014 All Rights Reserved

When all you have is a hammer, all your problems look like a nail.
author unknown
©Mentor Plus 2014 All Rights Reserved

What keeps him up at night?
Create Raving Fans
Manage cash flow and make a
healthy profit
Deliver a quality
product or service in a
timely manner
Hire and retain good
people, Develop the leadership
team
How much more can we grow given our current capacity? If I made a profit where is my cash? We seem to be working harder but making less money, why? How do I get my people focused on the right things? Should I raise my prices? How do I grow my managers? I’m working too many hours, where do I cut back? How will I fund my retirement? I’d like to take a year off to go sailing, am I crazy? My dad worked himself to death, how do I avoid his fate? What is my business worth? Is it even saleable?
©Mentor Plus 2014 All Rights Reserved

Firm
Foc
us: Client
Finance Customers
Operations People
Client Needs and Concerns
The Client Centric Accounting Firm
A more balanced approach
©Mentor Plus 2014 All Rights Reserved

Data Information Knowledge Wisdom
Collection Organization Verification Interpretation Justification Application
Lagging Indicators Leading Indicators Providing Historical Information Improve the Quality of Information Accountant - Scorekeeper Coach Service Centric Client Centric
Client Centric Firms have Made The Transition
From Compliance To RelianceSM
Client Perception of Value
Service Continuum
Performance Management Traditional Accounting
Traditional Allocation of Time
Tim
e - V
alue
My name is Will B. NextGen
How Does Your Company Keep Score?
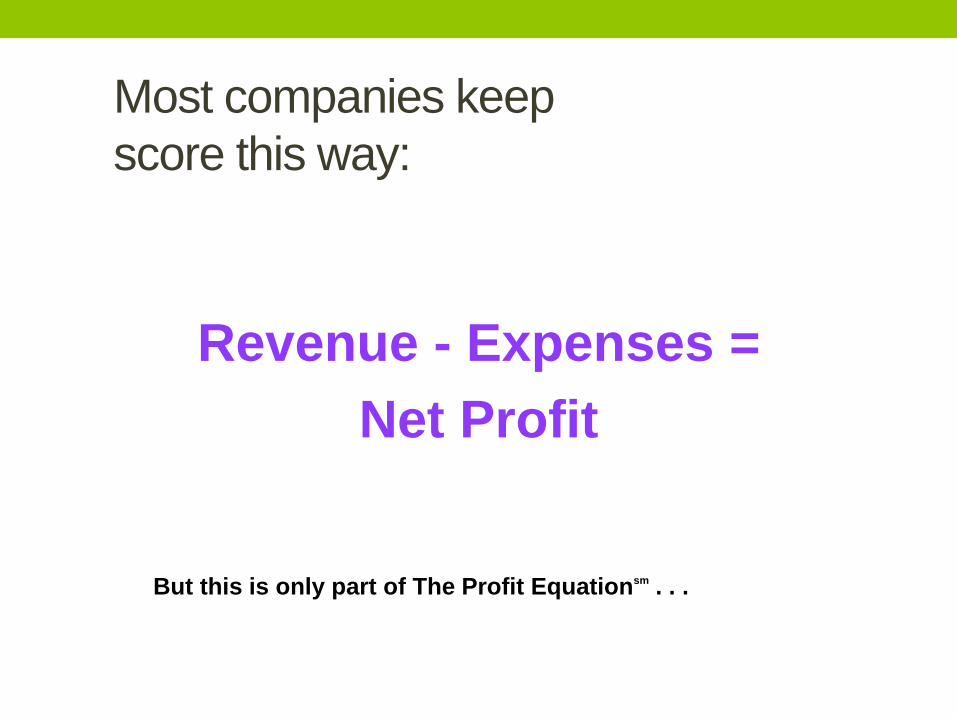
Most companies keep score this way:
Revenue - Expenses = Net Profit
But this is only part of The Profit Equationsm . . .
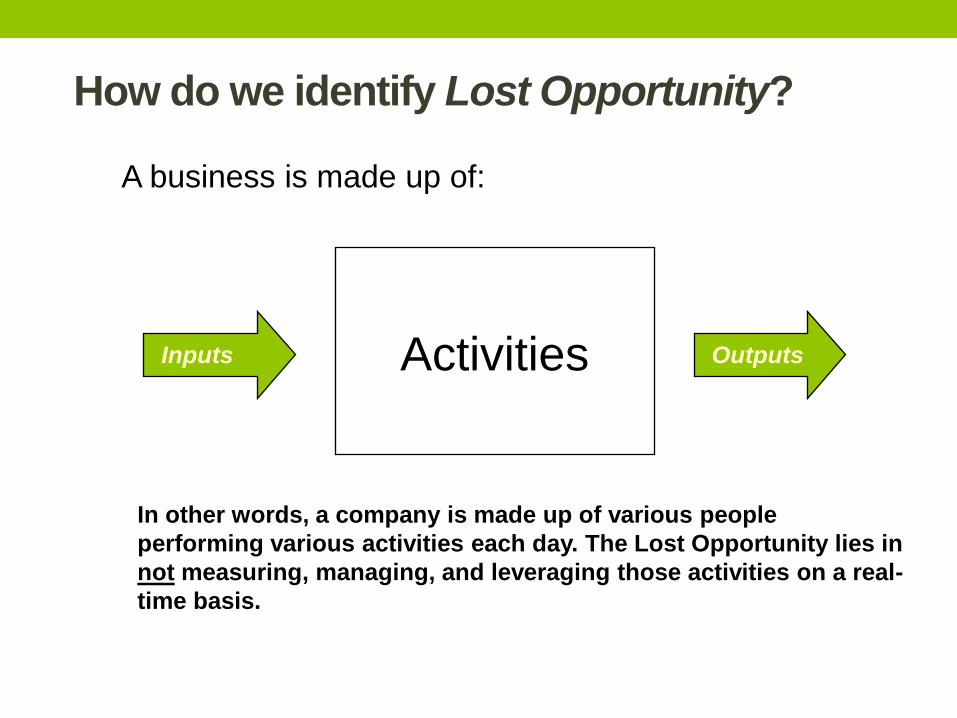
How do we identify Lost Opportunity?
A business is made up of:
Inputs Outputs
People X Process In other words, a company is made up of various people performing various activities each day. The Lost Opportunity lies in not measuring, managing, and leveraging those activities on a real-time basis.
Activities

Truth #1 Your company’s profitability depends on how well your people consistently perform specific activities.
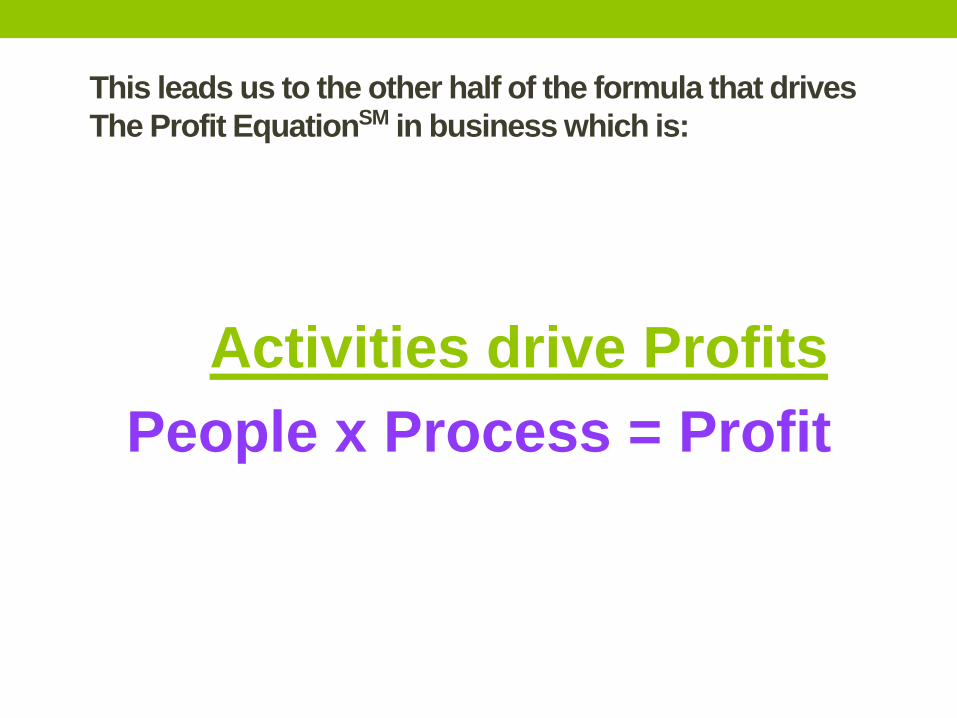
This leads us to the other half of the formula that drives The Profit EquationSM in business which is:
Activities drive Profits People x Process = Profit
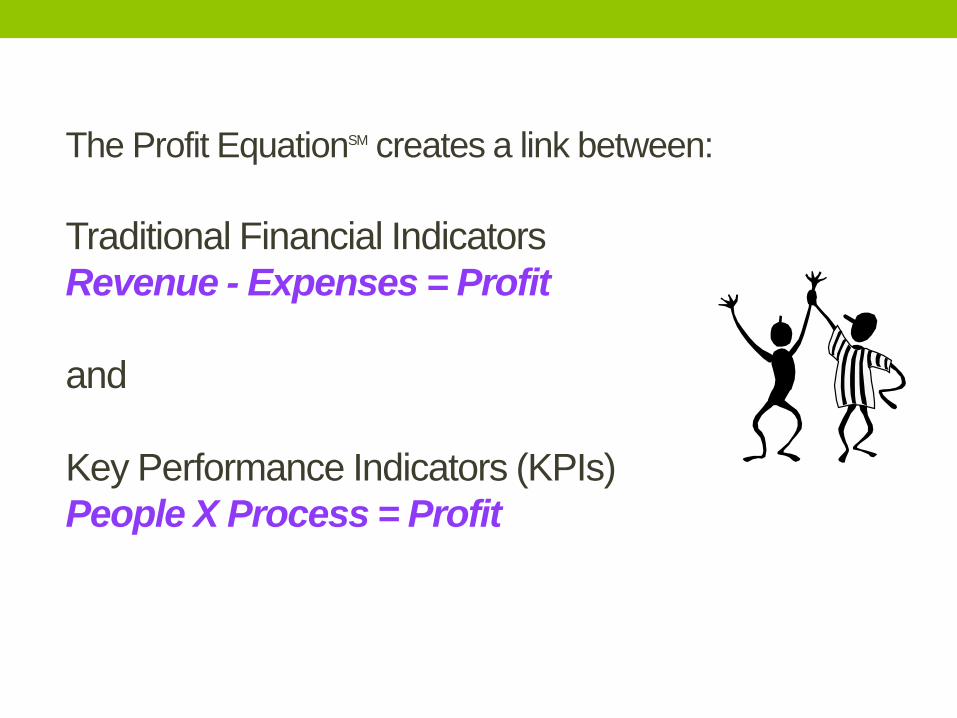
The Profit EquationSM creates a link between: Traditional Financial Indicators Revenue - Expenses = Profit and Key Performance Indicators (KPIs) People X Process = Profit
In doing so, we can provide you with better information to make critical decisions. And… provide real-time feedback to your team about its performance.
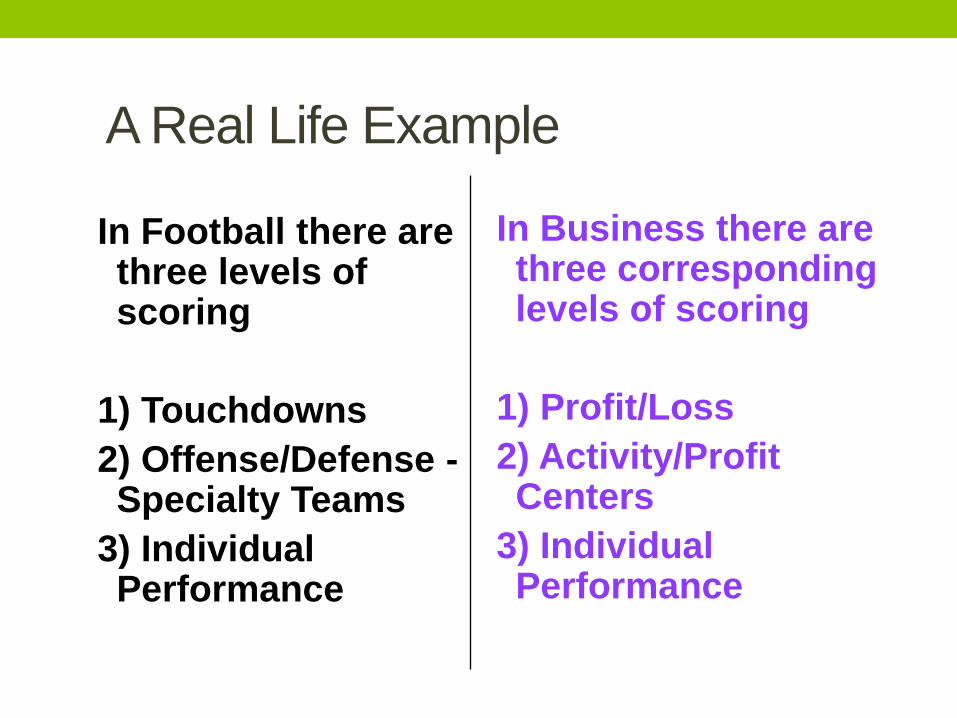
A Real Life Example
In Football there are three levels of scoring
1) Touchdowns 2) Offense/Defense - Specialty Teams
3) Individual Performance
In Business there are three corresponding levels of scoring
1) Profit/Loss 2) Activity/Profit Centers
3) Individual Performance
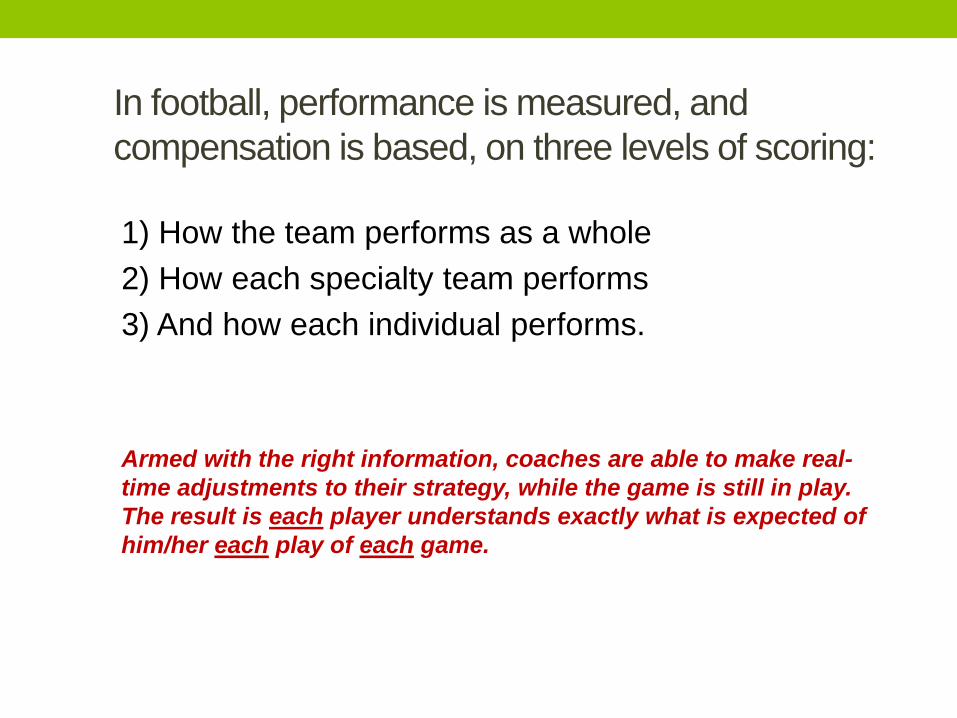
In football, performance is measured, and compensation is based, on three levels of scoring:
1) How the team performs as a whole 2) How each specialty team performs 3) And how each individual performs.
Armed with the right information, coaches are able to make real-time adjustments to their strategy, while the game is still in play. The result is each player understands exactly what is expected of him/her each play of each game.
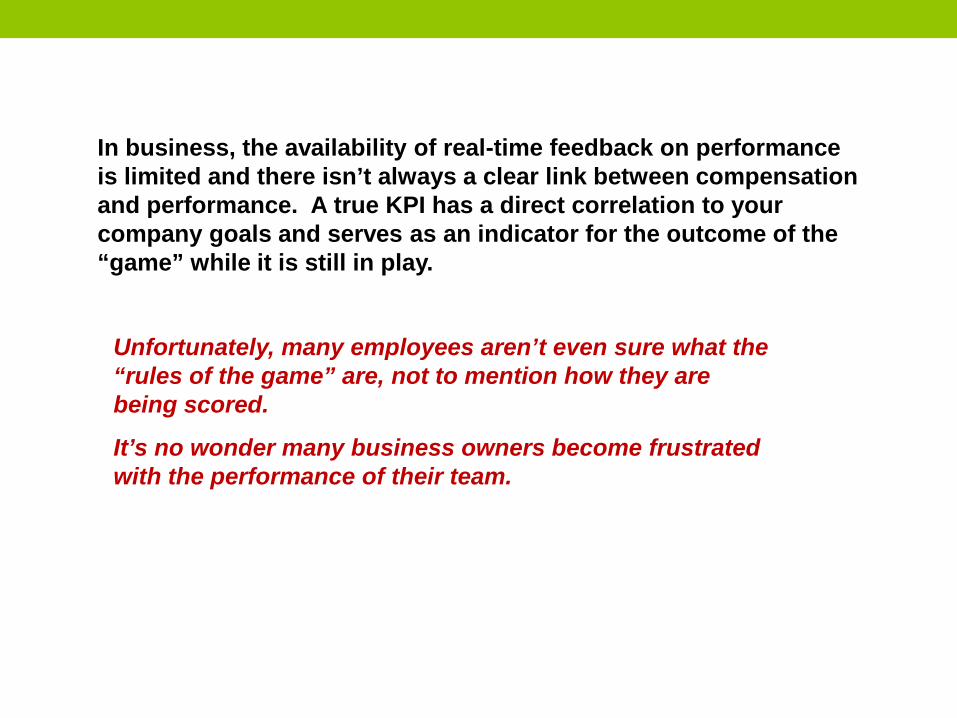
In business, the availability of real-time feedback on performance is limited and there isn’t always a clear link between compensation and performance. A true KPI has a direct correlation to your company goals and serves as an indicator for the outcome of the “game” while it is still in play.
Unfortunately, many employees aren’t even sure what the “rules of the game” are, not to mention how they are being scored.
It’s no wonder many business owners become frustrated with the performance of their team.
Truth #2 People perform best when they understand the “rules of play” and the scoring method is clear.
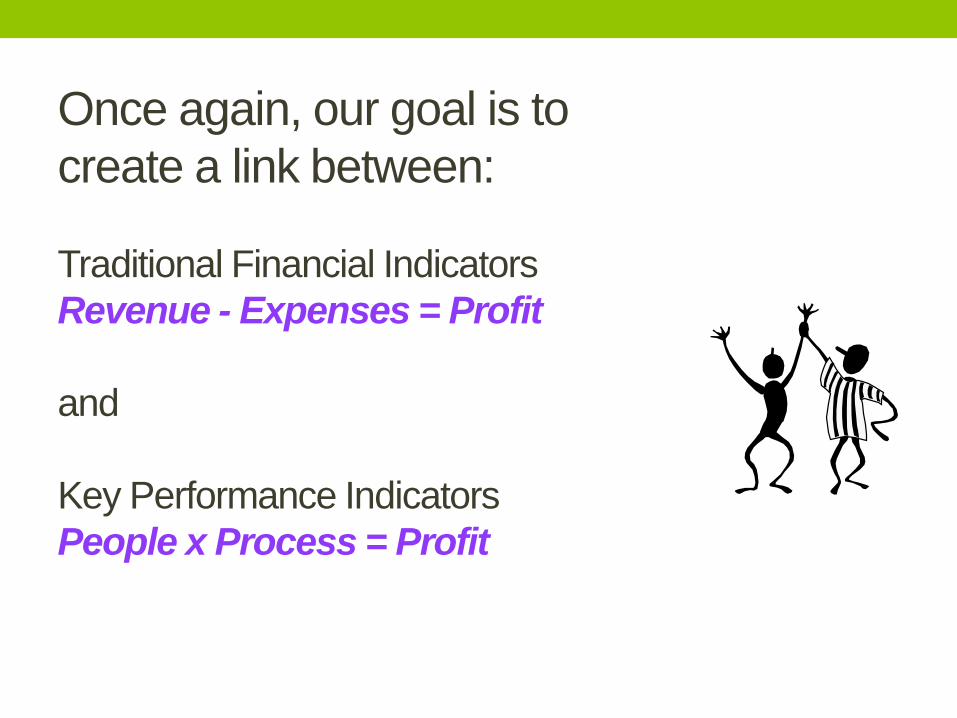
Once again, our goal is to create a link between: Traditional Financial Indicators Revenue - Expenses = Profit and Key Performance Indicators People x Process = Profit
The benefits for doing so are quite compelling.
Let’s take a look . . .
Truth #3 Small incremental changes in key areas (activities) can have a profound effect on the bottom line.
Four key areas to be measured in business could be: 1) Finance 2) Customers 3) Operations 4) People
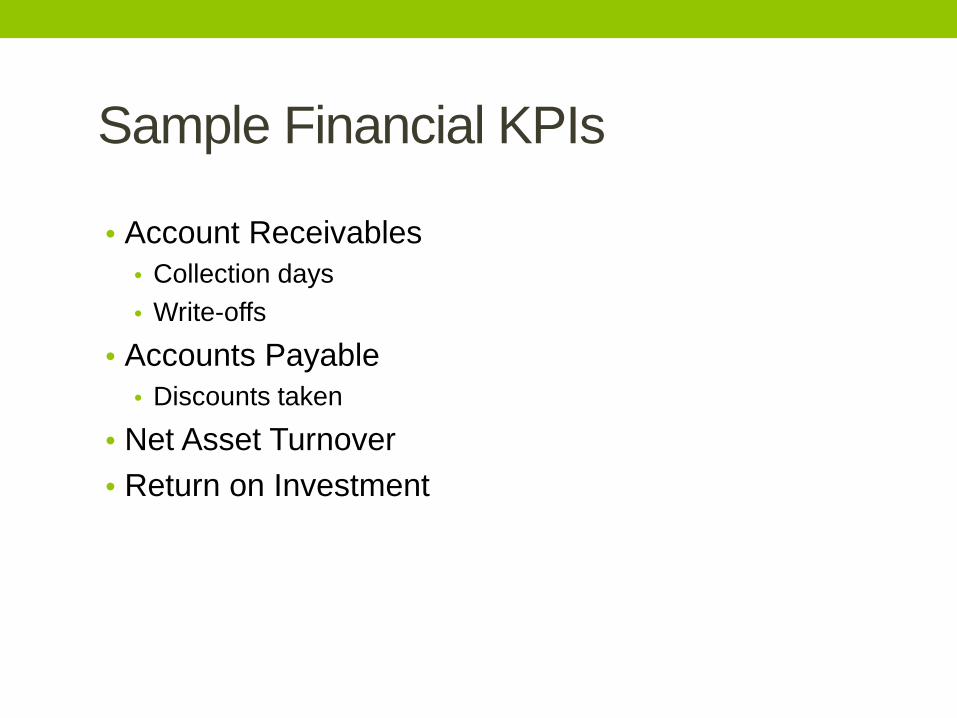
Sample Financial KPIs
• Account Receivables • Collection days • Write-offs
• Accounts Payable • Discounts taken
• Net Asset Turnover • Return on Investment
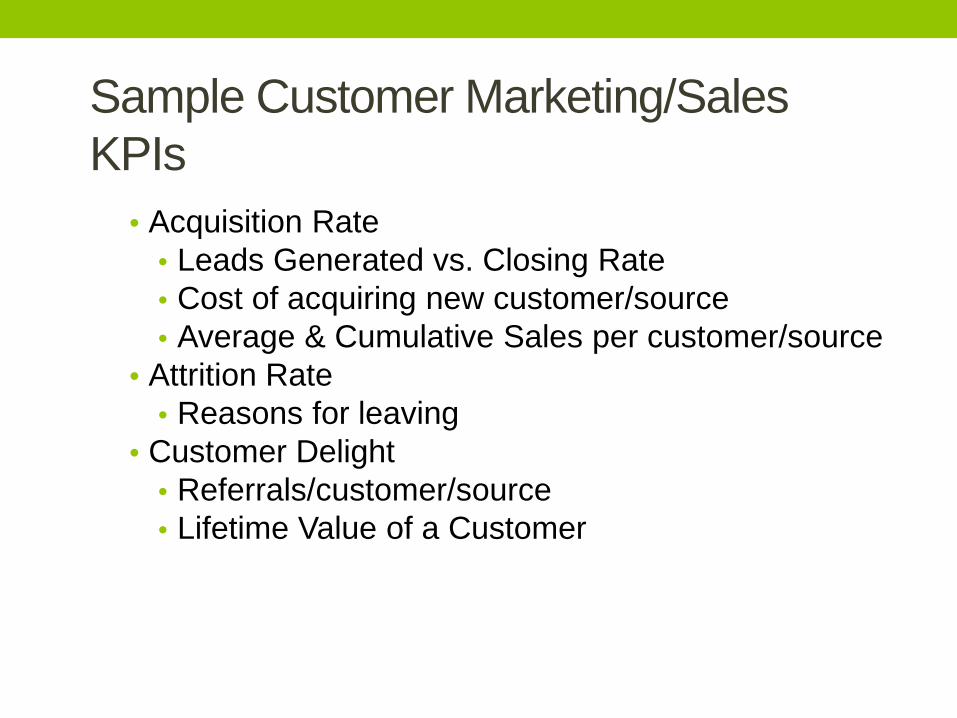
Sample Customer Marketing/Sales KPIs
• Acquisition Rate
• Leads Generated vs. Closing Rate • Cost of acquiring new customer/source • Average & Cumulative Sales per customer/source
• Attrition Rate • Reasons for leaving
• Customer Delight • Referrals/customer/source • Lifetime Value of a Customer
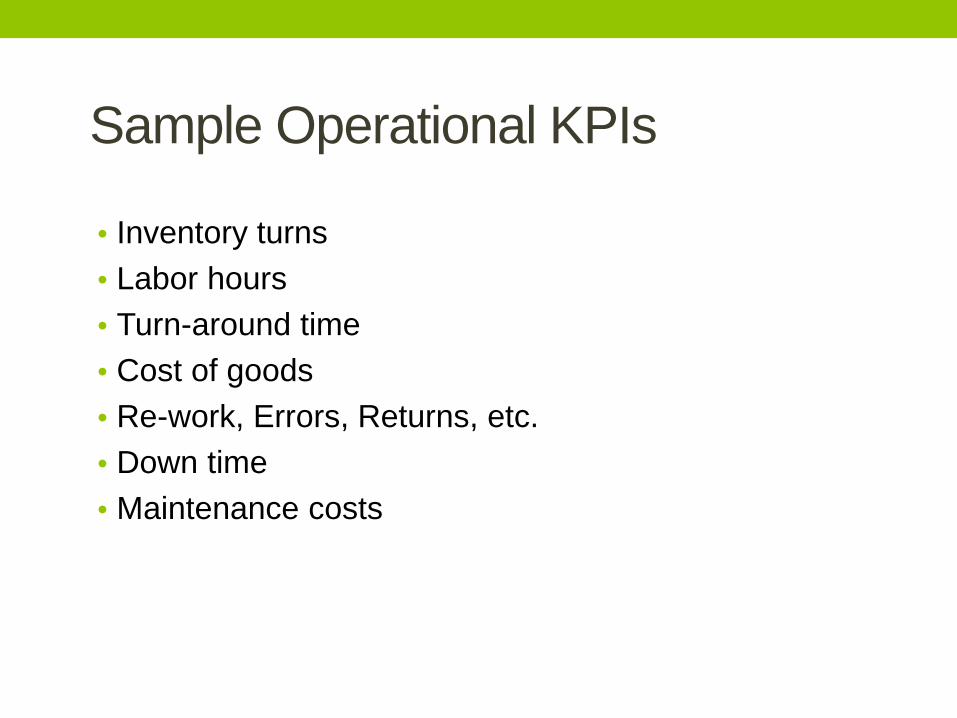
Sample Operational KPIs
• Inventory turns • Labor hours • Turn-around time • Cost of goods • Re-work, Errors, Returns, etc. • Down time • Maintenance costs
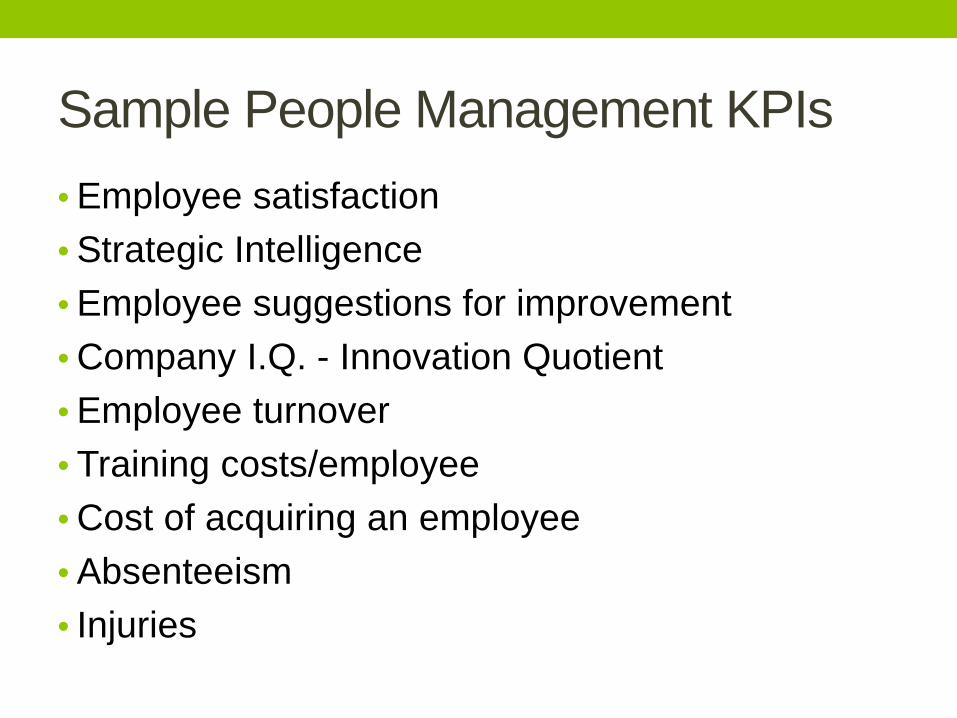
Sample People Management KPIs • Employee satisfaction • Strategic Intelligence • Employee suggestions for improvement • Company I.Q. - Innovation Quotient • Employee turnover • Training costs/employee • Cost of acquiring an employee • Absenteeism • Injuries
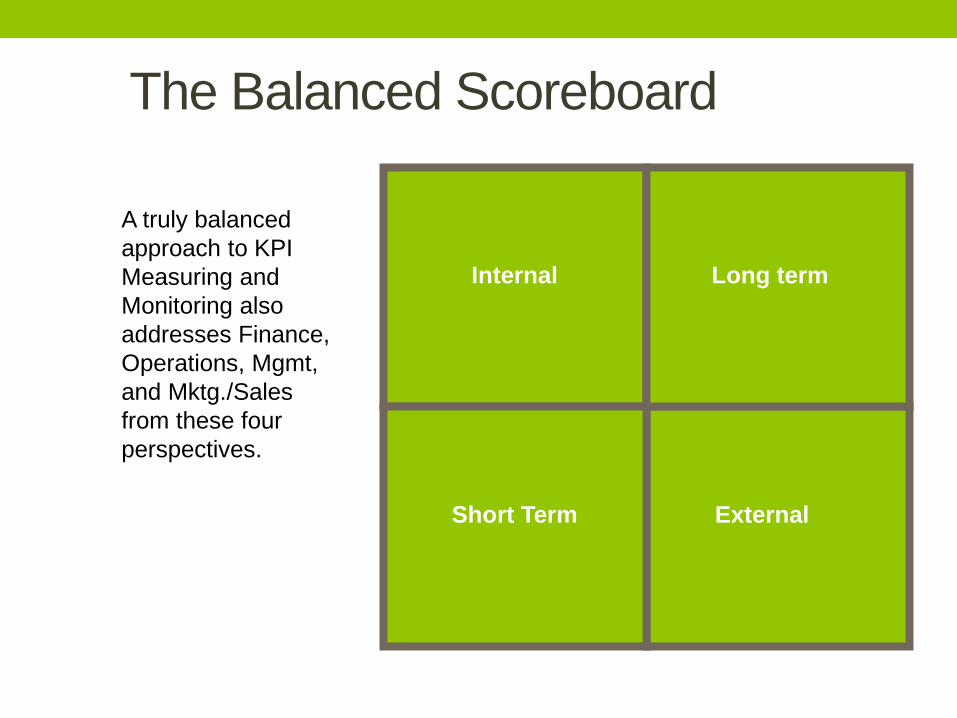
The Balanced Scoreboard
A truly balanced approach to KPI Measuring and Monitoring also addresses Finance, Operations, Mgmt, and Mktg./Sales from these four perspectives.
Short Term External
Internal Long term
Finance
Short Term
External
Internal Long term
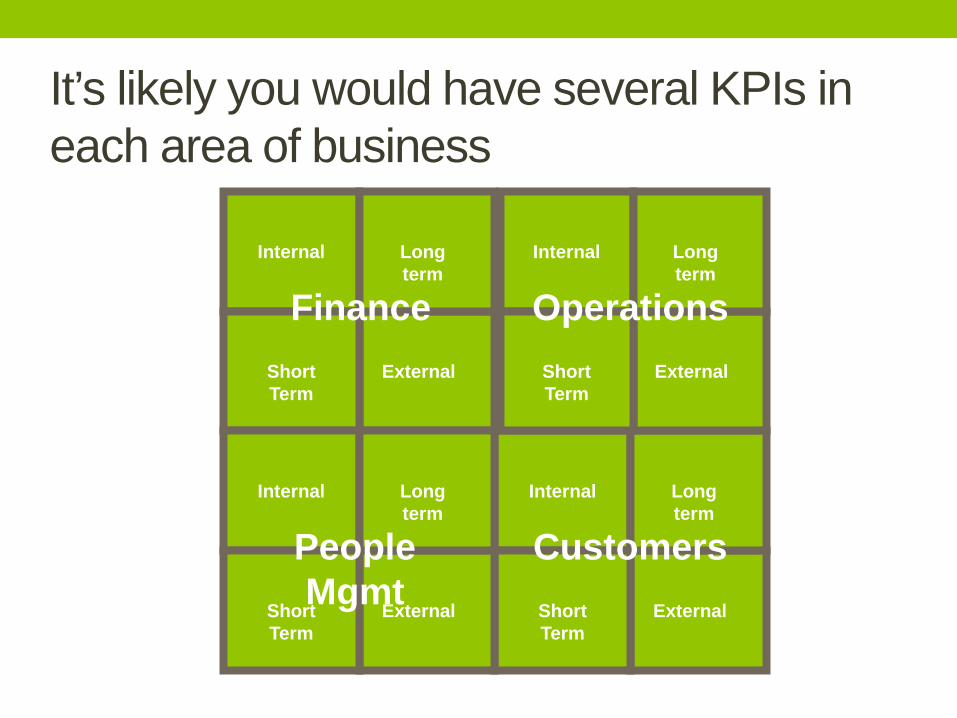
It’s likely you would have several KPIs in each area of business
Finance
Short Term
External
Internal Long term
Finance
Customers Finance
Short Term
External
Internal Long term
Finance
Short Term
External
Internal Long term
Operations
People Mgmt
Various KPIs are monitored on different cycles
• Some weekly • Some monthly • Some quarterly • Some annually
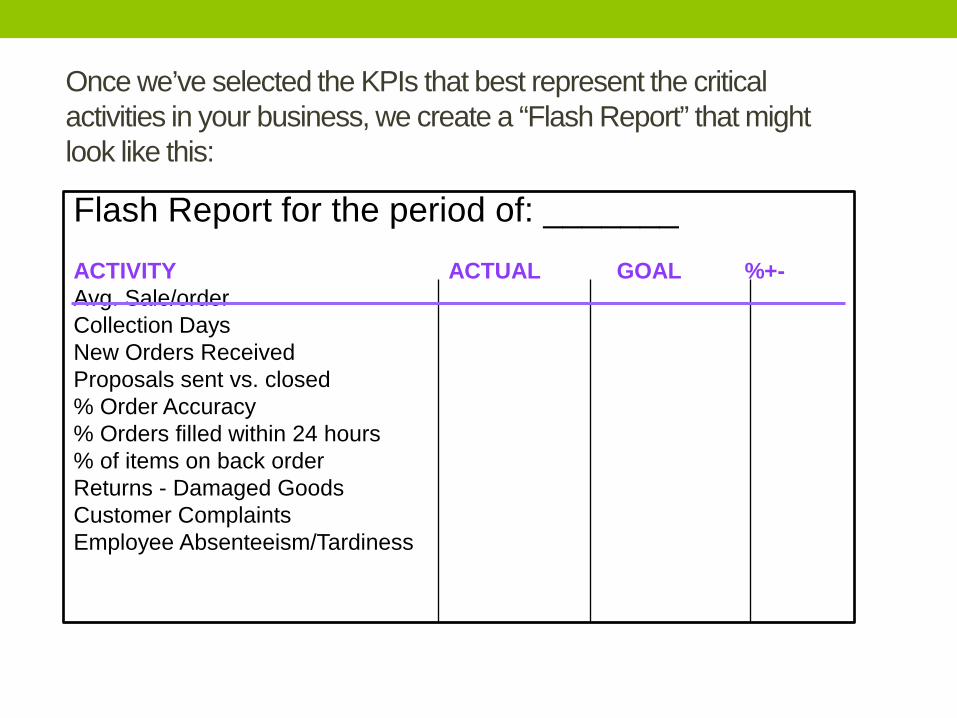
Once we’ve selected the KPIs that best represent the critical activities in your business, we create a “Flash Report” that might look like this:
Flash Report for the period of: _______ ACTIVITY ACTUAL GOAL %+- Avg. Sale/order Collection Days New Orders Received Proposals sent vs. closed % Order Accuracy % Orders filled within 24 hours % of items on back order Returns - Damaged Goods Customer Complaints Employee Absenteeism/Tardiness
No More Lop-sided Coaching
Balanced Scoreboard =
Better Decision Support
Armed with better information ...
Now it’s time to engage and empower the team to improve the numbers.
Here are the Four Steps to make that happen ...
Simply put, when we identify the Key Performance Indicators for each area of business and educate the team about the link between their performance and the financial realities of the business, we will have taken the first step toward Business Literacy. In doing so, we establish new, measurable standards of performance to which everyone can adhere.
Step #1 - Explain the “Rules of Play”

The team needs regular and consistent feedback about their performance. Without this, they will cease to care.
Step #2 - Post the Score
It may take some time for changes to appear on the bottom line and not every effort will have an immediate, discernable result, but it’s important to recognize the effort along the way.
Step #3 - Recognize Effort
Rather than giving arbitrary raises and bonuses, now you can reward your team based on real performance measures. In doing so, you’ll find your team ready, willing, and able to support your overall business goals.
Step #4 - Reward Improvement
The final truth about business: What gets measured gets done. What gets rewarded gets done again. Measurement drives performance
Discussion: How does this apply to your business?
• How does your company keep score? • Is it based on the performance of the company as a whole?
• Is it based on the performance of specialty teams within the company?
• Is it based on individual contributions? • What measures do you currently track? • How do you share them with the team? • Are they linked to compensation?
Take Away Tools
• Chart of Account Analysis • How Does Your Company Keep Score ppt
Scaling New Heights 2014
©Mentor Plus 2014 All Rights Reserved
Wrap-up
• Accuracy vs. Relevance – Chart of Account Analysis
• Teach them about their business • Inspire them to be better business owners • Increase employee engagement
Scaling New Heights 2014
©Mentor Plus 2014 All Rights Reserved
Your questions?
My question: What will you take away from this
session?
Scaling New Heights 2014 San Antonio, Texas
©Mentor Plus 2014 All Rights Reserved