Embed Size (px)
Citation preview

1Analytics for GEOSS :: GEO Plenary 2012 :: ©2012 Peter Baumann
Adding Big Earth Data Analytics
to GEOSS
GEO IX Plenary
Foz do Iguacu, 2012-nov-20
Peter Baumann, Stefano Nativi
Jacobs University Germany, CNR Italy
[gamingfeeds.com]
Research funded through EU FP7 283610 EarthServer –
European Scalable Earth Science Service Environment

3Analytics for GEOSS :: GEO Plenary 2012 :: ©2012 Peter Baumann
Features & Coverages
The basis of all: geographic feature
• = abstraction of a real world phenomenon [OGC, ISO]
• associated with a location relative to Earth
Special kind of feature: coverage
• Typical representative: raster image
• ...but there is more!
Typically, Big Data are coverages

4Analytics for GEOSS :: GEO Plenary 2012 :: ©2012 Peter Baumann
„Big Data“: The 4 Vs
Volume
Velocity
Variety
Veracity
[M. Stonebraker and IBM]

5Analytics for GEOSS :: GEO Plenary 2012 :: ©2012 Peter Baumann
Raster Data Volume
Social Networks
• Incidence matrix of size 10^8 x 10^8 ...now do linear algebra!
Satellite Imagery
• ngEO plannings: 10^12 images under ESA custody
HPC
• „Even with multi-terabyte local disk sub-systems and multi-petabyte archives, I/O can
become a bottleneck in HPC.“
• -- Jeanette Jenness, LLNL, ASCI-Project, 1998
• „Users download 10x more data than needed“
• -- Kerstin Kleese van Dam, 2002
6Analytics for GEOSS :: GEO Plenary 2012 :: ©2012 Peter Baumann
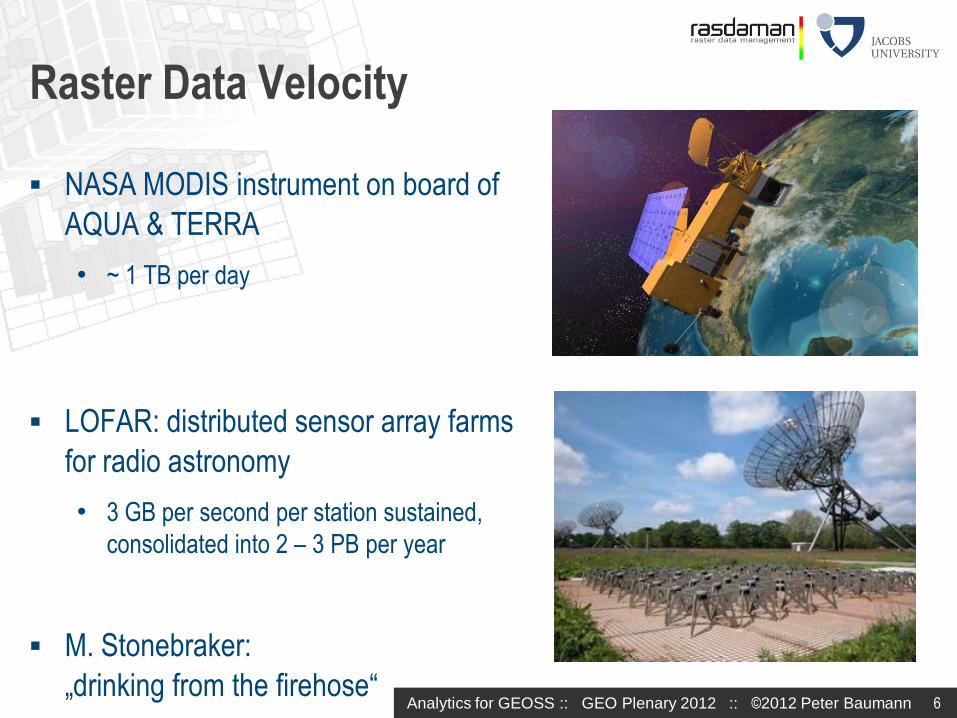
Raster Data Velocity
NASA MODIS instrument on board of
AQUA & TERRA
• ~ 1 TB per day
LOFAR: distributed sensor array farms
for radio astronomy
• 3 GB per second per station sustained,
consolidated into 2 – 3 PB per year
M. Stonebraker:
„drinking from the firehose“

7Analytics for GEOSS :: GEO Plenary 2012 :: ©2012 Peter Baumann
Sensor, image, model, & statistics data
• Life Science: Pharma/chem, healthcare / bio research, bio statistics, genetics, ...
• Geo: Geodesy, geology, hydrology, oceanography, meteorology, earth system, ...
• Engineering & research: Simulation & experimental data in automotive/shipbuilding/
aerospace industry, turbines, process industry, astronomy, high energy physics, ...
• Management/Controlling: Decision Support, OLAP, Data Warehousing, census,
statistics in industry and public administration, ...
• Multimedia: e-learning, distance learning, prepress, ...
„80% of all data have some spatial connotation“ [C&P Hane, 1992]
Raster Data Variety

8Analytics for GEOSS :: GEO Plenary 2012 :: ©2012 Peter Baumann
MultiSolid
Coverage
n-D "space/time-varying phenomenon"
• [ISO 19123, OGC 09-146r2]
Raster Data Variety: Coverages
«FeatureType»AbstractCoverage
MultiPoint
Coverage
MultiCurve
Coverage
MultiSurface
Coverage
Grid
Coverage
Referenceable
GridCoverage
Rectified
GridCoverage

9Analytics for GEOSS :: GEO Plenary 2012 :: ©2012 Peter Baumann
Raster Data Veracity
Both measured and computed data need to
carry quality information as part of provenance
Sometimes established (costly!) procedures
for error estimation, sometimes not
Ex: Satellite image processing, from L0 to L2
• Many quality criteria determined, but hardwired
• error propagation by far not always customary
What to do with this information?
• Complicates life of data consumer dramatically!
[l2gen, bitmask for ocean color]

10Analytics for GEOSS :: GEO Plenary 2012 :: ©2012 Peter Baumann
Let’s Take a Closer Look... Remember? „Users download 10x more data than needed“
[Kerstin Kleese van Dam, 2002]
t
Divergent access patterns for ingest and retrieval
Server must mediate between access patterns

11Analytics for GEOSS :: GEO Plenary 2012 :: ©2012 Peter Baumann
[Diedrich et al 2001]
Use Case:
Satellite ImageTime Series
12Analytics for GEOSS :: GEO Plenary 2012 :: ©2012 Peter Baumann
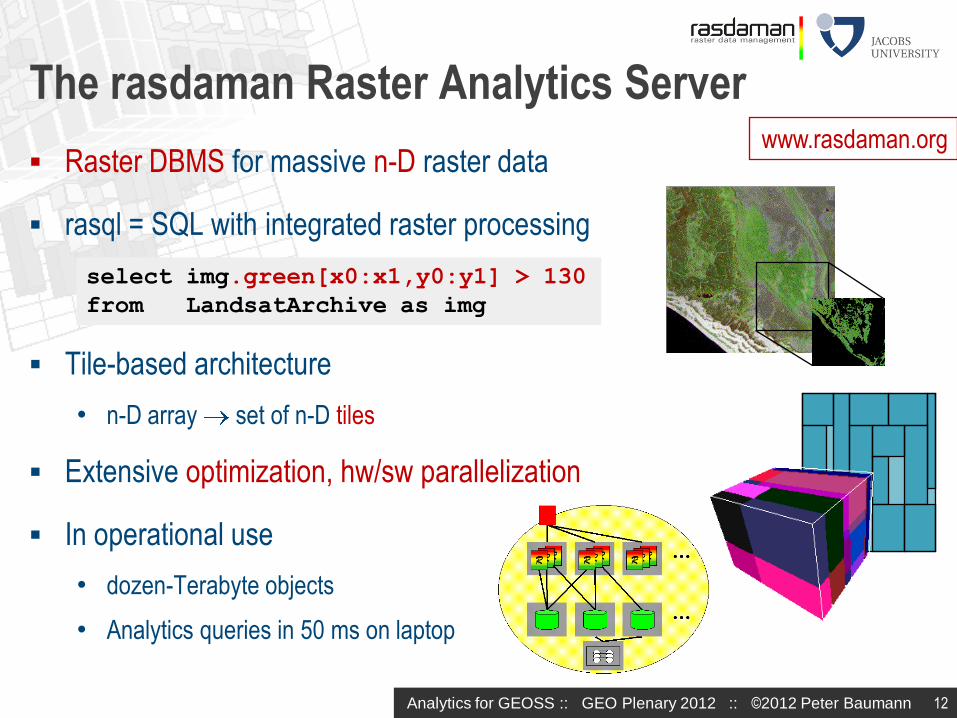
Raster DBMS for massive n-D raster data
rasql = SQL with integrated raster processing
•
Tile-based architecture
• n-D array set of n-D tiles
Extensive optimization, hw/sw parallelization
In operational use
• dozen-Terabyte objects
• Analytics queries in 50 ms on laptop
The rasdaman Raster Analytics Server
select img.green[x0:x1,y0:y1] > 130
from LandsatArchive as img
www.rasdaman.org

13Analytics for GEOSS :: GEO Plenary 2012 :: ©2012 Peter Baumann
Heterogeneous federation / cloud
• Can optimize for data location,
transport volume, node load, ...
Work in progress
select
encode(
( (A.nir - A.red) / (A.nir + A.red)
- (B.nir - B.red) / (B.nir + B.red)
), “HDF5“ )
from A, B
array A
select
encode(
(B.nir - B.red) / (B.nir + B.red),
“array-compressed“ )
from B
select
encode(
(A.nir - A.red) / (A.nir +A.red),
“array-compressed“ )
from A
Query Processing in a Federation
Array B
[Owonibi 2012]

14Analytics for GEOSS :: GEO Plenary 2012 :: ©2012 Peter Baumann
Raster Query Language: ad-hoc navigation, extraction, aggregation, analytics
Time series
Image processing
Summary data
Sensor fusion
& pattern mining
What Raster Analytics Offers

15Analytics for GEOSS :: GEO Plenary 2012 :: ©2012 Peter Baumann
Ex: Climate Data Service
[MEEO 2012]

16Analytics for GEOSS :: GEO Plenary 2012 :: ©2012 Peter Baumann
3D Clients: Experiments
Problem: coupling DB / visualization
Approach:
• deliver RGBA image to X3D client,
transparency as height
• Feed directly into client GPU
select
encode(
{ red: (char) s.b7[x0:x1,x0:x1],
green: (char) s.b5[x0:x1,x0:x1],
blue: (char) s.b0[x0:x1,x0:x1],
alpha: (char) scale( d, 20 )
},
"png"
)
from SatImage as s, DEM as d [JacobsU, Fraunhofer 2012]
17Analytics for GEOSS :: GEO Plenary 2012 :: ©2012 Peter Baumann
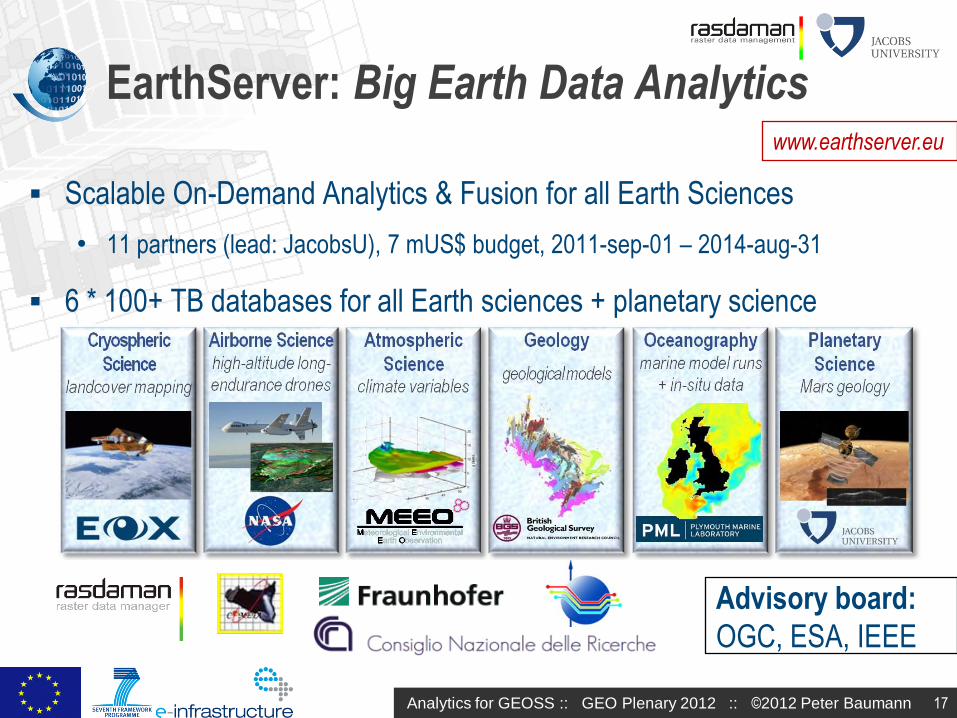
EarthServer: Big Earth Data Analytics
Scalable On-Demand Analytics & Fusion for all Earth Sciences
• 11 partners (lead: JacobsU), 7 mUS$ budget, 2011-sep-01 – 2014-aug-31
6 * 100+ TB databases for all Earth sciences + planetary science
www.earthserver.eu
Advisory board:
OGC, ESA, IEEE
18Analytics for GEOSS :: GEO Plenary 2012 :: ©2012 Peter Baumann
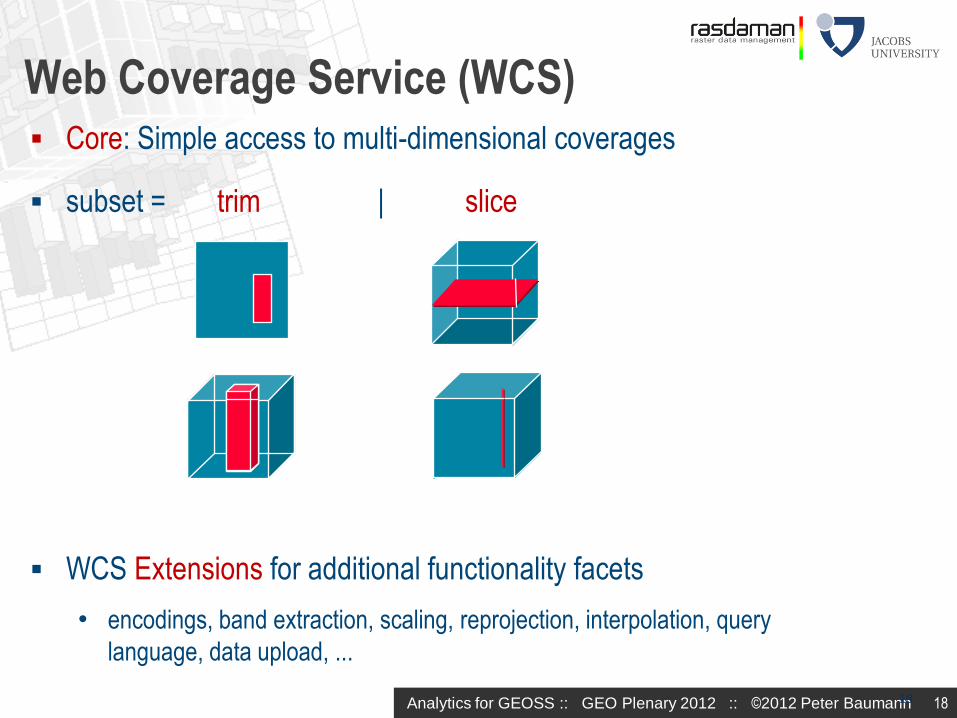
Web Coverage Service (WCS) Core: Simple access to multi-dimensional coverages
subset = trim | slice
WCS Extensions for additional functionality facets
• encodings, band extraction, scaling, reprojection, interpolation, query
language, data upload, ...
18

19Analytics for GEOSS :: GEO Plenary 2012 :: ©2012 Peter Baumann
SWE O&M and SOS (+ friends):
specialized for sensor acquisition, some complexity
→ upstream acquisition
GMLCOV and WCS (+WCPS):
simple, uniform schema for all coverages; scalable; versatile processing
→ downstream services
coverageserver
O&M+
SensorML
GMLCOV+
WCS
Semantic Web
Integration of OGC WCS and SWE

20Analytics for GEOSS :: GEO Plenary 2012 :: ©2012 Peter Baumann
Propose EarthServer platform, rasdaman, as contribution to CGI
Flexible ad-hoc processing & filtering
• Working „in situ“on existing archives; no copying!
Integrated n-D coverage data / metadata search
• Smooth integration with GEOSS Broker
Scalable n-D interfaces using OGC standards
• WMS, WCS suite including WCPS, WPS
nD visual coverage client toolkit
• 1D diagrams, 2D maps, 3D data cubes, 3D timeseries sets, ...
• Dynamically composed from query results
Conclusion: Agile Analytics