Embed Size (px)
Citation preview

Page 1
ADDENDUM I
BIOPLUME III
GRAPHICS CONVERSION
TO SURFER FORMAT
Abstract
This procedure can be used to create a SURFER® compatible grid file from Bioplume III
input and output graphics. The input data and results from Bioplume III can be contoured
and printed directly from SURFER. Furthermore, SURFER can be used to export graphic
data in several formats including an AutoCad® compatible drawing exchange file (DXF)
format. To summarize this procedure:
• Using a Bioplume III utility function, model input or output can be extracted and
saved as a comma separated value (*.csv) file.
• The *.csv file is opened in Excel and pasted into the “Export.xls” worksheet
provided in this package.
• To be consistent with SURFER format the row data order is reversed.
• The user fills out four designated cells of this spreadsheet to specify the
minimum and maximum range for the x and y-axes that were used in the ground
water simulation as required by SURFER.
• The worksheet is then saved as a tab delimited ASCII file with a *.grd extension.
• This *.grd file can then be read and contoured directly by SURFER.
A Bioplume III post processor program is currently being developed by USEPA’s Center
for Subsurface Modeling Support (CSMoS). Therefore, this method should be considered
a temporary procedure to be used as a stopgap until the true post processor is available.

Page 2
Disclaimer
The information in this document has been funded wholly by the United States
Environmental Protection Agency. It has been subjected to the Agency’s review, and has
been approved for distribution. Mention of trade names or commercial products does not
constitute endorsement or recommendation for use. The software described in this
document is supplied on an “as-is” basis without guarantee or warranty of any kind,
expressed or implied. Neither the United States Government (United States Environmental
Protection Agency, National Risk Management Laboratory/Subsurface Protection and
Remediation Division), nor any of the authors accept any liability resulting from the use of
this code.
Nomenclature Used
The following conventions are used in this document. The symbol è denotes selection
of a hierarchal pull-down or menu selection. For example, to describe clicking on the File
option then on Open is simply written File è Open. Information needed from the user is
placed inside <>. For example, the prompt for you to open your file is written File è Open
<Your File Name (e.g. Hillafb1)>.
Required Software
This technique requires the following programs:
1) Bioplume III (Distributed by the U.S.E.P.A’s Center for Subsurface Modeling
Support, Ada, OK);
2) Microsoft Excel97® or later; and
3) SURFER: Version 6.4 (SURFER for Windows) is recommended. Earlier
versions of SURFER will work but the descriptions for use will not be
accurate in the text provided below.
Technique Description
Page 3
The following method can be used to extract Bioplume III two-dimensional graphical
information in a SURFER compatible grid file format. Graphical input information can be
extracted including, top elevations, bottom elevations, layer thicknesses, observed heads,
hydraulic conductivity, and observed concentrations for hydrocarbon and all electron
acceptors. After a successful Bioplume III simulation, this method can be used to extract
graphical model results. For simplification, the example shown below describes the
conversion of hydrocarbon mass transport results; however, the technique can also be
used for any of the input/output features described above.
Step 1: Creation of a *.csv Format File
Start Bioplume III and open any saved simulation (File è Open <select a file>). Go to any
two-dimensional input or output graphical file. For example, to work with a simulated
Figure 1. Example of 2D graphical output from Bioplume III showing a modeled hydrocarbon plume.

Page 4
hydrocarbon plume go to Results è Concentrations è Hydrocarbon è 2D Contours. The
graphical hydrocarbon plume might look something like Figure 1.
Next, move the mouse pointer to the upper left-hand corner of the model grid, click and
hold the left mouse button. While continuing to depress the mouse button, drag to the
lower right-hand corner of the model grid. A spreadsheet-like matrix, similar to that shown
on Figure 2, should replace part of the normal graphical display of the model grid. Click
on the “Export Data” button then save the file (e.g. Plume.csv). The *.csv file type is the
default format.
Figure 2. Results matrix generated by using the mouse to block-off the model grid.
Page 5
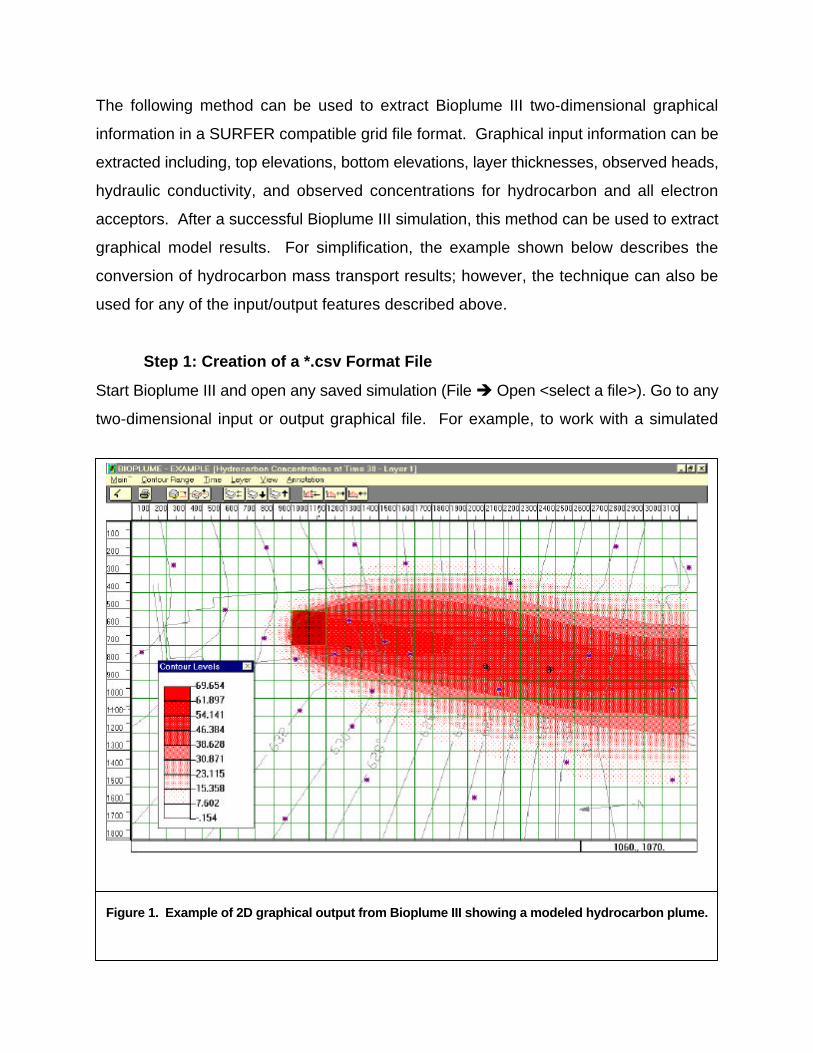
Step 2: Import *.csv File to Excel
Exit Bioplume III or minimize the screen and start Microsoft Excel97. In Excel go to File
è Open. Set the “Files of Type:” window to “All Files (*.*)”. Find and select the *.csv file
(e.g. Plume.csv) you just created (Figure 3). Note: the default directory for *.csv files will
be C:\bioplume\export, however, you could have saved this file to any directory.
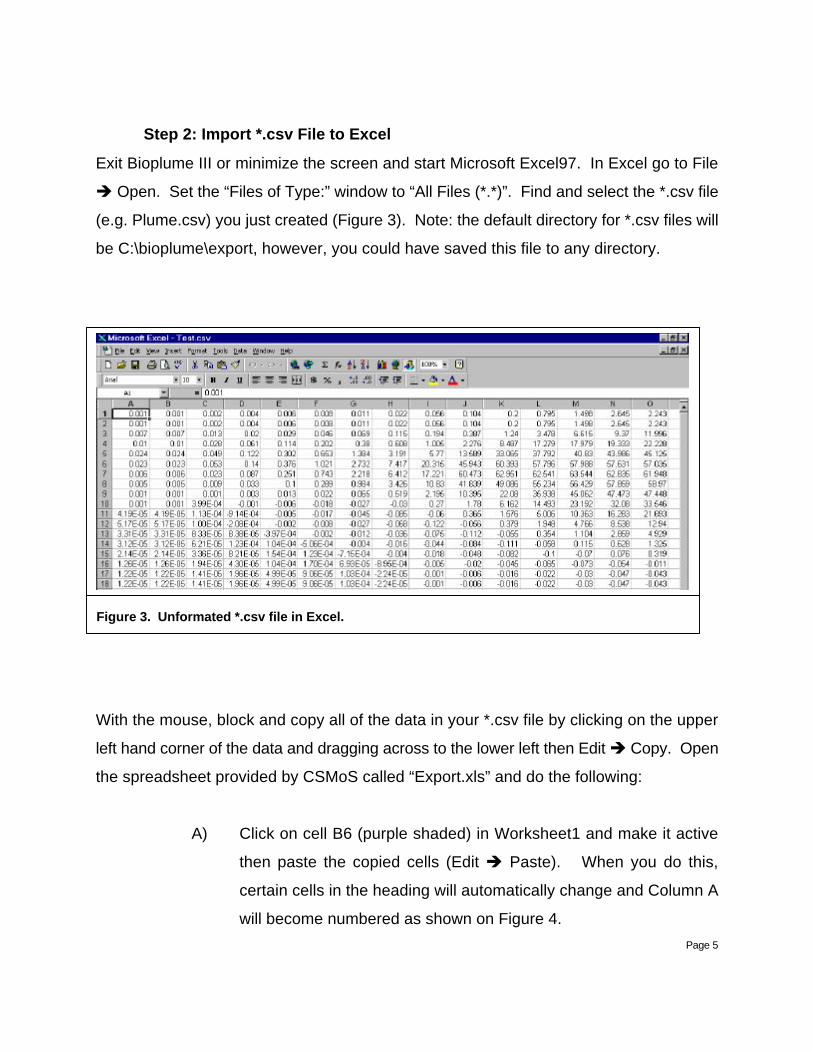
With the mouse, block and copy all of the data in your *.csv file by clicking on the upper
left hand corner of the data and dragging across to the lower left then Edit è Copy. Open
the spreadsheet provided by CSMoS called “Export.xls” and do the following:
A) Click on cell B6 (purple shaded) in Worksheet1 and make it active
then paste the copied cells (Edit è Paste). When you do this,
certain cells in the heading will automatically change and Column A
will become numbered as shown on Figure 4.
Figure 3. Unformated *.csv file in Excel.
Page 6
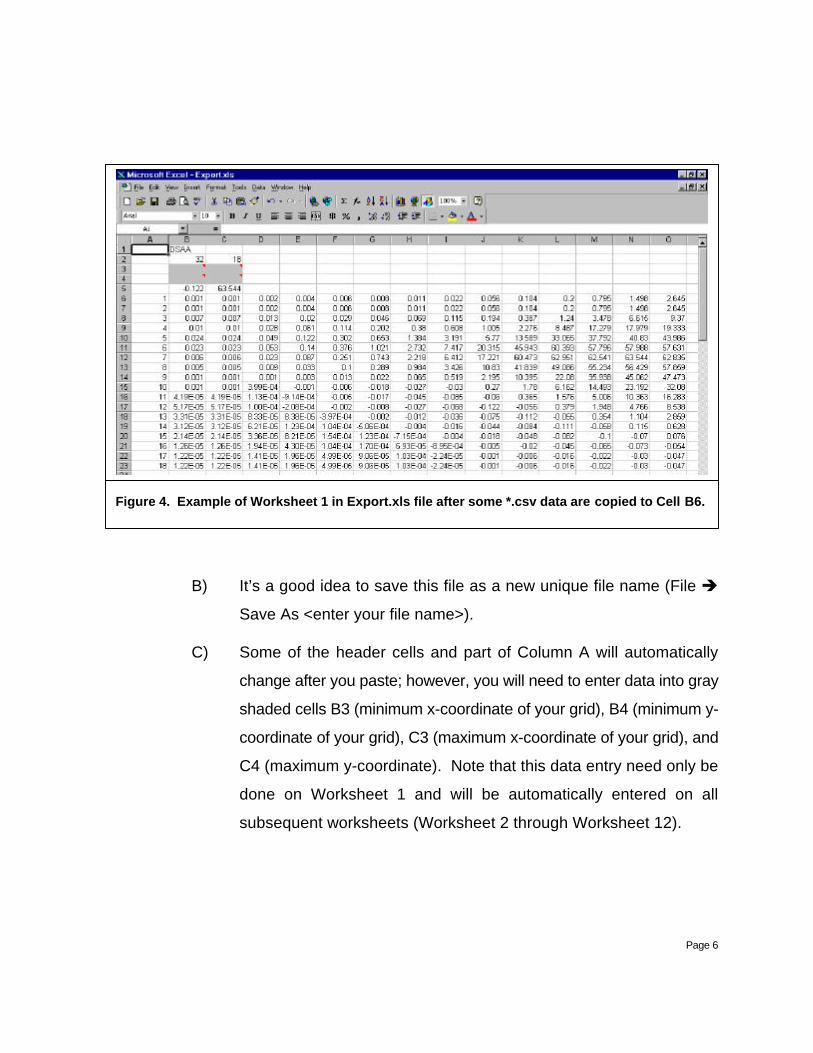
B) It’s a good idea to save this file as a new unique file name (File è
Save As <enter your file name>).
C) Some of the header cells and part of Column A will automatically
change after you paste; however, you will need to enter data into gray
shaded cells B3 (minimum x-coordinate of your grid), B4 (minimum y-
coordinate of your grid), C3 (maximum x-coordinate of your grid), and
C4 (maximum y-coordinate). Note that this data entry need only be
done on Worksheet 1 and will be automatically entered on all
subsequent worksheets (Worksheet 2 through Worksheet 12).
Figure 4. Example of Worksheet 1 in Export.xls file after some *.csv data are copied to Cell B6.

Page 7
D) The order of the grid rows needs to be reversed by sorting to be
consistent with SURFER grid file format. Using the mouse, block off
the grid portion of Worksheet1 excluding the header (Cells B1 to C5)
and go to Data è Sort. Specify “Sort By” to be Column A and specify
the sorting order to be Descending then click “OK” (Figure 5).
E) Delete Column A by clicking on the “A” column header then going to
Edit è Delete. The grid data will slide to the left and the final
spreadsheet will look like Figure 6.
F) Save the worksheet in tab delimited format by going to File è Save
As. In the “Save as Type” box select “Text (Tab Delimited)(*.txt)”. In
the “File Name” box enter a unique file name using a *.grd extension
(e.g. VOC1.grd). Be sure and specify a *.grd extension otherwise
Excel will automatically place a *.txt extension which SURFER will not
recognize. Note: Excel will give you a warning that “The selected file
Figure 5. Example of grid file after adding header data and reversing the row order by sorting
on Column A.

Page 8
type does not support notebooks that contain multiple sheets”. This
is normal, just click OK.
These steps create a SURFER compatible grid file. You can continue to export other
graphics files from Bioplume III by copying various *.csv files into cell B6 on the other
unused worksheets. When you have finished exporting graphical files save the Excel
spreadsheet in *.xls format otherwise only one worksheet will be saved and some of your
work will be lost.
Figure 7. Example of data sheet after Column A is deleted.
Page 9
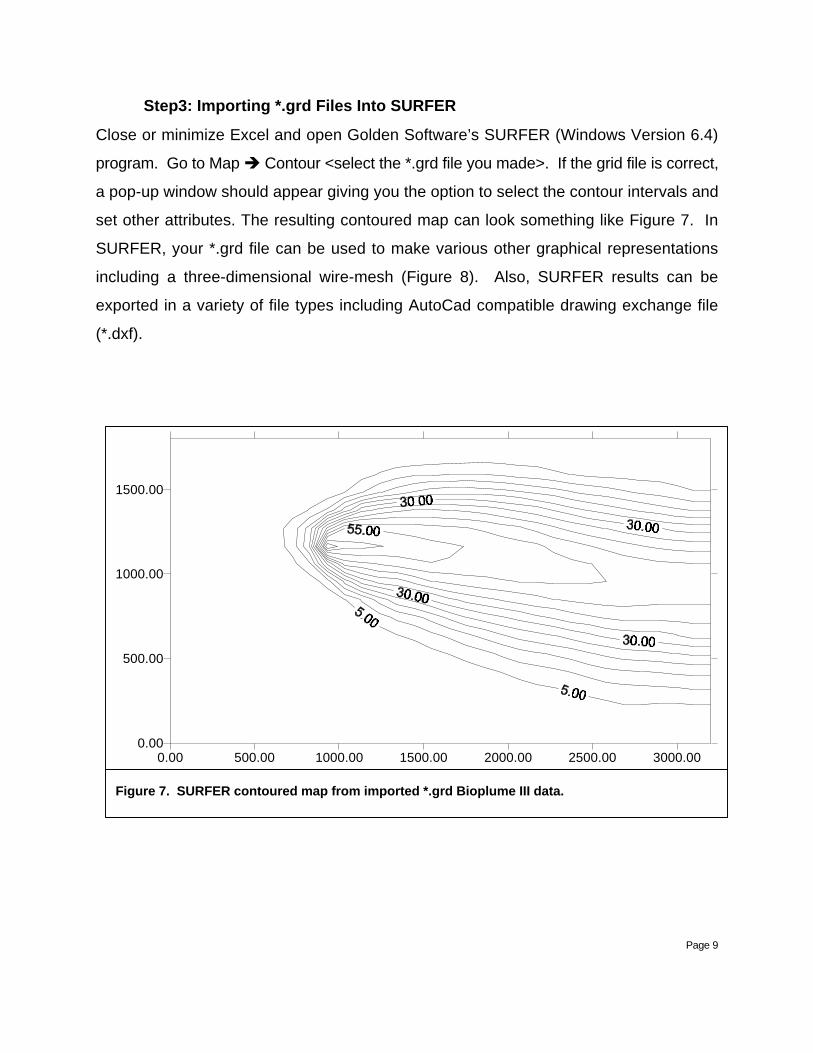
Step3: Importing *.grd Files Into SURFER
Close or minimize Excel and open Golden Software’s SURFER (Windows Version 6.4)
program. Go to Map è Contour <select the *.grd file you made>. If the grid file is correct,
a pop-up window should appear giving you the option to select the contour intervals and
set other attributes. The resulting contoured map can look something like Figure 7. In
SURFER, your *.grd file can be used to make various other graphical representations
including a three-dimensional wire-mesh (Figure 8). Also, SURFER results can be
exported in a variety of file types including AutoCad compatible drawing exchange file
(*.dxf).
0.00 500.00 1000.00 1500.00 2000.00 2500.00 3000.000.00
500.00
1000.00
1500.00
Figure 7. SURFER contoured map from imported *.grd Bioplume III data.

Page 10
Figure 8. Example wire-mesh figure from *.grd file.