Embed Size (px)
Citation preview

QUEST Project: Geoscience BC
A Short Note on the Distribution of Geochemical Elements
in Geological Formations of the QUEST Project Area
Colin T Barnett∗ Peter M Williams†
August 2009
Introduction
In an earlier report on the QUEST Project stream and lake sediment geochemistry [1], wepresented the idea of using a neural network to model the geochemistry in areas where thegeology is known from outcrop mapping, and then to apply this model to infer the bedrockgeology in non-outcropping areas. The resulting inferred geology, wherever geochemistrywas known, was almost identical to mapped geology in areas of outcrop, and blended wellwith mapped geology along the margins, where there was no geochemistry. These resultsshow that geochemistry combined with neural networks can provide a powerful tool formapping bedrock geology concealed by a veneer of glacial overburden in the QUEST projectarea.
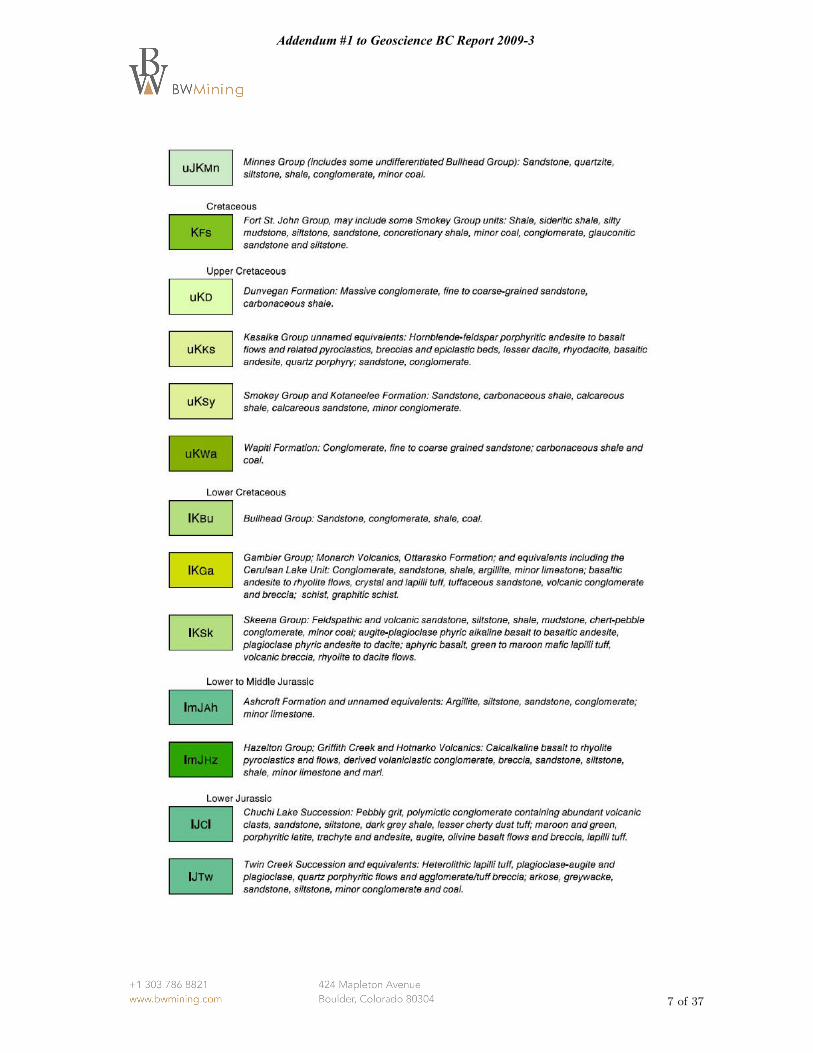
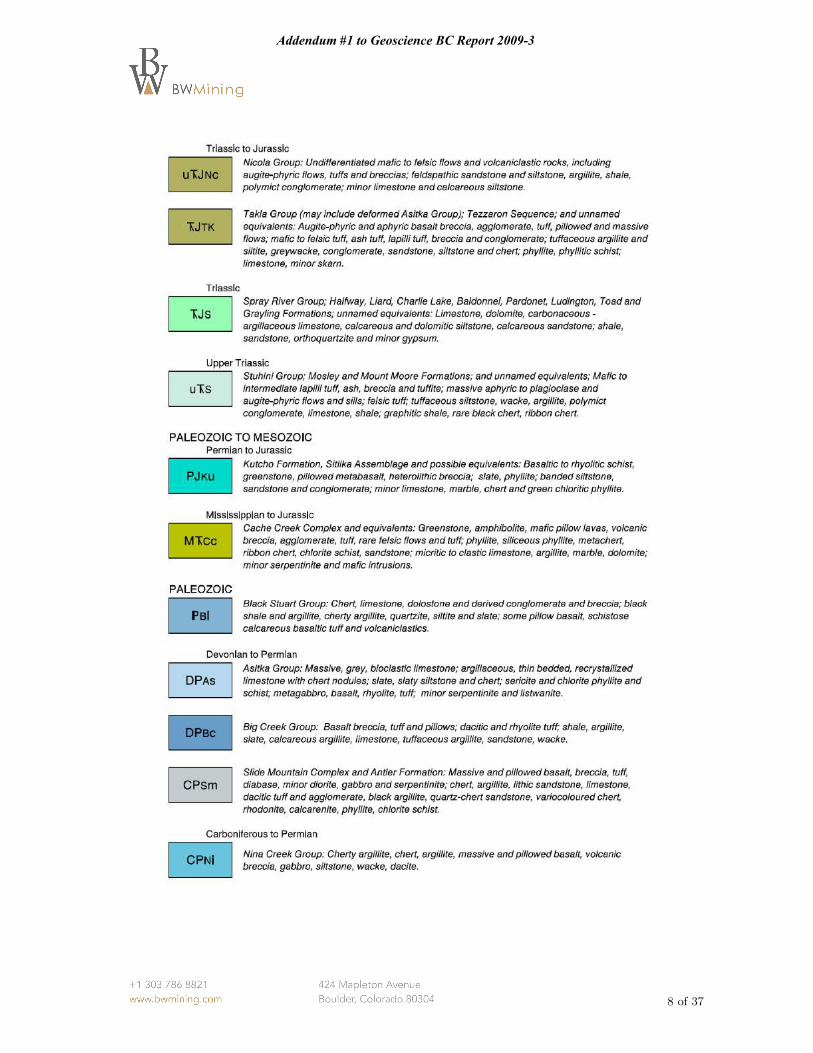
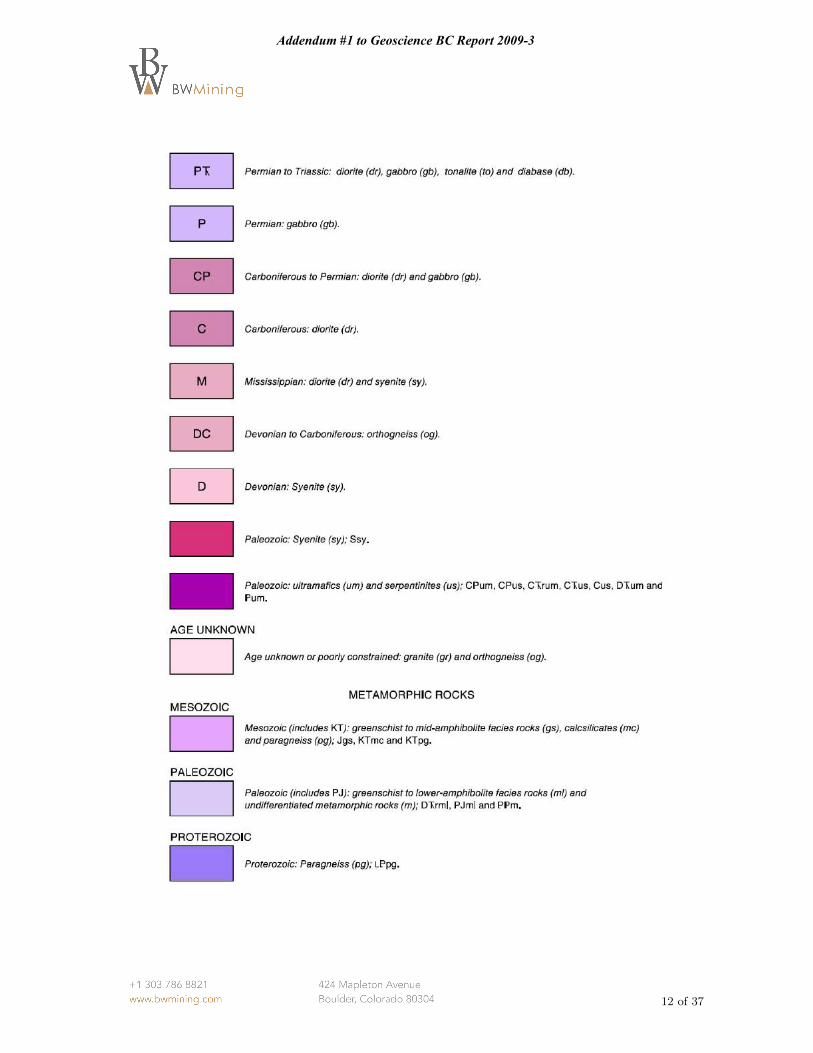
The results have been reviewed by geologists at the BC Geological Survey, and havegenerally been found to hold up well in the light of their surface mapping. In a few places,however, there were some obvious discrepancies, where the inferred bedrock geology con-flicted with the known surface geology. One of these places, for example, was in the north-centre of the QUEST Project area, midway between Fort St James and Prince George (seeFigure 4). In this place, the neural network appears to be confusing the presence of Triassicto Jurassic age Takla Group rocks with older Mississipian to Jurassic age Cache Creek rocks(see legend on Page 8).
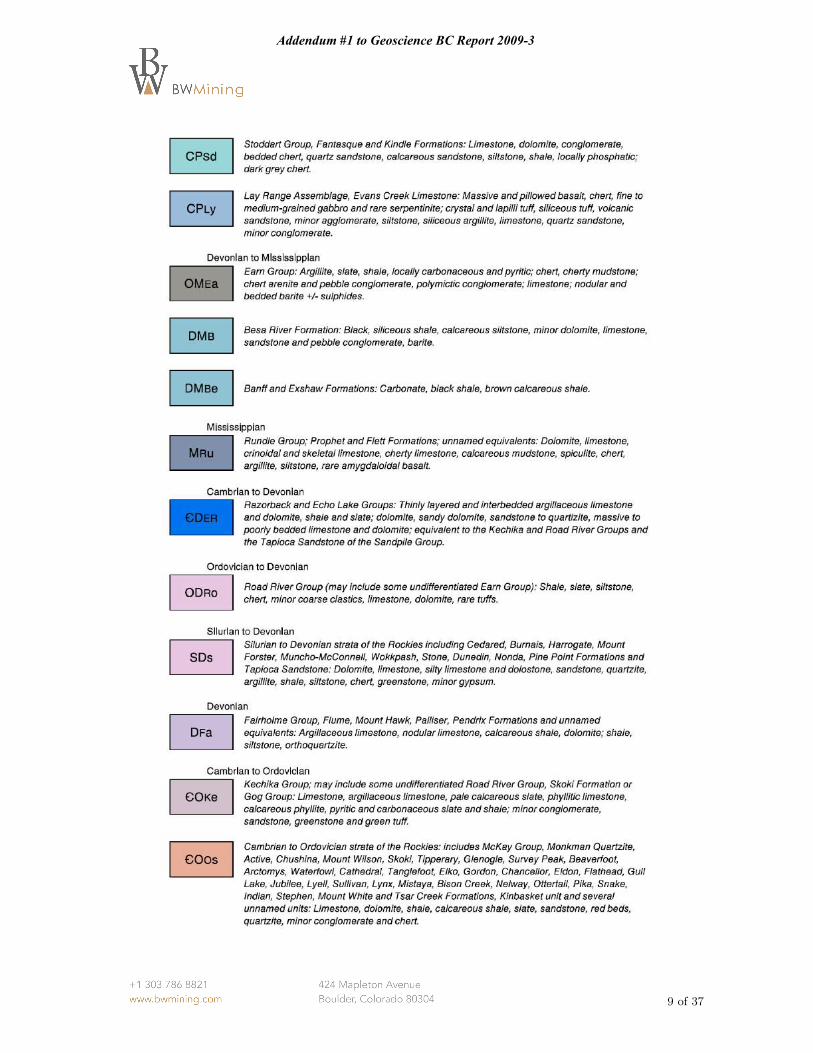
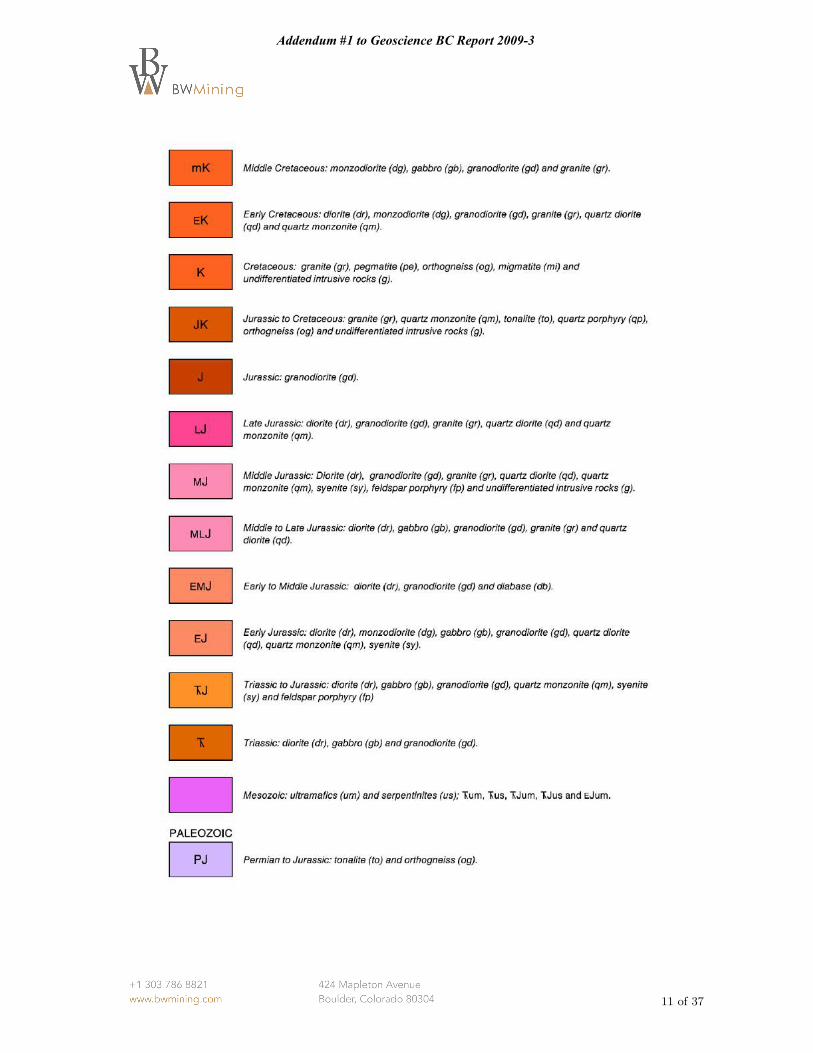
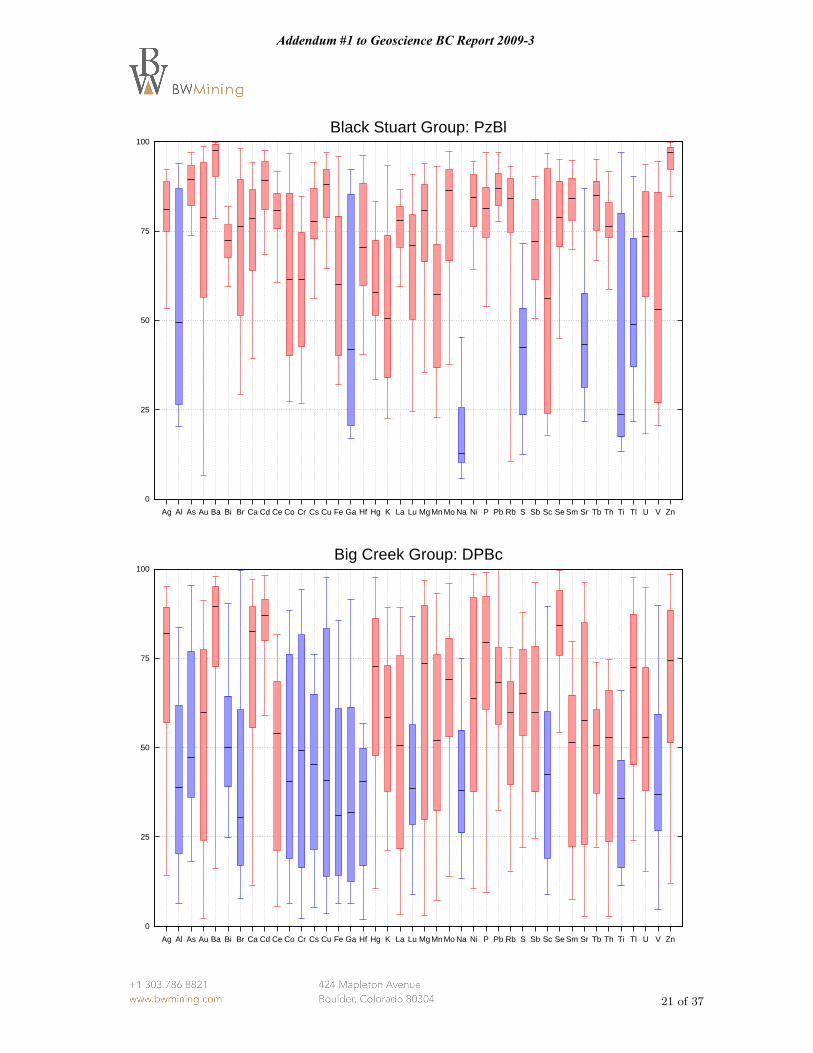
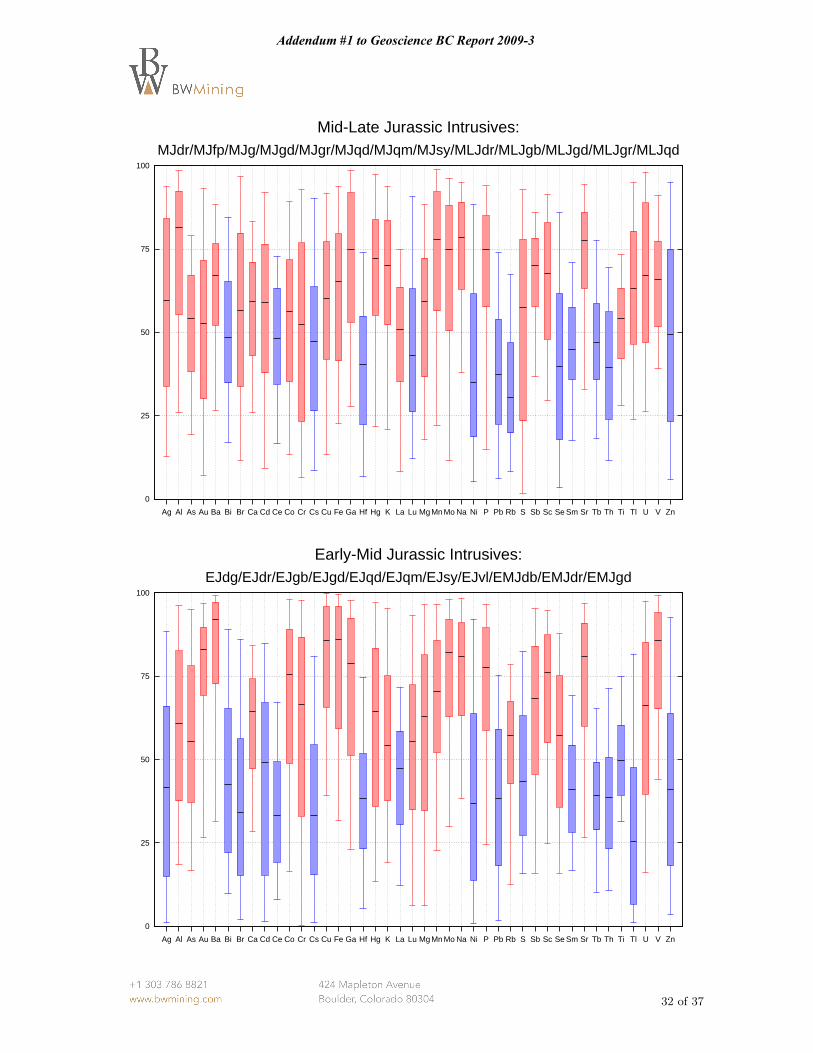
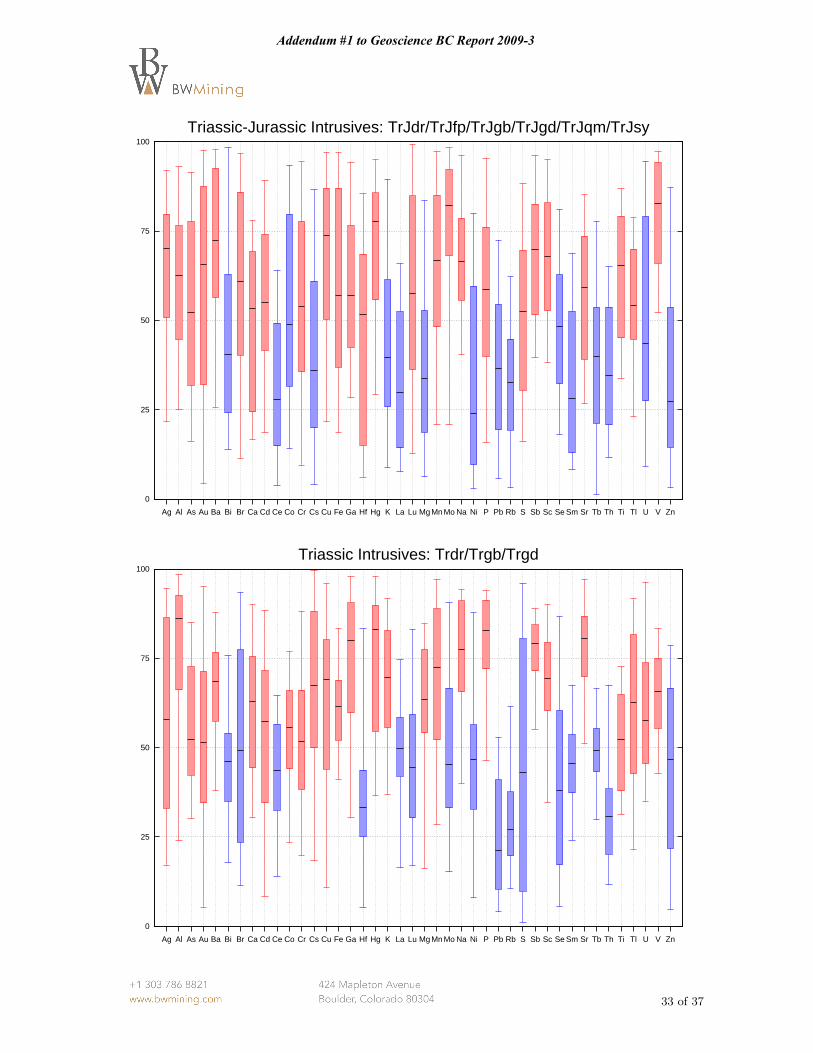
To understand how the neural network is making its predictions, we therefore decided toexamine the distributions of the 42 leveled elements for each of the 48 principal formationsthat outcrop in the QUEST Project area. The results are shown as a set of classical “boxand whisker” plots, as explained in the next section.
∗BW Mining, Boulder, Colorado, USA†BW Mining, Brighton, Sussex, UK
1 of 37
Addendum #1 to Geoscience BC Report 2009-3

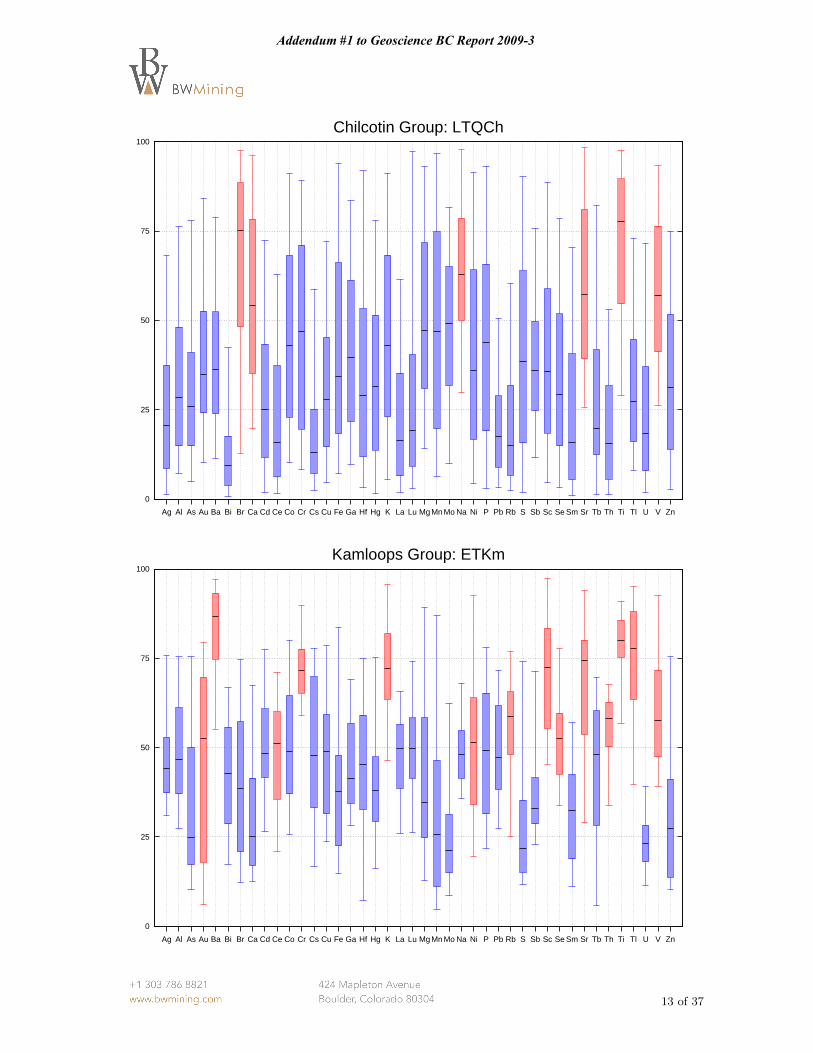
Box plots
The plots on Pages 13–36 give summary statistics of the distributions of 42 geochemicalelements over each of the 48 principal formations. Consider, for example, the Endako Groupshown on Page 14 and reproduced here in Figure 1. Each column comprises a vertical box
0
25
50
75
100
Ag Al As Au Ba Bi Br Ca Cd Ce Co Cr Cs Cu Fe Ga Hf Hg K La Lu Mg Mn Mo Na Ni P Pb Rb S Sb Sc Se Sm Sr Tb Th Ti Tl U V Zn
Endako Group: ETEn
Figure 1: Plot showing the distributions of the various elements for the Endako Group.
and whisker plot of the distribution of the assays for a given element over the formationin question. The box consists of values lying between the lower and upper quartiles of thedistribution. It is shaded red or blue depending on whether the median, indicated by acentral divider within the box, lies above or below the median for that element over theregion as a whole. The whiskers, marked below and above the box, extend from the 5thto the 95th percentiles which, in view of outliers, are more informative than minimum andmaximum.
Assay values for the various elements typically occupy very different ranges. If each boxand whisker diagram were plotted using the same units for all elements, it would be unclearwhich elements were elevated, and which depressed, relative to their background values. Tosolve this problem, the units for each vertical column have been transformed independentlyby applying the inverse cumulative distribution function of the regional population for theelement in question. The resulting dimensionless numbers between 0 and 100, as percents,can then all be plotted on a common vertical scale for each element. In Figure 1, forexample, the median value for Ti falls just above 75. This means that the median for Ti,within the Endako Group, lies in the upper quartile for Ti over the region as a whole,implying that Ti is significantly elevated for this formation.
2 of 37
Addendum #1 to Geoscience BC Report 2009-3
The region used to determine the background distribution was the full geologic mapof Figure 4, excluding the pale yellow areas representing the overburden. The relevantpercentiles for this background distribution of the various elements are shown in Table 1.The rows of this table can be used, for the various elements, to translate ordinates such as25, 50, 75 into actual abundances.
Conclusions
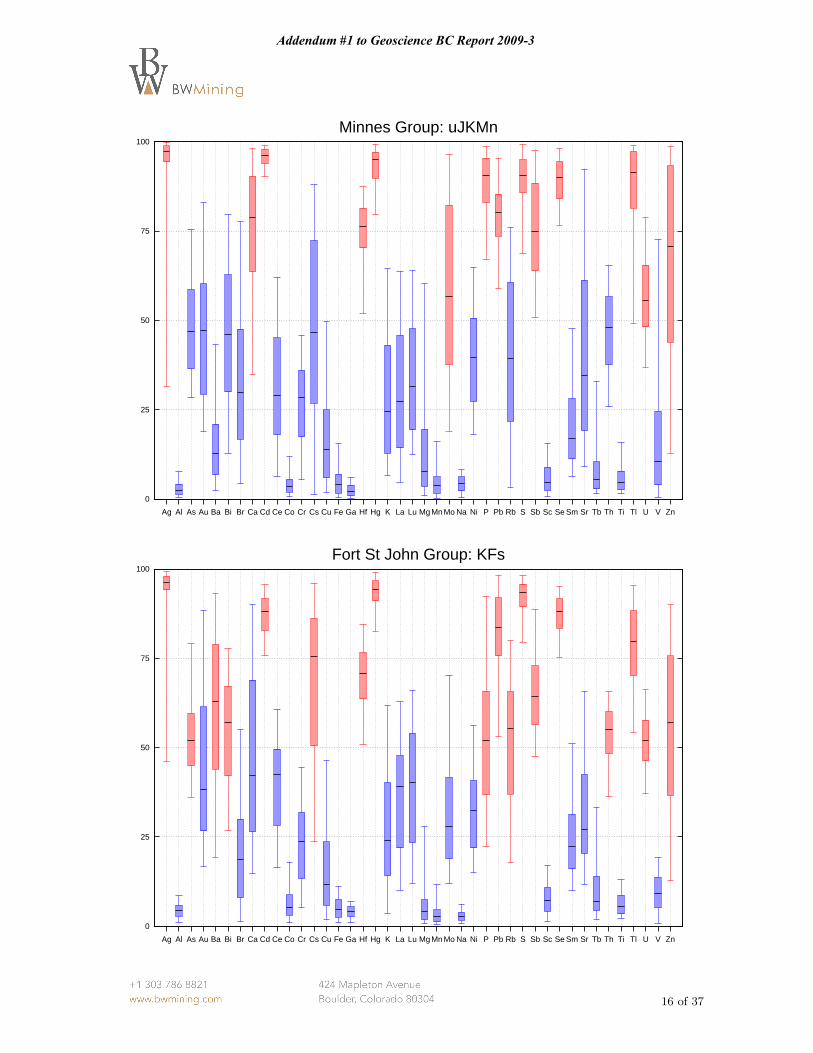
Careful examination of these box and whisker plots reveals that the majority of the 48geological formations have distinctive geochemical distributions. Since the neural networkalso takes account of the full multivariate statistics of the 42 elements, it should havelittle difficulty distinguishing most of these formations. However, a few of the plots areremarkably similar. Two of these happen to be the Nicola and Takla Groups, shown atthe top of Page 19, and the Cache Creek Complex, shown at the bottom of Page 20, andreproduced here in Figure 2. It would not be surprising if the neural network had difficulty
0
25
50
75
100
Ag Al As Au Ba Bi Br Ca CdCeCo Cr Cs Cu Fe Ga Hf Hg K La Lu MgMnMoNa Ni P Pb Rb S Sb Sc SeSm Sr Tb Th Ti Tl U V Zn
Nikola and Takla Groups: TrJTk/uTrJNc
0
25
50
75
100
Ag Al As Au Ba Bi Br Ca CdCeCo Cr Cs Cu Fe Ga Hf Hg K La Lu MgMnMoNa Ni P Pb Rb S Sb Sc SeSm Sr Tb Th Ti Tl U V Zn
Cache Creek Complex: MTrCc
Figure 2: Comparison of the distributions of the various elements for the Nicola and TaklaGroups and the Cache Creek Complex.
separating these formations. Geological knowledge and understanding may therefore berequired to assess the inferred bedrock geology map in places where the neural network ispredicting one or other of these two formations.
It is not the intention of this short note to analyze each of the 48 principal formations inthe QUEST Project area in detail. The observant reader will, however, notice other groups
3 of 37
Addendum #1 to Geoscience BC Report 2009-3
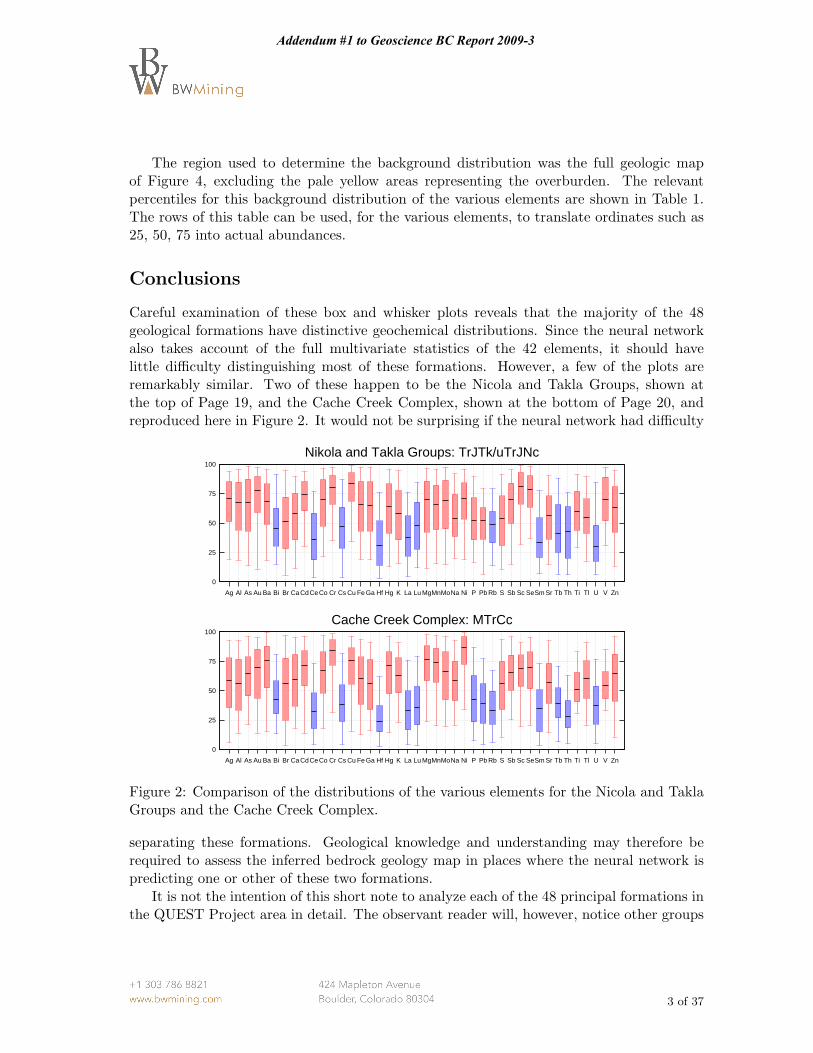
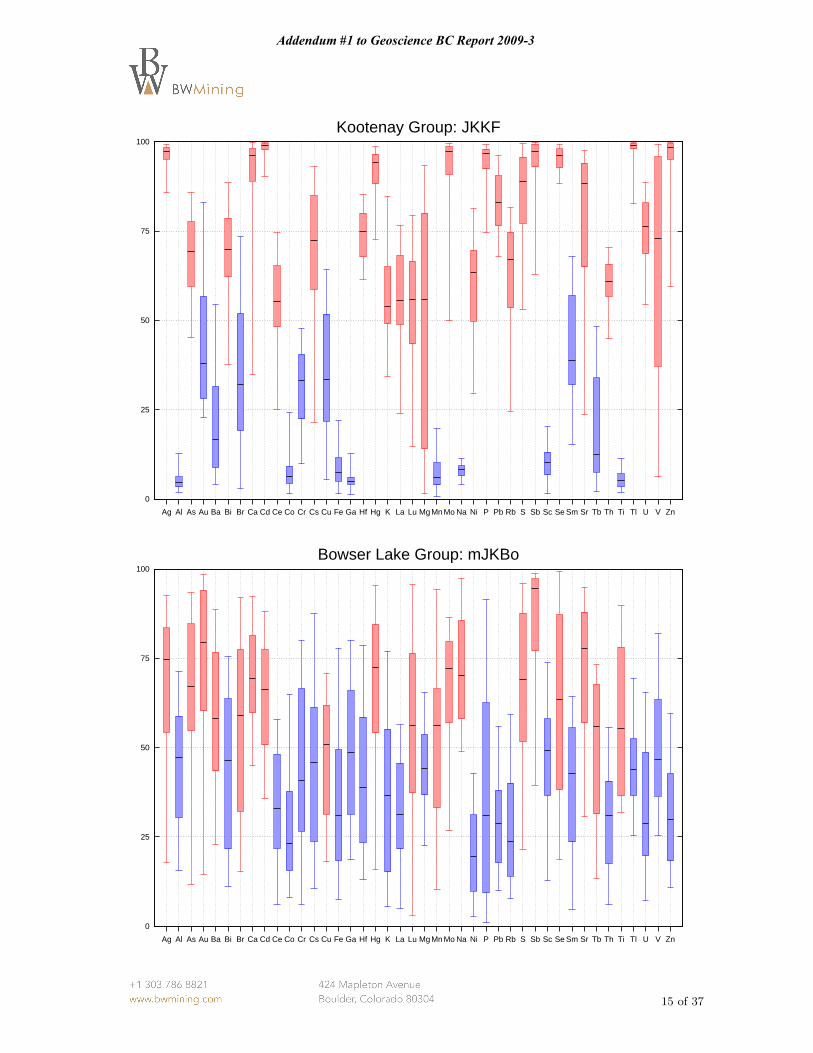
that have similar geochemistry. The late Cretaceous to early Jurassic Kootenay Group andFernie Formation, for example, closely resemble the Triassic Spray River Group, as shownbelow in Figure 3. Despite the spread in ages, these different geological formations consist
0
25
50
75
100
Ag Al As Au Ba Bi Br Ca CdCeCo Cr Cs Cu Fe Ga Hf Hg K La Lu MgMnMoNa Ni P Pb Rb S Sb Sc SeSm Sr Tb Th Ti Tl U V Zn
Kootenay Group: JKKF
0
25
50
75
100
Ag Al As Au Ba Bi Br Ca CdCeCo Cr Cs Cu Fe Ga Hf Hg K La Lu MgMnMoNa Ni P Pb Rb S Sb Sc SeSm Sr Tb Th Ti Tl U V Zn
Spray River Group: TrJS
Figure 3: Comparison of the distributions of the various elements for the Kootenay Groupand the Spray River Group.
of limestones, shales and sandstones, which were probably derived from the same, oldersource rocks and deposited under much the same sedimentary conditions.
Acknowledgements
The authors would like to acknowledge the expertise and assistance provided by WayneJackaman of Noble Exploration Services Ltd, firstly in assembling the geochemical samplesand secondly in advising on the selection of elements used in this study. They would alsolike to thank Stephen Williams, private GIS contractor, for compiling the surface geologicalmap of the QUEST Project area. Both are members of the Geoscience BC Project Team.
References
[1] Barnett, C. T. and Williams, P. M., 2009: Using geochemistry and neural networks tomap geology under glacial cover. Final Report for Geoscience Project 2008-003. Geo-science BC Report 2009-003.
4 of 37
Addendum #1 to Geoscience BC Report 2009-3

Figure 4: Surficial geological map of the QUEST project area, showing a few of the towns.The pale yellow areas represent the Quaternary overburden. The outline of the airbornegravity and electromagnetic surveys is marked in black. The map projection is UTM Zone10 in NAD83.
5 of 37
Addendum #1 to Geoscience BC Report 2009-3
6 of 37
Addendum #1 to Geoscience BC Report 2009-3
7 of 37
Addendum #1 to Geoscience BC Report 2009-3
8 of 37
Addendum #1 to Geoscience BC Report 2009-3
9 of 37
Addendum #1 to Geoscience BC Report 2009-3

10 of 37
Addendum #1 to Geoscience BC Report 2009-3
11 of 37
Addendum #1 to Geoscience BC Report 2009-3
12 of 37
Addendum #1 to Geoscience BC Report 2009-3
0
25
50
75
100
Ag Al As Au Ba Bi Br Ca Cd Ce Co Cr Cs Cu Fe Ga Hf Hg K La Lu Mg Mn Mo Na Ni P Pb Rb S Sb Sc Se Sm Sr Tb Th Ti Tl U V Zn
Chilcotin Group: LTQCh
0
25
50
75
100
Ag Al As Au Ba Bi Br Ca Cd Ce Co Cr Cs Cu Fe Ga Hf Hg K La Lu Mg Mn Mo Na Ni P Pb Rb S Sb Sc Se Sm Sr Tb Th Ti Tl U V Zn
Kamloops Group: ETKm
13 of 37
Addendum #1 to Geoscience BC Report 2009-3

0
25
50
75
100
Ag Al As Au Ba Bi Br Ca Cd Ce Co Cr Cs Cu Fe Ga Hf Hg K La Lu Mg Mn Mo Na Ni P Pb Rb S Sb Sc Se Sm Sr Tb Th Ti Tl U V Zn
Endako Group: ETEn
0
25
50
75
100
Ag Al As Au Ba Bi Br Ca Cd Ce Co Cr Cs Cu Fe Ga Hf Hg K La Lu Mg Mn Mo Na Ni P Pb Rb S Sb Sc Se Sm Sr Tb Th Ti Tl U V Zn
Ootsa Lake Group: ETOo
14 of 37
Addendum #1 to Geoscience BC Report 2009-3
0
25
50
75
100
Ag Al As Au Ba Bi Br Ca Cd Ce Co Cr Cs Cu Fe Ga Hf Hg K La Lu Mg Mn Mo Na Ni P Pb Rb S Sb Sc Se Sm Sr Tb Th Ti Tl U V Zn
Kootenay Group: JKKF
0
25
50
75
100
Ag Al As Au Ba Bi Br Ca Cd Ce Co Cr Cs Cu Fe Ga Hf Hg K La Lu Mg Mn Mo Na Ni P Pb Rb S Sb Sc Se Sm Sr Tb Th Ti Tl U V Zn
Bowser Lake Group: mJKBo
15 of 37
Addendum #1 to Geoscience BC Report 2009-3
0
25
50
75
100
Ag Al As Au Ba Bi Br Ca Cd Ce Co Cr Cs Cu Fe Ga Hf Hg K La Lu Mg Mn Mo Na Ni P Pb Rb S Sb Sc Se Sm Sr Tb Th Ti Tl U V Zn
Minnes Group: uJKMn
0
25
50
75
100
Ag Al As Au Ba Bi Br Ca Cd Ce Co Cr Cs Cu Fe Ga Hf Hg K La Lu Mg Mn Mo Na Ni P Pb Rb S Sb Sc Se Sm Sr Tb Th Ti Tl U V Zn
Fort St John Group: KFs
16 of 37
Addendum #1 to Geoscience BC Report 2009-3

0
25
50
75
100
Ag Al As Au Ba Bi Br Ca Cd Ce Co Cr Cs Cu Fe Ga Hf Hg K La Lu Mg Mn Mo Na Ni P Pb Rb S Sb Sc Se Sm Sr Tb Th Ti Tl U V Zn
Kasalka and Smokey Groups: uKKs/uKSy
0
25
50
75
100
Ag Al As Au Ba Bi Br Ca Cd Ce Co Cr Cs Cu Fe Ga Hf Hg K La Lu Mg Mn Mo Na Ni P Pb Rb S Sb Sc Se Sm Sr Tb Th Ti Tl U V Zn
Bullhead and Skeena Groups: lKBu/lKSk
17 of 37
Addendum #1 to Geoscience BC Report 2009-3

0
25
50
75
100
Ag Al As Au Ba Bi Br Ca Cd Ce Co Cr Cs Cu Fe Ga Hf Hg K La Lu Mg Mn Mo Na Ni P Pb Rb S Sb Sc Se Sm Sr Tb Th Ti Tl U V Zn
Hazelton Group: lmJHz
0
25
50
75
100
Ag Al As Au Ba Bi Br Ca Cd Ce Co Cr Cs Cu Fe Ga Hf Hg K La Lu Mg Mn Mo Na Ni P Pb Rb S Sb Sc Se Sm Sr Tb Th Ti Tl U V Zn
Chuchi Lake, Twin Creek, Ashcroft: lJCl/lJTw/lmJAh
18 of 37
Addendum #1 to Geoscience BC Report 2009-3

0
25
50
75
100
Ag Al As Au Ba Bi Br Ca Cd Ce Co Cr Cs Cu Fe Ga Hf Hg K La Lu Mg Mn Mo Na Ni P Pb Rb S Sb Sc Se Sm Sr Tb Th Ti Tl U V Zn
Nikola and Takla Groups: TrJTk/uTrJNc
0
25
50
75
100
Ag Al As Au Ba Bi Br Ca Cd Ce Co Cr Cs Cu Fe Ga Hf Hg K La Lu Mg Mn Mo Na Ni P Pb Rb S Sb Sc Se Sm Sr Tb Th Ti Tl U V Zn
Spray River Group: TrJS
19 of 37
Addendum #1 to Geoscience BC Report 2009-3

0
25
50
75
100
Ag Al As Au Ba Bi Br Ca Cd Ce Co Cr Cs Cu Fe Ga Hf Hg K La Lu Mg Mn Mo Na Ni P Pb Rb S Sb Sc Se Sm Sr Tb Th Ti Tl U V Zn
Kutchko Formation: PJKu
0
25
50
75
100
Ag Al As Au Ba Bi Br Ca Cd Ce Co Cr Cs Cu Fe Ga Hf Hg K La Lu Mg Mn Mo Na Ni P Pb Rb S Sb Sc Se Sm Sr Tb Th Ti Tl U V Zn
Cache Creek Complex: MTrCc
20 of 37
Addendum #1 to Geoscience BC Report 2009-3
0
25
50
75
100
Ag Al As Au Ba Bi Br Ca Cd Ce Co Cr Cs Cu Fe Ga Hf Hg K La Lu Mg Mn Mo Na Ni P Pb Rb S Sb Sc Se Sm Sr Tb Th Ti Tl U V Zn
Black Stuart Group: PzBl
0
25
50
75
100
Ag Al As Au Ba Bi Br Ca Cd Ce Co Cr Cs Cu Fe Ga Hf Hg K La Lu Mg Mn Mo Na Ni P Pb Rb S Sb Sc Se Sm Sr Tb Th Ti Tl U V Zn
Big Creek Group: DPBc
21 of 37
Addendum #1 to Geoscience BC Report 2009-3

0
25
50
75
100
Ag Al As Au Ba Bi Br Ca Cd Ce Co Cr Cs Cu Fe Ga Hf Hg K La Lu Mg Mn Mo Na Ni P Pb Rb S Sb Sc Se Sm Sr Tb Th Ti Tl U V Zn
Slide Mountain Complex: CPSm
0
25
50
75
100
Ag Al As Au Ba Bi Br Ca Cd Ce Co Cr Cs Cu Fe Ga Hf Hg K La Lu Mg Mn Mo Na Ni P Pb Rb S Sb Sc Se Sm Sr Tb Th Ti Tl U V Zn
Nina Creek Group: CPNi
22 of 37
Addendum #1 to Geoscience BC Report 2009-3

0
25
50
75
100
Ag Al As Au Ba Bi Br Ca Cd Ce Co Cr Cs Cu Fe Ga Hf Hg K La Lu Mg Mn Mo Na Ni P Pb Rb S Sb Sc Se Sm Sr Tb Th Ti Tl U V Zn
Lay Range Assemblage: CPLy
0
25
50
75
100
Ag Al As Au Ba Bi Br Ca Cd Ce Co Cr Cs Cu Fe Ga Hf Hg K La Lu Mg Mn Mo Na Ni P Pb Rb S Sb Sc Se Sm Sr Tb Th Ti Tl U V Zn
Base River/Banf and Exshaw: DMB/DMBe
23 of 37
Addendum #1 to Geoscience BC Report 2009-3

0
25
50
75
100
Ag Al As Au Ba Bi Br Ca Cd Ce Co Cr Cs Cu Fe Ga Hf Hg K La Lu Mg Mn Mo Na Ni P Pb Rb S Sb Sc Se Sm Sr Tb Th Ti Tl U V Zn
Rundle Group: MRu
0
25
50
75
100
Ag Al As Au Ba Bi Br Ca Cd Ce Co Cr Cs Cu Fe Ga Hf Hg K La Lu Mg Mn Mo Na Ni P Pb Rb S Sb Sc Se Sm Sr Tb Th Ti Tl U V Zn
Road River Group: ODRo/SDs
24 of 37
Addendum #1 to Geoscience BC Report 2009-3

0
25
50
75
100
Ag Al As Au Ba Bi Br Ca Cd Ce Co Cr Cs Cu Fe Ga Hf Hg K La Lu Mg Mn Mo Na Ni P Pb Rb S Sb Sc Se Sm Sr Tb Th Ti Tl U V Zn
Kechika Group: CmOKe
0
25
50
75
100
Ag Al As Au Ba Bi Br Ca Cd Ce Co Cr Cs Cu Fe Ga Hf Hg K La Lu Mg Mn Mo Na Ni P Pb Rb S Sb Sc Se Sm Sr Tb Th Ti Tl U V Zn
Cambrian-Ordovician: CmOs
25 of 37
Addendum #1 to Geoscience BC Report 2009-3

0
25
50
75
100
Ag Al As Au Ba Bi Br Ca Cd Ce Co Cr Cs Cu Fe Ga Hf Hg K La Lu Mg Mn Mo Na Ni P Pb Rb S Sb Sc Se Sm Sr Tb Th Ti Tl U V Zn
Snowshoe Group: uPrPzSn
0
25
50
75
100
Ag Al As Au Ba Bi Br Ca Cd Ce Co Cr Cs Cu Fe Ga Hf Hg K La Lu Mg Mn Mo Na Ni P Pb Rb S Sb Sc Se Sm Sr Tb Th Ti Tl U V Zn
Misinchinka Group: uPrCmMs
26 of 37
Addendum #1 to Geoscience BC Report 2009-3

0
25
50
75
100
Ag Al As Au Ba Bi Br Ca Cd Ce Co Cr Cs Cu Fe Ga Hf Hg K La Lu Mg Mn Mo Na Ni P Pb Rb S Sb Sc Se Sm Sr Tb Th Ti Tl U V Zn
Cariboo Group: uPrCmC
0
25
50
75
100
Ag Al As Au Ba Bi Br Ca Cd Ce Co Cr Cs Cu Fe Ga Hf Hg K La Lu Mg Mn Mo Na Ni P Pb Rb S Sb Sc Se Sm Sr Tb Th Ti Tl U V Zn
Gog and Boulder Creek Groups: uPrCmGo
27 of 37
Addendum #1 to Geoscience BC Report 2009-3

0
25
50
75
100
Ag Al As Au Ba Bi Br Ca Cd Ce Co Cr Cs Cu Fe Ga Hf Hg K La Lu Mg Mn Mo Na Ni P Pb Rb S Sb Sc Se Sm Sr Tb Th Ti Tl U V Zn
Ingenika Group: uPrIg
0
25
50
75
100
Ag Al As Au Ba Bi Br Ca Cd Ce Co Cr Cs Cu Fe Ga Hf Hg K La Lu Mg Mn Mo Na Ni P Pb Rb S Sb Sc Se Sm Sr Tb Th Ti Tl U V Zn
Kaza Group: uPrKz
28 of 37
Addendum #1 to Geoscience BC Report 2009-3

0
25
50
75
100
Ag Al As Au Ba Bi Br Ca Cd Ce Co Cr Cs Cu Fe Ga Hf Hg K La Lu Mg Mn Mo Na Ni P Pb Rb S Sb Sc Se Sm Sr Tb Th Ti Tl U V Zn
Miette Group: uPrMi
0
25
50
75
100
Ag Al As Au Ba Bi Br Ca Cd Ce Co Cr Cs Cu Fe Ga Hf Hg K La Lu Mg Mn Mo Na Ni P Pb Rb S Sb Sc Se Sm Sr Tb Th Ti Tl U V Zn
Early Tertiary Intrusives:ETdg/ETfp/ETg/ETgb/ETgd/ETgr/ETmi/ETqd/ETqm/ETqp
29 of 37
Addendum #1 to Geoscience BC Report 2009-3

0
25
50
75
100
Ag Al As Au Ba Bi Br Ca Cd Ce Co Cr Cs Cu Fe Ga Hf Hg K La Lu Mg Mn Mo Na Ni P Pb Rb S Sb Sc Se Sm Sr Tb Th Ti Tl U V Zn
Cretaceous-Tertiary Intrusives:KTdr/KTfp/KTg/KTgd/KTgr/KTpe/KTsy/LKdr/LKfp/LKgd/LKgr/LKqm/LKqp/LKto
0
25
50
75
100
Ag Al As Au Ba Bi Br Ca Cd Ce Co Cr Cs Cu Fe Ga Hf Hg K La Lu Mg Mn Mo Na Ni P Pb Rb S Sb Sc Se Sm Sr Tb Th Ti Tl U V Zn
Cretaceous Intrusives:EKdg/EKdr/EKgd/EKgr/EKqd/EKqm/Kg/Kgr/Kmi/Kog/Kpe/mKdg/mKgb/mKgd/mKgr
30 of 37
Addendum #1 to Geoscience BC Report 2009-3

0
25
50
75
100
Ag Al As Au Ba Bi Br Ca Cd Ce Co Cr Cs Cu Fe Ga Hf Hg K La Lu Mg Mn Mo Na Ni P Pb Rb S Sb Sc Se Sm Sr Tb Th Ti Tl U V Zn
Jurassic-Cretaceous Intrusives: JKg/JKgr/JKog/JKqm/JKqp/JKto
0
25
50
75
100
Ag Al As Au Ba Bi Br Ca Cd Ce Co Cr Cs Cu Fe Ga Hf Hg K La Lu Mg Mn Mo Na Ni P Pb Rb S Sb Sc Se Sm Sr Tb Th Ti Tl U V Zn
Late Jurassic Intrusives: LJdr/LJgd/LJgr/LJqd/LJqm
31 of 37
Addendum #1 to Geoscience BC Report 2009-3
0
25
50
75
100
Ag Al As Au Ba Bi Br Ca Cd Ce Co Cr Cs Cu Fe Ga Hf Hg K La Lu Mg Mn Mo Na Ni P Pb Rb S Sb Sc Se Sm Sr Tb Th Ti Tl U V Zn
Mid-Late Jurassic Intrusives:MJdr/MJfp/MJg/MJgd/MJgr/MJqd/MJqm/MJsy/MLJdr/MLJgb/MLJgd/MLJgr/MLJqd
0
25
50
75
100
Ag Al As Au Ba Bi Br Ca Cd Ce Co Cr Cs Cu Fe Ga Hf Hg K La Lu Mg Mn Mo Na Ni P Pb Rb S Sb Sc Se Sm Sr Tb Th Ti Tl U V Zn
Early-Mid Jurassic Intrusives:EJdg/EJdr/EJgb/EJgd/EJqd/EJqm/EJsy/EJvl/EMJdb/EMJdr/EMJgd
32 of 37
Addendum #1 to Geoscience BC Report 2009-3
0
25
50
75
100
Ag Al As Au Ba Bi Br Ca Cd Ce Co Cr Cs Cu Fe Ga Hf Hg K La Lu Mg Mn Mo Na Ni P Pb Rb S Sb Sc Se Sm Sr Tb Th Ti Tl U V Zn
Triassic-Jurassic Intrusives: TrJdr/TrJfp/TrJgb/TrJgd/TrJqm/TrJsy
0
25
50
75
100
Ag Al As Au Ba Bi Br Ca Cd Ce Co Cr Cs Cu Fe Ga Hf Hg K La Lu Mg Mn Mo Na Ni P Pb Rb S Sb Sc Se Sm Sr Tb Th Ti Tl U V Zn
Triassic Intrusives: Trdr/Trgb/Trgd
33 of 37
Addendum #1 to Geoscience BC Report 2009-3

0
25
50
75
100
Ag Al As Au Ba Bi Br Ca Cd Ce Co Cr Cs Cu Fe Ga Hf Hg K La Lu Mg Mn Mo Na Ni P Pb Rb S Sb Sc Se Sm Sr Tb Th Ti Tl U V Zn
Jurassic to Permian Intrusives:PJog/PJto/PTrdb/PTrdr/PTrgb/PTrgs/PTrto/Pgb
0
25
50
75
100
Ag Al As Au Ba Bi Br Ca Cd Ce Co Cr Cs Cu Fe Ga Hf Hg K La Lu Mg Mn Mo Na Ni P Pb Rb S Sb Sc Se Sm Sr Tb Th Ti Tl U V Zn
Mississippian-Devonian Intrusives: DCog/Mdr/Msy
34 of 37
Addendum #1 to Geoscience BC Report 2009-3

0
25
50
75
100
Ag Al As Au Ba Bi Br Ca Cd Ce Co Cr Cs Cu Fe Ga Hf Hg K La Lu Mg Mn Mo Na Ni P Pb Rb S Sb Sc Se Sm Sr Tb Th Ti Tl U V Zn
Palaeozoic Ultramafics: CPrum/CPus/CTrum/CTrus/Cus/DTrum/Pzum
0
25
50
75
100
Ag Al As Au Ba Bi Br Ca Cd Ce Co Cr Cs Cu Fe Ga Hf Hg K La Lu Mg Mn Mo Na Ni P Pb Rb S Sb Sc Se Sm Sr Tb Th Ti Tl U V Zn
Cretaceous-Tertiary Intrusives: Jgs/KTmc/KTpg
35 of 37
Addendum #1 to Geoscience BC Report 2009-3

0
25
50
75
100
Ag Al As Au Ba Bi Br Ca Cd Ce Co Cr Cs Cu Fe Ga Hf Hg K La Lu Mg Mn Mo Na Ni P Pb Rb S Sb Sc Se Sm Sr Tb Th Ti Tl U V Zn
Paleozoic Metamorphics: DTrlm/DTrml/PJml/PrPzm
0
25
50
75
100
Ag Al As Au Ba Bi Br Ca Cd Ce Co Cr Cs Cu Fe Ga Hf Hg K La Lu Mg Mn Mo Na Ni P Pb Rb S Sb Sc Se Sm Sr Tb Th Ti Tl U V Zn
Lower Proterozoic Paragneiss: LPrpg
36 of 37
Addendum #1 to Geoscience BC Report 2009-3
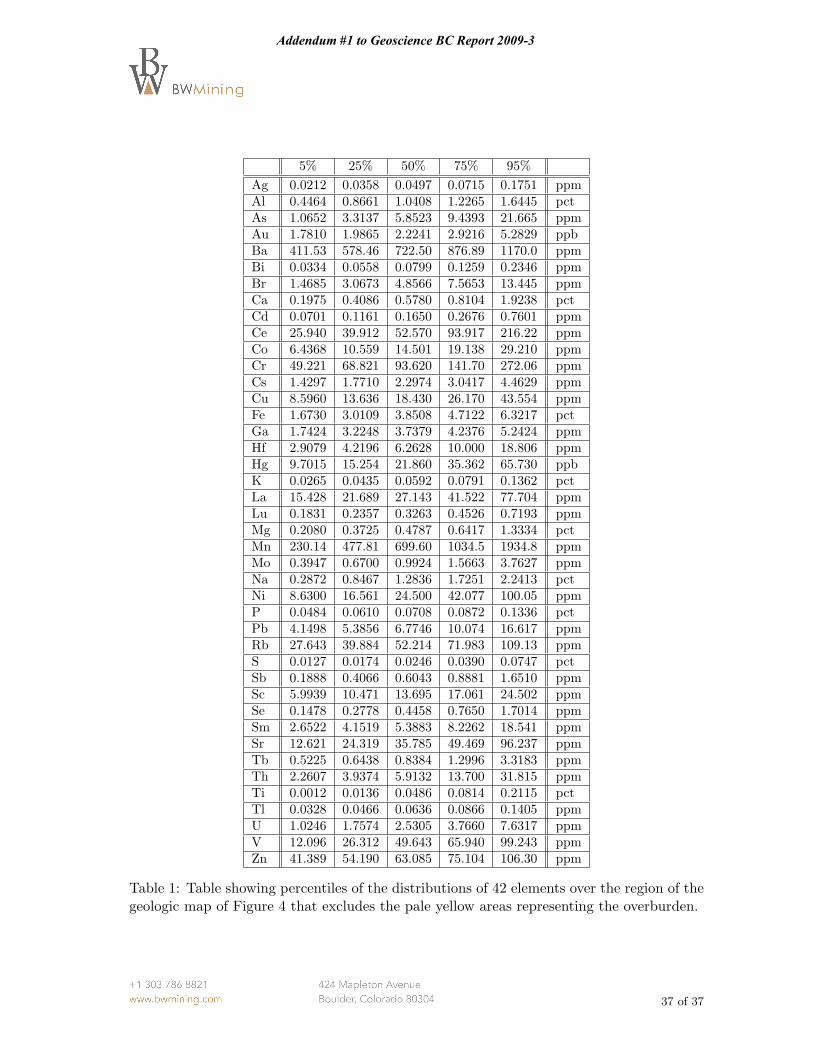
5% 25% 50% 75% 95%Ag 0.0212 0.0358 0.0497 0.0715 0.1751 ppmAl 0.4464 0.8661 1.0408 1.2265 1.6445 pctAs 1.0652 3.3137 5.8523 9.4393 21.665 ppmAu 1.7810 1.9865 2.2241 2.9216 5.2829 ppbBa 411.53 578.46 722.50 876.89 1170.0 ppmBi 0.0334 0.0558 0.0799 0.1259 0.2346 ppmBr 1.4685 3.0673 4.8566 7.5653 13.445 ppmCa 0.1975 0.4086 0.5780 0.8104 1.9238 pctCd 0.0701 0.1161 0.1650 0.2676 0.7601 ppmCe 25.940 39.912 52.570 93.917 216.22 ppmCo 6.4368 10.559 14.501 19.138 29.210 ppmCr 49.221 68.821 93.620 141.70 272.06 ppmCs 1.4297 1.7710 2.2974 3.0417 4.4629 ppmCu 8.5960 13.636 18.430 26.170 43.554 ppmFe 1.6730 3.0109 3.8508 4.7122 6.3217 pctGa 1.7424 3.2248 3.7379 4.2376 5.2424 ppmHf 2.9079 4.2196 6.2628 10.000 18.806 ppmHg 9.7015 15.254 21.860 35.362 65.730 ppbK 0.0265 0.0435 0.0592 0.0791 0.1362 pctLa 15.428 21.689 27.143 41.522 77.704 ppmLu 0.1831 0.2357 0.3263 0.4526 0.7193 ppmMg 0.2080 0.3725 0.4787 0.6417 1.3334 pctMn 230.14 477.81 699.60 1034.5 1934.8 ppmMo 0.3947 0.6700 0.9924 1.5663 3.7627 ppmNa 0.2872 0.8467 1.2836 1.7251 2.2413 pctNi 8.6300 16.561 24.500 42.077 100.05 ppmP 0.0484 0.0610 0.0708 0.0872 0.1336 pctPb 4.1498 5.3856 6.7746 10.074 16.617 ppmRb 27.643 39.884 52.214 71.983 109.13 ppmS 0.0127 0.0174 0.0246 0.0390 0.0747 pctSb 0.1888 0.4066 0.6043 0.8881 1.6510 ppmSc 5.9939 10.471 13.695 17.061 24.502 ppmSe 0.1478 0.2778 0.4458 0.7650 1.7014 ppmSm 2.6522 4.1519 5.3883 8.2262 18.541 ppmSr 12.621 24.319 35.785 49.469 96.237 ppmTb 0.5225 0.6438 0.8384 1.2996 3.3183 ppmTh 2.2607 3.9374 5.9132 13.700 31.815 ppmTi 0.0012 0.0136 0.0486 0.0814 0.2115 pctTl 0.0328 0.0466 0.0636 0.0866 0.1405 ppmU 1.0246 1.7574 2.5305 3.7660 7.6317 ppmV 12.096 26.312 49.643 65.940 99.243 ppmZn 41.389 54.190 63.085 75.104 106.30 ppm
Table 1: Table showing percentiles of the distributions of 42 elements over the region of thegeologic map of Figure 4 that excludes the pale yellow areas representing the overburden.
37 of 37
Addendum #1 to Geoscience BC Report 2009-3