Embed Size (px)
Citation preview

VTT PU
BLICATIO
NS 594
Added ßglucan as a source of fibre for consum
ersM
arika Lyly
Tätä julkaisua myy Denna publikation säljs av This publication is available from
VTT VTT VTTPL 1000 PB 1000 P.O. Box 1000
02044 VTT 02044 VTT FI02044 VTT, FinlandPuh. 020 722 4404 Tel. 020 722 4404 Phone internat. +358 20 722 4404Faksi 020 722 4374 Fax 020 722 4374 Fax +358 20 722 4374
ISBN 951– 38– 6700– 5 (soft back ed.) ISBN 951– 38– 6701– 3 (URL: http://www.vtt.fi/inf/pdf/)ISSN 1235– 0621 (soft back ed.) ISSN 1455– 0849 (URL: http://www.vtt.fi/inf/pdf/)
ESPOO 2006 VTT PUBLICATIONS 594
Marika Lyly
Added ßglucan as a source of fibrefor consumers
The intake of dietary fibre does not currently meet the recommendations inmany Western countries, and it is important to find new ways to increaseits intake. The aim of this thesis was to investigate whether providing foodsenriched with ßglucan would be a feasible strategy for improvingconsumers’ dietary fibre intake regarding the sensory properties andconsumer acceptance of these foods. ßglucan is a good option for fibreenrichment of foods because of its proven capability to reduce elevatedblood cholesterol levels and to balance blood glucose and insulin responseafter meals.
The study showed that dietary fibre had a positive image among Finnishrespondents and it was considered important for health. Beverages andsoups with added ßglucan were acceptable regarding their sensorycharacteristics, thus being feasible carrier products for ßglucan andproviding a possible nontraditional source of dietary fibre. Liking for theproducts with added ßglucan was the most important factor affecting thewillingness to use them, indicating that the sensory quality of products withadded dietary fibre with health benefits has to be acceptable, only thenconsumers are willing to buy them.


VTT PUBLICATIONS 594
Added β-glucan as a source of fibre for consumers
Marika Lyly VTT
ACADEMIC DISSERTATION To be presented with the permission of the Faculty of Agriculture and
Forestry of the University of Helsinki, for public criticism in Walter Hall, Viikki, on 3rd March, 2006, at 12 o�clock noon.

ISBN 951�38�6700�5 (soft back ed.) ISSN 1235�0621 (soft back ed.)
ISBN 951�38�6701�3 (URL: http://www.vtt.fi/inf/pdf/) ISSN 1455�0849 (URL: http://www.vtt.fi/inf/pdf/)
Copyright © VTT Technical Research Centre of Finland 2006
JULKAISIJA � UTGIVARE � PUBLISHER
VTT, Vuorimiehentie 3, PL 1000, 02044 VTT puh. vaihde 020 722 111, faksi 020 722 4374
VTT, Bergsmansvägen 3, PB 1000, 02044 VTT tel. växel 020 722 111, fax 020 722 4374
VTT Technical Research Centre of Finland, Vuorimiehentie 3, P.O. Box 1000, FIN-02044 VTT, Finland phone internat. +358 20 722 111, fax + 358 20 722 4374
VTT, Tietotie 2, PL 1000, 02044 VTT puh. vaihde 020 722 111, faksi 020 722 7071
VTT, Datavägen 2, PB 1000, 02044 VTT tel. växel 020 722 111, fax 020 722 7071
VTT Technical Research Centre of Finland, Tietotie 2, P.O. Box 1000, FI-02044 VTT, Finland phone internat. +358 20 722 111, fax +358 20 722 7071
Cover picture: Päivi Vahala. Photos by VTT. Technical editing Maini Manninen Otamedia Oy, Espoo 2006

3
Lyly, Marika. Added β-glucan as a source of fibre for consumers. Espoo 2006. VTT Publications 594. 96 p. + app. 50 p.
Keywords dietary fibres, β-glucans, fibre enrichment, consumer acceptance, functional food, beverages, soups, sensory quality, healthy diet
Abstract The intake of dietary fibre does not currently meet the recommendations in many Western countries. However, a diet abundant in dietary fibre has been linked with a reduced risk of many diseases, such as type 2 diabetes, colorectal cancer and cardiovascular disease. For that reason, dietary fibre can be considered as an essential component in a health-promoting diet and it is important to find new ways to increase its intake. β-glucan could be an effective type of dietary fibre when added into foods because of its proven health effects; it has been shown to reduce elevated blood cholesterol levels and balance blood glucose and insulin response after meals.
Adding physiologically effective amounts of β-glucan into foods may be difficult as regards the processing and sensory quality of the foods, as consumers are not willing to compromise on taste in foods. The general aim of this thesis was to investigate whether providing foods enriched with β-glucan would be a feasible strategy for improving consumers� dietary fibre intake. The more detailed objectives were to study Finnish consumers� views on dietary fibre and possible obstacles to improving the intake of dietary fibre, the technical feasibility of a prototype beverage and a soup containing β-glucan as regards their sensory quality, and the consumer acceptance of these foods with information about their health effects in Finland, France and Sweden.
The results showed that Finnish respondents (N = 125) considered dietary fibre important for their health, although it was not spontaneously mentioned as an element of a health-promoting diet. A group of respondents overestimated their dietary fibre intake compared to their actual intake as estimated using a fibre intake test. This misperception can be an obstacle to improving the quality of the diet. The respondents did not know what was the recommended intake of dietary fibre (in grams), but they could name relevant sources of fibre in the diet.

4
Adding oat or barley β-glucan into beverages and ready-to-eat soups affected their sensory characteristics by making them thicker and suppressing some flavour attributes with increasing concentrations of β-glucan, as evaluated by an experienced sensory panel. Low molecular weight β-glucan was easier to add into products at higher concentrations as regards the sensory characteristics. The importance of the high molecular weight of β-glucan in terms of its physiological efficacy, however, is important to consider. Freezing did not affect the sensory characteristics of soups containing β-glucan.
Consumer acceptance of beverages and ready-to-eat frozen soups was studied in Finland, France and Sweden among over-40-year-olds (N = 1157). The results showed that a health claim gave a small additional value to beverages and soups with added β-glucan, but liking for the products was the strongest determinant for the willingness to use them. There were no differences between men�s and women�s willingness to use these foods. Respondents who were concerned about their blood cholesterol and/or glucose levels were more willing to use beverages but not soups with health claims. Only in Sweden were the elderly more willing to use beverages with health claims compared to younger respondents; while in Finland and France no differences were found between age groups in the willingness to use beverages. There were no differences between age groups in the willingness to use soups in any of the countries. It does not seem likely that consumers would be ready to pay much extra for functional beverages and soups.
In conclusion, the present study demonstrated that Finnish consumers perceive fibre as being important for their health. Beverages and soups with added β-glucan were feasible regarding their sensory properties and thus would make potential carrier products for added β-glucan. β-glucan as an additional fibre source gave a small added value to beverages and soups but the taste of the products was the most important factor affecting the willingness to use these foods. Palatable fibre-enriched foods could be a possible approach to increase fibre intake as part of a normal diet. Further research would be needed to investigate the actual role of fibre-enriched products in the total intake of dietary fibre.

5
Academic dissertation
University of Helsinki � Faculty of Agriculture and Forestry � Department of Applied Chemistry and Microbiology (Nutrition), Finland
Custos
Professor Marja Mutanen University of Helsinki � Faculty of Agriculture and Forestry � Department of Applied Chemistry and Microbiology (Nutrition), Finland
Supervisors
Dr. Liisa Lähteenmäki VTT Technical Research Centre of Finland
Professor Kaisa Poutanen VTT Technical Research Centre of Finland
Reviewers
Ph.D. Armand Cardello U.S. Army Natic Soldier Center � Sensory and Consumer Research � Science and Technology Directorate, the USA.
Docent Ritva Järvinen University of Kuopio � Department of Public Health and Clinical Nutrition � Division of Clinical Nutrition, Finland Opponent
Professor Hely Tuorila University of Helsinki � Faculty of Agriculture and Forestry � Department of Food Technology, Finland

6
Preface
The study was carried out at VTT Biotechnology during the years 2001�2005. The majority of the research was part of the VTT research programme �Tailored Technologies for future foods� and was mainly carried out as part of a European research project entitled "Design of foods with improved functionality and superior health effects using cereal betaglucans" (QLRT-2000-00535), financially supported by the European Community (EC) within the 5th Framework Programme under the Quality of Life and Management of Living resources, Key Action 1. The financial support is gratefully acknowledged.
I thank Professor Juha Ahvenainen, Technology Director of VTT's Biotechnology Cluster, for providing excellent work facilities and financial support. I warmly thank Professor Leena Räsänen and Professor Marja Mutanen, both from the Department of Nutrition at the University of Helsinki, for their encouragement and comments. I would especially like to thank the reviewers of this thesis, Ph.D. Armand Cardello and Docent Ritva Järvinen, for their extremely valuable effort in giving constructive comments and criticisms, and for creating a fruitful dialogue during the reviewing process.
I am most grateful to Dr. Liisa Lähteenmäki for encouraging me to start this thesis and for supervising me through all the steps in the work and for sharing her wide expertise in this area. I am very grateful to Professor Kaisa Poutanen for supervision and continuous dynamic ideas. This work would not have been possible without the co-operation and support of several colleagues. I wish to express my appreciation to the rest of my co-authors in Publications I�IV: Dr. Karin Autio, Kaisu Honkapää, Dr. Katariina Roininen, Dr. Marjatta Salmenkallio-Marttila and Dr. Tapani Suortti at VTT Biotechnology, Ulla Rauramo from The Finnish Bread Information and Eija Soini. I warmly thank my closest colleagues Anne Arvola, Heidi Eriksson, Dr. Raija-Liisa Heiniö, Johanna Kuosmanen, Tuija Kössö, Piritta Lampila, Pirkko Nousiainen, Dr. Katariina Roininen, Dr. Nina Urala and Ulla Österlund for keeping the team spirit up. Pirkko, Heidi and Ulla, your assistance was irreplaceable in handling the hundreds of soup and beverage samples! Particularly Nina, thank you for sharing this process with me during the bright and dark days (in the end I�m glad that we did not press the cancel button). In addition, I wish to thank our partners in the EU project for

7
collaboration. In particular, I would like to thank Jörgen Holm, Findus R & D, for providing the soups in Studies III and IV, Angeliki Öste-Triantafyllou and Rickard Öste at CEBA Foods AB for providing the β-glucan preparations in Studies II�IV and Markus Wydra, Döhler Euro Citrus GmbH for providing the beverage bases in Studies II and IV. I also wish to thank Kaisa Vesivalo from Translation Services Noodi for revising the English language in this thesis quickly and flexibly.
I owe my dearest thanks to my family, relatives and friends for their encouragement, relaxing moments and shared experiences. In particular, my mother Marjanna has been an extremely important help in taking care of little Pihla. Finally, I would like to express my warmest gratitude to my own family � Janne and Pihla � for showing and reminding me what the most important things in life really are.
Espoo, February 2006
Marika Lyly

8
List of original publications
The present thesis is based on the following publications, which will be referred to in the text by their Roman numerals (I�IV). Unpublished data is also presented.
I Lyly, M., Soini, E., Rauramo, U. and Lähteenmäki, L. 2004. Perceived role of fibre in a healthy diet among Finnish consumers. Journal of Human Nutrition and Dietetics 17, 231�239.
II Lyly, M., Salmenkallio-Marttila, M., Suortti, T., Autio, K., Poutanen, K. and Lähteenmäki, L. 2003. Influence of oat ß-glucan preparations on the perception of mouthfeel and on rheological properties in beverage prototypes. Cereal Chemistry 80, 536�541.
III Lyly, M., Salmenkallio-Marttila, M., Suortti, T., Autio, K., Poutanen, K. and Lähteenmäki, L. 2004. The sensory characteristics and rheological properties of soups containing oat and barley β-glucan before and after freezing. Lebensmittel-Wissenschaft und Technologie 37, 749�761.
IV Lyly, M., Roininen, K., Honkapää, K., Poutanen, K. and Lähteenmäki, L. Factors influencing consumers� willingness to use beverages and ready-to-eat frozen soups containing oat ß-glucan in Finland, France and Sweden. Food Quality and Preference. In press.

9
Research input and authorship of articles Marika Lyly�s dissertation is a summary of research reported in four (I�IV) appended articles. The research input and authorship of the articles is as follows:
I. Lyly, M., Soini, E., Rauramo, U. and Lähteenmäki, L. 2004. Perceived role of fibre in a healthy diet among Finnish consumers. Journal of Human Nutrition and Dietetics 17, 231�239.
The planning of this study as well as the data analysis was carried out by Marika Lyly, M.Sc., and Dr. Liisa Lähteenmäki. The interviews were carried out and data coded by Eija Soini, M.Sc. The study was supervised by Dr. Liisa Lähteenmäki and with other authors she participated in the writing of the manuscript by giving comments and suggestions. The author of the present thesis had the main responsibility for preparing and writing the article.
II. Lyly, M., Salmenkallio-Marttila, M., Suortti, T., Autio, K., Poutanen, K. and Lähteenmäki, L. 2003. Influence of oat ß-glucan preparations on the perception of mouthfeel and on rheological properties in beverage prototypes. Cereal Chemistry 80, 536�541.
The planning of this study as well as the data analysis was carried out by Marika Lyly, M.Sc., and Dr. Liisa Lähteenmäki. Samples were prepared by the technicians at VTT. Viscosity measurement was performed by Dr. Marjatta Salmenkallio-Marttila and molecular weight analyses by Dr. Tapani Suortti. The study was supervised by Dr. Liisa Lähteenmäki and Prof. Kaisa Poutanen and with other authors they participated in the writing of the manuscript by giving comments and suggestions. The author of the present thesis had the main responsibility for preparing and writing the article.
III. Lyly, M., Salmenkallio-Marttila, M., Suortti, T., Autio, K., Poutanen, K. and Lähteenmäki, L. 2004. The sensory characteristics and rheological properties of soups containing oat and barley β-glucan before and after freezing. Lebensmittel-Wissenschaft und Technologie 37, 749�761.
The planning of this study as well as the data analysis was carried out by Marika Lyly, M.Sc., and Dr. Liisa Lähteenmäki. Preparation of the samples was carried out by our technicians at VTT. Viscosity measurement was performed by Dr. Marjatta Salmenkallio-Marttila and Tessa Kuuva, M.Sc. Dr. Tapani Suortti performed molecular weight analyses and wrote a paragraph about them. The study was supervised by Dr. Liisa Lähteenmäki and Prof. Kaisa Poutanen and with other authors they participated in the writing of the manuscript by giving comments and suggestions. The author of the present thesis had the main responsibility for preparing and writing the article.
IV. Lyly, M., Roininen, K., Honkapää, K.., Poutanen, K. and Lähteenmäki, L. Factors influencing consumers' willingness to use beverages and ready-meal frozen soups containing oat ß-glucan in Finland, France and Sweden. Food Quality and Preference. In press.
The planning of the study was carried out by Marika Lyly, M.Sc., and Dr. Liisa Lähteenmäki. The data analysis was performed by Marika Lyly, M.Sc., Kaisu Honkapää, M.Sc., Dr. Katariina Roininen and Dr. Liisa Lähteenmäki. Sample distribution to consumers was organised by the technicians at VTT. The study was supervised by Dr. Liisa Lähteenmäki and with other authors she participated in the writing of the manuscript by giving comments and suggestions. The author of the present thesis had the main responsibility for preparing and writing the article.

10
Contents
Abstract ................................................................................................................. 3
Academic dissertation........................................................................................... 5
Preface .................................................................................................................. 6
List of original publications .................................................................................. 8
Research input and authorship of articles ............................................................. 9
1. Introduction................................................................................................... 13 1.1 Dietary fibre in a health-promoting diet .............................................. 16
1.1.1 Definition and health benefits of dietary fibre ........................ 16 1.1.2 Recommended and current intake and sources of dietary fibre
in the diet................................................................................. 17 1.1.3 Consumers� perceptions of dietary fibre and barriers to increase
the intake ................................................................................. 20 1.2 β-glucan as a source of dietary fibre.................................................... 22
1.2.1 Physical and chemical characteristics of β-glucan.................. 23 1.2.2 Health effects of β-glucan ....................................................... 23 1.2.3 β-glucan as an ingredient in processed foods.......................... 33 1.2.4 Technological challenges in developing foods with added
β-glucan................................................................................... 34 1.3 Factors influencing the acceptance of foods with health-related claims......35
1.3.1 Acceptable sensory quality ..................................................... 37 1.3.2 Product information and personal motivation factors ............. 38 1.3.3 The role of carrier product ...................................................... 39 1.3.4 The effect of age and gender on the acceptance of functional
foods........................................................................................ 41 1.3.5 Price ........................................................................................ 41 1.3.6 Aims of the study .................................................................... 42
2. Materials and methods .................................................................................. 44 2.1 General description of the studies ....................................................... 44 2.2 Samples (Studies II�III and IV)........................................................... 46
2.2.1 β-glucan preparations used in Studies II�IV........................... 46

11
2.2.2 Beverage and soup samples .................................................... 46 2.3 Participants .......................................................................................... 48 2.4 Procedure and methods........................................................................ 49 2.5 Data analysis........................................................................................ 50
3. Results........................................................................................................... 52 3.1 Consumer perceptions of a healthy diet and dietary fibre in it (I)....... 52
3.1.1 Defining a healthy diet ............................................................ 52 3.1.2 Intake and sources of fibre ...................................................... 52 3.1.3 Perceptions of the role of dietary fibre in health ..................... 53
3.2 The effect of β-glucan on the sensory characteristics of beverages and soups (II and III) ........................................................................... 54 3.2.1 Sensory profiles of the samples............................................... 54 3.2.2 The effect of freezing (III) ...................................................... 55 3.2.3 The link between instrumental viscosity and sensory
characteristics (II and III)........................................................ 55 3.3 Consumers� willingness to use beverages and soups containing oat
β-glucan (IV) ....................................................................................... 56 3.3.1 Differences between countries ................................................ 56 3.3.2 The effect of age, gender and health motivation on
willingness to use .................................................................... 57 3.3.3 Willingness to pay for beverages and soups with health claims..57
4. Discussion..................................................................................................... 59 4.1 Methodological considerations............................................................ 59 4.2 Consumer perceptions of a healthy diet and dietary fibre ................... 62 4.3 The effect of β-glucan on the sensory characteristics of beverages
and soups ............................................................................................. 65 4.3.1 The link between instrumental viscosity and sensory
characteristics.......................................................................... 67 4.4 Consumers� willingness to use beverages and soups containing oat
β-glucan ............................................................................................... 67 4.4.1 The effect of age, gender and health motivation ..................... 69 4.4.2 Willingness to pay for beverages and soups with health claims..71
4.5 Feasibility of beverages and soups with added β-glucan..................... 72

12
5. Conclusions................................................................................................... 75
References........................................................................................................... 77
Appendices
Publications I�IV

13
1. Introduction In recent years, the increasing prevalence of public health problems related to a sedentary lifestyle has been widely discussed in developed countries. Obesity, type II diabetes and metabolic syndrome are becoming increasingly common health problems that require a lot of resources from the public health care system (WHO 2003). Lifestyle factors such as exercise, smoking, inappropriate diet quality and energy intake that is too high compared to energy consumption, in addition to hereditary factors, are key risk factors to these disorders. Additionally, as life expectancy is increasing, the well-being of the ageing population is a key target.
Thus, diet is one of the lifestyle factors that can be improved in order to lower diet-related disease risk factors. Basically, European consumers know what elements belong to a health-promoting diet, �more fruit and vegetables�, �less fat�, �balance and variety� (Margetts et al. 1997), as recommended by nutritionists, but the increasing morbidity rates of diet-related disorders indicate that, in practice, people�s diet does not follow the recommendations. The role of government is to provide nutritional goals (Figure 1), but the general education or information campaigns are not necessarily effective enough as such in improving dietary habits. As an example, the �five-a-day� campaign, which encouraged an increase in the intake of vegetables and fruit to five portions per day, has not succeeded very well in the USA or in the UK (Lambert et al. 2002).
On the other hand, it is the role of the food industry to provide appropriate products for consumers and also to communicate about the product benefits (Figure 1). Thus, the nutritional goals set by government or other authorities are at the level of the overall diet, while the food industry provides products and product-based information. The challenge for consumers is to gather a diet from the individual products available on the market, although the nutritional goals are at the level of the overall diet.

14
Role of the food industry
Role of the government and other authorities
Factors affecting food choice
Consumer
� taste
� convenience
� price
� attitudes
� �
� �.Variety of foods
Nutritional goals
Adjustment and interpretation of information
& product related information (e.g. health claims)
Role of the food industry
Role of the government and other authorities
Factors affecting food choice
Consumer
� taste
� convenience
� price
� attitudes
� �
� �.Variety of foodsVariety of foods
Nutritional goals
Adjustment and interpretation of information
& product related information (e.g. health claims)
Figure 1. Actors and responsibilities relating to consumers� food choice.
Among the many components of diet, the role of dietary fibre in health has been investigated in numerous studies. Intake of fibre has been associated with reduced risk of many diseases, such as colorectal cancer (Bingham et al. 2003), cardiovascular disease (Pereira et al. 2004) and type 2 diabetes (Meyer et al. 2000). Therefore, it can be regarded as one of the key components in a health-promoting diet.
However, dietary fibre intake is not adequate in many developed countries and new ways to improve the intake should be invented. Dietary habits are changing and the consumption of ready-made foods has increased. This may lead to a decreased intake of dietary fibre if pre-prepared and processed foods contribute significantly to energy intake (Burns et al. 2002). At the same time, the consumption of traditional sources of fibre is decreasing. Therefore, one possibility is to add dietary fibre into foods that traditionally are not relevant sources of fibre in the diet, for instance, beverages.
β-glucan, a water-soluble fibre in oat and barley, could be a good dietary fibre alternative to be added into foods because of its proven health effects. Oat has been shown to have a balancing effect on post-prandial blood glucose and insulin levels (Wood et al. 1994) and to lower blood cholesterol levels (Ripsin et al. 1992). However, adding β-glucan into foods may be problematic from the food processing and sensory quality point of view. β-glucan produces high viscosity (Wood and Beer 1998), which may be a difficult sensory characteristic

15
in foods. On the other hand, viscosity is crucial for the physiological efficacy of β-glucan (Wood et al. 1994).
In order for consumers to benefit from the positive health effects, foods with high dietary fibre content must be bought and consumed regularly. How can the selection and use of foods with health benefits be enhanced? Taste is one of the most important factors affecting food choice (Glanz et al. 1998). Hence, taste and the overall sensory quality of foods must be faultless and acceptable. In addition, consumers need to be better informed about foods with a high dietary fibre content by providing appropriate and effective information about the benefits of the products. It is crucial to communicate about the health effects, because they are not readily evident in the product itself. In order to successfully do this, the factors behind consumers� willingness to use modified foods must be identified. Specifically, in order to improve dietary fibre intake, consumers� perceptions of fibre and the possible obstacles to improving the intake of fibre should be investigated.
The general aim of this thesis was to investigate whether providing foods with added β-glucan would be a feasible strategy for improving consumers� dietary fibre intake.

16
1.1 Dietary fibre in a health-promoting diet
1.1.1 Definition and health benefits of dietary fibre
Dietary fibre is the non-digestible part of plant food and it includes a group of different compounds of varied nature. Trowell (1972) defined fibre as the skeletal remnants of plant cells that are resistant to hydrolysis by enzymes. In 2001 (Anonymous 2001), dietary fibre was defined as follows: �Dietary fiber is the edible parts of plants or analogous carbohydrates that are resistant to digestion and absorption in the human small intestine with complete or partial fermentation in the large intestine. Dietary fiber includes polysaccharides, oligosaccharides, lignin, and associated plant substances. Dietary fibers promote beneficial physiological effects including laxation, and/or blood cholesterol attenuation, and/or blood glucose attenuation.�
Dietary fibre can be classified according to its water solubility. Soluble fibres include mainly gums, pectins and mucilages while the insoluble fibres include cellulose, hemicellulose and lignin. According to another classification based on the chemical structure, the constituents of dietary fibre are non-starch polysaccharides and resistant oligosaccharides, analogous carbohydrates (e.g. indigestible dextrins, synthesised carbohydrate compounds), lignin and substances associated with the non-starch polysaccharide and lignin complex in plants (e.g. waxes, phytate, tannins, saponins) (Anonymous 2001). Different fibre types are fermented by bacteria in the colon. Water-soluble fibres are usually almost completely fermented while insoluble fibres are only partly fermented. Another important characteristic is the water-retention capacity, with the pectins, mucilages and hemicellulose having the best capacity.
Dietary fibre is collectively acknowledged to be one of the key factors in a health-promoting diet as the link between intake of dietary fibre and the reduced risk of many diseases is established in several studies. Increased dietary fibre intake decreases serum cholesterol levels (Brown et al. 1999) and reduces the risk of cardiovascular diseases (Pietinen et al. 1996, Rimm et al. 1996, Jenkins et al. 1998, Liu et al. 2002, Pereira et al. 2004). Intake of total dietary fibre (Bingham et al. 2003), especially from cereal and grain products (Hill 1998, Jansen et al. 1999) is also positively associated with a decreased risk of colorectal cancer and adenomas (Peters et al. 2003). However, a recent meta-analysis indicates a less

17
significant effect of dietary fibre on the risk of colorectal cancer (Park et al. 2005). Dietary fibre has also been proven to have a protective role in the development of diabetes (Meyer et al. 2000, Schulze et al. 2004). In addition, a high intake of dietary fibre is associated with increased frequency of bowel movements (Sanjoaquin et al. 2004) and it relieves constipation (reviewed by Dohnalek 2004), a condition that affects the quality of everyday life of many individuals.
The mechanism behind the effect of dietary fibre on health is not fully understood, and the evidence is based on associations between the prevalence or incidence of a particular disease and the amount of fibre in the diet. A diet high in dietary fibre may be low in energy content, saturated fat content or alter the absorption of harmful substances from the food, which may also partly explain the effect of dietary fibre on health. In adults, it is unlikely that a diet would have too high a fibre content. However, a high fibre diet may cause flatulence (Bolin & Stanton 1998), which may be inconvenient.
1.1.2 Recommended and current intake and sources of dietary fibre in the diet
Alarmingly, the intake of dietary fibre in many Western countries does not meet recommendations and it is believed that its intake is still decreasing in many countries (Miller-Jones 2004). In Table 1 the intake and sources of fibre and the recommended intake in selected countries is described with the aim of describing dietary fibre intake in different Western countries. The data in these studies were mainly collected in the 1990s (with some in the 1980s) using different methods (food frequency questionnaire, 24-h recall, weighted records). Due to the different dietary methods used, differences in the methods used to analyse the dietary fibre composition of foods, and differences in study populations (size, age range), comparison of the values should be made with caution. In all these countries, dietary fibre intake does not meet either the recommendations of the WHO (World Health Organisation) or of the country itself. The WHO�s recommendation for total dietary fibre intake is > 25 g/day (WHO 2003). Women tend to have more fibre-dense diets than men, although men�s average intake of dietary fibre is usually higher because of the higher energy intake. For example, in a Finnish nationally representative study, the fibre density of men�s and women�s diets was 2.5 g/MJ and 2.9 g/MJ, respectively, (Männistö et al. 2003).
18
The main sources of dietary fibre in the diet are culture dependent and vary slightly between countries, but Table 1 shows that bread, cereals, vegetables and fruit and berries are the most important sources of dietary fibre.
Apparent reasons for the decrease in fibre intake are a reduction in energy expenditure and food intake and changed eating habits. For example, in Finland, rye is a typically significant source of fibre and the consumption of rye products is the main indicator for high fibre intake (Valsta 1999). However, the consumption of rye per capita has decreased between 1970 and 2003 from 23.3 to 14.6 kg/capita/year (Statistics Finland 2004).
As intake of dietary fibre is positively associated with proven health benefits, there is a need to improve the intake. A �traditional� way of doing this would be to increase the consumption of high-fibre foods, such as wholegrain bread and cereals. A �new� way could be to add fibre to foods which traditionally do not contain dietary fibre, but which are consumed more and more in the current diet of many countries. For example, consumers� interest in ready-to-eat foods and functional beverages is increasing (Sloan 2005), and their dietary fibre content could possibly be modified.

Table 1. Intake and sources of fibre in selected Western countries and the recommended intake (g/day).
Country Study population
Men (g/day)
Women (g/day)
All (g/day) Main sources Reference Recommendation (g/day)
Austria N = 4661, 4�56 + y
18 Koenig and Elmadfa (1999)
30 g/day (National recommendation)
Belgium N = 11302, 25�74 y
8.4 g/1000 kcal/day
9.2 g/1000 kcal/day
De Henauw and De Backer (1999)
15�22 g/1000 kcal/day (National recommendation)
Denmark 22 18 Cereals 62% Vegetables 24% Fruit 12%
Miller-Jones (2004)*
Finland N = 2007, 25�64 y
21.8 (NSP) 18.5 (NSP) Bread 50% Fruit and berries 14% Other cereals 11% Vegetables 10%
Männistö et al. (2003)
25�35 (NSP) (National Nutrition Council 2005)
France N = 4080, 45�65 y
21.0 (DF) 17.1 (DF) Cereals 30�35% Vegetables 20�24% Fruit 19�22%
Lairon et al. (2003)
25�35 (DF) (National recommendation)
Germany 21.9 19.5 Bread Miller-Jones (2004)*
Greece N = 470, 18�64 y
18.2 Moschandreas and Kafatos (1999)
≥ 25 g/day (National recommendation)
Ireland N = 1379, 18�64 y
16.7 (NSP) 23.2 (DF)
13 (NSP) 17.4 (DF)
14.8 (NSP) 20.2 (DF)
Breads 30.7 % Potato 19.3% Vegetables 16.5%
Galvin et al. (2001)
18 (NSP) (National recommendation)
Netherlands 21 Gibney (2001)* Portugal N = 489,
≥ 40 y 26.3 (DF) Graca (1999) 27�40 g/day
(National recommendation) Spain 17 Gibney (2001)* Sweden N = 1651,
15�74 y 18 (DF) 15 (DF) Becker (1999) 25�35 (NSP) (Swedish Nutrition
Recommendations 1997) UK 20 20.4 20.3 (NSP) Bingham et al.
(2003) 18 (NSP) (National recommendation)
USA 13�15 g/d Miller-Jones (2004)*
NSP = Non-starch polysaccharides. DF = dietary fibre. * = review article; the author has gathered the information from various sources.
19

20
1.1.3 Consumers� perceptions of dietary fibre and barriers to increase the intake
In general, consumers have a positive perception of high-fibre products as regards their healthiness and nutritional value (Mialon et al. 2002). Dietary fibre is also recognised as an important target for modification in the diet. In an American study, 38% of the respondents reported having changed or to be currently changing their diet as regards fibre and 45% regarding fat (Auld et al., 1998). In addition, women, older participants, the better educated and respondents with diet-related disease were more likely to have made changes to their diets. Among Europeans, those who had changed their eating habits in the past 3 years had most frequently increased their consumption of fruit and vegetables and water and decreased their consumption of fat, energy intake (�calories�) and sugar (European Opinion Research Group 2003). In the latter study, no questions were asked about changes in dietary fibre intake.
Despite the positive attitudes of consumers towards dietary fibre, a lack of more detailed knowledge about dietary fibre and its sources in the diet has been observed in many studies. Whichelow (1988) found British consumers to have a lack of basic understanding of the term dietary fibre, because many of the respondents in her study believed that animal products were a source of dietary fibre. This was also the case in the study of Sobal and Cassidy (1993) among Americans. Less than one-third of the respondents could correctly classify at least eight foods according to their fibre content among ten food items of which five contained fibre and five did not (Whichelow 1987, 1988). The higher educated and females had a better knowledge of dietary fibre (Whichelow, 1988). Doctors and nurses, as health professionals, also lacked a comprehensive knowledge of dietary fibre (Whichelow 1988), which is alarming as, according to recent research results, doctors, in particular, are very trusted information sources about health in European countries (Spadaro 2003).
In some other studies, reasonably good consumer knowledge about dietary fibre has been found. American respondents could rate the fibre content of 40 foods to an extent that corresponded quite well to the chemical data about fibre content in the same foods (Sobal and Cassidy 1993). In Ireland, fibre intake from potatoes, vegetables, wholemeal bread and fruits was greater if the respondent�s attitude

21
towards fibre was positive (Barker et al. 1995), which indicates a knowledge of the sources of dietary fibre in a diet.
If consumers are unsure about the sources of dietary fibre in the diet, they are unlikely to understand the dietary recommendations in relation to the grams of dietary fibre that they should consume daily and where and how to obtain this amount. Although the recommendations given in grams are basically targeted at food professionals and the recommendations given in food and portion levels (e.g. �you need x pieces of bread per day to obtain sufficient fibre�) are targeted at consumers, nevertheless in the public discussion about dietary fibre, e.g. in newspapers, grams are often used, which makes the message ambiguous for consumers. However, the positive image of dietary fibre is an advantage when the aim is to increase its intake at the population level.
Nutritional knowledge is associated with the intake of fat, fruit and vegetables and those in the highest quintile for such knowledge are more likely to meet the consumption recommendations of these components (Wardle et al. 2000). Thus, if consumers do not have sufficient knowledge of the sources of dietary fibre, it may be a barrier to the increase in the intake of dietary fibre in their diet. When the aim is to increase the current intake of dietary fibre, it is essential to clarify consumer perceptions and/or misperceptions of dietary fibre. This knowledge could help to provide suitable and effective information to consumers. A general message about fibre is not as effective as a tailored message, which is based on the individual�s own present knowledge, beliefs and attitudes about fibre (Brinberg et al. 2003). In addition, although a general association between dietary fibre intake and its food sources is understood, the specific food sources of fibre may not be recognised (Cashel et al. 2001). Education campaigns alone, however, are not necessarily successful in improving dietary habits. The �five-a-day� campaign in the USA and the UK since the 1990s encourages using a minimum of five portions of vegetables and fruit per day, but it has had a quite small effect on the consumption of fruit and vegetables at national level so far (Lambert et al. 2002). Consumers had difficulty in knowing what foods were defined as fruit and vegetables and what constituted a portion.
Another obstacle to increase the intake of dietary fibre may be the palatability of products rich in dietary fibre. Berg et al. (2003) found that high fibre breakfast cereals and bread were perceived to be healthy but not necessarily palatable
22
among Swedish 11- to 15-year olds. In addition, the palatability of wholesome foods high in fibre is crucial in terms of compliance with a fibre-rich diet (Maier et al. 2000). The food industry could contribute to a health-promoting diet and possibly improve dietary fibre intake by providing tasty high-fibre products, which do not cost more than more refined grain products.
A diet rich in dietary fibre may also cause flatus emissions (Bolin & Stanton 1998), which can be considered annoying. This may be a reason to avoid a diet rich in fibre.
The development of the selection of foods in particular product categories may not have been favourable from the perspective of fibre intake. Consumption of fast food and ready-prepared foods has increased during the past decades all over the world. An Australian study found that the large proportion of energy coming from foods prepared outside the home was associated with a lower intake of dietary fibre (Burns et al. 2002). Of course the quality of these foods varies to a great extent and ready-prepared foods can also be wholesome and health promoting. However, if food habits are shifting towards frequent eating of more processed, ready-prepared foods, the lack of a variety of health-promoting, fibre-rich foods in this category may be an obstacle to increasing fibre intake.
1.2 β-glucan as a source of dietary fibre
β-glucan could be an appropriate dietary fibre alternative to be added into foods. β-glucan was selected because among fibres its health effects are the most extensively documented (e.g. a meta-analysis by Ripsin et al. 1992) and the use of health claims with β-glucan-containing foods is allowed in the USA (FDA 2004), Sweden (Anonymous 2004), Finland (Anonymous 2000) and the UK (Joint Health Claims Initiative 2004).
The β-glucan content of oat and barley varies mostly between 3 and 7% (oats) (Wood & Beer 1998) and between 3 and 11% (barley) (Skendi et al. 2003), making them significant sources of β-glucan in the diet. Food products containing oats or barley are natural sources of β-glucan in the diet. β-glucan can also be added to different foods, either cereal based or others, and in this way expand the selection of possible sources or fibre in the diet. Commercial food products to which β-glucan has been added are, e.g., pasta, oat flakes and cereals and bakery products.

23
1.2.1 Physical and chemical characteristics of β-glucan
The mixed linkage (1→3)(1→4)-β-D-glucans (β-glucans) in barley and oat are water-soluble, high molecular-weight polysaccharides (Wood 1986). β-glucans result in viscous and shear thinning solutions even at quite low concentrations (Wood and Beer 1998). Therefore, they are suitable alternatives for thickening agents in foods, e.g. beverages (Temelli et al. 2004), sauces, salad dressings and ice creams (Wood 1986). For example, at above a 0.5% concentration, barley β-glucan was found to produce a higher viscosity than pectin at the same concentration (Temelli et al. 2004).
The viscosity of β-glucan depends on the molecular weight, solubility and concentration (Autio 1996, Wood and Beer 1998, Wood et al. 2000). Oat β-glucans generally have a higher molecular weight than barley β-glucan (Wood et al. 1991, Autio 1996, Beer et al. 1997a). This difference between barley and oat β-glucan is relevant to consider in their behaviour in foods (Brennan and Cleary 2005). However, as regards the physiological characteristics of oat and barley β-glucans, they have been reported to have a quite similar efficacy (Delaney et al. 2003, Hallfrisch et al. 2003b).
1.2.2 Health effects of β-glucan
The health effects of oat and barley β-glucans have been studied since the 1970s. The cholesterol-lowering capacity of β-glucan and its ability to balance post-prandial blood glucose and insulin response has been extensively studied. Two meta-analyses by Ripsin et al. (1992) and Brown et al. (1999) have shown that oat β-glucan reduces elevated blood cholesterol levels. In Tables 2 (cholesterol-lowering capacity) and 3 (blood glucose response), a selection of studies conducted since 1990 is presented in more detail. They include studies performed both with oat and barley products, as barley β-glucan has also shown physiological efficacy, although the number of studies conducted with barley is much smaller than that of studies with oat products. In fact, oat and barley β-glucans have been reported to be equally effective (Delaney et al. 2003, Hallfrisch et al. 2003b).

24
The amount and source of β-glucan in all of these studies has varied, but on average the quantities have been under 10 g of β-glucan per day (Table 2) or per single portion (Table 3). Oat bran and oat bran concentrate have been quite commonly used sources of β-glucan. Most of the studies on the cholesterol-lowering effect have been performed with hypercholesterolemic subjects. In the majority of the studies, the β-glucan preparation has been described only very briefly and the data about its molecular weight are missing in almost every study. It would be of some value to compare the results of different studies in relation to the molecular weight of the β-glucan preparations used.

Table 2. Controlled human studies on the effect of oat or barley β-glucan on blood cholesterola levels since the 1990s.
Study Study subjects Study design
β-glucan preparation
Amount of BG
Carrier food Control diet
Time (weeks)
Changeb compared to baseline values
Differenceb compared to control group/control period
OAT β-GLUCAN Amundsen et al. 2003
N = 16 (7 F, 9 M), 57±7.9 y, hyper-cholesterolemic
Cross-over
Oat bran concentrate
Oat BG 5.1 g/day
Cereals, bread and muffins, tea cakes, fresh pasta, apple drink
Wheat or rye
3 Decreased, significance not reported
Lower compared to control period
Anderson et al. 1990
N = 12 M, 42�70 y, hyper-cholesterolemic
Cross-over
Oat bran Soluble fibre 7.4 g/day
Cereals Corn-flakes
2 Decreased Lower compared to control period
Anderson et al. 1991
N = 20 M, 38�70 y, hyper-cholesterolemic
Parallel groups
Oat bran Soluble fibre 13.4 g/ day
Hot cereal and oat bran muffins
Wheat bran
3 Decreased; NS change in the control group
Beer et al. 1995
N = 14 M, 20�28 y, healthy
Cross-over
Oat gum Oat BG 9 g/day
Instant whip Placebo whip
2 NS difference compared to control period
Braaten et al. 1994a
N = 19 (10 F, 9 M), 44�64 y, hyper-cholesterolemic
Cross-over
Oat gum Oat BG 5.8 g/day
Drink (non-carbonated)
Malto-dextrin
4 Decreased Lower compared to control period
25

Study Study subjects Study design
β-glucan preparation
Amount of BG
Carrier food Control diet
Time (weeks)
Changeb compared to baseline values
Differenceb compared to control group/control period
Davidson et al. 1991
N = 140 M/F, 30�65 y, hyper-cholesterolemic
Parallel groups
Oatmeal or oat bran
Oat BG 1.2�6.0 g/day
Hot cereals, muffins, shakes
Farina 6 Decreased with doses 3.6�6 g BG/day
Lower with 6 g BG in oatmeal and with 3.6�6.0 g BG in oat bran compared to control period
Davy et al. 2002
N = 36 M, 50�75 y, overweight
Parallel groups
Oatmeal and oat bran
Oat BG 5.5 g/day
Oatmeal and oat bran cereals
Wheat cereal
12 Decreased
Time-by-treatment interaction nearly significant
Keenan et al. 1991
N = 145 M, F, 20�70 y, hyper-cholesterolemic
Cross-over
Oat bran Soluble fibre 6.4 g/day
Cold cereal Wheat bran
6 Decreased Decrease greater compared to control group
Kerckhoffs et al. 2003 (Study 1)
N = 48 (27 F, 21 M), ~51.5 y, mildly hyper-cholesterolemic
Parallel groups
A mix of oat bran and oat bran concentrate
Oat BG 5.9 g/day
Bread and cookies
Wheat fibre
4 NS decrease
NS difference compared to control group
26

Study Study subjects Study design
β-glucan preparation
Amount of BG
Carrier food Control diet
Time (weeks)
Changeb compared to baseline values
Differenceb compared to control group/control period
Kerckhoffs et al. 2003 (Study 2)
N = 25 (15 F, 10 M), ~53.5 y, mildly hyper-cholesterolemic
A mix of oat bran and oat bran concentrate
Oat BG 5.0 g/day
Mixed with orange juice
Wheat fibre
2 Lower compared to control period
Kestin et al. 1990
N = 24 M, 29�61 y, mildly hyper-cholesterolemic
Cross-over
Oat bran Soluble fibre 5.8 g/day
Bread and muffins
Wheat bran
4 NS decrease
Lower compared to control period
Leadbetter et al. 1991
N = 40 (20 F, 20 M) 25�64 y, hyper-cholesterolemic
Cross-over
Oat bran Oat BG ~1.2�3.6 g/day
Cereals, bread, muffins, hot dishes
No sup-plement
4 NS differences compared to control period
Lovegrove et al. 2000
N = 62 (31 M, 31 F), ~56.6 y, healthy
Parallel groups
Oat bran concentrate
Oat BG 3 g/day
Cereal Wheat bran 20 g/day
8 NS decrease
NS difference compared to control group
Robitaille et al. 2005
N = 34 F, 22�53 y, overweight
Parallel groups
Oat bran Oat BG 2.31 g/day
Muffins No sup-plement
4 NS increase in treatment and control group
NS differences compared to control group
Törrönen et al. 1992
N = 28 M, 25�52 y, hyper-cholesterolemic
Parallel groups
Oat bran concentrate
Oat BG 11.2 g/day
Bread Wheat 8 NS decrease
NS differences compared to control group
27

Study Study subjects Study design
β-glucan preparation
Amount of BG
Carrier food Control diet
Time (weeks)
Changeb compared to baseline values
Differenceb compared to control group/control period
Uusitupa et al. 1992
N = 36 (16 F, 20 M), ~47.5 y, hyper-cholesterolemic
Parallel groups
Oat bran Oat BG 10.3 g/day
Juice, yoghurt, porridge and dessert
Wheat bran
8 NS decrease
NS differences compared to control group
Whyte et al. 1992
N = 23 M, 26�60 y, mildly hyper-cholesterolemic
Cross-over
Oat bran Oat BG 10.3 g
Breakfast cereals
Wheat bran 54 g/day
4 Decreased, significance not reported
Lower compared to control period
Önning et al. 1999
N = 52 M, 52�70 y, moderately hyper-cholesterolemic
Cross-over
Oat bran concentrate
Oat BG 3.8 g/day
Oat milk Rice milk
5 Decreased Lower compared to control period
BARLEY β-GLUCAN Behall et al. 2004a
N = 25 (18 F, 7 M), ~46.7 y, mildly hyper-cholesterolemic
Cross-over
Barley flakes, barley flour or pearled barley
Barley BG 0, 3 or 6 g/day
Pancakes, cookies, hot cereals, muffins, hot dishes
Wheat or rice
5 Decreased Lower in medium and high BG groups compared to control period
Behall et al. 2004b
N = 18 M, 28�62 y, moderately hyper-cholesterolemic
Cross-over
Barley flakes, barley flour or pearled barley
Barley BG < 0.4, 3 or 6 g/day
Pancakes, cookies, hot cereals, muffins, hot dishes
Wheat or rice
5 Decreased
Lower in high BG group compared to medium or low BG groups
28

Study Study subjects Study design
β-glucan preparation
Amount of BG
Carrier food Control diet
Time (weeks)
Changeb compared to baseline values
Differenceb compared to control group/control period
Keogh et al. 2003
N = 18 M, 38.8±10.1 y, mildly hyper-cholesterolemic
Cross-over
Enriched barley fibre
Barley BG 9.9 g/day
Bread, waffles, muffins, hot dishes, cakes, cookies
Glucose 4 NS change NS difference compared to control period
Li et. al. 2003
N = 10 F, 20.4±1.3 y, healthy
Cross-over
Whole grain barley
Barley BG 8.9 g/day
Barley mixed with rice
Rice 4 Decreased Lower compared to control period
Lupton et al. 1994
N = 79 (43 F, 36 M), 48.2 y, hyper-cholesterolemic
Parallel groups
Barley bran flour or barley oil extract
30 g barley bran flour or 3 g barley oil extract
Beverages (flour) or capsules (oil)
Cellulose 20 g/day
4 Decreased; NS change in control group
McIntosh et al. 1991
N = 21 M, 30�59 y, mildly hyper-cholesterolemic
Cross-over
Barley bran, barley flakes
Barley BG 8 g/day
Bread, muesli, spaghetti, biscuits
Whole wheat
4 Decreased, significance not reported
Lower compared to control period
BG = β-glucan NS = non-significant a Serum total cholesterol and/or LDL (low density lipoprotein) cholesterol b Significant change/difference at level P < 0.05 Beer et al. 1995: Molecular weight (MW) of BG used was 1 000 000 Kerckhoffs et al. 2003, study 1: Bread: MW < 250 000 55%, MW 250 000�1 000 000 30% Cookie: MW 250 000�1 000 000 45%, MW > 1 000 000 40% Kerckhoffs et al. 2003, study 2: MW < 250 000 28%, MW 250 000�1 000 000 49% Törrönen et al. 1992: MW of BG used 1 500 000
29

Table 3. Controlled human studies on the effect of oat or barley β-glucan on postprandial blood glucose measurementsa since the 1990s.
Study Study subjects β-glucan preparation
Amount of BG Carrier food Control meal Procedure Responseb compared to control load/meal
Braaten et al. 1991
N = 10 (6 F, 4 M), 25±1.8 y, healthy
Oat gum 14.5 g oat gum (78% BG) with 50 g glucose
Gel-like pudding
A drink with 50 g glucose
One load after 12 h fast
Lower response
Braaten et al. 1994b
N = 21 (7 F, 14 M), 38�68 y, healthy and with type 2 diabetes
Oat gum and oat bran
8.8 g BG with porridge meal
Porridge Wheat farina One meal after 12 h fast
Lower response in healthy subjects and in type 2 diabetic subjects
Tapola et al. 2005
N = 12 (5 F, 7 M), 66±7 y, type 2 diabetes patients
Oat bran Oat BG 9.4 g in flour 3.0 g in crisp 4.6 g in flour with glucose
Oat bran flour and oat bran crisps
12.5 g glucose with 250 ml water
One load after 12 h fast
Lower response with oat bran flour with and without glucose; NS difference with oat bran crisp
Tappy et al. 1996
N = 8 (1 F, 7 M), 34�65 y, NIDDM
Oat flour and oat bran
Oat BG 4, 6 or 8.4 g
Breakfast cereal
Continental breakfast (bread, milk, ham, cheese)
One load after 10�12 h fast
Lower response
Wood et al. 1990
N = 9 (5 F, 4 M), 23.6±1.3 y, healthy
Oat gum 14.5 g oat gum (78% BG) with 50 g glucose
Gel-like pudding
A drink with 50 g glucose
One load after an overnight fast
Lower response
Wood et al. 1994 (Study 1)
N = 9 (5 F, 4 M), ~31.5 y, healthy
Oat gum 1.8�7.2 g oat gum with 50 g glucose
Beverage A drink with 50 g glucose
One load after 12 h fast
NS lower response
30

Study Study subjects β-glucan preparation
Amount of BG Carrier food Control meal Procedure Responseb compared to control load/meal
Wood et al. 1994 (Study 2)
N = 11 (5 F, 6 M), ~37.5 y, healthy
Hydrolysed oat gum
7.2 g oat gum with 50 g glucose
Beverage A drink with 50 g glucose
One load after 12 h fast
NS lower response; the linear component of the treatment effect significant
Wood et al. 1994 (Study 3)
N = 8 (2 F, 6 M), healthy
Instantised oat gum
7.2 g oat gum with 29 g maltodextrin and 21 g glucose
Beverage A drink with 21 g glucose and 29 g maltodextrin
One load after 12 h fast
NS lower response
Yokoyama et al. 1997
N = 5 (1 F, 4 M), aged 36�60 y, healthy
Enriched barley flour
Barley BG 12 g
Pasta Wheat pasta One load after 12 h fast
Lower response
BG = β-glucan NS = non-significant a Peak glucose response, mean area under glucose curve or plasma glucose b Significant difference at level P < 0.05 NIDDM = Non-insulin dependent diabetes mellitus
31

32
At the moment, the Food and Drug Administration (FDA) in the USA allows the use of a generic health claim for oat and oat products mentioning the cholesterol-lowering effect of soluble fibre (β-glucan) and the reduction in the risk of coronary heart disease (FDA 2004). In one portion, there has to be at least 0.75 g of β-glucan and from a minimum of four portions it is possible to get 3 g of β-glucan per day. In Sweden, the code of practice concerning health claims also defines the minimum amount of oat β-glucan in one portion (0.75 g) or per day (3 g) (Anonymous 2004). In Finland, the National Food Agency allows a cholesterol-related health claim for oat flakes and oat bran if the product contains at least 5 g β-glucan per 100 g product (Anonymous 2000). In the UK, the Joint Health Claims Initiative allows a generic cholesterol-related claim relating to whole oats, oat bran, rolled oats and whole oat flour if the product contains at least 0.75 g β-glucan per serving, which is a quarter of the suggested daily intake (3 g) (Joint Health Claims Initiative 2004).
Although barley also contains significant amounts of β-glucan and it has been proven to have health effects, these regulations currently cover only β-glucan from oat. It remains to be seen if barley β-glucan will be included in the health-claim regulations in the future.
The viscosity of β-glucan is believed to be extremely important for its physiological efficacy. The size of the β-glucan molecules is an important characteristic of β-glucan, because the viscosity depends on the concentration, solubility and molecular weight of β-glucan (Autio 1996, Wood et al. 2000, Wood 2002). In a study by Ajithkumar et al. (2005), the molecular weight of β-glucan in selected oat cultivars varied between 1 250 000 and 1 780 000. Therefore it could roughly be defined that β-glucan with a molecular weight over 1 000 000 is unprocessed and high, and β-glucan with a molecular weight under 200 000 is strongly degraded and can be regarded as a low molecular weight β-glucan, not contributing strongly to viscosity. β-glucan with a molecular weight between 200 000 and 1 000 000 is degraded but still produces viscosity.
High molecular weight β-glucan produces higher viscosity than low molecular weight β-glucan at the same concentration. High viscosity (Wood et al. 1994) and high molecular weight (Wood et al. 2000) of β-glucan have both proved to be crucial for a decrease in the post-prandial glucose response. Wood (2002)

33
concluded comprehensively that the efficacy of β-glucan is dependent on four features, namely its dose, viscosity, molecular weight and solubility.
The potential physiological mechanisms behind the efficacy of β-glucan are suggested to be its ability to retard the absorption rate of food in the intestine due to increased viscosity, in this way balancing the post-prandial glucose and insulin response (Würsch & Pi-Sunyer 1997, Wood 2000, Jenkins et al. 2004). In addition, Gallaher and Hassel (1995) and Jalili et al. (2000) concluded in their reviews that increased viscosity in the small intestine interferes with cholesterol absorption or re-absorption, in this way affecting the cholesterol balance and synthesis in the body.
Not many human studies have been conducted showing possible adverse effects of a diet rich in β-glucan. Hallfrisch and Behall (2003a) concluded that consumption of oat or barley flour or extract was not related to any particular gastrointestinal symptoms.
1.2.3 β-glucan as an ingredient in processed foods
The food matrix and/or processing of the food in which β-glucan is incorporated, affects its physiological effectiveness. Processing may affect the molecular weight and solubility of β-glucan (Beer et al. 1997b) and therefore influence its physiological efficacy. High molecular weight β-glucan is particularly sensitive to processing. Freezing has not been found to affect the molecular weight of β-glucan (Beer et al. 1997b, , Suortti et al. 2000, Kerckhoffs et al. 2003), but it decreases the solubility of β-glucan (Beer et al. 1997b). On the other hand, heating makes β-glucan more soluble (Bhatty 1992, Jaskari et al. 1995) and enhances its physiological efficacy.
It is essential to consider the influence of food processing on the characteristics of β-glucan, because differences between food products in their cholesterol-lowering effects have been observed. Maier et al. (2000) compared five different ways to provide extra fibre to the diet and they found that an oat bran muffin increased LDL (low-density lipoprotein) cholesterol levels while the other four intervention foods (amaranth muffin, oat bran, oat bran flakes and a variety of oat bran products in the diet) reduced LDL cholesterol as expected. Similarly, a

34
study comparing bread, cookies and a drink as carrier products showed orange juice with β-glucan to lower LDL cholesterol while bread and cookies did not (Kerckhoffs et al. 2003). The baking process of bread decreased the molecular weight of β-glucan but it was not a clear reason for the lack of effect and, in particular, did not explain the ineffectiveness of cookies that contained a relatively high molecular weight β-glucan.
Previously, the effect of processing on the physiological efficacy has not been taken into account in the labelling rules for foods containing β-glucan and the regulations have been based only on the amount of β-glucan in the food. However, currently, in the Swedish health claim code of practice for the food sector (Anonymous 2004) this is taken into consideration by requiring a substantiation of the cholesterol-lowering effect after processing of raw materials rich in β-glucan.
1.2.4 Technological challenges in developing foods with added β-glucan
The viscosity of β-glucan may be problematic regarding the sensory quality of the foods containing β-glucan, but on the other hand it has been found to be important for the physiological effectiveness of β-glucan. The concentration of β-glucan in, e.g., beverages cannot be very high or the increasing viscosity makes the product undrinkable. In addition, the typical slimy texture of β-glucan in the mouth may be unacceptable in some products. Oat has a relatively high fat content compared to other grains and it easily develops a rancid off-flavour in unfavourable conditions (Welch 1995). Products that have a lower viscosity due to a lower molecular weight or a low concentration of β-glucan may have more acceptable sensory characteristics, but may not be physiologically efficacious. In developing foods with a high β-glucan content, this balance between a satisfactory sensory quality and health effects has to be kept in mind (Brennan and Cleary 2005). A food manufacturer should try to minimise the factors that reduce the solubility and molecular weight of β-glucan (Anttila et al. 2004).
Under research conditions, volunteers have rated their liking for test foods containing β-glucan. An oat-based soup with two different flavours was accepted quite well among participants, who consumed it 1�2 times daily for 23 weeks, as

35
only one participant left the trial before the end (Rytter et al. 1996). In a study by Önning et al. (1999), a blackcurrant flavoured oat milk was quite well liked (total liking was 7.2 on a scale of 1�9) among the volunteers and it did not differ from its counterpart (rice beverage with the same flavour) at a single evaluation. The sensory quality of a flavoured oat-based fermented product was acceptable (overall acceptability was 4.4�5.2 on a scale of 0�9) to a semi-trained sensory panel compared to flavoured, commercial yoghurt or non-dairy products (overall acceptability was 5.6�6.0 on a scale of 0�9) (Mårtensson et al. 2001), but this was only a simple taste test, not a long-term study. In a study by Mårtensson et al. (2005), volunteers participating in a trial consumed three servings (200 ml each) of β-glucan containing test products or a dairy-based control product for 5 weeks. The dairy-based product was more preferred than the oat products (the overall impression for the dairy-based product was 7 on a scale of 1�9 and for oat products 4), but the overall impression of one of the oat products improved during the test period from 4 to 6 points on a scale of 1�9. A similar effect was found in the study of Biörklund et al. (2005), where the total impression of the beverage samples with 5 or 10 g of barley or oat β-glucan increased during the test period (not indicated how much). In their study, the beverages with 10 g barley or oat β-glucan were rated lower (3.6 and 3.3 points on a scale of 1�9, respectively) than beverages with 5 g barley or oat β-glucan (5.5 and 5.4 points on a scale of 1�9, respectively), indicating that the increasing concentration of β-glucan impaired the sensory quality of the beverages.
Of course, well-designed consumer studies are certainly needed for defining the actual consumer acceptance of foods with a high β-glucan content, taking into account the various factors affecting the choice of functional foods. The crucial point is the long-term acceptance of these products and their sustained use in order to ensure the regular consumption of the required daily amount of β-glucan for achieving the health effects. A wide selection of different products containing β-glucan could help their versatile and easy use.
1.3 Factors influencing the acceptance of foods with health-related claims
Foods that contain sufficient β-glucan to have a health effect can be considered as functional foods and they could be marketed with health-related claims. The

36
European Consensus Group in an EU-funded project FUFOSE has presented a commonly used definition for functional foods: �Functional foods are satisfactorily demonstrated to affect beneficially one or more target functions in the body, beyond adequate nutritional effects in a way that is relevant to either an improved state of health and well-being and/or reduction of risk of disease� (Diplock et al. 1999). In Finland, the National Food Agency does not yet have a national definition for functional foods (Anonymous 2002) and for now it accepts the above-mentioned definition.
In an EU-funded PASSCLAIM project (The Process for the Assessment of Scientific Support for Claims on Foods), based on the FUFOSE project, a consensus view of the criteria that should be met for making valid health claims was developed (Aggett et al. 2005). According to the criteria, the following main points should be met for assuring that the health claims made are based on adequate scientific data and are thus valid: The food for which a claim is made must be characterised and the substantiation of the claim must be based on human data. Biologically and methodologically valid markers are to be used if the true endpoint of the benefit cannot be measured and the change in target variable should be statistically significant and biologically meaningful. All of the available data should be taken into account when assessing the validity of a claim.
In this thesis, the concept of functional foods is used in a broad sense, and includes foods that are marketed with health-related claims, whether the health effects have been scientifically proven or not. For example, in most of the studies that have investigated consumer responses towards functional foods, the products have not been tested regarding their actual health effect although they are labelled with health claims in the study situation.
In Finland, there are consumers who question the concept of functional foods and the trend of developing them (Niva et al. 2000). They are suspicious about the general tendency to emphasise the health aspects over the pleasurable and social aspects of foods. On the other hand, there are consumers who are interested in new foods with health effects and the possibility of staying healthy without drugs by using them (Niva et al. 2000). Finnish consumers could be divided into three groups with different attitudes towards functional foods: trustful, unconcerned and doubtful consumers (Niva et al. 2003). Trustful and unconcerned consumers shared positive attitudes towards functional foods

37
whereas trustful and doubtful consumers both considered control and regulation to be important factors.
Consumer expectations towards functional foods may be controversial. Consumers require products that are developed using technology but are still natural and untreated (Niva et al. 2003). In addition to product-specific factors and individual factors, acceptance of these products is influenced by the general discussion of trends in nutrition and food policy, food production and concepts of the healthiness of food (Niva et al. 2003). The general atmosphere is culture dependent and varies from country to country. Dieticians and medical doctors are in important positions regarding their opinions on functional foods. They have a significant influence on their patients and their own personal views on functional foods affect the advice they give to their patients. In a Dutch study, dieticians were somewhat sceptical about the use of functional foods and they were uncertain about the usage, safety, efficacy and target groups of the products (de Jong et al. 2004). Yet, 69% of the respondents thought that functional foods could improve particular body functions and 49% felt that functional foods can play a role in a healthy diet.
Only regular consumption of functional foods confers health benefits on consumers. Regarding functional foods containing β-glucan, the sensory quality of the products and information linked to them are key factors affecting the acceptance of the products. Individual attitudes, motivation factors and some demographic variables such as gender and age are also related to functional food choices. An additional product characteristic, price, is also relevant. In the following sections, these product-specific and individual factors affecting the use of functional foods, particularly foods that are comparable to foods containing β-glucan, is discussed.
1.3.1 Acceptable sensory quality
Pleasantness of food is one of the key factors affecting food choice (Arvola et al. 1999) and its importance dominates health issues (Glanz et al. 1998, Tepper and Trail 1998). Taste determines also the use of nutraceutical products (Cardello and Schutz 2003). Consumers are not willing to compromise between poor taste and health effects (Tuorila and Cardello 2002). They expect an acceptable

38
sensory quality from functional products; in a blind tasting study, Irish consumers selected the juice they preferred the most as being the �healthiest� sample (Luckow and Delahunty 2004). In a Finnish laddering study, taste and convenience were important reasons for choice of functional foods (Urala and Lähteenmäki 2003). According to a Belgian study, consumers are even less willing to compromise on the taste of functional foods than previously (Verbeke 2006). In addition to taste, the texture of food also significantly affects its liking (Moskowitz and Krieger 1995). Thus, in the development of functional foods the sensory quality of the product is at least equally important as the health effect.
1.3.2 Product information and personal motivation factors
Health claims connected with functional foods influence the acceptance of such foods. In fact, as the health benefit cannot usually be detected in the buying situation or immediately after the consumption of a functional food, information is the only way to communicate about the additional value of the functional product for consumers. Thus, information about the product can enhance the perceived benefit experienced from using the product (Bech-Larsen and Grunert 2003) and can therefore favourably affect its acceptability, for example in terms of willingness to use and buying the product. In their study, the effect of the health claim was positive in all three countries: Denmark, Finland and the USA. In a study by Bower et al. (2003) on fat spreads, information about the nutritional benefit, the name of the product and the price had a significant effect on buying intention. Kihlberg et al. (2005) observed that health information (�Product has a cholesterol-lowering effect�) increased the liking of bread among Swedish consumers.
The increasing strength of a health claim does not necessarily have an effect on the perceived benefit of the product and it depends on the familiarity of the functional component (Urala et al. 2003). In their study, Finnish consumers evaluated eight different health related claims, each presented on four strength levels. For example, the level 1 claim was �Product contains plenty of added fibre� and the level 4 claim was �The added fibre in the product prevents cancer�. If the functional component was familiar, the increasing strength of the claim did not increase the perceived benefit but if the component was less familiar, the perceived advantage improved with the increasing strength of the

39
claim. According to Bech-Larsen et al. (2001), 71% of Danish consumers, 73% of Finns and 53% of Americans consider themselves to be aware of the health effect of fibre. Thus, fibre can be regarded as quite a familiar component for consumers and therefore a less strong health claim could be sufficient for informing consumers about the health effects of fibre-rich foods. However, β-glucan is probably not as familiar a concept as fibre in general.
The efficacy of product information is not constant in all cases and for all consumers. Consumers� attitudes and personal needs define what information is noted and if and how these new beliefs are incorporated into consumers� knowledge systems (Lähteenmäki 2003). The type of consumers� nutrition knowledge has also been shown to have an effect on intended consumption of a functional food (Wansink et al. 2005). Those who had both attribute-related knowledge (e.g. �This food contains β-glucan�) and consequence-related knowledge (e.g. �β-glucan reduces your risk of coronary heart disease�) of functional foods were more willing to consume these products compared to those with only one type of information.
Consumers with health problems have been found to seek specific nutrition information that has relevance to them (Bhaskaran and Hardley 2002). For example, those who had high cholesterol levels were looking for cholesterol-free foods. An ill family member had a positive effect on the likelihood of acceptance of functional foods (Verbeke 2005). Information about the fibre content of a food was relevant for the elderly who were concerned about their fibre intake and thus it increased their purchase intent, contrary to younger consumers (Tuorila et al. 1998). The perceived reward from using functional foods is the best predictor for willingness to use such foods (Urala and Lähteenmäki 2004).
1.3.3 The role of carrier product
The nutritional quality of the carrier product defines more how consumers perceive the healthiness of functional foods than the health claim attached to the products (Bech-Larsen and Grunert 2003). Functional foods are not perceived only as functional foods but primarily to be members of particular product categories (Urala and Lähteenmäki 2003). In accordance with this, a chocolate

40
bar labelled with a health claim was not classified as a functional food but as a member of the chocolate product group in focus group discussions in Finland (Di Monaco et al. 2005). Therefore the use of functional foods cannot be disconnected from their �traditional� counterparts, and the existing health image of the carrier product group has an effect on consumer reactions towards the modified product. In a Finnish study, butter with a health claim about the positive health effect of conjugated linoleic acid was not accepted because butter itself has a negative health image in Finland (Lähteenmäki 2000). Because of this, a positive message attached to butter was regarded as false and irrelevant.
In addition to this, a very healthy product does not necessarily benefit from the addition of a functional component. If a product is perceived to be healthy as such, the added functionality does not necessarily make the product healthier in consumers� minds compared to some other products (Bech-Larsen and Grunert 2003). However, enriching a product with a compound already present in the product makes it acceptable to consumers. Danish consumers were most positive about functional foods that were enriched with a compound already existing in the product at lower concentration, e.g. enrichment of oat flakes with extra β-glucan (Poulsen 1999).
A discrepancy may exist between the opinions and views of consumers, food technologists, nutritionists and marketing professionals as regards successful and attractive carrier products and functional food concepts. Van Kleef et al. (2002) tested 300 mini-concepts with a varying carrier product, functional ingredient and health claim using 50 Dutch consumers by presenting verbal and visual information of the concepts. In addition, they interviewed 38 experts on food technology, nutrition or marketing. Comparison of the results showed that the experts could improve their understanding concerning consumers� views, nutritionists in particular, as the views of consumers and experts differed. For example, consumers did not find pills to be as attractive carriers for functional ingredients as did marketing professionals and food technologists. Consumers also found some carrier products to be more attractive than the experts, such as soups, chocolate, chewing gum and ice cream.

41
1.3.4 The effect of age and gender on the acceptance of functional foods
In some studies, women and elderly consumers have been shown to have higher potential as users of functional foods. Finnish women were more willing to use functional products than men, except cholesterol-lowering spreads (Niva et al. 2003). In Finland, the proportion of users of plant stanol ester margarine has been found to increase with age (Anttolainen et al. 2001). The elderly and women had a more positive attitude towards functional foods in Denmark (Poulsen 1999). However, opposing results exist also; Verbeke (2005) did not observe a gender effect in the acceptance of functional foods in Belgium and de Jong et al. (2003) found no difference between Dutch women and men in the use of cholesterol-lowering margarine. Thus, it seems that some of these so-called traditional demographic variables are not the best predictors for the use of functional foods in general, but they may be suitable for single products.
1.3.5 Price
Obviously the price of functional foods has an effect on their acceptance, as most of the consumers have restricted financial resources to use. Usually functional foods are more expensive than their traditional counterparts. Ollila et al. (2004) studied the effect of price in a representative sample of the Finnish population, observing it to have a key role in buying decisions of functional foods. Di Monaco et al. (2005) found that increasing the price reduced the likelihood of buying both for regular chocolate bars and chocolate bars with a health claim in Finland. Thus, the effect of increasing price was similar for both regular and functional products. Poulsen (1999) concluded that a positive attitude towards enriched products increased the willingness to pay more for these products, but he also mentioned that the role of price was not totally clear among Danish consumers. Among Dutch dieticians, 89% of the respondents thought that functional foods are expensive (de Jong et al. 2004). Their personal opinions may have a significant influence on the advice they give to their patients.

42
1.3.6 Aims of the study
As the intake of dietary fibre in general is below the recommendations, new ways to improve it should be explored. The general nutrition education about increasing the use of traditional sources of fibre has not been effective enough. The changing food consumption patterns indicate that new ways of including foods rich in dietary fibre in the diet would also be needed (Figure 2). These products should have an acceptable product quality and high consumer acceptance. The general aim of this thesis was to investigate whether providing foods enriched with β-glucan would produce a feasible strategy for improving consumers� dietary fibre intake (Figure 2).
The more detailed objectives were to study:
• how Finnish consumers perceive the role of fibre in a healthy diet and explore possible barriers to increasing fibre intake (I)
• how added β-glucan influences the perceived product quality, e.g. the sensory characteristics of two prototype foods, namely a beverage and a ready-to-eat frozen soup (II and III)
• consumer acceptability of β-glucan-containing beverage and ready-to-eat frozen soup prototypes and the role of health related claims in three countries differing in their food culture and views on healthy eating (IV)

43
The intake of dietary fibre is not sufficient
How to improve the intake of dietary fibre?
By informing about the �traditional� sources of fibre and encouraging
their use
By increasing the dietary fibre content of traditionalfibre sources (e.g. bread)
Sensory quality?
By understanding possible barriers to increase the intake of fibre
Technological feasibility?Consumer acceptance
By adding dietary fibre into new foods (e.g.
beverages)
�Generally� healthy fibre-rich products (β-glucan or other types of dietary fibre)
Special health effect (physiologically efficient amount of e.g. β-glucan)
With health claim
With health claim
The intake of dietary fibre is not sufficient
How to improve the intake of dietary fibre?How to improve the intake of dietary fibre?
By informing about the �traditional� sources of fibre and encouraging
their use
By informing about the �traditional� sources of fibre and encouraging
their use
By increasing the dietary fibre content of traditionalfibre sources (e.g. bread)
By increasing the dietary fibre content of traditionalfibre sources (e.g. bread)
Sensory quality?
By understanding possible barriers to increase the intake of fibre
Technological feasibility?Consumer acceptance
By adding dietary fibre into new foods (e.g.
beverages)
By adding dietary fibre into new foods (e.g.
beverages)
�Generally� healthy fibre-rich products (β-glucan or other types of dietary fibre)
Special health effect (physiologically efficient amount of e.g. β-glucan)
With health claim
With health claim
�Generally� healthy fibre-rich products (β-glucan or other types of dietary fibre)
Special health effect (physiologically efficient amount of e.g. β-glucan)
�Generally� healthy fibre-rich products (β-glucan or other types of dietary fibre)
�Generally� healthy fibre-rich products (β-glucan or other types of dietary fibre)
Special health effect (physiologically efficient amount of e.g. β-glucan)
Special health effect (physiologically efficient amount of e.g. β-glucan)
With health claim
With health claim
Physiological functionality? 4
Figure 2. Different means to improve the intake of dietary fibre and the aims of the present study (shaded).

44
2. Materials and methods The samples and experimental protocols are described only generally in this section. For more detailed information see the original Publications I�IV.
2.1 General description of the studies
Study I examined how Finnish consumers perceive the role of fibre in a healthy diet. Studies II and III concentrated on the sensory quality of β-glucan-containing foods. Two prototype foods were selected for the studies, namely beverage and ready-made frozen soup. The aim was to examine the effect of different oat (II and III) and barley (III) β-glucan preparations on the sensory characteristics and viscosity of a beverage prototype (II) and a ready-made soup prototype (III) and the influence of freezing on these parameters in soups (III). We also reflected on the sensory results as regards the chemical and physical characteristics of β-glucan. Study IV investigated consumer reactions towards beverages and ready-made frozen soups containing β-glucan in Finland, France and Sweden with the objective of describing the key factors for willingness to use these products. The three countries were selected because they were thought to represent different food cultures and to display variations in consumer views regarding the definitions of healthy eating (Margetts et al. 1997), the perceived benefits of healthy eating (Zunft et al. 1997) and the perceived need to alter eating habits (Kearney et al. 1997).
A beverage and a soup were chosen as examples of foods that are not naturally significant sources of dietary fibre but where β-glucan could be added. Although it may be challenging technologically to add a viscous fibre into beverages, beverages as vehicles for functional components are very interesting, because their consumption has increased during the past decades in Finland (Lahti-Koski and Siren 2004) and the consumption of portable beverages worldwide is increasing (Sloan 2004). According to Menrad (2003), it is also an important product category within functional foods. A ready-to-eat frozen soup is a potential product because of the increasing interest in ready-to-eat foods (Sloan 2005), and because consumers regard it as an interesting carrier product (van Kleef et al. 2002).
Table 4 presents in detail the aims, samples and participants.

Tabl
e 4.
Aim
of t
he st
udie
s and
the
sam
ples
and
the
part
icip
ants
.
Stud
y A
im
Car
rier
food
M
olec
ular
w
eigh
t of
β-gl
ucan
Con
cent
ratio
ns
used
R
efer
ence
sa
mpl
e Pa
rtic
ipan
ts
I To
des
crib
e Fi
nnis
h co
nsum
ers�
per
cept
ions
of
die
tary
fibr
e in
a
heal
thy
diet
.
- -
- -
Con
sum
ers:
N =
125
(F
51%
, M 4
9%,
mea
n ag
e 42
yea
rs)
II
To st
udy
the
effe
ct o
f di
ffer
ent o
at β
-glu
can
frac
tions
on
the
sens
ory
qual
ity a
nd v
isco
sity
of a
be
vera
ge p
roto
type
.
Ora
nge
beve
rage
B
G1:
2 0
00 0
00
BG
2: 2
000
000
B
G3:
160
000
B
G4:
60
000
BG
1 an
d B
G2:
0.
25%
, 0.5
%
and
1.0%
BG
3 an
d B
G4:
0.5
%,
1.0%
and
2%
Ora
nge
beve
rage
th
icke
ned
with
1.
3% C
MC
Trai
ned
sens
ory
pane
l:
N =
9�1
0
III
To e
xam
ine
the
effe
ct o
f di
ffer
ent o
at a
nd b
arle
y β-
gluc
an fr
actio
ns o
n th
e se
nsor
y qu
ality
and
vi
scos
ity o
f a re
ady-
mad
e so
up a
nd w
heth
er
free
zing
aff
ects
thes
e pa
ram
eter
s.
Roa
sted
bel
l-pe
pper
soup
O
at 1
: 2 0
00 0
00
Oat
2: 2
00 0
00
Bar
ley:
40
000
Oat
1: 0
.25%
, 0.
5% a
nd 1
.0%
O
at 2
and
B
arle
y: 0
.5%
, 1.
0% a
nd 2
%
Soup
thic
kene
d w
ith 0
.8%
m
odifi
ed st
arch
Trai
ned
sens
ory
pane
l:
N =
10
IV
To in
vest
igat
e w
hich
fa
ctor
s inf
luen
ce
cons
umer
s� w
illin
gnes
s to
use
a re
ady-
mad
e so
up
and
beve
rage
with
oat
β-
gluc
an in
thre
e co
untri
es.
App
le-p
ear
beve
rage
Fr
ozen
read
y-m
ade
shrim
p-di
ll so
up
Bev
erag
e:
prep
arat
ion
20
0 00
0
(in b
ever
age
80
�100
000
) So
up: 8
0 00
0
1.0%
A
pple
-pea
r be
vera
ge a
nd
shrim
p-di
ll so
up
with
out
β-gl
ucan
Trai
ned
sens
ory
pane
l: N
= 1
1 C
onsu
mer
s: N
= 1
157
in to
tal
(F 5
7%, M
43%
);
Finl
and
N =
353
; Fr
ance
N =
410
; Sw
eden
N =
394
, m
ainl
y ov
er 4
0 ye
ars
CM
C =
Car
boxy
met
hyl c
ellu
lose
F
= fe
mal
e M
= m
ale
46
2.2 Samples (Studies II�III and IV)
2.2.1 β-glucan preparations used in Studies II�IV
The β-glucan preparations used in Studies II�IV varied in their molecular weight between 40 000 and 2 000 000 (Table 3). The preparations were not identical in any of the studies, but, for example, preparation BG2 in Study II and Oat 1 in Study III were quite similar, oat-bran-type preparations, and preparation BG3 in Study II and Oat 2 in Study III were also quite similar, more processed preparations. Due to practical reasons (e.g. timetable of the studies), it was not possible to use the same preparations in each study, as the product is quite sensitive and not suitable for storing over a long time.
The suppliers of the preparations were the same in each study. The name of the company supplying the dry milled oat bran in Studies II and III changed between Studies II (Avena Oat Ingredients) and III (Finn Cereal), but it actually is the same company.
2.2.2 Beverage and soup samples
The samples used in Studies II�III and IV were either soups or beverages. Beverages were either orange (II) or apple-pear (IV) juice and soups were either roasted bell-pepper (III) or shrimp-dill (IV). In the orange beverages (II), four oat β-glucan preparations were used as thickeners and in the reference sample the thickener used was CMC (carboxymethyl cellulose). The β-glucan preparations were all added at three concentrations and the reference sample thickener at one concentration level. The samples were evaluated at room temperature (~20°C).
The selection of the concentration levels of the beverage samples was based on preliminary tests with the preparations. Because the viscosity-forming properties of the preparations were quite different, the BG1 and BG2 preparations being different from the BG3 and BG4 preparations, compromises had to be made, as the target was also to form an equivalent concentration series of each preparation to make the comparisons between them possible. In addition, the FDA regulation concerning the minimum amount of β-glucan per portion (0.75 g) or 3 g per day

47
for using a cholesterol-related health claim was considered. Basically, the objective was to put as much β-glucan as possible into the product.
In the roasted bell-pepper soup (III), two oat and one barley β-glucan preparations were added as thickeners at three concentration levels and the reference sample was thickened with modified starch at one concentration level. The samples were evaluated at +60°C. In both Studies II and III, the samples were evaluated at the sensory laboratory of VTT Biotechnology. The apple-pear beverage and the shrimp-dill soup samples in the consumer study (IV) either did not contain β-glucan or they contained β-glucan at one concentration level. The reference soup was thickened with maize starch. Consumers were advised to taste the beverage samples at refrigerator temperature and the soup samples after heating according to instructions (at circa +60�80°C) at home. For more detailed information about the samples, see Table 4 or the original publications.
The carrier foods used in Studies II�IV were the same, beverages and soups, although different flavours were used. In Study II, orange flavour was chosen, because it is a relatively familiar and neutral flavour and thus it did not excessively dominate the evaluation of the beverage samples. In Study III, the tomato-based roasted bell-pepper soup was considered suitable; as the β-glucan preparations were added to the soup base separately at VTT Biotechnology, for practicality, a homogenous soup was convenient. In Study IV, the apple-pear beverage sample and shrimp-dill soup sample were prepared on an industrial scale and the selection of the flavours was based on practicalities. In addition, these samples were used in clinical trials (not conducted by us), and the selection was also made from this point of view.
In Study IV, the use frequency of five different beverage types and five different soup types was rated in each country for screening the use frequency of the product categories (beverages and soups) in the study population. Some differences between countries existed between different types of beverages and soups, but, in general, respondents were users of the target products.

48
2.3 Participants
The participants were trained sensory panellists from VTT Biotechnology (II, III, IV) or consumers (I, IV). The trained sensory panellists in Studies II, III and IV created the vocabulary for evaluation of the samples and conducted a descriptive analysis. Panellists were staff of VTT Biotechnology and all were permanent members of a trained in-house panel with experience in sensory evaluation.
The panellists who developed the sensory vocabulary for the descriptive analysis of the samples (II, III, IV) were long-term (several years or more) members of the trained in-house panel at VTT Biotechnology. In Studies II�IV, the vocabularies for beverages and soups were developed by the same three or four panellists, although the fourth or fifth panellist was different for practical reasons. These panellists were experienced with the profiling of different types of foods, including beverages. The members of the whole sensory panel used in Studies II�IV completed and passed basic taste tests before joining the panel, and they also received education about the basic elements of sensory evaluation routines and methods. The new panel members participate in the evaluations as extra assessors whose ratings are omitted from the results. After three training sessions with a certain method (e.g. descriptive analysis) and fulfilling the criteria that the results of the particular panellist are within a prescribed range from the panel mean for 80% of the attributes in the descriptive analysis, they are included as full panel members. After this, in each project, the panel performance is monitored and further training and feedback are given.
The perceived role of fibre in a healthy diet was studied among Finnish consumers (I). A convenience sample of respondents was recruited from libraries, indoor swimming pools and shopping centres, places that are accessed by heterogeneous individuals. In Study IV, consumers in Finland, France and Sweden rated the liking and beneficiality of the samples and willingness to use and pay for them and filled in a background questionnaire. In all countries, the respondents were users of the target products. In this study, the Finnish convenience sample of consumers was recruited from shopping malls, sports centres, fire stations and from VTT (Technical Research Centre of Finland), because these locations are visited by individuals with different backgrounds. In France and Sweden, volunteers were recruited from consumer panels. In France, the collection of the data was carried out in three regions (the west and south-

49
east France and in Paris) to ensure a better representation of French consumers. The consumers were selected from a consumer database that was organised by a French food research institute. Unfortunately there is a lack of detail about the panel as a whole. In Sweden, the entire consumer panel comprises approximately 2300 members of whom 70% are women and 30% men, and who are aged between 18 and 75 years. The panellists are from southern Sweden, including both families with children and single households. The panel was recruited in the beginning of the year 2002 by advertising in local newspapers.
The target age group of the respondents in our study was 40 years or over, because they are more likely to be interested in these products than younger consumers, who do not need to think urgently about disease risk factors related to ageing. In Table 4 and in original publications I�IV, the participants are described in more detail.
2.4 Procedure and methods
In Study I, a semi-structured interview was used as the study method. Questions concerned the respondent's perceptions of a healthy diet, the function, sources and required amount of dietary fibre, information about dietary fibre and the use of bread (bread-related results were not reported in Study I). The respondents did not know, prior to the interview, that the actual theme of interest would be dietary fibre as they were told that the theme was health in general. Background information on socio-demographic factors and the health condition of the participants was collected and respondents also completed a fibre intake test (The Finnish Bread Information 1999) for assessing dietary fibre intake (Study I, Appendix 1). The fibre test (The Finnish Bread Information 1999) used in Study I is a quick, self-administered tool for estimation of dietary fibre intake. It is possible to roughly estimate respondents� intake of fibre with the test and it can be used for dividing respondents into different fibre intake- categories, or to monitor changes in respondent�s fibre intake. Each point in the test approximately equals the amount of food product that contains 1 g of fibre, but the test is too rough for direct conversion of points into grams of fibre. However, the classification of respondents into different categories according to their self-estimated fibre intake was thought to be appropriate. The fibre test has been validated with food diaries (Wegelius, unpublished data).

50
In Studies II�IV, the sensory evaluation of the samples was conducted with generic descriptive analysis (Lawless and Heymann 1998). The vocabulary was developed in one session in each study and a panel trained in three (II) or two (III) or one (IV) training sessions, the length of each session being about 30 min. The actual evaluations were conducted in eight (II) or twelve (III) or two (IV) sessions (including the replicate sessions) with blind-coded samples in the sensory evaluation laboratory at VTT Biotechnology, using a computerised data-gathering system (Compusense Inc.). Detailed instructions to the panellists for conducting the evaluations were used in each evaluation session. They included instructions on how to conduct the evaluation of the samples for each attribute. As an example, in Study II, the attribute �Thickness of the beverage in the mouth� was to be evaluated in the following way: �Evaluate the thickness of the beverage in the mouth by moving it around with your tongue. An example of a �not at all thick� beverage is water or juice, and an example of an �extremely thick� beverage is syrup or a thick fool.�
Constant rate measurement of viscosity as a function of shear rate was performed from the same samples evaluated by the sensory panel (II and III) with a StressTech rheometer at shear rates 16.4�157 s-1 at +20°C (II) or at +60°C (III).
In Study IV, consumers in Finland, France and Sweden evaluated their liking, perceived beneficiality and willingness to use the beverage or soup samples and how much they were willing to pay for them before and after tasting. They also completed a background questionnaire containing questions about demographic variables, general liking and use frequency of different soups and beverages, and health-related and attitude questions (attitude results were not reported in Study IV).
2.5 Data analysis
The data were analysed using the standard statistical procedures as described individually in Studies I�IV.
In Study I about consumer perceptions of dietary fibre, the content of the responses were first analysed and preliminarily categorised by the interviewer, after which all the authors jointly discussed the categorisation and some changes

51
were then made before making the final categorisation. The frequency distributions were tested using the χ2-test. The consumer data of Study IV were analysed using General Linear Model (GLM) Repeated Measures analysis to test the differences between samples in liking, perceived beneficiality and willingness to use them before and after tasting, and whether there would be differences between countries. In addition, the willingness to use samples among different age groups and by gender before and after tasting was tested using GLM Repeated Measures analysis. If significant differences were found in GLM Repeated Measures Analyses, further analyses were performed either using Tukey�s test or Paired Samples T-test. Pearson Correlation, two-tailed, was used in correlation analyses.
The effect of β-glucan source and concentration and freezing (only in Study III) on the differences between samples in sensory attributes was tested with ANOVA (Analysis of variance) in Studies II and III. In Study III, the analyses were run in several steps due to incomplete data. The data were incomplete because the concentration series of different samples varied (Oat 1: 0.25, 0.5 and 1%; Oat 2 and Barley: 0.5, 1 and 2%), and therefore it was not recommended to include them in the same analysis. If significant differences were found in ANOVA, the differences between samples were further tested with Tukey's test (p < 0.05). In Study III, the effect of freezing on the instrumental viscosity at a shear rate of 50 s-1 was analysed using the paired samples T-test. The relationships between sensory attributes and the instrumental measurements (viscosity and molecular weight) were analysed with correlation tests in Studies II and III. In Study IV, the differences between the sensory characteristics of the two beverage/soup samples were tested with ANOVA.
SPSS software (SPSS Inc.) was used in all statistical tests.

52
3. Results
3.1 Consumer perceptions of a healthy diet and dietary fibre in it (I)
3.1.1 Defining a healthy diet
In Study I, which concerned consumer perceptions of a healthy diet and dietary fibre in it, the majority, 62%, of the respondents, defined their own diet as being healthy. The essential elements of a healthy diet, such as �vegetables� (58%), �low in fat� (34%), �fruit and berries (22%)� and �variety (20%)�, were mentioned frequently. Thus, in theory the elements of a health-promoting diet are known. Only 5% of the respondents mentioned fibre as an element of a healthy diet, which means that dietary fibre was not spontaneously considered to be part of a healthy diet.
3.1.2 Intake and sources of fibre
We asked the respondents� opinion of their fibre intake. The majority of the respondents (almost 75%) considered the fibre content of their diet to be �adequate� or �possibly adequate�. About one-fifth thought that it was �inadequate� or �maybe inadequate�, and 6% could not estimate the amount of fibre in their diet. We then compared these results with the results from a fibre intake test. Among those who thought that their fibre intake was sufficient, about 40% actually had an inadequate intake of fibre and about 60% adequate. Noteworthy, about two-thirds of the respondents in the lowest fibre intake group incorrectly considered their fibre intake as being adequate/maybe adequate. The rest of them correctly estimated the intake as being inadequate/maybe inadequate.
The respondents stated that bread, vegetables and fruit were the best sources of fibre in their diet. Respectively, based on the fibre test (I: Appendix) results, bread (62.3% of the total fibre intake), vegetables (10.2%) and fruit and berries (8.4%) were the most important sources of dietary fibre (I: Fig. 1). The role of vegetables, fruit and berries as fibre sources was slightly overestimated in the interview compared to their actual proportions in the fibre test.

53
The results were completely different when the respondents were asked to estimate the amount of fibre that they should consume daily. Only a quarter of the respondents thought they might know the amount, the estimations varying between �800 mg� and two-thirds of the entire food intake. Consumers could not evaluate their fibre intake in the manner that is commonly used by nutritionists as a base for dietary recommendations given at food and portion level.
Based on the results from the fibre test, about half of the respondents could be classified as having an adequate intake of fibre. Altogether about one-third had insufficient or poor intake of fibre. Although the fibre intake of men was, on average, higher than that of women, there was a trend indicating the presence of more men than women in the lowest fibre intake group, but the difference was not statistically significant.
3.1.3 Perceptions of the role of dietary fibre in health
When the respondents were asked to spontaneously describe the key elements of a healthy diet, only 5% mentioned �fibre� and 10% �bread� on this occasion. On the other hand, 68% of the respondents considered fibre as very important for their health when this was specially asked. There were no differences between age groups regarding the perceived importance of fibre for health.
Respondents were then asked to describe why a sufficient intake of fibre was important for them. �Bowel function� (mentioned by 39% of the respondents) and �general well-being� (29%) were most often mentioned in response to this item. Dietary fibre was often defined by its functions: 'related to bowel/stomach function' (24%), 'related to digestion' (23%) and 'makes one feel full, decreases appetite' (12%) being the most frequent comments. Apart from these functional definitions, fibre was often defined by food items that the respondent thought to contain fibre. Vegetables (42%), cereals (33%), fruit (27%), bread (25%) and porridge (19%) were most often mentioned here. Thus, respondents seemed to be quite well informed about the sources of fibre in the diet as compared to the actual sources estimated with the fibre test (I: Fig. 1).

54
3.2 The effect of β-glucan on the sensory characteristics of beverages and soups (II and III)
3.2.1 Sensory profiles of the samples
Beverages and soups containing high molecular weight β-glucan (molecular weight 2 000 000) were thicker, slimier and more extensible compared to beverages and soups containing low molecular weight β-glucan (molecular weight 40 000�200 000) at the same concentration. In particular, the thickness and extensibility of beverages (II: Figs. 3 & 4) and the thickness, extensibility and sliminess of soups (III: Figs. 2�4) varied to a great extent between β-glucan types with different molecular weights.
Additionally, the changes as a function of concentration of β-glucan in the texture attribute intensities, such as thickness, sliminess and extensibility, were dissimilar in different preparations. In beverages, the high molecular weight β-glucans were more effective thickeners than low molecular weight β-glucans as a function of concentration. In soups, barley β-glucan increased sensory thickness only at concentrations ≥ 1% (III: Fig. 3) while oat β-glucan thickened the soup at lower levels (III: Fig. 3).
As the result of the β-glucan concentration in thicker beverages and soups, some flavour attributes were suppressed. Additionally, in Study III barley β-glucan seemed to modify taste attributes differently than oat β-glucan; the deterioration of flavours with increasing β-glucan concentration was weaker in soups containing barley β-glucan (III: Figs. 5�8).
Both in beverages and in soups, the maximum concentration of β-glucan was 0.5% for the high molecular weight preparations because above that concentration the beverages and soups became too thick. With the lower molecular weight preparations it was possible to add 2% β-glucan to beverages and soups and still have a feasible thickness.
The sensory profiles of the beverages and soups in Study IV showed that the beverage with β-glucan had a more intense oat flavour and weaker intensity of fruit aroma, total flavour intensity and sourness (IV: Fig. 2). The rancid off-flavour in the β-glucan beverage detected by the sensory panel was notable. The

55
texture of the β-glucan beverage was thicker, more extensible, grainier and slimier than the beverage without β-glucan (IV: Fig. 2). Despite the off-flavour detected in the β-glucan beverage, the microbiological quality of the beverage was normal, and the same samples were used in a clinical study conducted elsewhere. It was then decided to use them in the consumer tests also.
The soup with β-glucan had a less intense orange colour, the freshness of the aroma, the intensity of the shrimp aroma, the shrimp flavour, the dill flavour, the freshness of the flavour, the saltiness and the total flavour intensity than the soup without β-glucan (IV: Fig. 3). The intensity of the grain flavour and the possible off-flavour were more intense in the β-glucan soup compared to the soup without, but the off-flavour was much weaker than in the β-glucan beverage.
3.2.2 The effect of freezing (III)
Freezing the soups did not change their sensory quality (III), in practice, because the only difference found was a 0.5 point decrease on a scale of 0�10 in powderiness of the mouthfeel. However, freezing had a lowering effect on instrumentally measured viscosity, reducing it by about 30%, but this change was not observed in the sensory evaluation of the samples. Molecular weight did not notably change during freezing treatment.
3.2.3 The link between instrumental viscosity and sensory characteristics (II and III)
The correlation between instrumentally measured viscosity and sensory thickness was good. In beverages, the correlations were between 0.63 and 0.78 at shear rates of 26�100/s and in soups the correlation was 0.77 at a shear rate of 50/s. Many flavour characteristics correlated negatively with the viscosity of beverages and soups; in beverages, these attributes were sourness, intensity of orange aroma and total flavour intensity and, in soups, the intensity of tomato flavour, saltiness, sharpness and total flavour intensity.

56
3.3 Consumers� willingness to use beverages and soups containing oat β-glucan (IV)
For each beverage and soup sample, the respondents rated their liking, perceived beneficiality and willingness to use the particular sample before and after tasting. These three variables were inter-dependent as the correlations between the variables varied between 0.65 and 0.84 (beverages) and in soups between 0.58 and 0.82 (analysed all countries together, after tasting). Despite this, the results are reported separately as the variation in the variables was different as the correlations were not completely close to 1.0.
Liking for the products strongly determined the willingness to use them. Particularly in beverages containing β-glucan, liking, and thereby willingness to use them, decreased notably after tasting (IV: Figs. 4 & 6). Sensory evaluation of the samples by a trained panel showed that the beverage with β-glucan had a significant rancid off-flavour (IV: Fig. 2). The expected liking and willingness to use and particularly the perceived beneficiality were higher in β-glucan beverages with a health claim (IV: Fig. 5). After tasting, liking, perceived beneficiality and willingness to use decreased in beverages with β-glucan. Despite this decline, the β-glucan beverage with a health claim (either cholesterol or glucose related) was still perceived to be more beneficial than the β-glucan beverage without a health claim.
In soup samples, the presence of the health claim did not have a notable effect on liking before or after tasting but it increased the perceived beneficiality (before and after tasting) and willingness to use (only before tasting) compared to the other two samples (IV: Figs. 7�9). However, the differences between samples were very small on a scale of 1�7, especially in the glucose claim subgroup. The soups with β-glucan had much the same level of acceptance as the soup without β-glucan.
3.3.1 Differences between countries
The perceived beneficiality of beverages and soups was rated similarly in Finland, France and Sweden. In liking and in willingness to use beverages and soups, there were some differences between countries. Liking of beverages

57
without β-glucan in the cholesterol claim subgroup increased in Finland and Sweden after tasting but did not change in France. In soups, in the cholesterol claim subgroup in Sweden the sample without β-glucan was the best liked after tasting, while in Finland and in France all the samples were almost equally liked. The willingness to use beverages in the glucose claim subgroup differed between the three countries; after tasting, the willingness to use beverages with β-glucan decreased more steeply in France than in Finland and Sweden. In soups, in the cholesterol claim subgroup, Swedish consumers were most willing to use the sample without β-glucan after tasting while in Finland and in France all the samples were equally rated after tasting. However, these differences between countries were not very large.
3.3.2 The effect of age, gender and health motivation on willingness to use
Only the beverage group in Sweden showed an age effect on willingness to use. The youngest consumer group (≤ 48 years) was least willing to use the beverage with the health claim compared to the two oldest age groups.
No considerable differences were found between women�s and men�s willingness to use beverages and soups with health claims, despite some very small statistically significant differences and weak interactions between rating time, sample and gender, and rating time, country and gender.
A personal need to pay attention to blood cholesterol and glucose levels correlated weakly but significantly with an increased willingness to use β-glucan beverages with cholesterol/glucose-related health claims (correlation coefficients 0.15�0.30), the correlations being higher after tasting. No such effect was found in the soup group.
3.3.3 Willingness to pay for beverages and soups with health claims
The respondents were asked what would be the maximum prices they would be willing to pay for trying and regularly using each product. Before tasting, consumers were willing to pay the highest price for beverages (�1.20/portion;

58
250 ml) and soups (�2.35�2.42/portion) with β-glucan and a health claim. After tasting, the price that respondents were willing to pay for a beverage with a health claim dropped dramatically, by about 22�27%. Also, the prices for beverages with β-glucan but without a claim dropped by about 18�24%. In soups with β-glucan, the prices decreased by about 15% after tasting. The prices respondents were willing to pay for beverages and soups without β-glucan fell also, but slightly, between 4% and 10%. It seems that respondents were not willing to pay more for products with health claims.
Willingness to use a product correlated significantly with willingness to pay for trying or regularly buying the beverages and soup, the correlation coefficients varying between 0.34 and 0.52. Good correlations were obtained between willingness to pay to try a product and to regularly buy a product. In beverages, the correlations varied between 0.70 and 0.75 and in soups between 0.78 and 0.80.

59
4. Discussion
4.1 Methodological considerations
The semi-structured interview method was chosen in Study I because we wanted to gather information about consumers� opinions and views on health-promoting diet and fibre in their own language, and to understand their perceptions as a whole, without prior strong hypotheses (Eskola and Suoranta 2000). The structure helps in keeping the interviews similar every time; however, the method is flexible enough to take into account differences between respondents� response styles. The recorded interviews increased the reliability of the results as it was possible to check the notes written during the interview afterwards (Breakwell 2000). Content analysis and categorisation of the results made it possible to better find and describe larger issues in the data. This increases the information content and the meaningfulness of the data (Eskola and Suoranta 2000).
The content analysis and preliminary categorisation of the results were done by the interviewer (one of the investigators), after which all the investigators jointly discussed the categorisation and some changes were then made. In an optimal situation, the content analysis and categorisation of the results would have been made by several people independently in order to avoid bias, which may occur if difficulties in interpretation exist.
The size of the study population in Study I, 125 volunteers, was thought to be sufficient, as the same topics came up repeatedly, and according to a text book by Eskola & Suoranta (2000), it means that the data begin to reach saturation point. Men and women of different age groups were represented, although the study population had a slightly higher level of education than the Finnish population on average. In addition, Huotilainen et al. (2005) describe that the minimum number of participants in a qualitative interview study should be 10�50. A qualitative study is useful in describing and understanding a phenomenon (Eskola and Suoranta 2000) but the quantitative significance of the phenomenon in a particular population needs to be further studied with quantitative methods.
Because respondents did not know beforehand that their opinions on dietary fibre was what was of actual interest, the method improved the likelihood of

60
spontaneous reactions towards fibre, which would help in capturing realistic opinions of the topic. On the other hand, because the topics concerned health and diet, there may be a tendency to please the interviewer (Norenzayan & Schwarz 1999) by giving socially acceptable opinions on these matters, thus positively biasing the opinions on fibre and a health-promoting diet. In addition, as participation was voluntary, it is most likely that those who are willing to participate in these kinds of studies differ from those who are not willing. The participants may be more interested in food and health than the non-participants and also have a better knowledge of these matters. However, only about 20% of all contacted volunteers refused to take part thus indicating that there was not an extensive selectiveness bias in the data.
The fibre test (The Finnish Bread Information 1999) used in Study I may cause a slight overestimation of fibre intake because all choices increase fibre intake and the social acceptability of a high-fibre diet may influence the reported fibre intakes. However, in our study, the points gained from each selected food were not shown to the respondents while they were completing the questionnaire. In our study, the mean fibre intake points were 33 for men and 27 for women. The average fibre intake measured with 48-h dietary recall is 21.8 g/day for men and 18.5 g/day for women in Finland (Männistö et al. 2003). Thus, the absolute points in our study were higher than measured fibre intake in an average Finnish population, which shows that converting the points directly into grams would not be valid. However, the classification of respondents into different categories according to their self-estimated fibre intake appeared to be appropriate (Wegelius, unpublished data).
The descriptive analysis method used in Studies II�IV is suitable for defining the sensory characteristics of the product in detail and it produces objective information about the sensory attributes (Lawless and Heymann 1998). The reliability of the results can be improved by using replicate evaluation sessions and by training the panel, as was done in these studies. In addition, the use of warm-up samples in Studies II�III increase panellist reliability (Plemmons & Resurreccion 1998) and the scales used by panellists were adjusted with these reference sample ratings. The results obtained by the descriptive method are relative, however, and comparisons between samples can be made only within the samples evaluated on the same occasion and by the same panel. It is not possible to compare for example our numeric results with the results from other

61
studies. In addition, the results obtained with a trained panel and the descriptive method or any other analytical sensory method do not tell which sample is �the best� or anything else about consumer preferences.
To study consumer preferences, in Study IV, beverages and soup samples were tested with consumers without previous experience in sensory evaluation, the target age group being over 40 year-olds. The size of the study sample in Study IV varied between 353 and 410 in each of the countries. When our data were split into smaller subgroups according to different health claims, gender, age groups, the cell sizes of the data in most of the cases were close to 50, which has been suggested to be the minimum number of participants in a consumer study (Meilgaard et al. 1991). A convenience sample was used in Finland, and the recruitment locations (shopping malls, sports centres, fire stations and VTT (Technical Research Centre of Finland) were selected based on the fact that they are visited by individuals with different backgrounds. We were able to ensure that different education levels were represented in our data. The targeted age group, 40 years or over, was successfully met. It is not known how many consumers that were contacted refused to take part.
Tasting the samples in the home use situation is closer to the actual eating situation than tasting in laboratory conditions but is not fully comparable with a normal food use situation, naturally. In the test situation, the role of sensory quality is perhaps slightly more weighted than in a normal eating situation, where attention is often focused on factors other than just the food. Compared to central location tests, more information can usually be gathered in home use tests because respondents� have more time to complete the questionnaires (Meilgaard et al. 1991). A disadvantage is that researchers have no control over the testing situation; thus, the instructions have to be very clear and the amount of samples is limited in order to avoid mistakes and confusion. There may be differences between the liking scores from central location testing and home use testing, the scores obtained from home use testing being higher in many studies, but there is no overall consensus on which location would be the most appropriate (Boutrolle et al. 2005). In their study, although the scores differed between the two test situations, the liking order of the samples was the same in both tests.

62
The prototype food types chosen, a beverage and a soup, can be regarded as being quite familiar product types in each country, so in this respect the results obtained are comparable between countries. The questionnaires were translated from English into the three local languages: Finnish, Swedish and French. The translation may slightly change the meaning of the questions or they may be understood differently in different countries. We did not perform re-translation of the Finnish, Swedish and French questionnaires back into English, which would have improved the accuracy of the translated questionnaires.
4.2 Consumer perceptions of a healthy diet and dietary fibre
Finnish respondents in Study I mentioned similar factors as essential elements in a healthy diet, i.e. �vegetables�, �low in fat�, �fruit and berries� and �variety�, as did respondents in the pan-EU survey (Margetts et al. 1997). Thus, in theory the elements of a health-promoting diet are known.
The respondents could correctly describe the best sources of fibre in their own diet when asked, the most frequently mentioned sources being bread, vegetables and fruit, and the result corresponded well with the actual fibre sources in the diet estimated with the fibre test. In a nationally representative Finnish study, the main sources of dietary fibre were bread, fruit and berries, other cereals and vegetables (Männistö et al. 2003), the results being similar to those obtained in our study. In our study in the interview, however, the role attributed to vegetables and fruit and berries as fibre sources was perhaps slightly overestimated compared to their actual importance. In other studies, consumers have shown to have a fairly good knowledge of fibre sources in the diet, e.g. in Northern Ireland (Barker et al. 1995) and in the USA (Sobal and Cassidy 1993). Some studies, however, have found a lack of knowledge about fibre sources, e.g. in Australia (Cashel et al. 2001) and in the UK (Whichelow 1987, 1988).
Fibre was not frequently mentioned spontaneously as a key element of a health-promoting diet, but when it was specifically asked, almost 70% of the respondents considered fibre to be very important for their health. Similarly in an American study, fibre was considered to be very healthy among women (Oakes 2003). The result of our study emphasises the importance and relevance of the appropriate

63
phrasing of questions and how strongly this affects the responses. It is socially acceptable to regard fibre as important for health and this probably had an effect on the responses. The spontaneous situation, however, showed that the association between fibre and health is perhaps not so well realised as the link between a health-promoting diet and vegetables and fruit. In addition, the connection between a nutrient (fibre in this case) and health is understood differently than the link between a certain food or food group and health.
Currently the average intake of fibre is not sufficient in Finland; the recommended intake is 25�35 g/day (National Nutrition Council 2005) while the current intake is 21.8 g/day for men and 18.5 g/day for women (Männistö et al. 2003). Based on the results from the fibre test in our study, about one-third of the respondents altogether had an insufficient or poor intake of fibre. In particular, men in the lowest fibre intake group would need special attention in order to improve their diets. Because the fibre intake scores are not standardised by energy consumption, men�s absolute points in fibre intake testing may be higher than those of women as a result of higher total food consumption. This implies that the fibre density of the men�s diet (g/kJ) can be considerably lower than that of women. Consequently, men in the lowest fibre intake group are likely to have a diet with very low fibre density and have a need to significantly improve their diet quality in this sense. In Finland, the intake of fibre per kJ is lower in men (2.5 g/MJ) than in women (2.9 g/MJ) (Männistö et al. 2003).
Respondents could not estimate the amount of recommended daily fibre intake in the manner that is commonly used by nutritionists and also used as a base for recommendations given to consumers at food and portion level. This could be a problem in adopting dietary advice and in implementing it in practice. On the one hand, there is the simple and �down-to-earth� message about the number of slices of bread to be consumed daily, or the weekly consumption frequency of breakfast cereals, but on the other hand there is public discussion, e.g. in newspapers, on the recommendations in grams. For a lay person, it is difficult to find a connection and relationships between these two means of displaying the same recommendations. When possible, for example in dietary counselling, a tailored message based on consumer�s current knowledge is more effective than a general message (Brinberg et al. 2003).

64
The quite significant discrepancy between respondents� opinions on their own fibre intake and the result from the fibre intake test is noteworthy. About 40% of those who thought that their fibre intake was sufficient actually had an inadequate intake of fibre. In addition, over half of the respondents in the lowest fibre intake group actually considered their fibre intake to be adequate/maybe adequate. In other words, they estimated their diet quality to be better than it really was. Consumers may perceive the higher fibre intake to be socially more acceptable and hence it affected their estimations and responses; thus, they wanted to emphasise the good quality of their diet. Previously, in a Dutch population, the self-rated consumption of vegetables and fruit was much higher than the objective intake measured with a food frequency questionnaire, relating to positive beliefs concerning fruit and vegetable consumption (Lechner et al. 1997). Because in our study respondents overestimated fruit and vegetables as sources of fibre compared to their actual significance as fibre sources, it will lead to even more significant overestimation of dietary fibre intake if respondents at the same time believe that they use more fruit and vegetables than they actually do. This could partly explain the overestimation of dietary fibre intake. Overestimation of the overall quality of one�s own diet has been reported earlier by Variyam et al. (2001) with American respondents. In their study, men, smokers, the higher educated and those who perceived their health status as being excellent had an increased probability of overestimating their overall diet quality.
If consumers are not aware of their current consumption frequency of fibre-rich products, it is difficult to know how and to what extent to change their eating behaviour. This was suggested by Lambert et al. (2002), in the case of the five-a-day campaign and the consumption of fruit and vegetables, to partly explain its low success rate in the USA and UK. The campaign, launched in the 1990s, aimed to increase the intake of vegetables and fruit to five portions per day. So far, it has had only a small effect on the consumption of fruit and vegetables on a national level (Lambert et al. 2002). Lambert et al. (2002) propose also that fruit, vegetables and other healthy foods could be promoted with appropriate labelling and advertising campaigns. Development and marketing of foods with additional β-glucan or some other type of dietary fibre with comprehensible product-specific claims could be more effective than just campaigning for increasing use frequencies or amounts of traditional sources of dietary fibre. The Quaker Oats case in the USA showed that a health claim regarding oatmeal products and a

65
strong information campaign through electronic and print media improved the sale of the products and other products containing oat (Paul et al. 1999).
In our study, fibre was perceived to be equally important for health in all age groups. In some other studies, older respondents have had a higher purchase intent for a food containing fibre (Tuorila et al. 1998) and elderly women have also perceived fibre as being more important for health than young women (Oakes 2003). However, in these studies the younger respondents have been clearly younger (e.g. 15 year-olds, Tuorila et al. 1998) than the respondents in our study, who were mainly over 40-year-olds, so in this respect the results are not fully comparable. Fibre was perceived important for respondents because of its favourable effect on �bowel function� and �general well-being�. Respondents defined it according to its functionality and also according to the foods they thought to contain fibre. These results suggest that, when providing nutrition counselling, it is crucial to use concrete and actively used everyday terms to ensure successful and effective communication.
4.3 The effect of β-glucan on the sensory characteristics of beverages and soups
At the same β-glucan concentration, the sensory texture characteristics of beverages and soups differed significantly depending on the type of β-glucan. In beverages, the molecular weight of β-glucan varied between 60 0000 and 2 000 000 and in soups between 40 000 and 2 000 000, barley having the lowest molecular weight. Beverages and soups containing low molecular weight β-glucan were not so thick, slimy and extensible as those containing high molecular weight β-glucan. The results were as expected, as viscosity, i.e. the sensory thickness of β-glucan, is dependent on concentration and molecular weight (Wood et al. 2000). Because the concentrations were the same, the differences were caused by the varying molecular weight. The impurities of the fractions may also have a small effect on thickness but the role of molecular weight was fundamental. The strong correlations between molecular weight and thickness support this finding, which was reported earlier by e.g. Wood et al. (2000).
All β-glucan fractions in the beverage samples were from oat. Thus, the differences in texture characteristics at the same concentration of β-glucan can

66
mostly be explained by the variation in molecular weight. In soups, the source of β-glucan was oat or barley. Therefore, besides dissimilar molecular weights of the preparations, the different texture characteristics of the soup samples can also be caused by the different cereal sources of β-glucan. Oat fractions contained higher amounts of lipids and proteins than the barley fraction, whereas the total dietary fibre and carbohydrate content of the barley fraction was higher than in the oat fractions. Components, other than β-glucan, in the preparations may also have an effect on the texture characteristics but probably their effects are less than the effect of molecular weight or cereal source of β-glucan.
Increasing thickness suppressed flavour characteristics in beverages and soups, and oat β-glucan seemed to do it more than barley β-glucan. The masking effect of viscosity has been reported earlier (Pangborn et al. 1973, Wendin et al. 1997). However, other components in β-glucan fractions may also affect the taste of beverages and soups, since the fractions were not purely β-glucan but also contained other components. The level of purity varied between 13.4 g and 34.5 g β-glucan per 100 g fraction. It is necessary to consider the effect of increasing thickness on flavour characteristics when developing products with added dietary fibre. It may be relevant to compensate for the lower perceived intensity of flavours with, e.g., additional flavour components in order to achieve the desirable flavour quality. In the study by Temelli et al. (2004), raising the concentration of β-glucan in an orange-flavoured beverage did not statistically significantly influence the flavour perception, although there seemed to be a trend of this. However, they operated over quite a narrow concentration range (0.3�0.7% β-glucan) compared to our samples which contained 0.25�2% β-glucan. Their β-glucan fraction was also purer, containing over 80% β-glucan, but they did not report its molecular weight.
As freezing of the soups did not notably affect the sensory quality, the result indicates that in this respect a frozen ready-made food product would be a suitable alternative for β-glucan enrichment. Yet, as the instrumental viscosity decreased by about 30% after the freezing treatment, it would be necessary to investigate whether it would have an effect on the physiological efficacy. On the other hand, the molecular weight remained quite stable during the freezing treatment. This finding is similar to the study by Beer et al. (1997b). However, the solubility of β-glucan decreases during freezing (Beer et al. 1997b) and therefore may influence its physiological efficacy. Because soups are eaten

67
warm, it could alleviate the problem of reduced solubility and efficacy, because heating increases the solubility of β-glucan (Bhatty 1992, Jaskari et al. 1995).
The efficacy of β-glucan as a thickener and the influence of molecular weight on viscosity is a two-sided matter. On the one hand, as high molecular weight β-glucan is an effective thickener, it is required in smaller amounts than low molecular weight β-glucan and therefore it is cost effective. High molecular weight β-glucan is also physiologically more effective than low molecular weight β-glucan, as already mentioned, because of its viscosity-forming properties. On the other hand, high viscosity in food products, e.g. beverages, may be a negative feature in terms of sensory acceptability. Getting sufficient amounts of β-glucan into foods is a balance between sensory acceptability, physiological efficacy, food processing and also a question of price and cost effectiveness.
4.3.1 The link between instrumental viscosity and sensory characteristics
The good correlations between instrumentally measured viscosity and sensory thickness show a good performance by the sensory panel and it is possible to use instrumental viscosity measurements in estimating sensory thickness. In a study by Pangborn et al. (1978), viscosity measured at a shear rate of 30 rpm correlated very well (r > 0.9) with the sensory thickness of beverages. We found that viscosity measured at shear rates of both 50 s-1 (III) and 100 s-1 (II and III) correlated well with sensory thickness. In addition, many flavour characteristics correlated negatively with the viscosity of beverages and soups. The suppressing effect of viscosity on flavour has been discussed above.
4.4 Consumers� willingness to use beverages and soups containing oat β-glucan
As expected, a liking for the products was the strongest determinant for the willingness to use them. This was particularly clearly seen in beverages as the decreased liking of beverage samples containing β-glucan most likely caused a decrease in willingness to use them after tasting. Evidently, the rancid off-flavour detected by the trained panel affected liking. Taste is extremely

68
important in food choice, in general (e.g. Glanz et al. 1998, Tepper and Trail 1998, Arvola et al. 1999), and functional foods or nutraceuticals are no exception (Jonas and Beckmann 1998, Cardello and Schutz 2003). Off-flavour of a functional food can not be compensated for by a health effect (Tuorila and Cardello 2002).
The health claim conferred additional value to beverages before tasting because the expected liking and willingness to use and particularly the perceived beneficiality were higher in β-glucan beverages with a health claim. The health claim could not compensate for the fact that the actual taste could not fulfil the expectations and consequently liking, perceived beneficiality and willingness to use decreased after tasting. The β-glucan beverage with a health claim (either cholesterol or glucose related) was, however, still perceived to be more beneficial than the β-glucan beverage without a health claim but with the same sensory quality. Bech-Larsen and Grunert (2003) found health claims to have a positive influence on the perception of food healthiness. In a real market situation, a health claim for oatmeal and an information campaign increased the sale of it and of other oat-containing products (Paul et al. 1999).
In soups, in general, neither the tasting of them nor the presence of a health claim strongly affected the responses towards the soups, but the health claim could give a small additional benefit. All the soup samples, with or without β-glucan were quite equally accepted.
Obviously, health claims had a different effect on beverages and soups. The type of carrier product that is enriched and labelled with a health claim has an impact on consumer reactions towards it (de Jong et al. 2003). First, functional foods are positioned in a particular product category according to the carrier product and only secondly are they classified as functional foods (Urala and Lähteenmäki 2003). Why then had the health claim only a small effect if any on soups in particular? If a product is perceived to be healthy, consumers do not necessarily consider such a product to be more beneficial or better when enriched (Bech-Larsen and Grunert 2003). If a soup is regarded as a low-fat food (Kähkönen et al. 1995) and therefore healthy (Oakes 2003), it is difficult to add any benefit to it with enrichments.

69
Overall, the health claims about the specific health effects of β-glucan had only a rather small effect on perceived beneficiality and willingness to use the beverages and soups. Therefore it would be interesting to investigate what kind of effect could be achieved with general information about the dietary fibre content of the product. As consumers positively regard products with a high fibre content because of their perceived healthiness and nutritional value (Mialon et al. 2002), a message about dietary fibre in the products could also be effective, especially when based on consumers� present knowledge (Brinberg et al. 2003).
No significant differences between countries in liking or willingness to use the beverages or soups were found, and their perceived beneficiality was similar in all three countries. French consumers perhaps emphasised more strongly their dislike of beverages with β-glucan than consumers in Finland or Sweden. In another study, French consumers have been found to seek more pleasure from food and to prefer low-fat or low-salt diets less than Belgians, Americans or Japanese (Rozin et al. 1999). At the moment, there are not very many cross-cultural studies on the acceptance of functional foods. In a Danish study, American and Danish consumers were less positive than Finnish consumers about the foods enriched with omega-3 fatty acids or oligosaccharides, but in all three countries health claims positively affected the likelihood of buying the products (Bech-Larsen et al. 2001). The researchers also emphasised the effect the enrichment type (familiar or not familiar) and the carrier product type had on the acceptance of the products. In another Danish study, Danish consumers knew less about functional foods and had more doubts about their benefits than English consumers (Jonas and Beckmann 1998). Thus, it seems that there may be some cross-cultural differences in the acceptance of functional foods, but the differences vary depending on the comparable populations and their characteristics as well as the product and enrichment type. In addition, the differences are more in the degree of acceptability and not a question of acceptance or non-acceptance.
4.4.1 The effect of age, gender and health motivation
It is understandable that the elderly would be more interested in using functional foods (Poulsen 1999, Anttolainen et al. 2001) as they are more likely have personal experience of an illnesses appearing with age than the young. In Australia, older consumers paid more attention to preventive actions regarding

70
dietary changes, in this way possibly influencing the disease risk (Bhaskaran and Hardley 2002), and this could increase their use of functional foods.
Interestingly, in our study the effect of age on willingness to use was seen only in Sweden, where the group of consumers at age ≤ 48 years was least willing to use the beverage with a health claim. No such effect was found in other countries or in the willingness to use soups. It has been found that consumers in Finland and France share similar beliefs about the perceived benefits of healthy eating whereas Sweden was clustered with Denmark, Italy and Portugal (Zunft et al. 1997). In Finland, the extensive and systematic work at population level to lower the dietary risk factors of cardiovascular disease started with the North Karelia project in the early 1970s (Pietinen et al. 2001). Thus, the role of dietary change in preventing diseases has been widely discussed in Finland for over 30 years.
We did not find any considerable differences between women and men in their willingness to use foods with health claims. In an earlier study with a relatively small number of respondents (N = 70), women have had a higher purchase intent of functional spread (Bower et al. 2003) but another study described men to be more common users of plant sterol margarine in Finland (Anttolainen et al. 2001), and, in a third study, researchers did not find gender differences (de Jong et al. 2003). In general, women have been described to be more positive towards functional foods than men (Poulsen 1999, Urala et al. 2003). However, our finding is supported by those of Verbeke (2005) and de Jong et al, (2003) concerning the effect of gender; it does not necessarily differentiate the potential users of functional foods or the effect is highly product dependent. In addition, men suffer more from cardiovascular diseases (Statistics Finland 2003), which may make them more potential users of cholesterol-lowering products, because high cholesterol levels are one risk factor for cardiovascular diseases.
Those respondents who perceived a strong need to pay attention to blood cholesterol and glucose levels were more willing to use β-glucan beverages with cholesterol/glucose-related health claims. The correlations were, however, quite low in our study. Thus, personal health-related needs may be motivating factors for the use of functional foods, but their contribution to willingness to use is not necessarily considerable, which emphasises the variety of other factors affecting the willingness to use the products too. Tuorila et al. (1998) have found a link between acceptance of food labelled as �high-fibre� and concern with fibre

71
intake, and Bower et al. (2003) found a relationship between high health concern and high purchase intention of a spread labelled with a health benefit. The opposite could also be the case; if a person does not perceive him/herself to have a particular health problem, this may prevent him/her from buying a product labelled with a health claim related to this health problem, because there is no motivation to do so.
Interestingly, no such effect was found in the soup group. This could be explained by the more acceptable sensory quality of the β-glucan soups compared to β-glucan beverages. Because β-glucan soups were more liked than β-glucan beverages, they were easy to use as such and an additional motivation for using them was not needed for compensating for the off-flavour. Another explanation is the significant effect of the carrier product to which the health claim is attached. Urala and Lähteenmäki (2003) indicated that consumers do not perceive functional foods only as functional foods but foods within the particular product category where they belong. In addition, de Jong et al. (2003) observed that consumer characteristics of users of functional foods cannot be generalised over different food categories.
4.4.2 Willingness to pay for beverages and soups with health claims
Before tasting, consumers were willing to pay the highest price for beverages and soups with added β-glucan and a health claim. Thus, the functionality of the product was an acceptable reason for the higher price, and also consumer expectations towards the product were high. After tasting, the prices respondents were willing to pay decreased, indicating that the sensory quality of the products, both those with β-glucan and without, did not meet the expectations. It is obvious that the defective sensory quality of beverages with β-glucan caused this decrease for its part. In soups, the drop in the prices was not so dramatic. The prices estimated before tasting seemed to be quite unrealistic and did not correspond to the prices respondents actually would be willing to pay.
The sensory quality of the functional products has to be acceptable for consumers and, only after this, are they willing to pay a certain additional price for the beneficial health effect. There are probably consumer groups who, given

72
any conditions, are not willing to pay extra for functional foods, but there are also those for whom price is not so important a determinant in making a buying decision (Poulsen 1999). In a Danish study, consumers were not willing to pay extra for products with functional benefits (Jonas & Beckmann 1998). Among Finns too, the price of functional foods is important in making buying decisions (Ollila et al. 2004).
The correlations between willingness to use and willingness to pay indicate a link between these two factors but, as the correlations were only moderate, they measure and mean different things for consumers. A higher price is not linearly accepted although willingness to use a product would be strong.
Good correlations were obtained between willingness to pay to try a product and to regularly buy a product, indicating that if respondents were willing to pay a higher price to try a product, they also were willing to pay a higher price to regularly buy a product.
4.5 Feasibility of beverages and soups with added β-glucan
Technologically, low molecular weight β-glucan was easier to add into a product at higher quantities because it produced a lower viscosity than high molecular weight β-glucan. Yet, high molecular weight is important for the physiological efficacy of β-glucan. Because of this, the addition of β-glucan into foods could be done from two different perspectives. The low molecular weight β-glucan could be added into foods as dietary fibre, in general, not considering the proven cholesterol-lowering and blood glucose-balancing effects and the requirements for achieving them. Nevertheless, β-glucan is a type of dietary fibre and the food with added β-glucan could be marketed as �fibre-enriched�. As the health claims about the cholesterol-lowering and blood glucose-balancing effects of β-glucan had only quite a small effect on their perceived beneficiality and willingness to use them, general information about the fibre content of the product could be equally effective and generate the same positive image for the product as a specific health claim would.

73
However, another question is whether a relatively pure fibre concentrate could bring the same beneficial effects as the dietary fibre in vegetables, fruit and cereals, although the dietary fibre intake would certainly be improved with a product containing added fibre. The health benefits of fibre may be mediated also via other compounds and substances in a diet rich in dietary fibre, because the mechanisms behind the health effects of dietary fibre are not completely understood.
Another strategy is to add high molecular weight β-glucan as a special functional ingredient and aim at producing a food product with a product-specific effect and a health claim about the cholesterol-lowering and/or blood glucose-balancing effects.
Beverages and soups or similar products with added β-glucan could be feasible sources of β-glucan in the diet. Even at quite low concentrations, e.g. 0.5% β-glucan, a 250-ml portion of a beverage would contain 1.25 g of β-glucan, which is almost half of the daily amount recommended by the FDA in the USA. In soups, the same β-glucan concentration in a 300-ml portion of soup would result in a 1.5-g dosage of β-glucan from a single portion. Hence, the daily intake of 3 g β-glucan could be achieved by consuming one to two portions of different types of foods with added β-glucan. If the β-glucan concentration were 2%, which it was possible to achieve with the low molecular weight preparations, a single 250-ml portion of a beverage would provide 5 g β-glucan and a 300-ml portion of soup 6 g β-glucan.
To whom should foods with added β-glucan be targeted? Targeting them to the whole population would aim at increasing the dietary fibre intake at population level, which in turn, if successful, could have a significant effect on public health. Particularly, this could be a possible strategy if β-glucan were added into products as dietary fibre in general. However, it is essential to consider the possible differences in health effects arising from dietary fibre occurring naturally in foods and those resulting from added fibre concentrate. On the other hand, the products could be targeted at persons suffering from high cholesterol levels or diabetes, who would benefit from balanced blood glucose values if β-glucan were added as a special functional ingredient. In this case, these particular patient groups would benefit if the use of these products were sufficient in terms of mediating health effects, and if the quality of the rest of the

74
diet did not deteriorate. The question about an appropriate target group is a complex issue. Among Dutch dieticians, 9 out of 10 respondents felt uncertainty about the overall target groups of functional foods (de Jong et al. 2004). In addition, the appropriate target group from a public health perspective may be different from the food manufacturer�s point of view, taking a commercial approach. Further research is needed on how products enriched with dietary fibre affect the total dietary fibre intake in different target groups.

75
5. Conclusions The general aim of this thesis was to investigate whether foods enriched with a fibre component, namely β-glucan, would produce a feasible strategy for improving consumers� dietary fibre intake. Both consumer aspects regarding dietary fibre and fibre-enriched products, and product-related factors were studied.
Finnish consumers regarded dietary fibre as being important for their health. However, the contradiction between perceived and self-estimated intake of fibre can be an obstacle to improving the quality of the diet through nutrition education among particular groups of consumers, because the misperception may prevent implementation of the actually needed dietary changes. The contradiction may result from overestimating the use of foods rich in fibre in the diet, overestimating some foods as dietary fibre sources and unrealistic optimism concerning the quality of one�s own diet. Since the results indicate that consumers generally have a positive attitude towards high-fibre products, products either naturally containing fibre or with added fibre could be acceptable.
Enriching non-traditional foods with dietary fibre with a label informing on fibre enrichment could be a possible approach to improving dietary fibre intake, especially among those whose diet does not naturally contain sufficient traditional sources of dietary fibre. For these consumers, general nutrition education is not necessarily effective enough to ensure the inclusion of an adequate amount of traditional dietary fibre sources in the diet.
The sensory quality of beverages and soups with added oat or barley β-glucan was acceptable and the sensory characteristics of the soup did not change during freezing. Beverages and ready-to-eat frozen soups could be feasible carriers for β-glucan and thus provide a non-traditional source of dietary fibre. In product development it is important to take into account the increasing thickness and suppression of flavour characteristics caused by the added β-glucan fraction which could be counteracted, for example, by adding some flavour components, and it could be interesting to study this aspect further.

76
Overall, low molecular weight β-glucan was easier to add into a product at higher concentrations in terms of the sensory properties, but it is important to bear in mind the importance of high molecular weight β-glucan for its physiological efficacy. One strategy could be to add β-glucan into foods as dietary fibre, in general, aiming only at the increased fibre content of the food, while at the same time keeping in mind that the health effects of fibre concentrates and dietary fibre naturally present in foods may differ. In this case the low molecular weight β-glucan could be a suitable alternative as it can be added into foods at higher concentrations than high molecular weight β-glucan and still maintain feasible sensory properties. Another approach would be to add high molecular weight β-glucan and aim at the specific physiological efficacy of these foods.
Liking for beverages and soups was the strongest determinant for the willingness to use them, and therefore the taste and other sensory characteristics of foods with added β-glucan are key factors for the regular use of the products. The present study demonstrated that further research is needed for tailoring the sensory quality of the fibre-enriched products to make them more palatable. In particular, the off-flavour detected in beverages containing β-glucan showed the importance of the development of suitable process methods for β-glucan products. As the specific health claims gave only a small additional value to beverages and soups, general information about the fibre content of the product could be equally effective, because dietary fibre as such is positively linked with health in consumers� minds. The many different characteristics of a food product have to be in favourable balance for consumers in order to enhance the product acceptability and success in the market. Healthiness of food is, however, only one product feature and selection criterion among many others.
Dietary fibre-enriched foods might be valuable especially in snack and prepared food markets as their increasing consumption patterns could be utilised by offering new fibre sources in this category. However, the role of the new fibre-rich foods in the total intake of dietary fibre should be investigated in different target groups before conclusions can be made about whether they provide a feasible strategy for improving consumers� fibre intake.

77
References Aggett, P. J., Antoine, J.-M., Asp, N.-G., Bellisle, F., Contor, L., Cummings, J. H., Howlett, J., Müller, D. J. G., Persin, C., Pijls, L. T. J., Rechkemmer, G., Tuijtelaars, S. and Verhagen, H. 2005. PASSCLAIM. Consensus on Criteria. European Journal of Nutrition, Vol. 44, Suppl. 1, pp. I5�I30.
Ajithkumar, A., Andersson, R. and Åman, P. 2005. Content and molecular weight of extractable β-glucan in American and Swedish oat samples. Journal of Agricultural and Food Chemistry, Vol. 53, pp. 1205�1209.
Amundsen, Å. L., Haugum, B. and Andersson, H. 2003. Changes in serum cholesterol and sterol metabolites after intake of products enriched with an oat bran concentrate within a controlled diet. Scandinavian Journal of Nutrition, Vol. 47, pp. 68�74.
Anderson, J. W., Gilinsky, N. H., Deakins, D. A., Smith, S. F., O�Neal, D. S., Dillon, D. W. and Oeltgen, P. R. 1991. Lipid responses of hypercholesterolemic men to oat bran and wheat bran intake. American Journal of Clinical Nutrition, Vol. 54, pp. 678�683.
Anderson, J. W., Spencer, D. B., Hamilton, C. C., Smith, S. F., Tietyen, J., Bryant, C. A. and Oeltgen, P. 1990. Oat-bran cereal lowers serum total and LDL cholesterol in hypercholesterolemic men. American Journal of Clinical Nutrition, Vol. 52, pp. 495�499.
Anonymous. 2000. Valvonta 8/2000. Kolesteroliväitteiden valvontaopas. Elintarvikkeiden pakkausmerkinnöissä ja muussa markkinoinnissa käytettäviä veren kolesteroliin viittaavia väitteitä koskeva opas. Helsinki: National Food Agency Finland. [In Finnish.]
Anonymous. 2001. The definition of dietary fiber. Report of the Dietary Fiber Definition Committee to the Board of Directors of the American Association of Cereal Chemists. Cereal Foods World, Vol. 46, pp. 112�126.
Anonymous. 2002. Guide for the control of health claims. Guidebook 3/2002. Helsinki: National Food Agency Finland.

78
Anonymous. 2004. Health claims in the labelling and marketing of food products. The food sector�s code of practice, appendix 2. Lund: SNF Swedish Nutrition Foundation. http://www.hp-info.nu/SweCode_2004_1.pdf. Accessed 12.5.2005.
Anttila, H., Sontag-Strohm, T. and Salovaara, H. 2004. Viscosity of beta-glucan in oat products. Agricultural and Food Science, Vol. 13, pp. 80�87.
Anttolainen, M., Luoto, R., Uutela, A., Boice, J. D., Blot, W. T., McLaughlin, J. K. and Puska, P. 2001. Characteristics of users and nonusers of plant sterol margarine in Finland: An approach to study functional foods. Journal of the American Dietetic Association, Vol. 101, pp. 1365�1368.
Arvola, A., Lähteenmäki, L. and Tuorila, H. 1999. Predicting the intent to purchase unfamiliar and familiar cheeses: the effects of attitudes, expected liking and food neophobia. Appetite, Vol. 32, pp. 113�126.
Auld, G. W., Nitzke, S. A., McNulty, J., Bock, M. A., Bruhn, C. M., Gabel, K., Lauritzen, G., Lee, Y. F., Medeiros, D., Newman, R., Ortiz, M., Read, M., Schutz, H. and Sheehan, E. 1998. A stage-of-change classification system based on actions and beliefs regarding dietary fat and fiber. American Journal of Health Promotion, Vol. 12, pp. 192�201.
Autio, K. 1996. Functional aspects of cell wall polysaccharides. In: Eliasson, A.-C. (ed.). Carbohydrates in Food. New York: Marcel Dekker. Pp. 227�264.
Barker, M. E., Thompson, K. A. and McClean, S. I. 1995. Attitudinal dimensions of food choice and nutrient intake. British Journal of Nutrition 74, pp. 649�659.
Bech-Larsen, T. and Grunert, K. G. 2003. The perceived healthiness of functional foods. A conjoint study of Danish, Finnish and American consumers� perception of functional foods. Appetite, Vol. 40, pp. 9�14.
Bech-Larsen, T., Grunert, K. G. and Poulsen, J. B. 2001. The acceptance of functional foods in Denmark, Finland and the United States. MAPP Working paper 73. Aarhus: The Aarhus School of Business.

79
Becker, W. 1999. Dietary guidelines and patterns of food and nutrient intake in Sweden. British Journal of Nutrition, Vol. 81, Suppl. 2, pp. S113�S117.
Beer, M. U., Arrigoni, E. and Amando, R. 1995. Effects of oat gum on blood cholesterol levels in healthy young men. European Journal of Clinical Nutrition, Vol. 49, pp. 517�522.
Beer, M. U., Wood, P. J. and Weisz, J. 1997a. Molecular weight distribution and (1→3)(1→4)-β-D-glucan content of consecutive extracts of various oat and barley cultivars. Cereal Chemistry, Vol. 74, pp. 476�480.
Beer, M. U., Wood, P. J., Weisz, J. and Fillion, N. 1997b. Effect of cooking and storage on the amount and molecular weight of (1-3)(1-4)- β-D-glucan extracted from oat products by an in vitro digestion system. Cereal Chemistry, Vol. 74, pp. 705�709.
Behall, K. M., Scholfield, D. J. and Hallfrisch, J. 2004a. Diets containing barley significantly reduce lipids in mildly hypercholesterolemic men and women. American Journal of Clinical Nutrition, Vol. 80, pp. 1185�93.
Behall, K. M., Scholfield, D. J. and Hallfrisch, J. 2004b. Lipids significantly reduced by diets containing barley in moderately hypercholesterolemic men. Journal of the American College of Nutrition, Vol. 23, pp. 55�62.
Berg, C., Jonsson, I., Conner, M. and Lissner, L. 2003. Perceptions and reasons for choice of fat- and fibre-containing foods by Swedish schoolchildren. Appetite, Vol. 40, pp. 61�67.
Bhaskaran, S. and Hardley, F. 2002. Buyers beliefs, attitudes and behaviour: foods with therapeutic claims. Journal of Consumer Marketing, Vol. 19, pp. 591�606.
Bhatty, R. S. 1992. Total and extractable β-glucan contents of oats and their relationship to viscosity. Journal of Cereal Science, Vol. 15, pp. 185�192.
Bingham, S. A., Day, N. E., Luben, R., Ferrari, P., Slimani, N., Norat, T., Clavel-Chapelon, F., Kesse, E., Nieters, A., Boeing, H., Tjønneland, A., Overvad, K., Martinez, C., Dorrensoro, M., Gonzalez, C. A., Key, T. J., Trichopoulou, A., Naska, A., Vineis, P., Tumino, R., Krogh, V., Bueno-de-Mesquita, H. B., Peeters, P. HM.,

80
Berglung, G., Hallmans, G., Lund, E., Skele, G., Kaaks, R. and Riboli, E. 2003. Dietary fibre in food and protection against colorectal cancer in the European Prospective Investigation into Cancer and Nutrition (EPIC): an observational study. Lancet, Vol. 361, pp. 1496�1501.
Biörklund, M., van Rees, A., Mensink, R. P. and Önning, G. 2005. Changes in serum lipids and postprandial glucose and insulin concentrations after consumption of beverages with β-glucans from oats and barley: a randomised dose-controlled trial. European Journal of Clinical Nutrition, Vol. 59, pp. 1272�1281.
Bolin, T. D. and Stanton, R. A. 1998. Flatus emission patterns and fibre intake. European Journal of Surgery, Vol. 164, Suppl. 582, pp. 115�118.
Boutrolle, I., Arranz, D., Rogeaux, M. and Delarue, J. 2005. Comparing central location test and home use test results: Application of a new criterion. Food Quality and Preference, Vol. 16, pp. 704�713.
Bower, J., Saadat, M. A. and Whitten, C. 2003. Effect of liking, information and consumer characteristics on purchase intention and willingness to pay more for a fat spread with a proven health benefit. Food Quality and Preference, Vol. 14, pp. 65�74.
Braaten, J. T., Wood, P. J., Scott, F. W., Riedel, K. D, Poste, L. M. and Collins, M. W. 1991. Oat gum lowers glucose and insulin after an oral glucose load. American Journal of Clinical Nutrition, Vol. 53, pp. 1425�1430.
Braaten, J. T., Wood, P. J., Scott, F. W., Wolynetz, M. S., Lowe, M. K., Bradley-White, P. and Collins, M. W. 1994a. Oat beta-glucan reduces blood cholesterol concentration in hypercholesterolemic subjects. European Journal of Clinical Nutrition, Vol. 48, pp. 465�474.
Braaten, J. T., Scott, F. W., Wood, P. J., Riedel, K. D., Wolynetz, M. S., Brulé, D. and Collins, M. W. 1994b. High β-glucan oat bran and oat gum reduce postprandial blood glucose and insulin in subjects with and without type 2 diabetes. Diabetic Medicine, Vol. 11, pp. 312�318.

81
Breakwell, G. M. 2000. Interviewing. In: Breakwell, G. M., Hammond, S. and Fife-Schaw, C. (eds.). Research methods in psychology. London: Sage Publications. Pp. 239�250.
Brennan, C. S. and Cleary, L. J. 2005. The potential use of cereal (1→3, 1→4)-β-D-glucans as functional food ingredients. Journal of Cereal Science, Vol. 42, pp. 1�13.
Brinberg, D., Axelson, M. L. and Price, S. 2003. Changing food knowledge, food choice, and dietary fiber consumption by using tailored messages. Appetite, Vol. 35, pp. 35�43.
Brown, L., Rosner, B., Willett, W. W. and Sacks, F. M. 1999. Cholesterol-lowering effects of dietary fiber: a meta-analysis. American Journal of Clinical Nutrition, Vol. 69, pp. 30�42.
Burns, C., Jackson, M., Gibbons, C. and Stoney, R. M. 2002. Foods prepared outside the home: association with selected nutrients and body mass index in adult Australians. Public Health Nutrition, Vol. 5, pp. 441�448.
Cardello, A. V. and Schutz, H. G. 2003. The importance of taste and other product factors to consumer interest in nutraceutical products: Civilian and military comparisons. Journal of Food Science, Vol. 68, pp. 1519�1524.
Cashel, K. M., Crawford, D., Deakin, V. and Talbot, B. 2001. Is the link between nutrients and food understood? The case of fibre and folate. Public Health Nutrition, Vol. 4, pp. 913�918.
Davidson, M. H., Dugan, L. D., Burns, J. H., Bova, J., Story, K. and Drennan, K. B. 1991. The hypocholesterolemic effects of beta-glucan in oatmeal and oat bran. A dose-controlled study. JAMA, Vol. 266, pp. 1833�1839.
Davy, B. M., Davy, K. P., Ho, R. C., Beske, S. D., Davrath, L. R. and Melby, C. L. 2002. High-fiber oat cereal compared with wheat cereal consumption favourably alters LDL-cholesterol subclass and particle numbers in middle-aged and older men. American Journal of Clinical Nutrition, Vol. 76, pp. 351�358.

82
Delaney, B., Nicolosi, R. J., Wilson, T. A., Carlson, T., Frazer, S., Zheng, G.-H., Hess, R., Ostergren, K., Haworth, J. and Knutson, N. 2003. Beta-glucan fractions from barley and oats are similarly antiatherogenic in hypercholesterolemic Syrian golden hamsters. Journal of Nutrition, Vol. 133, pp. 468�495.
Di Monaco, R., Ollila, S. and Tuorila, H. 2005. Effect of price on pleasantness ratings and use intentions for a chocolate bar in the presence and absence of a health claim. Journal of Sensory Studies, Vol. 20, pp. 1�16.
Diplock, A. T., Aggett, P. J., Ashwell, M., Bornet, F., Fern, E. B. and Robertfroid, M. B. 1999. Scientific concepts of functional foods in Europe: Consensus Document. British Journal of Nutrition, Vol. 81S, pp. S1�S27.
Dohnalek, M. H. 2004. The role of fibre in clinical nutrition. In: van der Kamp, J. W., Asp, N.-G., Miller-Jones, J. and Schaafsma, G. (eds.). Dietary fibre. Bioactive carbohydrates for food and feed. Wageningen: Wageningen Academic Publishers. Pp. 271�294.
Eskola, J. and Suoranta, J. 2000. Introduction to qualitative research. [Johdatus laadulliseen tutkimukseen]. Tampere: Vastapaino. [In Finnish.]
European Opinion Research Group EEIG. 2003. Health, food and alcohol and safety. Special Eurobarometer 186 / Wave 59.0. http://europa.eu.int/comm/health/ph_determinants/life_style/alcohol/documents/ebs_186_en.pdf. Accessed 13.5.2005.
FDA 2004. Code of Federal regulations, Title 21, Volume 2, Part 101, § 101.81. Health claims: Soluble fiber from certain foods and risk of coronary heart disease (CHD). Department of Health and Human Services. Food Labeling. http://a257.g.akamaitech.net/7/257/2422/12feb20041500/edocket.access.gpo.gov/cfr_2004/aprqtr/pdf/21cfr101.81.pdf. Accessed 12.5.2005.
The Finnish Bread Information. 1999. http://www.leipatiedotus.fi/default.aspx?path=4;177. [In Finnish.] Accessed 11.5.2005.

83
Gallaher, D. D. and Hassel, C. A. 1995. The role of viscosity in the cholesterol-lowering effect of dietary fiber. In: Kritchevsky, D. and Bonfield, C. (eds). Dietary Fibre in health and disease. Minnesota: Eagan Press. Pp. 106�114.
Galvin, M. A., Kiely, M., Harrington, K. E. Robson, P. J., Moore, R. and Flynn, A. 2001. The North/South Ireland food consumption survey: the dietary fibre intake of Irish adults. Public Health Nutrition, Vol. 4(5A), pp. 1061�1068.
Gibney, M. J. 2001. Nutrition and diet for healthy lifestyles in Europe. In: McCleary, B. V. and Prosky, L. (eds). Advanced dietary fibre technology. Oxford: Blackwell Science Ltd. Pp. 3�12.
Glanz, K., Basil, M., Maibach, E., Goldberg, J. and Snyder, D. 1998. Why Americans eat what they do: Taste, nutrition, cost, convenience and weight control concerns as influences on food consumption. Journal of the American Dietetic Association, Vol. 98, pp. 1118�1126.
Graca, P. 1999. Dietary guidelines and food nutrient intakes in Portugal. British Journal of Nutrition, Vol. 81, Suppl. 2, pp. S99�S103.
Hallfrisch, J. and Behall, K. M. 2003a. Physiological responses of men and women to barley and oat extracts (Nu-trimX). I. Breath hydrogen, methane, and gastrointestinal symptoms. Cereal Chemistry, Vol. 80, pp. 76�79.
Hallfrisch, J., Schofield, D. J. and Behall, K. M. 2003b. Physiological responses of men and women to barley and oat extracts (Nu-trimX). II. Comparison of glucose and insulin responses. Cereal Chemistry, Vol. 80, pp. 80�83.
De Henauw, S. and De Backer, G. 1999. Nutrient and food intakes in selected subgroups of Belgian adults. British Journal of Nutrition, Vol. 81, Suppl. 2, pp. S37�S42.
Hill, M. J. 1998. Cereals, dietary fibre and cancer. Nutrition Research, Vol. 18, pp. 653�659.

84
Huotilainen, A., Urala, N. and Lähteenmäki, L. 2005. Qualitative methods. In: Tuorila, H. and Appelbye, U. (eds.). Sensory methods in food research [Elintarvikkeiden aistinvaraiset tutkimusmenetelmät]. Helsinki: Yliopistopaino.
Jalili, T., Wildman, R. E. C. and Medeiros, D. M. 2000. Nutraceutical roles of dietary fibre. Journal of Nutraceuticals, Functional & Medical foods. Vol. 2, pp. 19�34.
Jansen, M. C., Bueno-de-Mesquita, H.B., Buzina, R., Fidanza, F., Menotti, A., Blackburn, H., Nissinen, A. M., Kok, F. J. and Kromhout, D. 1999. Dietary fiber and plant foods in relation to colorectal cancer mortality. The Seven Countries Study. International Journal of Cancer, Vol. 81, pp. 174�179.
Jaskari, J., Henriksson, K., Nieminen, A., Suortti, T., Salovaara, H. and Poutanen, K. 1995. Effect of hydrothermal and enzymic treatments on the viscous behaviour of dry- and wet-milled oat brans. Cereal Chemistry, Vol. 72, pp. 625�631.
Jenkins, D. J. A., Kendall, C. WC. and Ransom, T. P. P. 1998. Dietary fiber, the evolution of the human diet and coronary heart disease. Nutrition Research, Vol. 18, pp. 633�652.
Jenkins, D. J. A., Marchie, A., Augustin, L. S. A., Ros, E. and Kendall, C. W. C. 2004. Viscous dietary fibre and metabolic effects. Clinical Nutrition Supplements, Vol. 1, pp. 39�49.
Joint Health Claims Initiative. 2004. Generic health claim for oats and blood cholesterol, 06/05/04. www.jhci.org.uk/approv/oats.htm Accessed 20.12.2005.
Jonas, M. S. and Beckmann, S. C. 1998. Functional foods: Consumer perceptions in Denmark and England. MAPP Working paper 55. Aarhus: The Aarhus School of Business.
de Jong, N., Hoendervangers, C. T., Bleeker, J. K. and Ocké, M. C. 2004. The opinions of Dutch dietitians about functional foods. Journal of Human Nutrition and Dietetics, Vol. 17, pp. 55�62.

85
de Jong, N., Ocké, M. C., Branderhorst, H. A. C. and Friele, R. 2003. Demographic and lifestyle characteristics of functional food consumers and dietary supplement users. British Journal of Nutrition, Vol. 89, pp. 273�281.
Kearney, M., Gibney, M. J., Martinez, J. A., de Almeida, M. D. V., Friebe, D., Zunft, H. J. F., Widhalm, K. and Kearney, J. M. 1997. Perceived need to alter eating habits among representative samples of adults from all member states of the European Union. European Journal of Clinical Nutrition, Vol. 51, Suppl. 2, pp. S30�S35.
Keenan, J. M., Wenz, J. B., Myers, S., Ripsin, C. and Huang, Z. Q. 1991. Randomized, controlled, crossover trial of oat bran in hypercholesterolemic subjects. Journal of Family Practice, Vol. 33, pp. 600�608.
Keogh, G. F., Cooper, G. J. S., Mulvey, T. B., McArdle, B. H., Coles, G. D., Monro, J. A. and Poppitt, S. D. 2003. Randomized controlled crossover study of the effect of a highly β-glucan-enriched barley on cardiovascular disease risk factors in mildly hypercholesterolemic men. American Journal of Clinical Nutrition, Vol. 78, pp. 711�718.
Kerckhoffs, D. A. J. M., Hornstra, G. and Mensink, R. P. 2003. Cholesterol-lowering effect of β-glucan from oat bran in mildly hypercholesterolemic subjects may decrease when β-glucan is incorporated into bread and cookies. American Journal of Clinical Nutrition, Vol. 78, pp. 221�227.
Kestin, M., Moss, R., Clifton, P. M. and Nestel, P. J. 1990. Comparative effects of three cereal brans on plasma lipids, blood pressure, and glucose metabolism in mildly hypercholesterolemic men. American Journal of Clinical Nutrition, Vol. 52, pp. 661�666.
Kihlberg, I., Johansson, L. Langsrud, Ø. and Risvik, E. 2005. Effects of information on liking of bread. Food Quality and Preference, Vol. 16, pp. 25�35.
Koenig, J. and Elmadfa, I. 1999. Food-based dietary guidelines � the Austrian perspective. British Journal of Nutrition, Vol. 81, Suppl. 2, pp. S31�S35.

86
Kähkönen, P., Tuorila, H. and Hyvönen, L. 1995. Dairy fat content and serving temperature as determinants of sensory and hedonic characteristics in cheese soup. Food Quality and Preference, Vol. 6, pp. 127�133.
Lahti-Koski, M. and Siren, M. 2004. Ravitsemuskertomus 2003. National Public Health Institute B4/2004. Helsinki: National Public Health Institute, Hakapaino Oy. [In Finnish, summary in English.]
Lairon, D., Bertrais, S., Vincent, S., Arnault, N., Galan, P., Boutron, M.-C. and Hercberg, S. 2003. Dietary fibre intake and clinical indices in the French Supplementation en Vitamines et Minéraux AntioXydants (SU.VI.MAX) adult cohort. Proceedings of the Nutrition Society, Vol. 62, pp. 11�15.
Lambert, N., Dibsdall, L. and Frewer, L. J. 2002. Case study. Poor diet and smoking: the big killers. Comparing health education in two hazard domains. British Food Journal, Vol. 104, pp. 63�75.
Lawless, H. and Heymann, H. 1998. Sensory Evaluation of Food. Principles and Practices. New York: Chapman & Hall. Pp. 341�378.
Leadbetter, J., Ball, M. J. and Mann, J. I. 1991. Effects of increasing quantities of oat bran in hypercholesterolemic people. American Journal of Clinical Nutrition, Vol. 54, pp. 841�845.
Lechner, L., Brug, J. and De Vries, H. 1997. Misconceptions of fruit and vegetable consumption: Differences between objective and subjective estimation of intake. Journal of Nutrition Education and Behaviour, Vol. 29, pp. 313�320.
Li, J., Kaneko, T., Qin, L.-Q., Wang, J. and Wang, Y. 2003. Effects of barley intake on glucose tolerance, lipid metabolism, and bowel function in women. Nutrition, Vol. 19, pp. 926�929.
Liu, S., Buring, J. E., Sesso, H. D., Rimm, E. B., Willett, W. C. and Manson, J. E. 2002. A prospective study of dietary fiber intake and risk of cardiovascular disease among women. Journal of the American College of Cardiology, Vol. 39, pp. 49�56.

87
Lovegrove, J. A., Clohessy, A., Milon, H. and Williams, C. M. 2000. Modest doses of β-glucan do not reduce concentrations of potentially atherogenic lipoproteins. American Journal of Clinical Nutrition, Vol. 72, pp. 49�55.
Luckow, T. and Delahunty, C. 2004. Which juice is �healthier�? A consumer study on probiotic non-dairy juice drinks. Food Quality and Preference, Vol. 15, pp. 751�759.
Lupton, J. R., Robinson, M. C. and Morin, J. L. 1994. Cholesterol-lowering effect of barley bran flour and oil. Journal of the American Dietetic Association, Vol. 94, pp. 65�70.
Lähteenmäki, L. 2000. Consumers� perspectives of functional foods. In: Alander, M. and Mattila-Sandholm, T. (eds.). Functional Foods for EU Health in 2000. 4th Workshop FAIR CT 96-1028, PROBDEMO, Rovaniemi, FI, 25�28 Feb. 2000. VTT Symposium 198. Espoo: VTT. Pp. 19�21.
Lähteenmäki, L. 2003. Consumers and functional foods. In: Mattila-Sandholm, T. and Saarela, M. (eds.). Functional dairy products. Cambridge: Woodhead Publication Ltd. Pp. 346�358.
Maier, S. M., Turner, N. D. and Lupton, J. R. 2000. Serum lipids in hypercholesterolemic men and women consuming oat bran and amaranth products. Cereal Chemistry, Vol. 77, pp. 297�302.
Margetts, B. M., Martinez, J. A., Saba, A., Holm, L. and Kearney, M. 1997. Definitions of 'healthy' eating: a pan-EU survey of consumer attitudes to food nutrition and health. European Journal of Clinical Nutrition, Vol. 51, Suppl. 2, pp. S23�S29.
McIntosh, G. H., Whyte, J., McArthur, R. and Nestel, P. J. 1991. Barley and wheat foods: influence on plasma cholesterol concentrations in hypercholesterolemic men. American Journal of Clinical Nutrition, Vol. 53, pp. 1205�1209.
Meilgaard, M., Civille, V. and Carr, T. 1991. Sensory evaluation techniques. 2nd edition. Boca Raton/USA: CRC Press. Pp. 201�235.
88
Menrad, K. 2003. Market and marketing of functional food in Europe. Journal of Food Engineering, Vol. 56, pp. 181–188.
Meyer, K. A., Kushi, L. H., Jacobs, D. R., Jr., Slavin, J., Sellers, T. A. and Folsom, A. R. 2000. Carbohydrates, dietary fiber and incident of type 2 diabetes in older women. American Journal of Clinical Nutrition, 71, pp. 921�930.
Mialon. V. S., Clark, M. R., Leppard, P. I. and Cox, D. N. 2002. The effect of dietary fibre information and �English� muffins: a cross-cultural study. Food Quality and Preference, Vol. 13, pp. 1�12.
Miller-Jones, J. 2004. Dietary fibre intake, disease prevention, and health promotion: An overview with emphasis on evidence from epidemiology. In: van der Kamp, J. W., Asp, N.-G., Miller-Jones, J. and Schaafsma, G. (eds.). Dietary fibre. Bioactive carbohydrates for food and feed. Wageningen: Wageningen Academic Publishers. Pp. 143�164.
Moschandreas, J. and Kafatos, A. 1999. Food and nutrient intakes of Greek (Cretan) adults. Recent data for food-based dietary guidelines in Greece. British Journal of Nutrition, Vol. 81, Suppl. 2, pp. S71�S76.
Moskowitz, H. R. and Krieger, B. 1995. The contribution of sensory liking to overall liking: An analysis of six food categories. Food Quality and Preference, Vol. 6, pp. 83�90.
Männistö, S., Ovaskainen, M.-L. and Valsta, L. (eds.). 2003. The National FINDIET 2002 Study. Publications of National Public Health Institute B3/2003. Helsinki: National Public Health Institute, Department of Epidemiology and Health Promotion.
Mårtensson, O., Andersson, C., Andersson, K., Öste, R. and Holst, O. 2001. Journal of the Science of Food and Agriculture, Vol. 81, pp. 1314�1321.
Mårtensson, O., Biörklund, M., Mbou Lambo, A., Dueñas-Chasco, M., Irastorza, A., Holst, O., Norin, E., Welling, G., Öste, R. and Önning, G. 2005. Nutrition Research, Vol. 25, pp. 429�442.

89
National Nutrition Council. 2005. Finnish Nutrition Recommendations. Helsinki: Edita Publishing Oy.
Niva, M., Mäkelä, J. and Piiroinen, S. 2003. Domestic berries and plant stanols. Acceptability of functional foods in Finland. National Consumer Research Centre � Publications 2003:9. Helsinki: National Consumer Research Centre. [In Finnish, abstract in English.]
Niva, M., Timonen, P., Ryhänen, E.-L. and Lähteenmäki, L. 2000. Functional foods and the consumer � Cabbage for cancer prevention, milk for stress relief? National Consumer Research Centre. Working Papers 59/2000. Helsinki: National Consumer Research Centre. [In Finnish, abstract in English.]
Norenzayan, A. and Schwarz, N. 1999. Telling what they want to know: participants tailor causal attributions to researchers� interests. European Journal of Social Psychology, Vol. 29, pp. 1011�1020.
Oakes, M. 2003. Differences in judgements of food healthfulness by young and elderly women. Food Quality and Preference, Vol. 14, No. 3, pp. 227�236.
Ollila, S., Tuomi-Nurmi, S. and Immonen, H. 2004. Finnish consumers� willingness to buy functional foods. VTT Research Notes 2241. Espoo: VTT Biotechnology. 54 p. + app. 8 p. ISBN 951-38-6458-8; 951-38-6459-6. http://virtual.vtt.fi/inf/pdf/tiedotteet/2004/T2241.pdf. [In Finnish, abstract in English.]
Pangborn, R. M., Gibbs, Z. M. and Tassan, C. 1978. Effect of hydrocolloids on apparent viscosity and sensory properties of selected beverages. Journal of Texture Studies, Vol. 9, pp. 415�436.
Pangborn, R. M., Trabue, I. and Szczesniak, A. 1973. Effect of hydrocolloid on oral viscosity and basic taste intensities. Journal of texture studies, Vol. 4, pp. 224�241.
Park, Y., Hunter, D.J., Spiegelman, D., Bergkvist, L., Berrino, F., van den Brandt, P. A., Buring, J. E., Colditz, G. A., Freudenheim, J. L., Fuchs, C. S., Giovannucci, E., Goldbohm, R. A., Graham, S., Harnack, L., Hartman, A. M., Jacobs, D. R. Jr, Kato, I., Krogh, V., Leitzmann, M. F., McCullough, M. L.,

90
Miller, A. B., Pietinen, P., Rohan, T. E., Schatzkin, A., Willett, W. C., Wolk, A., Zeleniuch-Jacquotte, A., Zhang, S. M. and Smith-Warner, S. A. 2005. Dietary fiber intake and risk of colorectal cancer. Journal of the American Medical Association, Vol. 294, pp. 2849�2857.
Paul, G. L., Inks, S. L. and Geiger, C. J. 1999. The Quaker Oats health claim: A case study. Journal of Nutraceuticals, Functional & Medical Foods, Vol. 1, pp. 5�32.
Pereira, M. A., O�Reilly, E., Augustsson, K., Fraser, G. E., Goldbourt, U., Heitmann, B. L., Knekt, P., Liu, S., Pietinen, P., Spiegelman, D., Stevens, J., Virtamo, J., Willett, W. C. and Ascherio, A. 2004. Dietary fiber and risk of coronary disease: a pooled analysis of cohort studies. Archives of International Medicine, Vol. 164, pp. 370�376.
Peters, U., Sinha, R., Chatterjee, N., Subar, A. F., Ziegler, R. G., Kulldorff, M., Bresalier, R., Weissfeld, J. L., Flood, A., Schatzkin, A. and Hayes, R. B. 2003. Dietary fibre and colorectal adenoma in a colorectal cancer early detection programme. Lancet, Vol. 361, pp. 1491�95.
Pietinen, P., Lahti-Koski, M., Vartiainen, E. and Puska, P. 2001. Nutrition and cardiovascular disease in Finland since the early 1970s: a success story. Journal of Nutrition, Health and Aging, Vol. 5, pp. 150�154.
Pietinen, P., Rimm, E. B., Korhonen, P., Hartman, A. M., Willett, W. C., Albanes, D. and Virtamo, J. 1996. Intake of dietary fiber and risk of coronary heart disease in a cohort of Finnish men. The alpha-tocopherol, beta-carotene cancer prevention study. Circulation, Vol. 94, pp. 2720�2727.
Plemmons, L. E. and Resurreccion, A. V. A. 1998. A warm-up sample improves reliability of responses in descriptive analysis. Journal of Sensory Studies, Vol. 13, pp. 359�376.
Poulsen, J. B. 1999. Danish consumers� attitudes towards functional foods. MAPP Working paper 62. Aarhus: The Aarhus School of Business.

91
Rimm, E. B., Ascherio, A., Giovannucci, E., Spiegelman, D., Stampfer, M. and Willet, W. C. 1996. Vegetable, fruit and cereal fiber intake and risk of coronary heart disease among men. JAMA, Vol. 275, pp. 477�451.
Ripsin, C. M., Keenan, J. M., Jacobes, D. R., Elmer, P. J., Wlech, R. R., Van Horn, L., Liu, K., Turnbull, W. H., Thye, F., Kestin, M., Hegsted, M., Davidson, D. M., Davidson, M. H., Dugan, D. L., Denmark-Wahnefried, W. and Beling, S. 1992. Oat products and lipid lowering. A meta-analysis. JAMA, Vol. 267, pp. 3317�3325.
Robitaille, J., Fontaine-Bisson, B., Couture, P., Tchernol, A. and Vohl, M.-C. 2005. Effect of an oat bran-rich supplement on the metabolic profile of overweight premenopausal women. Annals of Nutrition and Metabolism, Vol. 49, pp. 141�148.
Rozin, P., Fischler, C., Imada, S., Sarubin, A. and Wrezesniewski, A. 1999. Attitudes to food and the role of food in life in the U.S.A., Japan, Flemish Belgium and France: Possible implications for the diet-health debate. Appetite, Vol. 33, pp. 163�180.
Rytter, E., Erlanson-Albertsson, C., Lindahl, L., Lundquist, I., Viberg, U., Åkesson, B. and Öste, R. 1996. Changes in plasma insulin, enterostatin, and lipoprotein levels during an energy-restricted dietary regimen including a new oat-based liquid food. Annals of Nutrition & Metabolism, Vol. 40, pp. 212�220.
Sanjoaquin, M. A., Appleby, P. N., Spencer, E. A. and Key, T. J. 2004. Nutrition and lifestyle in relation to bowel movement frequency: a cross-sectional study of 20, 630 men and women in EPIC-Oxford. Public Health Nutrition, Vol. 7, pp. 77�83.
Schulze, M. B., Liu, S., Rimm. E. B., Manson, J. E., Willett, W. C. and Hu, F. B. 2004. Glycemic index, glycemic load, and dietary fiber intake and incidence of type 2 diabetes in younger and middle-aged women. American Journal of Clinical Nutrition, Vol. 80, pp. 348�56.
Skendi, A., Biliaderis, C. G., Lazaridou, A. and Izydorczyk, M. S. 2003. Structure and rheological properties of water soluble β-glucans from oat cultivars of Avena sativa and Avena bysantina. Journal of Cereal Science, Vol. 38, pp. 15�31.

92
Sloan, A. E. 2004. New rules for ready-to-eat. Food Technology, Vol. 58, pp. 16.
Sloan, A. E. 2005. Healthy vending and other emerging trends. Food Technology, Vol. 59, pp. 26�28, 30, 32�35.
Sobal, J. and Cassidy, C. M. 1993. Public beliefs about the amount of fiber in foods. Appetite, Vol. 20, pp. 21�32.
Spadaro, R. 2003. Eurobarometer 58.0. European Union citizens and sources of information about health. The European Opinion Research Group (EORG), March 2003. http://europa.eu.int/comm/health/ph_information/documents/eb_58_en.pdf. Accessed 11.5.2005.
Statistics Finland. 2003. Causes of death, 2003. http://www.tilastokeskus.fi/til/ksyyt/index.html. Accessed 11.5.2005.
Statistics Finland. 2004. Consumption of some foods. http://tilastokeskus.fi/tup/suoluk/taskus_tulot.html. Accessed 12.5.2005.
Suortti, T., Johansson, L. and Autio, K. 2000. Effect of heating and freezing on molecular weight of oat β-glucan. Abstract No. 332, American Association of Cereal Chemists, Annual Meeting 2000.
Swedish Nutrition Recommendations 1997. http://www.slv.se/templates/SLV_DocumentList.aspx?id=9749. Accessed 6.7.2005.
Tapola, N., Karvonen, H., Niskanen, L., Mikola, M. and Sarkkinen, E. 2005. Glycemic responses of oat bran products in type 2 diabetes patients. Nutrition, Metabolism & Cardiovascular diseases, Vol. 15, pp. 255�261.
Tappy, L., Gugolz, E. and Wursch P. 1996. Effects of breakfast cereals containing various amounts of beta-glucan fibers on plasma glucose and insulin responses in NIDDM subjects. Diabetes Care, Vol. 19, pp. 831�834.
Temelli, F., Bansema, C. and Stobbe, K. 2004. Development of an orange-flavoured barley β-glucan beverage. Cereal Chemistry, Vol. 81, pp. 499�503.

93
Tepper, B. J. and Trail, A. C. 1998. Taste or health: a study on consumer acceptance of corn chips. Food Quality and Preference, Vol. 9, pp. 267�272.
Trowell, H. 1972. Crude fibre, dietary fibre and atherosclerosis. Atherosclerosis Vol. 16, pp. 138�140.
Tuorila, H., Andersson, Å., Martikainen, A. and Salovaara, H. 1998. Effect of product formula, information and consumer characteristics in the acceptance of a new snack food. Food Quality and Preference, Vol. 9, pp. 313�320.
Tuorila, H. and Cardello, A. V. 2002. Consumer responses to an off-flavor in juice in the presence of specific health claims. Food Quality and Preference, Vol. 13, pp. 561�569.
Törrönen, R., Kansanen, L., Uusitupa, M., Hänninen, O., Myllymäki, O., Härkönen, H. and Mälkki, Y. 1992. Effects of an oat bran concentrate on serum lipids in free-living men with mild to moderate hypercholesterolemia. European Journal of Clinical Nutrition, Vol. 46, pp. 621�627.
Urala, N., Arvola, A. and Lähteenmäki, L. 2003. Strength of health-related claims and their perceived advantage. International Journal of Food Science and Technology, Vol. 38, pp. 815�826.
Urala, N. and Lähteenmäki, L. 2003. Reasons behind consumers� functional food choices. Nutrition & Food Science, Vol. 33, pp. 148�158.
Urala, N. and Lähteenmäki, L. 2004. Attitudes behind consumers� willingness to use functional foods. Food Quality and Preference, Vol. 15, pp. 798�803.
Uusitupa, M. I., Ruuskanen, E., Mäkinen, E., Laitinen, J., Toskala, E., Kervinen, K. and Kesäniemi, Y. A. 1992. A controlled study on the effect of beta-glucan-rich oat bran on serum lipids in hypercholesterolemic subjects: relation to apolipoprotein E phenotype. Journal of the American College of Nutrition, Vol. 11, pp. 651�659.
Valsta, L. 1999. Food-based dietary guidelines for Finland � a staged approach. British Journal of Nutrition, Vol. 81, Suppl. 2, pp. S49�S55.

94
Van Kleef, E., van Trijp, H. C. M., Luning, P. and Jongen, W. M. F. 2002. Consumer-oriented functional food development: how well do functional disciplines reflect the �voice of the consumer�? Trends in Food Science and Technology, Vol. 13, pp. 93�101.
Variyam, J. N., Shim, Y. and Blaylock, J. 2001. Consumer misperceptions of diet quality. Journal of Nutrition Education, Vol. 33, pp. 314�21.
Verbeke, V. 2005. Consumer acceptance of functional foods: Socio-demographic, cognitive and attitudinal determinants. Food Quality and Preference, Vol. 16, pp. 45�57.
Verbeke, V. 2006. Functional foods: Consumer willingness to compromise on taste for health? Food Quality and Preference, Vol. 17, pp. 126�131.
Wansink, B., Westgren, R. E. and Cheney, M. M. 2005. Hierarchy of nutritional knowledge that relates to the consumption of a functional food. Nutrition, Vol. 21, pp. 264�268.
Wardle, J., Parmenter, K. and Waller, J. 2000. Nutrition knowledge and food intake. Appetite, Vol. 34, pp. 269�275.
Welch, R. W. 1995. Chapter 10. The chemical composition of oats. Chapter 14. Oats in human nutrition and health. In: Welch, R. W. (ed.). The oat crop. Product and utilization. London: Chapman & Hall. Pp. 279�320 and 433�479.
Wendin, K., Solheim, R., Allmere, T. and Johansson, L. 1997. Flavour and texture in sour milk affected by thickeners and fat content. Food Quality and Preference, Vol. 8, pp. 281�291.
Whichelow, M. J. 1987. Which foods contain dietary fibre? The beliefs of 7351 respondents in the Health and Lifestyle Survey 1984�85. Proceedings of the Nutrition Society, Vol. 46, p. 135A.
Whichelow, M. J. 1988. Which foods contain dietary fibre? The beliefs of a random sample of the British population. European Journal of Clinical Nutrition, Vol. 42, pp. 945�951.

95
WHO 2003. Diet, nutrition and the prevention of chronic diseases. Report of a joint WHO / FAO expert consultation. WHO Technical Report Series 916. Geneva: World Health Organisation.
Whyte, J. L., McArthur, R., Tomming, D. and Nestel, P. 1992. Oat bran lowers plasma cholesterol levels in mildly hypercholesterolemic men. Journal of the American Dietetic Association, Vol. 92, pp. 446�449.
Wood, P. J. 1986. Oat β-glucan: Structure, location and properties. In: Oats: Chemistry and Technology. F. H. Webster (ed.). Minnesota: American Association of Cereal Chemists, Inc. Pp. 121�152.
Wood, P. J. 2002. Relationships between solution properties of cereal β-glucans and physiological effects � a review. Trends in Food Science & Technology, Vol. 13, pp. 313�320.
Wood, P. J. and Beer, M. U. 1998. Functional Oat Products. In: Mazza, G. (ed.). Functional Foods, Biochemical and Processing Aspects. Lancester: Technomic Publishing Company, Inc. Pp. 1�37.
Wood, P. J., Beer, M. U. and Butler, G. 2000. Evaluation of the role of concentration and molecular weight of oat ß-glucan in determining effect of viscosity on plasma glucose and insulin following an oral glucose load. British Journal of Nutrition, Vol. 84, pp. 19�23.
Wood, P. J., Braaten, J. T., Scott, F. W., Riedel, D. and Poste, L. M. 1990. Comparisons of viscous properties of oat and guar gum and the effects of these and oat bran on glycemic index. Journal of Agricultural and Food Chemistry, Vol. 38, pp. 753�757.
Wood, P. J., Braaten, J. T., Scott, F. W., Riedel, K. D., Wolynetz, M. S. and Collins M. W. 1994. Effect of dose and modification of viscous properties of oat gum on plasma glucose and insulin following an oral glucose load. British Journal of Nutrition, Vol. 72, pp. 731�743.

96
Wood, P. J., Weisz, J. and Mahn, W. 1991. Molecular characterization of Cereal β-glucans. II. Size-exclusion chromatography for comparison of molecular weight. Cereal Chemistry, Vol. 68, pp. 530�536.
Würsch, P. and Pi-Sunyer F. X. 1997. The role of viscous soluble fiber in the metabolic control of diabetes. A review with special emphasis on cereals rich in beta-glucan. Diabetes Care, Vol. 20, pp. 1774�1780.
Yokoyama, W. H., Hudson, C. A., Knucles, B. E., Chiu, M.-C. M., Sayre, R. N., Turnlund, J. R. and Schneeman, B. O. 1997. Effect of barley β-glucan in durum wheat pasta on human glycemic response. Cereal Chemistry, Vol. 74, pp. 293�296.
Zunft, H. J. F., Friebe, D., Seppelt, B., de Graaf, C., Margetts, B., Schmitt, A. and Gibney, M. J. 1997. Perceived benefits of healthy eating among a nationally-representative sample of adults in the European Union. European Journal of Clinical Nutrition, Vol. 51, Suppl. 2, pp. S41�S46.
Önning, G., Wallmark, A., Persson, M., Åkesson, B., Elmstahl, S. and Öste, R. 1999. Consumption of oat milk for 5 weeks lowers serum cholesterol and LDL cholesterol in free-living men with moderate hypercholesterolemia. Annals of Nutrition and Metabolism, Vol. 43, pp. 301�3

PUBLICATION I
Perceived role of fibre in a healthy diet among Finnish consumers
In: Journal of Human Nutrition and Dietetics 2004. Vol. 17, pp. 231–239.
Reprinted with permission from the publisher.


Perceived role of fibre in a healthy diet amongFinnish consumers
M. Lyly, E. Soini, U. Rauramo & L. Lahteenmaki
VTT Biotechnology, VTT, Espoo, Finland
Introduction
In recent decades, many studies have established
the positive association between intake of dietary
fibre and decreased risk of several diseases such
as colorectal cancer (Jansen et al., 1999; Bingham
et al., 2003; Peters et al., 2003) or cardiovascular
diseases (Liu et al., 2002). Adequate fibre intake
has also been shown to improve glucose/insulin
metabolism and lower plasma lipid concentra-
tions in type 2 diabetes patients (Chandalia et al.,
2000). There are theories explaining the possible
mechanisms behind the effect of fibre on health
but in many cases these mechanisms have not
been fully understood and the evidence is based
on correlations between the amount of fibre in
diet and the prevalence or incidence of a certain
disease.
� The British Dietetic Association Ltd 2004 J Hum Nutr Dietet, 17, pp. 231–239 231
CorrespondenceMarika Lyly,
VTT Biotechnology,PO Box 1500,
FIN-02044 VTT,
Finland.Tel.: +358 9 456 5837
Fax: +358 9 455 2103
E-mail: [email protected]
Keywordsconsumers, dietary fibre, healthy diet,
perception.
Abstract
Objective The aim was to study how Finnish consumers perceive
the role of fibre in the diet, which foods are regarded as good sources
of fibre and the relationship between the respondents� self-estimated
fibre intake and their measured intake.
Methods A semistructured interview was conducted with 125 vol-
unteers, including a background information questionnaire and an
easy-to-use self-administered paper-and-pencil form estimating fibre
intake.
Results According to the self-administered form about half of the
respondents had adequate fibre intake. Among those who estimated
their fibre intake as adequate/maybe adequate, only 61% belonged to
the highest fibre intake group. Most of the respondents defined their
diet as being healthy. The key elements for a healthy diet were
�vegetables�, �low in fat�, �fruit and berries� and �variety�. Only 5% of
the respondents mentioned fibre spontaneously here. However, fibre
was considered important for health because of its effect on bowel
function and general well-being. The recommended intake of fibre
could not be described in nutritional terms, but respondents could
identify relevant sources of fibre in the diet.
Conclusion Finnish consumers considered fibre important for
health and could recognize the sources of fibre correctly although
they did not mention it spontaneously as a part of a healthy diet.
I/1

The intake of dietary fibre (NSP ¼ nonstarch
polysaccharides meaning the indigestible part of
carbohydrate-rich foods which does not yield
energy) is below the current Finnish recommen-
dations: the average intake of dietary fibre is
21.8 g day)1 for men and 18.5 g day)1 for women
(Mannisto et al., 2003) whereas the recommended
intake is 25–35 g day)1 (National Nutrition
Council, 1998). To improve the fibre intake, we
have to analyse how consumers think about fibre,
what foods are considered to be good sources of
fibre and whether fibre is considered as an
important factor in healthy eating.
Generally, European consumers seem to know,
at least at a verbal level, what a healthy diet, as
recommended by nutritionists, should be like. In a
pan-EU survey, 80% of the respondents mentioned
�more fruit and vegetables� or �less fat� or �balance
and variety� when describing their perceptions of a
healthy diet (Margetts et al., 1997). In the Finnish
subpopulation, the most frequently mentioned
definitions were �more fruit and vegetables, less fat/
fatty foods/low fat diet� and �balance and variety�,mentioned by at least 42% of the respondents.
Fibre was not mentioned very frequently without
prompting, as �more staples, fibre� was mentioned
only by 22% of the Finnish respondents.
The insufficient level of general knowledge
about fibre as a factor in a healthy diet may be an
obstacle to its increased intake. The level of the
subjects� nutritional knowledge has been associ-
ated with their intake of fat, fruit and vegetables
(Wardle et al., 2000). It is also quite common to
perceive one’s own diet quality to be better than it
really is (Variyam et al., 2001). This mispercep-
tion, �unrealistic optimism� may prevent beneficial
dietary changes.
The relationship between nutrients and foods
may be confusing for consumers. In the UK, the
Health and Lifestyle Survey showed that <30% of
the respondents correctly classified eight or more
food items according to the fibre content among a
total of 10 food items (Whichelow, 1987, 1988).
However, Sobal & Cassidy (1993) found American
respondents� rating of the amount of fibre in 40
foods reasonably similar to the chemical data
about the fibre content in these foods. Australians
could not recognize specific food sources of fibre
although the general relationship between fibre
intake and its food sources was understood
(Cashel et al., 2001). In Ireland, an increased
perceived importance of fibre in health was cor-
related with a high intake of fibre through
increased intake of potatoes, vegetables, whole-
meal bread and fruit indicating an understanding
of the main food sources of fibre (Barker et al.,
1995).
The aim of this work was to study how con-
sumers perceive the role of fibre in a healthy diet,
what foods are regarded as being good sources of
fibre and the relationship between the respond-
ents� self-estimated fibre intake and the intake
estimated with a self-administered fibre test.
Materials and methods
The participants for this study were volunteers
recruited from libraries, public swimming pools
and shopping centres. The size of the study sample
was 125 participants, of which 34% were from
Kuopio, a town in the eastern part of Finland, and
66% from Helsinki, the capital of Finland. The
�response rate� was 80%, which means that 156
volunteers were contacted, and 20% (31) of them
declined to take part. The commonest exclusion
criterion was the respondent’s age being under
18 years. The distribution of respondents� socio-
demographic characteristics was fairly close to the
overall Finnish population (Table 1). The pro-
portion of men and women was close to even, and
the age groups were equally represented. On
average in Finland (year 2001), 39.8% of the
population had completed only the basic educa-
tion level, 36.5% had a secondary education and
23.7% had a higher education level (Anonymous,
2001). Our study population was slightly higher
educated than the average Finnish population, but
all education levels were represented.
Interview
A semistructured interview was used as a study
method. At the start, questions about the
respondent’s perception of a healthy diet in gen-
eral were presented. This was followed by ques-
tions on the function, possible sources and
M. Lyly et al.232
� The British Dietetic Association Ltd 2004 J Hum Nutr Dietet, 17, pp. 231–239
I/2

required amount of dietary fibre. In the last part of
the interview, the respondents were asked who
could and should provide information about
dietary fibre, and finally, some additional ques-
tions were asked about the use of bread. The fibre
information and the bread-related questions and
results are not reported here. All of these ques-
tions were open-ended with no preset response
alternatives.
Before the actual interview, some general
information was given about the study, such as the
time required to participate in the survey and that
the theme was health in general. The interviewees
did not know in advance that the target interest
was in dietary fibre. This was important in
observing whether dietary fibre would be sponta-
neously mentioned in answers to the healthy diet-
related questions. The interviewer used a laptop
computer to record notes during the interviews
and the interview was also recorded on tape. The
usual duration was around 30 min per interview.
Background questionnaire and fibre intake test
After the interview, the participants filled in a
background information questionnaire on socio-
demographic factors, their own assessment of
their state of health and confidence in different
sources of information regarding dietary fibre (the
latter ones are not reported here). They also
completed a fibre intake test (Appendix 1; Finnish
Bread Information, 1999). Both of these only asked
questions with preset answer options. The fibre
intake test was developed by Finnish Bread
Information (1999) and validated with food diaries
in 2000 (A. Wegelius, unpublished data). The idea
behind it is to provide a fast, easy-to-use rough
method for consumers to assess the amount of
dietary fibre in their own diet. The test includes
eight product categories, which are relevant
sources of dietary fibre in Finland. The categories
are further divided into subcategories, for exam-
ple, in the case of bread, into different bread types
from rye bread to wheat toast. Consumers mark
the number of portions of each food item they ate
the day before. The portions of the food items are
converted into points; one point is approximately
equivalent to 1 g of dietary fibre. The test is not
able to provide an exact result of fibre intake but
gives a rough estimate and it is possible to com-
pare respondents� fibre intakes. As a result, the
consumer can be categorized into one of the fol-
lowing groups, based on the amount of points
gained in the test: adequate intake of fibre (‡25
points); almost adequate intake of fibre (21–24
points); insufficient intake of fibre (15–20 points);
poor intake of fibre (<15 points in the fibre test).
This classification is also used in the analysis of
this work. The fibre intake measured is an absolute
value in points, and hence not standardized by
energy intake.
The data were collected between April and June
2001 by one interviewer. Volunteers received
information about their dietary fibre intake from
the fibre intake test and were given a small gift as a
reward.
Data analysis
The notes written during the interviews were
checked against the tapes. The responses were
categorized according to their content. The cat-
egories were formed during examination of the
data, so that those issues that were mentioned by
at least four respondents formed an independent
category. Issues that were mentioned three times
or less were included in the category �others�.During the analysis, the categories could be fur-
ther combined based on their content, if their
Table 1 The frequency distributions of residence, sex, ageand education of the respondents
n (%)
Total (N) 125 (100)Residence
Kuopio city 43 (35)Helsinki city 82 (66)
SexMale 61 (49)Female 64 (51)
Age (years)18–30 38 (30)31–49 46 (37)50+ 41 (33)
Education (years)Basic education level (duration 9) 18 (15)Secondary education (11–12) 50 (40)High education level (13+) 57 (46)
Perceived role of fibre in a healthy diet 233
� The British Dietetic Association Ltd 2004 J Hum Nutr Dietet, 17, pp. 231–239
I/3

meaning was regarded as being close to each
other. With this approach, the responses could be
divided into a reasonable number of categories.
The number of respondents mentioning an item
was calculated. Mean values were calculated from
the background information questionnaire data.
Cross-tabular distributions of frequencies were
tested with the chi-square test. SPSS software
(version 10.0.5, SPSS Inc., Chicago, IL, USA) was
used for the statistical analysis.
Results
The intake and sources of dietary fibre according
to the fibre test
According to the results from the fibre test, about
half of the respondents (51%) could approximately
be described as likely to have an adequate intake
of fibre and 14% as likely to have an almost ade-
quate intake of fibre. About one-fifth of the
respondents (22%) seemed to have an insufficient
intake and 12% a poor intake of fibre. Over half of
the men (56%) and under half of the women (47%)
belonged to the highest intake group. A bigger
proportion of men (16%) than women (8%)
belonged to the lowest intake of fibre group, but
the difference was not statistically significant
(P ¼ 0.17; chi-square test). It has to be kept in
mind that the fibre intake points are not stan-
dardized by energy intake and as a consequence
men’s absolute fibre intake points may be higher
than women’s due to the usually higher energy
intake. Based on the approximate fibre test, the
main source of dietary fibre was clearly bread,
contributing over half of the fibre intake, followed
by vegetables and fruit and berries (Fig. 1).
Defining a healthy diet
The interview began with general, open questions
on what constitutes a healthy diet. Most of the
respondents assessed their own diet as being
healthy (62%) or at least moderately healthy
(12%). Only 14% evaluated their own diet as being
unhealthy, whereas the remainder of the popula-
tion (12%) was unsure about the healthiness of
their diet.
The respondents were asked what they consid-
ered to be key elements of a healthy diet. At this
point over half of the respondents (58%) men-
tioned �vegetables�. Also �low in fat� (34%), �fruit
and berries� (22%) and �variety� (20%) were fre-
quently mentioned. �Fibre� was spontaneously
mentioned by only 5% and �bread� by 10% of the
interviewees.
To the question �What would you change in
your diet, if you would like to have a healthier
diet�, the most frequently mentioned responses
were �more vegetables� (43%), �less sweet delica-
cies� (26%), �less fat� (18%), �more fruit� (14%) and
�more fish� (10%). Only 5% and 4% of the
respondents mentioned �more cereals/porridge� or
�less bread�, respectively.
Perceptions of dietary fibre
Definition of fibre
When respondents were asked with an open ques-
tion to define dietary fibre and describe the role of
dietary fibre in the diet using their own words, 89%
of the respondents could define dietary fibre in
some way although fibre had not been mentioned
often as part of a healthy diet. Fibre was very often
defined by food items, which the respondent
thought to contain fibre. Vegetables were most often
mentioned (by 42% of the respondents) in this
context, followed by cereals (33%), fruit (27%),
bread (25%) and porridge (19%). Dietary fibre was
also defined by its function in the body. Among
62.3
10.28.4 5.5
4.7 3.3 2.5 2.3
0
10
20
30
40
50
60
70
80
Per
cen
tag
e o
f th
e to
tal i
nta
ke o
f fi
bre
Bread
Vegetables
Fruits andberries
Porridge
Potato
Muesli, cereals
Seeds, nuts,bran etc.
Rice andpasta
Figure 1 The sources of dietary fibre in the diet (percentageof the total intake of fibre, mean and SD).
M. Lyly et al.234
� The British Dietetic Association Ltd 2004 J Hum Nutr Dietet, 17, pp. 231–239
I/4

these so-called functional definitions, �related to
bowel function� (35% of respondents), �related to
stomach function� (24%), �related to digestion�(23%) and �makes one feel full, decreases appetite�(12%) were the most frequently mentioned effects.
Only about one-tenth of the respondents (11%)
could not say anything about dietary fibre.
The amount of fibre in the diet
We were interested to know whether consumers
could evaluate their fibre intake using nutritional
terms, as this is often the way in which advice is
given by experts. The interviewees were asked how
much dietary fibre they thought they should con-
sume daily. Three-quarters of the respondents did
not know the recommended amount. Only 13%
claimed to know the recommended amount and
12% thought that they might know it. The amount
estimated by interviewees varied from �800 mg� to
�two-third of the entire food intake�. It seems that
although people claim to know the recommended
amount their responses could be very unrealistic
in nutritional terms.
The following questions dealt with their
opinion on the adequacy of dietary fibre in their
own diet, the best sources of dietary fibre in
their diet, and how to improve the intake of
dietary fibre. Three-quarters of the respondents
(74%) thought that their diet contained �ade-
quate/maybe adequate� fibre. Approximately one-
fifth (21%) considered the amount of fibre in
their diet �inadequate� or �maybe inadequate�, and
6% could not estimate the amount of fibre in
their diet at all.
The results from the fibre intake test were
compared with the respondents� own estimations
of their intake of dietary fibre. Of those who esti-
mated their fibre intake to be �adequate/maybe
adequate�, only 61% belonged to the highest fibre
intake group, and 25% actually had a poor or
insufficient intake of fibre (Fig. 2). Those who
estimated their fibre intake to be �inadequate/
maybe inadequate� mostly belonged to groups of
poor or insufficient fibre intake, but about one-
fifth of them actually had adequate fibre intake
(Fig. 2). Also noteworthy, two-thirds of the
respondents (67%) in the lowest fibre intake group
(poor intake) thought that their fibre intake was
�adequate� or �maybe adequate�, and only 34%
thought that it was �inadequate/maybe inad-
equate�.
The sources of fibre in the diet
The respondents were then asked to freely des-
cribe the best sources of fibre in their diet with the
possibility to mention several options. Bread
(mentioned by 76% of respondents), vegetables
(38%) and fruit (29%) were mentioned most often
as the best sources of dietary fibre. We also asked
how they would improve their intake of fibre if
necessary. The respondents had the opportunity to
mention several options here. The most common
ways to improve fibre intake were to increase the
use of bread (mentioned by 30% of respondents),
vegetables (26%), bran (13%), porridge (10%) and
fruit and berries (10%).
Compared with the results from the fibre intake
test the relevant sources were correctly identified,
although the role of vegetables, fruit and berries
was slightly overestimated as sources of fibre
compared with the actual proportion they contri-
buted in the fibre intake test.
The role of dietary fibre in a healthy diet
The interviewees were asked if an adequate intake
of fibre was important for their own health. In
general, 68% of the respondents thought it was
very important and 11% moderately important.
Only 9% said that fibre intake was irrelevant to
their health. There were no statistically significant
14
15
14
43
19
61
10%0% 20% 30% 40% 50% 60% 70% 80% 90% 100%
Don't know (n = 7)
Own estimation: maybenot / not adequate
intake of fibre (n = 26)
Own estimation: maybeadequate / adequate
intake of fibre (n = 92)
Adequate intake; ≥25 pointsAlmost adequate intake; 21–24 pointsInsufficient intake; 15–20 pointsPoor intake; <15 points
14 11
46 19
43
Figure 2 The personal estimation of the respondents� fibreintake and the actual fibre intake based on the results fromthe self-administered fibre intake test.
Perceived role of fibre in a healthy diet 235
� The British Dietetic Association Ltd 2004 J Hum Nutr Dietet, 17, pp. 231–239
I/5

differences between age groups regarding the
importance of fibre for health.
When asked to describe why an adequate intake
of fibre was important for their health, 39% of the
respondents mentioned �bowel function� as an
important influence of dietary fibre, whereas
�general well-being� was mentioned by 29%.
Discussion
The fibre intake test used gives an estimate of fibre
intake and it can be used to divide respondents
into different fibre intake categories. Each point in
the test is based on a rough estimate of the amount
of food product required to give an intake of 1 g of
fibre. Although this is an approximation, it pro-
vides a quick tool for roughly assessing the intake
of fibre and for grouping respondents according to
their intake; however, the test should not be used
for direct conversion of points into fibre intake
grams. The self-administered test may have a
tendency to overestimate the intake if points and
grams are compared. In this study, the average
points for men and women were 33 and 27,
respectively, whereas the average intake among
the Finnish population is 22 and 19 g day)1 when
measured using 48-h dietary recall (Mannisto
et al., 2003). This difference can be explained
partly by the approximate nature of the self-
administered test and partly by the discrepancies
in respondent populations, but also the nature of
the test may have an influence. In the self-
administered test all choices increase fibre intake
and the social desirability of a healthy, high-fibre
diet may have an impact on reporting higher fibre
intakes. Points based on the self administered
measure are likely to give more optimistic results
on fibre intake than what is the reality and this
should be taken into account when results are
examined.
According to the fibre test, half of the respond-
ents had an adequate intake of fibre, whereas about
one-third had an insufficient or poor intake of
fibre. Men usually have a higher energy intake than
women, which means that their fibre intake per kJ
is significantly lower than that of women. There-
fore, men in the lower fibre intake groups are likely
to be a problematic group. In a nationally repre-
sentative study in Finland, the mean daily intake of
fibre was 2.5 g MJ)1 in men and 2.9 g MJ)1 in
women (Mannisto et al., 2003). In the same study,
the main sources of dietary fibre for men were
grain products (66%), vegetables and potato (12%)
and fruit and berries (10%) and for women 54%,
14%, and 17%, respectively, measured as grams
based on 48-h dietary recall. We found similarities
in our study; according to the fibre test, the main
sources of dietary fibre were grain products, veg-
etables and fruit and berries.
The principles of a healthy diet were known in
theory, as fruit and berries, vegetables and a diet
low in fat were the most frequently mentioned
descriptions of a healthy diet. The finding is sim-
ilar to the results from the Finnish subpopulation
in a pan-EU survey (Margetts et al., 1997). The
role of vegetables and fruit and fat in a healthy diet
has been widely discussed in recent years in Fin-
land, which can be seen from these results. The
results also reflect the Finnish nutrition recom-
mendations suggesting in the so-called �plate
model� that half of the plate should be filled with
vegetables (National Nutrition Council, 1998).
Dietary fibre was not connected with a healthy diet
without prompting, but was regarded as important
when it was specifically asked about.
The majority of the respondents were able to
define dietary fibre in some way. Most often
dietary fibre was defined by food items thought to
contain fibre. In these definitions, greater
emphasis was placed in the consumption of veg-
etables and fruit compared with their actual role as
a fibre source. Cereals and bread were also fre-
quently mentioned, which indicates that people
know what good dietary sources of fibre are, as
also observed in other studies (Barker et al., 1995;
Cashel et al., 2001). Dietary fibre was also defined
according to its bodily functions and mostly
linked to stomach function and digestion, which
are perhaps the traditionally discussed effects of
fibre. It seems that the role of fibre in many spe-
cific diseases is not clear to consumers but they
seem to know where dietary fibre comes from and
its functions in the body. However, there was a
small group of consumers who could not say
anything about fibre. In this sense, nutrition
education related to dietary fibre has been quite
M. Lyly et al.236
� The British Dietetic Association Ltd 2004 J Hum Nutr Dietet, 17, pp. 231–239
I/6

successful in informing about what should be
eaten and what the result is, but has not being able
to explain the reason behind the advice.
The respondents� own estimation of their poss-
ible inadequate fibre intake was relatively good, as
the majority of those estimating their fibre intake
as being inadequate/may be inadequate actually
had an inadequate intake of fibre according to the
fibre test. However, a group of respondents also
estimated their fibre intake to be adequate/maybe
adequate and yet they actually had an inadequate
intake of fibre. Variyam et al. (2001) concluded in
their study that it is common to perceive one’s
own diet quality to be better than it actually is.
These misperceptions may prevent the actual
necessary dietary changes.
The recommendations concerning the amount
of dietary fibre were not known to participants. It
seems that lay people do not think about food in
nutritional terms, which means that it is difficult
for them to estimate the recommended amounts
or the effects of single factors in diet. However, it
is not necessarily an obstacle to healthy eating, as
in this population the most significant sources of
dietary fibre were correctly recognized. Perhaps
the �professional� way of concentrating on grams
and general advice is not successful in dietary
counselling. A more fruitful way could be focusing
on broader concepts, such as �eat wholegrain
bread at every lunch� or �eat porridge four times
per week�. Also, emphasizing the use of wholegrain
products among cereal products in dietary coun-
selling could be effective.
The majority of the interviewees perceived fibre
to be important for health although it was not
spontaneously mentioned as part of a healthy diet.
It was commonly seen as a key factor in gut health
and well-being. However, we have to keep in mind
that as health-related issues had been discussed in
previous questions, this may have an effect on their
attitude and answers to this question and perhaps
some considered fibre more important because the
focus of the study was on fibre and health issues.
In conclusion, fibre was not mentioned spon-
taneously as being a part of a healthy diet, but
when prompted, the majority of the consumers
considered it important for their own health. The
consumers were aware of the dietary sources of
fibre, but they slightly overestimated some foods
as sources of fibre. Personal perception of fibre
intake reflected the roughly estimated fibre intake,
but yet about 40% of respondents who perceived
their fibre intake as being adequate actually had an
inadequate intake of fibre. Consumers did not
know about the recommendations concerning
fibre, and they could not think about fibre in
nutritional terms.
References
Anonymous (2001) Statistics Finland. http://statfin.stat.fi/
statweb (last accessed 2 January 2004).
Barker, M.E., Thompson, K.A. & McClean, S.I. (1995)
Attitudinal dimensions of food choice and nutrient
intake. Br. J. Nutr. 74, 649–659.
Bingham, S.A., Day, N.E., Luben, R., Ferrari, P., Slimani, N.,
Norat, T., Clavel-Chapelon, F., Kesse, E., Nieters, A.,
Boeing, H., Tjønneland, A., Overvad, K., Martinez, C.,
Dorrensoro, M., Gonzalez, C.A., Key, T.J., Trichopoulou, A.,
Naska, A., Vineis, P., Tumino, R., Krogh, V., Bueno-de-
Mesquita, H.B., Peeters, P.H.M., Berglung, G., Hallmans,
G., Lund, E., Skele, G., Kaaks, R. & Riboli, E. (2003)
Dietary fibre in food and protection against colorectal
cancer in the European Prospective Investigation into
Cancer and Nutrition (EPIC): an observational study.
Lancet 361, 1496–1501.
Cashel, K.M., Crawford, D., Deakin, V. & Talbot, B. (2001)
Is the link between nutrients and food understood?
The case of fibre and folate. Public Health Nutr. 4, 913–
918.
Chandalia, M., Garg, A., Lutjohann, D., von Bergmann, K.,
Grundy, S.M. & Brinkley, L.J. (2000) Beneficial effects of
high dietary fiber intake in patients with type 2 diabetes
mellitus. N. Engl. J. Med. 342, 1392–1398.
Finnish Bread Information (1999) http://www.leipatiedotus.
fi/kuitutesti.asp (in Finnish). (last accessed 2 January
2004).
Jansen, M.C., Bueno-de-Mesquita, H.B., Buzina, R., Fidanza,
F., Menotti, A., Blackburn, H., Nissinen, A.M., Kok, F.J.
& Kromhout, D. (1999) Dietary fiber and plant foods in
relation to colorectal cancer mortality: the Seven
Countries Study. Int. J. Cancer 81, 174–179.
Liu, S., Buring, J.E., Sesso, H.D., Rimm, E.B., Willett, W.C. &
Manson, J.E. (2002) A prospective study of dietary fiber
intake and risk of cardiovascular disease among women.
J. Am. Coll. Cardiol. 39, 49–56.
Margetts, B.M., Martinez, J.A., Saba, A., Holm, L. & Kear-
ney, M. (1997) Definitions of �healthy� eating: a pan-EU
survey of consumer attitudes to food nutrition and
health. Eur. J. Clin. Nutr. 51(Suppl. 2), S23–S29.
Mannisto, S., Ovaskainen, M.-L. & Valsta, L. (eds) (2003)
Finravinto 2002-tutkimus. The National FINDIET
Perceived role of fibre in a healthy diet 237
� The British Dietetic Association Ltd 2004 J Hum Nutr Dietet, 17, pp. 231–239
I/7

2002 Study. Publications of National Public Health
Institute B3/2003. Department of Epidemiology and
Health Promotion, Helsinki: National Public Health
Institute.
National Nutrition Council (1998) Committee Report 1998:
7. Finnish Nutrition Recommendations. Helsinki: Min-
istry of Agriculture and Forestry.
Peters, U., Sinha, R., Chatterjee, N., Subar, A.F., Ziegler,
R.G., Kulldorff, M., Bresalier, R., Weissfeld, J.L., Flood, A.,
Schatzkin, A. & Hayes, R.B. (2003) Dietary fibre and
colorectal adenoma in a colorectal cancer early detec-
tion programme. Lancet 361, 1491–1495.
Sobal, J. & Cassidy, C.M. (1993) Public beliefs about the
amount of fiber in foods. Appetite 20, 21–32.
Variyam, J.N., Shim, Y. & Blaylock, J. (2001) Consumer
misperceptions of diet quality. J. Nutr. Educ. 33, 314–321.
Wardle, J., Parmenter, K. & Waller, J. (2000) Nutrition
knowledge and food intake. Appetite 34, 269–275.
Whichelow, M.J. (1987) Which foods contain dietary fibre?
The beliefs of 7351 respondents in the Health and
Lifestyle Survey 1984–85. Proc. Nutr. Soc. 46, 135A.
Whichelow, M.J. (1988) Which foods contain dietary fibre?
The beliefs of a random sample of the British popula-
tion. Eur. J. Clin. Nutr. 42, 945–951.
M. Lyly et al.238
� The British Dietetic Association Ltd 2004 J Hum Nutr Dietet, 17, pp. 231–239
I/8

Appendix 1 Fibre intake test (Finnish Bread Information, 1999)*. In each food category please mark the amount thatcorresponds with what you ate yesterday
Bread and cereals Number of slices/pieces Points/slice or piece*Rye bread with grains (Ruismax, RuisReal) 5
Other kind of soft rye bread or crisp bread, mixed grainbread with grains (Jyvamax, MoniviljaReal)
3
Mixed/oat/barley/wholemeal bread, Karelian ricepasty, bun, berry pie, thin rye crisp
2
Toast, French bread, croissant 1Rice pasty, piece of pizza (10 · 10 cm2), one large
thin pancake or four small ones1
Muesli, breakfast cereals, etc. (1 portion ¼ 1 dL-20 g)1) Number of portions Points/portion*Breakfast cereals rich in fibre (All-Bran Plus) 6Breakfast cereals with fibre (All-Bran Regular) 3Regular breakfast cereals 0.5Muesli 1.5One piece of Weetabix 2
Porridge (1 portion ¼ 2.5 dL) Number of portions Points/portion*Whole grain flake porridge 4Rice porridge or semolina pudding 1Oat bran porridge 6
Seeds, nuts, bran, dried fruit, etc. (1 portion ¼ 1 tbs) Number of portions Points/portion*Nuts, sunflower or other seeds, bran 1Flax seeds 3Raisins 1One dried plum or date 0.5One dried apricot 1
Fresh berries and fruit Number of portions Points/portion*1 portion ¼ one piece of fruit or 1 dL berries 2
Vegetables (1 portion ¼ 1 dL) Number of portions Points/portion*Fresh peas, cooked beans, maize, mixed frozenvegetables (e.g. pea-maize-bell pepper)
3
Grated fresh vegetables, mixed salad, cookedor fresh vegetables
1
Potato (1 portion ¼ 1 dL or 1 piece) Number of portions Points/portion*Cooked potatoes 1Mashed potatoes, potato salad, French fries,
fried potatoes, garlic potatoes1
Rice and pasta (1 portion ¼ 1 dL cooked food) Number of portions Points/portion*White rice 1Whole grain rice or rice–rye mix 2Regular macaroni 0.5Oat macaroni or rye macaroni 1
Total points*
*This information was given to respondents only after they had completed the test. The respondents had not been informed in advance that thespecific interest of this test was fibre.
Perceived role of fibre in a healthy diet 239
� The British Dietetic Association Ltd 2004 J Hum Nutr Dietet, 17, pp. 231–239
I/9


PUBLICATION II
Influence of oat β-glucan preparations on the perception of
mouthfeel and on rheological properties in beverage prototypes
In: Cereal Chemistry 2003. Vol. 80, No. 5, pp. 536–541.
Reprinted with permission from the publisher.


ëíê ÝÛÎÛßÔ ÝØÛÓ×ÍÌÎÇ
ײº´«»²½» ±º Ñ¿¬ óÙ´«½¿² Ю»°¿®¿¬·±² ±² ¬¸» л®½»°¬·±² ±º Ó±«¬¸º»»´
¿²¼ ±² θ»±´±¹·½¿´ Ю±°»®¬·» ·² Þ»ª»®¿¹» Ю±¬±¬§°»
Ó¿®·µ¿ Ô§´§ôïôî Ó¿®¶¿¬¬¿ Í¿´³»²µ¿´´·±óÓ¿®¬¬·´¿ôï Ì¿°¿²· Í«±®¬¬·ôï Õ¿®·² ß«¬·±ôï Õ¿·¿ ᫬¿²»²ôï
¿²¼ Ô··¿ Ô<¸¬»»²³<µ·ï
ßÞÍÌÎßÝÌ Ý»®»¿´ ݸ»³ò èðøë÷æëíê�ëìï
̸» ¿·³ ©¿ ¬± ¬«¼§ ¬¸» »ºº»½¬ ±º ½±²½»²¬®¿¬·±² ¿²¼ ³±´»½«´¿® ©»·¹¸¬±º º±«® ¼·ºº»®»²¬ ó¹´«½¿² °®»°¿®¿¬·±² ±² ¬¸» °»®½»·ª»¼ »²±®§ ¯«¿´·¬§±º ¿ ¾»ª»®¿¹» °®±¬±¬§°»ò ̸» ½±®®»´¿¬·±² ¾»¬©»»² »²±®§ ¿²¼ ·²¬®«ó³»²¬¿´ ³»¿«®» ©»®» ·²ª»¬·¹¿¬»¼ò Ì©± ±º ¬¸» °®»°¿®¿¬·±² ©»®» ¾®¿²ó¬§°» ½±²¬¿·²·²¹ ¸·¹¸ ³±´»½«´¿® ©»·¹¸¬ ó¹´«½¿²ô ¬©± ©»®» ³±®»ó°®±½»»¼´±© ³±´»½«´¿® ©»·¹¸¬ ó¹´«½¿² °®»°¿®¿¬·±²ò Ì©»´ª» ¾»ª»®¿¹» ¿³°´»½±²¬¿·²·²¹ ðòîë�îû ó¹´«½¿² ¿²¼ ±²» ®»º»®»²½» ¿³°´» ¬¸·½µ»²»¼ ©·¬¸½¿®¾±¨§³»¬¸§´ ½»´´«´±» øÝÓÝ÷ ©»®» °®±º·´»¼ ¾§ ¿ »²±®§ °¿²»´ ¿²¼¿²¿´§¦»¼ ¾§ ·²¬®«³»²¬¿´ ³»¿«®»³»²¬ øª·½±·¬§ ¿²¼ ³±´»½«´¿®©»·¹¸¬÷ò Í»²±®§ °®±º·´» ±º ¬¸» ¾»ª»®¿¹» ª¿®·»¼ ¿¬ ¬¸» ¿³» ½±²½»²ó
¬®¿¬·±² ±º ó¹´«½¿²ô ¼»°»²¼·²¹ ±² ó¹´«½¿² °®»°¿®¿¬·±²ò Þ»ª»®¿¹» ³¿¼»©·¬¸ ¬¸» ¾®¿²ó¬§°» °®»°¿®¿¬·±² ©»®» ³±®» ª·½±« ¿²¼ ¸¿¼ ¸·¹¸»®°»®½»·ª»¼ ¬¸·½µ²» ¬¸¿² ¾»ª»®¿¹» ³¿¼» ©·¬¸ ³±®»ó°®±½»»¼ô ´±©³±´»½«´¿® ©»·¹¸¬ °®»°¿®¿¬·±²ò Ó±¼»®¿¬» ½±®®»´¿¬·±² ©»®» ±¾¬¿·²»¼¾»¬©»»² °»®½»·ª»¼ ¬¸·½µ²» ¿²¼ ´·³·²» ¿²¼ ·²¬®«³»²¬¿´ ª·½±·¬§ ¿¬¿´´ ¸»¿® ®¿¬» ¾»¬©»»² îê ¿²¼ ïððñ»½ ø® ã ðòêí�ðòéèå Ð ðòððï÷òÌ»½¸²±´±¹·½¿´´§ô ³±®»ó°®±½»»¼ ó¹´«½¿² °®»°¿®¿¬·±² ¿®» »¿·»® ¬± ¿¼¼·²¬± ¿ ¾»ª»®¿¹» ·² ¿³±«²¬ «ºº·½·»²¬ º±® ¿½¸·»ª·²¹ ¿ °¸§·±´±¹·½¿´´§º«²½¬·±²¿´ ¿³±«²¬ ±º ó¹´«½¿² ·² ¿ °®±¼«½¬ò
̸» ±´«¾´» ±¿¬ º·¾»® ó¹´«½¿² ¸¿ ¿ ³±¼»®¿¬·²¹ »ºº»½¬ ±² °±¬ó°®¿²¼·¿´ ¾´±±¼ ¹´«½±» ¿²¼ ·²«´·² ®»°±²» øÞ®¿¿¬»² »¬ ¿´ ïççïåɱ±¼ »¬ ¿´ ïççì÷ ¿²¼ ®»¼«½» »´»ª¿¬»¼ ¾´±±¼ ½¸±´»¬»®±´ ´»ª»´øη°·² »¬ ¿´ ïççîå η³³ »¬ ¿´ ïççê÷ò ̸» ËòÍò Ú±±¼ ¿²¼ Ü®«¹ß¼³·²·¬®¿¬·±² øÚÜß÷ ¿´´±© ¿ ¹»²»®·½ ¸»¿´¬¸ ½´¿·³ º±® ±¿¬ ¿²¼±¿¬ °®±¼«½¬ ½±²½»®²·²¹ ¬¸» ½¸±´»¬»®±´ó´±©»®·²¹ »ºº»½¬ ±º ±´«¾´»º·¾»® ø»ò¹òô ó¹´«½¿²÷ ·² ®»¼«½·²¹ ¬¸» ®·µ ±º ½±®±²¿®§ ¸»¿®¬ ¼·»¿»øÚÜß ïççê÷ò
Ю»»²¬´§ô ¿¼¼»¼ ó¹´«½¿² · ¾»·²¹ «»¼ ³±¬´§ ·² ½»®»¿´ °®±¼ó«½¬ò Ò»© ¬§°» ±º º±±¼ ½±²¬¿·²·²¹ ó¹´«½¿² ¿®» ²»»¼»¼ ¬± °®±ó³±¬» ¬¸» «» ±º í ¹ ±º ó¹´«½¿²ñ¼¿§ô ©¸·½¸ · ¬¸» ¿³±«²¬ ¼»º·²»¼¾§ ¬¸» ÚÜß ¿ ¬¸» ´·³·¬ º±® °±¬»²¬·¿´ ¸»¿´¬¸ »ºº»½¬ò Ѳ» °±·¾·´·¬§º±® ¿ ²»© ó¹´«½¿²ó½±²¬¿·²·²¹ °®±¼«½¬ ½¿¬»¹±®§ · ¾»ª»®¿¹»òÙ®±©¬¸ ·² ¬¸» º«²½¬·±²¿´ ¼®·²µ »½¬±® ¸¿ ¾»»² ¬®±²¹ ±ª»® ¬¸»´¿¬ º»© §»¿® ¿²¼ · »¬·³¿¬»¼ ¬± ½±²¬·²«» øᬬ»® îððïå Í´±¿²îððî÷ò
̸» ¾»¸¿ª·±® ±º ó¹´«½¿² ·² ¾»ª»®¿¹» · ¿² ·²¬»®»¬·²¹ô «²»¨ó°´±®»¼ º·»´¼ò Û°»½·¿´´§ô ¬¸» ¸·¹¸ ª·½±·¬§ ±º ó¹´«½¿² · »¨°»½¬»¼¬± ·²º´«»²½» ¾±¬¸ »²±®§ ¯«¿´·¬§ ¿²¼ °¸§·±´±¹·½¿´ º«²½¬·±²¿´·¬§òÊ·½±·¬§ ±º ó¹´«½¿² · ³¿·²´§ ¼»¬»®³·²»¼ ¾§ ½±²½»²¬®¿¬·±² ¿²¼³±´»½«´¿® ©»·¹¸¬ øß«¬·± ïççëå ɱ±¼ »¬ ¿´ îððð÷ò ̸» ´¿®¹»® ¬¸»³±´»½«´¿® ©»·¹¸¬ ±® ¬¸» ½±²½»²¬®¿¬·±² ±º ó¹´«½¿² ·ô ¬¸» ¸·¹¸»®¬¸» ª·½±·¬§ò ß² ·²ª»®» ´·²»¿® ®»´¿¬·±²¸·° ¾»¬©»»² ¹´§½¿»³·½ ®»ó°±²» ¿²¼ ª·½±·¬§ ±º ¿² ±¿¬ ó¹´«½¿² ±´«¬·±² ¸¿ ¾»»² »¬¿¾ó´·¸»¼ øɱ±¼ »¬ ¿´ ïççì÷ò Ç»¬ ¬¸»®» · ²± »ª·¼»²½» ±º ¬¸» ·¹²·óº·½¿²½» ±º ³±´»½«´¿® ©»·¹¸¬ ±² ¬¸» »ºº·½¿½§ ±º ó¹´«½¿² ·² ®»¼«½ó·²¹ ¾´±±¼ ½¸±´»¬»®±´ ´»ª»´ò Ю±½»·²¹ ³¿§ ¼»½®»¿» ¬¸» ³±´»½«´¿®©»·¹¸¬ ±º ó¹´«½¿² øÞ»»® »¬ ¿´ ïççé÷ò ײ ¬¸» ¬«¼§ ±º J²²·²¹ »¬ ¿´øïççç÷ô ¿ °®±½»»¼ ±¿¬ °®±¼«½¬ ø±¿¬ ³·´µ÷ ©¿ º±«²¼ ¬± ¾» »ºº»½ó¬·ª» ·² ®»¼«½·²¹ ¾´±±¼ ½¸±´»¬»®±´ ´»ª»´ò
̸» »²±®§ ¯«¿´·¬§ ±º º±±¼ · ±²» ±º ¬¸» ³¿·² º¿½¬±® ·²º´«ó»²½·²¹ ¬¸» ®»°»¿¬»¼ º±±¼ ½¸±·½» ±º ²±ª»´ °®±¼«½¬ øß®ª±´¿ »¬ ¿´ïççç÷ò ̱ ¿«®» ¬¸» ½±²«³°¬·±² ±º ó¹´«½¿²ó½±²¬¿·²·²¹ º±±¼ô¿²¼ ¬¸»®»¾§ »²¿¾´» ¬¸» °±·¬·ª» ¸»¿´¬¸ »ºº»½¬ ±º ó¹´«½¿²ô °®±¼«½¬¸¿ª» ¬± ¸¿ª» ¿² ±ª»®¿´´ ¿½½»°¬¿¾´» »²±®§ ¯«¿´·¬§ ¿²¼ ¾®·²¹°´»¿«®» ¬± ½±²«³»®ò ̸» ª·½±·¬§ »ºº»½¬ ±º ó¹´«½¿²ô ¸±©»ª»®ô³¿§ ½¿«» °®±¾´»³ º®±³ ¬¸» º±±¼ °®±½»·²¹ °»®°»½¬·ª»ò ̸»´±© ³±´»½«´¿® ©»·¹¸¬ ó¹´«½¿² ¸¿ô °»®¸¿°ô ¾»¬¬»® »²±®§ ½¸¿®ó¿½¬»®·¬·½ ·² º±±¼ °®±¼«½¬ ¬¸¿² ¸·¹¸ ³±´»½«´¿® ©»·¹¸¬ ó¹´«½¿²
¼«» ¬± ´±©»® ª·½±·¬§ô ¾«¬ ¬¸» »ª·¼»²½» ±² °¸§·±´±¹·½¿´ »ºº·½¿½§±º ´±© ³±´»½«´¿® ©»·¹¸¬ ó¹´«½¿² ¸¿ ²±¬ §»¬ ¾»»² ©»´´ »¬¿¾ó´·¸»¼ øɱ±¼ ¿²¼ Þ»»® ïççè÷ò Ü»·¹²·²¹ º±±¼ ®·½¸ ·² ó¹´«½¿²©·¬¸ ¸·¹¸ ³±´»½«´¿® ©»·¹¸¬ · ½¸¿´´»²¹·²¹ ¬¿µô ¿²¼ ± º¿® ª»®§º»© ¬«¼·» ¸¿ª» §¬»³¿¬·½¿´´§ ¬«¼·»¼ ¬¸» »ºº»½¬ ±º ó¹´«½¿² ±²¬¸» »²±®§ ¯«¿´·¬§ øÓ<´µµ· »¬ ¿´ ïççíå ײ¹´»¬¬ »¬ ¿´ ïççìå Ʊ«´·¿ »¬¿´ îððð÷ò Ò±²» ±º ¬¸»» ¬«¼·» ¸¿ ¾»»² ½±²¼«½¬»¼ ©·¬¸ ¾»ª»®¿¹»¿ ¿ ³±¼»´ º±±¼ò
̸» ±¾¶»½¬·ª» ±º ¬¸· ®»»¿®½¸ ©»®» ¬± ·²ª»¬·¹¿¬» ¸±© ½±²½»²ó¬®¿¬·±² ¿²¼ ³±´»½«´¿® ©»·¹¸¬ ±º º±«® ó¹´«½¿² °®»°¿®¿¬·±² ¿ºº»½¬¬¸» °»®½»·ª»¼ »²±®§ ¯«¿´·¬§ô ·²½´«¼·²¹ ¬¸·½µ²»ô ¿²¼ ©¸»¬¸»®½±®®»´¿¬·±² ¾»¬©»»² »²±®§ ¿²¼ ·²¬®«³»²¬¿´ ³»¿«®»³»²¬ ¿®»¿ºº»½¬»¼ ¾§ ¬¸» ¼·ºº»®»²¬ ¸»¿® ®¿¬» «»¼ ·² ¬¸» ³»¿«®»³»²¬ ±º·²¬®«³»²¬¿´ ª·½±·¬§ ·² ¿ ¾»ª»®¿¹» °®±¬±¬§°»ò
ÓßÌÛÎ×ßÔÍ ßÒÜ ÓÛÌØÑÜÍ
óÙ´«½¿² Ю»°¿®¿¬·±²
Ú±«® ¼·ºº»®»²¬ ó¹´«½¿² °®»°¿®¿¬·±² øÞÙï�ÞÙì÷ ©»®» «»¼ º±®°®»°¿®·²¹ ¬¸» ¾»ª»®¿¹»ò ÞÙï ¿²¼ ÞÙî ©»®» ±¿¬ ¾®¿²ô ®·½¸ ·² ó¹´«½¿²ô °®±¼«½»¼ ¾§ ¼®§ ³·´´·²¹ ¿¬ ߪ»²¿ Ñ¿¬ ײ¹®»¼·»²¬ øØ»´ó·²µ·ô Ú·²´¿²¼÷ò ÞÙíó ¿²¼ ÞÙìó°®»°¿®¿¬·±² ©»®» ±´«¾´» ó¹´«½¿²°®»°¿®¿¬·±² º®±³ ÝÛÞß ßÞ øÔ«²¼ô Í©»¼»²÷ô °®±¼«½»¼ ¾§¿¯«»±« »²¦§³»ó¿·¼»¼ »¨¬®¿½¬·±²ò ̸» ½±³°±·¬·±² ±º ó¹´«½¿²°®»°¿®¿¬·±² · °®»»²¬»¼ ·² Ì¿¾´» ×ò óÙ´«½¿² ½±²¬»²¬ ±º ¬¸» °®»°¿ó®¿¬·±² ©¿ ¼»¬»®³·²»¼ »²¦§³¿¬·½¿´´§ ¾§ ¬¸» Ó»¹¿¦§³» ³»¬¸±¼øӽݴ»¿®§ ¿²¼ ݱ¼¼ ïççï÷ò ̸» ¿ª»®¿¹» ³±´»½«´¿® ©»·¹¸¬ øÓ©÷±º ¬¸» °®»°¿®¿¬·±² ©»®» ¿²¿´§¦»¼ ¿º¬»® ¬¸»·® ·±´¿¬·±² ¿²¼ °«®·óº·½¿¬·±² ¾§ «·²¹ ®·¹¸¬ó¿²¹´» ´¿»® ´·¹¸¬ ½¿¬¬»®·²¹ò ̸» ¾»ª»®¿¹»¿³°´» ©»®» ¿²¿´§¦»¼ ¾§ ØÐÔÝóÍÛÝ ©·¬¸ ½¿´½±º´«±® ¬¿·²·²¹øÍ«±®¬¬· ïççí÷ ¬± °®±ª» ¬¸» °®»»®ª¿¬·±² ±º ¬¸» ³±´»½«´¿® ©»·¹¸¬¼«®·²¹ °®»°¿®¿¬·±²ò
Ý¿®¾±¨§³»¬¸§´ ½»´´«´±» øÝÓÝ÷ øÝ¿®³»´´±ò²¿¬®å Ç´·±°·¬±²ß°¬»»µµ·ô Ø»´·²µ·ô Ú·²´¿²¼÷ ©¿ «»¼ ¿ ¿ ¬¸·½µ»²·²¹ ¿¹»²¬ ·²¬»¿¼±º ó¹´«½¿² °®»°¿®¿¬·±² ·² ¬¸» ®»º»®»²½» ¾»ª»®¿¹»ò Ñ®¿²¹»óº´¿ª±®»¼º®±¦»² ¶«·½» ¾¿» øÜ*¸´»®ô Ü¿®³¬¿¼¬ô Ù»®³¿²§÷ ©¿ «»¼ ¿ ¬¸»¾¿·½ ½±³°±²»²¬ ·² °®»°¿®·²¹ ¬¸» ¾»ª»®¿¹»ò
Ю»°¿®¿¬·±² ±º Þ»ª»®¿¹» Í¿³°´»Ì¸» ¾»ª»®¿¹» ©»®» °®»°¿®»¼ ¾§ ³·¨·²¹ ¬¸» ó¹´«½¿² °®»°¿ó
®¿¬·±² ©·¬¸ ©¿¬»®ô «½®±» ø¸±«»¸±´¼ ¯«¿´·¬§÷ô ¿²¼ 󿳧´¿»òÌ»®³¿³§´ ïîðÔ ¬§°» Ô øÞ¿¬½¸ ßÈÒ ðìïîíô Ò±ª± Ò±®¼·µ ßñÍôÜ»²³¿®µ÷ ©¿ «»¼ ¬± ¸§¼®±´§¦» ¬¸» ®»³¿·²·²¹ ¬¿®½¸ º®±³ ó¹´«½¿² ·² ¬¸» ¾»ª»®¿¹»ò ׬ ©¿ ¸»¿¬ó¬®»¿¬»¼ ¾»º±®» «» ¬± ·²¿½¬·ª¿¬»°±·¾´» »²¼±¹»²±« ó¹´«½¿²¿» ¾§ ¸»¿¬·²¹ ïðð ³Ô ±º îíòëû
ï ÊÌÌ Þ·±¬»½¸²±´±¹§ô ÐòÑò Þ±¨ ïëððô Ú×Òóðîðìì ÊÌÌô Ú·²´¿²¼òî ݱ®®»°±²¼·²¹ ¿«¬¸±®ò Û󳿷´æ ³¿®·µ¿ò´§´§àª¬¬òº·ò и±²»æ õíëè ç ìëê ëèíéò
Ú¿¨æ õíëè ç ìëë îïðíò
Ы¾´·½¿¬·±² ²±ò ÝóîððíóðéîìóðïÎò
w îððí ß³»®·½¿² ß±½·¿¬·±² ±º Ý»®»¿´ ݸ»³·¬ô ײ½ò
II/1

ʱ´ò èðô Ò±ò ëô îððí ëíé
øªñª÷ Ì»®³¿³§´ ©·¬¸ ïî ³Ó Ý¿ÝÔî ·² ¿ ¾±·´·²¹ ©¿¬»® ¾¿¬¸ º±® ïë³·²ò ̸» ±´«¬·±² ©¿ ·»ª»¼ ¬¸®±«¹¸ ´»²ó½´»¿²·²¹ ¬·«» ¿²¼«»¼ ¿¬ îû øªñª÷ ½±²½»²¬®¿¬·±²ò ̸» Ì»®³¿³§´ »²¦§³» ©¿ «»¼±²´§ ·² ÞÙï ¿²¼ ÞÙî ¾»ª»®¿¹» ¾»½¿«» ¬¿®½¸ ©¿ ¿´®»¿¼§ ®»ó³±ª»¼ º®±³ ÞÙí ¿²¼ ÞÙì °®»°¿®¿¬·±² ¼«®·²¹ °®±½»·²¹ò ̸»³·¨¬«®» ©¿ ¬¸»² ¾´»²¼»¼ ©·¬¸ Þ¿³·¨ ¾´»²¼»® ¾¿® º±® ïë »½ô ¿º¬»®©¸·½¸ ¬¸» ³·¨¬«®» ©¿ ¸»¿¬»¼ ·² ¾»¿µ»® «° ¬± õéëpÝ ·² ¿ ©¿¬»®¾¿¬¸ øõèðpÝ÷ º±® ïë ³·²ò ߺ¬»® ¸»¿¬·²¹ô ¬¸» ³·¨¬«®» ¿²¼ ±®¿²¹»¶«·½» ¾¿» ©»®» ¾´»²¼»¼ ¬±¹»¬¸»® ± ¬¸¿¬ ¬¸» º·²¿´ ½±²½»²¬®¿¬·±²©¿ ëû ¶«·½» ¾¿» ¿²¼ çû «¹¿® ·² ¾»ª»®¿¹» ¿³°´»ò ̸»¾»ª»®¿¹» ©»®» ½±±´»¼ ¿¬ ®±±³ ¬»³°»®¿¬«®» ¿²¼ ¬¿¾·´·¦»¼ º±® îð oí ¸® ¿¬ ®±±³ ¬»³°»®¿¬«®»ò ̸» ®»º»®»²½» ¿³°´» øÝÓÝ÷ ©¿ °®»ó°¿®»¼ ·² ¬¸» ¿³» ©¿§ ¾«¬ ¸»¿¬»¼ ¼·®»½¬´§ ±² ¿ ¬±ª» ¬± ¿´³±¬ ¬¸»¾±·´·²¹ °±·²¬ò ̸» ª·½±·¬§ ¿²¼ ³±´»½«´¿® ©»·¹¸¬ ±º ó¹´«½¿² ©¿¼»¬»®³·²»¼ º®±³ »¿½¸ ¾¿¬½¸ò
̸» ó¹´«½¿² ½±²½»²¬®¿¬·±² ·² ¬¸» ¾»ª»®¿¹» ª¿®·»¼ º®±³ ðòî묱 îòðû ø©ñ©÷ øÌ¿¾´» ××÷ò ̸» ½±²½»²¬®¿¬·±² ©»®» »´»½¬»¼ ¾¿»¼±² °®»´·³·²¿®§ ¬®·¿´ò ̸» ½±²½»²¬®¿¬·±² ±º ÝÓÝ ·² ¬¸» ®»º»®»²½»¾»ª»®¿¹» ¿³°´» ©¿ ïòíûò ̸» ¾»ª»®¿¹» ª¿®·»¼ ¿¬ °Ø íòë�ìòîò
Í»²±®§ Ûª¿´«¿¬·±²
̸» »¨°»®·»²½»¼ »²±®§ °¿²»´ ¸¿¼ îð ³»³¾»®ô º·ª» ±º ©¸±³¬±±µ °¿®¬ ·² ¬¸» ¼»ª»´±°³»²¬ ±º ª±½¿¾«´¿®§å ç�ïð ³»³¾»® ¬±±µ°¿®¬ ·² »¿½¸ »ª¿´«¿¬·±² »·±²ò ̸» »²±®§ ½¸¿®¿½¬»®·¬·½ ±º ¬¸»¾»ª»®¿¹» ©»®» »ª¿´«¿¬»¼ «·²¹ ¼»½®·°¬·ª» ¿²¿´§· øÔ¿©´» ¿²¼Ø»§³¿²² ïççè÷ò ߬¬®·¾«¬» ·²¬»²·¬·» ©»®» ®¿¬»¼ ±² ïðó«²·¬ ¹®¿°¸·½·²¬»²·¬§ ½¿´»ô ª»®¾¿´´§ ¿²½¸±®»¼ º®±³ ¬¸» »²¼ øÌ¿¾´» ×××÷ò
̸» ª±½¿¾«´¿®§ ©¿ ¼»ª»´±°»¼ ·² ±²» »·±²ò п²»´·¬ ¬¿¬»¼ ·¨¼·ºº»®»²¬ ó¹´«½¿² ¾»ª»®¿¹» ¿²¼ ¬¸»² ¼»½®·¾»¼ ¬¸» ¬»¨¬«®» ¿²¼º´¿ª±® ½¸¿®¿½¬»®·¬·½ò ß´¬±¹»¬¸»®ô ïï ¿¬¬®·¾«¬» ©»®» »´»½¬»¼ ¬±¼»½®·¾» ¬»¨¬«®»ô ³±«¬¸º»»´ô ¿²¼ º´¿ª±® ±º ¬¸» ¾»ª»®¿¹»ò Ú±® »¿½¸¿¬¬®·¾«¬»ô »¨½»°¬ ¬¸» ¬±¬¿´ º´¿ª±® ·²¬»²·¬§ô ³±¼»´ ©»®» ½®»¿¬»¼ º±®¬®¿·²·²¹ ¬¸» °¿²»´ øÌ¿¾´» ×××÷ò Ú±® ¬¸» »²±®§ »ª¿´«¿¬·±²ô ¼»¬¿·´»¼·²¬®«½¬·±² º±® ¬¸» °¿²»´·¬ ±² »ª¿´«¿¬·±² ¬»½¸²·¯«» º±® ¿´´ ¿¬¬®·ó¾«¬» ©»®» ©®·¬¬»² «° ¬± ¾» «»¼ ¼«®·²¹ ¬¸» »ª¿´«¿¬·±²ò
̸» °¿²»´ ©¿ ¬®¿·²»¼ ·² ¬¸®»» ¬®¿·²·²¹ »·±² ©·¬¸·² ïî ©»»µòÜ«®·²¹ ¬¸» º·®¬ ¬®¿·²·²¹ »·±² ø¼«®¿¬·±² íð ³·²÷ô ¬¸» ³±¼»´ ±º¬¸» ¿¬¬®·¾«¬» ©»®» °®»»²¬»¼ ¬± ¬¸» °¿²»´·¬ ¬± º¿³·´·¿®·¦» ¬¸»³©·¬¸ ¬¸» ¿¬¬®·¾«¬»ò Ü·®»½¬´§ ¿º¬»® ¬¸·ô ¬¸» ¬®¿·²·²¹ »·±² ½±²¬·²ó«»¼ ©·¬¸ ¬©± ¿³°´» ¬¸¿¬ ©»®» »ª¿´«¿¬»¼ ±² ¹®¿°¸·½ ½¿´»ò ̸»»½±²¼ ¬®¿·²·²¹ »·±² ©¿ ½±²¼«½¬»¼ ©·¬¸ º±«® ¿³°´» ø¬¸®»»±®¿²¹» ¶«·½» ½±²¬¿·²·²¹ ðòëû ó¹´«½¿² ¿²¼ ±²» ±®¿²¹» ¶«·½»¬¸·½µ»²»¼ ©·¬¸ ðòëû ÝÓÝ ¿ ¿ ®»º»®»²½»÷ò ß ¬¸·®¼ ¬®¿·²·²¹ »·±²©¿ ½±²¼«½¬»¼ ©·¬¸ º±«® ¿³°´» ø¬¸®»» ±®¿²¹» ¶«·½» ½±²¬¿·²·²¹ðòë�îû ó¹´«½¿² ¿²¼ ±²» ±®¿²¹» ¶«·½» ¬¸·½µ»²»¼ ©·¬¸ ïòíû ÝÓÝ¿ ¿ ®»º»®»²½»÷ò ̸» °¿²»´·¬ ¹±¬ º»»¼¾¿½µ ±º ¬¸»·® °»®º±®³¿²½»ø±©² ®¿¬·²¹ º±® »¿½¸ ¿¬¬®·¾«¬» ¿²¼ ¿³°´» ¿²¼ ³»¿² ±º ¬¸» ©¸±´»°¿²»´÷ ¿º¬»® »ª»®§ ¬®¿·²·²¹ »·±²ò
̸» »²±®§ »ª¿´«¿¬·±² ±º ¬¸» ¿³°´» ©¿ ½±²¼«½¬»¼ ·² »·¹¸¬»·±² ø·²½´«¼·²¹ ¬¸» ®»°´·½¿¬» »·±²÷ô »¿½¸ »·±² ·²½´«¼»¼º±«® ó¹´«½¿² ¾»ª»®¿¹» ¿²¼ ±²» ÝÓÝ ®»º»®»²½»ò ß´´ ¿³°´» ¿²¼¬¸» ÝÓÝ ®»º»®»²½» ©»®» ¾´·²¼ó½±¼»¼ò ̸» ÝÓÝ ®»º»®»²½» ©¿°®»»²¬»¼ º·®¬ ¿¬ »¿½¸ »·±² ¿ ¿ ©¿®³ó«° ¿³°´»ò ̸» ó¹´«½¿²¿³°´» ©»®» °®»»²¬»¼ ¬± ¬¸» °¿²»´·¬ ·² ®¿²¼±³ ±®¼»®ò Í¿³°´»©»®» ¿»»¼ ¬©·½»ò ̸» ¼¿¬¿ ©»®» ½±´´»½¬»¼ «·²¹ ¿ ½±³°«¬»®ó·¦»¼ ¼¿¬¿ó¹¿¬¸»®·²¹ §¬»³ øݱ³°«»²» ëô ªò ìòîå ÝÍßô ݱ³ó°«»²» ײ½òô Ù«»´°¸ô Ý¿²¿¼¿÷ò
Ê·½±·¬§ Ó»¿«®»³»²¬
ݱ²¬¿²¬ ®¿¬» ³»¿«®»³»²¬ ±º ª·½±·¬§ ¿ ¿ º«²½¬·±² ±º ¸»¿®®¿¬» ©¿ °»®º±®³»¼ ©·¬¸ ¿ ͬ®»Ì»½¸ ®¸»±³»¬»® øÝÝ îë ÝÝÛô λ±ó´±¹·½¿ ײ¬®«³»²¬ ßÞô Í©»¼»²÷ ¿¬ ¸»¿® ®¿¬» ±º ïêòì�ïëéñ»½ ¿¬õîðpÝò ̸» ¿³» ¿³°´» »ª¿´«¿¬»¼ ¾§ ¬¸» »²±®§ °¿²»´ ©»®»³»¿«®»¼ò
Ü¿¬¿ ß²¿´§·
ײ ¬¿¬·¬·½¿´ ¿²¿´§·ô ¬¸» ³»¿² ª¿´«» ©»®» ¿¼¶«¬»¼ ©·¬¸ ÝÓÝ®»º»®»²½» ®¿¬·²¹ ø»²±®§ ¿²¿´§· ®»«´¬÷æ
ÈÍÌ ã ø¿ � ¾÷ õ ÈÝÓݹ®¿²¼
©¸»®» ÈÍÌ ã ¿¼¶«¬»¼ ª¿´«»å ¿ ã °¿²»´·¬� °»®±²¿´ ®¿¬» º±® ·²¹´»¿³°´» ¿²¼ ¿¬¬®·¾«¬» ·² ¬¸» °¿®¬·½«´¿® »·±²å ¾ ã °¿²»´·¬� °»®ó±²¿´ ®¿¬» ±º ÝÓÝ ¿³°´» ¿²¼ ¿¬¬®·¾«¬» ·² ¬¸» °¿®¬·½«´¿® »·±²å¿²¼ ÈÝÓݹ®¿²¼ ã ³»¿² ±º ¬¸» ¿¬¬®·¾«¬» º±® ÝÓÝ ±ª»® ¿´´ °¿²»´·¬¿²¼ »·±²ò
̸» ¿¼¶«¬³»²¬ ©¿ ³¿¼» ¬± »´·³·²¿¬» ¬¸» ¼·ºº»®»²½» ¾»¬©»»²°¿²»´·¬ ¼«» ¬± ¬¸» «» ±º ¼·ºº»®»²¬ ´»ª»´ ±º ¬¸» ½¿´»ò ̸·¿¼¶«¬³»²¬ ¼·¼ ²±¬ ¿ºº»½¬ ¬¸» ®¿²¹» ±º ½¿´» «»¼ ¾§ ¬¸» °¿²»´·¬òÔ¿©´» ¿²¼ Ø»§³¿²² øïççè÷ ¼»½®·¾»¼ ¬¸» ·¬«¿¬·±² ©¸»®» °¿²»´ó·¬ ¿¹®»» ±² ¬¸» ³¿¹²·¬«¼» ±º ¬¸» »²±®§ ¼·ºº»®»²½» ¾»¬©»»² ¬¸»¿³°´» ¾«¬ ¬¸»§ «»¼ ¿ ¼·ºº»®»²¬ °¿®¬ ±º ¬¸» ½¿´»ò É·¬¸ ¬¸»¿¼¶«¬³»²¬ô ©» ½±«´¼ »´·³·²¿¬» ¼·ºº»®»²½» ¾»¬©»»² ¶«¼¹» ¾«¬ ²±¬³±¼·º§ ¬¸» ¼·ºº»®»²½» ¾»¬©»»² ¿³°´» ø©·¬¸·² «¾¶»½¬÷ò ß½½±®¼ó·²¹ ¬± д»³³±² ¿²¼ λ«®®»½½·±² øïççè÷ô ¿ ©¿®³ó«° ¿³°´» »´·³ó·²¿¬» º·®¬ó¿³°´» ¾·¿ ¿²¼ ¬¸« ·²½®»¿» °¿²»´·¬ ®»´·¿¾·´·¬§ò
̸» »²±®§ °®±º·´» º±® »¿½¸ ¾»ª»®¿¹» ©¿ ½®»¿¬»¼ ¾§ ½¿´½«´¿ó¬·²¹ ¬¸» ³»¿² ±ª»® ¬¸» ¬©± ¿»³»²¬ò Ú±® ¬¸» ÝÓÝ ®»º»®»²½»ô¬¸» »²±®§ °®±º·´» ©¿ ½®»¿¬»¼ ¾§ ½¿´½«´¿¬·²¹ ¬¸» ³»¿² ±ª»® ¿´´éé ¿»³»²¬ò ̸» ª·½±·¬·» ±º ¬¸» ¾»ª»®¿¹» ©»®» ¼»¬»®³·²»¼ ¿¬ª¿®·±« ¸»¿® ®¿¬» º®±³ ïê ¬± ïëéñ»½ò ̸» ®»´¿¬·±²¸·° ¾»¬©»»²»²±®§ »ª¿´«¿¬·±² ¿²¼ ¬¸» ·²¬®«³»²¬¿´ ³»¿«®»³»²¬ ©»®»»¨°´±®»¼ ©·¬¸ ½±®®»´¿¬·±² ¬»¬ò ̸» ¼¿¬¿ «»¼ ·² ¬¸» ½±®®»´¿¬·±²¿²¿´§· ©»®» ¬¸» ³»¿² ±º ¬©± ®»°´·½¿¬» ¿³°´»ò ÝÓÝ ®»º»®»²½»¼¿¬¿ ©»®» ·²½´«¼»¼ ·² ¬¸» ½±®®»´¿¬·±² ¿²¿´§·ò Ì©±ó©¿§ ¿²¿´§·±º ª¿®·¿²½» øßÒÑÊß÷ ©¿ «»¼ º±® ¬»¬·²¹ °±·¾´» ·²¬»®¿½¬·±² ·²¬¸» »²±®§ ¼¿¬¿ò ײ¼»°»²¼»²¬ ª¿®·¿¾´» ©»®» ½±²½»²¬®¿¬·±² øº±«®´»ª»´÷ ¿²¼ ó¹´«½¿² ±«®½» øº±«® °®»°¿®¿¬·±²÷ô ¼»°»²¼»²¬ ª¿®·ó¿¾´» ©»®» ¿´´ »²±®§ ¿¬¬®·¾«¬»ò ÝÓÝ ®»º»®»²½» ¼¿¬¿ ©»®»»¨½´«¼»¼ º®±³ ¬¸· ¿²¿´§· ¾»½¿«» ¬¸» ¼¿¬¿ ©»®» ·²½´«¼»¼ ·² ¬¸»¿¼¶«¬³»²¬ ±º ¬¸» ±¬¸»® ¿³°´» ¿²¼ ¾»½¿«» ·¬ ¼·¼ ²±¬ ½±²¬¿·² ¿²§
ó¹´«½¿²ò ÍÐÍÍ ±º¬©¿®» øªò ïðòðòëô ÍÐÍÍ ×²½ò ݸ·½¿¹±ô ×Ô÷ ©¿«»¼ º±® ¬¸» ¬¿¬·¬·½¿´ ¿²¿´§·ò
ÎÛÍËÔÌÍ
Í»²±®§ Ю±º·´»
Í»²±®§ °®±º·´» ±º ¬¸» ¾»ª»®¿¹» ¼·ºº»®»¼ ¿¬ ¬¸» ¿³» ó¹´«½¿²½±²½»²¬®¿¬·±²ô ¼»°»²¼·²¹ ±² ¬¸» ¬§°» ±º ó¹´«½¿² ±«®½» øÚ·¹ò ￲¼ î÷ò ̸» ¬¸·½µ²» ±º ¬¸» ¾»ª»®¿¹» »°»½·¿´´§ ª¿®·»¼ ¿³±²¹
ÌßÞÔÛ ×ݱ³°±·¬·±² ±º óÙ´«½¿² Ю»°¿®¿¬·±²
ÞÙï ÞÙî ÞÙí ÞÙì
ߪ»®¿¹» ³±´»½«´¿® ©»·¹¸¬ øÓ©÷ îôðððµ îôðððµ ïêðµ êðµÝ¿®¾±¸§¼®¿¬» øûô ¼¾÷ ëè�êî ëè�êî íë ë̱¬¿´ ¼·»¬¿®§ º·¾»® øûô ¼¾÷ íî�íè íî�íè îê ëð
óÙ´«½¿² øûô ©¾÷ ïíòì ïíòé îïòç íìòîÔ·°·¼ øûô ¼¾÷ ïð�ïî ïð�ïî ïð ïêЮ±¬»·² øûô ¼¾÷ îï�îë îï�îë îî îè߸ øûô ¼¾÷ ì�ê ì�ê ï ì
ÌßÞÔÛ ××ݱ²½»²¬®¿¬·±² ±º óÙ´«½¿² ·² Þ»ª»®¿¹» Í¿³°´»
Í¿³°´» ݱ²½»²¬®¿¬·±² ±º ó¹´«½¿² ø©ñ©ô ó¹´«½¿²÷
ÞÙï ðòîëû ðòëû ïòðûÞÙî ðòîëû ðòëû ïòðûÞÙí ðòëû ïòðû îòðûÞÙì ðòëû ïòðû îòðûÑ®¿²¹» ¾»ª»®¿¹» ®»º»®»²½» ¿³°´»ø¼±» ²±¬ ½±²¬¿·² ó¹´«½¿²÷ ïòíû ÝÓÝ
II/2

ëíè ÝÛÎÛßÔ ÝØÛÓ×ÍÌÎÇ
°®»°¿®¿¬·±²ò ̸» ³±®» °®±½»»¼ °®»°¿®¿¬·±² øÞÙí ¿²¼ ÞÙì÷ ¸¿¼¬¸·²²»® ³±«¬¸º»»´ ¬¸¿² ¬¸» ¾®¿²ó¬§°» °®»°¿®¿¬·±² øÞÙï ¿²¼ ÞÙî÷ò
̸»» ¬¿¬·¬·½¿´ ·²¬»®¿½¬·±² ¾»¬©»»² ó¹´«½¿² ±«®½» ø°®»°¿ó®¿¬·±² ¬§°»÷ ¿²¼ ó¹´«½¿² ½±²½»²¬®¿¬·±² ·² ¬¸» ¾»ª»®¿¹» ©»®»¬»¬»¼ º«®¬¸»®ò ͬ¿¬·¬·½¿´ ·²¬»®¿½¬·±² ¾»¬©»»² ¬¸» ¬§°» ±º ó¹´«½¿²¿²¼ ½±²½»²¬®¿¬·±² ©»®» º±«²¼ ·² ¬©± ¿¬¬®·¾«¬»æ ï÷ »¨¬»²·¾·´·¬§ ±º¾»ª»®¿¹» ø°±«®»¼ º®±³ ¬¸» °±±²÷ øÚÅëô îíðà ã îòçîéå Ð ã ðòðïì÷¿²¼ î÷ ¬¸·½µ²» ±º ¬¸» ¾»ª»®¿¹» øÚÅëô îíðà ã ëòèëíå Ð ä ðòððï÷øÚ·¹ò í ¿²¼ ì÷ò ײ ÞÙï ¿²¼ ÞÙî °®»°¿®¿¬·±²ô ¬¸» ·²½®»¿» ±º»¨¬»²·¾·´·¬§ ¿²¼ ¬¸·½µ²» ©·¬¸ ½±²½»²¬®¿¬·±² ©¿ ¬»»°»® ¬¸¿² ·²ÞÙí ¿²¼ ÞÙì °®»°¿®¿¬·±²ò Þ»½¿«» ±º ¬¸» ·²½±³°´»¬» ¼¿¬¿ ¿¬ ½±²ó½»²¬®¿¬·±² ±º ðòîë ¿²¼ îòðûô ¬¸» ·²¬»®¿½¬·±² ©»®» ¿´± ¬»¬»¼«·²¹ ±²´§ ½±²½»²¬®¿¬·±² ±º ðòë ¿²¼ ïòðûå ¬¸» ®»«´¬ ©¿ ¬¸» ¿³»ò
Í»²±®§ ¬¸·½µ²» ø³±«¬¸÷ô »¨¬»²·¾·´·¬§ ø°±±²÷ô ¿²¼ ´·³·²»ø³±«¬¸÷ ©»®» ¬®±²¹´§ ½±®®»´¿¬»¼ ø® ã ðòçï�ðòçëô Ð ä ðòððï÷ô ©¸·½¸³»¿² ¬¸¿¬ ¬¸»» ¿¬¬®·¾«¬» ¼·¼ ²±¬ ª¿®§ ·²¼»°»²¼»²¬´§ ·² ¬¸»»¾»ª»®¿¹» ¿³°´»ò
ײ¬®«³»²¬¿´ ¿²¼ Í»²±®§ Ó»¿«®»³»²¬ ݱ®®»´¿¬·±²Ì¸» ª·½±·¬·» ·²½®»¿»¼ ®»³¿®µ¿¾´§ ©·¬¸ ¬¸» ·²½®»¿·²¹ ½±²½»²ó
¬®¿¬·±² ±º ó¹´«½¿² ·² ¬¸» ¾»ª»®¿¹»ò ̸»®» ©¿ ¿´± ´¿®¹» ª¿®·¿¬·±²
¾»¬©»»² ¬¸» °®»°¿®¿¬·±²ò Ú±® »¨¿³°´»ô ¿¬ ¿ ¸»¿® ®¿¬» ïððñ»½ô ¬¸»ª·½±·¬·» ª¿®·»¼ º®±³ ì ³Ð¿ øÞÙì ðòëû÷ ¬± ïôîîí ³Ð¿ øÞÙîïòðû÷ øÌ¿¾´» ×Ê÷ò ײ ³±¬ ¿³°´»ô ¬¸» ª·½±·¬§ ¿´± ¸±©»¼ ¸»¿®ó¬¸·²²·²¹ ¾»¸¿ª·±®ô ©·¬¸ ¬¸» ¸·¹¸»¬ ª·½±·¬§ ¿¬ ¬¸» ´±©»¬ ¸»¿® ®¿¬»ò
̸» ª·½±·¬§ ©¿ ³»¿«®»¼ ¿¬ ¼·ºº»®»²¬ ¸»¿® ®¿¬»ò ̸» ½±®®»ó´¿¬·±² ¾»¬©»»² »²±®§ ¬¸·½µ²»ô ´·³·²»ô ¿²¼ ·²¬®«³»²¬¿´ ª·ó½±·¬§ ©¿ ®»´¿¬·ª»´§ ¸·¹¸ ¿¬ ¿´´ ¸»¿® ®¿¬» »¨½»°¬ ¿¬ ¬¸» ´±©»¬¸»¿® ®¿¬» ±º ïêñ»½ øÌ¿¾´» Ê÷ò ̸» ½±®®»´¿¬·±² ©¿ ¸·¹¸»¬ ¿¬ ¸»¿®®¿¬» ïððñ»½ ¾«¬ ¬¸» ¼·ºº»®»²½» ¾»¬©»»² ¸»¿® ®¿¬» ©»®» ³¿´´òɸ»² ¬¸» ¬¸·½µ»¬ ¾»ª»®¿¹» øÞÙï ïû ¿²¼ ÞÙî ïû÷ ©»®» ®»³±ª»¼º®±³ ¬¸» ½±®®»´¿¬·±² ¿²¿´§·ô ¬¸» ½±®®»´¿¬·±² ¾»¬©»»² »²±®§¬¸·½µ²» ¿²¼ ·²¬®«³»²¬¿´ ª·½±·¬§ ·²½®»¿»¼ ¸¿®°´§ ¿¬ ¸»¿®®¿¬» ±º îêñ»½ º®±³ ® ã ðòéï�ðòéè øÐ ä ðòððï÷ ¬± ® ã ðòçï�ðòçëøÐ ä ðòððï÷ò ̸· ³¿§ ¾» ¼«» ¬± º¿½¬ ¬¸¿¬ ¬¸» ÞÙï ¿²¼ ÞÙî¾»ª»®¿¹» ©»®» °®±¾¿¾´§ ¬±± ¬¸·½µ º±® ¬¸» ª·½±·¬§ ³»¿«®»³»²¬òײ ¬¸· ½¿»ô ¬¸» ÞÙï ïû ¿²¼ ÞÙî ïû ¾»ª»®¿¹» ¿³°´» ©»®»¾¿®»´§ ¼®·²µ¿¾´»å ¬¸»§ ©»®» ½´±»® ¬± ¿ °«¼¼·²¹ó¬§°» ±º º±±¼ò
̸» ±«® º´¿ª±® »»³»¼ ¬± ¾» ³¿µ»¼ ¾§ ¬¸» ª·½±·¬§ ±º ¬¸»¾»ª»®¿¹» ø® ã �ðòéðå Ð ä ðòððïô ¿¬ ¿ ¸»¿® ®¿¬» ±º ïððñ»½÷ò ̸»·²¬»²·¬§ ±º ¬¸» ±®¿²¹» ¿®±³¿ ø® ã �ðòìçå Ð ã ðòððëô ¿¬ ¿ ¸»¿® ®¿¬»±º ïððñ»½÷ ¿²¼ ¬¸» ¬±¬¿´ º´¿ª±® ·²¬»²·¬§ ø® ã �ðòëìå Ð ã ðòððîô ¿¬ ¿
Ú·¹ò ïò Í»²±®§ °®±º·´» ±º ¬¸» ¿³°´» ¿¬ ¿ ½±²½»²¬®¿¬·±² ±º ðòëû ó¹´«½¿² ·² ¾»ª»®¿¹» ¿²¼ ®»º»®»²½» ¿³°´» øïòíû ÝÓÝ÷ò
Ú·¹ò îò Í»²±®§ °®±º·´» ±º ¿³°´» ¿¬ ¿ ½±²½»²¬®¿¬·±² ±º ïòðû ó¹´«½¿² ·² ¾»ª»®¿¹» ¿²¼ ®»º»®»²½» ¿³°´» øïòíû ÝÓÝ÷ò
II/3

ʱ´ò èðô Ò±ò ëô îððí ëíç
¸»¿® ®¿¬» ±º ïððñ»½÷ ¿´± ½±®®»´¿¬»¼ ²»¹¿¬·ª»´§ ©·¬¸ ¬¸» ·²¬®«ó³»²¬¿´ ª·½±·¬§ò
Ûºº»½¬ ±º Ó±´»½«´¿® É»·¹¸¬ ±º óÙ´«½¿² ±² Í»²±®§ ̸·½µ²»Ì¸» ½±®®»´¿¬·±² ¾»¬©»»² ³±´»½«´¿® ©»·¹¸¬ ø´±¹Ó©÷ ¿²¼ ½±®»
»²±®§ ¿¬¬®·¾«¬» ©»®» ½¿´½«´¿¬»¼ ¿¬ ¿ ½±²½»²¬®¿¬·±² ±º ïòðû ó¹´«½¿² ø² ã è÷ ¾»½¿«» ¬¸· »²¿¾´»¼ ¬¸» ½±³°¿®·±² ±º ª·½±·¬·»±º ¼·ºº»®»²¬ °®»°¿®¿¬·±² ¿¬ ¿³» ½±²½»²¬®¿¬·±² ±º ó¹´«½¿²ò ̸»»²±®§ ¬¸·½µ²» ¬®±²¹´§ ½±®®»´¿¬»¼ ©·¬¸ ¬¸» ³±´»½«´¿® ©»·¹¸¬ ±º
ó¹´«½¿² ø® ã ðòççå Ð ä ðòððï÷ô ± ¬¸» ¸·¹¸ ³±´»½«´¿® ©»·¹¸¬ ó¹´«½¿² ¹¿ª» ¸·¹¸»® ª·½±·¬§ ¬¸¿² ´±© ³±´»½«´¿® ©»·¹¸¬ ó¹´«½¿²ò̸»®» ©¿ ¿ ²»¹¿¬·ª» ½±®®»´¿¬·±² ¾»¬©»»² ³±´»½«´¿® ©»·¹¸¬ ¿²¼±«® º´¿ª±® ø® ã �ðòçìå Ð ã ðòððï÷ô ¬¸» ·²¬»²·¬§ ±º ¬¸» ±®¿²¹»¿®±³¿ ø® ã �ðòèçå Ð ã ðòððí÷ô ¿²¼ ¬±¬¿´ º´¿ª±® ·²¬»²·¬§ ø® ã �ðòçïåÐ ã ðòððî÷ò
Ü×ÍÝËÍÍ×ÑÒ
̸» ³±´»½«´¿® ©»·¹¸¬ ±º ó¹´«½¿²ô ¿²¼ ¸»²½» ¬¸» ª·½±·¬§ô ·»²·¬·ª» ¬± °®±½»·²¹ò Ü·ºº»®»²¬ ó¹´«½¿² °®»°¿®¿¬·±² ¸±©»¼¼·ºº»®»²¬ ª·½±·¬·» ø¾±¬¸ »²±®§ ¿²¼ ·²¬®«³»²¬¿´÷ ·² ¾»ª»®¿¹»½±²¬¿·²·²¹ ¬¸» ¿³» ¿³±«²¬ ó¹´«½¿²ò ̸» ½±®®»´¿¬·±² ¾»¬©»»²³±´»½«´¿® ©»·¹¸¬ ¿²¼ »²±®§ ¬¸·½µ²» ©¿ ¬®±²¹ò Ô±© ³±´»½«´¿®©»·¹¸¬ ó¹´«½¿² ¹¿ª» ´» ª·½±« ³±«¬¸º»»´ ¬¸¿² ¸·¹¸ ³±´»½«´¿®©»·¹¸¬ ó¹´«½¿² ¿¬ ¬¸» ¿³» ½±²½»²¬®¿¬·±² ´»ª»´ò ̸» º·²¼·²¹ ©¿»¨°»½¬»¼ ¿²¼ ·³·´¿® ¬± ¬¸¿¬ ¿´®»¿¼§ ®»°±®¬»¼ ¾§ ɱ±¼ »¬ ¿´øîððð÷ò ̸»§ º±«²¼ ¿ ´·²»¿® ®»´¿¬·±²¸·° ¾»¬©»»² ´±¹ ø½±²½»²¬®¿¬·±²I Ó©÷ ¿²¼ ´±¹ ª·½±·¬§ ø¿¬ ¿ ¸»¿® ®¿¬» ±º íðñ»½÷ò Ü«®·²¹ ·±ó
´¿¬·±² ±º ó¹´«½¿² º®±³ ¬¸» ®¿© ³¿¬»®·¿´ô ¬¸» ³±´»½«´¿® ©»·¹¸¬¼»½®»¿»ô ©¸·½¸ ®»¼«½» ¬¸» ª·½±·¬§ ±º ó¹´«½¿²ò ̸»®»º±®»ô ´±©³±´»½«´¿® ©»·¹¸¬ ó¹´«½¿² »²¿¾´» ¿¼¼·²¹ °¸§·±´±¹·½¿´´§ º«²½ó¬·±²¿´ ¿³±«²¬ ±º ó¹´«½¿² ¬± ¿ ¾»ª»®¿¹»ò ر©»ª»®ô ¿ ¸·¹¸ ª·ó½±·¬§ »»³ ¬± ¾» ½®«½·¿´ º±® ¿½¸·»ª·²¹ ¬¸» °±·¬·ª» »ºº»½¬ ±º ó¹´«½¿² ±² °»¿µ ¾´±±¼ ¹´«½±» øɱ±¼ »¬ ¿´ ïççìô îððð÷ô ¸·¹¸³±´»½«´¿® ©»·¹¸¬ ó¹´«½¿² · °¸§·±´±¹·½¿´´§ ³±®» »ºº»½¬·ª» ¬¸¿²´±© ³±´»½«´¿® ©»·¹¸¬ ó¹´«½¿²ò ̸» ®±´» ±º ³±´»½«´¿® ©»·¹¸¬ ±²¬¸» ½¸±´»¬»®±´ó´±©»®·²¹ »ºº»½¬ ±º ó¹´«½¿² · ²±¬ ½´»¿®ò ̸» ª·ó½±·¬§ ±º ó¹´«½¿² ³¿§ ·²½®»¿» ¬¸» »¨½®»¬·±² ±º ½¸±´»¬»®±´ øÖ«¼¼»¬ ¿´ ïçèïå Õ·®¾§ »¬ ¿´ ïçèï÷ô ± ¬¸» ¸·¹¸ ³±´»½«´¿® ©»·¹¸¬ ¿²¼ô¬¸»®»º±®»ô ¬¸» ª·½±·¬§ ±º ó¹´«½¿² ©±«´¼ ¾» »»²¬·¿´ ·² ¿½¸·»ª·²¹¬¸» »ºº»½¬ò Þ»»® »¬ ¿´ øïççé÷ ½±²½´«¼»¼ ¬¸¿¬ °®±½»·²¹ ³¿§ ¼»½®»¿»¬¸» ³±´»½«´¿® ©»·¹¸¬ ±º ó¹´«½¿²ò Ç»¬ ¿ °®±½»»¼ ±¿¬ °®±¼«½¬ ©¿»ºº»½¬·ª» ·² ®»¼«½·²¹ ¾´±±¼ ½¸±´»¬»®±´ ´»ª»´ ·² ¬¸» ¬«¼§ ±ºJ²²·²¹ »¬ ¿´ øïççç÷ò
̸» ª·½±·¬·» ±º ¬¸» ®¿© ³¿¬»®·¿´ ó¹´«½¿² °®»°¿®¿¬·±² øÞÙ￲¼ ÞÙî÷ ¿¬ ¿ ½±²½»²¬®¿¬·±² ±º ðòëû ©»®» íðë ¿²¼ ëçï ³Ð¿ô ¿²¼îëð ¿²¼ ìèð ³Ð¿ ¿¬ ¸»¿® ®¿¬» ±º ïêñ»½ ¿²¼ îêñ»½ô ®»°»½¬·ª»´§ò̸» ³±´»½«´¿® ©»·¹¸¬ ±º ó¹ ½¿² ·² ¾±¬¸ °®»°¿®¿¬·±² ©¿ îôðððµò ײ¬¸» ¬«¼§ ±º Ü¿©µ·² ¿²¼ Ò²¿²²¿ øïççë÷ô ¬¸» ®»«´¬ ©»®»«®°®··²¹´§ ·³·´¿®ò ײ ¬¸»·® ¬«¼§ô ¬¸» ª·½±·¬§ ±º ±¿¬ ¹«³ ¿¬ ¿½±²½»²¬®¿¬·±² ±º ðòëû ©¿ îëð ¿²¼ îðð ³Ð¿ ¿¬ ¸»¿® ®¿¬» ±ºïðñ»½ ¿²¼ îðñ»½ô ®»°»½¬·ª»´§ò ̸» ³±´»½«´¿® ©»·¹¸¬ ±º ó¹´«½¿²©¿ ´±©»® øèèîµ÷ ·² ¬¸¿¬ ¬«¼§ò
ݱ®®»´¿¬·±² ¾»¬©»»² »²±®§ ¬»¨¬«®» ¿²¼ ·²¬®«³»²¬¿´ ¬»¨¬«®»¸¿ª» ¾»»² »¨¿³·²»¼ ·² ³¿²§ ¬«¼·»ò ̸» ¸»¿® ®¿¬» «»¼ ·² ·²¬®«ó³»²¬¿´ ª·½±·¬§ ³»¿«®»³»²¬ ³¿§ ¸¿ª» ¿ ·¹²·º·½¿²¬ »ºº»½¬ ±² ¬¸»
Ú·¹ò íò Û¨¬»²·¾·´·¬§ ±º ¾»ª»®¿¹» ø°±«®»¼ º®±³ ¬¸» °±±²÷ò Ý·®½´» °±·²¬ ®»°®»»²¬ ¬¸» »¨¬»²·¾·´·¬§ ±º ÝÓÝ ®»º»®»²½» ¿³°´»ò
Ú·¹ò ìò ̸·½µ²» ±º ¾»ª»®¿¹»ò Ý·®½´» °±·²¬ ®»°®»»²¬ ¬¸» ¬¸·½µ²» ±º ÝÓÝ ®»º»®»²½» ¿³°´»ò
II/4

ëìð ÝÛÎÛßÔ ÝØÛÓ×ÍÌÎÇ
½±®®»´¿¬·±² ¾»¬©»»² ·²¬®«³»²¬¿´ ¿²¼ »²±®§ ³»¿«®»³»²¬ ±º¬»¨¬«®»ò ̸» ¸·¹¸ ¼»°»²¼»²½» ±º ª·½±·¬§ ±² ¸»¿® ®¿¬» ³¿µ»½±³°¿®·±² ±º ¬¸» ®»«´¬ ¾»¬©»»² ¼·ºº»®»²¬ ¬«¼·» ¼·ºº·½«´¬ ©¸»²¬¸» ¸»¿® ®¿¬» «»¼ ©»®» ²±¬ ¬¸» ¿³»ò б·¬·ª» ½±®®»´¿¬·±² ¾»¬©»»²»²±®§ ¿²¼ ·²¬®«³»²¬¿´ ª·½±·¬§ ·² º±±¼ °®±¼«½¬ ·³·´¿® ¬± ±«®¸¿ ¾»»² º±«²¼ «·²¹ ª¿®·±« ·²¬®«³»²¬ ¿²¼ ¿ ®¿²¹» ±º ¸»¿®®¿¬»ò Ë·²¹ ¿ Þ®±±µº·»´¼ ª·½±³»¬»®ô ¿ ¸·¹¸ ½±®®»´¿¬·±² ø® â ðòç÷©¿ º±«²¼ ¾»¬©»»² »²±®§ ±®¿´ ¿²¼ ·²¬®«³»²¬¿´ ª·½±·¬§ ·²±§³·´µ §±¹«®¬ ø¸»¿® ®¿¬» ïðð ®°³÷ øÞ«±²± »¬ ¿´ ïççð÷ ¿²¼ ·²¬¸®»» ¾»ª»®¿¹» ø¸»¿® ®¿¬» íð ®°³÷ øп²¹¾±®² »¬ ¿´ ïçéè÷ò Ù±±¼½±®®»´¿¬·±² ¾»¬©»»² ·²¬®«³»²¬¿´ ¿²¼ »²±®§ ¬»¨¬«®»³»¿«®»³»²¬ øª·½±·¬§ ¿²¼ ¬¸·½µ²»÷ ±º ¿´¿¼ ¼®»·²¹ øÉ»²¼·²¿²¼ Ø¿´´ îððï÷ ¿²¼ ´»³±² °·» º·´´·²¹ øØ·´´ »¬ ¿´ ïççë÷ ¸¿ª» ¿´±¾»»² º±«²¼ò
ײ ±«® ¬«¼§ô ª·½±·¬§ ³»¿«®»¼ ¿¬ ¼·ºº»®»²¬ ¸»¿® ®¿¬» ¸¿¼·¹²·º·½¿²¬ ¾«¬ ±³»©¸¿¬ ´±©»® ½±®®»´¿¬·±² ½±³°¿®»¼ ©·¬¸ ±¬¸»®¬«¼·» ©·¬¸ »²±®§ ¬¸·½µ²» ¿²¼ ´·³·²»ò ׬ · ¬¸»®»º±®» °±·¾´»¬± °®»¼·½¬ »²±®§ ¬¸·½µ²» ¾¿»¼ ±² ·²¬®«³»²¬¿´ ª¿´«»ò ߺ¬»®®»³±ª·²¹ ¬¸» ¬¸·½µ»¬ ¾»ª»®¿¹» ¿³°´» º®±³ ¬¸» ¿²¿´§·ô ¬¸»½±®®»´¿¬·±² ·²½®»¿»¼ ¸¿®°´§ ¬± ® â ðòçò η½¸¿®¼±² »¬ ¿´ øïçèç÷º±«²¼ ª·½±·¬§ ¿¬ ¿ ¸»¿® ®¿¬» ±º ëðñ»½ ¸¿¼ ¬¸» ¬®±²¹»¬ ½±®®»´¿¬·±²©·¬¸ »²±®§ ´·³·²» ·² ¬®«» ±´«¬·±² ¿²¼ ©»¿µ ¹»´ò ̸· ®»«´¬¼·ºº»® º®±³ ±«®å ©» º±«²¼ ¬¸¿¬ ¿´´ ¬¸» «»¼ ¸»¿® ®¿¬» âïêñ»½½±®®»´¿¬»¼ ©»´´ ©·¬¸ »²±®§ ´·³·²»ò
̸» ±«®²» ±º ¬¸» º´¿ª±® ©¿ ®¿¬»¼ ´±©»® ·² ¬¸» ³±®» ª·½±«¾»ª»®¿¹» ¬¸¿² ·² ¬¸» ´» ª·½±« ¿³°´»ò ß´±ô ·²¬»²·¬§ ±º ¬¸»±®¿²¹» ¿®±³¿ ¿²¼ ¬¸» ¬±¬¿´ º´¿ª±® ·²¬»²·¬§ ½±®®»´¿¬»¼ ²»¹¿¬·ª»´§©·¬¸ ¬¸» ·²¬®«³»²¬¿´ ª·½±·¬§ò ر©»ª»®ô ¿ ¬¸» ó¹´«½¿² °®»°¿ó®¿¬·±² ½±²¬¿·²»¼ ±²´§ ïí�íìû ó¹´«½¿²ô ·¬ · ¼·ºº·½«´¬ ¬± »°¿®¿¬»¬¸» °«®» »ºº»½¬ ±º ª·½±·¬§ º®±³ ¬¸» »ºº»½¬ ±º ·²½®»¿·²¹ ½±²½»²ó
¬®¿¬·±² ±º ±¬¸»® ½±³°±²»²¬ ±² ¬¸» ¬¿¬»ò ײ ¹»²»®¿´ô ¬¸» ª·½±·¬§±º º±±¼ ³±¼·º·» ¬¸» °»®½»°¬·±² ±º ¬¿¬» øп«´« ¿²¼ Ø¿¿ ïçèðåÙ±¼¸¿´´ ïçèè÷ò Ú«®¬¸»®³±®»ô ½±³°±·¬·±² ±º ¬¸» ¬¸·½µ»²»® ¿´±²»¸¿ ¿ ¹®»¿¬»® »ºº»½¬ ±² ¬¸» °»®½»°¬·±² ±º º´¿ª±® ¬¸¿² ¬¸» ª·½±·¬§øп²¹¾±®² »¬ ¿´ ïçéíå Ó<´µµ· »¬ ¿´ ïççí÷ò ß³±²¹ ¬¸» ±ó½¿´´»¼°®·³¿®§ ¬¿¬»ô ±«®²» · ³¿µ»¼ ¾§ ª·½±·¬§ øп²¹¾±®² »¬ ¿´ïçéíå É»²¼·² »¬ ¿´ ïççé÷ò
̸»®» ¸¿ ¬± ¾» «ºº·½·»²¬ ¿³±«²¬ ±º ó¹´«½¿² ·² º±±¼ °®±¼«½¬¬± ®»¿½¸ ¬¸» ´»ª»´ ²»»¼»¼ º±® ¸»¿´¬¸ »ºº»½¬ò ÚÜß ¿´´±© ¬¸» ¸»¿´¬¸½´¿·³ º±® °®±¼«½¬ ½±²¬¿·²·²¹ ¿ ³·²·³«³ ±º ðòéë ¹ ±º ó¹´«½¿²°»® °±®¬·±²ò ̸» ´±©»¬ «¹¹»¬»¼ ¼¿·´§ ·²¬¿µ» ±º ó¹´«½¿² º±®¿½¸·»ª·²¹ ¬¸» ¸»¿´¬¸ »ºº»½¬ · í ¹ °»® ¼¿§ô ©¸·½¸ ®»¯«·®» º±«®°±®¬·±² ©·¬¸ ðòéë ¹ ±º ó¹´«½¿²ò Þ»ª»®¿¹» ³±¼»´ ·² ¬¸· ¬«¼§½±²¬¿·²»¼ ó¹´«½¿² º®±³ ðòîë ¹ñïðð ³Ô ¬± î ¹ñïðð ³Ôò ײ ½±³ó°´·¿²½» ©·¬¸ ¬¸» ÚÜß ´·³·¬ ±² ¬¸» ¿³±«²¬ ±º ó¹´«½¿² °»® °±®¬·±²º±® «·²¹ ¬¸» ¸»¿´¬¸ ½´¿·³ô ¬¸» ·¦» ±º ±²» °±®¬·±² ©±«´¼ ª¿®§ º®±³íðð ³Ô øðòîëû÷ ¬± íéòë ³Ô øîû÷ò É·¬¸ ¿³°´» ÞÙï ¿²¼ ÞÙîô ·¬· ²±¬ °±·¾´» ¬± ¹± ¸·¹¸»® ¬¸¿² ðòëû ó¹´«½¿² ·² ¬¸» ¾»ª»®¿¹» ¼«»¬± ¬»½¸²±´±¹·½¿´ °®±¾´»³ ø¬¸» ¾»ª»®¿¹» ¹»¬ ¬±± ¬¸·½µ÷ô ¾«¬ ©·¬¸ ¿³ó°´» ÞÙí ¿²¼ ÞÙìô ·¬ · °±·¾´» ¬± ¹± ¬± ¿ ½±²½»²¬®¿¬·±² ±º îû ó¹´«½¿² ·² ¬¸» ¾»ª»®¿¹»ò Ë·²¹ °«®·º·»¼ ó¹´«½¿² º®¿½¬·±² ¿´± ¿ª±·¼·³°«®·¬·» ±º ¬¿®½¸ ¿²¼ °®±¬»·² ¬¸¿¬ ½¿² ½¿«» ·²½®»¿»¼ ª·½±·¬§ ·²º±±¼ ¿²¼ ½±²»¯«»²¬´§ ½¿«» °®±¾´»³ ·² º±±¼ °®±½»·²¹ò
̸» ¹±±¼ ª·½±·¬§óº±®³·²¹ °®±°»®¬·» ³¿µ» ó¹´«½¿² °±¬»²¬·¿´¿´¬»®²¿¬·ª» ¿ ¬¸·½µ»²·²¹ ¿¹»²¬ ·² ¼·ºº»®»²¬ º±±¼ ¿°°´·½¿¬·±² «½¸¿ ·½» ½®»¿³ô ¿«½»ô ¿²¼ ¿´¿¼ ¼®»·²¹ øɱ±¼ ïçèê÷ò ׬ ¿¾·´·¬§¬± ·²½®»¿» ª·½±·¬§ · ´±©»® ¬¸¿²ô ±® ¿¬ ¬¸» ¿³» ´»ª»´ ¿ô ±¬¸»®¬¸·½µ»²·²¹ ¿¹»²¬ò ݱ³°¿®»¼ ©·¬¸ ±¬¸»® ¬¸·½µ»²»® ¿¬ ¿ ½±²½»²¬®¿ó¬·±² ±º ðòëûô ±¿¬ ¹«³ · ´» ª·½±« ¬¸¿² ¨¿²¬¸¿² ¿²¼ ¹«¿® ¹«³¾«¬ ³±®» ª·½±« ¬¸¿² ´±½«¬ ¾»¿² ¹«³ ¿²¼ ¹«³ ¿®¿¾·½ øÜ¿©µ·²¿²¼ Ò²¿²²¿ ïççë÷ò É·¬¸ ¸»¿® ®¿¬» ·²½®»¿·²¹ º®±³ ïñ»½ ¬± îðñ»½ô¬¸» ¼·ºº»®»²½» ¾»¬©»»² ¹«³ ¼»½®»¿»¼ò Ê·½±·¬§ ±º ó¹´«½¿² ·²±¬ ¿ºº»½¬»¼ ¾§ °Ø ´»ª»´ øÜ¿©µ·² ¿²¼ Ò²¿²²¿ ïççë÷ ¾»½¿«» ó¹´«½¿² · ¿ ²»«¬®¿´ ¿²¼ ²±²·±²·½ °±´§³»®ò óÙ´«½¿² · ¬¸»®»º±®»«·¬¿¾´» º±® ¿ ©·¼» ®¿²¹» ±º º±±¼ °®±¼«½¬ «½¸ ¿ ¿½·¼·½ ¾»ª»®¿¹»òÍ«½®±» »»³ ¬± ·²½®»¿» ª·½±·¬§ ±º ¹´«½¿² øß«¬·± »¬ ¿´ ïçèéåÜ¿©µ·² ¿²¼ Ò²¿²²¿ ïççë÷ò ̸» ¿³» ®»«´¬ ¸¿ ¾»»² ®»°±®¬»¼ ¾§
ÌßÞÔÛ ×××߬¬®·¾«¬» ¿²¼ Ó±¼»´ ±º ¬¸» ߬¬®·¾«¬» º±® Í»²±®§ Ûª¿´«¿¬·±²
߬¬®·¾«¬» ͽ¿´» ð ͽ¿´» ïð Ó±¼»´ º±® Ô±© Ô»ª»´ ߬¬®·¾«¬» Ó±¼»´ º±® Ø·¹¸ Ô»ª»´ ߬¬®·¾«¬»
Ú´¿ª±®×²¬»²·¬§ ±º ±¿¬ º´¿ª±® Ò±¬ ¿¬ ¿´´ ·²¬»²» Û¨¬®»³»´§ ·²¬»²» Ñ®¿²¹» ¶«·½» Ñ®¿²¹» ¶«·½» ³·¨»¼ ©·¬¸ ±¿¬ º´¿µ»Î¿²½·¼·¬§ ±º ¬¸» º´¿ª±® Ò±¬ ¿¬ ¿´´ ®¿²½·¼ Û¨¬®»³»´§ ®¿²½·¼ Ñ®¿²¹» ¶«·½» Ñ®¿²¹» ¶«·½» ©·¬¸ ®¿²½·¼ ±¿¬ ½±±µ·»Í©»»¬²» ±º ¬¸» º´¿ª±® Ò±¬ ¿¬ ¿´´ ©»»¬ Û¨¬®»³»´§ ©»»¬ Ô±©ó«¹¿® ±®¿²¹» ¶«·½» Ø·¹¸ó«¹¿® ±®¿²¹» ¶«·½»Í±«®²» ±º ¬¸» º´¿ª±® Ò±¬ ¿¬ ¿´´ ±«® Û¨¬®»³»´§ ±«® Ñ®¿²¹» ¶«·½» Ö«·½» ©·¬¸ ¸·¹¸ ±®¿²¹» ¿®±³¿×²¬»²·¬§ ±º ±®¿²¹» ¿®±³¿ Ò±¬ ¿¬ ¿´´ ·²¬»²» Û¨¬®»³»´§ ·²¬»²» Ö«·½» ©·¬¸ ´±© ±®¿²¹» ¿®±³¿ Ö«·½» ©·¬¸ ¸·¹¸ ±®¿²¹» ¿®±³¿Ì±¬¿´ º´¿ª±® ·²¬»²·¬§ Ò±¬ ¿¬ ¿´´ ·²¬»²» Û¨¬®»³»´§ ·²¬»²» Ò± ³±¼»´ Ò± ³±¼»´
Ì»¨¬«®» Û¨¬»²·¾·´·¬§ ±º ¬¸»
¾»ª»®¿¹» ø°±«®»¼ º®±³ ¬¸» °±±²÷
Ò±¬ ¿¬ ¿´´ »¨¬»²·¾´» Û¨¬®»³»´§ »¨¬»²·¾´» Ñ®¼·²¿®§ ±®¿²¹» º±±´ ø¬¸·½µ»²»¼ ©·¬¸ °±¬¿¬± ¬¿®½¸÷
Ñ®¿²¹» º±±´ô »¨¬»²·¾´» ø©¸·°°»¼ ©¸·´» ¾±·´·²¹÷
̸·½µ²» ±º ¬¸» ¾»ª»®¿¹» ø·² ³±«¬¸÷ Ò±¬ ¿¬ ¿´´ ¬¸·½µ Û¨¬®»³»´§ ¬¸·½µ Ñ®¿²¹» ¶«·½»
̸·½µ ±®¿²¹» º±±´ ø¬¸·½µ»²»¼ ©·¬¸ °±¬¿¬± ¬¿®½¸÷
Ù®¿·²·²» ±º ¬¸» ³±«¬¸º»»´ Ò±¬ ¿¬ ¿´´ ¹®¿·²§ Û¨¬®»³»´§ ¹®¿·²§ Ñ®¿²¹» ¶«·½» Ñ®¿²¹» ¶«·½» ©·¬¸ ½±®² ¬¿®½¸Ë²»ª»²²» ±º ³±«¬¸º»»´ Ûª»² ˲»ª»² Ñ®¿²¹» º±±´ ˲»ª»² ±®¿²¹» º±±´Í´·³·²» ±º ¬¸» ³±«¬¸º»»´ Ò±¬ ¿¬ ¿´´ ´·³§ Û¨¬®»³»´§ ´·³§ Ñ®¼·²¿®§ ±®¿²¹» º±±´
ø¬¸·½µ»²»¼ ©·¬¸ °±¬¿¬± ¬¿®½¸÷Í´·³§ ±®¿²¹» º±±´ ø©¸·°°»¼ ©¸·´» ¾±·´·²¹÷
ÌßÞÔÛ Êݱ®®»´¿¬·±² Þ»¬©»»² ײ¬®«³»²¬¿´ ¿²¼ Í»²±®§ Ó»¿«®»³»²¬¿
Ê·½±·¬§ ¿¬ ͸»¿® כּ
ïêñ»½ îêñ»½ ëðñ»½ ïððñ»½
ͱ«®²» ±º º´¿ª±® �ðòëíöö �ðòéìöö �ðòéîöö �ðòéðööײ¬»²·¬§ ±º ±®¿²¹» ¿®±³¿ �ðòîç �ðòëíöö �ðòëïöö �ðòëðöö̱¬¿´ º´¿ª±® ·²¬»²·¬§ �ðòìîö �ðòêîöö �ðòëçöö �ðòëìöö̸·½µ²» ø³±«¬¸÷ ðòìëö ðòéïöö ðòéíöö ðòéèööÍ´·³·²» ðòîë ðòêíöö ðòêëöö ðòéðöö¿ öô Ð ä ðòðë øî󬿷´»¼÷å ööô Ð ä ðòðï øî󬿷´»¼÷å ² ã íï�íîò
ÌßÞÔÛ ×ÊÊ·½±·¬§ ±º Þ»ª»®¿¹» ø³Ð¿÷ ¿¬ Ú±«® Ü·ºº»®»²¬ ͸»¿® כּ¿
Ê·½±·¬§ ¿¬ ͸»¿® כּ
Í¿³°´» ïêñ»½ îêñ»½ ëðñ»½ ïððñ»½
ÝÓÝ ïòíû íîç íðè îéí îííÞÙï ðòîëû îë îì îî îð ðòëðû íðë îëð ïèî ïíð ïòðû îôéðè ïôçîë ïôïëï êçèÞÙî ðòîëû êè êï ëï ìî ðòëðû ëçï ìèð íîí îïê ïòðû ìôïêî íôðìí ïôççð ïôîîíÞÙí ðòëðû è è è è ïòðû íí íî íï íð îòðû îèð îêç îëì îìðÞÙì ðòëðû ì ì ì ì ïòðû ç ç ç ç îòðû ïçð ïëê ïîî çè
¿ Ó»¿² ±º ¬©± ®»°´·½¿¬» ³»¿«®»³»²¬ò
II/5

ʱ´ò èðô Ò±ò ëô îððí ëìï
Û´º¿µ »¬ ¿´ øïçéé÷ º±® ¹«¿® ¹«³ ¿²¼ ´±½«¬ ¾»¿² ¹«³ ±´«¬·±²ò ̱¿½¸·»ª» ¬¸· »ºº»½¬ô ¬¸» «¹¿® ½±²½»²¬®¿¬·±² ·² ¬¸»» ¬«¼·» ª¿®·»¼îð�ëðûò ײ ¬¸» ¾»ª»®¿¹» ±º ±«® ¬«¼§ô ¬¸» «¹¿® ½±²½»²¬®¿¬·±² ©¿çûò ß½½±®¼·²¹ ¬± ß«¬·± »¬ ¿´ øïçèé÷ô Ò¿Ý´ ¸¿ ²± »ºº»½¬ ±² ¬¸» ª·ó½±·¬§ ±º ó¹´«½¿²ò Ü¿©µ·² ¿²¼ Ò²¿²²¿ øïççë÷ º±«²¼ ¿ ¼·ºº»®»²¬®»«´¬å ·² ¬¸»·® ¬«¼§ô ¸·¹¸ ¿´¬ ½±²½»²¬®¿¬·±² ïû÷ ¼»½®»¿»¼ ¬¸»ª·½±·¬§ò ̸» ª·½±·¬§ ±º ó¹´«½¿² ¬»³°±®¿®·´§ ¼»½®»¿» ©·¬¸·²½®»¿»¼ ¬»³°»®¿¬«®» øß«¬·± »¬ ¿´ ïçèéå Ü¿©µ·² ¿²¼ Ò²¿²²¿ïççë÷ô ¾«¬ ¬¸» »ºº»½¬ ±º ¬»³°»®¿¬«®» ±² ª·½±·¬§ ±º ó¹´«½¿² ·®»ª»®·¾´»ò ׬ ©±«´¼ ¾» °»®¸¿° °±·¾´» ¬± ¿¼¼ ³±®» ó¹´«½¿² ¬±©¿®³ º±±¼ °®±¼«½¬ô ¿ ¬¸» °®±¼«½¬ ©±«´¼ ¸¿ª» ¼»½®»¿»¼ »²±®§¬¸·½µ²» ¼«®·²¹ »¿¬·²¹ ±® ¼®·²µ·²¹ ¼«» ¬± ·²½®»¿»¼ ¬»³°»®¿¬«®»ò
ÝÑÒÝÔËÍ×ÑÒÍ
ß »¨°»½¬»¼ô ¬¸» ³±´»½«´¿® ©»·¹¸¬ ±º ó¹´«½¿² ¸¿¼ ¿ ·¹²·º·½¿²¬»ºº»½¬ ±² ¬¸» »²±®§ ¬¸·½µ²» ±º ¾»ª»®¿¹» ¿³°´» ½±²¬¿·²·²¹ ó¹´«½¿²ò ̸» ½±®®»´¿¬·±² ¾»¬©»»² ·²¬®«³»²¬¿´ ª·½±·¬§ ¿²¼ °»®ó½»·ª»¼ ´·³·²» ¿²¼ ¬¸·½µ²» ©»®» ¹±±¼ ø® ã ðòêí�ðòéè÷ô ¿²¼ ¬¸»¸»¿® ®¿¬» ¸¿¼ ²± ²±¬¿¾´» »ºº»½¬ ±² ¬¸» ½±®®»´¿¬·±² ¿¬ ¸»¿® ®¿¬»¾»¬©»»² îêñ»½ ¿²¼ ïððñ»½ò Ì»½¸²±´±¹·½¿´´§ô ·¬ · °±·¾´» ¬± °®»ó°¿®» ¿ ¾»ª»®¿¹» ½±²¬¿·²·²¹ ¿ °¸§·±´±¹·½¿´´§ »ºº»½¬·ª» ¿³±«²¬ ±º
ó¹´«½¿² º®±³ ¬¸» ÔÓÉ ó¹´«½¿² °®»°¿®¿¬·±²ô ©¸·½¸ ¿®» »¿·»® ¬±°®±½» ¬¸¿² ØÓÉ ó¹´«½¿²ò ر©»ª»®ô ¬¸» ®»´¿¬·±²¸·° ¾»¬©»»²°¸§·±´±¹·½¿´ º«²½¬·±²¿´·¬§ ¿²¼ ³±´»½«´¿® ©»·¹¸¬ ¸¿ ¬± ¾» µ»°¬ ·²³·²¼ò ݱ²«³»® ¬«¼·» ¿®» ²»»¼»¼ ¬± ·²ª»¬·¹¿¬» ¬¸» ¿½½»°¬¿¾·´·¬§±º º±±¼ °®±¼«½¬ ½±²¬¿·²·²¹ ó¹´«½¿²ò
ßÝÕÒÑÉÔÛÜÙÓÛÒÌÍ
É» ¬¸¿²µ Ü*¸´»® Ù³¾Øô Ù»®³¿²§ô º±® °®±ª·¼·²¹ « ¬¸» ±®¿²¹» ¾»ª»®ó¿¹» ¾¿»å ÝÛÞß ßÞô Í©»¼»²ô º±® ó¹´«½¿² °®»°¿®¿¬·±²å ¿²¼ ߪ»²¿ Ñ¿¬×²¹®»¼·»²¬ô Ú·²´¿²¼ô º±® ó¹´«½¿² °®»°¿®¿¬·±²ò ̸· ©±®µ ¾»´±²¹ ¬± ¬¸»Ì¿·´±®»¼ Ì»½¸²±´±¹·» º±® Ú«¬«®» Ú±±¼ øÌÌÚÚ÷ ®»»¿®½¸ °®±¹®¿³ ¿¬ ÊÌÌÞ·±¬»½¸²±´±¹§ò ̸· ¬«¼§ ¸¿ ¾»»² º·²¿²½·¿´´§ «°°±®¬»¼ ¾§ ¬¸»Û«®±°»¿² ݱ³³«²·¬§ øÛÝ÷ ©·¬¸·² ¬¸» 문 Ú®¿³»©±®µ Ю±¹®¿³³» «²¼»®¬¸» Ï«¿´·¬§ ±º Ô·º» ¿²¼ Ó¿²¿¹»³»²¬ ±º Ô·ª·²¹ 뱫®½»ô Õ»§ ß½¬·±² ïæЮ±¶»½¬ �Ü»·¹² ±º º±±¼ ©·¬¸ ·³°®±ª»¼ º«²½¬·±²¿´·¬§ ¿²¼ «°»®·±® ¸»¿´¬¸»ºº»½¬ «·²¹ ½»®»¿´ ¾»¬¿¹´«½¿²�ô ÏÔÎÌóîðððóððëíëò
Ô×ÌÛÎßÌËÎÛ Ý×ÌÛÜ
ß®ª±´¿ô ßòô Ô<¸¬»»²³<µ·ô Ôòô ¿²¼ Ì«±®·´¿ô Øò ïçççò Ю»¼·½¬·²¹ ¬¸» ·²¬»²¬¬± °«®½¸¿» «²º¿³·´·¿® ¿²¼ º¿³·´·¿® ½¸»»»æ ̸» »ºº»½¬ ±º ¿¬¬·¬«¼»ô»¨°»½¬»¼ ´·µ·²¹ ¿²¼ º±±¼ ²»±°¸±¾·¿ò ß°°»¬·¬» íîæïïíóïîêò
ß«¬·±ô Õòô Ó§´´§³<µ·ô Ñòô ¿²¼ Ó<´µµ·ô Çò ïçèéò Ú´±© °®±°»®¬·» ±º±´«¬·±² ±º ±¿¬ ó¹´«½¿²ò Öò Ú±±¼ ͽ·ò ëîæïíêìóïíêêò
ß«¬·±ô Õò ïççëò Ú«²½¬·±²¿´ ¿°»½¬ ±º ½»´´ ©¿´´ °±´§¿½½¸¿®·¼»ò п¹»îîéóîêì ·²æ Ý¿®¾±¸§¼®¿¬» ·² Ú±±¼ò ßòóÝò Û´·¿±²ô »¼ò Ó¿®½»´ Ü»µµ»®æÒ»© DZ®µò
Þ»»®ô Óò Ëòô ɱ±¼ô Ðò Öòô É»·¦ô Öòô ¿²¼ Ú·´´·±²ô Òò ïççéò Ûºº»½¬ ±º ½±±µ·²¹¿²¼ ¬±®¿¹» ±² ¬¸» ¿³±«²¬ ¿²¼ ³±´»½«´¿® ©»·¹ ¬ ±º øïóí÷øïóì÷ó óÜó¹´«½¿² »¨¬®¿½¬»¼ º®±³ ±¿¬ °®±¼«½¬ ¾§ ¿² ·² ª·¬®± ¼·¹»¬·±² §¬»³òÝ»®»¿´ ݸ»³ò éìæéðëóéðçò
Þ®¿¿¬»²ô Öò Ìòô ɱ±¼ô Ðò Öòô ͽ±¬¬ô Úò Éòô η»¼»´ô Õò Üòô ᬻô Ôò Óòô ¿²¼Ý±´´·²ô Óò Éò ïççïò Ñ¿¬ ¹«³ô ¿ ±´«¾´» º·¾®» ©¸·½¸ ´±©»® ¹´«½±»¿²¼ ·²«´·² ·² ²±®³¿´ ·²¼·ª·¼«¿´ ¿º¬»® ¿² ±®¿´ ¹´«½±» ´±¿¼æ ݱ³°¿®·ó±² ©·¬¸ ¹«¿® ¹«³ò ß³ò Öò Ý´·²ò Ò«¬®ò ëíæïìîëóïìíðò
Þ«±²±ô Óò ßòô Í»¬»®ô Ýòô Û®·½µ±²ô Ôò Ûòô ¿²¼ Ú«²¹ô Üò Çò Ýò ïççðò ͱ§ó³·´µ §±¹¸«®¬æ Í»²±®§ »ª¿´«¿¬·±² ¿²¼ ½¸»³·½¿´ ³»¿«®»³»²¬ò Öò Ú±±¼Í½·ò ëëæëîèóëíïò
Ü¿©µ·²ô Òò Ôòô ¿²¼ Ò²¿²²¿ô ×ò ßò ïççëò ͬ«¼·» ±² ±¿¬ ¹«³ Åøïóíôïóì÷ó óÜó¹´«½¿²Ãæ ݱ³°±·¬·±²ô ³±´»½«´¿® ©»·¹¸¬ »¬·³¿¬·±² ¿²¼ ®¸»±´±¹·½¿´°®±°»®¬·»ò Ú±±¼ ا¼®±½±´´±·¼ çæïóéò
Û´º¿µô ßò Óòô пô Ùòô и·´·°ô Ùò Ñòô ¿²¼ Ó±®´»§ô Îò Ùò ïçééò ̸»ª·½±·¬§ ±º ¼·´«¬» ±´«¬·±² ±º ¹«¿® ¹«³ ¿²¼ ´±½«¬ ¾»¿² ¹«³ ©·¬¸ ¿²¼©·¬¸±«¬ ¿¼¼»¼ «¹¿®ò Öò ͽ·ò Ú±±¼ ß¹®·½ò îèæèçëóèççò
ÚÜßò ïççêò Ú±±¼ ´¿¾»´·²¹æ Ø»¿´¬¸ ½´¿·³å Ñ¿¬ ¿²¼ ½±®±²¿®§ ¸»¿®¬¼·»¿»ò Ú»¼»®¿´ λ¹·¬»®æ Ö¿² ìô êïøí÷ò
Ù±¼¸¿´´ô Óò ßò ïçèèò ̸» ®±´» ±º ½¿®¾±¸§¼®¿¬» ·² º´¿ª±«® ¼»ª»´±°³»²¬òÚ±±¼ Ì»½¸²±´ò ïïæéïóéèò
Ø·´´ô Óò ßòô Ó·¬½¸»´´ô Öò Îòô ¿²¼ ͸»®³¿²ô Ðò ßò ïççëò ̸» ®»´¿¬·±²¸·°
¾»¬©»»² ¬¸» ®¸»±´±¹·½¿´ ¿²¼ »²±®§ °®±°»®¬·» ±º ¿ ´»³±² °·» º·´´·²¹òÖò Ì»¨¬«®» ͬ«¼ò îêæìëéóìéðò
ײ¹´»¬¬ô Ùò Ûòô É¿®²»®ô Õòô ¿²¼ Ò»©³¿²ô Îò Õò ïççìò Í»²±®§ ¿²¼ ²«¬®·ó¬·±²¿´ »ª¿´«¿¬·±² ±º Ñ¿¬®·³ò Ý»®»¿´ Ú±±¼ ɱ®´¼ íçæéëëóéëçò
Ö«¼¼ô Ðò ßòô ¿²¼ Ì®«©»´´ô ßò Íò ïçèïò ̸» »ºº»½¬ ±º ®±´´»¼ ±¿¬ ±² ¾´±±¼ ´·°·¼¿²¼ º»½¿ ¬»®±·¼ »¨½®»¬·±² ·² ³¿²ò ß³ò Öò Ý´·²ò Ò«¬®ò íìæîðêïóîðêéò
Õ·®¾§ô Îòô ß²¼»®±²ô Öò Éòô Í·»´·²¹ô Þòô λ»ô Ûòô ݸ»²ô Éòô Ó·´´»®ô Îòô¿²¼ Õ¿§ô Îò ïçèïò Ñ¿¬ó¾®¿² »´»½¬·ª»´§ ´±©»® »®«³ ´±©ó¼»²·¬§ ´·°±ó°®±¬»·² ½¸±´»¬»®±´ ½±²½»²¬®¿¬·±² ±º ¸§°»®½¸±´»¬»®±´»³·½ ³»²ò ß³òÖò Ý´·²ò Ò«¬®ò íìæèîìóèîçò
Ô¿©´»ô Øòô ¿²¼ Ø»§³¿²²ô Øò ïççèò Í»²±®§ Ûª¿´«¿¬·±² ±º Ú±±¼ò Ю·²ó½·°´» ¿²¼ Ю¿½¬·½»ò ݸ¿°³¿² ú Ø¿´´æ Ò»© DZ®µò
ӽݴ»¿®§ô Þòô ¿²¼ ݱ¼¼ô Îò ïççïò Ó»¿«®»³»²¬ ±º øï í÷ôøï ì÷ó óÜó¹´«½¿² ·² ¾¿®´»§ ¿²¼ ±¿¬æ ß ¬®»¿³´·²»¼ »²¦§³·½ °®±½»¼«®»ò Öò ͽ·òÚ±±¼ ß¹®·½ò ëëæíðíóíïîò
Ó<´µµ·ô Çòô Ø»·²·*ô ÎòóÔòô ¿²¼ ß«¬·±ô Õò ïççíò ײº´«»²½» ±º ±¿¬ ¹«³ô ¹«¿®¹«³ ¿²¼ ½¿®¾±¨§³»¬¸§´ ½±´´«´±» ±² ¬¸» °»®½»°¬·±² ±º ©»»¬²» ¿²¼º´¿ª±«®ò Ú±±¼ ا¼®±½±´´±·¼ êæëîëóëíîò
п²¹¾±®²ô Îò Óòô Ì®¿¾«»ô ×òô ¿²¼ ͦ½¦»²·¿µô ßò ïçéíò Ûºº»½¬ ±º ¸§¼®±½±´´±·¼±² ±®¿ ª·½±·¬§ ¿²¼ ¾¿·½ ¬¿¬» ·²¬»²·¬·»ò Öò Ì» ¬«®» ͬ«¼ò ìæîîìóîìïò
п²¹¾±®²ô Îò Óòô Ù·¾¾ô Æò Óòô ¿²¼ Ì¿¿²ô Ýò ïçéèò Ûºº»½¬ ±º ¸§¼®±ó½±´´±·¼ ±² ¿°°¿®»²¬ ª·½±·¬§ ¿²¼ »²±®§ °®±°»®¬·» ±º »´»½¬»¼¾»ª»®¿¹»ò Öò Ì»¨¬«®» ͬ«¼ò çæìïëóìíêò
п«´«ô Õòô ¿²¼ Ø¿¿ô Ûò Óò ïçèðò ̸» ·²º´«»²½» ±º ±´ª»²¬ ª·½±·¬§ ±²¬¸» ¬¸®»¸±´¼ ª¿´«» ±º °®·³¿®§ ¬¿¬»ò ݸ»³ò Í»²» ëæøÍ«°°´ò ï÷æîíóíîò
д»³³±²ô Ôò Ûòô ¿²¼ λ«®®»½½·±²ô ßò Êò ßò ïççèò ß ©¿®³ó«° ¿³°´»·³°®±ª» ®»´·¿¾·´·¬§ ±º ®»°±²» ·² ¼»½®·°¬·ª» ¿²¿´§·ò Öò Í»²±®§Í¬«¼ò ïíæíëçóíéêò
ᬬ»®ô Üò îððïò Ú«²½¬·±²¿´ ¼®·²µ ½¿² ¸±© « ¬¸» ©¿§ò Û«®ò Ú±±¼ Ü®·²µÎ»ªò íæííóìïò
η½¸¿®¼±²ô Îò Õòô Ó±®®·ô Ûò Îòô αóÓ«®°¸§ô Íò Þòô Ì¿§´±®ô Ôò Öòô ¿²¼Ü»¿ô ×ò Ýò Óò ïçèçò ݸ¿®¿½¬»®·¦¿¬·±² ±º ¬¸» °»®½»·ª»¼ ¬»¨¬«®» ±º ¬¸·½µó»²»¼ §¬»³ ¾§ ¼§²¿³·½ ª·½±·¬§ ³»¿«®»³»²¬ò Ú±±¼ ا¼®±ó½±´´±·¼ íæïéëóïçïò
η³³ô Ûò Þòô ß½¸»®·±ô ßòô Ù·±ª¿²²«½½·ô Ûòô Í°·»¹»´³¿²ô Üòô ͬ¿³°º»®ôÓòô É·´´»¬ô Éò Ýò ïççêò Ê»¹»¬¿¾´»ô º®«·¬ ¿²¼ ½»®»¿´ º·¾»® ·²¬¿µ» ¿²¼ ®·µ±º ½±®±²¿®§ ¸»¿®¬ ¼·»¿» ¿³±²¹ ³»²ò ÖßÓß îéëæìééóìëïò
η°·²ô Ýò Óòô Õ»»²¿²ô Öò Óòô Ö¿½±¾»ô Üò Îòô Û´³»®ô Ðò Öòô É»´½¸ô Îò ÎòôÊ¿² ر®²ô Ôòô Ô·«ô Õòô Ì«®²¾«´´ô Éò Øòô ̸§»ô Úòô Õ»¬·²ô Óòô Ø»¹¬»¼ô ÓòôÜ¿ª·¼±²ô Üò Óòô Ü¿ª·¼±²ô Óò Øòô Ü«¹¿²ô Üò Ôòô Ü»²³¿®µóÉ¿¸ó²»º®·»¼ô Éòô ¿²¼ Þ»´·²¹ô Íò ïççîò Ñ¿¬ °®±¼«½¬ ¿²¼ ´·°·¼ ´±©»®·²¹ò ß³»¬¿ó¿²¿´§·ò ÖßÓß îêéæííïéóííîëò
Í´±¿²ô ßò Ûò îððîò ̸» ¬±° ï𠺫²½¬·±²¿´ º±±¼ ¬®»²¼æ ̸» ²»¨¬ ¹»²»®ó¿¬·±²ò Ú±±¼ Ì»½¸²±´ò ëêæíîóëéò
Í«±®¬¬·ô Ìò ïççíò Í·¦»ó»¨½´«·±² ½¸®±³¿¬±¹®¿°¸·½ ¼»¬»®³·²¿¬·±² ±º ó¹´«½¿² ©·¬¸ °±¬½±´«³² ®»¿½¬·±² ¼»¬»½¬·±²ò Öò ݸ®±³¿¬±¹®ò êíîæïðëóïïðò
É»²¼·²ô Õòô ͱ´¸»·³ô Îòô ß´´³»®»ô Ìòô ¿²¼ Ö±¸¿²±²ô Ôò ïççéò Ú´¿ª±«®¿²¼ ¬»¨¬«®» ·² ±«®³·´µ ¿ºº»½¬»¼ ¾§ ¬¸·½µ»²»® ¿²¼ º¿¬ ½±²¬»²¬ò Ú±±¼Ï«¿´ò Ю»ºò èæîèïóîçïò
É»²¼·²ô Õòô ¿²¼ Ø¿´´ô Ùò îððïò ײº´«»²½» ±º º¿¬ô ¬¸·½µ»²»® ¿²¼ »³«´·º·»®½±²¬»²¬ ±² ¿´¿¼ ¼®»·²¹æ ͬ¿¬·½ ¿²¼ ¼§²¿³·½ »²±®§ ¿²¼ ®¸»±´±¹·½¿´¿²¿´§»ò Ô»¾»²³ò É·ò Ì»½¸²±´ò íìæîîîóîííò
ɱ±¼ô Ðò Öò ïçèêò Ñ¿¬ ó¹´«½¿²æ ͬ®«½¬«®»ô ´±½¿¬·±² ¿²¼ °®±°»®¬·»ò п¹»ïîïóïëî ·²æ Ñ¿¬æ ݸ»³·¬®§ ¿²¼ Ì»½¸²±´±¹§ò Úò Øò É»¾¬»®ô »¼ò ß³òß±½ò Ý»®»¿´ ݸ»³òæ ͬò п«´ô ÓÒò
ɱ±¼ô Ðò Öòô ¿²¼ Þ»»®ô Óò Ëò ïççèò Ú«²½¬·±²¿´ ±¿¬ °®±¼«½¬ò п¹» ïóíé·²æ Ú«²½¬·±²¿´ Ú±±¼ô Þ·±½¸»³·½¿´ ¿²¼ Ю±½»·²¹ ß°»½¬ò Ùò Ó¿¦¦¿ô»¼ò Ì»½¸²±³·½ Ы¾´·¸·²¹æ Ô¿²½¿¬»®ô Ðßò
ɱ±¼ô Ðò Öòô Þ»»®ô Óò Ëòô ¿²¼ Þ«¬´»®ô Ùò îðððò Ûª¿´«¿¬·±² ±º ¬¸» ®±´» ±º½±²½»²¬®¿¬·±² ¿²¼ ³±´»½«´¿® ©»·¹¸¬ ±º ±¿¬ ó¹´«½¿² ·² ¼»¬»®³·²·²¹»ºº»½¬ ±º ª·½±·¬§ ±² °´¿³¿ ¹´«½±» ¿²¼ ·²«´·² º±´´±©·²¹ ¿² ±®¿´¹´«½±» ´±¿¼ò Þ®ò Öò Ò«¬®ò èìæïçóîíò
ɱ±¼ô Ðò Öòô Þ®¿¿¬»²ô Öò Ìòô ͽ±¬¬ô Úò Éòô η»¼»´ô Õò Üòô ɱ´§²»¬¦ô Óò Íòô¿²¼ ݱ´´·² Óò Éò ïççìò Ûºº»½¬ ±º ¼±» ¿²¼ ³±¼·º·½¿¬·±² ±º ª·½±«°®±°»®¬·» ±º ±¿¬ ¹«³ ±² °´¿³¿ ¹´«½±» ¿²¼ ·²«´·² º±´´±©·²¹ ¿² ±®¿´¹´«½±» ´±¿¼ò Þ®ò Öò Ò«¬®ò éîæéíïóéìíò
Ʊ«´·¿ô Ûò ×òô Ñ®»°±«´±«ô Êòô ¿²¼ ̦·¿ô Ýò îðððò Ûºº»½¬ ±º º¿¬ ³·³»¬·½ ±²°¸§·½¿´ô ¬»¨¬«®¿´ ¿²¼ »²±®§ °®±°»®¬·» ±º ½±±µ·»ò ײ¬ò Öò Ú±±¼ Ю±°òíæíèëóíçéò
J²²·²¹ô Ùòô É¿´´³¿®µô ßòô л®±²ô Óòô [µ»±²ô Þòô Û´³¬¿¸´ô Íòô ¿²¼J¬»ô Îò ïçççò ݱ²«³°¬·±² ±º ±¿¬ ³·´µ º±® ë ©»»µ ´±©»® »®«³½¸±´»¬»®±´ ¿²¼ ÔÜÔ ½¸±´»¬»®±´ ·² º®»»ó´·ª·²¹ ³»² ©·¬¸ ³±¼»®¿¬»¸§°»®½¸±´»¬»®±´»³·¿ò ß²²ò Ò«¬®ò Ó»¬¿¾ò ìíæíðïóíðçò
Åλ½»·ª»¼ ß«¹«¬ îêô îððîò ß½½»°¬»¼ Ü»½»³¾»® îìô îððîòÃ
II/6

PUBLICATION III
The sensory characteristics and rheological properties of soups
containing oat and barley β-glucan before and after freezing
In: Lebensmittel-Wissenschaft und Technologie 2004. Vol. 37, pp. 749–761.
Reprinted with permission from the publisher.


Lebensm.-Wiss. u.-Technol. 37 (2004) 749–761
ARTICLE IN PRESS
*Correspondi
455-2103.
Email-addres
0023-6438/$30.0
doi:10.1016/j.lwt
The sensory characteristics and rheological properties of soupscontaining oat and barley b-glucan before and after freezing
Marika Lyly*, Marjatta Salmenkallio-Marttila, Tapani Suortti, Karin Autio,Kaisa Poutanen, Liisa L.ahteenm.aki
VTT Biotechnology, P.O. Box 1500, FIN-02044 VTT, Finland
Received 7 July 2003; accepted 10 February 2004
Abstract
The aim was to study the effect of concentration and molecular weight of two oat and one barley b-glucan preparation on the
perceived sensory quality of a ready-to-eat soup prototype before and after freezing. Oat1 was a bran-type preparation containing
high molecular weight b-glucan; Oat2 and Barley were more processed and purified preparations with lower molecular weight. Ninesoups containing 0.25–2.0 g b-glucan/100 g soup and one reference soup thickened with starch were profiled by a sensory panel and
their viscosity and molecular weight of b-glucan was analysed.
Freezing had no notable effects on the sensory quality of the soups. At the same concentration, soups made with the bran-type
preparation were more viscous and had higher perceived thickness than soups made with processed, low molecular weight
preparations. Barley soups had mainly higher flavour intensities than oat soups. Good correlations were obtained between sensory
texture attributes and viscosity (r=0.70–0.84; Pp0.001) and moderate correlations between flavour attributes and viscosity
(r=�0.63–�0.80; Pp0.001). Technologically, b-glucans are feasible thickening agent alternatives in soups. Preparations with lowermolecular weight and viscosity are easier to add into a food product in higher quantities, but the role of high molecular weight b-glucan in physiological functionality has to be kept in mind.
r 2004 Swiss Society of Food Science and Technology. Published by Elsevier Ltd. All rights reserved.
Keywords: Beta-glucan; Freezing; Sensory quality; Mouthfeel; Soup
1. Introduction
The mixed linkage (1-3)(1-4)-b-D-glucans (b-glucan) from the endosperm of cereal grains arevaluable industrial hydrocolloids and have been shownto be important, physiologically active dietary fibrecomponents (Wood, 2001). b-glucans are water-soluble,linear, high molecular-weight polysaccharides (Autio,Myllym.aki, & M.alkki, 1987; Autio, M.alkki, & Virta-nen, 1992; Doublier & Wood, 1995). They give viscous,shear thinning solutions even at low concentrations. Theviscosity is related to the molecular weight and isstrongly dependent on concentration (Autio, 1995;Wood, Beer, & Butler, 2000). Oat b-glucan has beenshown to lower elevated blood cholesterol levels (Ripsinet al., 1992; Rimm et al., 1996) and to have a balancing
ng author. Tel.: +1-358-9-456-5837; fax: +4-358-9-
s: [email protected] (M. Lyly).
0 r 2004 Swiss Society of Food Science and Technology. P
.2004.02.009
III/1
effect on postprandial blood glucose and insulinresponse (Braaten et al., 1991; Wood et al., 1994). Fromcereals especially oat and barley are rich in b-glucan.The major difference between oat and barley b-glucan isthe size of the molecules, native b-glucan in barley grainsis about two thirds of the size of b-glucan in oat (Wood,Weisz, & Mahn, 1991; Autio, 1995; Beer, Wood, &Weisz, 1997a).Interest in the production and use of isolated cereal b-
glucans in foods is due to their potential health benefits.If a product contains at least 0.75 g b-glucan perportion, the Food and Drug Administration (FDA) ofUSA allows a health claim for oat and oat productsconcerning the cholesterol-lowering effect of soluble b-glucan fibre and thereby a reduced risk of coronaryheart disease (FDA, 1996). The recommended dailyintake of b-glucan for achieving the health effects is 3 g/d, corresponding to four portions per day.Also barley b-glucan has shown to have cholesterol
lowering effects in humans (Newman, Newman, &
ublished by Elsevier Ltd. All rights reserved.

ARTICLE IN PRESSM. Lyly et al. / Lebensm.-Wiss. u.-Technol. 37 (2004) 749–761750
Graham, 1989; McIntosh, Whyte, McArthur, & Nestel,1991; Lupton, Robinson, & Morin, 1994; Ikegamiet al., 1996) in hamsters (Kahlon, Chow, Knuckles,& Chiu, 1993; Delaney et al., 2003), rats (Hecker,Meier, Newman, & Newman, 1998) and chicks(Wang, Newman, & Hofer, 1992). Proposed mechan-isms of action are, e.g. increased excretion of cho-lesterol (Lia et al., 1995) and stimulation of thereverse cholesterol transport (Bourdon et al., 1999). Ina study with golden hamsters Delaney et al. (2003)concluded that the cholesterol lowering effect ofb-glucan is more or less similar whether it is iso-lated from oat or barley. Barley b-glucan has beenshown to lower also postprandial glucose andinsulin response in humans (Yokoyama et al., 1997;Hallfrisch & Behall, 2000; Hallfrisch, Schofield, &Behall, 2003).The good viscosity forming properties make b-glucans
potential alternatives as thickening agents in differentfood applications, e.g. ice creams, sauces and saladdressings (Wood, 1986). Compared to other thickeningagents, b-glucan has a lower or equal ability to increaseviscosity as xanthan, guar gum, locust bean gum andgum arabic (Dawkins & Nnanna, 1995). To make theconsumption of the earlier mentioned four portions ofb-glucan feasible, new types of b-glucan containingfoods need to be developed, in addition to cerealproducts where b-glucan is an intrinsic component.One option for these new products are frozen, ready-to-eat foods, as their consumption is growing in general(Dwyer, 1999). Frozen ready-to-eat soups is onepossible product category, where b-glucan could beused as thickening agent.The viscosity of b-glucan also has an effect on the
overall sensory quality of the product it is added in.Food products need to have satisfactory sensoryproperties, because flavour and texture of foods stronglyinfluence repeated choices of novel food products(Arvola, L.ahteenm.aki, & Tuorila, 1999). We havepreviously studied the effect of oat b-glucan on thesensory quality of a beverage prototype (Lyly et al.,2003). In this study, it was found that beverages madewith the bran-type preparations were more viscous andhad higher perceived thickness than beverages madewith more processed, small molecular weight prepara-tions.The elevation of intestinal viscosity due to high
molecular weight of b-glucan is important for itsphysiological effectiveness. High viscosity seems to becrucial for achieving the positive effect of b-glucan onthe peak blood glucose (Wood et al., 1994, 2000), whichmeans that high molecular weight b-glucan is physiolo-gically more effective than low molecular weight one.However, a processed oat product (oat milk) was foundto be effective in reducing blood cholesterol levels in thestudy of .Onning et al. (1999).
III/2
Freezing and storing in a freezer may change thephysiological and chemical properties of b-glucan.Especially, high molecular weight b-glucan has beenshown to be sensitive to processing; processing mayaffect solubility and decrease the molecular weight ofb-glucan (Beer, Wood, Weisz, & Fillion, 1997b). In thestudy of Beer et al. (1997b), frozen storage had no effecton the molecular weight of b-glucan in oat bran muffins,but the solubility of b-glucan decreased by 50%. Thechanges in molecular organisation and crystallinitypossibly cause the decrease in solubility (Beer et al.,1997b). Suortti, Johansson, and Autio (2000) alsoconcluded that freezing does not reduce the molecularweight. Solubility determines the viscosity in thegastrointestinal tract, which has an effect on thephysiological effectiveness. Heating increases the solu-bility of b-glucan (Bhatty, 1992; Jaskari et al., 1995),and therefore may affect its physiological effectiveness.As the soups are eaten warm, we expect that the heatingof the soup improves the solubility and thus, theeffectiveness of b-glucan.The aim of this study was to compare oat and barley
b-glucan as functional ingredients, and to investigatehow concentration and molecular weight of two oat andone barley b-glucan preparations affect the perceivedsensory quality of ready-to-eat soup prototype beforeand after freezing, especially regarding thickness.
2. Materials and methods
2.1. b-glucan preparations
Three different b-glucan fractions (Oat1, Oat2 andBarley) were used for preparing the soups. Oat1 was oatbran, rich in b-glucan, produced by dry milling at FinnCereal (Vantaa, Finland). Oat2 and Barley preparationswere soluble b-glucan preparations from CEBA AB(Lund, Sweden), produced by aqueous enzyme-aidedextraction. The composition of the three b-glucanpreparations is presented in Table 1. b-glucan contentof all of the preparations was determined enzymaticallyby the Megazyme method (McCleary & Codd, 1991).From Oat2 and Barley preparations the total dietaryfibre (NMKL, 2003b), ash (NMKL, 1991), total protein(NMKL, 2003a) and lipids (NMKL, 1989) wereanalysed at an accredited analytical laboratory accord-ing to methods defined by the Nordic Committee onFood Analysis NMKL. The content of carbohydrateswas calculated by difference when all the othercomponents had been determined.From Oat1 preparation, dietary fibre was analysed
according to the AOAC method (AOAC, 1990). Proteincontents were determined by a Kjeldahl method withselenium as digestion catalyst (Digestor DS 2020,Distillation Unit 2200 KJ, Tecator AB, H .ogan.as,

ARTICLE IN PRESS
Table 1
Composition of the b-glucan preparations
Oat1 Oat2 Barley
Average molecular weight (Mw)a 2,000,000 200,000 40,000
Carbohydrate (g/100 g, d.b.)b max 32 15.8 45.2
Total dietary fibre (g/100 g, d.b.)b min 24 33.2 40.7
b-glucan (g/100 g, w.b.)a 14.5 19.3 34.5
Lipids (g/100 g, d.b.)b 10 19.2 3.7
Proteins (g/100 g, d.b.)b 27 30.3 9.9
Ash (g/100 g, d.b.)b n.a. 1.4 0.50
d.b.=dry basis.
w.b.=wet basis.
n.a.=not available.aAnalyses performed by authors/VTT Biotechnology.bSuppliers information.
Thawing of the soup base Soup base + water + β-glucan preparations (+alpha-amylase to Oat1 soups), blender bar treatment for 15 s
Heating of the soup up to +80ºC, (ca. 15 min, in a steel pan on the stove)
•Cooling down to roomtemperature •Storage over night in a refrigerator •Heating of the soup up to +80ºC, (ca. 15 min, in a steel pan on the stove) •Sensory evaluation = 'fresh' samples
•Freezing in a freezer (6-9 h.) •Storage for 2 weeks at -18 ºC
•Thawing of the soup •Heating of the soup up to +80ºC, (ca. 15 min, in a steel pan on the stove) •Sensory evaluation of samples after freezing treatment
Fig. 1. Preparation of the soup samples.
M. Lyly et al. / Lebensm.-Wiss. u.-Technol. 37 (2004) 749–761 751
Sweden). Total carbohydrate contents were calculatedas difference: 100–(moisture+ash+protein+fat), andlipids according to AOAC method (AOAC, 1995). Alsothe analysis of Oat1 preparation was performed by anaccredited analytical laboratory.The average molecular weights (Mw) of the prepara-
tions were analysed after their isolation and puri-fication by using right angle laser light scattering. Thesoup samples at concentration 1 g b-glucan/100 g soupwere analysed by HPLC-SEC with calcofluor staining(Suortti, 1993) in order to examine the molecularweight during preparation and storage of the soups.As the b-glucan preparations were not contaminatedwith any other polymeric material eluting in theretention window their Mws could be determineddirectly by application right angle laser light scattering.In the soups the situation was different as theycontained other polymeric compounds, and there-fore calcofluor staining was applied. The molecularweight distribution of b-glucan in soup samples wasdetermined on the basis of log Mw versus elutionvolume calibration curve constructed by isolated b-glucan fractions. The fractions were isolated by semi-preparative HPLC-SEC and their molecular weightswere determined by laser light scattering. The validityof calibration curve was later checked by chromato-graphy of b-glucans of various Mws with application oflaser light scattering detector; here logMw versuselution volume calibration curves were obtained andcompared to the original curve obtained from isolatedb-glucan fractions.In the reference soup, modified starch (Colflo 67;
National Starch, UK) was used as thickening agent. Thesoup base was frozen roasted bell pepper soup (providedby Findus R & D AB, Bjuv, Sweden). The ingredientsof the soup base were water, tomato, onion, roasted redbell pepper, milk powder, tomato puree, carrots,parsnip, vegetable oil, vegetable bouillon, garlic andspices.
III/3
Preparation of the soup samples: The soup sampleswere prepared at VTT Biotechnology laboratory byadding either the previously mentioned modified starchColflo 67 or b–glucans (and Termamyl-enzyme) into thesoup base. The preparation of the samples was doneaccording to Fig. 1. First, the samples were evaluated as‘fresh’, which means after the samples were cooled downand reheated again. Reheating was conducted, as alsothe frozen storage samples were reheated. The waterlosses during preparation of the samples and reheatingwere taken into account by adding afterwards the sameamount water which was evaporated during heating.Water losses varied between 1.5–4.4% (preparation ofthe soups) and 1.0–2.8% (reheating of the soups). Theremaining quantity of the samples was frozen in a quick-freezer (Model Porkka BC/BF 910; ManufacturerHuurre Group PLC, Finland) and stored for 14–19days. After the storage period, all samples wereevaluated again.Termamyl 120L Type L (Batch AXN 04325, Novo-
zymes A/S, Denmark) was used to hydrolyse theremaining starch from b–glucans in the Oat1 soups. Itwas treated prior to use to inactivate possible endogen-ous b-glucanase by heating 100ml of 23.5ml/100mlTermamyl containing 12mM CaCL2 in a boiling waterbath for 15min. The solution was sieved through lenscleaning tissue and used at concentration 1 g/100 g soup.The Termamyl enzyme was used only in Oat1 soups,because starch was already removed from Oat2 andBarley preparations during processing.The b-glucan concentrations in the soups varied from
0.25 g b-glucan/100 g soup up to 2.0 g b-glucan/100 gsoup (Table 2). The concentrations were selected basedon preliminary trials, where the effect of differentconcentrations on viscosity was roughly evaluated. Theselected concentrations form a geometric progression.The concentration of modified starch in the referencesoup sample was 0.8 g modified starch/100 g soup.

ARTICLE IN PRESS
Table 2
The concentration of b-glucan in the soup samples
Soup
sample
no.
Preparation
used in the
soup
Concentration of
b-glucan (gb-glucan/100 g soup)
Total dietary fibre
content (g fibre/
100 g soup)a
1. Oat1 0.25 min 0.41
2. 0.5 min 0.83
3. 1.0 min 1.65
4. Oat2 0.5 0.86
5. 1.0 1.72
6. 2.0 3.44
7. Barley 0.5 0.59
8. 1.0 1.18
9. 2.0 2.36
10. Tomato soup thickened with modified starch (reference
sample=warm-up sample) including 0.8 g modified starch/
100 g soup.
aCalculated by authors/VTT Biotechnology based on the composi-
tion analysis/total dietary fibre values.
Table3
Theattributesandmodelsoftheattributesforthesensory
evaluation
Attribute
Scale0=
Scale10=
Modelfor‘lowleveloftheattribute’
Modelfor‘highleveloftheattribute’
Fla
vou
r
Theintensity
oftomato
flavour
Notatallintense
Extrem
elyintense
Tomato
soup
Tomato
soupwithadded
tomato
pure
Saltiness
Notatallsalty
Extrem
elysalty
Tomato
soup
Tomato
soupwithadded
salt
(+0.4g/100g)
Sharpness
Notatallsharp
Extrem
elysharp
Tomato
soup
Tomato
soupwithbellpepper
and
whitepepper
powder
Totalflavourintensity
Notatallintense
Extrem
elyintense
——
Theintensity
ofpossibleoff-flavour
Notatallintense
Extrem
elyintense
——
Tex
ture
Theextensibilityofthesoup(poured
from
thespoon)
Notatallextensible
Extrem
elyextensible
Tomato
soup
Tomato
soup,thickened
withpotato
starch(whipped
whileboiling)
Thethicknessofthesoup(inmouth)
Notatallthick
Extrem
elythick
Tomato
juice
Tomato
juice(thickened
withpotato
starch)
Powderiness
Notatallpowdery
Extrem
elypowdery
Tomato
juice
Tomato
juicewithcorn
starch
Sliminess
Notatallslimy
Extrem
elyslimy
Tomato
juice(thickened
withpotato
starch)
Slimytomato
soup,thickened
with
potato
starch(whipped
whileboiling)
M. Lyly et al. / Lebensm.-Wiss. u.-Technol. 37 (2004) 749–761752
2.2. Sensory evaluation
The sensory characteristics of the soups were eval-uated using descriptive analysis (Lawless & Heymann,1998). Attribute intensities were rated on 10-unitgraphic intensity scales, verbally anchored from theirends (Table 3). The experienced sensory panel had 20members, of which four took part in the development ofvocabulary, and 10 took part in each evaluation session.The participants per session varied but all of them wereselected among the experienced 20 panellists.The vocabulary (Table 3) was developed in one
session. The panellists tasted four different b-glucansoups and described the texture and flavour character-istics. During discussion, altogether nine attributes todescribe texture, mouthfeel and flavour of the soupswere selected for profiling. For each attribute, except thetotal flavour intensity and the intensity of possible off-flavour, models were created for training the panel(Table 3). For assessors, detailed instructions onevaluation technique for all attributes were written upfor carrying out the evaluations.The whole panel ðN ¼ 20Þ was trained in two training
sessions within 5 weeks. During first training session(duration approx. 30min) the models of the attributeswere presented to the panellists to familiarise them withthe attributes. Following directly after this, the trainingsession continued with two samples that were evaluatedon graphic scales. The second training session wasconducted with four samples: three soups containing0.5–1.0 g b-glucan/100 g soup and one soup thickenedwith modified starch at concentration 0.8/100 g soup asa reference. The assessors got feedback of theirperformance, namely their own rating for each attributeand sample and means of the whole panel, after everytraining session.
III/4

ARTICLE IN PRESSM. Lyly et al. / Lebensm.-Wiss. u.-Technol. 37 (2004) 749–761 753
The sensory evaluation of the samples was carried outin 12 sessions of which six were carried out before andsix after 14–19 days storage at �18�C (including thereplicate sessions), each session including three b-glucansoups and the reference sample. All samples were blindcoded, also the reference sample. The reference samplewas presented first at each session as a ‘warm up’-sample. The b-glucan samples were presented to thepanellists in random order. Samples were assessed twice.The data were collected using computerised data-collecting system (CSA, Computerized Sensory AnalysisSystem, Compusense Inc., Guelph, Canada, Compu-sense 5, version 4.2).
2.3. Viscosity measurement
Constant rate measurement of viscosity as a functionof shear rate was performed with StressTech rheometer(CC 25 CCE, Reologica Instruments AB, Sweden) atshear rates 16.4–157 s�1 at +60�C. All samples eval-uated by the sensory panel were measured. Tworeplicate measurements per sample were conducted,and the average value of the measurements was used inthe statistical analysis. Only viscosities measured atshear rate 50 s�1 are reported in this article. The shearrate was chosen as it has been shown to correlate withsensory sliminess and thickness in mouth (Richardson,Morris, Ross-Murphy, Taylor, & Dea, 1989).
2.4. Data analysis
For the statistical analyses, sensory ratings wereadjusted with reference sample ratings. The adjustmentwas done to eliminate the possible differences betweenassessors due to the use of different level of the scale.This adjustment did not affect the range of scaleassessors used. Lawless and Heymann (1998) havedescribed the situation where assessors agree on themagnitude of the sensory difference between thesamples, but they use different part of the scale. Withthe adjustment we could eliminate differences betweenjudges, but not modify the differences between samples(within subjects). The reference sample was the first, a‘warm-up’ sample in each session. According toPlemmons and Resurreccion (1998), a warm-up sampleeliminates the first sample bias and thus increasespanellist reliability.The adjustment was done according the following
formula:
XST ¼ ða � bÞ þ XRef :grand;
where XST is the adjusted value, a the assessor’s personalrate for single sample and attribute in the particularsession, b the assessor’s personal rate of referencesample and attribute in the particular session, XRef.grand
the mean of the attribute for reference sample over all
III/5
assessors and sessions (separate values for fresh andfrozen soups)Due to incompleteness of data, the statistical analyses
of sensory ratings were run in several steps. Firstly, themain effects of freezing ðN ¼ 360Þ and concentration(within preparations; N ¼ 120/each preparation) weretested with separate one-way ANOVAs ðN ¼ 360Þ: Ifsignificant in ANOVA, the differences in means betweenconcentrations were further tested with Tukey’s testðPo0:05Þ: Secondly, the possible interactions betweeneffect of freezing (before versus after), source of b-glucan and concentration (0.5, 1.0 or 2 g b-glucan/100 gsoup) were tested with the two processed b-glucanpreparations (Oat2 and Barley) that formed completedata ðN ¼ 240Þ: Oat1 preparation was excluded fromthese analyses due to its strong effects on viscosity thatwould make unfeasible to prepare real soups at higherlevel concentrations than 0.5 g b-glucan/100 g soup.Reference sample data were excluded from this analysis,as the data were included in the adjustment of the othersamples, and as it did not contain any b-glucan.However, in figures the reference sample means andmeans of Oat1 preparations are presented to show thesensory qualities of those samples.As there was practically no difference in the sensory
quality of the soups before and after freezing, thesensory profile for each soup in Figs. 2–8 was created bycalculating the mean of each attribute over the foursessions (two evaluations before freezing, two afterfreezing), thus combining the values for fresh and frozensoups. For the reference soup, the sensory profile wascalculated over all 12 sessions, combining the values forfresh and frozen soups.The effect of freezing on the instrumental viscosity at
shear rate 50 s�1 was analysed with paired samples T-test ðN ¼ 18Þ including all b-glucan containing soups inthe analysis.The relationships between sensory characteristics and
instrumental viscosity at shear rate 50 s�1 were exploredwith correlation tests. In this analysis all data wereincluded, also data from Oat1 sample and referencesample data. As the viscosity of the samples wasmeasured separately from all the replicate samplesevaluated in the sensory analysis, they were includedin the analysis as separate samples ðN ¼ 48Þ:The correlations between molecular weight (logMw)
and sensory attributes were calculated at b-glucanconcentration of 1.0 g b-glucan/100 g soup ðN ¼ 12Þ;because this enabled the comparison of viscosity ofdifferent preparations at the same concentration of b-glucan. In this analysis also data from Oat1 sample wasincluded. Results from soups evaluations before andafter freezing were both included in the analysis and alsoreplicate analysis results from all samples evaluated inthe sensory analysis, because their molecular weightswere analysed separately.

ARTICLE IN PRESS
0
1
2
3
4
5
6
7
8
9
10
0 0.25 0.5 0.75 1 1.25 1.5 1.75 2 2.25
Concentration of ββ
-glucan in the soupsg -glucan / 100g soup
Th
e ex
ten
sib
ilit
y o
f th
e so
up
Oat1 Oat2 Barley Ref.
Extremely extensible
Not at all extensible
Fig. 2. The extensibility of the soup (means and standard errors).
0
1
2
3
4
5
6
7
8
9
10
0 0.25 0.5 0.75 1 1.25 1.5 1.75 2 2.25
Concentration of ββ
-glucan in the soupsg -glucan / 100g soup
Th
ickn
ess
of
the
sou
p
Oat1 Oat2 Barley Ref.
Extremely thick
Not at all thick
Fig. 3. The thickness of the soup (means and standard errors).
0
1
2
3
4
5
6
7
8
9
10
0 0.25 0.5 0.75 1 1.25 1.5 1.75 2 2.25
Concentration of β-glucan in the soupsg β-glucan / 100g soup
Sli
min
ess
Oat1 Oat2 Barley Ref.
Extremely slimy
Not at all slimy
Fig. 4. The sliminess of the soup (means and standard errors).
M. Lyly et al. / Lebensm.-Wiss. u.-Technol. 37 (2004) 749–761754
III/6

ARTICLE IN PRESS
0
1
2
3
4
5
6
7
8
9
10
0.00 0.25 0.50 0.75 1.00 1.25 1.50 1.75 2.00 2.25
Concentration of ββ
-glucan in the soupsg -glucan / 100g soup
Th
e in
ten
sity
of
tom
ato
fla
vou
r
Oat1 Oat2 Barley Ref.
Extremely intense
Not at all intense
Fig. 5. The intensity of tomato flavour (means and standard errors).
0
1
2
3
4
5
6
7
8
9
10
0 0.25 0.5 0.75 1 1.25 1.5 1.75 2 2.25
Concentration of β-glucan in the soupsg β -glucan / 100g soup
Sal
tin
ess
Oat1 Oat2 Barley Ref.
Extremelysalty
Not at all salty
Fig. 6. Saltiness (means and standard errors).
0
1
2
3
4
5
6
7
8
9
10
0 0.25 0.5 0.75 1 1.25 1.5 1.75 2 2.25
Concentration of -glucan in the soupsg -glucan / 100g soup
Sh
arp
nes
s
Oat1 Oat2 Barley Ref.
Extremely sharp
Not at all sharp
ββ
Fig. 7. Sharpness (means and standard errors).
M. Lyly et al. / Lebensm.-Wiss. u.-Technol. 37 (2004) 749–761 755
III/7

ARTICLE IN PRESS
0
1
2
3
4
5
6
7
8
9
10
0 0.25 0.5 0.75 1 1.25 1.5 1.75 2 2.25
Concentration of β-glucan in the soupsg β-glucan / 100g soup
To
tal f
lavo
ur
inte
nsi
ty
Oat1 Oat2 Barley Ref.
Extremely intense
Not at all intense
Fig. 8. Total flavour intensity (means and standard errors).
M. Lyly et al. / Lebensm.-Wiss. u.-Technol. 37 (2004) 749–761756
SPSS software (version 11.0.1, SPSS Inc. Chicago,Illinois, USA) was used for the statistical analysis.
3. Results
3.1. The effect of freezing
Freezing had no notable effect on the sensory qualityof the soups. Statistically significant difference betweenfresh and frozen samples were found in the powderinessonly [F (1,360)=5.433; P=0.020]. Means for powderi-ness were 2.672.1 and 2.171.8 before and afterfreezing, respectively, so the lowering effect of freezingon powderiness was actually very small on scale 0–10,and not important in practice.Freezing had statistically significant effect on the
instrumentally measured viscosity of the b-glucancontaining soups [N=18; t=2.889; P=0.01]. At shearrate 50 s�1, the mean viscosity of all b-glucan containingsoups over four concentrations was 659mPa s beforefreezing and after freezing 451mPa s, the reductionbeing about 30%.
3.2. The effect of concentration
In each preparation the increasing concentration of b-glucan affected statistically significantly the sensoryquality of the soups (Figs. 2–8). In all b-glucanpreparations rising concentration increased extensibility[F(2,120)=19.4 for Oat1, 41.7 for Oat2, 34.4 for Barley;all Po0.001], thickness [F(2,120)=132.8 for Oat1, 97.3for Oat2, 53.8 for Barley; all Po0.001], sliminess[F(2,120)=124.2 for Oat1, 72.0 for Oat2, 39.9 forBarley; all Po0.001], and off-flavour of the soup[F(2,120)=9.4 for Oat1, 9.3 for Oat2, 15.0 for Barley;Po0.001]. At the same time rising concentrationdecreased intensity of tomato flavour [F(2,120)=32.1for Oat1, 24.5 for Oat2; both Po0.001, 3.3 for Barley;
III/8
P=0.039] and total flavour intensity [F(2,120)=34.2 forOat1, 30.7 for Oat2; both Po0.001, 3.4 for Barley;P=0.036]. Furthermore, in oat-based preparationsrising b-glucan concentration lowered the perceivedsaltiness [F(2,120)=18.8 for Oat1, 13.0 for Oat2;Po0.001] and sharpness [F(2,120)=18.4 for Oat1, 15.2for Oat2; Po0.001]. Thus, with Barley preparation theweakening of flavour attributes was smaller than withOat1 and Oat2 preparations when b-glucan concentra-tion in the soup increased.
3.3. Effect of preparation and concentration
To test whether freezing (before versus after) andincreasing concentration (0.5, 1.0 or 2.0 g b-glucan/100 gsoup) affect sensory attributes differently in processed b-glucan preparations (Oat2 versus Barley), a three-wayANOVA was carried out. Similar to previous one-waytesting, the main significant effects found were concen-tration of b-glucan (in all attributes Po0.01, exceptpowderiness which was not significant), source of b-glucan (in all attributes Po0.01) and freezing inpowderiness (P=0.033) and thickness (P=0.030). Sig-nificant statistical interactions between b-glucan source(i.e. the preparation type) and b-glucan concentration inthe soups were found in seven out of nine attributes: ‘theintensity of tomato flavour [F(2, 240)=6.306; P=0.002],‘saltiness’ [F(2, 240)=6.635; P=0.002], ‘sharpness’ [F(2,240)=7.299; P=0.001], ‘total flavour intensity’ [F(2,240)=15.884; Po0.001], ‘the extensibility of the soup(poured from the spoon)’ [F(2, 240)=8.229; Po0.001],‘the thickness of the soup’ [F(2, 240)=5.522; P=0.005],and ‘sliminess’ [F(2, 240)=10.436; Po0.001] (Figs. 2–8).This means that the changes in the attribute intensitieswere dissimilar in different preparations as function ofconcentration. The thickness of barley soup remainedstable when b-glucan concentration increased from 0.5 gb-glucan/100 g soup to 1 g b-glucan/100 g soup, butincreased in Oat2 soup in the same concentration range.

ARTICLE IN PRESS
Table 4
The viscosity of the soups (mPa s), before and after freezing. Means of two replicate measurements
Samples Viscosity at shear rate 50 s�1
Fresh Frozen
Oat1 0.25 g b-glucan/100 g soup 131 91
0.50 g b-glucan/100 g soup 347 218
1.0 g b-glucan/100 g soup 2894 1980
Oat2 0.50 g b-glucan/100 g soup 134 103
1.0 g b-glucan/100 g soup 290 209
2.0 g b-glucan/100 g soup 1575 1036
Barley 0.50 g b-glucan/100 g soup 85 58
1.0 g b-glucan/100 g soup 135 87
2.0 g b-glucan/100 g soup 343 276
Reference sample 0.8 g starch/100 g soup 110 86
M. Lyly et al. / Lebensm.-Wiss. u.-Technol. 37 (2004) 749–761 757
Extensibility and sliminess of the Oat2 soup increasedmore sharply as a function of concentration than thoseof the barley soup, whereas intensity of tomato flavour,saltiness, sharpness, and total flavour intensity de-creased more steeply in the Oat2 soup as a function ofconcentration than in the Barley soup.
3.4. Correlations between instrumental and sensory
measurements
The increasing concentration of b-glucan increasedthe viscosity of the soups. There were also largedifferences between the preparations. For example, atshear rate 50 s�1, the viscosity varied from 58mPa s(Barley frozen 0.5 g b-glucan/100 g soup) to 2894mPa s(Oat1 fresh 1.0 g b-glucan/100 g soup) (Table 4). In allsamples, the viscosity also showed shear-thinningbehaviour, having highest viscosity at the lowest shearrate.Strong negative correlations were found between
sensory flavour attributes and instrumental viscosity.Only correlations at shear rate 50 s�1 are reported.Instrumental viscosity correlated well with sensorytexture attributes; extensibility of the soup ðN ¼ 48;r=0.70; Po0.001), thickness of the soup (N ¼ 48;r=0.77; Po0.001) and sliminess of the soup (N ¼ 48;r=0.84; Po0.001). Additionally, the intensity of tomatoflavour (N ¼ 48; r=�0.80; Po0.001), saltiness(N ¼ 48; r=�0.63; Po0.001), sharpness (N ¼ 48;r=�0.69; Po0.001), and total flavour intensity(N ¼ 48; r=�0.75; Po0.001) appeared to be partlymasked by the viscosity of the soup.
3.5. Effect of molecular weight of b-glucan on sensory
thickness
The molecular weight remained quite stable duringfreezing. In samples containing 1 g b-glucan/100 g soup,
III/9
before freezing the molecular weight was 1,100,000 inOat1 soup, 200,000 in Oat2 and 40 000 in Barley soup.After freezing the molecular weight of Oat2 and Barleysoups were the same as before freezing. In Oat1 soup ithad changed slightly; the analysis of parallel samplesgave results 1,000,000 and 1,400,000, but practicallyboth of the results were close to the original 1,100,000,and most likely the differences were due to sampletreatment, not freezing treatment.The correlations between molecular weight (logMw)
and sensory attributes were calculated at b-glucanconcentration of 1.0 g b-glucan/100 g soup ðN ¼ 12Þ;because this enabled the comparison of viscosity ofdifferent preparations at the same concentration of b-glucan. The sensory thickness strongly correlated withthe molecular weight of b-glucan (N ¼ 12; r=0.99;Po0.001), so the high molecular weight b-glucan gavehigher viscosity than low molecular weight b-glucan.There was a negative correlation between molecularweight and the intensity of tomato flavour (N ¼ 12;r=�0.98; P=0.001), saltiness (N ¼ 12; r=�0.93;P=0.003), sharpness (N ¼ 12; r=�0.97; Po0.001),and total flavour intensity (N ¼ 12; r=�0.94;Po0.001).
4. Discussion
The three different b-glucan preparations gavedifferent viscosity and sensory thickness in soups atthe same concentration of b-glucan (Table 4, Fig. 3).Increasing b-glucan concentration had a significanteffect on the sensory quality of soups, mainly byincreasing the intensity of texture attributes and off-flavour, and by decreasing the intensity of other flavourattributes (Figs. 2–8). In Barley soups the changes weregenerally milder as a function of concentration com-pared to oat soups, perhaps due to lower thickness. The

ARTICLE IN PRESSM. Lyly et al. / Lebensm.-Wiss. u.-Technol. 37 (2004) 749–761758
viscosity of food is known to modify the perception oftastes (Paulus & Haas, 1980; Godshall, 1988). Further-more, composition of the thickener in itself has beensuggested to have a greater effect on the perception offlavours than just the viscosity (Pangborn, Trabue, &Szczesniak, 1973; M.alkki, Heini .o, & Autio, 1993)Freezing had no notable effect on the molecular
weight of b-glucan or on the sensory quality of thesoups, although the freezing treatment was quite severeas the freezing time to �18�C was between 6 and 9 h.The instrumental viscosity of the soups decreased duringfreezing about 30%, but the reduction was not largeenough to be detected in the sensory evaluation. Theextractability of b-glucan has been found to decreaseduring storage in freezer (Beer et al., 1997b), but in thesame study the molecular weight remained stable infrozen oat bran muffins. The decline in solubility duringfrozen storage possibly reflects changes in molecularorganisation and crystallinity (Beer et al., 1997b).Heating has been shown to increase the solubility of b-glucan (Bhatty, 1992; Jaskari et al., 1995), and thus mayalso affect its physiological effectiveness. Therefore, awarm food would be especially suitable for b-glucanenrichment. As the soups are designed to be eatenwarm, in this study they were reheated before assess-ments. This could counteract the solubility-loweringeffect of freezing.As expected, the correlation between molecular
weight and sensory thickness was strong and positive.In previous studies, Wood et al. (2000) have found alinear relationship between log (concentration�Mw)and log viscosity. Good correlations were also obtainedbetween sensory texture attributes and viscosity. Pre-viously, we have found a positive correlation (r=0.73, atshear rate 50 s�1) between sensory thickness andinstrumental viscosity in b-glucan enriched beverages(Lyly et al., 2003). Positive correlation between sensoryand instrumental viscosity in food products similar toours has been found using various instruments and arange of shear rates. A high correlation ðr > 0:9Þ betweensensory oral and instrumental viscosity in soymilkyogurt (shear rate 100 rpm, Buono, Setser, Erickson, &Fung, 1990) and in three beverages (shear rate 30 rpm,Pangborn, Gibbs, & Tassan, 1978) was found usingBrookfield viscometer. Good correlations betweeninstrumental and sensory texture measurements (viscos-ity/thickness) of salad dressing (Wendin & Hall, 2001)and lemon pie filling (Hill, Mitchell, & Sherman, 1995)have also been found. In our study, there was a negativecorrelation between the intensities of flavour attributesand viscosity at different shear rates. However, as the b-glucan preparations contained only 14.5–34.5 g b-glucan/100 g preparation, it is difficult to separate thepure effect of viscosity from the effect of increasingconcentration of other components on the taste. Yet itwas possible to compare the viscosities of Oat1 and Oat2
III/1
soup samples, as the concentration of b-glucan in thepreparations was almost the same (14.5 g b-glucan/100 gpreparation and 19.3 g b-glucan/100 g preparation,respectively).The role of molecular weight on the cholesterol
lowering effect of b-glucan is not clear. High molecularweight and thereby high viscosity seem to be crucial forthe physiological functionality of b-glucan regarding itsbalancing effect on the peak blood glucose (Wood et al.,1994, 2000). The role of molecular weight on cholester-ol-lowering properties is less clear, as also a processedoat product has been found effective in reducing bloodcholesterol levels in the study of .Onning et al. (1999).Native b-glucan in the grain has a molecular weight of2–3 million, but the high molecular weight b-glucan issensitive to processing (Beer, Arrigoni, & Amado, 1996;Beer et al., 1997a, b; Suortti et al., 2000). The giantlinear molecules are easily disrupted by enzymatichydrolysis or high mechanical shear. Even small residualb-glucanase activities of the grain can hydrolyse the b-glucan during isolation process (Autio et al., 1992).Solubility affects viscosity in addition to the molecularweight and total concentration. On one hand, fragmen-tation of b-glucan and thereby decrease in molecularweight during cooking and processing may enhance theextractability of b-glucan, and therefore the viscosity,but on the other hand, reduced molecular weightconsequently alter viscosity (Jaskari et al., 1995;Robertson, Majsak-Newman, Ring, & Selvendran,1997). In the study of Beer et al. (1997b), bakingincreased the physiologically extractable amount of b-glucan three- to fourfold but decreased the peakmolecular weight by 50% compared to the raw material.They used an in vitro system simulating humandigestion in their study. An association between lowermolecular weight and increased solubility has beennoted in other studies also (Wood et al., 1991).The amount of b-glucan in food products has to be
adequate to reach the level needed for health effects.Soup samples in this study contained b-glucan from0.25 g b-glucan/100ml soup to 2 g b-glucan/100ml soup.In compliance with FDA’s limit given to the amount ofb-glucan per portion for using the health claim(minimum 0.75 g b-glucan/portion), the size of oneportion would vary from 300ml (0.25 g b-glucan/100 gsoup) to 37.5ml (2 g b-glucan/100 g soup). Concerningsoup, a typical portion size could be approximately350ml. In this sense, soups could be suitable foods toadd b-glucan in. In addition, using b-glucan concentra-tion 1/100 g or higher, it would be possible to include 3 gof b-glucan or even more into one portion (300 g) ofsoup. With the bran-type preparation Oat1, the max-imum practical concentration of b-glucan in the soupwas 0.5 g b-glucan/100 g soup due to technologicalproblems (the soup simply gets too thick). With thelower molecular weight preparations Oat2 and Barley, it
0

ARTICLE IN PRESSM. Lyly et al. / Lebensm.-Wiss. u.-Technol. 37 (2004) 749–761 759
was possible to add up to 2 g b-glucan/100 g soup. Theuse of purified b-glucan fractions also makes it possibleto avoid the impurities of other components, such asprotein and starch, which can increase viscosity in foodsand therefore cause problems in food processing.The results showed that barley b-glucan worked well
in this kind of food product regarding its sensoryproperties. Oat2 and Barley preparations representedboth more processed preparation types although themolecular weights were different, which slightly compli-cates the comparison of oat and barley preparations.Also the concentration of b-glucan of the differentpreparations used for the soup were different (Table 1),and therefore, the Barley soups made of the preparationwith highest concentration of b-glucan contained lessadditional cereal material than the oat soups.Due to its originally stronger taste, higher purity of
the preparation and lower viscosity, it did not suppressflavour characteristics of the soups as much as did oatpreparations (Figs. 5–8). However, the molecularweights of the oat and barley preparations were notthe same (Table 1). It would be interesting to compareoat and barley preparations of the same molecularweight. Barley b-glucan has also been found physiolo-gically efficient regarding its cholesterol lowering effectin humans (Newman et al., 1989; McIntosh et al., 1991;Lupton et al., 1994; Ikegami et al., 1996) and in animalstudies (Wang et al., 1992; Kahlon et al., 1993; Heckeret al., 1998; Delaney et al., 2003), and it has alsofavourable effect on blood glucose and insulin responsesafter meal in humans (Yokoyama et al., 1997; Hallfrisch& Behall 2000; Hallfrisch et al., 2003). In the studiesmentioned here, the molecular weight of barley b-glucanpreparations was not described, which makes thecomparison of physiological effects of oat and barleydifficult. However, the interest in using barley as asource of b-glucan in foods is increasing (Bhatty, 1992;Knuckles, Hudson, Chiu, & Sayre, 1997; Hecker et al.,1998).
b-glucans are potential alternatives as thickeningagents in different food applications (Wood, 1986) andcompared to other thickeners, its ability to increaseviscosity is competitive with other thickening agents(Dawkins & Nnanna, 1995). High molecular weight b-glucans are more effective thickening agents than lowmolecular weight b-glucans as they increase viscositymore at lower concentrations. b-glucan is suitable for awide range of food products, because as a neutral andnon-ionic polymer its viscosity is not affected by pH(Dawkins & Nnanna, 1995). Sodium chloride atconcentrations used in food (1–3 g NaCl/100 g food)decreased the viscosity of oat (Dawkins and Nnanna1995) and barley b-glucan (G !omez, Navarro, Garnier,Horta, & Carbonell, 1997) and has to be taken intoaccount when designing products with b-glucan. Theviscosity of b-glucan reversibly decreases with increased
III/1
temperature (Autio et al., 1987; Dawkins & Nnanna,1995). In this sense, warm food products would be idealproduct alternatives, as the concentration of b-glucancould be higher than in cold food products because theproduct would have decreased sensory thickness duringeating or drinking as a result of increased temperature.
5. Conclusions
The molecular weight and concentration of b-glucanhad a significant effect on the sensory thickness of soup,as expected. The sensory characteristics of soupscontaining barley b-glucan were different compared tooat b-glucans. Freezing had no notable effect on themolecular weight of b-glucan or on the sensory qualityof the soups. The correlations between instrumentalviscosity and sensory characteristics were good (sensorytexture r=0.70–0.84; flavour r=�0.69 to �0.80).Technologically, soup is a well-suited product alter-native for enrichment with physiologically effectiveamounts of b-glucan. Using low molecular weight b-glucan preparations (MWp200,000), it is possible toinclude larger amounts b-glucan into one portion ofsoup. However, the relationship between molecularweight of b-glucan with respect to physiologicalfunctionality has to be kept in mind. Clinical studiesare needed to investigate the physiological effects of b-glucan preparations differing in molecular weight andviscosity. Also the consumer acceptability of novel foodproducts containing b-glucan would be essential toinvestigate.
Acknowledgements
We thank Findus R & D AB, Sweden, for providingus the soup base, and CEBA AB, Sweden and FinnCereal, Finland, for b-glucan preparations. This workbelongs to the Tailored Technologies for Future Foods(TTFF) research program at VTT Biotechnology. Thisstudy has been financially supported by the EuropeanCommunity (EC) within the 5th Framework Pro-gramme under the Quality of Life and Management ofLiving resources, Key Action 1: Project ‘‘Design offoods with improved functionality and superior healtheffects using cereal betaglucans’’, QLRT-2000-00535.
References
AOAC Official Methods of Analysis. (1990). Total dietary fibre (15th
ed.) No. 985.29.
AOAC Official Methods of Analysis. (1995). Fat in flour (16th ed). No.
922.06.
Arvola, A., L.ahteenm.aki, L., & Tuorila, H. (1999). Predicting the
intent to purchase unfamiliar and familiar cheeses: The effects of
1

ARTICLE IN PRESSM. Lyly et al. / Lebensm.-Wiss. u.-Technol. 37 (2004) 749–761760
attitudes, expected liking and food neophobia. Appetite, 32,
113–126.
Autio, K. (1995). Functional aspects of cell wall polysaccharides. In
A.-C. Eliasson (Ed.), Carbohydrates in food (pp. 227–264). New
York: Marcel Dekker.
Autio, K., M.alkki, Y., & Virtanen, T. (1992). Effects of processing on
the microstructure of oat (Avena sativa) bran concentrate and the
physicochemical properties of isolated b-glucans. Food Structure,
11, 47–54.
Autio, K., Myllym.aki, O., & M.alkki, Y. (1987). Flow properties
of solutions of oat b-glucans. Journal of Food Science, 52,
1364–1366.
Beer, M. U., Arrigoni, E., & Amado, R. (1996). Extraction of oat gum
from oat bran: Effects of process on yield, molecular weight
distribution, viscosity and (1-3)(1-4)-b-D-glucan content of the
gum. Cereal Chemistry, 73, 58–62.
Beer, M. U., Wood, P. J., & Weisz, J. (1997a). Molecular weight
distribution and (1-3)(1-4)-b-D-glucan content of consecutive
extracts of various oat and barley cultivars. Cereal Chemistry, 74,
476–480.
Beer, M. U., Wood, P. J., Weisz, J., & Fillion, N. (1997b). Effect
of cooking and storage on the amount and molecular weight of
(1-3)(1-4)-b-D-glucan extracted from oat products by an in vitro
digestion system. Cereal Chemistry, 74, 705–709.
Bhatty, R. S. (1992). Total and extractable b-glucan contents of oats
and their relationship to viscosity. Journal of Cereal Science, 15,
185–192.
Bourdon, I., Yokoyama, W., Davis, C., Backus, R., Richter, D.,
Knuckles, B., & Schneeman, B. O. (1999). Postprandial lipid,
glucose, insulin, and cholecystokinin responses in men fed barley
pasta enriched with beta-glucan. American Journal of Clinical
Nutrition, 69, 55–63.
Braaten, J. T., Wood, P. J., Scott, F. W., Riedel, K. D., Poste, L. M., &
Collins, M. W. (1991). Oat gum, a soluble fibre which lowers
glucose and insulin in normal individuals after an oral glucose load:
Comparison with guar gum. American Journal of Clinical Nutrition,
53, 1425–1430.
Buono, M. A., Setser, C., Erickson, L. E., & Fung, D. Y. C. (1990).
Soymilk yoghurt: Sensory evaluation and chemical measurement.
Journal of Food Science, 55, 528–531.
Dawkins, N. L., & Nnanna, I. A. (1995). Studies on oat gum [(1->3,
1->4)-beta-D-glucan]: Composition, molecular weight estimation
and rheological properties. Food Hydrocolloids, 9, 1–7.
Delaney, B., Nicolosi, R. J., Wilson, T. A., Carlson, T., Frazer, S.,
Zheng, G.-H., Hess, R., Ostergren, K., Haworth, J., & Knutson, N.
(2003). Beta-glucan fractions from barley and oats are similarly
antiatherogenic in hypercholesterolemic Syrian golden hamsters.
Journal of Nutrition, 133, 468–495.
Doublier, J. L., & Wood, P. J. (1995). Rheological properties of
aqueous solutions of (1->3)(1->4)-b-D-glucan from oats (Avena
sativa L.). Cereal Chemistry, 72, 335–340.
Dwyer, S. (1999). Now they’re cookin’! Prepared Foods, 168, 15–16,
18, 22–24, 26.
FDA (1996). Food labelling: Health claims; oats and coronary heart
disease. Federal Register. 61 (3), January 4.
Godshall, M. A. (1988). The role of carbohydrates in flavour
development. Food Technology, 42(11), 71–78.
G !omez, C., Navarro, A., Garnier, C., Horta, A., & Carbonell, J. V.
(1997). Physical and structural properties of barley (1-3),(1-4)-
b-D-glucan—III. Formation of aggregates analysed through
its viscoelastic and flow behaviour. Carbohydrate Polymers, 34,
141–148.
Hallfrisch, J., & Behall, K. M. (2000). Improvement in insulin and
glucose responses related to grains. Cereal Foods World, 45, 66–69.
Hallfrisch, J., Schofield, D. J., & Behall, K. M. (2003). Physiological
responses of men and women to barley and oat extracts
III/1
(Nu-trimX). II. Comparison of glucose and insulin responses.
Cereal Chemistry, 80, 80–83.
Hecker, K. D., Meier, M. L., Newman, R. K., & Newman, C. W.
(1998). Barley b-glucan is effective as a hypocholesterolaemic
ingredient in foods. Journal of the Science of Food and Agriculture,
77, 179–183.
Hill, M. A., Mitchell, J. R., & Sherman, P. A. (1995). The relationship
between the rheological and sensory properties of a lemon pie
filling. Journal of Texture Studies, 26, 457–470.
Ikegami, S., Tomita, M., Honda, S., Yamaguchi, M., Mizukawa, R.,
Suzuki, Y., Ishii, K., Ohsawa, S., Kiyooka, N., Higuchi, M., &
Kobayashi, S. (1996). Effect of boiled barley-rice-feeding in
hypercholesterolemic and normolipemic subjects. Plant Foods for
Human Nutrition, 49, 317–328.
Jaskari, J., Henriksson, K., Nieminen, A., Suortti, T., Salovaara, H., &
Poutanen, K. (1995). Effect of hydrothermal and enzymic
treatments on the viscous behaviour of dry- and wet-milled oat
brans. Cereal Chemistry, 72, 625–631.
Kahlon, T. S., Chow, F. I., Knuckles, B. E., & Chiu, M. M. (1993).
Cholesterol-lowering effects in hamsters of beta-glucan-enriched
barley fraction, dehulled whole barley, rice bran, and oat bran and
their combinations. Cereal Chemistry, 70, 435–440.
Knuckles, B. E., Hudson, C. A., Chiu, M. M., & Sayre, R. N. (1997).
Effect of b-glucan barley fractions in high-fibre bread and pasta.
Cereal Foods World, 42, 94–99.
Lawless, H., & Heymann, H. (1998). Sensory evaluation of food.
Principles and practices. New York: Chapman & Hall.
Lia, (A., Hallmans, G., Sandberg, A.-S., Sundberg, B., (Aman, P., &
Andersson, H. (1995). Oat beta-glucan increases bile acid excretion
and a fibre-rich barley fraction increases cholesterol excretion in
ileostomy subjects. American Journal of Clinical Nutrition, 62,
1245–1251.
Lupton, J. R., Robinson, M. C., & Morin, J. L. (1994). Cholesterol-
lowering effect of barley bran flour and oil. Journal of the American
Dietetic Association, 94, 65–70.
Lyly, M., Salmenkallio-Marttila, M., Suortti, T., Autio, K., Poutanen,
K., & L.ahteenm.aki, L. (2003). Influence of oat b-glucan prepara-
tions on the perception of mouthfeel and on rheological properties
in beverage prototypes. Cereal Chemistry, 80, 536–541.
M.alkki, Y., Heini .o, R.-L., & Autio, K. (1993). Influence of oat gum,
guar gum and carboxymethyl collulose on the perception of
sweetness and flavour. Food Hydrocolloids, 6, 525–532.
McCleary, B., & Codd, R. (1991). Measurement of (1-3),(1-4)-b-D-glucan in barley and oats: A streamlined enzymic procedure.
Journal of the Science of Food and Agriculture, 55, 303–312.
McIntosh, G. H., Whyte, J., McArthur, R., & Nestel, P. J. (1991).
Barley and wheat foods: Influence on plasma cholesterol concen-
trations in hypercholesterolemic men. American Journal of Clinical
Nutrition, 53, 1205–1209.
Newman, R. K., Newman, C. W., & Graham, H. (1989). The
hypocholesterolemic function of barley b-glucans. Cereal Foods
World, 34, 883–886.
NMKL method No 131. (1989). Fat. Determination according to SBR
in meat and meat products.
NMKL method No 23. (1991). Moisture and ash. Gravimetric
determination in meat and meat products (3rd. ed.).
NMKL method No 6. (2003a). Nitrogen. Determination in foods and
feeds according to Kjeldahl (4th ed.).
NMKL method No 129. (2003b). Total, soluble, and insoluble dietary
fibre in foods. Enzymatic-gravimetric method, MES/TRIS Buffer
(2nd ed.)..Onning, G., Wallmark, A., Persson, M., (Akesson, B., Elmstahl, S., &
.Oste, R. (1999). Consumption of oat milk for 5 weeks lowers serum
cholesterol and LDL cholesterol in free-living men with moderate
hypercholesterolemia. Annals of Nutrition and Metabolism, 43,
301–309.
2

ARTICLE IN PRESSM. Lyly et al. / Lebensm.-Wiss. u.-Technol. 37 (2004) 749–761 761
Pangborn, R. M., Gibbs, Z. M., & Tassan, C. (1978). Effect of
hydrocolloids on apparent viscosity and sensory properties of
selected beverages. Journal of Texture Studies, 9, 415–436.
Pangborn, R. M., Trabue, I., & Szczesniak, A. (1973). Effect of
hydrocolloid on oral viscosity and basic taste intensities. Journal of
Texture Studies, 4, 224–241.
Paulus, K., & Haas, E. M. (1980). The influence of solvent viscosity on
the threshold values of primary tastes. Chemical Senses, 5(Suppl.
1), 23–32.
Plemmons, L. E., & Resurreccion, A. V. A. (1998). A warm-up sample
improves reliability of responses in descriptive analysis. Journal of
Sensory Studies, 13, 359–376.
Richardson, R. K., Morris, E. R., Ross-Murphy, S. B., Taylor, L. J., &
Dea, I. C. M. (1989). Characterization of the perceived texture of
thickened systems by dynamic viscosity measurements. Food
Hydrocolloids, 3, 175–191.
Rimm, E. B., Ascherio, A., Giovannucci, E., Spiegelman, D.,
Stampfer, M., & Willet, W. C. (1996). Vegetable, fruit and cereal
fibre intake and risk of coronary heart disease among men. Journal
of the American Medical Association, 275, 451–477.
Ripsin, C. M., Keenan, J. M., Jacobes, D. R., Elmer, P. J., Wlech, R.
R., Van Horn, L., Liu, K., Turnbull, W. H., Thye, F., Kestin, M.,
Hegsted, M., Davidson, D. M., Davidson, M. H., Dugan, D. L.,
Denmark-Wahnefried, W., & Beling, S. (1992). Oat products and
lipid lowering. A meta-analysis. Journal of the American Medical
Association, 267, 3317–3325.
Robertson, J. A., Majsak-Newman, G., Ring, S. G., & Selvendran, R.
R. (1997). Solubilisation of mixed linkage (1-3), (1-4)-b-D-glucans from barley: Effects of cooking and digestion. Journal
of Cereal Science, 25, 275–283.
Suortti, T. (1993). Size-exclusion chromatographic determination of
beta-glucan with postcolumn reaction detection. Journal of
Chromatography, 632, 105–110.
III/1
Suortti, T., Johansson, L., & Autio, K. (2000). Effect of heating and
freezing on molecular weight of oat b-glucan. Abstract No. 332,American Association of Cereal Chemists, Annual Meeting 2000.
Wang, L., Newman, C. W., & Hofer, P. J. (1992). Barley beta-glucans
alter intestinal viscosity and reduce plasma cholesterol concentra-
tions in chicks. Journal of Nutrition, 122, 2292–2297.
Wendin, K., & Hall, G. (2001). Influences of fat, thickener and
emulsifier contents on salad dressing: Static and dynamic sensory
and rheological analyses. Lebensmittel-Wissenschaft und -Techno-
logie, 34, 222–233.
Wood, P. J. (1986). Oat b-glucan: Structure, location and pro-
perties. In F. H. Webster (Ed.), Oats: Chemistry and technology
(pp. 121–152). Minnesota: American Association of Cereal
Chemists, Inc.
Wood, P. J. (2001). Cereal b-glucans: Structure, properties and health
claims. In B. V. McCleary, & L. Prosky (Eds.), Advanced dietary
fibre technology (pp. 315–318). Oxford: Blackwell Science Co.
Wood, P. J., Beer, M. U., & Butler, G. (2000). Evaluation of the role of
concentration and molecular weight of oat b-glucan in determiningeffect of viscosity on plasma glucose and insulin following an oral
glucose load. British Journal of Nutrition, 84, 19–23.
Wood, P. J., Braaten, J. T., Scott, F. W., Riedel, K. D., Wolynetz, M.
S., & Collins, M. W. (1994). Effect of dose and modification of
viscous properties of oat gum on plasma glucose and insulin
following an oral glucose load. British Journal of Nutrition, 72,
731–743.
Wood, P. J., Weisz, J., & Mahn, W. (1991). Molecular characterization
of Cereal b–glucans. II. Size-exclusion chromatography for
comparison of molecular weight. Cereal Chemistry, 68, 530–536.
Yokoyama, W. H., Hudson, C. A., Knucles, B. E., Chiu, M.-C. M.,
Sayre, R. N., Turnlund, J. R., & Schneeman, B. O. (1997). Effect of
barley b-glucan in durum wheat pasta on human glycemic
response. Cereal Chemistry, 74, 293–296.
3


PUBLICATION IV
Factors influencing consumers’ willingness to use beverages and
ready-to-eat frozen soups containing oat ß-glucan in Finland, France and
Sweden
In: Food Quality and Preference. In press. Reprinted with permission from the publisher.


ARTICLE IN PRESS
www.elsevier.com/locate/foodqual
Food Quality and Preference xxx (2006) xxx–xxx
Factors influencing consumers’ willingness to use beveragesand ready-to-eat frozen soups containing oat b-glucan
in Finland, France and Sweden
Marika Lyly *, Katariina Roininen, Kaisu Honkapaa, Kaisa Poutanen, Liisa Lahteenmaki
VTT Technical Research Centre of Finland, P.O. Box 1000, 02044 VTT, Finland
Received 24 May 2005; received in revised form 30 September 2005; accepted 13 December 2005
Abstract
Factors affecting consumers’ willingness to use beverages and ready-to-eat frozen soups containing oat b-glucan were studied in Fin-land, France and Sweden (N = 1157).
Three beverage or soup samples were presented to each consumer: a reference sample without b-glucan/health claim, a sample con-taining b-glucan, without claim and a third one with b-glucan and claim (cholesterol or glucose related). Questions about liking, bene-ficiality, willingness to use and price estimates for purchasing were asked before and after tasting. A trained sensory panel (N = 11) alsoprofiled the sensory characteristics of the samples.
Taste of the samples strongly affected the willingness to use them. Health claim gave a significant but small added value to beveragesand soups with b-glucan. The price respondents were willing to pay for the beverages and soups containing b-glucan decreased aftertasting, regardless of the health claim. No notable effect due to gender or age on the willingness to use products with health claimswas found.� 2005 Elsevier Ltd. All rights reserved.
Keywords: Consumer; b-Glucan; Willingness to use; Gender; Age; Price
1. Introduction
Functional foods are regarded as an important growthopportunity for the food industry. Fulfilling these expecta-tions requires a great deal of effort from co-operating part-ners, e.g., researchers, retailers and food ingredientsuppliers (Menrad, 2003). Therefore, it is necessary to esti-mate the interests and probable behaviour of consumersbeforehand in order to avoid expensive mistakes in productor concept development.
The interest of the food industry and consumers in die-tary fibre is predicted to continue growing (Sloan, 2001).Oat bran seems to be one of the most interesting ingre-dients due to its already proven health benefits and
0950-3293/$ - see front matter � 2005 Elsevier Ltd. All rights reserved.
doi:10.1016/j.foodqual.2005.12.001
* Corresponding author. Tel.: +358 20 722 5837; fax: +358 20 722 7071.E-mail address: [email protected] (M. Lyly).
IV/
‘oat drinks’ has been mentioned as one of the majortrends by Sloan (2001). We wanted to study a potentialfunctional ingredient, oat b-glucan fibre, in two differentfoods. It has been scientifically proven that oat b-glucanlowers elevated blood cholesterol levels (Ripsin et al.,1992) and has a balancing effect on postprandial blood glu-cose and insulin response (Braaten et al., 1991; Wood et al.,1994).
Many factors affect consumers’ acceptability of foods.Taste and other sensory characteristics of foods occupy akey position. Taste has to be faultless since it strongly influ-ences food choices (Arvola, Lahteenmaki, & Tuorila,1999), in many cases surpassing health issues (Glanz, Basil,Maibach, Goldberg, & Snyder, 1998; Tepper & Trail,1998). In addition, Tuorila and Cardello (2002) demon-strated that consumers are not willing to compensate forbad taste with health effects.
1

2 M. Lyly et al. / Food Quality and Preference xxx (2006) xxx–xxx
ARTICLE IN PRESS
In many cases, however, product information has influ-enced the perceived benefit and thereby the willingness touse a product. The name of the product, its price and itsnutritional benefit information had a significant effect onthe intention to buy a fat spread (Bower, Saadat, & Whit-ten, 2003). Kahkonen, Tuorila, and Rita (1996) found thata low-fat spread was better accepted if consumers receivednutrition information before using it.
Product information as such may not in all cases beeffective in influencing the acceptability of foods. Attitudesand personal motivation define the relevance of the prod-uct information to consumers and determine its efficacy.Attitudes may determine the effect of product informationon liking and the likelihood of buying a product (Shepherd,Sparks, Bellier, & Raats, 1991). The sensory ratings ofspread labelled as being reduced-fat were more positive ifthe respondents’ attitudes towards reduced-fat spread werepositive (Aaron, Mela, & Evans, 1994). In a study byMcFarlane and Pliner (1997) on novel foods, general nutri-tion information increased the willingness to taste novelfoods if nutrition was important to the participants. Thiscould also be true with health-related motivational factors:a personal need to prevent illness or to pay attention toone’s own health may affect the willingness to use a productwith a suitable health claim. The likelihood of the conceptof functional foods being accepted increases, if the respon-dent has an ill family member (Verbeke, 2005). Healthproblems also motivate individuals to search for specificand relevant nutritional information (Bhaskaran & Hard-ley, 2002), e.g., those with high blood cholesterol levellook for cholesterol-free foods. Information about thefibre content of food increased the likelihood that theelderly intended to purchase the product, as they were con-cerned about their fibre intake, unlike younger consumersfor whom fibre intake was not relevant (Tuorila, Anders-son, Martikainen, & Salovaara, 1998). If the end result ofusing a product is a reduction in disease risk, the motiva-tion to use a product may be strong enough. In a studyby Urala and Lahteenmaki (2004), the perceived rewardin terms of improved performance and health from usingfunctional foods was the best predictor for a consumer’swillingness to use functional foods. In addition, the carrierproduct type, which is enriched, has an effect on the reac-tions towards functional foods. In the study by Bech-Larsen and Grunert (2003), functional, enriched spreadwas perceived as healthier than enriched yoghurt and juicewas as the latter products are perceived to be alreadyhealthy.
Price cannot be excluded from the factors influencingthe willingness to use foods. Price plays a crucial role inthe decision of Finnish consumers to purchase functionalfoods (Ollila, Tuomi-Nurmi, & Immonen, 2004). The rolethat price played was contradictory to that of Poulsen’s(1999) study on functional foods, although he mentionedthat a positive attitude towards enriched products wouldincrease the willingness of a consumer to pay a higher pricefor these products.
IV
The so called traditional demographic variables such asgender and age may also affect the willingness to use aproduct. In a study by Bower et al. (2003), females, oldersubjects and consumers with a high health concern had ahigher purchase intention for the spread labelled with aproven health benefit. The subjects in this experiment were,however, relatively young (more than half of them wereunder 25 and the oldest subjects were only 44 years old),which may make it difficult to separate the true effect ofage in this study. The proportion of users of plant stanolester margarine has found to increase with age (Anttolai-nen et al., 2001) and in Denmark, the elderly had a morepositive attitude towards functional foods than young peo-ple did (Poulsen, 1999). Older Australian consumers werelikely to take preventative actions concerning dietarychanges and, in this way, possibly influence their diseaserisk (Bhaskaran & Hardley, 2002), which could make themmore potential users of functional foods.
The objectives of this study were to answer the followingquestions:
• Does a health claim affect liking for a product, its per-ceived beneficiality and willingness to use beveragesand ready-to-eat soups containing b-glucan?
• How does exposure to the products influence the liking,perceived beneficiality and willingness to use theproducts?
• Do so called traditional demographic variables, such ascountry, gender and age affect willingness to use theseproducts?
• Does a personal need to pay attention to one’s healthaffect the willingness to use these products?
• Are consumers willing to pay more for products withhealth claims?
2. Materials and methods
2.1. Procedure
Consumer data were collected in Finland, France andSweden during autumn 2003 with the target of 400 partic-ipants in each country. Consumers in the three countrieswere considered to represent different food cultures andhave varying views on healthy eating (Margetts, Martinez,Saba, Holm, & Kearney, 1997), perceived benefits of it(Zunft et al., 1997) and perceived need to alter eating habits(Kearney et al., 1997).
In the recruitment situation, the participants were toldthat the study concentrates on the factors related to foodchoice on a general level. In Finland and France, respon-dents answered sample-related questions before tasting inthe recruitment situation (expected liking, expected willing-ness to use, etc.). Secondly, the participants received threesamples of either beverages or soups (Fig. 1) labelled withthe ingredient list (Table 1) and instructions for conductingthe taste test at home with the same questionnaires to fill in.
/2

Fig. 1. Sample design.
Table 1Ingredient list of beverages and soups
Without b-glucan With b-glucan
Beverage Water, fruit juice (apple and pear concentrate),sucrose, fructose, rice flour, vegetable fat,preservative (potassium sorbate)
Water, fruit juice (apple and pear concentrate), sucrose,fructose, oat fraction, preservative (potassium sorbate)
Soup Water, carrots, peas, shrimps, tomato,onion, red bell pepper, celeriac, cream,skim milk powder, tomato puree, maize starch,maltodextrins, fish bouillon, salt, dill, rape seed oil,shrimp concentrate, white pepper
Water, carrots, peas, shrimps, tomato, onion, red bell pepper,celeriac, cream, skim milk powder, tomato puree, oat fraction,maltodextrins, fish bouillon, salt, dill, rape seed oil,shrimp concentrate, white pepper
The difference between the products without and with b-glucan is marked in bold in the ingredient lists (it was not highlighted for consumers though).
M. Lyly et al. / Food Quality and Preference xxx (2006) xxx–xxx 3
ARTICLE IN PRESS
Participants then sent the completed questionnaires backby mail to the responsible organiser in each country. InSweden, participants received all samples and question-naires at the same time at home and they were carefullyinstructed to fill in the first questionnaire on expected lik-ing, etc., before tasting the samples. In all countries, therespondents received a small reward after completing thestudy.
2.2. Samples
One of the samples was a reference sample without b-glucan and without a health claim. The two other samplescontained b-glucan and they were presented either withouta health claim or with a cholesterol- or glucose-relatedhealth claim (Fig. 1). With this design, we could test boththe effect of sensory properties and the effect of the claimon the acceptance of the products.
The samples used in this study were an apple-pear bev-erage and a shrimp-dill ready-to-eat frozen soup. In bothproduct categories, there were two different versions: withand without oat b-glucan (Table 1). The amount of vegeta-
IV/3
ble oil in the beverage without b-glucan was very small,0.65 g/100 g beverage. It was included in the recipe becausethe energy and nutrient content of the samples had to be assimilar as possible, as these same samples were used also inclinical studies (not reported here).
The amount of b-glucan in the beverage and soup sam-ples was 1 g of b-glucan/100 g beverage/soup.
Five members of an experienced sensory panel devel-oped the vocabulary for beverages and soups, which waspartly based on earlier studies with b-glucan beveragesand soups (Lyly et al., 2003, 2004). The sensory character-istics of the beverages and soups in consumer tests wereprofiled using descriptive analysis (Lawless & Heymann,1998). Attribute intensities were rated on 10-unit graphicintensity scales, verbally anchored from their ends. Onetraining session was performed before actual evaluations.The blind coded samples were assessed twice using theexperienced sensory panel (11 assessors in each session).The data were collected using computerised data-collectingsystem (CSA, Computerized Sensory Analysis System,Compusense Inc., Guelph, Canada, Compusense 5, version4.4).

4 M. Lyly et al. / Food Quality and Preference xxx (2006) xxx–xxx
ARTICLE IN PRESS
2.3. Participants
The volunteers for the consumer test were recruitedfrom shopping malls, sports centres, fire stations (to reachmales) and from VTT (the Technical Research Centre ofFinland) in Finland. In Sweden and France, consumerswere recruited from large consumer panels. A total of613 consumers tasted beverages and 544 consumers soups(Table 2).
The target age of the respondents was 40 years or over.This age group was selected because they are more likely tobe potential users of these products compared with youn-ger age groups, who do not yet have an active need to thinkabout ageing and the increasing risk factors of diseasesrelated to it. A total of 4.5% of the respondents were under40 years old and their age ranged from 17 to 89 (Table 2).The respondents’ level of education in France was lowerthan in Finland and Sweden (Table 2).
In our study 36% of the respondents reported their stateof health as reasonably good, 63% as good/excellent and
Table 2Background information of participants (mean values or percentage proportio
Finland (N = 353) France (
Number of respondents
Beverage group (%) 59 50• Cholesterol claim 53 50• Glucose claim 47 50Soup group (%) 41 50• Cholesterol claim 49 50• Glucose claim 51 50
Mean age (years) 57 53Range 28–89 35–83% under 40 years 3.1 0.2
Gender
Women (%) 59 49Men (%) 41 51
Education (%)
Nine years (basic level) 27 49College level 55 26University level 18 25
BMI (body mass index: kg/m2)
Mean 25 25
Table 3The need to pay attention to health; means + (standard deviation)
Finland Fra
Blood pressure 3.8 (2.3) 2.8Cholesterol levels 4.2 (2.0) 3.3Blood glucose levels 3.4 (2.0) 2.7Gut health 3.9 (1.9) 3.2Bone health 4.7 (1.9) 3.6Fibre intake 4.7 (1.8) 3.9Weight 4.6 (2.0) 4.6Healthiness of food 4.8 (1.7) 4.3Health in general 5.5 (1.5) 4.6
Scale: 1 = no need at all, 7 = strong need.
IV/
only 1–2% reported their health as poor in all countries.In an European study, quite similarly, 60% of 26–65+year-old European Union citizens perceived their healthas very good/good, 32% as fair and 7.6% as bad/verybad (European Opinion Research Group, 2003). In ourstudy, only the proportion of those reporting their healthas poor was slightly smaller than in average in the Euro-pean Union.
Quite a large proportion of the respondents reportedweight control attempts often/constantly (37%) or some-times (38%) during the past two years.
The motivation to pay attention to health was generallyhigher among Finnish respondents than French and Swed-ish respondents (Table 3). The Finnish respondents had astronger need to pay attention to blood pressure, choles-terol levels, blood glucose levels, gut health, bone health,fibre intake, healthiness of food, and health in general(F(2,1136) = 6.0–57.6; P 6 0.003). Attention to weightmanagement was equally high in France and Finland, butwas slightly lower in Sweden (F(2,1136) = 7.3; P 6 0.001).
ns)
N = 410) Sweden (N = 394) All (N = 1157)
50 5350 5150 4950 4750 5050 50
54 5517–78 17–8910.3 4.5
62 5738 43
24 3445 4131 25
25 25
nce Sweden All countries
(2.0) 3.0 (2.2) 3.1 (2.2)(2.1) 3.1 (2.0) 3.5 (2.1)(1.9) 2.8 (1.9) 2.9 (1.9)(2.0) 3.5 (1.9) 3.5 (2.0)(2.2) 3.1 (2.0) 3.7 (2.1)(2.1) 4.2 (1.8) 4.3 (1.9)(1.9) 4.1 (2.0) 4.5 (2.0)(2.1) 4.4 (1.7) 4.5 (1.9)(2.0) 4.2 (1.9) 4.7 (1.9)
4

M. Lyly et al. / Food Quality and Preference xxx (2006) xxx–xxx 5
ARTICLE IN PRESS
2.3.1. Questionnaires
The questionnaires contained questions on liking, thebeneficiality of the product for one’s own self, willingnessto use, a maximum price for trying and for regularly pur-chasing the product. These questions were asked before
and after tasting the samples. Responses were rated on a7-point scale (1 = not at all, 7 = extremely much), exceptthe price questions, which were rated on a 100-unit linescale (EUR 0.5–EUR 3.5 for beverages and EUR 1–EUR6 for soups) with EUR 0.5 and EUR 1 intervals, respec-tively. For creating the price scales, the manufacturers ofthe products estimated a realistic price range for thesekinds of products in each country. Additionally, about50% of the lowest and highest price was subtracted from/added to the lowest and highest prices, respectively, tomake the scales wide enough.
In addition, respondents filled in a background question-naire comprising questions on demographic variables, gen-eral liking and use frequency of different soups andbeverages, health-related questions and attitude questionsusing theGeneralHealth Interest attitude scale (GHI, Roini-nen, Lahteenmaki, & Tuorila, 1999) and three other scalesmeasuring the attitudes towards functional foods named‘Reward’, ‘Necessity’ and ‘Safety’ (Urala & Lahteenmaki,2004). The attitude results are not reported in this paper.
2.4. Data analysis
The sensory profiles for beverages and soups were cre-ated by calculating the means over the two assessments.Two-way ANOVA (Analysis of Variance) was used fortesting the possible differences between beverage/soup sam-ples. The dependent variables were all sensory attributesand independent variables sample and panellist.
A General Linear Model (GLM) Repeated Measuresanalysis was used to test the differences between samplesin liking, beneficiality and willingness to use the products
0
2
4
6
8
10The intensity o
Total flavou
The extensibility of thebeverage (poured from a
spoon)
The thickness of the beverage(in mouth)
The graininess of the mouthfeel
The sliminess of the mouthfeel
Beverage without betaglucan
Beverage with betaglucan
***
***
***
***
Fig. 2. Sensory profiles of the beverage samples with and without b-glucadifferences ((df1,df2) = 1, 44) are marked as ***P < 0.001, **P < 0.01, *P < 0.
IV/
before and after tasting. The effect of age and gender onwillingness to use beverages and soups was also tested witha General Linear Model (GLM) Repeated Measures anal-ysis. If statistically significant differences were found,further analyses were then performed with a GLM multi-variate analysis and Tukey’s test or a Paired Samples T-test. A Pearson correlation, 2-tailed, was used in correla-tion analyses. SPSS software (version 12.0.1, SPSS Inc.Chicago, IL, USA) was used for the statistical analysis.
All of the results in the following paragraph are statisti-cally significant (P < 0.05); therefore, the P values are notseparately reported for the results from T-tests and Tukey’stests.
3. Results
3.1. Sensory profiles of the samples
3.1.1. Beverages
The beverage containing b-glucan was thicker, moreextensible, grainier and slimier compared to the beveragewithout b-glucan (Fig. 2). Moreover, the intensity of theoat flavour was stronger but the sourness, intensity of thefruit aroma and total flavour intensity were weaker in theb-glucan beverage than in the beverage without b-glucan.It is noteworthy that the rancid off-flavour was consider-ably stronger in the b-glucan beverage (mean 3.8 vs. 0.5on a scale of 0–10), which indicates that the beverage hadan untypical flavour that could be regarded as a productdefect.
3.1.2. Soups
The soup containing b-glucan was thicker, more pow-dery and slimy than the soup without b-glucan (Fig. 3),whereas the intensity of the orange colour, the freshnessof the aroma, the intensity of the shrimp aroma, the shrimpflavour, the dill flavour, the freshness of the flavour, the
f oat flavour
The rancidity of the flavour
The sweetness of the flavour
The sourness of the flavour
The intensity of the fruit aroma
r intensity
***
***
***
***
*
n. Means of two replicate evaluations (N = 11). Statistically significant05.
5

0
2
4
6
8
10The freshness of the aroma
The intensity of the shrimparoma
The intensity of the orangecolour
The intensity of the shrimpflavour
The intensity of dill flavour
The freshness of the flavour
The intensity of grain flavourThe saltiness of the flavour
Total flavour intensity
The intensity of possible off-flavour
The thickness of the soup (inmouth)
The powderiness of themouthfeel
The sliminess of the mouthfeel
The soup without betaglucan
The soup with betaglucan
***
***
***
***
***
***
*** ***
***
***
***
***
*
Fig. 3. Sensory profiles of the soup samples with and without b-glucan. Means of two replicate evaluations (N = 11). Statistically significant differences((df1,df2) = 1, 44) are marked as ***P < 0.001, **P < 0.01, *P < 0.05.
6 M. Lyly et al. / Food Quality and Preference xxx (2006) xxx–xxx
ARTICLE IN PRESS
saltiness and the total flavour intensity were decreased. Theintensity of the grain flavour and the possible off-flavourwere increased in the b-glucan soup. The intensity of theoff-flavour was, however, only 1.3 on a scale of 0–10.
3.2. The effect of the health claim and exposure on liking,
perceived beneficiality and willingness to use
Liking, perceived beneficiality and willingness to use allcorrelated strongly in beverages and soups (Table 4), whichmeans that they were not independent variables. In the fol-lowing section, however, we present the results separatelyfor each variable.
3.2.1. Beverages
The presence of a health claim (either cholesterol- orglucose-related) significantly increased the expected liking
for the beverage before tasting (Fig. 4a and b, Table 5).After tasting liking for both b-glucan containing samplesdecreased, despite of the health claims, whereas the likingfor the sample without b-glucan increased and it became
Table 4Correlations between liking, willingness to use and perceived beneficiality, acountries together), all rated after tasting
Liking vs.beneficiality
Liking vs.willingness to use
Beverages
No b-glucan, no claim 0.67*** 0.77***b-Glucan, no claim 0.70*** 0.84***b-Glucan, claim 0.65*** 0.81***
Soups
No b-glucan, no claim 0.60*** 0.77***b-Glucan, no claim 0.58*** 0.81***b-Glucan, claim 0.63*** 0.82***
*P < 0.05, **P < 0.01, ***P < 0.001.
IV/
the best liked after tasting. In the glucose claim subgroup,there were no differences in liking between countries,although differences were observed in the cholesterol claimsubgroup; in France, liking of the sample without b-glucandid not change after tasting while it increased in Finlandand Sweden. The decrease in liking of b-glucan samplesafter tasting was steepest in France. However, the differ-ences between countries were mainly caused by the largerdifference between samples after tasting in Sweden com-pared to the other countries and the lowest liking scoresof b-glucan samples in France compared to other coun-tries. For that reason, we present the liking for beveragesfor all of the countries together (Fig. 4a and b).
Beverages with a cholesterol or glucose claim were per-ceived as significantly more beneficial than samples withoutclaim (without or with b-glucan; Fig. 5a and b, Table 5).Although the perceived beneficiality of the b-glucan samplewith a health claim decreased after tasting in both claimsubgroups, it still remained higher than the b-glucan sam-ple without a claim. In other words, the health claim gavethis sample added beneficiality before and after tasting
nd between willingness to use and willingness to pay (N = 531–610, all
Beneficiality vs.willingness to use
Willingness to use vs. willingness to pay
For tryingthe product
For regularlybuying the product
0.76*** 0.40** 0.49**0.73*** 0.44** 0.52**0.72*** 0.43** 0.49**
0.72*** 0.35** 0.43**0.64*** 0.34** 0.44**0.70*** 0.40** 0.48**
6

Cholesterol claim subgroup"How much do you expect to like/like this beverage?"
1.0
1.5
2.0
2.5
3.0
3.5
4.0
4.5
5.0
5.5
6.0
6.5
7.0
before tasting after tasting
Lik
ing
Extremely much
Not at all
Glucose claim subgroup"How much do you expect to like/like this beverage?"
1.0
1.5
2.0
2.5
3.0
3.5
4.0
4.5
5.0
5.5
6.0
6.5
7.0
before tasting after tasting
Lik
ing
Extremely much
Not at all
no β-glucan, no claim β-glucan, no claimβ-glucan, claim
no β-glucan, no claim β-glucan, no claimβ-glucan, claim
(b)(a)
Fig. 4. The liking of beverage samples in cholesterol and glucose claim subgroups. Means are presented over countries.
Table 5Summary of repeated measures ANOVA on beverages
F rating time(df1,df2 = 1, 276–284)
F sample(df1,df2 = 2, 552–568)
F rating time · sample(df1,df2 = 2, 552–568)
F rating time ·sample · country(df1,df2 = 4, 552–568)
F sample · country(df1,df2 = 4, 552–568)
Liking
Cholesterol claim subgroup 67.6*** 50.1*** 206.1*** 1.1 5.4***Glucose claim subgroup 53.1*** 46.1*** 191.8*** 1.5 0.3
Beneficiality
Cholesterol claim subgroup 61.6*** 96.8*** 70.8*** 0.16 1.3Glucose claim subgroup 45.5*** 38.6*** 57.3*** 1.0 2.2
Willingness to use
Cholesterol claim subgroup 178.2*** 42.2*** 120.8*** 0.97 2.4Glucose claim subgroup 128.9*** 13.3*** 100.4*** 2.9* 2.5*
Sample means differences between samples with no b-glucan (no health claim), with b-glucan (no health claim), and with b-glucan (with health claim).Rating time means difference between results before and after tasting.*P < 0.05, **P < 0.01, ***P < 0.001.
Cholesterol claim subgroup"How beneficial is this beverage for you?"
before tasting after tasting
Ben
efic
ialit
y
Extremely beneficial
Not at all beneficial
Glucose claim subgroup"How beneficial is this beverage for you?"
1.0
1.5
2.0
2.5
3.0
3.5
4.0
4.5
5.0
5.5
6.0
6.5
7.0
1.0
1.5
2.0
2.5
3.0
3.5
4.0
4.5
5.0
5.5
6.0
6.5
7.0
before tasting after tasting
Ben
efic
ialit
y
Extremely beneficial
Not at all beneficial
no β-glucan, no claim β-glucan, no claimβ-glucan, claim
no β-glucan, no claim β-glucan, no claimβ-glucan, claim
(b)(a)
Fig. 5. The perceived beneficiality of beverage samples in cholesterol and glucose claim subgroups. Means are presented over countries.
M. Lyly et al. / Food Quality and Preference xxx (2006) xxx–xxx 7
ARTICLE IN PRESS
compared to the sample with the same sensory quality butwithout the health claim. Respondents in different coun-tries rated the samples similarly in both health claimsubgroups.
IV/7
The presence of a health claim significantly increased thewillingness to use beverages before the samples were tastedin both health claim subgroups (Fig. 6a and b, Table 5).Before tasting, the willingness to use the sample with a
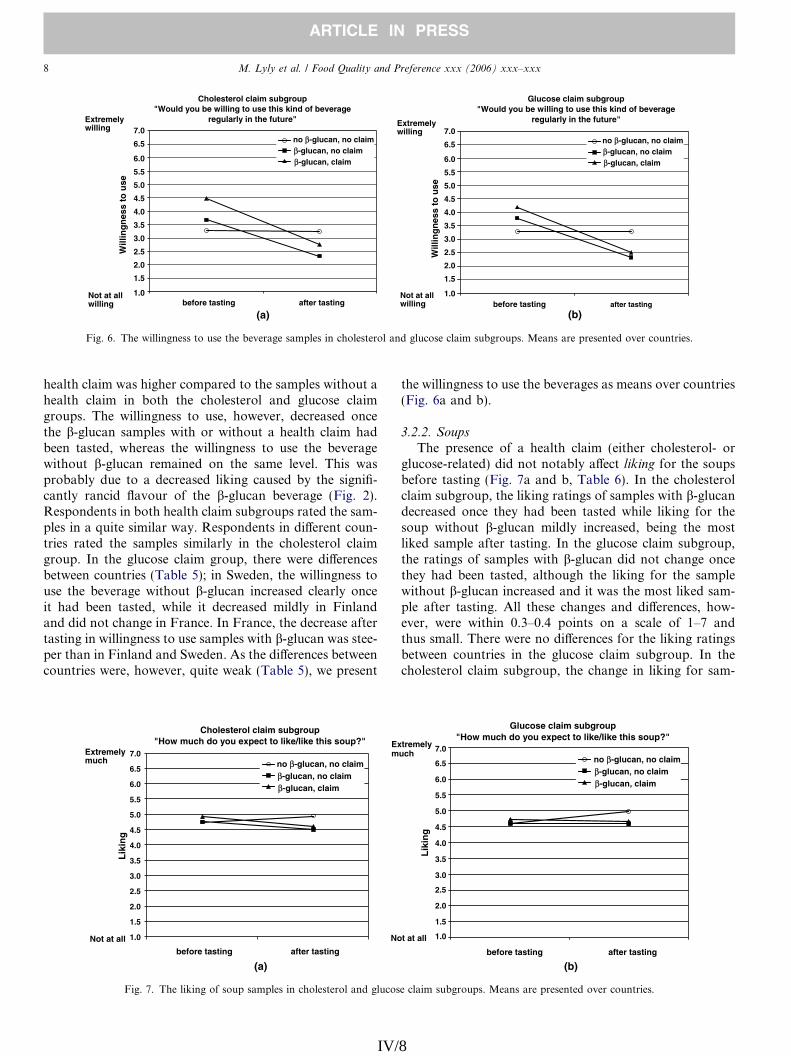
Cholesterol claim subgroup"Would you be willing to use this kind of beverage
regularly in the future"
before tasting after tasting
Glucose claim subgroup"Would you be willing to use this kind of beverage
regularly in the future"
before tasting after tasting
Will
ing
nes
s to
use
Extremely willing
Not at allwilling
Will
ing
nes
s to
use
Extremely willing
Not at allwilling
no β-glucan, no claim β-glucan, no claimβ-glucan, claim
no β-glucan, no claim β-glucan, no claimβ-glucan, claim
(b)(a)
1.0
1.5
2.0
2.5
3.0
3.5
4.0
4.5
5.0
5.5
6.0
6.5
7.0
1.0
1.5
2.0
2.5
3.0
3.5
4.0
4.5
5.0
5.5
6.0
6.5
7.0
Fig. 6. The willingness to use the beverage samples in cholesterol and glucose claim subgroups. Means are presented over countries.
8 M. Lyly et al. / Food Quality and Preference xxx (2006) xxx–xxx
ARTICLE IN PRESS
health claim was higher compared to the samples without ahealth claim in both the cholesterol and glucose claimgroups. The willingness to use, however, decreased oncethe b-glucan samples with or without a health claim hadbeen tasted, whereas the willingness to use the beveragewithout b-glucan remained on the same level. This wasprobably due to a decreased liking caused by the signifi-cantly rancid flavour of the b-glucan beverage (Fig. 2).Respondents in both health claim subgroups rated the sam-ples in a quite similar way. Respondents in different coun-tries rated the samples similarly in the cholesterol claimgroup. In the glucose claim group, there were differencesbetween countries (Table 5); in Sweden, the willingness touse the beverage without b-glucan increased clearly onceit had been tasted, while it decreased mildly in Finlandand did not change in France. In France, the decrease aftertasting in willingness to use samples with b-glucan was stee-per than in Finland and Sweden. As the differences betweencountries were, however, quite weak (Table 5), we present
Cholesterol claim subgroup"How much do you expect to like/like this soup?"
1.0
1.5
2.0
2.5
3.0
3.5
4.0
4.5
5.0
5.5
6.0
6.5
7.0
before tasting after tasting
Lik
ing
Extremely much
Not at all
Exm
No
no β-glucan, no claim β-glucan, no claimβ-glucan, claim
(a)
Fig. 7. The liking of soup samples in cholesterol and glucos
IV/
the willingness to use the beverages as means over countries(Fig. 6a and b).
3.2.2. Soups
The presence of a health claim (either cholesterol- orglucose-related) did not notably affect liking for the soupsbefore tasting (Fig. 7a and b, Table 6). In the cholesterolclaim subgroup, the liking ratings of samples with b-glucandecreased once they had been tasted while liking for thesoup without b-glucan mildly increased, being the mostliked sample after tasting. In the glucose claim subgroup,the ratings of samples with b-glucan did not change oncethey had been tasted, although the liking for the samplewithout b-glucan increased and it was the most liked sam-ple after tasting. All these changes and differences, how-ever, were within 0.3–0.4 points on a scale of 1–7 andthus small. There were no differences for the liking ratingsbetween countries in the glucose claim subgroup. In thecholesterol claim subgroup, the change in liking for sam-
Glucose claim subgroup"How much do you expect to like/like this soup?"
before tasting after tasting
Lik
ing
tremely uch
t at all
no β-glucan, no claim β-glucan, no claimβ-glucan, claim
(b)
1.0
1.5
2.0
2.5
3.0
3.5
4.0
4.5
5.0
5.5
6.0
6.5
7.0
e claim subgroups. Means are presented over countries.
8

Table 6Summary of repeated measures ANOVA on soups
F rating time(df1,df2 = 1, 233–252)
F sample(df1,df2 = 2, 466–504)
F rating time · sample(df1,df2 = 2, 466–504)
F rating time ·sample · country(df1,df2 = 4, 466–504)
F sample · country(df1,df2 = 4, 466–504)
Liking
Cholesterol claim subgroup 2.5 8.7*** 10.4*** 3.8** 2.7*Glucose claim subgroup 1.5 5.7** 6.9** 0.6 0.8
Beneficiality
Cholesterol claim subgroup 15.6*** 61.4*** 13.2*** 1.6 0.3Glucose claim subgroup 0.6 27.9*** 4.7* 0.7 1.2
Willingness to use
Cholesterol claim subgroup 36.2*** 11.7*** 17.0*** 2.7* 3.8**Glucose claim subgroup 3.1* 6.4** 7.9*** 1.7 1.2
Sample means differences between samples with no b-glucan (no health claim), with b-glucan (no health claim), and with b-glucan (with health claim).Rating time means difference between results before and after tasting.*P < 0.05, **P < 0.01, ***P < 0.001.
M. Lyly et al. / Food Quality and Preference xxx (2006) xxx–xxx 9
ARTICLE IN PRESS
ples after tasting changed mildly in Finland and France.However, the differences between samples in liking werewithin 0.3–0.4 points on a scale of 1–7 and thus small. InSweden, however, the sample without b-glucan was clearlythe most liked after tasting. As these differences were quiteweak overall (Table 6), we present all of the countriestogether (Fig. 7a and b).
The soups with a cholesterol or glucose claim were per-ceived to be significantly more beneficial than the othersamples before and after tasting (Fig. 8a and b, Table 6),although the perceived beneficiality of the b-glucan samplewith a health claim decreased after tasting. Respondents indifferent countries rated the samples similarly in bothhealth claim subgroups.
Before tasting, the willingness to use the samples withhealth claims was higher than that of the samples withouta health claim, although the difference was very small in theglucose claim subgroup (Fig. 9a and b, Table 6). Once thesamples had been tasted, the willingness to use the sampleswith b-glucan decreased in both claim subgroups whereas itremained on the same level for the sample without b-glu-
Cholesterol claim subgroup"How beneficial is this soup for you?"
1.0
1.5
2.0
2.5
3.0
3.5
4.0
4.5
5.0
5.5
6.0
6.5
7.0
before tasting after tasting
Ben
efic
ialit
y
Not at all beneficial
Extremely beneficial
Exbe
Nobe
no β-glucan, no claim β-glucan, no claimβ-glucan, claim
(a)
Fig. 8. The perceived beneficiality of soup samples in cholesterol an
IV/9
can. Respondents in the glucose claim subgroup rated thesamples similarly in different countries. In the cholesterolclaim subgroup in Finland and France, all of the sampleswere ranked equally once they had been tasted, while inSweden, the sample without b-glucan was ranked the high-est once it had been tasted. The statistical interactionsbetween the rating time, sample and country were quiteweak (Table 6) mainly due to larger differences betweenthe samples after tasting in Sweden. Thus, in Fig. 9a andb all of the countries and claim subgroups are presentedtogether.
3.3. The effect of age and gender on the willingness to use
beverages and soups
We kept both claim subgroups together in these analysesin order to investigate the effect of age and gender on thewillingness to use beverages and soups. For this analysis,respondents were first divided into three age groups ofequal size using cut-points of 33.3% and 66.7%; 48 yearsold or less, 49–60 years old and 61 years old or older. There
Glucose claim subgroup"How beneficial is this soup for you?"
1.0
1.5
2.0
2.5
3.0
3.5
4.0
4.5
5.0
5.5
6.0
6.5
7.0
before tasting after tasting
Ben
efic
ialit
y
tremely neficial
t at allneficial
no β-glucan, no claim β-glucan, no claimβ-glucan, claim
(b)
d glucose claim subgroups. Means are presented over countries.

Cholesterol claim subgroup"Would you be willing to use this kind of soup
regularly in the future"
1.0
1.5
2.0
2.5
3.0
3.5
4.0
4.5
5.0
5.5
6.0
6.5
7.0
before tasting after tasting
Will
ing
nes
s to
use
no β-glucan, no claim β-glucan, no claimβ-glucan, claim
Extremely willing
Not at allwilling
Will
ing
nes
s to
use
Extremely willing
Not at allwilling
Glucose claim subgroup"Would you be willing to use this kind of soup
regularly in the future"
1.0
1.5
2.0
2.5
3.0
3.5
4.0
4.5
5.0
5.5
6.0
6.5
7.0
before tasting after tasting
no β-glucan, no claim
β-glucan, no claimβ-glucan, claim
(a) (b)
Fig. 9. The willingness to use the soup samples in cholesterol and glucose claim subgroups. Means are presented over countries.
10 M. Lyly et al. / Food Quality and Preference xxx (2006) xxx–xxx
ARTICLE IN PRESS
were differences between countries in the ratings of bever-age samples in different age groups (sample · country · agegroup F(8,1150) = 2.1; P = 0.035). In further analyses inFinland and France, age did not affect the willingness touse beverage samples. In Sweden, the willingness to usebeverage samples was different in the three age groups(sample · age group F(4,368) = 3.8; P = 0.005). Moreover,the change in the willingness of older Swedish respondentsto use the beverages (rating time · age group F(2,184) =5.0; P = 0.008) before and after tasting was not as steepas that of the younger respondents. In further statisticalanalyses, Tukey’s test showed the two oldest age groupsto be more willing to use the b-glucan beverage that hada health claim once they tasted it when compared to theyoungest age group (F(2,186) = 12.2; P < 0.001). In addi-tion, the respondents in the oldest age group were morewilling to use the beverage without b-glucan than the youn-gest group (F(2,86) = 4.5; P = 0.012) was. Age was notfound to have any effect on the willingness to use the soupsin any of the three countries.
We also tested the possible effect of gender on the will-ingness to use the beverages and soups with health claims.In beverages, statistically significant interactions for ratingtime (before and after tasting), sample and gender werefound (F(2,1150) = 4.5; P = 0.011) but the differencesbetween women and men were very small; the maximumdifference was approximately 0.3 points on a scale of 1–7.In soups, statistically significant differences were foundfor rating time, countries and gender (F(2,510) = 3.5;P = 0.031). Further analyses showed that in Finland andFrance there were no differences in the willingness of menand women to use the soups. In Sweden, statistical interac-tion was found for the rating time and gender(F(1,364) = 4.7; P = 0.032). The decrease in the willingnessof women to use the soups with b-glucan once they tastedthem was steeper than that of men, and the increase in thewillingness of men to use soup without b-glucan once theytasted it was steeper than that of women. These differences
IV/
and changes were, however, only between 0.1 and 0.3points on a scale of 1–7.
3.4. The effect of health motivation factors on willingness to
use beverages and soups with different health claims
In the background questionnaire, respondents wereasked about their personal need to pay attention to theirblood cholesterol and glucose levels. The willingness touse b-glucan beverages and soups with health claims wascorrelated with these ratings. For beverages, quite lowbut significant correlations were found (Table 7), indicatingthat those whose need to pay attention to their blood cho-lesterol or whose glucose values were high were more will-ing to use the beverage with a cholesterol claim/glucoseclaim. The correlations were higher after tasting. Thosewho needed to pay attention to their blood cholesterol werealso willing to use beverages with a glucose claim, althoughnot the other way around. No significant correlations werefound between the willingness to use soups with healthclaims and personal health motivation factors.
3.5. Willingness to pay for beverages and soups with health
claims
The respondents were asked to rate before and after tast-ing the maximum price for trying and the maximum price for
regularly purchasing the product. Before tasting, respon-dents were willing to pay the most for beverages and soupswith b-glucan and a health claim (Table 8). These pricesestimated before tasting decreased after tasting, however,regardless the presence of the claim; the decrease wasapproximately 20–25% for beverages with b-glucan and/or a health claim and approximately 15% for soups withb-glucan and/or a health claim. In addition, the pricesfor beverages and soups without b-glucan decreased,although the drop of the prices was much weaker, beingroughly 10%. For beverages, the sample without b-glucan
10

Table 7Correlation coefficients between the willingness to use beverages and soups with health claims before and after tasting and personal health motivationfactors (N = 266–309)
Cholesterol claim Glucose claim
Before tasting After tasting Before tasting After tasting
Beverage
Need to pay attention to Blood cholesterol levels 0.21** 0.27** 0.15** 0.18**Blood glucose levels 0.1 0.16** 0.22** 0.30**
Soup
Need to pay attention to Blood cholesterol levels 0.03 0.07 0.02 �0.02Blood glucose levels 0.05 0.05 0.02 �0.04
*P < 0.05, **P < 0.01, ***P < 0.001.
Table 8The maximum prices (€) respondents would be ready to pay for trying and for regularly buying beverages and soups with and without health claim and/orb-glucan
Trying price (€) Regular price (€)
Before tasting After tasting Change % Before tasting After tasting Change %
Beverage, both claims together
No b-glucan, no claim 1.04 (0.02) 0.99 (0.02) �4.4 1.04 (0.02) 0.95 (0.02) �8.6b-Glucan, no claim 1.09 (0.02) 0.89 (0.02) �18.7 1.08 (0.02) 0.82 (0.01) �24.0b-Glucan, claim 1.20 (0.02) 0.94 (0.02) �22.1 1.20 (0.02) 0.87 (0.02) �27.1
Soup, both claims together
No b-glucan, no claim 2.24 (0.04) 2.01 (0.03) �10.3 2.31 (0.03) 2.07 (0.03) �10.1b-Glucan, no claim 2.23 (0.03) 1.93 (0.03) �13.8 2.31 (0.03) 1.99 (0.03) �14.0b-Glucan, claim 2.35 (0.04) 1.97 (0.03) �16.1 2.42 (0.03) 2.05 (0.03) �15.2
Means (SE in brackets) are presented over countries and both claim subgroups. The change in prices is expressed as percentual change.
M. Lyly et al. / Food Quality and Preference xxx (2006) xxx–xxx 11
ARTICLE IN PRESS
obtained the highest price ratings after tasting, whereas insoups, the claim helped to maintain the price of the soupthat contained b-glucan at the same level with the priceof the sample without b-glucan. It seems that the pricesestimated before tasting, based on product descriptions,were somewhat unrealistic. For beverages, the decrease inliking due to an off-flavour had a strong effect on the pricesrespondents were willing to pay.
We also correlated the willingness to use with the will-ingness to pay for trying/regularly buying the product(Table 4). Significant but moderate correlations were foundbetween the willingness to use and buying price and thesecorrelations were higher for regular purchases than for justsampling the product. Based on these correlations, it seemsthat the willingness to use is, at some level, related to thewillingness to buy. Yet a high willingness to use does notnecessarily mean that consumers would accept higher pricefor buying the product since the correlations were onlymoderate.
4. Discussion
As expected, the taste of the product played a key roleand strongly affected the willingness to use the product.Especially for the beverages containing b-glucan, this wasshown very clearly; the perceived beneficiality and a will-ingness to use them decreased distinctly once the producthad been tasted and probably stemmed from a decrease
IV/
in liking caused by the rancid off-flavour detected by sen-sory laboratory panel. Oat has a relatively high fat contentcompared to other cereals and the rancid off-flavour in theb-glucan beverages was most likely caused by lipid oxida-tion due to unfavourable conditions (Welch, 1995). In thesoups the rancid flavour was not detected.
Thus, the expectations did not meet the actual taste andtherefore the ratings decreased after tasting. For the soups,the decrease in liking and therefore also in the willingnessto use after tasting was only mild. The importance of tastein food choice has been proven in many earlier studies (e.g.,Arvola et al., 1999; Glanz et al., 1998; Tepper & Trail,1998). The results from a laddering study about functionalfoods showed that taste was more important in Denmarkand England than the products’ health benefits (Jonas &Beckmann, 1998). Taste was also found to be the mostimportant determinant for use of a nutraceutical product(Cardello & Schutz, 2003).
Health claims had a significant but small positive effecton expected liking in beverages, although once they hadbeen tasted, the liking for beverages with b-glucandecreased and the beverage containing no b-glucan wasthe best liked. The fact that the faulty taste of the productcannot be compensated with health effects has also estab-lished by Tuorila and Cardello (2002). For soups, thehealth claims did not have a notable effect on liking beforeor after tasting and in general, all soup samples were likedequally.
11

12 M. Lyly et al. / Food Quality and Preference xxx (2006) xxx–xxx
ARTICLE IN PRESS
As liking is strongly correlated with the willingness touse a product, the willingness to use beverages with b-glu-can and their perceived beneficiality decreased once theproducts had been tasted, although it still remained on ahigher level for the beverage with a health claim when com-pared to the beverage without a claim. Thus, a health claimprovided a small, but significant, added value to the bever-age with b-glucan.
For soups, a corresponding effect was noted as thehealth claims had a positive effect on their perceived bene-ficiality, mainly before tasting. The decrease of beneficialityand willingness to use soups with claims after tasting wasvery mild compared to the beverages, mostly because ofthe better accepted sensory quality of them. In addition,it appears that the health claims in soups had a differenteffect than the effect they had in beverages, which is dis-cussed later.
The differences between countries in liking and willing-ness to use were quite small; for beneficiality, there wereno differences amongst the countries. French consumersseemed to be more critical in liking and willingness to usethe beverage with b-glucan. This finding is logical in lightof the results found by Rozin, Fischler, Imada, Sarubin,and Wrezesniewski (1999); among Belgians, French, Amer-icans and Japanese consumers, they discovered that Frenchconsumers seek the most pleasure from food and leastfavour fat-/salt-reduced diets.
The effect of age on the willingness to use was only seenin Sweden amongst the consumers tasting beverages. Theyoungest consumer group was clearly the least willing touse beverages with health claims. Naturally, aged consum-ers are more potentially users of functional foods (Boweret al., 2003; Poulsen, 1999) as they are more likely to havepersonal or other experience with health problems, such ashigh cholesterol levels. Younger consumers are not yetmotivated to improve or maintain their health with func-tional foods. Interestingly, this effect was only seen in Swe-den and only in beverages, not in soups. It must, however,be kept in mind that our respondents were mainly olderthan 40, with the mean age being more than 50. It couldbe that Swedish consumers pay special attention to theirhealth later than French and Finnish consumers do, whoalready start to focus on these matters in their 40s or at ayounger age.
No major significant differences between the willingnessof men and women to use the beverages or soups withhealth claims were found. This finding is contradictory tothose of other studies that state that women are generallymore likely to be potential users of functional foods (Boweret al., 2003; Poulsen, 1999) and to more likely have a higherpurchase intent for a spread with a health benefit label(Bower et al., 2003). On the other hand, this is similar toVerbeke (2005) finding as he did not find gender to deter-mine the acceptance of functional food concept. In addi-tion, de Jong, Ocke, Branderhorst, and Friele (2003) didnot find differences between the use of cholesterol-loweringmargarine between men and women. On the other hand, in
IV/1
a study by Anttolainen et al. (2001), men more commonlyused plant sterol margarine than women did. One possibleexplanation could be that women are not as interested incholesterol-lowering products as men more often have ele-vated serum cholesterol values and suffer from more oftenfrom coronary heart disease.
A weak but significant association was found betweenpersonal health motivation factors and the willingness touse beverages with health claims. If consumers had a per-sonal perceived need to pay attention to blood cholesterolor blood glucose values, they were more willing to use bev-erages with cholesterol or glucose claims, especially aftertasting the product. Similarly, Tuorila et al. (1998) havefound a connection between how concerned consumersare about their fibre intake and their acceptance of snackfoods labelled ‘high fibre’. Interestingly, these kinds of sig-nificant relations were not found at all for soups. In addi-tion, age did not have any effect, either, and soups weregenerally rated differently from beverages, as described ear-lier. Hence, the product type itself has an important effecton the attitudes towards the health claim attached to it.As found by Urala and Lahteenmaki (2003), functionalfoods are perceived to be a member of a particular productcategory (e.g., beverages) and not as a homogenous groupover different product categories. De Jong et al. (2003) con-cluded that the use of functional foods or supplements isdependent on the type of product; therefore, consumercharacteristics cannot be generalised over different foodor supplement groups. Our study indicates that the resultsare different and dependent on the product itself, a bever-age or a soup. One possible additional explanatory factorcould also be the differences in the acceptance/liking ofbeverages and soups with b-glucan. Because b-glucan bev-erages generally had a lower level of pleasantness than b-glucan soups, additional motivation to use them wasrequired to compensate for their unfavourable taste. Thesame does not hold true for soups, however, as their tastewas acceptable and they were easy to like. Consequently,health motivation factors only correlated with b-glucanbeverages.
Some of the differences in the responses that wereobtained for soups and beverages can easily be explainedby the more accepted sensory quality of the soup. This doesnot, however, explain the differences in expectations (thesituation before tasting) where beverages with healthclaims were rated to have higher additional values thansoups. Kahkonen, Tuorila, and Hyvonen (1995) suggestedin the discussion of their results that, in Finland, soup isconsidered to be a low-fat food. Generalising this findingto other countries could partly explain the results of whyhealth claims provided so little added value to soups.Low-fat foods are often considered to be healthy (Oakes,2003) and a health claim cannot easily make this kind ofproduct more attractive. Bech-Larsen and Grunert (2003)found in their study that yoghurt and juice were perceivedto be healthy as such and these products did not benefitfrom enrichment with functional components. In a study
2

M. Lyly et al. / Food Quality and Preference xxx (2006) xxx–xxx 13
ARTICLE IN PRESS
by Levy, Derby, and Roe (1997), yoghurt as a product didnot benefit from a calcium and osteoporosis health claim,as this information was already recognised by the respon-dents; therefore it did not provide added value informationand did not consequently have any effect on consumers.Thus, the nutritional quality of the carrier product primar-ily determines the perceived healthiness of the food, andthe effect of health claims and functional ingredients is lessimportant (Bech-Larsen & Grunert, 2003).
The trying and regularly buying prices respondents esti-mated before tasting were rather unrealistic as the decreaseafter tasting was rather notable, particularly for beverageswith b-glucan, although the faulty sensory quality of thebeverage definitely had an influence on this. The decreasein prices was steepest for beverages with a health claim.Because of the health claim, consumers expected morefrom the product and, as the consumers were willing topay more from the health effect, they respectively expectedreasonable product quality to offset the higher price. In thestudy by Jonas and Beckmann (1998), Danish respondentswere not willing to pay more for a product with functionalbenefits. Among Finnish consumers, the price of functionalfoods plays an important role in buying decisions (Ollilaet al., 2004). A high price could be an obstacle to buy aproduct, although it did not necessarily prevent those con-sumers who perceived a special health-related need to usefunctional foods and believed that these products are effec-tive from buying it. In our study, the moderate correlationsbetween the willingness to use and willingness to pay indi-cate some link between these two variables but also differ-ences in reactions to these factors. A higher price is notnecessarily accepted, even though the willingness of con-sumers to use a product would be high.
5. Conclusions
The taste of products had a strong influence on the will-ingness of a consumer to use them. Health claims providedadditional value to beverages and soups, although the sen-sory quality of the products was more important. Soupsreceived different responses than beverages did, partlydue to differences in sensory quality, but also partly dueto the crucial role that the carrier product type itself plays.Age or gender did not notably affect the willingness to useproducts with health claims. The product quality has to befaultless for the additional value provided by health effectsto exist, thus increasing the willingness of consumers to usethe products and pay reasonable prices for buying them.
Acknowledgements
We would like to thank Findus R&D AB, Sweden, forproviding us with the soup samples and CEBA AB, Swedenfor providing us with the beverage samples. We would liketo thank Plateforme Alimentec/Les Maisons du Gout inFrance and Findus R&D AB in Sweden for performingthe consumer study in France and Sweden. This work be-
IV/
longs to the Tailored Technologies for Future Foods(TTFF) research program at VTT Biotechnology. Thisstudy has been financially supported by the EuropeanCommunity (EC) within the 5th Framework Programmeunder the Quality of Life and Management of Living re-sources, Key Action 1: Project ‘‘Design of foods with im-proved functionality and superior health effects usingcereal betaglucans’’, QLRT-2000-00535.
References
Aaron, J. I., Mela, D. J., & Evans, R. E. (1994). The influences ofattitudes, beliefs and label information on perceptions of reduced-fatspread. Appetite, 22(1), 25–37.
Anttolainen, M., Luoto, R., Uutela, A., Boice, J. D., Blot, W. T.,McLaughlin, J. K., et al. (2001). Characteristics of users and nonusersof plant sterol margarine in Finland: An approach to study functionalfoods. Journal of the American Dietetic Association, 101(11),1365–1368.
Arvola, A., Lahteenmaki, L., & Tuorila, H. (1999). Predicting the intent topurchase unfamiliar and familiar cheeses: The effects of attitudes,expected liking and food neophobia. Appetite, 32(1), 113–126.
Bech-Larsen, T., & Grunert, K. G. (2003). The perceived healthiness offunctional foods. A conjoint study of Danish, Finnish and Americanconsumers’ perception of functional foods. Appetite, 40(1), 9–14.
Bhaskaran, S., & Hardley, F. (2002). Buyers beliefs, attitudes andbehaviour: Foods with therapeutic claims. Journal of Consumer
Marketing, 19(7), 591–606.Bower, J., Saadat, M. A., & Whitten, C. (2003). Effect of liking,
information and consumer characteristics on purchase intention andwilligness to pay more for a fat spread with a proven health benefit.Food Quality and Preference, 14(1), 65–74.
Braaten, J. T., Wood, P. J., Scott, F. W., Riedel, K. D., Poste, L. M., &Collins, M. W. (1991). Oat gum lowers glucose and insulin after anoral glucose load. American Journal of Clinical Nutrition, 53(6),1425–1430.
Cardello, A. V., & Schutz, H. G. (2003). The importance of taste and otherproduct factors to consumer interest in nutraceutical products: Civilianand military comparisons. Journal of Food Science, 68(4), 1519–1524.
de Jong, N., Ocke, M. C., Branderhorst, H. A. C., & Friele, R. (2003).Demographic and lifestyle characteristics of functional food consum-ers and dietary supplement users. British Journal of Nutrition, 89(2),273–281.
European Opinion Research Group EEIG (2003). The health of adults inthe European Unionhttp://europa.eu.int/comm/health/ph_informa-tion/documents/ebs_183.7_en.pdf.
Glanz, K., Basil, M., Maibach, E., Goldberg, J., & Snyder, D. (1998).Why Americans eat what they do: Taste, nutrition, cost, convenienceand weight control concerns as influences on food consumption.Journal of the American Dietetic Association, 98(10), 1118–1126.
Jonas, M. S., & Beckmann, S. C. (1998). Functional foods: Consumerperceptions in Denmark and England. MAPP Working paper 55. TheAarhus School of Business, Aarhus.
Kahkonen, P., Tuorila, H., & Hyvonen, L. (1995). Dairy fat content andserving temperature as determinants of sensory and hedonic charac-teristics in cheese soup. Food Quality and Preference, 6(2), 127–133.
Kahkonen, P., Tuorila, H., & Rita, H. (1996). How information enhancesacceptability of a low-fat spread. Food Quality and Preference, 7(2),87–94.
Kearney, M., Gibney, M. J., Martinez, J. A., de Almeida, M. D. V.,Friebe, D., Zunft, H. J. F., et al. (1997). Perceived need to alter eatinghabits among representative samples of adults from all member statesof the European Union. European Journal of Clinical Nutrition,
51(Suppl. 2), S30–S35.Lawless, H., & Heymann, H. (1998). Sensory evaluation of food. Principles
and practices. New York: Chapman & Hall.
13

14 M. Lyly et al. / Food Quality and Preference xxx (2006) xxx–xxx
ARTICLE IN PRESS
Levy, A. S., Derby, B. M., & Roe, B. E. (1997). Consumer impacts ofhealth claims: An experimental study Division of Market Studies,Center for Food and Applied Nutrition, Food and Drug Administra-tion, USAhttp://www.cfsan.fda.gov/~dms/hclm-rpt.html.
Lyly, M., Salmenkallio-Marttila, M., Suortti, T., Autio, K., Poutanen, K.,& Lahteenmaki, L. (2003). Influence of oat b-glucan preparations onthe perception of mouthfeel and on rheological properties in beverageprototypes. Cereal Chemistry, 80(5), 536–541.
Lyly, M., Salmenkallio-Marttila, M., Suortti, T., Autio, K., Poutanen, K.,& Lahteenmaki, L. (2004). The sensory characteristics and rheologicalproperties of soups containing oat and barley b-glucan before andafter freezing. Lebensmittel-Wissenschaft und -Technologie, 37(7),749–761.
Margetts, B. M., Martinez, J. A., Saba, A., Holm, L., & Kearney, M.(1997). Definitions of ‘healthy’ eating: A pan-EU survey of consumerattitudes to food nutrition and health. European Journal of Clinical
Nutrition, 51(Suppl. 2), S23–S29.McFarlane, T., & Pliner, P. (1997). Increasing willingness to taste novel
foods: Effects on nutrition and taste information. Appetite, 28(3),227–238.
Menrad, K. (2003). Market and marketing of functional food in Europe.Journal of Food Engineering, 56(2–3), 181–188.
Oakes, M. (2003). Differences in judgements of food healthfulness byyoung and elderly women. Food Quality and Preference, 14(3), 227–236.
Ollila, S., Tuomi-Nurmi, S., & Immonen, H. (2004). Finnish consumers’willingness to buy functional foods. VTT Research Notes 2241. Espoo(in Finnish, abstract in English).
Poulsen, J. B. (1999). Danish consumers’ attitudes towards functionalfoods. MAPP Working paper 62. The Aarhus School of Business,Aarhus.
Ripsin, C. M., Keenan, J. M., Jacobes, D. R., Elmer, P. J., Wlech, R. R.,Van Horn, L., et al. (1992). Oat products and lipid lowering. A meta-analysis. Journal of the American Medical Association, 267(24),3317–3325.
Roininen, K., Lahteenmaki, L., & Tuorila, H. (1999). Quantification ofconsumer attitudes to health and hedonic characteristics of foods.Appetite, 33(1), 71–88.
IV/
Rozin, P., Fischler, C., Imada, S., Sarubin, A., & Wrezesniewski, A.(1999). Attitudes to food and the role of food in life in the USA, Japan,Flemish Belgium and France: Possible implications for the diet-healthdebate. Appetite, 33(2), 163–180.
Shepherd, R., Sparks, P., Bellier, S., & Raats, M. (1991). The effects ofinformation on sensory ratings and preferences: The importance ofattitudes. Food Quality and Preference, 3(2), 147–155.
Sloan, A. E. (2001). Growing demand for dietary fibre. Functional Foods &Nutraceuticals(September–October), 12–13.
Tepper, B. J., & Trail, A. C. (1998). Taste or health: A study on consumeracceptance of corn chips. Food Quality and Preference, 9(4), 267–272.
Tuorila, H., Andersson, A., Martikainen, A., & Salovaara, H. (1998).Effect of product formula information and consumer characteristics inthe acceptance of a new snack food. Food Quality and Preference, 9(5),313–320.
Tuorila, H., & Cardello, A. V. (2002). Consumer responses to an off-flavorin juice in the presence of specific health claims. Food Quality and
Preference, 13(7–8), 561–569.Urala, N., & Lahteenmaki, L. (2003). Reasons behind consumers’
functional food choices. Nutrition & Food Science, 33(4), 148–158.Urala, N., & Lahteenmaki, L. (2004). Attitudes behind consumers’
willingness to use functional foods. Food Quality and Preference, 15(7–8), 798–803.
Verbeke, V. (2005). Consumer acceptance of functional foods: Socio-demographic, cognitive and attitudinal determinants. Food Quality and
Preference, 16(1), 45–57.Welch, R. W. (1995). The chemical composition of oats. In R. W. Welch
(Ed.), The oat crop. Product and utilization (pp. 279–320). London:Chapman & Hall.
Wood, P. J., Braaten, J. T., Scott, F. W., Riedel, K. D., Wolynetz, M. S.,& Collins, M. W. (1994). Effect of dose and modification of viscousproperties of oat gum on plasma glucose and insulin following an oralglucose load. British Journal of Nutrition, 72(5), 731–743.
Zunft, H. J. F., Friebe, D., Seppelt, B., de Graaf, C., Margetts, B.,Schmitt, A., et al. (1997). Perceived benefits of healthy eating among anationally-representative sample of adults in the European Union.European Journal of Clinical Nutrition, 51(Suppl. 2), S41–S46.
14

Published by
Series title, number and report code of publication
VTT Publications 594 VTT�PUBS�594
Author(s) Lyly, Marika Title
Added β-glucan as a source of fibre for consumers
Abstract The intake of dietary fibre does not currently meet the recommendations in many Western countries, and it is important to find new ways to increase its intake. β-glucan is a good option for fibre enrichment, because of its proven capability to reduce elevated blood cholesterol levels and balance blood glucose and insulin response after meals.
The general aim of this thesis was to investigate whether providing foods enriched with β-glucan would be a feasible strategy for improving consumers� dietary fibre intake.
The results showed that Finnish respondents considered dietary fibre important for their health, although it was not spontaneously mentioned as an element of a health-promoting diet. A group of respondents overestimated their dietary fibre intake compared to their actual intake. This misperception can be an obstacle to improving the quality of the diet.
Adding oat and barley β-glucan into beverages and ready-to-eat soups affected their sensory characteristics by making them thicker and suppressing some flavour attributes with increasing concentrations of β-glucan. Low molecular weight β-glucan was easier to add into products at higher concentrations compared to high molecular weight β-glucan as regards the lower viscosity-producing capability and thus more feasible sensory characteristics. However, attention should also be paid to the importance of the high molecular weight of β-glucan in terms of its physiological efficacy. Freezing did not affect the sensory characteristics of soups containing β-glucan.
Connecting a health claim to beverages and soups with added β-glucan increased their perceived benefit value, but liking for the products was the strongest determinant for the willingness to use them. It does not seem likely that consumers would be ready to pay much extra for functional beverages and soups.
In conclusion, the present study demonstrated that Finnish consumers perceive fibre to be important for their health. Beverages and soups with added β-glucan were feasible regarding their sensory properties and thus would be potential carrier products for added β-glucan. Liking for the products was the most important factor affecting the consumers� willingness to use these foods.
Keywords dietary fibres, β-glucans, fibre enrichment, consumer acceptance, functional food, beverages, soups, sensory quality, healthy diet
ISBN 951�38�6700�5 (soft back ed.) 951�38�6701�3 (URL: http://www.vtt.fi/publications/index.jsp)
Series title and ISSN Project number
VTT Publications 1235�0621 (soft back ed.) 1455�0849 (URL: http://www.vtt.fi/publications/index.jsp)
Date Language Pages Price February 2006 English 96 p. + app. 50 p. C
Contact Sold by VTT Technical Research Centre of Finland Tietotie 2, P.O. Box 1000, FI-02044 VTT, Finland Phone internat. +358 20 722 111 Fax +358 20 722 7071
VTT Technical Research Centre of Finland P.O.Box 1000, FI-02044 VTT, Finland Phone internat. +358 20 722 4404 Fax +358 20 722 4374

VTT PU
BLICATIO
NS 594
Added ßglucan as a source of fibre for consum
ersM
arika Lyly
Tätä julkaisua myy Denna publikation säljs av This publication is available from
VTT VTT VTTPL 1000 PB 1000 P.O. Box 1000
02044 VTT 02044 VTT FI02044 VTT, FinlandPuh. 020 722 4404 Tel. 020 722 4404 Phone internat. +358 20 722 4404Faksi 020 722 4374 Fax 020 722 4374 Fax +358 20 722 4374
ISBN 951– 38– 6700– 5 (soft back ed.) ISBN 951– 38– 6701– 3 (URL: http://www.vtt.fi/inf/pdf/)ISSN 1235– 0621 (soft back ed.) ISSN 1455– 0849 (URL: http://www.vtt.fi/inf/pdf/)
ESPOO 2006 VTT PUBLICATIONS 594
Marika Lyly
Added ßglucan as a source of fibrefor consumers
The intake of dietary fibre does not currently meet the recommendations inmany Western countries, and it is important to find new ways to increaseits intake. The aim of this thesis was to investigate whether providing foodsenriched with ßglucan would be a feasible strategy for improvingconsumers’ dietary fibre intake regarding the sensory properties andconsumer acceptance of these foods. ßglucan is a good option for fibreenrichment of foods because of its proven capability to reduce elevatedblood cholesterol levels and to balance blood glucose and insulin responseafter meals.
The study showed that dietary fibre had a positive image among Finnishrespondents and it was considered important for health. Beverages andsoups with added ßglucan were acceptable regarding their sensorycharacteristics, thus being feasible carrier products for ßglucan andproviding a possible nontraditional source of dietary fibre. Liking for theproducts with added ßglucan was the most important factor affecting thewillingness to use them, indicating that the sensory quality of products withadded dietary fibre with health benefits has to be acceptable, only thenconsumers are willing to buy them.