Embed Size (px)
Citation preview

The views expressed herein are those of the authors and do not necessarily reflect the views of CBBEP or other organizations that may have provided funding for this project.
ADCIRC Based Storm Surge Analysis of Sea Level Rise in the Corpus Christi Bay Area
Publication CBBEP – 86 Project Number – 1306
July 2013
Prepared by ARCADIS U.S., Inc.
630 Plaza Drive Suite 200
Highlands Ranch, Colorado 80129
Submitted to: Coastal Bend Bays & Estuaries Program
1305 N. Shoreline Blvd. Ste 205 Corpus Christi, Texas 78401
Imagine the result
ADCIRC Based Storm Surge Analysis of Sea Level Rise in the Corpus Christi Bay Area in Texas
July 3, 2013

ADCIRC Based Storm Surge Analysis of Sea Level Rise in the Corpus Christi Bay Area in Texas
Prepared for:
The Nature Conservancy
Prepared by:
ARCADIS U.S., Inc. 630 Plaza Drive Suite 200 Highlands Ranch Colorado 80129 Tel 720 344 3500 Fax 720 344 3535
Our Ref.:
LA003056.0002
Date:
July 3, 2013 This document is intended only for the use of the individual or entity for which it was prepared and may contain information that is privileged, confidential and exempt from disclosure under applicable law. Any dissemination, distribution or copying of this document is strictly prohibited.
Funding for this model application was provided by The Nature Conservancy (TNC). Funding for TNC was provided through a grant from the Coastal Bend Bays and Estuaries Program. The SLAMM scenarios were provided by The Nature Conservancy of Florida.
TNC_ Corpus_Storm_Surge_07-15-2013.Docx i
Table of Contents
1. Introduction 1
2. ADCIRC Model Overview 3
3. Data Sources 7
4. ADCIRC Model Setup 8
4.1 ADCIRC Mesh 8
4.2 Application of Land Cover 8
4.3 Sea Level Rise 9
5. Results 10
5.1 Maximum Storm Surge Elevation 10
5.2 Analysis of Nonlinear SLR Effects 11
5.3 Inundation Limits 12
5.4 Marsh Attenuation Sensitivity Test 13
5.5 Water Surface Elevation Time Series 15
6. Conclusions 16
7. Recommendations 18
8. References 19
Tables
Table 1 Manning’s n and Z0 Values for SLAMM Land Cover Classes
Table 2 Manning’s n and Z0 Values for C-CAP Land Cover Classes
Table 3 SLAMM Sea Level Rise Scenarios (mm)
Table 4 Increase in Inundated Area for Future Scenarios Under Storm 343 Conditions
Figures
Figure 1: Theoretical Storm Track Applied for the Study
Figure 2: Location Map of the Corpus Christi Bay Area
Figure 3: ADCIRC Model Schematic

TNC_ Corpus_Storm_Surge_07-15-2013.Docx ii
Table of Contents
Figure 4: ADCIRC Mesh Domain and Topographic Contours (feet NAVD88)
Figure 5: ADCIRC Mesh Topographic Contours (feet NAVD88)
Figure 6: ADCIRC Mesh Topographic Contours (feet NAVD88) for the Study Domain
Figure 7: ADCIRC Mesh Resolution for the Study Domain
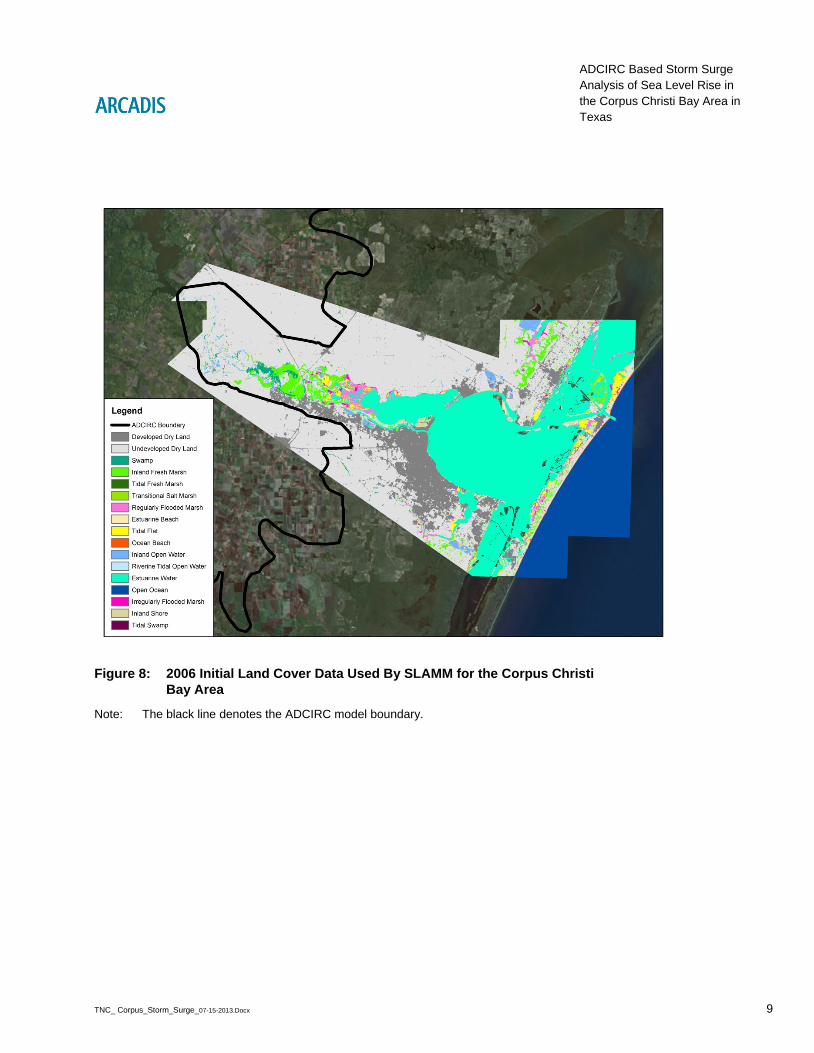
Figure 8: 2006 Initial Land Cover Data Used By SLAMM for the Corpus Christi Bay Area
Figure 9: SLAMM 2050 Scenario for the Corpus Christi Bay Area
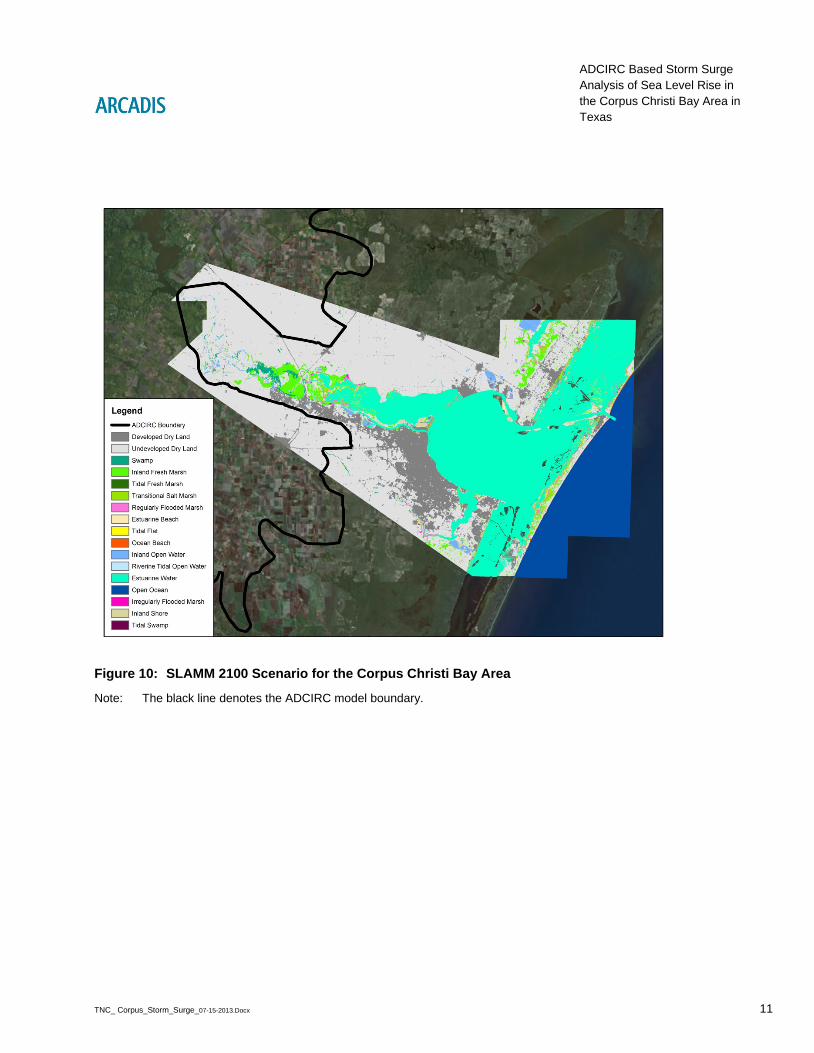
Figure 10: SLAMM 2100 Scenario for the Corpus Christi Bay Area
Figure 11: C-CAP Land Cover Data
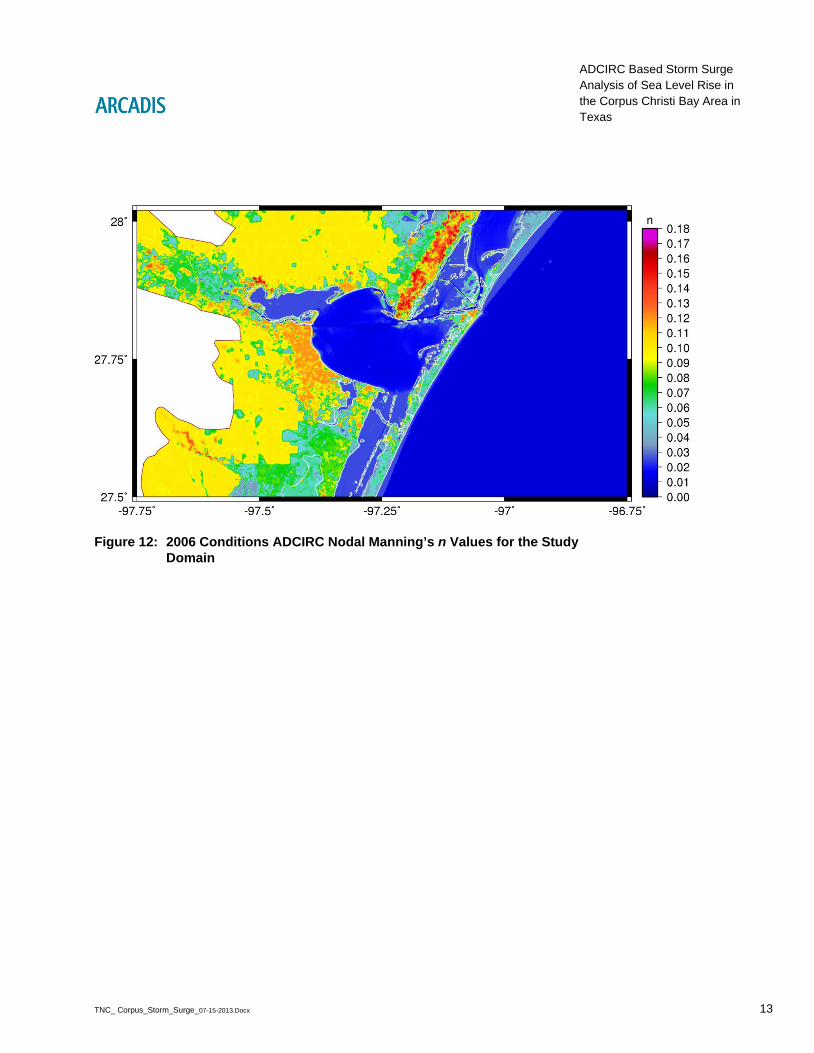
Figure 12: 2006 Conditions ADCIRC Nodal Manning’s n Values for the Study Domain
Figure 13: 2006 Conditions ADCIRC Nodal Z0 Values in the Study Domain for Southerly Winds
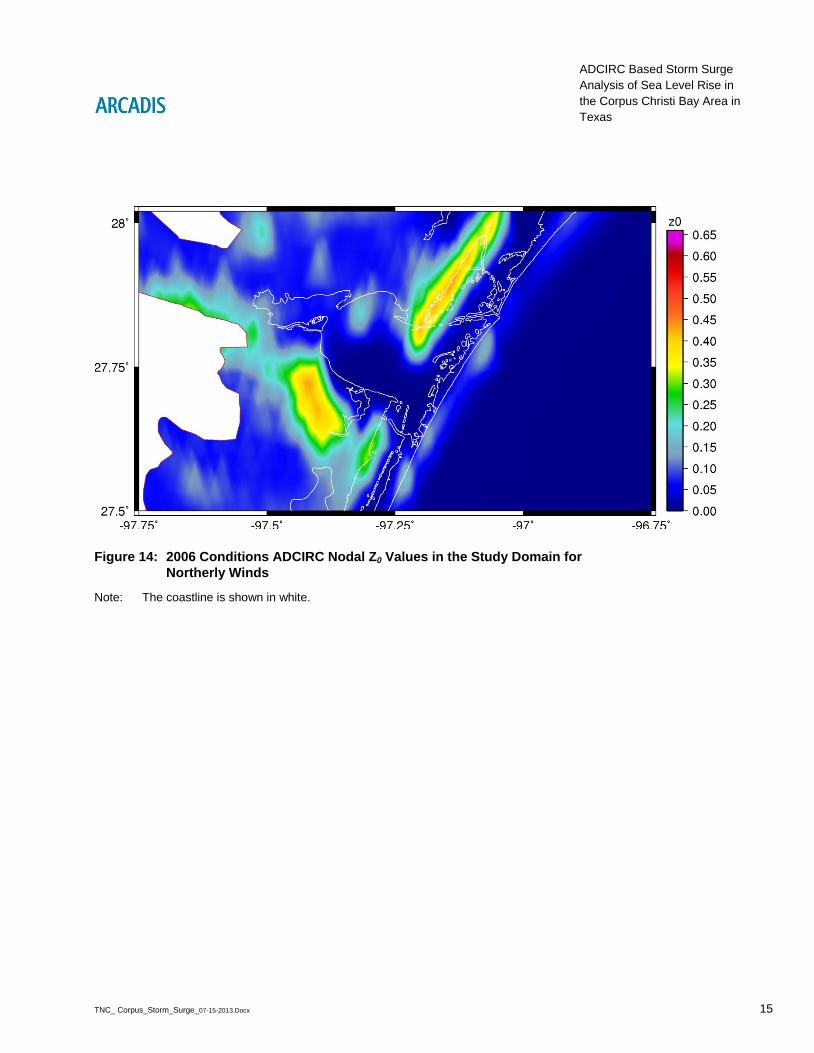
Figure 14: 2006 Conditions ADCIRC Nodal Z0 Values in the Study Domain for Northerly Winds
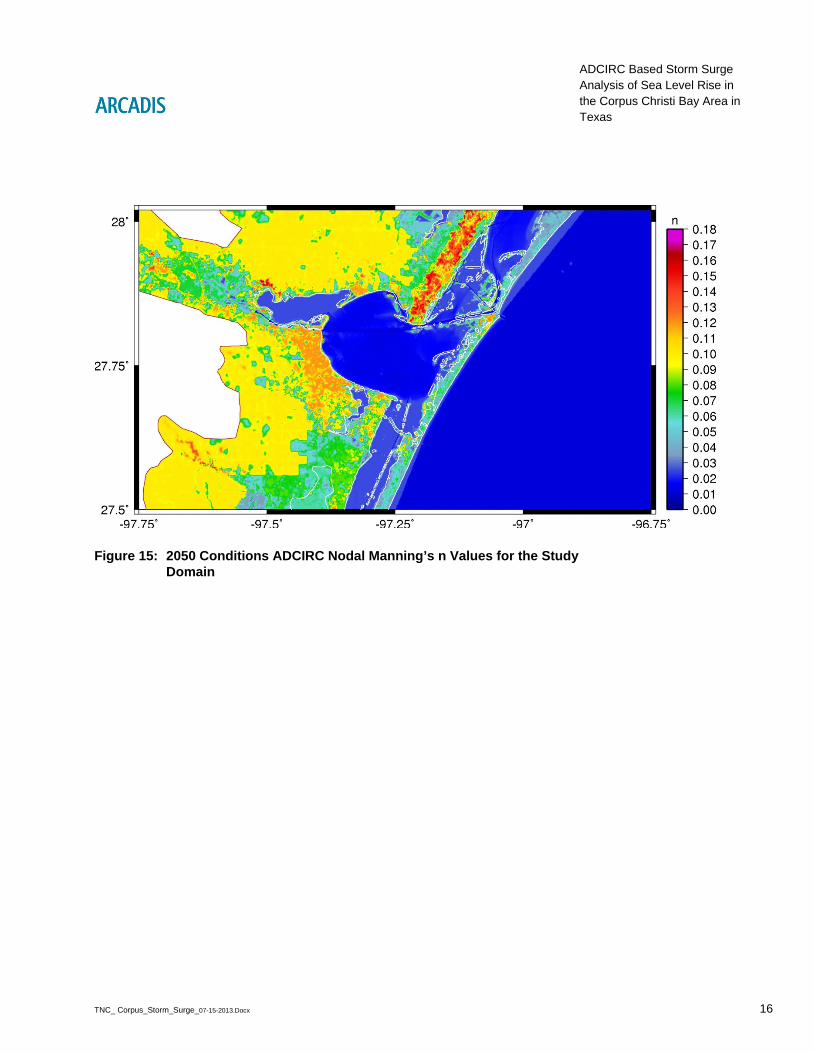
Figure 15: 2050 Conditions ADCIRC Nodal Manning’s n Values for the Study Domain
Figure 16: 2050 Conditions ADCIRC Nodal Z0 Values in the Study Domain for Southerly Winds
Figure 17: 2050 Conditions ADCIRC Nodal Z0 Values in the Study Domain for Northerly Winds
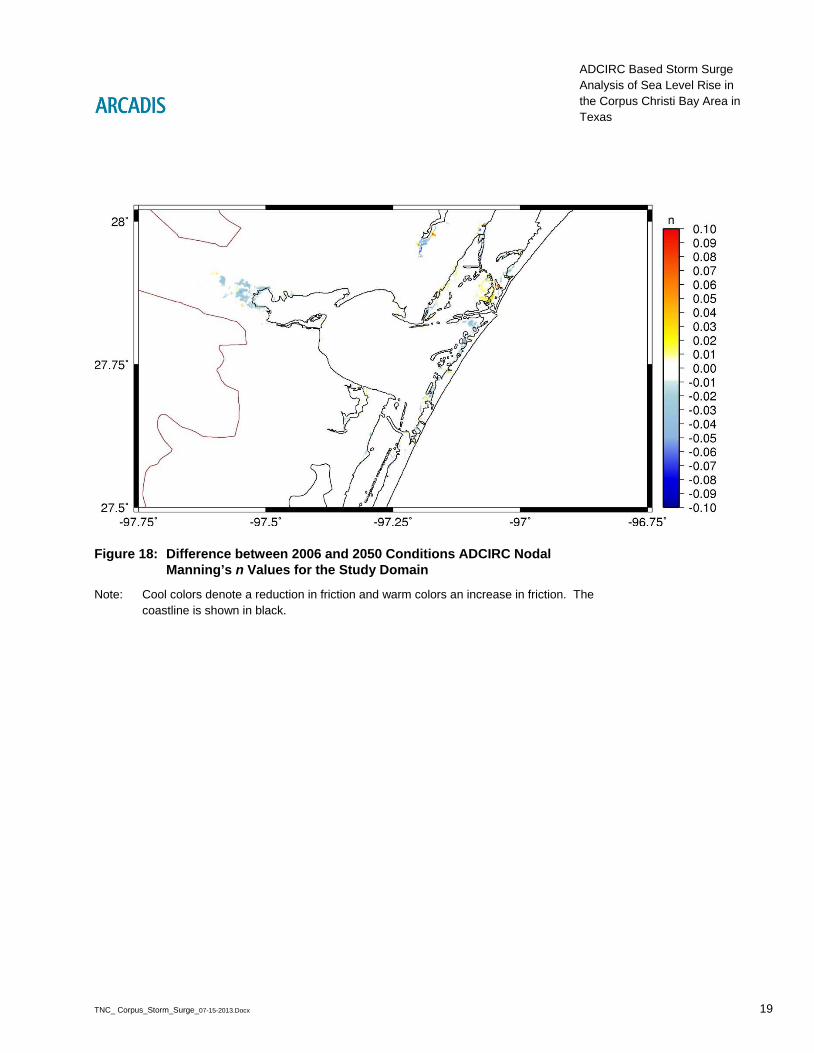
Figure 18: Difference between 2006 and 2050 Conditions ADCIRC Nodal Manning’s n Values for the Study Domain
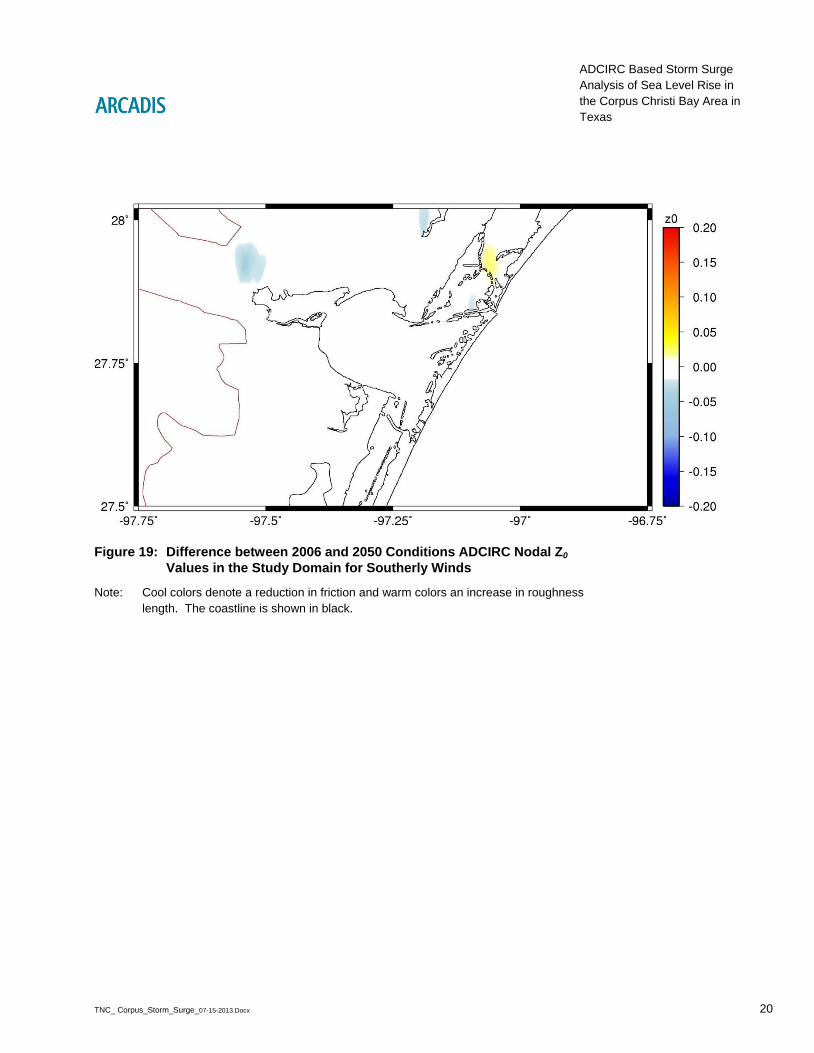
Figure 19: Difference between 2006 and 2050 Conditions ADCIRC Nodal Z0 Values in the Study Domain for Southerly Winds
Figure 20: Difference between 2006 and 2050 Conditions ADCIRC Nodal Z0 Values in the Study Domain for Northerly Winds
Figure 21: 2100 Conditions ADCIRC Nodal Manning’s n Values for the Study Domain
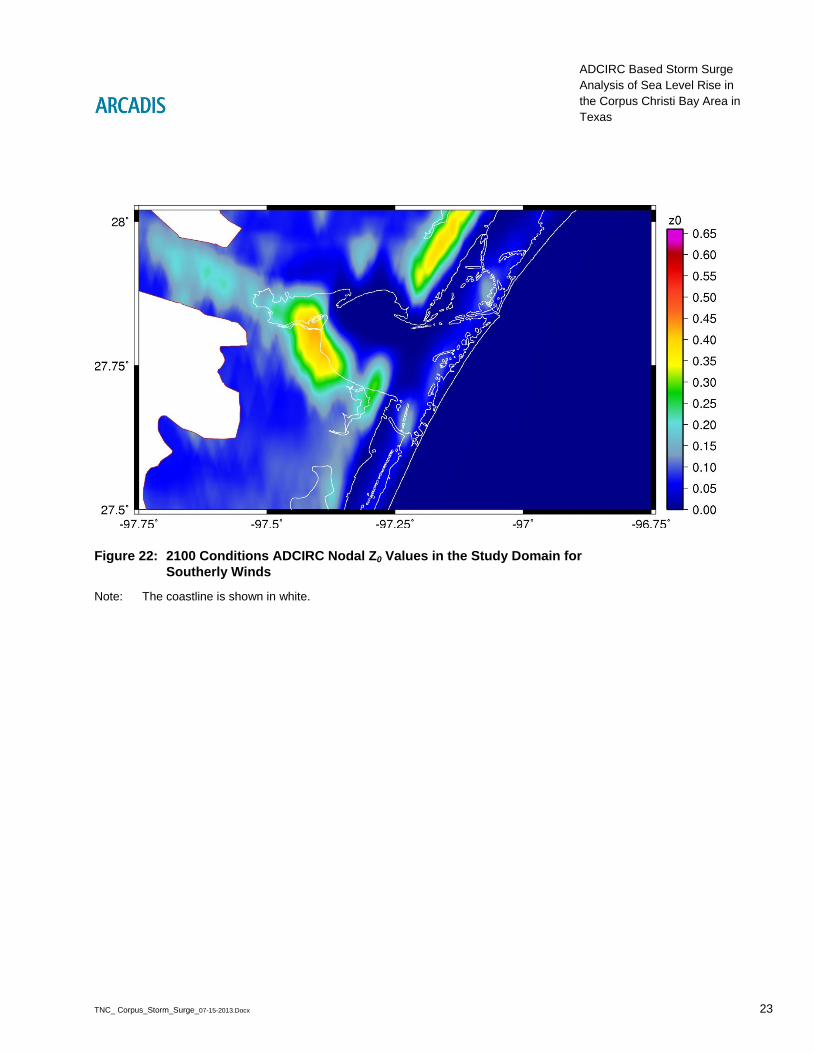
Figure 22: 2100 Conditions ADCIRC Nodal Z0 Values in the Study Domain for Southerly Winds
Figure 23: 2100 Conditions ADCIRC Nodal Z0 Values in the Study Domain for Northerly Winds
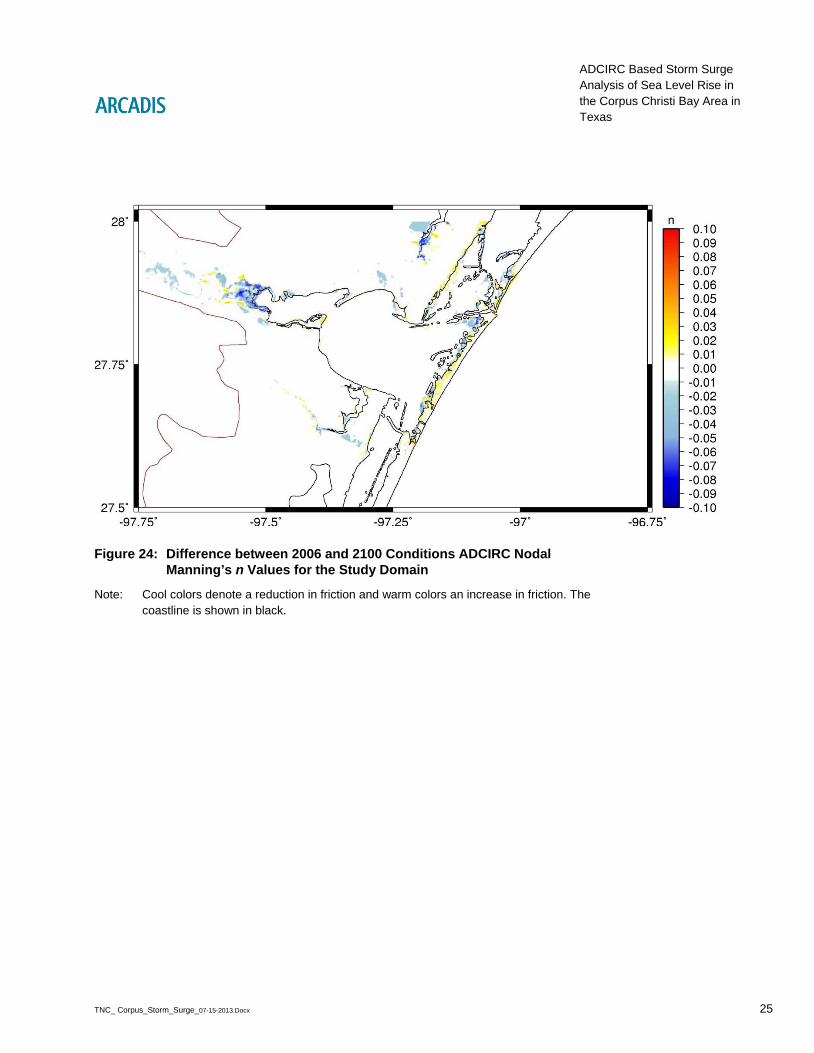
Figure 24: Difference between 2006 and 2100 Conditions ADCIRC Nodal Manning’s n Values for the Study Domain
Figure 25: Difference between 2006 and 2100 Conditions ADCIRC Nodal Z0 Values in the Study Domain for Southerly Winds
Figure 26: Difference between 2006 and 2100 Conditions ADCIRC Nodal Z0 Values in the Study Domain for Northerly Winds

TNC_ Corpus_Storm_Surge_07-15-2013.Docx iii
Table of Contents
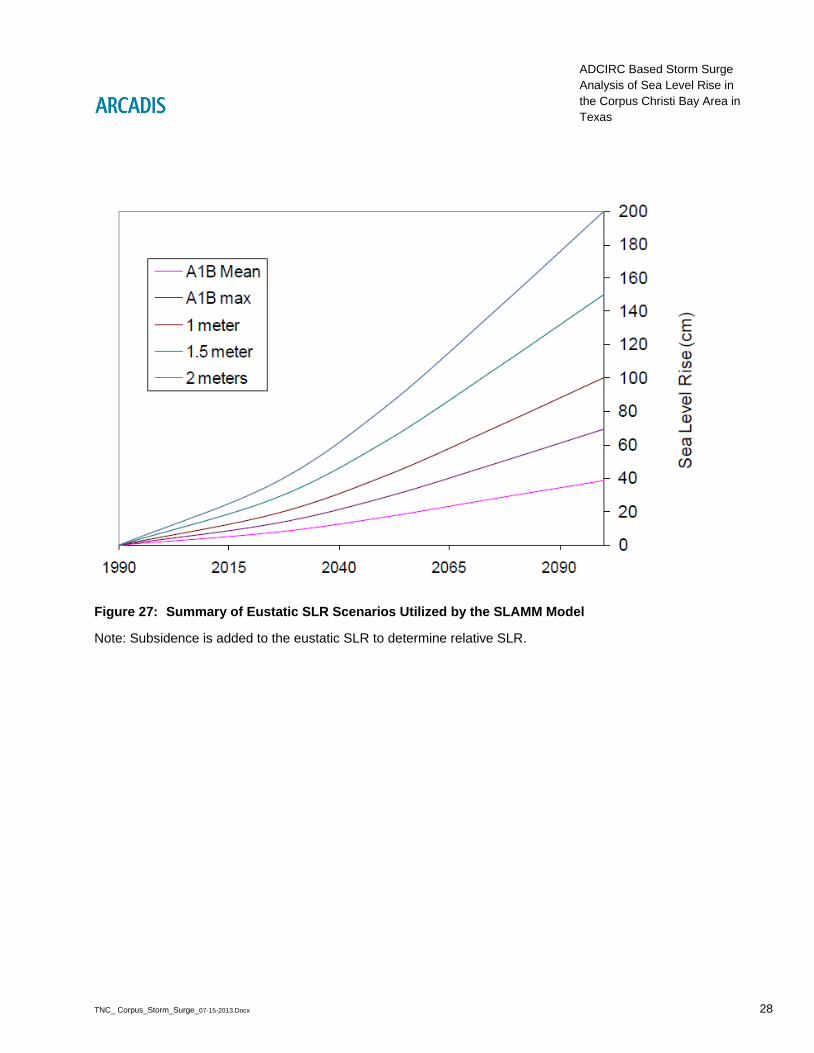
Figure 27: Summary of Eustatic SLR Scenarios Utilized by the SLAMM Model
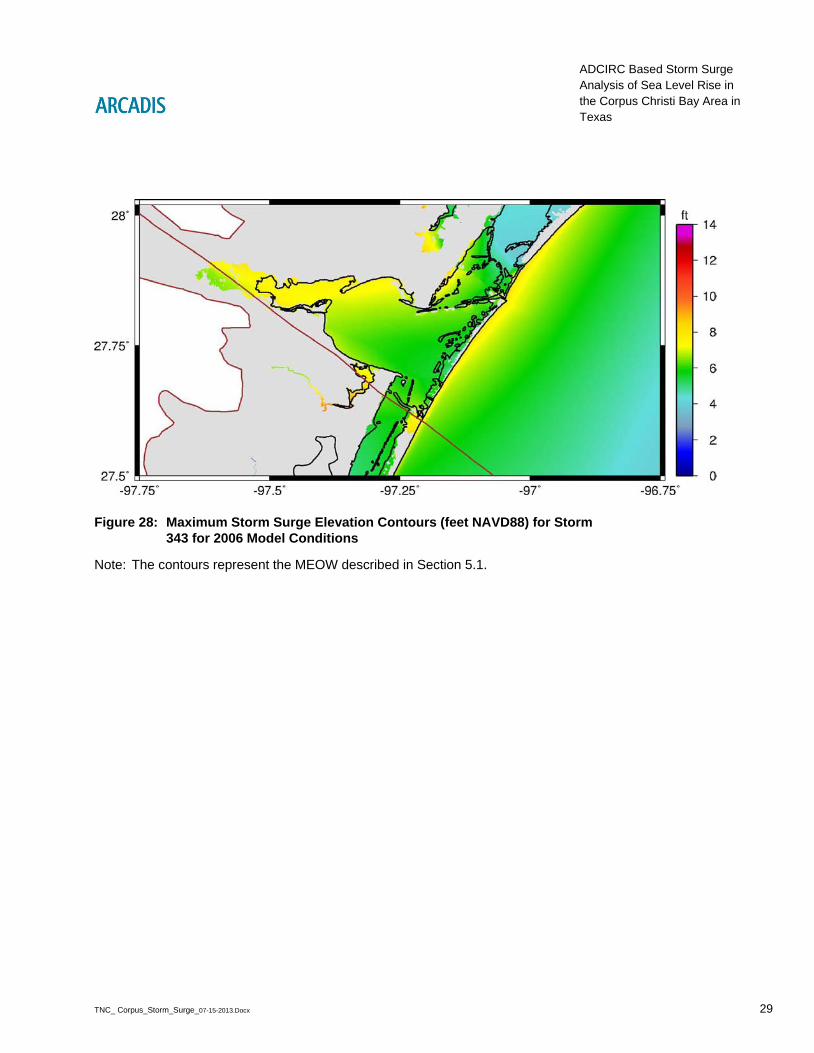
Figure 28: Maximum Storm Surge Elevation Contours (feet NAVD88) for Storm 343 for 2006 Model Conditions
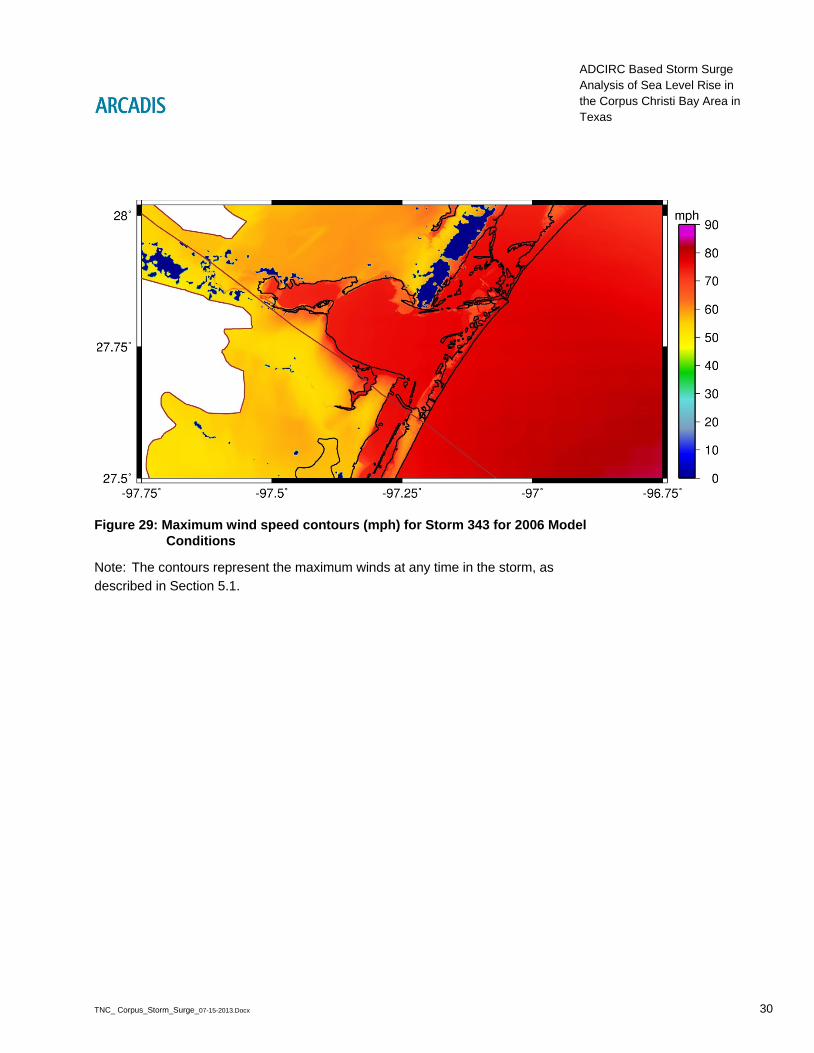
Figure 29: Maximum wind speed contours (mph) for Storm 343 for 2006 Model Conditions
Figure 30: Maximum Storm Surge Elevation Contours (feet NAVD88) for Storm 343 for 2050 Model Scenario
Figure 31: The Difference Between 2050 Maximum Storm Surge Elevation and 2006 Maximum Storm Surge Elevation for Storm 343
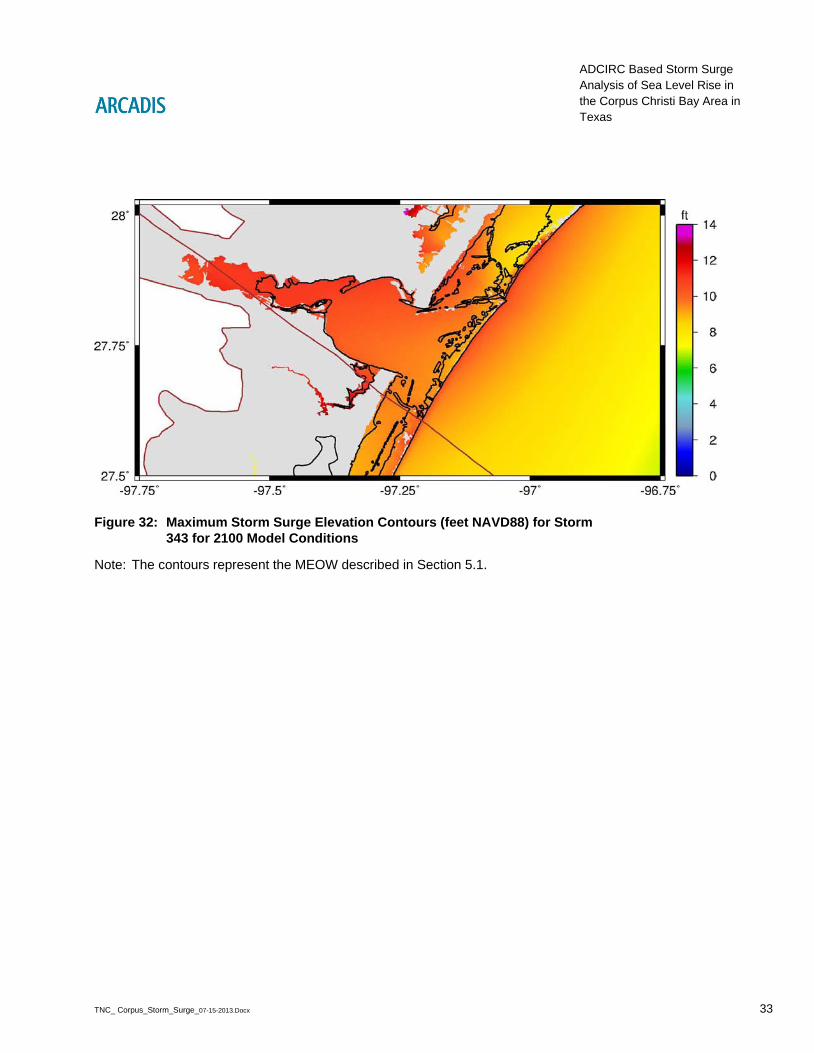
Figure 32: Maximum Storm Surge Elevation Contours (feet NAVD88) for Storm 343 for 2100 Model Conditions
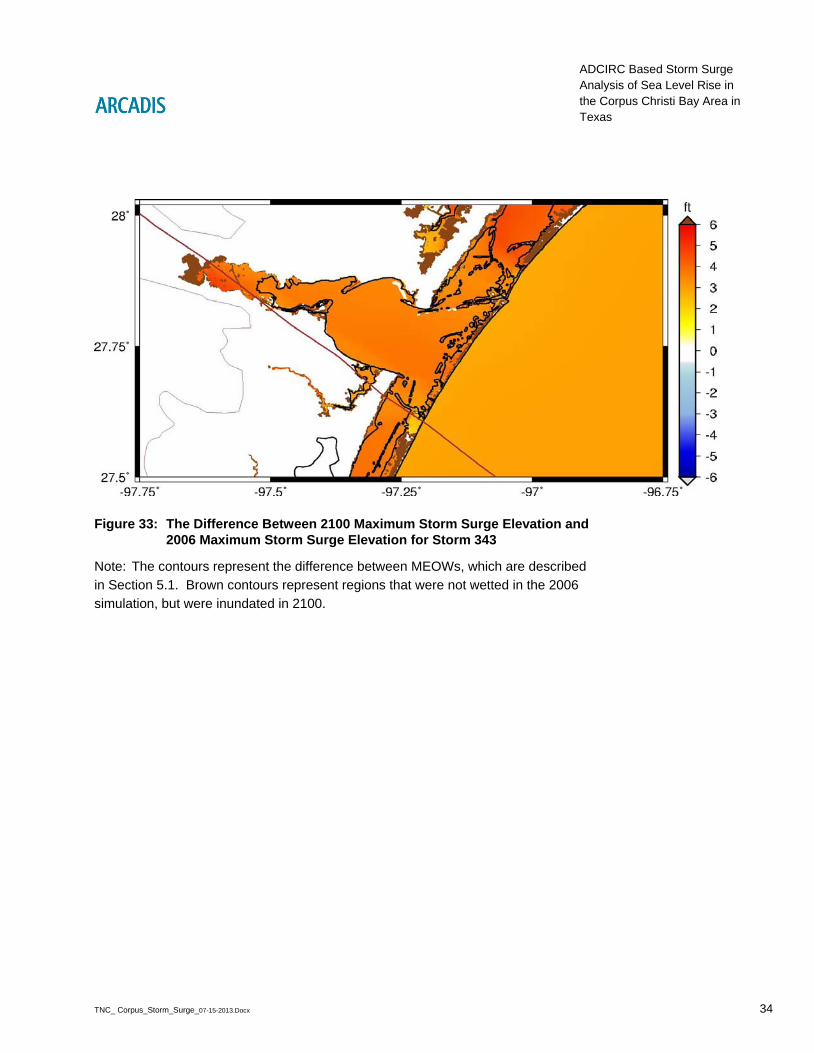
Figure 33: The Difference Between 2100 Maximum Storm Surge Elevation and 2006 Maximum Storm Surge Elevation for Storm 343
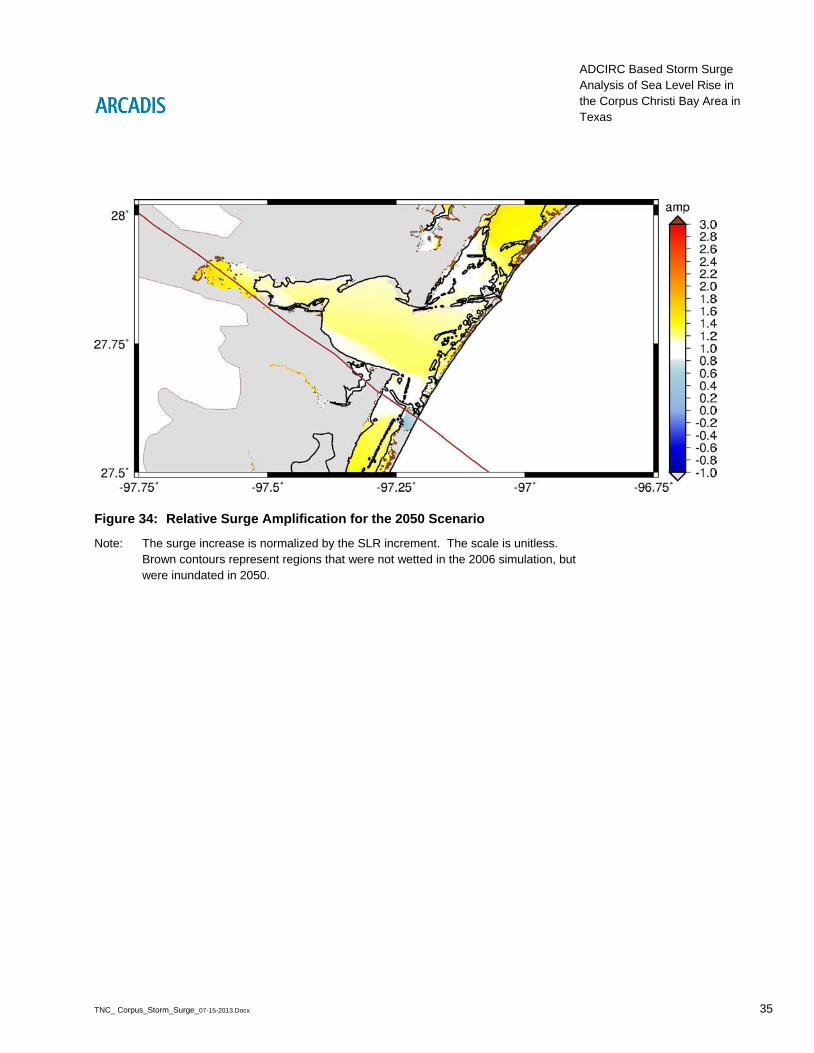
Figure 34: Relative Surge Amplification for the 2050 Scenario
Figure 35: Relative Surge Amplification for the 2100 Scenario
Figure 36: Difference between Original 2006 and 2006 Without Marsh Conditions ADCIRC Nodal Manning’s n Values for the Study Domain
Figure 37: Difference between Original 2006 and 2006 Without Marsh Conditions ADCIRC Nodal Z0 Values in the Study Domain for Southerly Winds
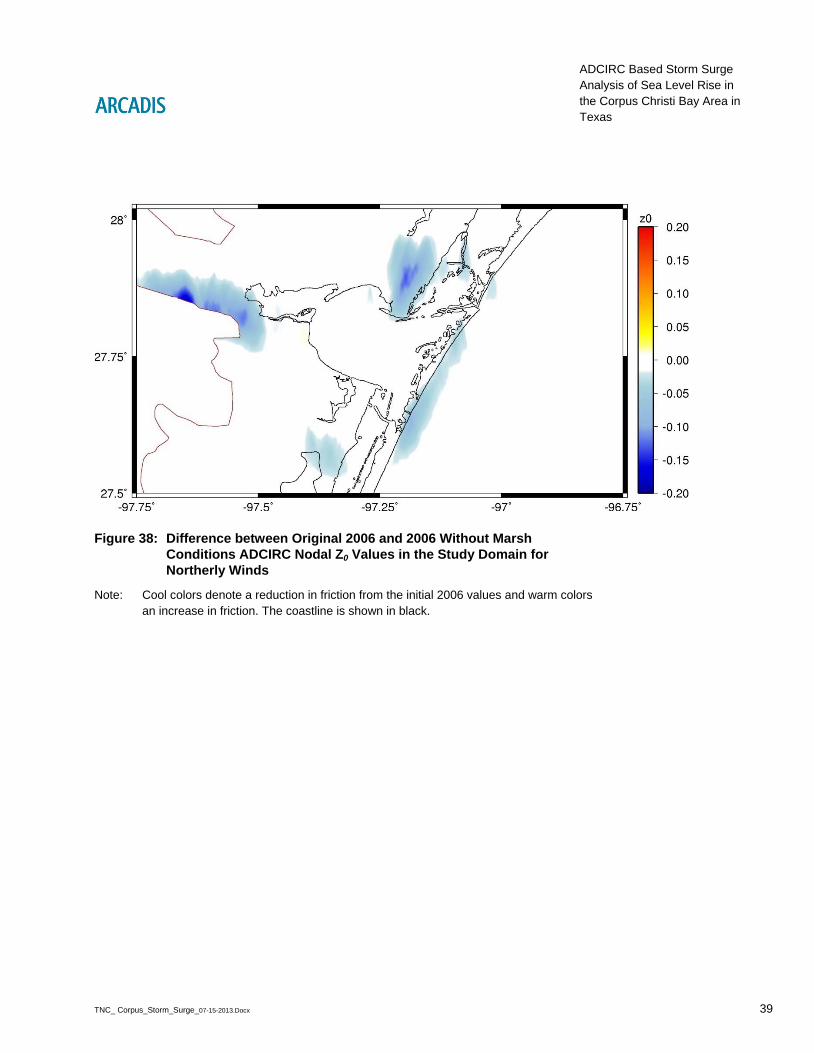
Figure 38: Difference between Original 2006 and 2006 Without Marsh Conditions ADCIRC Nodal Z0 Values in the Study Domain for Northerly Winds
Figure 39: Maximum Storm Surge Elevation Contours (feet NAVD88) for Storm 343 for a Marsh Loss Sensitivity Test for 2006 Conditions.
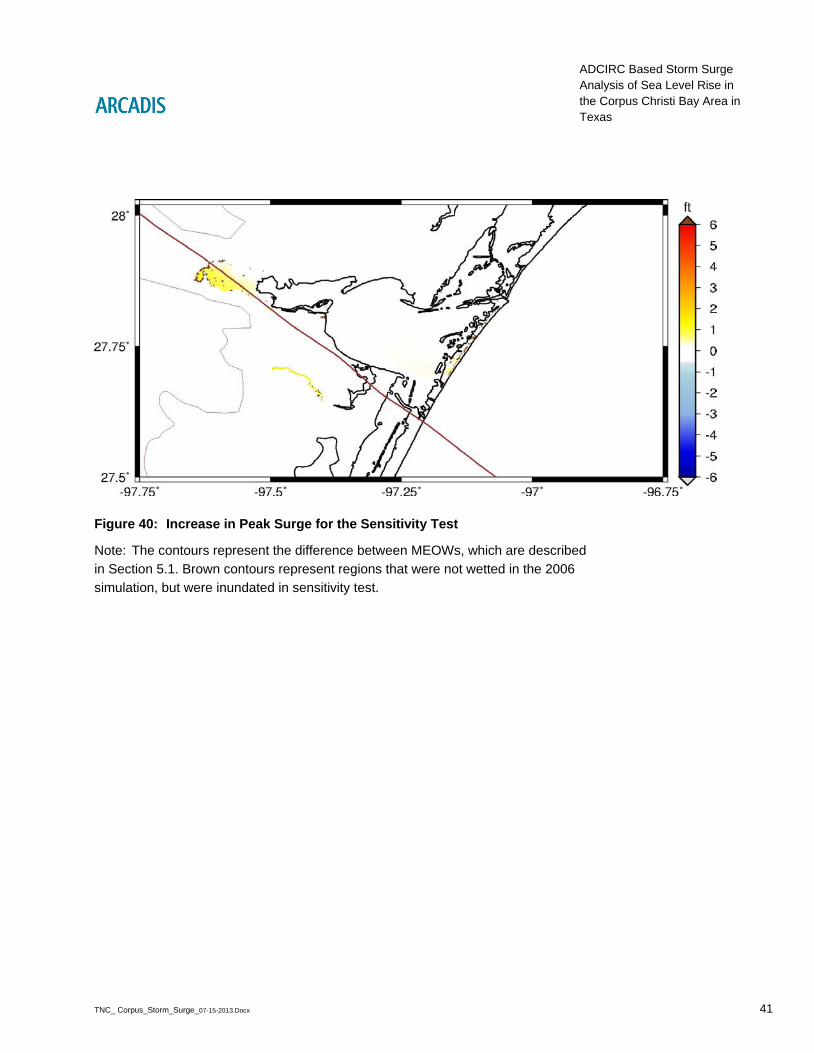
Figure 40: Increase in Peak Surge for the Sensitivity Test
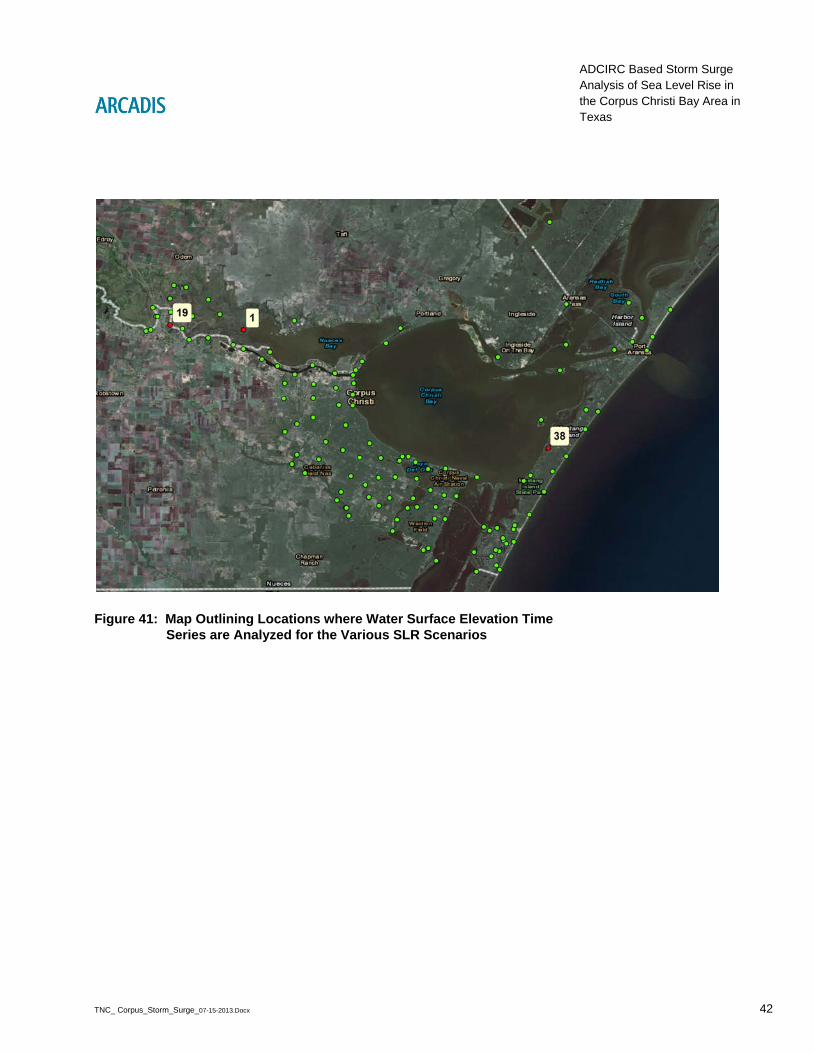
Figure 41: Map Outlining Locations where Water Surface Elevation Time Series are Analyzed for the Various SLR Scenarios
Figure 42: Water Surface Elevation Time Series for Location 1 at the Western Shore of Nueces Bay
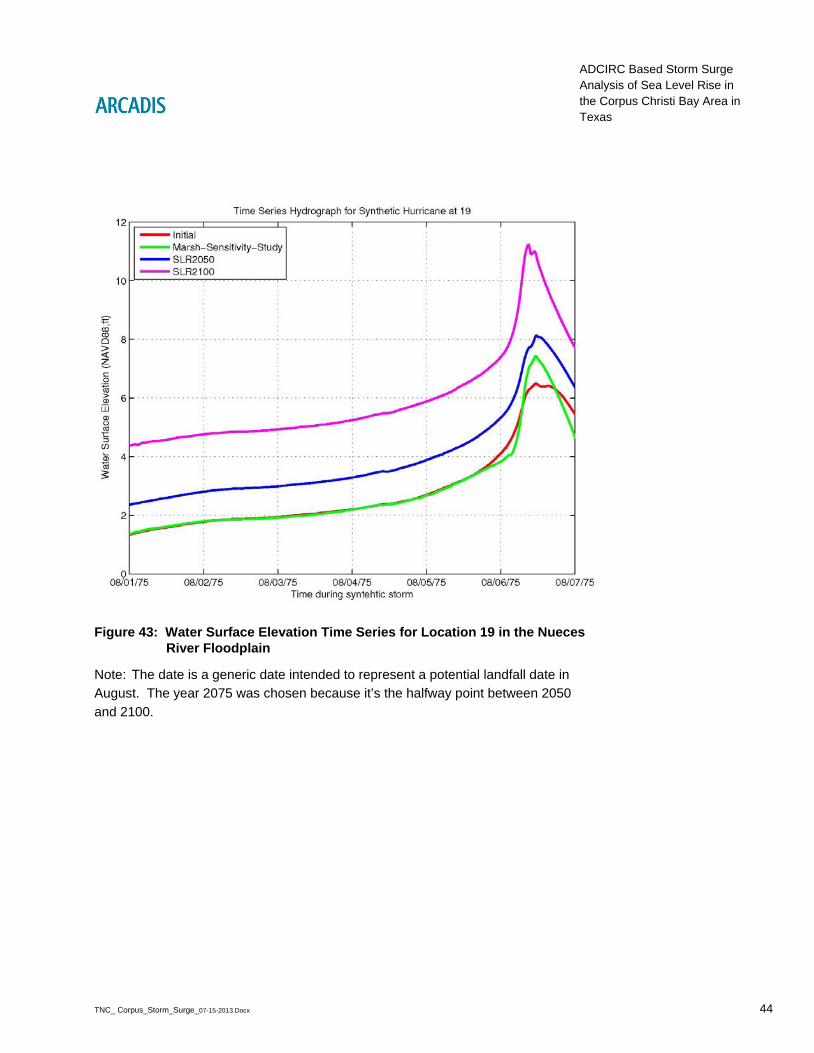
Figure 43: Water Surface Elevation Time Series for Location 19 in the Nueces River Floodplain
Figure 44: Water Surface Elevation Time Series for Location 38 at the Inland Edge of the Barrier Island
TNC_ Corpus_Storm_Surge_07-15-2013.Docx iv
Table of Contents
ACRONYMS AND ABBREVIATIONS
ADCIRC ADvanced CIRCulation
C-CAP Coastal Change Analysis Program
FEMA Federal Emergency Management Agency
FIS flood insurance study
HRD Hurricane Research Division
HWM high water marks
lidar light detection and ranging
LMSL local mean sea level
MEOW maximum envelope of water
MHHW mean higher high water
m meter
mph miles per hour
NLCD National Land Cover Dataset
NOAA National Oceanic and Atmospheric Administration
SLAMM Sea-Level Affecting Marshes Model
SLR sea level rise
STWAVE STeady State Spectral WAVE
TNC The Nature Conservancy
UnSWAN unstructured Simulating WAves Near-shore
USACE U.S. Army Corps of Engineers
WSE water surface elevation

TNC_ Corpus_Storm_Surge_07-15-2013.Docx 1
ADCIRC Based Storm Surge Analysis of Sea Level Rise in the Corpus Christi Bay Area in Texas
1. Introduction
This modeling effort was motivated by the need to provide a series of technical tools to The Nature Conservancy (TNC) and Coastal Bend Bays and Estuaries Program to better understand the effects of sea level rise (SLR) and storm surge within the Corpus Christi Bay area. The present implementation of the ADvanced CIRCulation (ADCIRC) model for SLR analysis complements the information produced by previous studies conducted by The Nature Conservancy. The products provided as part of this effort will help coastal managers, scientist and the conservation community in identifying the additional threat posed by storm surge given one meter of SLR by 2100 in the study area. This project has been funded through a grant from the Coastal Bend Bays and Estuaries Program.
Prior to this effort, the Sea-Level Affecting Marshes Model (SLAMM) was used by The Nature Conservancy of Florida to analyze the potential effects of SLR on vegetation in the Corpus Christi area. The SLAMM analyses provided forecasts of future marsh landscapes under various potential SLR scenarios through the year 2100.
The intent of this project is to utilize the future vegetation conditions predicted by the SLAMM model to generate ADCIRC model friction parameters representative of future conditions. In this way the ADCIRC model can be used to analyze the effects of future landscapes and SLR on storm surge. Future scenarios include changes in land cover type in the area. The land cover changes are implemented by utilizing the available SLAMM output information to derive appropriate hydrodynamic friction parameters. A SLR rate of one meter by 2100 is analyzed for this study for 2050 and 2100 conditions.
Three scenarios of SLR were analyzed using the ADCIRC hydrodynamic model; the model evaluated the initial conditions in 2006 and future 2050 and 2100 scenarios. ADCIRC is a physics-based, unstructured mesh finite element model, solving the shallow water equations for time dependent, free surface circulation problems (Luettich et al. 2004). ADCIRC is commonly used by state and federal agencies throughout the United States to study a variety of coastal circulation phenomena including tidal studies, hurricane storm surge, and flooding scenarios.
Because no recent hurricane has made landfall at the desired location of interest, a hypothetical storm scenario was selected as the representative storm scenario in this study area. The hypothetical storm used here was originally derived as part of a U.S.

TNC_ Corpus_Storm_Surge_07-15-2013.Docx 2
ADCIRC Based Storm Surge Analysis of Sea Level Rise in the Corpus Christi Bay Area in Texas
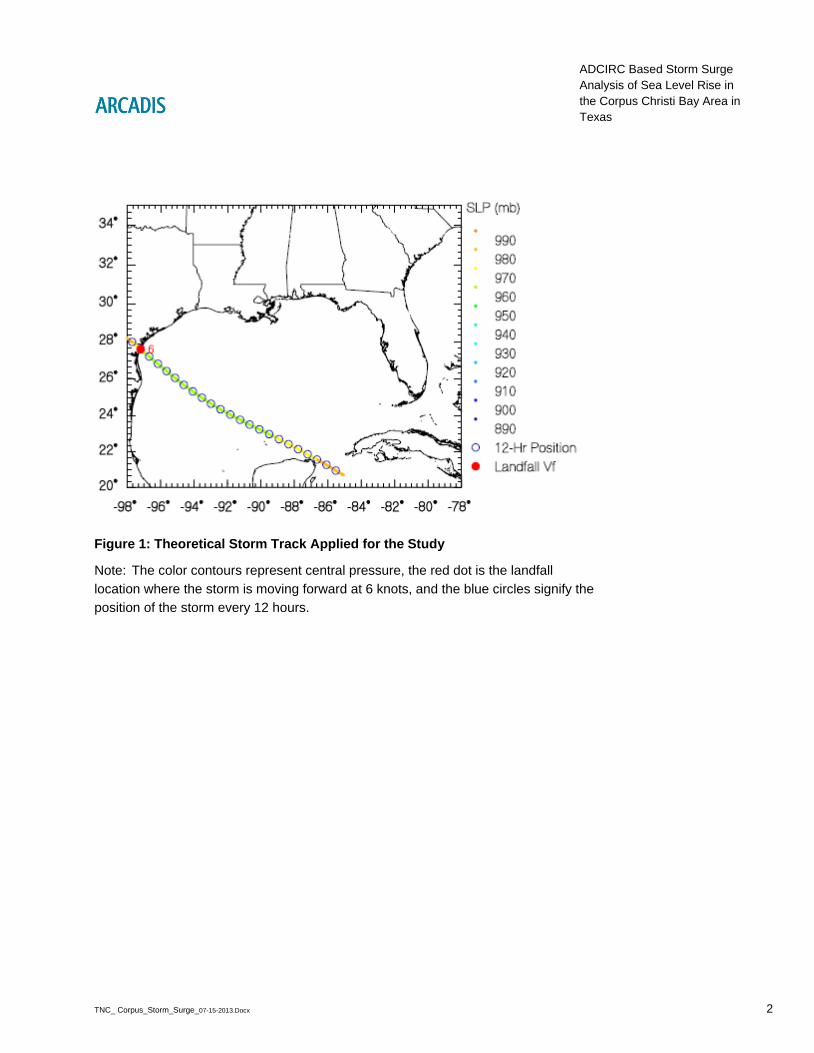
Army Corps of Engineers (USACE) and Federal Emergency Management Agency (FEMA) flood insurance study (FIS) of the Texas coastline (USACE 2011). Storm 343 from the 2011 FEMA storm suite was applied for this effort to approximate a high intensity category 1 storm moving from south-southeast to north-northwest and making first landfall near Padre Balli Park. Storm 343 has a peak wind speed of 90 miles per hour (mph) in the Gulf and approximately 65 mph at landfall, a forward speed of 6 knots (6.9 mph), and a minimum central pressure of 960 millibar (mb). The track for Storm 343 is shown in Figure 1. The initial landfall location is 97.207291 W, 27.604974 N. Additionally, note that ADCIRC simulations do not include rainfall in the analysis; only storm surge and nearshore waves are considered in this analysis.
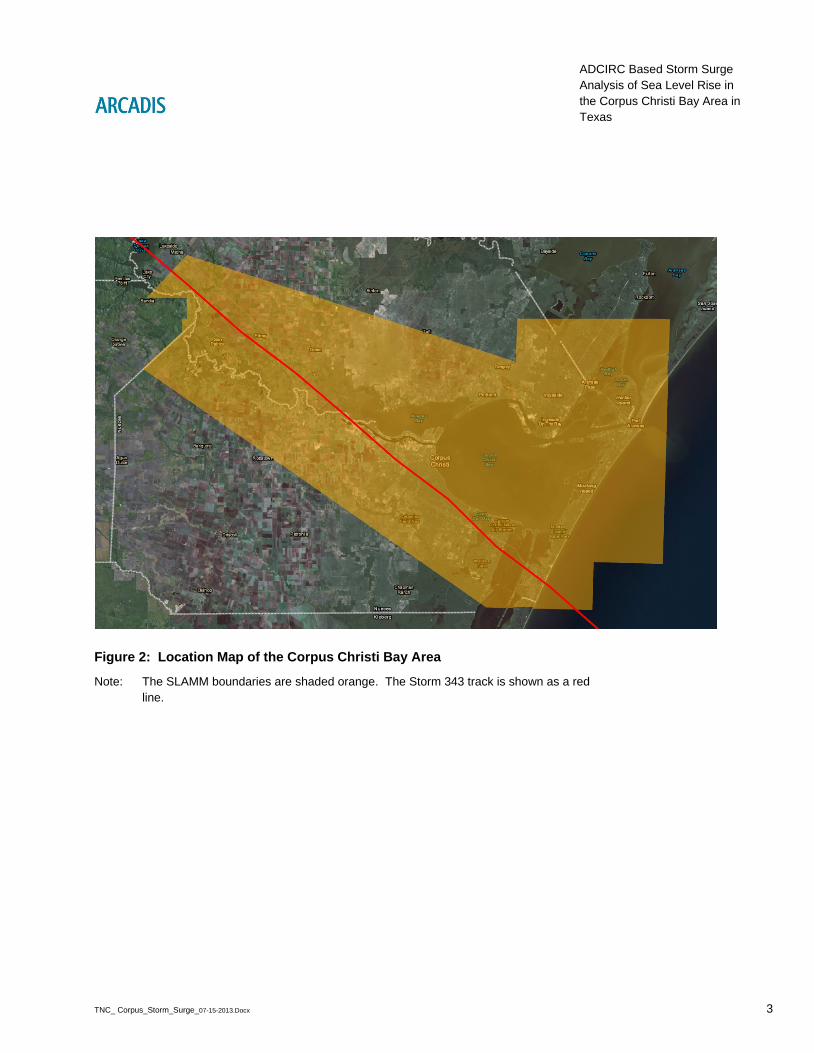
A location map of the study area is shown if Figure 2. The path of Storm 343 and the extents of the SLAMM models are also included. All maps and coordinates in this report are referenced to the NAD83 horizontal datum and NAVD88 vertical datum.

TNC_ Corpus_Storm_Surge_07-15-2013.Docx 3
ADCIRC Based Storm Surge Analysis of Sea Level Rise in the Corpus Christi Bay Area in Texas
2. ADCIRC Model Overview
ADCIRC was selected for this storm surge analysis, as it is an extensively validated and commonly used storm surge analysis model. ADCIRC is the standard coastal storm surge model used by the USACE and was the model applied in recent coastal Texas flood insurance study conducted by USACE and FEMA (USACE 2011). The FIS model mesh was constructed utilizing the most recent and accurate elevation data available in Texas to determine flood risk under current conditions. The ADCIRC modeling system was validated during the FEMA FIS using Hurricanes Allen, Bret, Carla, Rita and Ike.
This study is able to build from the FIS by extending the analysis of Storm 343 to include consideration of future scenarios. The ADCIRC model constructed in the FIS is a accurate and robust system that has been thoroughly validated and reviewed by some of the leading experts in the field of coastal engineering. The Nature Conservancy is able to leverage this model to accurately simulate storm surge for current and proposed future conditions, with minor variations to the model setup, aside from model adjustments necessary to define future conditions. All model parameters utilized for the FIS were applied to this study unless otherwise noted. The version of ADCIRC at the time of the FIS, version 49, was applied for this study.
The ADCIRC hydrodynamic model solves the shallow water equations on unstructured, linear triangular elements. ADCIRC is a physics-based model, using the depth-integrated barotropic equations of mass and momentum conservation subject to the incompressibility, Boussinesq (elimination of the vertical coordinate), and hydrostatic pressure approximations. The depth-integrated implementation is used, where the water level and depth-averaged velocity are solved for at each triangle vertex, referred to as nodes.
The ADCIRC model is a computational code that is compiled to simulate flow processes. Input files are required to describe the region of interest and its characteristics, boundary conditions and forcing mechanisms (e.g., wind fields). Though the inputs vary, the computational code version remains the same throughout the study. The critical inputs for this study are the computational mesh, surface characteristics file, and meteorological forcing file for Storm 343 (wind and pressure fields). A modeling schematic for ADCIRC is shown in Figure 3.
The computational mesh consists of nodes, which are the locations where the ADCIRC model solves the shallow water equations. Nodes communicate with each
TNC_ Corpus_Storm_Surge_07-15-2013.Docx 4
ADCIRC Based Storm Surge Analysis of Sea Level Rise in the Corpus Christi Bay Area in Texas
other via linear triangular finite elements. The computational modeling process requires that the physical system is accurately described and characterized at the nodal locations. This means that topographic and bathymetric elevations must be accurately represented by an elevation value specified at the nodes. In addition, all vertical geometric features such as levees, river banks, and roads must be incorporated into the mesh by strategic placement of nodes. These small-scale features require careful consideration because they can impede the flow and focus the storm surge. Topographical mappings and surveys, including high-resolution light detection and ranging (lidar)-based surveys, can easily neglect these features due to their relatively small horizontal scale. Such small horizontal scales require special handling in order to concisely represent each feature in the mesh.
Unstructured finite element meshes permit shallow water equation solutions that can localize resolution. In this case, resolution is focused in the study area as a whole and more specifically in critical areas such as dredged channels and levees. The elements vary in size from multiple kilometers in the open ocean to resolutions as fine as 15 meters in the study area. Varying resolution throughout the mesh domain leads to globally and locally more accurate solutions, while also saving on computational expense.
The computational mesh developed for the FIS, referred to as TX2008, is the basis for this study as well. All mesh elevations are referenced to the vertical datum NAVD88.
Figure 4 displays the mesh domain of the TX2008 mesh. Note that the mesh domain includes the western North Atlantic, Caribbean Sea and Gulf of Mexico. The large domain allows the mesh to accurately propagate storm surge through the Caribbean and Gulf of Mexico, onto the continental shelf and overland. The unstructured nature of the ADCIRC mesh allows for coarser element sizes in the deep, open waters and higher resolution near shore and onshore. Over ninety percent of the computational nodes for the TX2008 mesh reside in coastal Texas.
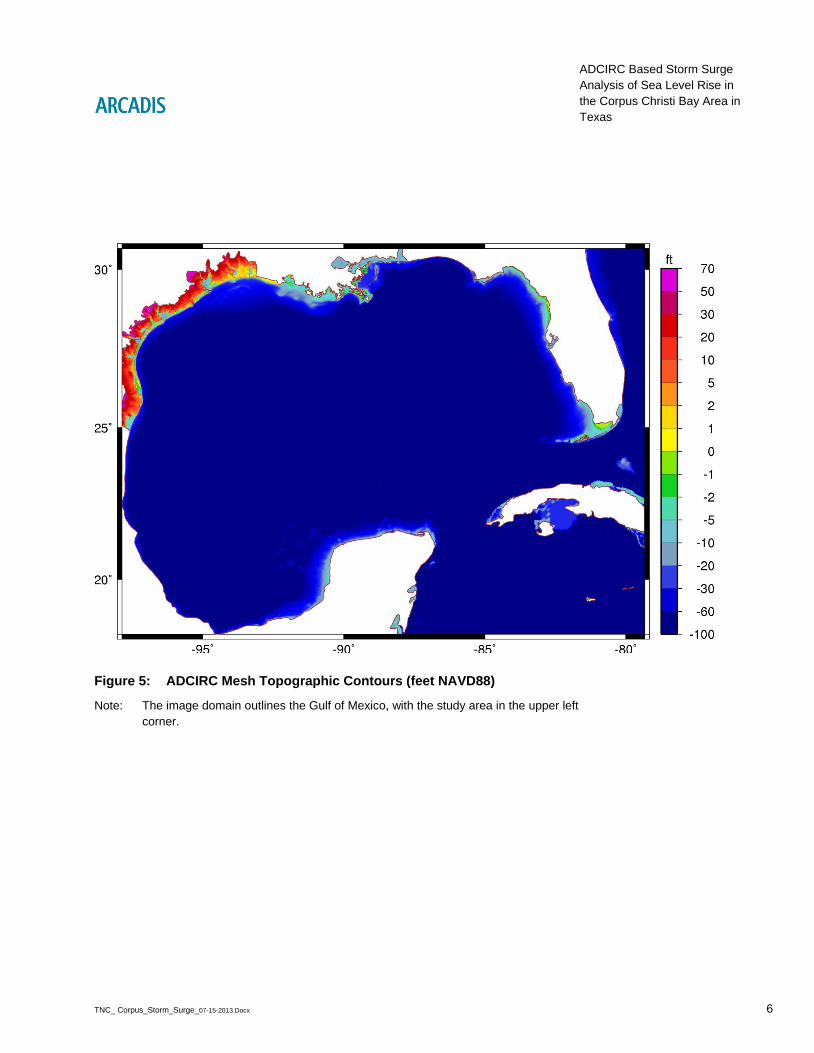
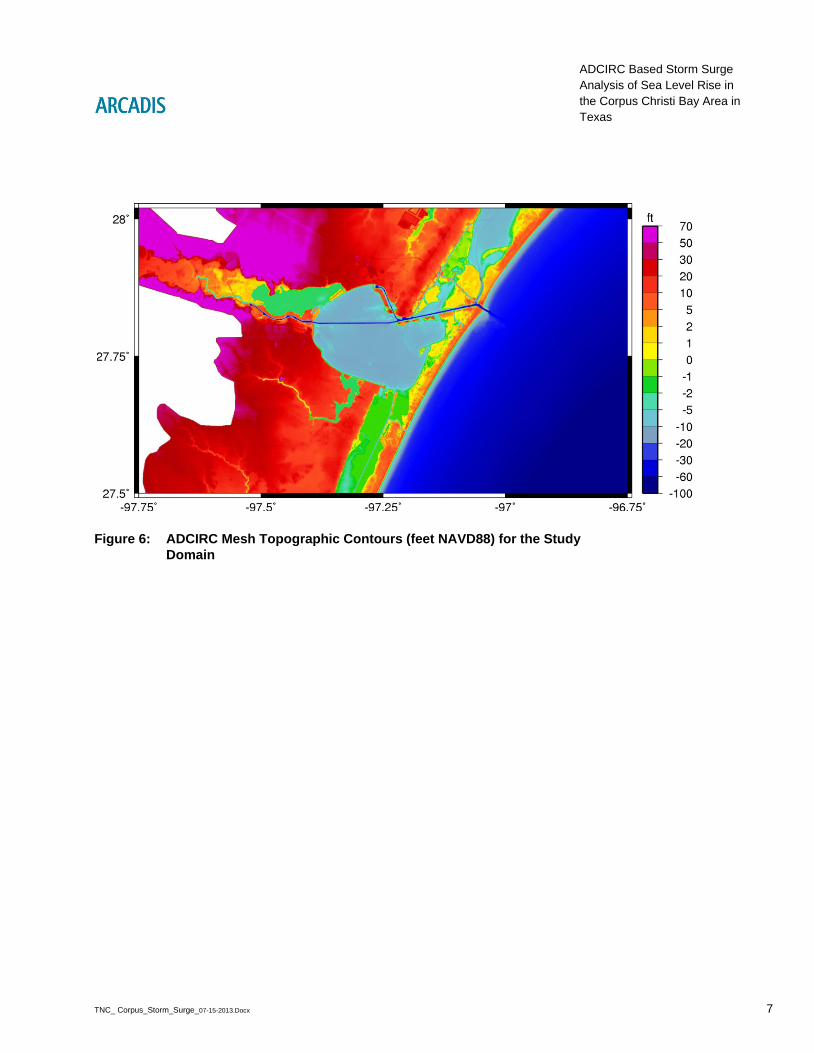
Figure 5 shows a mesh domain and elevation contours in the Gulf of Mexico. Details of the study area elevations can be seen in Figure 6. The inland boundary for the ADCIRC mesh is set at approximately the twelve meter contour, such that the boundary is sufficiently inland to capture the details of storm surge inundation, even under high sea level rise conditions. Mesh resolution is depicted in Figure 7. Note that some critical conveyance areas, such as the Gulf Intracoastal Waterway are

TNC_ Corpus_Storm_Surge_07-15-2013.Docx 5
ADCIRC Based Storm Surge Analysis of Sea Level Rise in the Corpus Christi Bay Area in Texas
highly resolved, while other areas such as the deep waters of the Gulf of Mexico are more coarsely resolved.
Elevations are applied to the mesh using grid scale averaging techniques. For each mesh node, the maximum extents of the adjacent elemental centroids are determined to establish the areal limits used for averaging elevation data. All topographic survey data, within the area limits are averaged and applied to the given node. Thus, the size of the area used for mesh scale averaging varies as elemental resolution varies. Specific details can be found in the documentation for the recent FEMA study (USACE 2011).
Mesh scale averaging is applied for two reasons. The first reason is that each ADCIRC node must represent an approximation to the terrain in a region surrounding it. In order to appropriately describe the area, each nodal elevation must incorporate data from the surrounding area rather than from a single data point. The exception to this rule is when vertically pronounced features (such as levees and channels) are assigned specific elevations to correctly capture small scale hydraulic conveyances and impedances. The second reason is for model stability purposes. Mesh scale averaging creates a more smooth elevation surface than direct sampling, which in general leads to better model stability.
In addition, ADCIRC requires a description of the frictional roughness over which the wind blows and waves and surge propagate. This roughness accounts for the resistance due to vegetation and resistance due to constructed urban, suburban, and industrial areas. Surface roughness significantly influences the flow of a fluid over a surface, whether the fluid is water or air. In the case of water flowing over a surface, the bottom friction force that is developed is an important resistance mechanism that must be accurately quantified. The Manning’s n bottom friction resistance formulation is applied in this study. This formulation is widely used and is a standard formulation in hydraulic computations. In the case of air flowing over a rough surface, the wind boundary layer is modified and the resulting ten-meter above ground level wind speed is modified prior to computing the surface drag. The wind boundary layer does not adjust instantaneously to the local roughness but adjusts slowly based on the roughness in the upwind direction over which the wind has already passed. In order to evaluate the physical effect of bottom resistance and the wind boundary layer, the roughness of the land surface needs to be described.
Land roughness in overland regions is characterized by land cover conditions such as urban, forested, agricultural, or marsh. The Manning’s n associated with

TNC_ Corpus_Storm_Surge_07-15-2013.Docx 6
ADCIRC Based Storm Surge Analysis of Sea Level Rise in the Corpus Christi Bay Area in Texas
these land classifications was selected or interpolated/extrapolated from standard hydraulic literature (Chow 1959, Henderson 1966, Barnes 1967, Arcement and Schneider 1989). The roughness lengths or more specifically “nominal” roughness lengths Z0 used to adjust the wind boundary layer are defined by the FEMA HAZUS program (FEMA 2005). The wind values are used as adjusted by the Z0 wind roughness parameter.
Using land cover information, each ADCIRC node is assigned a Manning’s n and Z0 value by the same grid scale averaging technique used to assign elevation information (Atkinson 2012). The ADCIRC and unstructured Simulating WAves Near-shore (UnSWAN) models then use the nodal attribute information to resist flow, attenuate waves, and dynamically adjust wind speeds during a storm surge event. The FIS applied Manning’s and Z0 derived from the Coastal Change Analysis Program (C-CAP; http://www.csc.noaa.gov/digitalcoast/data/ccapregional/) and the National Land Cover Dataset (NLCD http://www.epa.gov/mrlc/nlcd-2006.html). For this study, SLAMM output data was applied where available and supplemented by C-CAP data outside of the SLAMM domain.
ADCIRC was coupled with the STeady State Spectral WAVE (STWAVE) nearshore wave model in the FIS. However, for this study and previous studies on behalf of TNC, ADCIRC has been coupled with UnSWAN. During previous hindcasting studies of Hurricanes Ike, Gustav, Rita and Katrina, both UnSWAN and STWAVE have been shown to compute similar wave radiation stresses which result in similar effects on storm surge. Dietrich et al. describe this in detail in a publication of the hindcast of Hurricane Gustav, which made landfall in 2008 (Dietrich et al. 2011). UnSWAN and ADCIRC are coupled on a ten minute interval for this analysis.
Storm 343 simulations do not include tidal forcing at the mesh boundary. Dynamic tidal forcing is computationally demanding and adds limited benefit to understanding the relative effects of SLR under various storm surge conditions. Rather than incorporating dynamic tidal forcing, each simulation assumes a constant water surface elevation as an initial condition as was done for theoretical storm simulations during the FIS study. For the work described here, the initial condition for 2006 conditions was set at 1.2 feet NAVD88, which is mean high higher water (MHHW) at the National Oceanic Atmospheric Administration (NOAA) Bob Hall Pier gauge. For future scenarios, the initial condition was adjusted up from MHHW based on the appropriate SLR for each scenario. Note that though including dynamic tides has limited benefit to an extreme event analysis such as this study, analysis of dynamic daily tides is beneficial to examining SLR impacts aside from extreme events. A

TNC_ Corpus_Storm_Surge_07-15-2013.Docx 7
ADCIRC Based Storm Surge Analysis of Sea Level Rise in the Corpus Christi Bay Area in Texas
dynamic sea level rise tidal analysis would better inform marsh tidal prism and hydroperiod, which are ultimately critical to analyzing potential changes to the marsh environment along the coast in models such as SLAMM.
3. Data Sources
The primary data sources for this study are topographic, bathymetric and land cover data that are applied to the ADCIRC mesh and surface characteristics files. All other ADCIRC inputs necessary for simulation, such as the Storm 343 winds, are setup identical to the FIS. The FEMA FIS study additionally supplied the TX2008 ADCIRC mesh. TheTX2008 ADCIRC mesh was assembled by applying the most recent topographic and bathymetric surveys available at the time of the study, including statewide lidar, natural and USACE dredged channel surveys, and independent levee surveys conducted by county and city personnel. Lidar data was gathered and processed between 2002 and 2006. Bathymetric data was supplied by USACE Galveston and incorporated the most recent statewide surveys available from USACE, NOAA and other agencies. Further details are available in the 2011 FEMA FIS documentation. Elevation surveys were mapped to the ADCIRC mesh using grid scale averaging techniques.
SLAMM datasets for the initial conditions in 2006, and 2050 and 2100 scenarios were supplied by The Nature Conservancy. SLAMM datasets used the land covers from the National Wetland Inventory (NWI; http://www.fws.gov/wetlands/). The SLAMM datasets assume a eustatic SLR of one meter by 2100 and local subsidence. SLAMM data were utilized for this study in areas where the data are available, with the exception of the SLAMM classes for developed dry land and undeveloped dry land. The reason for the exception is that C-CAP has greater diversity in defining land classes within the region covered by SLAMM’s two dry land classes. ADCIRC mesh areas outside of the SLAMM model domains, as well as in the dry land areas, applied C-CAP 2005 land cover data. The C-CAP data were downloaded from NOAA’s website.
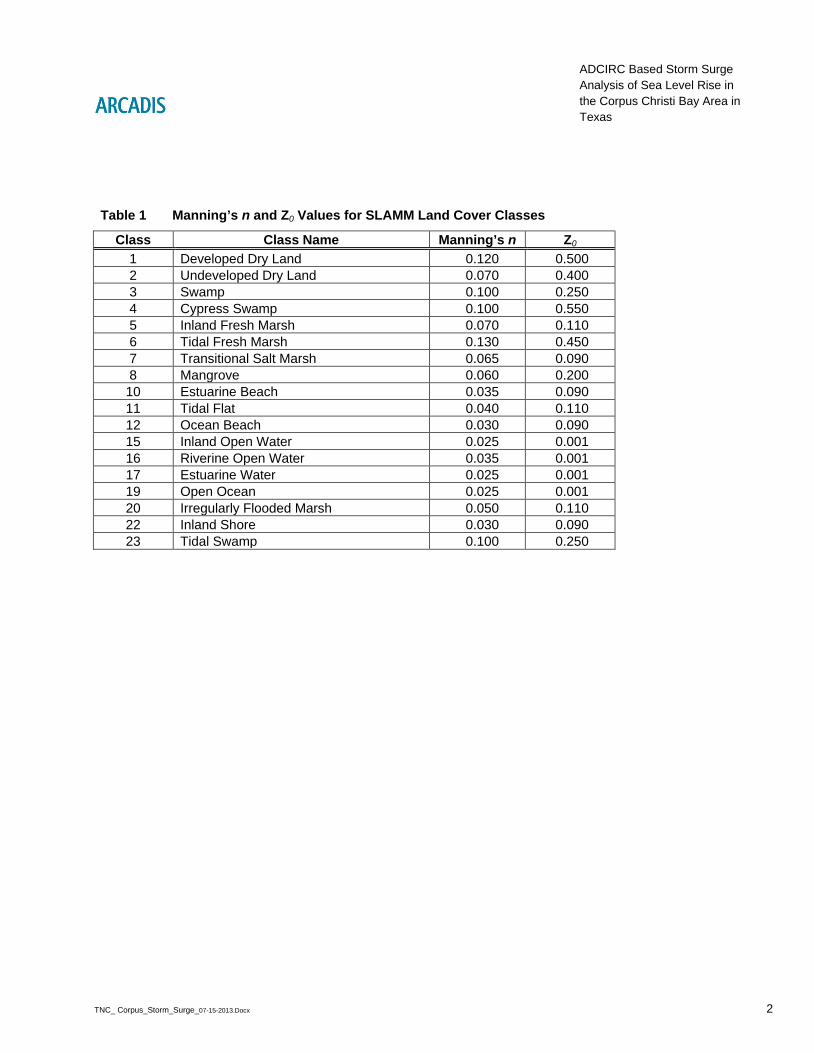
Figures 8 through 10 exhibit land cover for the initial conditions in 2006 and the SLAMM scenarios for 2050 and 2100, respectively. Note that the SLAMM data are not available for the entire ADCIRC mesh domain. In areas that SLAMM data are not available, C-CAP data is applied to the surface characteristics file. C-CAP 2005 land cover data for Texas are displayed in Figure 11. C-CAP data is a static dataset and thus is identical for 2006, 2050 and 2100 scenarios. A combined SLAMM and C-CAP land cover dataset is created for each scenario. Table 1 and Table 2 outline
TNC_ Corpus_Storm_Surge_07-15-2013.Docx 8
ADCIRC Based Storm Surge Analysis of Sea Level Rise in the Corpus Christi Bay Area in Texas
the Manning’s n and Z0 values assigned to each SLAMM land cover class and C-CAP land cover class respectively. Higher Manning’s n and Z0 values equate to increased bottom friction and greater wind reduction. These values were determined from values identified in literature and those outlined in the Texas FEMA FIS (USACE 2011).
4. ADCIRC Model Setup
4.1 ADCIRC Mesh
The TX2008 ADCIRC mesh is identical to the FIS ADCIRC mesh. Subsidence was lumped into the relative sea level rise term in the SLAMM study for this area, thus the 2050 and 2100 ADCIRC meshes were identical to the 2006 scenario ADCIRC mesh. In this way, subsidence is accounted for by way of the relative sea level rise term (e.g. subsidence and eustatic sea level rise), which is discussed further in Section 4.3.
4.2 Application of Land Cover
A combined land cover dataset for each scenario is created using the SLAMM and C-CAP data. The domain wide dataset is applied onto the ADCIRC nodes using a distance weighted mesh scale averaging function to define Manning’s n and Z0 values. Manning’s n values are averaged based on immediately surrounding roughness values. Wind boundary layer re-adjustments, Z0, depend upon roughness conditions upwind of the location because the wind boundary layer does not adjust to a new roughness instantaneously. Therefore, upwind wind reduction factors are computed for 12 compass directions by examining all roughness coefficients up to 6 miles away. Then the directional roughness used at each computational point within the mesh is based upon the existing wind direction, which is important for highly varying wind fields such as hurricanes.
The resulting Manning’s n and Z0 values for 2006, 2050 and 2100 conditions are shown in Figure 12 through Figure 26. The figures include absolute values and differences between 2006 and future conditions. Two of the 12 directional Z0 parameters are shown for northerly and southerly winds. Note that the area of change between 2006 Z0 values and future values is highly dependent on the wind direction. Additionally, the figures reveal that the changes in land cover and the related changes in roughness values for 2100 are notably more substantial than those in 2050.
TNC_ Corpus_Storm_Surge_07-15-2013.Docx 9
ADCIRC Based Storm Surge Analysis of Sea Level Rise in the Corpus Christi Bay Area in Texas
4.3 Sea Level Rise
The computations are vertically referenced to NAVD88, which is a geodetic equipotential surface and therefore provides a sound reference for our computations when adjusted for the offset to local MHHW. The average offset between local MHHW and NAVD88 for the study areas is 1.18 foot (0.36 meters). Thus the initial water surface elevation (WSE) for the ADCIRC model is set to 1.18 foot NAVD88 for the 2006 scenario.
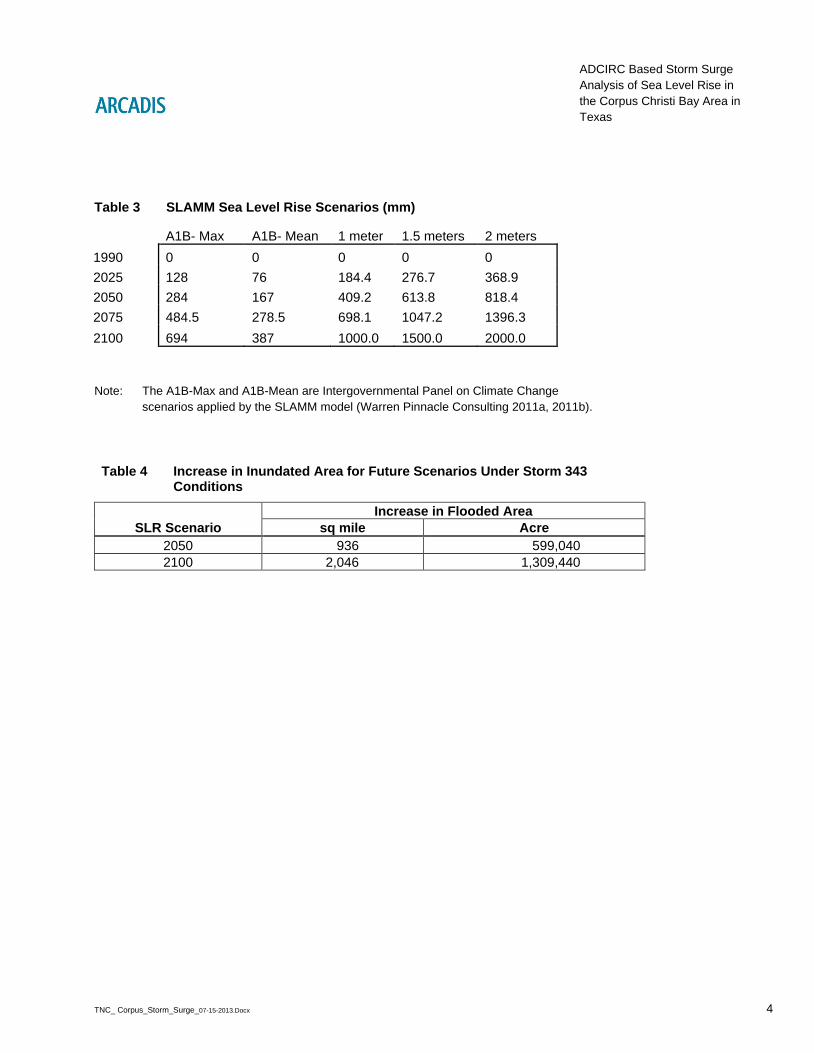
Relative SLR (eustatic SLR and subsidence combined) is accounted for in the 2050 and 2100 scenarios in the same manner that the SLAMM models account for SLR. Figure 27 and Table 3 summarize the eustatic SLR scenarios modeled by the TNC SLAMM Project. The middle curve, representing 1 meter of SLR by 2100 is the selected curve for this analysis. Combined with local subsidence, relative sea level rise levels were established by The Nature Conservancy. Relative SLR applied in the SLAMM model by TNC for 2050 was 1.07 feet (0.32 meters). The relative SLR for 2100 is 3.00 feet (0.92 meters).
The initial WSE in the ADCIRC model for the 2050 and 2100 scenarios is set to the initial WSE of 1.18 feet (0.36 meters) together with the relative SLR. The 2050 initial WSE is 2.25 feet (0.69 meters) NAVD88 and the 2100 initial WSE is set to 4.18 feet (1.27 meters).
TNC_ Corpus_Storm_Surge_07-15-2013.Docx 10
ADCIRC Based Storm Surge Analysis of Sea Level Rise in the Corpus Christi Bay Area in Texas
5. Results
5.1 Maximum Storm Surge Elevation
The simulation of Storm 343 at MHHW for the base condition produced a peak surge of approximately 9 feet. Figure 28 shows the maximum surge pattern as derived as a maximum envelope of water (MEOW). A MEOW is the maximum storm surge elevation computed at any point during the hurricane and is used to understand maximum inundation patterns. The MEOW shows higher surge values east of the eye of the storm. This is expected due to stronger winds occurring east of the eye of the storm and the counterclockwise direction of the circulating winds during the hurricane.
Figure 29 shows the maximum wind speed (mph) applied to the ADCIRC model for Storm 343 in 2006 conditions. Similar to the MEOW’s representation of maximum water surface elevation, Figure 29 represents the maximum wind applied at each location in the model at any point during the simulation and not a single snap in time. Note that the winds speeds represent those applied in ADCIRC after consideration of wind reductions due to Z0 (shown in Figure 13 an Figure 14). The highest wind speeds in the nearshore and in Corpus Christi Bay are generally on the order of 80 mph. Overland maximum wind speeds are in the range of 45 to 60 mph, with higher speeds generally on the eastern side of the storm eye. Areas in blue represent those which result in significant wind reduction due to land cover types (e.g. deciduous forest shown in Figure 11).
The same Storm 343 meteorological forcing was applied to the future scenario models and the maximum surge was computed. The maximum surge for the 2050 result is shown in Figure 30 and the difference between the 2050 condition and the 2006 base condition is shown in Figure 31. Recall that for the 2050 scenario, the analyzed SLR value is 1.07 feet (0.32 meters). The increase in surge throughout the region is generally on the order of 1 foot, with a maximum of approximately 2 feet in the Nueces River floodplain, where the marsh changes in SLAMM are most substantial between 2006 and 2050. The brown regions around the inundation limits in Figure 31 show areas that are flooded in the future condition but were originally not flooded for the base condition.
The maximum surge for the 2100 result is shown in Figure 32 and the difference between the 2100 condition and the base condition is shown in Figure 33. Recall that for the 2100 scenario, the analyzed SLR value is 3.00 feet (0.92 meters). Again,
TNC_ Corpus_Storm_Surge_07-15-2013.Docx 11
ADCIRC Based Storm Surge Analysis of Sea Level Rise in the Corpus Christi Bay Area in Texas
the increase in surge throughout the region is generally on the order of the analyzed SLR (3 foot) throughout the area, with a maximum in the Nueces River floodplain, where the marsh changes in SLAMM are most substantial between 2006 and 2100. The brown regions around the inundation limits show areas that are flooded in the 2100 condition but were originally not flooded for the initial condition in 2006. The nonlinear storm surge patterns seen in the 2050 comparison to 2006 are also exhibited in the 2100 scenario. Regions like Corpus Christi Bay, Nueces Bay, the Nueces River floodplain, and Oso Creek exhibit flooding increases greater than the SLR value itself.
5.2 Analysis of Nonlinear SLR Effects
In order to further analyze patterns of nonlinear SLR impacts, relative surge amplification was plotted for both the 2050 and 2100 scenarios. Relative surge amplification is defined as the increase in maximum surge normalized by the SLR increment. A linear response would show a surge increase equal to the SLR increment. Amplification occurs when the future surge maximum is greater than simple addition of the SLR increment. Amplification is the consequence of many factors, including site location, geometry, frictional characteristics, meteorological forcing, and the 2006 conditions storm surge elevations. Examining nonlinearities in SLR related response is important in understanding the dynamic complexities of SLR in extreme events, particularly in identifying areas at the greatest risk. The ADCIRC model dynamically calculates the many interdependent factors involved in a SLR analysis, making a fully dynamic analysis possible instead of a simplistic static SLR assumption.
Figure 34 and Figure 35 are plots of relative surge amplification for the 2050 scenario and the 2100 scenario respectively. In these images, the contour values show the factor of increase in maximum surge normalized by the SLR value analyzed in each case. For the difference in surge at geographic coordinates (x,y) defined as:
dz(x,y) = surge_future_condition – surge_2006,
then Figure 35 plots:
2100_relative_surge_amplification =
dz(x,y) / (2100_initial_WSE – 2006_initial_WSE)
TNC_ Corpus_Storm_Surge_07-15-2013.Docx 12
ADCIRC Based Storm Surge Analysis of Sea Level Rise in the Corpus Christi Bay Area in Texas
or
2100_relative_surge_amplification = dz(x,y) / (4.18 feet – 1.18 feet)
and similarly for the 2050 scenario. This way of looking at the data spatially reveals the surge increase relative to the SLR amount. For regions far offshore, the increase in water level is exactly equal to the SLR increase, so the amplification factor is unity; a factor of unity is equivalent to a static SLR application at that specific location. Inland regions show that the increase in surge is greater than the addition of the SLR water increment by a factor of 1.5 or more in many locations. At a few locations, the surge amplification factor is less than unity because relatively more water is propagating inland, thus the relative surge decreases locally. Comparison of Figure 34 and Figure 35 shows that the amplification factor is similar in both scenarios, thought generally increases with greater SLR increment. This is the opposite result of previous studies conducted for TNC, including analysis of Hurricane Ike in the Galveston Bay and Jefferson County areas. In the case of Hurricane Ike, for very large SLR increments (e.g. 2100), the amplification decreased relative to lower SLR increments (e.g. 2050) because the additional water volume contribution from the SLR increment becomes more dominant in 2100. Conversely, for this analysis of a high intensity Category 1 storm, the amplification factor increases slightly for the 2100 condition compared to the 2050 condition. This is largely due to the fact that Storm 343 produces a significantly smaller storm surge than Hurricane Ike and thus the floodplain is not overwhelmed with inundation in Storm 343 the same way the Galveston Bay floodplain is overwhelmed by Hurricane Ike in the 2100 conditions.
For this region and for this storm event, the relative amplification is greatest in the floodplain adjacent to the Nueces River where the amplification is over 1.5 in both 2050 and 2100. The Nueces River floodplain experiences amplification because of the storm track, the bay’s proximity to the coast, and the physical parameters of the bay such as size and depth. These amplification results are consistent with previous estimates of the effect of SLR on coastal surge along the Gulf of Mexico (Atkinson et al. 2012, Smith et al. 2010) in which the peak increase can be as high as a factor of two or three times the SLR amount. Thus, simply adding the SLR amount to present day surge maxima will under-predict the future storm surge.
5.3 Inundation Limits
In addition to the increased water surface elevation that may occur in the future, these results also permit consideration of the additional surface area that may be

TNC_ Corpus_Storm_Surge_07-15-2013.Docx 13
ADCIRC Based Storm Surge Analysis of Sea Level Rise in the Corpus Christi Bay Area in Texas
flooded in the future. The maximum surge plots provide an indication of the extents of inundation for each of the scenarios. Likewise, the plots of difference in maximum storm surge between future and base scenarios can provide an estimate of the increase in flooded area that may be expected under the future scenarios. Note that both Figure 31 and Figure 33 reveal brown regions around the edges of the inundation limits. As stated earlier, these are regions that are newly flooded in the future due to SLR and the associated marsh degradation. By summing the individual areas of all of the ADCIRC finite elements that are not flooded in the base simulation but flooded in either of the future simulations, an estimate is derived for the total increase in flooded area. The 2050 simulation predicts an addition of 936 square miles of inundation along the entire coast of Texas. The 2100 simulation predicts an increase of 2,046 square miles along the entire coast of Texas, which is nearly double that of the 2050 scenario. Table 4 provides a summary of the increase.
The distribution of the future flooded regions follows the water line of the peak surge envelope as incremental increases in surge push water slightly further onshore. Low lying regions, such as the floodplain adjacent to the Nueces River will tend to experience more inundation than regions of steeper topography gradients. The exception is steep topographic regions close to the coast; the barrier islands protecting Corpus Christi Bay experience significantly more flooding in future scenarios than in 2006, particularly 2100. This is due to the lack of protection between the barrier islands and the open coast. Additionally, areas that demonstrate high surge amplification factors and areas impacted by the strongest winds (e.g. the fully exposed barrier islands and Nueces River floodplain) also reflect relatively larger changes in inundation limits. Therefore, these areas will vary for different meteorological conditions. A better understanding of these complex relationships requires further simulations with variable SLR and meteorological scenarios. However, the simulation of even one storm shows the importance of a dynamic SLR analysis rather than a static SLR analysis.
5.4 Marsh Attenuation Sensitivity Test
A sensitivity test was performed to explore the relative importance of marshes for attenuating storm surge and the increase in sea level in the ADCIRC model. To test this, a Storm 343 simulation was run with the 2006 initial sea level and the following changes for marsh implementation in the model:
• inland fresh marsh changed to bare land;
TNC_ Corpus_Storm_Surge_07-15-2013.Docx 14
ADCIRC Based Storm Surge Analysis of Sea Level Rise in the Corpus Christi Bay Area in Texas
• transitional marsh changed to bare land;
• irregularly flooded marsh changed to bare land;
• tidal fresh marsh changed to open water; and
• regularly flooded marsh changed to open water.
For each marsh type, Manning’s n and Z0 values were converted to either bare land or open water. The difference in Manning’s n between the actual 2006 conditions and the sensitivity test is shown in Figure 36. Differences in Z0 values are shown in Figure 37 and Figure 38. The maximum surge for the sensitivity simulation is shown in Figure 39 and the difference in surge from the 2006 base scenario is show in Figure 40.
Figure 36 shows four primary areas with a reduced marsh footprint in the sensitivity test including the Nueces River floodplain, regions adjacent to the barrier islands, locations near Oso Creek, and a region south of Copano Bay and Port Bay. As seen in Figure 40 the changes in peak storm surge are over 0.5 foot for much of the Nueces River floodplain, where the frictional differences are largest and most concentrated. Additionally, this region is a broad, low lying floodplain. Generally, regions with similar characteristics are most significantly impacted by the surge attenuation potential of marshes.
Additionally, there are some relatively small differences near Oso Creek. The differences near Oso Creek are limited both by the steep topographic gradients adjacent to the creek (e.g. Figure 28 and Figure 39 show a narrow floodplain which is inundated) and the limited size of marsh area reduced at the south end of the creek.
Minimal differences are shown south of Port Bay. The negligible differences near Port Bay are due to the storm track selected and the route which flood waters propagate to reach the area. Inspection of Figure 28 shows that flooding south of Port Bay comes from the north. Given the limited changes in model setup in Copano Bay, Port Bay and Aransas Bay, the changed marsh regions south of the bay do not impact surge patterns for this storm.
Similar to the region south of Port Bay, the sensitivity test results in limited surge attenuation immediately adjacent to barrier islands. Though the marsh changes are

TNC_ Corpus_Storm_Surge_07-15-2013.Docx 15
ADCIRC Based Storm Surge Analysis of Sea Level Rise in the Corpus Christi Bay Area in Texas
significant in area, the impact on storm surge is nominal for two reasons. First, the changes in marsh area are spread across a fairly long, slender area perpendicular to the storm surge path. Thus the distance in which surge travels over marsh in any one direction is relatively short. Secondly, the marsh areas are immediately adjacent to barrier islands with steep topographic gradients. Many stretches of the barrier island are high enough in elevation that the island is not overtopped. Just as marshes generally attenuate surge well in broad flat regions like the Nueces River floodplain, marshes generally do not attenuate surge well in regions with steep topographic gradients like those adjacent to the barrier islands.
This analysis implies that changes in marsh characteristics impact storm surge under specific conditions. A reduced marsh area footprint can reduce storm surge and waves for a high frequency storm over a broad floodplain. However, in order to better understand the surge and wave attenuation potential of marshes in this area, further studies are required to isolate critical parameters (e.g. marsh type, density, rigidity) during analysis, including the consideration of numerous meteorological conditions (e.g. intensity, track, radius to maximum wind, forward speed).
5.5 Water Surface Elevation Time Series
Storm surge time series data for all four simulations was analyzed. Nearly two hundred locations were plotted and inspected, three of which are included in this analysis. Figure 41 shows all point locations and highlights the three which are plotted for the purposes of this report. Figure 42 through Figure 44 depict the storm surge hydrographs for the three locations. Hydrographs represent water surface elevations at locations only during model computation, which occurs when the water surface elevation is higher than the nodal elevation. For locations such as station 1, the hydrograph output duration for some scenarios is shorter than others due to variable inundation periods. Hydrographs for all points, including the three shown, have been supplied to The Nature Conservancy as part of this analysis.
TNC_ Corpus_Storm_Surge_07-15-2013.Docx 16
ADCIRC Based Storm Surge Analysis of Sea Level Rise in the Corpus Christi Bay Area in Texas
6. Conclusions
The simulation of the four current and future landscape scenarios for a high Category 1 storm has produced useful data for qualitatively understanding the impacts of sea level rise and marsh degradation on storm surge. The resulting 2050 and 2100 storm surge scenarios are insightful both in terms of understanding the change in storm surge conditions due to various ADCIRC model input modifications and understanding regions that will be most greatly impacted by storm surge for future SLR scenarios under the given meteorological conditions.
Some key findings from this study are:
• The SLAMM model output can be mapped to the ADCIRC model for similar studies.
• The difference between 2006 and future conditions storm surge response varies nonlinearly due to sea level rise and marsh degradation.
• Relative surge amplification for future scenarios can be as high as two for Storm 343 conditions in the study area.
• Some areas, such as the Nueces River floodplain, demonstrate notable variability in the water surface elevation relative to the sea level rise increase. The variability is due to the combined contribution of frictional changes and local wind conditions. Most of the study area shows that the changes in water surface elevation are similar to the increase in sea level, reflecting a limited change in surge due to local wind impacts and marsh loss. This is likely due to the relatively steep topographic gradients in much of the study area.
• The marsh degradation sensitivity study qualitatively demonstrated that changes in marsh conditions do impact storm surge attenuation in some areas for this scenario, particularly the Nueces River floodplain.
• The simulation of even one storm shows the importance of a dynamic SLR analysis rather than a static SLR analysis. Simply adding the SLR amount to present day surge maxima will under-predict the future storm surge in many areas.

TNC_ Corpus_Storm_Surge_07-15-2013.Docx 17
ADCIRC Based Storm Surge Analysis of Sea Level Rise in the Corpus Christi Bay Area in Texas
This study is a worthwhile first step towards understanding the potential impacts of sea level rise, subsidence and marsh degradation within and around the Corpus Christi Bay area of Texas. Though the analysis was limited to four simulations, the dynamic nature of sea level rise in extreme events is clearly demonstrated in the model results. Given the dynamic and complicated nature of sea level rise during extreme events, as well as the associated adverse environmental and economic impacts, further analysis is recommended in this study area.
TNC_ Corpus_Storm_Surge_07-15-2013.Docx 18
ADCIRC Based Storm Surge Analysis of Sea Level Rise in the Corpus Christi Bay Area in Texas
7. Recommendations
Further simulations are recommended to quantitatively analyze the impacts of the model variables analyzed as part of this study. A detailed examination incorporating numerous meteorological conditions is necessary to better understand the spatially varying impacts of sea level rise and marsh change during extreme events. Additionally, subsidence may be considered in future studies. Each model consideration, such as the influence of marshes on storm surge, must be systematically studied by varying parameters in the ADCIRC model.
The recommended study would require isolating model changes in order to understand the impact of changing an individual model variable. This would require analysis that diverges from the methodology of this study, which largely incorporated all SLAMM output to best represent a possible future scenario. Rather than incorporating sea level rise, subsidence and marsh changes directly from SLAMM output, it is recommended that SLAMM output or similar studies, be used as a guide to establishing realistic testing guidelines. Using these guidelines, each variable would be individually analyzed with all other variables held constant.
Additionally, beyond analyzing extreme events it is recommended that daily tides are analyzed independent of storm conditions. SLAMM incorporates a static sea level rise assumption. However, as shown in this study, hydrodynamics in the area are quite dynamic and spatially varying. Thus a tidal analysis applying ADCIRC is expected to be notably different than a static sea level rise tidal assumption would render. Though this study was focused on a storm event, the same hydrodynamic principles are applicable in the analysis of daily tides. A dynamic sea level rise tidal analysis would better inform marsh hydroperiod, which are ultimately critical to analyzing potential changes to the marsh environment along the coast in models such as SLAMM.
TNC_ Corpus_Storm_Surge_07-15-2013.Docx 19
ADCIRC Based Storm Surge Analysis of Sea Level Rise in the Corpus Christi Bay Area in Texas
8. References
Arcement, G.J. and V.R. Schneider. 1989. “Guide for Selecting Manning's Roughness Coefficients for Natural Channels and Flood Plains”. U.S. Geological Survey Water-Supply Paper 2339, U.S. Geological Survey, Denver, Colorado.
Atkinson, J., J. Smith, C. Bender, “Sea Level Rise effects on Storm Surge and Nearshore Waves on the Texas Coast: Influence of Landscape and Storm Characteristics", Journal of Waterway, Port, Coastal, and Ocean Eng, 2012.
Atkinson, J, H. Roberts, S. Hagen, S. Zou, P. Bacopoulos, S. Medeiros, J. Weishampel, Z. Cobell, “Deriving Frictional Parameters and Performing Historical Validation for an ADCIRC Storm Surge Model of the Florida Gulf Coast”, Florida Watershed Journal, 2011.
Atkinson, J., T. Wamsley, J. Westerink, M. Cialone, C. Dietrich, K. Dresback, R.
Kolar, D. Resio, C., Bender, B. Blanton, S. Bunya, W. de Jong, B. Ebersole, A, Sleath, B. Jensen, H. Pourtaheri, J., Ratcliff, H. Roberts, and J. Smith. 2007. "Hurricane Storm Surge and Wave Modeling in Southern Louisiana," Estuarine and Coastal Modeling: Proceedings of the Tenth International Conference, M. Spaulding, ed., ASCE, 2007.
Barnes, H.H. 1967. “Roughness Characteristics of Natural Channels.” U.S. Geological Survey Water-Supply Paper 1849, U.S. Geological Survey, Washington D.C.
Chow, V.T. 1959. “Open Channel Hydraulics.” McGraw-Hill Book Company, New York.
Dietrich, J.C., J.J. Westerink, A.B. Kennedy, J.M. Smith, R. Jensen, M. Zijlema, L.H. Holthuijsen, C. Dawson, R.A. Luettich, Jr., M.D. Powell, V.J. Cardone, A.T. Cox, G.W. Stone, H. Pourtaheri, M.E. Hope, S. Tanaka, L.G. Westerink, H.J. Westerink, Z. Cobell. 2011. "Hurricane Gustav (2008) Waves and Storm Surge: Hindcast, Synoptic Analysis and Validation in Southern Louisiana," Monthly Weather Review, 139, 2488–2522.
Federal Emergency Management Agency (FEMA). 2005. “HAZUS: Hazard loss estimation methodology.” http://www.fema. gov/hazus/index.shtm.
TNC_ Corpus_Storm_Surge_07-15-2013.Docx 20
ADCIRC Based Storm Surge Analysis of Sea Level Rise in the Corpus Christi Bay Area in Texas
Henderson, F.M. 1966. “Open Channel Flow.” Macmillan Publishing Company, New York.
Luettich, R.A., and J.J. Westerink. 2004. “Formulation and Numerical Implementation of the 2D/3D ADCIRC Finite Element Model Version 44.XX”. Available at: http://adcirc.org/adcirc_theory_2004_12_08.pdf.
National Oceanic Atmospheric Administration (NOAA). 2001. “Sea Level Variations of the United States 1854-1999.” Technical Report NOS CO-OPS 36, Silver Spring, Maryland.
NOAA. 2007. “Sea level stations.” http://www.tidesandcurrents.noaa.gov/sltrends/sltrends.html.
Smith, J. M., M.A. Cialone, T.V. Wamsley, and T.O. McAlpin. 2010. “Potential impact of sea level rise on coastal surges in southeast Louisiana”, Ocean Engineering, 37, 36-47.
U.S. Army Corps of Engineers. 2011. “Flood Insurance Study, Coastal Counties, Texas. Intermediate Submission 2: Offshore Water Levels and Waves.” (in review).

TNC_ Corpus_Storm_Surge_07-15-2013.Docx 1
ADCIRC Based Storm Surge Analysis of Sea Level Rise in the Corpus Christi Bay Area in Texas
Tables
TNC_ Corpus_Storm_Surge_07-15-2013.Docx 2
ADCIRC Based Storm Surge Analysis of Sea Level Rise in the Corpus Christi Bay Area in Texas
Table 1 Manning’s n and Z0 Values for SLAMM Land Cover Classes Class Class Name Manning’s n Z0
1 Developed Dry Land 0.120 0.500 2 Undeveloped Dry Land 0.070 0.400 3 Swamp 0.100 0.250 4 Cypress Swamp 0.100 0.550 5 Inland Fresh Marsh 0.070 0.110 6 Tidal Fresh Marsh 0.130 0.450 7 Transitional Salt Marsh 0.065 0.090 8 Mangrove 0.060 0.200 10 Estuarine Beach 0.035 0.090 11 Tidal Flat 0.040 0.110 12 Ocean Beach 0.030 0.090 15 Inland Open Water 0.025 0.001 16 Riverine Open Water 0.035 0.001 17 Estuarine Water 0.025 0.001 19 Open Ocean 0.025 0.001 20 Irregularly Flooded Marsh 0.050 0.110 22 Inland Shore 0.030 0.090 23 Tidal Swamp 0.100 0.250

TNC_ Corpus_Storm_Surge_07-15-2013.Docx 3
ADCIRC Based Storm Surge Analysis of Sea Level Rise in the Corpus Christi Bay Area in Texas
Table 2 Manning’s n and Z0 Values for C-CAP Land Cover Classes
Class Class Name Manning’s n Z0 2 High Intensity Developed 0.120 0.500 3 Medium Intensity Developed 0.100 0.390 4 Low Intensity Developed 0.070 0.330 5 Developed Open Space 0.035 0.330 6 Cultivated Land 0.100 0.060 7 Pasture/Hay 0.055 0.060 8 Grassland 0.035 0.040 9 Deciduous Forest 0.160 0.650 10 Evergreen Forest 0.180 0.720 11 Mixed Forest 0.170 0.710 12 Scrub/Shrub 0.080 0.120 13 Palustrine Forested Wetland 0.150 0.710 14 Palustrine Scrub/Shrub Wetland 0.075 0.110 15 Palustrine Emergent Wetland 0.070 0.110 16 Estuarine Forested Wetland 0.150 0.550 17 Estuarine Scrub/Shrub Wetland 0.070 0.120 18 Estuarine Emergent Wetland 0.050 0.110 19 Unconsolidated Shore 0.030 0.090 20 Bare Land 0.030 0.090 21 Open Water 0.025 0.001 22 Palustrine Aquatic Bed 0.035 0.040 23 Estuarine Aquatic Bed 0.030 0.040
TNC_ Corpus_Storm_Surge_07-15-2013.Docx 4
ADCIRC Based Storm Surge Analysis of Sea Level Rise in the Corpus Christi Bay Area in Texas
Table 3 SLAMM Sea Level Rise Scenarios (mm)
A1B- Max A1B- Mean 1 meter 1.5 meters 2 meters
1990 0 0 0 0 0 2025 128 76 184.4 276.7 368.9 2050 284 167 409.2 613.8 818.4 2075 484.5 278.5 698.1 1047.2 1396.3 2100 694 387 1000.0 1500.0 2000.0
Note: The A1B-Max and A1B-Mean are Intergovernmental Panel on Climate Change scenarios applied by the SLAMM model (Warren Pinnacle Consulting 2011a, 2011b).
Table 4 Increase in Inundated Area for Future Scenarios Under Storm 343 Conditions
SLR Scenario Increase in Flooded Area
sq mile Acre 2050 936 599,040 2100 2,046 1,309,440

TNC_ Corpus_Storm_Surge_07-15-2013.Docx 1
ADCIRC Based Storm Surge Analysis of Sea Level Rise in the Corpus Christi Bay Area in Texas
Figures
TNC_ Corpus_Storm_Surge_07-15-2013.Docx 2
ADCIRC Based Storm Surge Analysis of Sea Level Rise in the Corpus Christi Bay Area in Texas
Figure 1: Theoretical Storm Track Applied for the Study
Note: The color contours represent central pressure, the red dot is the landfall location where the storm is moving forward at 6 knots, and the blue circles signify the position of the storm every 12 hours.
TNC_ Corpus_Storm_Surge_07-15-2013.Docx 3
ADCIRC Based Storm Surge Analysis of Sea Level Rise in the Corpus Christi Bay Area in Texas
Figure 2: Location Map of the Corpus Christi Bay Area
Note: The SLAMM boundaries are shaded orange. The Storm 343 track is shown as a red line.

TNC_ Corpus_Storm_Surge_07-15-2013.Docx 4
ADCIRC Based Storm Surge Analysis of Sea Level Rise in the Corpus Christi Bay Area in Texas
Figure 3: ADCIRC Model Schematic
Note: Water current and wave condition output data are not part of the scope of work of this study.

TNC_ Corpus_Storm_Surge_07-15-2013.Docx 5
ADCIRC Based Storm Surge Analysis of Sea Level Rise in the Corpus Christi Bay Area in Texas
Figure 4: ADCIRC Mesh Domain and Topographic Contours (feet NAVD88)
Note: The mesh domain includes the western North Atlantic, Caribbean Sea and Gulf of Mexico.
TNC_ Corpus_Storm_Surge_07-15-2013.Docx 6
ADCIRC Based Storm Surge Analysis of Sea Level Rise in the Corpus Christi Bay Area in Texas
Figure 5: ADCIRC Mesh Topographic Contours (feet NAVD88)
Note: The image domain outlines the Gulf of Mexico, with the study area in the upper left corner.
TNC_ Corpus_Storm_Surge_07-15-2013.Docx 7
ADCIRC Based Storm Surge Analysis of Sea Level Rise in the Corpus Christi Bay Area in Texas
Figure 6: ADCIRC Mesh Topographic Contours (feet NAVD88) for the Study Domain

TNC_ Corpus_Storm_Surge_07-15-2013.Docx 8
ADCIRC Based Storm Surge Analysis of Sea Level Rise in the Corpus Christi Bay Area in Texas
Figure 7: ADCIRC Mesh Resolution for the Study Domain
Note: Cool colors are high resolution and warmer colors denote coarser resolution. Contours represent spatial resolution in feet.
TNC_ Corpus_Storm_Surge_07-15-2013.Docx 9
ADCIRC Based Storm Surge Analysis of Sea Level Rise in the Corpus Christi Bay Area in Texas
Figure 8: 2006 Initial Land Cover Data Used By SLAMM for the Corpus Christi Bay Area
Note: The black line denotes the ADCIRC model boundary.

TNC_ Corpus_Storm_Surge_07-15-2013.Docx 10
ADCIRC Based Storm Surge Analysis of Sea Level Rise in the Corpus Christi Bay Area in Texas
Figure 9: SLAMM 2050 Scenario for the Corpus Christi Bay Area
Note: The black line denotes the ADCIRC model boundary
TNC_ Corpus_Storm_Surge_07-15-2013.Docx 11
ADCIRC Based Storm Surge Analysis of Sea Level Rise in the Corpus Christi Bay Area in Texas
Figure 10: SLAMM 2100 Scenario for the Corpus Christi Bay Area
Note: The black line denotes the ADCIRC model boundary.

TNC_ Corpus_Storm_Surge_07-15-2013.Docx 12
ADCIRC Based Storm Surge Analysis of Sea Level Rise in the Corpus Christi Bay Area in Texas
Figure 11: C-CAP Land Cover Data
Note: The black line denotes the ADCIRC model boundary.
TNC_ Corpus_Storm_Surge_07-15-2013.Docx 13
ADCIRC Based Storm Surge Analysis of Sea Level Rise in the Corpus Christi Bay Area in Texas
Figure 12: 2006 Conditions ADCIRC Nodal Manning’s n Values for the Study Domain

TNC_ Corpus_Storm_Surge_07-15-2013.Docx 14
ADCIRC Based Storm Surge Analysis of Sea Level Rise in the Corpus Christi Bay Area in Texas
Figure 13: 2006 Conditions ADCIRC Nodal Z0 Values in the Study Domain for Southerly Winds
Note: The coastline is shown in white.
TNC_ Corpus_Storm_Surge_07-15-2013.Docx 15
ADCIRC Based Storm Surge Analysis of Sea Level Rise in the Corpus Christi Bay Area in Texas
Figure 14: 2006 Conditions ADCIRC Nodal Z0 Values in the Study Domain for Northerly Winds
Note: The coastline is shown in white.
TNC_ Corpus_Storm_Surge_07-15-2013.Docx 16
ADCIRC Based Storm Surge Analysis of Sea Level Rise in the Corpus Christi Bay Area in Texas
Figure 15: 2050 Conditions ADCIRC Nodal Manning’s n Values for the Study Domain

TNC_ Corpus_Storm_Surge_07-15-2013.Docx 17
ADCIRC Based Storm Surge Analysis of Sea Level Rise in the Corpus Christi Bay Area in Texas
Figure 16: 2050 Conditions ADCIRC Nodal Z0 Values in the Study Domain for Southerly Winds
Note: The coastline is shown in white.

TNC_ Corpus_Storm_Surge_07-15-2013.Docx 18
ADCIRC Based Storm Surge Analysis of Sea Level Rise in the Corpus Christi Bay Area in Texas
Figure 17: 2050 Conditions ADCIRC Nodal Z0 Values in the Study Domain for Northerly Winds
Note: The coastline is shown in white.
TNC_ Corpus_Storm_Surge_07-15-2013.Docx 19
ADCIRC Based Storm Surge Analysis of Sea Level Rise in the Corpus Christi Bay Area in Texas
Figure 18: Difference between 2006 and 2050 Conditions ADCIRC Nodal Manning’s n Values for the Study Domain
Note: Cool colors denote a reduction in friction and warm colors an increase in friction. The coastline is shown in black.
TNC_ Corpus_Storm_Surge_07-15-2013.Docx 20
ADCIRC Based Storm Surge Analysis of Sea Level Rise in the Corpus Christi Bay Area in Texas
Figure 19: Difference between 2006 and 2050 Conditions ADCIRC Nodal Z0 Values in the Study Domain for Southerly Winds
Note: Cool colors denote a reduction in friction and warm colors an increase in roughness length. The coastline is shown in black.

TNC_ Corpus_Storm_Surge_07-15-2013.Docx 21
ADCIRC Based Storm Surge Analysis of Sea Level Rise in the Corpus Christi Bay Area in Texas
Figure 20: Difference between 2006 and 2050 Conditions ADCIRC Nodal Z0 Values in the Study Domain for Northerly Winds
Note: Cool colors denote a reduction in friction and warm colors an increase in roughness length. The coastline is shown in black.

TNC_ Corpus_Storm_Surge_07-15-2013.Docx 22
ADCIRC Based Storm Surge Analysis of Sea Level Rise in the Corpus Christi Bay Area in Texas
Figure 21: 2100 Conditions ADCIRC Nodal Manning’s n Values for the Study Domain
TNC_ Corpus_Storm_Surge_07-15-2013.Docx 23
ADCIRC Based Storm Surge Analysis of Sea Level Rise in the Corpus Christi Bay Area in Texas
Figure 22: 2100 Conditions ADCIRC Nodal Z0 Values in the Study Domain for Southerly Winds
Note: The coastline is shown in white.

TNC_ Corpus_Storm_Surge_07-15-2013.Docx 24
ADCIRC Based Storm Surge Analysis of Sea Level Rise in the Corpus Christi Bay Area in Texas
Figure 23: 2100 Conditions ADCIRC Nodal Z0 Values in the Study Domain for Northerly Winds
Note: The coastline is shown in white.
TNC_ Corpus_Storm_Surge_07-15-2013.Docx 25
ADCIRC Based Storm Surge Analysis of Sea Level Rise in the Corpus Christi Bay Area in Texas
Figure 24: Difference between 2006 and 2100 Conditions ADCIRC Nodal Manning’s n Values for the Study Domain
Note: Cool colors denote a reduction in friction and warm colors an increase in friction. The coastline is shown in black.

TNC_ Corpus_Storm_Surge_07-15-2013.Docx 26
ADCIRC Based Storm Surge Analysis of Sea Level Rise in the Corpus Christi Bay Area in Texas
Figure 25: Difference between 2006 and 2100 Conditions ADCIRC Nodal Z0 Values in the Study Domain for Southerly Winds
Note: Cool colors denote a reduction in friction and warm colors an increase in roughness length. The coastline is shown in black.

TNC_ Corpus_Storm_Surge_07-15-2013.Docx 27
ADCIRC Based Storm Surge Analysis of Sea Level Rise in the Corpus Christi Bay Area in Texas
Figure 26: Difference between 2006 and 2100 Conditions ADCIRC Nodal Z0 Values in the Study Domain for Northerly Winds
Note: Cool colors denote a reduction in friction and warm colors an increase in roughness length. The coastline is shown in black.
TNC_ Corpus_Storm_Surge_07-15-2013.Docx 28
ADCIRC Based Storm Surge Analysis of Sea Level Rise in the Corpus Christi Bay Area in Texas
Figure 27: Summary of Eustatic SLR Scenarios Utilized by the SLAMM Model
Note: Subsidence is added to the eustatic SLR to determine relative SLR.
TNC_ Corpus_Storm_Surge_07-15-2013.Docx 29
ADCIRC Based Storm Surge Analysis of Sea Level Rise in the Corpus Christi Bay Area in Texas
Figure 28: Maximum Storm Surge Elevation Contours (feet NAVD88) for Storm 343 for 2006 Model Conditions
Note: The contours represent the MEOW described in Section 5.1.
TNC_ Corpus_Storm_Surge_07-15-2013.Docx 30
ADCIRC Based Storm Surge Analysis of Sea Level Rise in the Corpus Christi Bay Area in Texas
Figure 29: Maximum wind speed contours (mph) for Storm 343 for 2006 Model Conditions
Note: The contours represent the maximum winds at any time in the storm, as described in Section 5.1.

TNC_ Corpus_Storm_Surge_07-15-2013.Docx 31
ADCIRC Based Storm Surge Analysis of Sea Level Rise in the Corpus Christi Bay Area in Texas
Figure 30: Maximum Storm Surge Elevation Contours (feet NAVD88) for Storm 343 for 2050 Model Scenario
Note: The contours represent the MEOW described in Section 5.1.

TNC_ Corpus_Storm_Surge_07-15-2013.Docx 32
ADCIRC Based Storm Surge Analysis of Sea Level Rise in the Corpus Christi Bay Area in Texas
Figure 31: The Difference Between 2050 Maximum Storm Surge Elevation and 2006 Maximum Storm Surge Elevation for Storm 343
Note: The contours represent the difference between MEOWs, which are described in Section 5.1. Brown contours represent regions that were not wetted in the 2006 simulation, but were inundated in 2050.
TNC_ Corpus_Storm_Surge_07-15-2013.Docx 33
ADCIRC Based Storm Surge Analysis of Sea Level Rise in the Corpus Christi Bay Area in Texas
Figure 32: Maximum Storm Surge Elevation Contours (feet NAVD88) for Storm 343 for 2100 Model Conditions
Note: The contours represent the MEOW described in Section 5.1.
TNC_ Corpus_Storm_Surge_07-15-2013.Docx 34
ADCIRC Based Storm Surge Analysis of Sea Level Rise in the Corpus Christi Bay Area in Texas
Figure 33: The Difference Between 2100 Maximum Storm Surge Elevation and 2006 Maximum Storm Surge Elevation for Storm 343
Note: The contours represent the difference between MEOWs, which are described in Section 5.1. Brown contours represent regions that were not wetted in the 2006 simulation, but were inundated in 2100.
TNC_ Corpus_Storm_Surge_07-15-2013.Docx 35
ADCIRC Based Storm Surge Analysis of Sea Level Rise in the Corpus Christi Bay Area in Texas
Figure 34: Relative Surge Amplification for the 2050 Scenario
Note: The surge increase is normalized by the SLR increment. The scale is unitless. Brown contours represent regions that were not wetted in the 2006 simulation, but were inundated in 2050.

TNC_ Corpus_Storm_Surge_07-15-2013.Docx 36
ADCIRC Based Storm Surge Analysis of Sea Level Rise in the Corpus Christi Bay Area in Texas
Figure 35: Relative Surge Amplification for the 2100 Scenario
Note: The surge increase is normalized by the SLR increment. The scale is unitless. Brown contours represent regions that were not wetted in the 2006 simulation, but were inundated in 2100.

TNC_ Corpus_Storm_Surge_07-15-2013.Docx 37
ADCIRC Based Storm Surge Analysis of Sea Level Rise in the Corpus Christi Bay Area in Texas
Figure 36: Difference between Original 2006 and 2006 Without Marsh Conditions ADCIRC Nodal Manning’s n Values for the Study Domain
Note: Cool colors denote a reduction in friction from the initial 2006 values and warm colors an increase in friction. The coastline is shown in black.

TNC_ Corpus_Storm_Surge_07-15-2013.Docx 38
ADCIRC Based Storm Surge Analysis of Sea Level Rise in the Corpus Christi Bay Area in Texas
Figure 37: Difference between Original 2006 and 2006 Without Marsh Conditions ADCIRC Nodal Z0 Values in the Study Domain for Southerly Winds
Note: Cool colors denote a reduction in friction from the initial 2006 values and warm colors an increase in friction. The coastline is shown in black.
TNC_ Corpus_Storm_Surge_07-15-2013.Docx 39
ADCIRC Based Storm Surge Analysis of Sea Level Rise in the Corpus Christi Bay Area in Texas
Figure 38: Difference between Original 2006 and 2006 Without Marsh Conditions ADCIRC Nodal Z0 Values in the Study Domain for Northerly Winds
Note: Cool colors denote a reduction in friction from the initial 2006 values and warm colors an increase in friction. The coastline is shown in black.

TNC_ Corpus_Storm_Surge_07-15-2013.Docx 40
ADCIRC Based Storm Surge Analysis of Sea Level Rise in the Corpus Christi Bay Area in Texas
Figure 39: Maximum Storm Surge Elevation Contours (feet NAVD88) for Storm 343 for a Marsh Loss Sensitivity Test for 2006 Conditions.
Note: The contours represent the MEOW described in Section 5.1.
TNC_ Corpus_Storm_Surge_07-15-2013.Docx 41
ADCIRC Based Storm Surge Analysis of Sea Level Rise in the Corpus Christi Bay Area in Texas
Figure 40: Increase in Peak Surge for the Sensitivity Test
Note: The contours represent the difference between MEOWs, which are described in Section 5.1. Brown contours represent regions that were not wetted in the 2006 simulation, but were inundated in sensitivity test.
TNC_ Corpus_Storm_Surge_07-15-2013.Docx 42
ADCIRC Based Storm Surge Analysis of Sea Level Rise in the Corpus Christi Bay Area in Texas
Figure 41: Map Outlining Locations where Water Surface Elevation Time Series are Analyzed for the Various SLR Scenarios

TNC_ Corpus_Storm_Surge_07-15-2013.Docx 43
ADCIRC Based Storm Surge Analysis of Sea Level Rise in the Corpus Christi Bay Area in Texas
Figure 42: Water Surface Elevation Time Series for Location 1 at the Western Shore of Nueces Bay
Note: The date is a generic date intended to represent a potential landfall date in August. The year 2075 was chosen because it’s the halfway point between 2050 and 2100.
TNC_ Corpus_Storm_Surge_07-15-2013.Docx 44
ADCIRC Based Storm Surge Analysis of Sea Level Rise in the Corpus Christi Bay Area in Texas
Figure 43: Water Surface Elevation Time Series for Location 19 in the Nueces River Floodplain
Note: The date is a generic date intended to represent a potential landfall date in August. The year 2075 was chosen because it’s the halfway point between 2050 and 2100.

TNC_ Corpus_Storm_Surge_07-15-2013.Docx 45
ADCIRC Based Storm Surge Analysis of Sea Level Rise in the Corpus Christi Bay Area in Texas
Figure 44: Water Surface Elevation Time Series for Location 38 at the Inland Edge of the Barrier Island
Note: The date is a generic date intended to represent a potential landfall date in August. The year 2075 was chosen because it’s the halfway point between 2050 and 2100.

TNC_ Corpus_Storm_Surge_07-15-2013.Docx