Embed Size (px)
Citation preview
ADBI Working Paper Series
Measuring the Environmental Impacts of Changing Trade Patterns on the Poor
Kaliappa Kalirajan, VenkatachalamAnbumozhi, and Kanhaiya Singh
No. 239 August 2010
Asian Development Bank Institute
The Working Paper series is a continuation of the formerly named Discussion Paper series; the numbering of the papers continued without interruption or change. ADBI’s working papers reflect initial ideas on a topic and are posted online for discussion. ADBI encourages readers to post their comments on the main page for each working paper (given in the citation below). Some working papers may develop into other forms of publication.
Suggested citation:
Kalirajan, K., V. Anbumozhi, and K. Singh. 2010. Measuring The Environmental Impacts Of Changing Trade Patterns On The Poor. ADBI Working Paper 239. Tokyo: Asian Development Bank Institute. Available: http://www.adbi.org/working-paper/2010/08/10/4030.environmental.impacts.trade.patterns.poor/ Please contact the author(s) for information about this paper.
Kaliappa Kalirajan is professor Crawford School of Economics and Government at the Australian National University, Canberra. Venkatachalam Anbumozhi is capacity building specialist at ADBI. Kanhaiya Singh is senior economist at National Council of Applied Economic Research, New Delhi.
The views expressed in this paper are the views of the authors and do not necessarily reflect the views or policies of ADBI, the Asian Development Bank (ADB), its Board of Directors, or the governments they represent. ADBI does not guarantee the accuracy of the data included in this paper and accepts no responsibility for any consequences of their use. Terminology used may not necessarily be consistent with ADB official terms.
Asian Development Bank Institute Kasumigaseki Building 8F 3-2-5 Kasumigaseki, Chiyoda-ku Tokyo 100-6008, Japan Tel: +81-3-3593-5500 Fax: +81-3-3593-5571 URL: www.adbi.org E-mail: [email protected] © 2010 Asian Development Bank Institute
ADBI Working Paper 239 Kalirajan, Anbumozhi, and Singh
Abstract
It is an empirical fact that it is very difficult to balance economic growth, poverty reduction, and environment protection, particularly for developing and transitional economies. While the economic environment of a country is influenced by conditions within the country, it is also influenced by external shocks such as the recent global financial crisis depending on how integrated the country is with the rest of the world. Thus, it poses a continuing challenge for policy makers in developing and transitional countries to readjust the economic environment in a way that leads to better and more effective targeting of the chronic issue of poverty reduction without causing damage to the natural environment. It is in this context that this paper attempts to measure the environmental impact of changing trade patterns on the poor.
The recent financial crisis has discouraged United States (US) private consumption, which in turn has significantly reduced exports from Asia. However, Asia’s private consumption is at a very low level even when compared with the current reduced US private consumption. Therefore, it is possible for Asian countries to focus more on improving regional trade and domestic consumption to compensate for the revenue losses that resulted from the reduction in global demand. This paper argues that energy-efficient production methods and service-led growth, particularly trade in environmental goods and services, provide good opportunities for Asian countries to enjoy “inclusive growth” without damaging the natural environment.
JEL Classification: E20, Q43, and Q56
ADBI Working Paper 239 Kalirajan, Anbumozhi, and Singh
Contents
1. Preamble ................................................................................................................... 1
1.1 The Setting ....................................................................................................... 3
2. Environmental Impacts Of Trade Patterns On The Poor: Theoretical Propositions .... 7
2.1 Environmental Impacts of Trade on the Poor: Empirical Findings in Asia .......... 8
3. Service-Led Growth And Trade In Environmental Goods And Services ................... 14
4. Conclusions And Policy Suggestions ....................................................................... 17
Appendix I ........................................................................................................................... 19
Appendix II .......................................................................................................................... 20
References ......................................................................................................................... 21
ADBI Working Paper 239 Kalirajan, Anbumozhi, and Singh
1
1. PREAMBLE One of the important characteristics of developing economies is their vast informal economic sector, which is mostly spread over the service and agriculture sectors. Such informality has helped maintain resilience in the growth process of many developing countries and provides flexible employment and self-employment to a large segment of the unskilled workforce, though the technology used may not be up to date in terms of efficiency. Another important characteristic of developing countries is the high incidence of poverty. The World Development Report (WDR) 2008 declares that about 75% of the poor are in rural areas and the majority will still be rural in about 2040. There are about 900 million rural poor with extreme poverty, measured by per capita income of less than US$1 per day.1
The implications are that poverty can be reduced by (i) increasing agricultural productivity, and (ii) increasing the production and export of labor-intensive tradables. For example, WDR 2008 provides evidence that rural poverty in Ghana has been halved with increased agricultural productivity. It is well established that through Green Revolution technology, the rural poverty rate in India declined from about 53% in 1977–78 to 26% in 1999–2000 (Planning Commission 2001). The case of People’s Republic of China (PRC) reducing poverty drastically through labor-intensive manufacturing export-led growth is well documented in the literature (see Amiti and Freund 2008).
Nevertheless, the strategies of increasing agricultural productivity and increasing labor-intensive exports are not free from criticisms It is argued, particularly by environmentalists, that these strategies tend to have negative implications on the environment due to over-exploitation and pollution of natural resources such as water and atmosphere. Of these, the influence of the latter cause of pollution on environment is more alarming. The Stern Review on the Economics of Climate Change estimates that climate change will lead to the loss of at least 5% of global gross domestic product (GDP) each year, now and forever, if no action is taken to nullify its negative effects. If one considers a wider range of risks and impacts, the estimates of environmental damage could rise to 20% of GDP, or more (Stern 2006). In the present situation of global financial crisis, such negative influence, particularly of increased exports on environment could get worsened because it is rational for both developed and developing countries to find ways to increase their exports at any costs by using cheap inputs including energy and the casualty in most cases is the environment, which has a direct bearing on poverty (Kalirajan 2009).
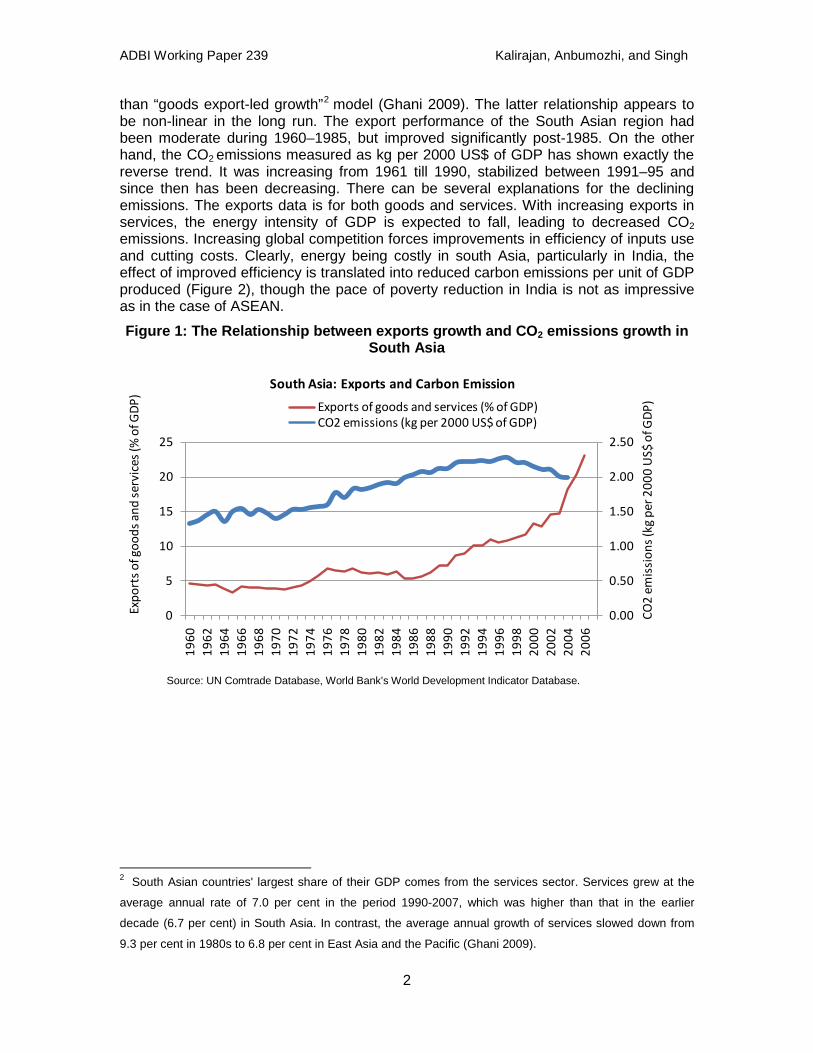
However, the link between increased exports and carbon dioxide (CO2) emissions may vary across countries depending on how serious they are about using clean technologies and what types of goods they are exporting. It is interesting to note the impact of composition of exports on emissions. For example, Figure 1 shows the relationship between export growth and CO2 emissions growth in major South Asian countries, which are considered to be following the “services-led growth” model rather
* The authors thank Professor Shandre Thangavelu for his valuable comments and suggestions. 1 Recently, the World Bank revised its poverty estimates based on new measures which incorporate the
price information of the developing countries more accurately. For a clear exposition on this, see Bauer et al. (2008).
ADBI Working Paper 239 Kalirajan, Anbumozhi, and Singh
2
than “goods export-led growth”2
Figure 1: The Relationship between exports growth and CO2 emissions growth in South Asia
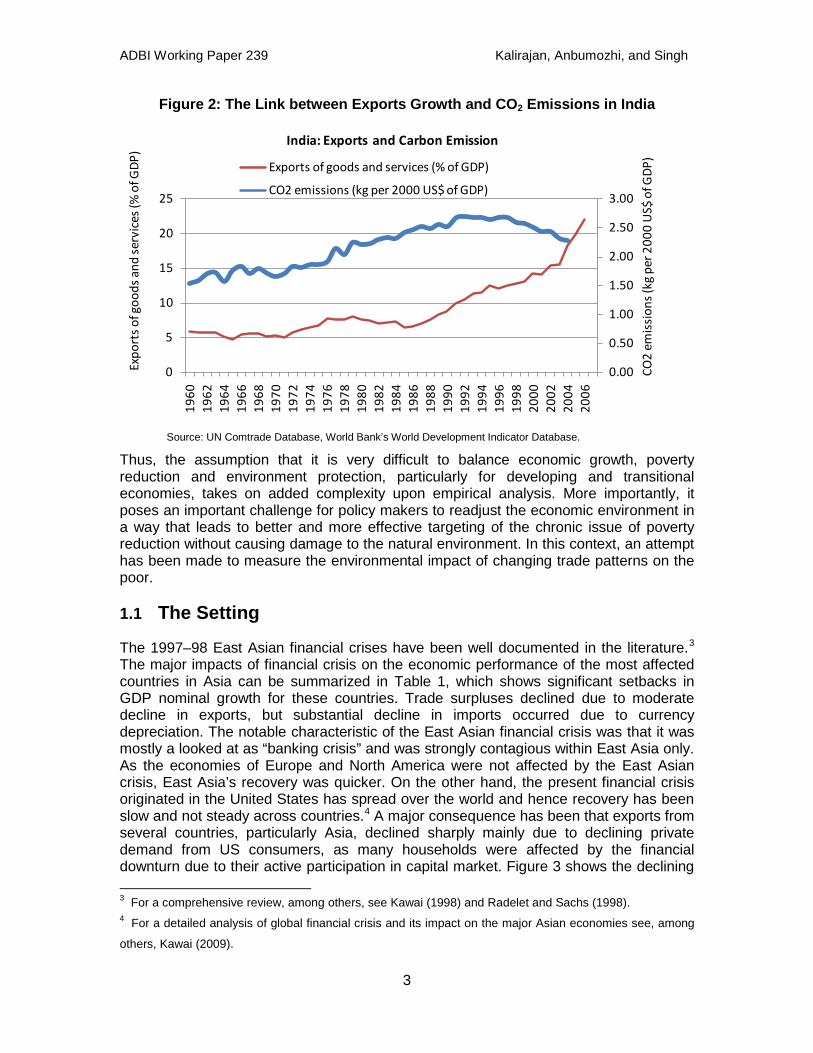
model (Ghani 2009). The latter relationship appears to be non-linear in the long run. The export performance of the South Asian region had been moderate during 1960–1985, but improved significantly post-1985. On the other hand, the CO2 emissions measured as kg per 2000 US$ of GDP has shown exactly the reverse trend. It was increasing from 1961 till 1990, stabilized between 1991–95 and since then has been decreasing. There can be several explanations for the declining emissions. The exports data is for both goods and services. With increasing exports in services, the energy intensity of GDP is expected to fall, leading to decreased CO2 emissions. Increasing global competition forces improvements in efficiency of inputs use and cutting costs. Clearly, energy being costly in south Asia, particularly in India, the effect of improved efficiency is translated into reduced carbon emissions per unit of GDP produced (Figure 2), though the pace of poverty reduction in India is not as impressive as in the case of ASEAN.
Source: UN Comtrade Database, World Bank’s World Development Indicator Database.
2 South Asian countries' largest share of their GDP comes from the services sector. Services grew at the
average annual rate of 7.0 per cent in the period 1990-2007, which was higher than that in the earlier
decade (6.7 per cent) in South Asia. In contrast, the average annual growth of services slowed down from
9.3 per cent in 1980s to 6.8 per cent in East Asia and the Pacific (Ghani 2009).
0.00
0.50
1.00
1.50
2.00
2.50
0
5
10
15
20
25
1960
1962
1964
1966
1968
1970
1972
1974
1976
1978
1980
1982
1984
1986
1988
1990
1992
1994
1996
1998
2000
2002
2004
2006
CO2
emis
sion
s (k
g pe
r 200
0 U
S$ o
f GD
P)
Expo
rts
of g
oods
and
ser
vice
s (%
of G
DP)
South Asia: Exports and Carbon Emission
Exports of goods and services (% of GDP) CO2 emissions (kg per 2000 US$ of GDP)
ADBI Working Paper 239 Kalirajan, Anbumozhi, and Singh
3
Figure 2: The Link between Exports Growth and CO2 Emissions in India
0.00
0.50
1.00
1.50
2.00
2.50
3.00
0
5
10
15
20
2519
6019
6219
6419
6619
6819
7019
7219
7419
7619
7819
8019
8219
8419
8619
8819
9019
9219
9419
9619
9820
0020
0220
0420
06
CO2
emis
sion
s (k
g pe
r 200
0 U
S$ o
f GD
P)
Expo
rts
of g
oods
and
ser
vice
s (%
of G
DP)
India: Exports and Carbon Emission
Exports of goods and services (% of GDP)
CO2 emissions (kg per 2000 US$ of GDP)
Source: UN Comtrade Database, World Bank’s World Development Indicator Database.
Thus, the assumption that it is very difficult to balance economic growth, poverty reduction and environment protection, particularly for developing and transitional economies, takes on added complexity upon empirical analysis. More importantly, it poses an important challenge for policy makers to readjust the economic environment in a way that leads to better and more effective targeting of the chronic issue of poverty reduction without causing damage to the natural environment. In this context, an attempt has been made to measure the environmental impact of changing trade patterns on the poor.
1.1 The Setting
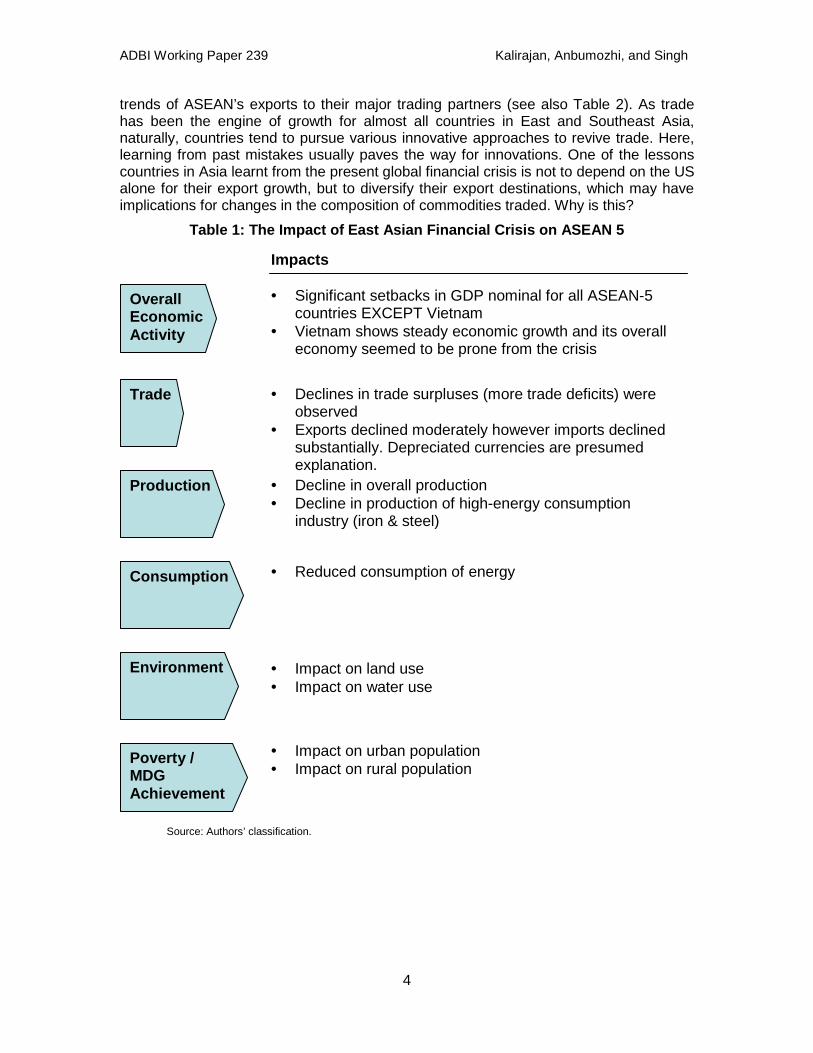
The 1997–98 East Asian financial crises have been well documented in the literature.3 The major impacts of financial crisis on the economic performance of the most affected countries in Asia can be summarized in Table 1, which shows significant setbacks in GDP nominal growth for these countries. Trade surpluses declined due to moderate decline in exports, but substantial decline in imports occurred due to currency depreciation. The notable characteristic of the East Asian financial crisis was that it was mostly a looked at as “banking crisis” and was strongly contagious within East Asia only. As the economies of Europe and North America were not affected by the East Asian crisis, East Asia’s recovery was quicker. On the other hand, the present financial crisis originated in the United States has spread over the world and hence recovery has been slow and not steady across countries.4
3 For a comprehensive review, among others, see Kawai (1998) and Radelet and Sachs (1998).
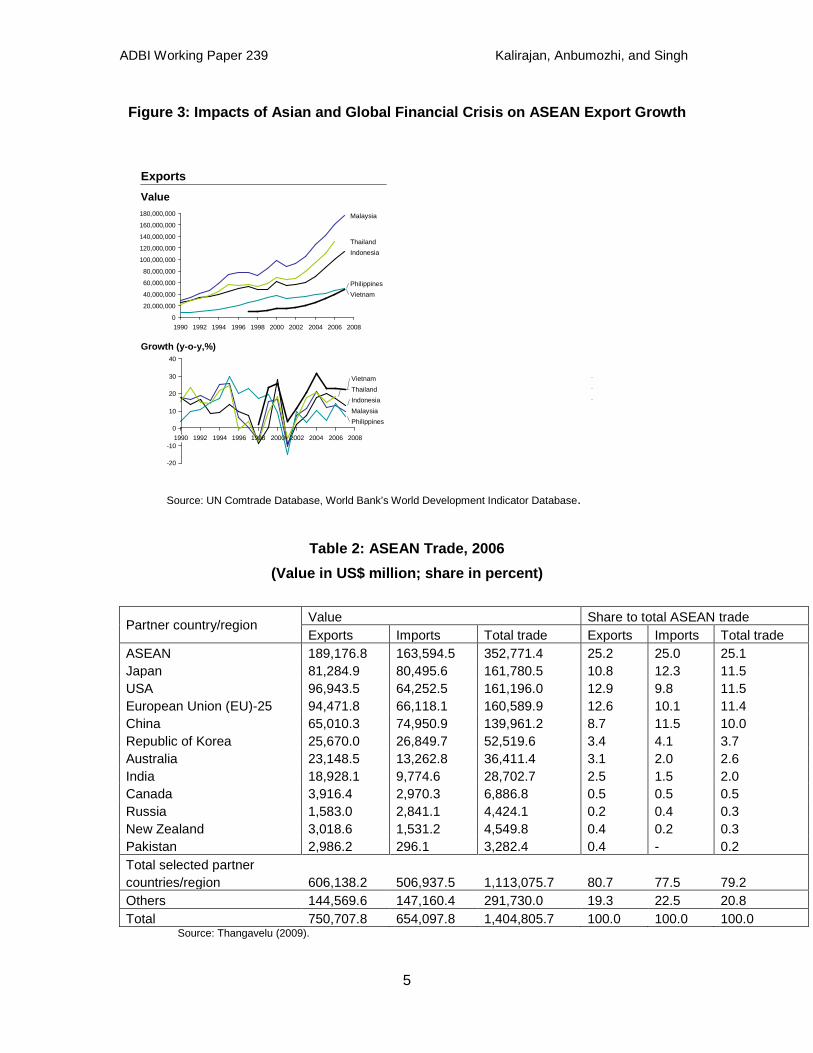
A major consequence has been that exports from several countries, particularly Asia, declined sharply mainly due to declining private demand from US consumers, as many households were affected by the financial downturn due to their active participation in capital market. Figure 3 shows the declining
4 For a detailed analysis of global financial crisis and its impact on the major Asian economies see, among
others, Kawai (2009).
ADBI Working Paper 239 Kalirajan, Anbumozhi, and Singh
4
trends of ASEAN’s exports to their major trading partners (see also Table 2). As trade has been the engine of growth for almost all countries in East and Southeast Asia, naturally, countries tend to pursue various innovative approaches to revive trade. Here, learning from past mistakes usually paves the way for innovations. One of the lessons countries in Asia learnt from the present global financial crisis is not to depend on the US alone for their export growth, but to diversify their export destinations, which may have implications for changes in the composition of commodities traded. Why is this?
Table 1: The Impact of East Asian Financial Crisis on ASEAN 5
Source: Authors’ classification.
Production
Trade
Consumption
Environment
Impacts
• Decline in overall production • Decline in production of high-energy consumption
industry (iron & steel)
• Declines in trade surpluses (more trade deficits) were observed
• Exports declined moderately however imports declined substantially. Depreciated currencies are presumed explanation.
• Impact on land use • Impact on water use
• Reduced consumption of energy
Overall Economic Activity
• Significant setbacks in GDP nominal for all ASEAN-5 countries EXCEPT Vietnam
• Vietnam shows steady economic growth and its overall economy seemed to be prone from the crisis
Poverty / MDG Achievement
• Impact on urban population • Impact on rural population
ADBI Working Paper 239 Kalirajan, Anbumozhi, and Singh
5
Figure 3: Impacts of Asian and Global Financial Crisis on ASEAN Export Growth
0
20,000,000
40,000,000
60,000,000
80,000,000
100,000,000
120,000,000
140,000,000
160,000,000
180,000,000
1990 1992 1994 1996 1998 2000 2002 2004 2006 2008
Malaysia
Philippines
Thailand
Vietnam
Indonesia
-20
-10
0
10
20
30
40
1990 1992 1994 1996 1998 2000 2002 2004 2006 2008
IndonesiaMalaysiaPhilippines
ThailandVietnam
ExportsValue
Growth (y-o-y,%)
Source: UN Comtrade Database, World Bank’s World Development Indicator Database.
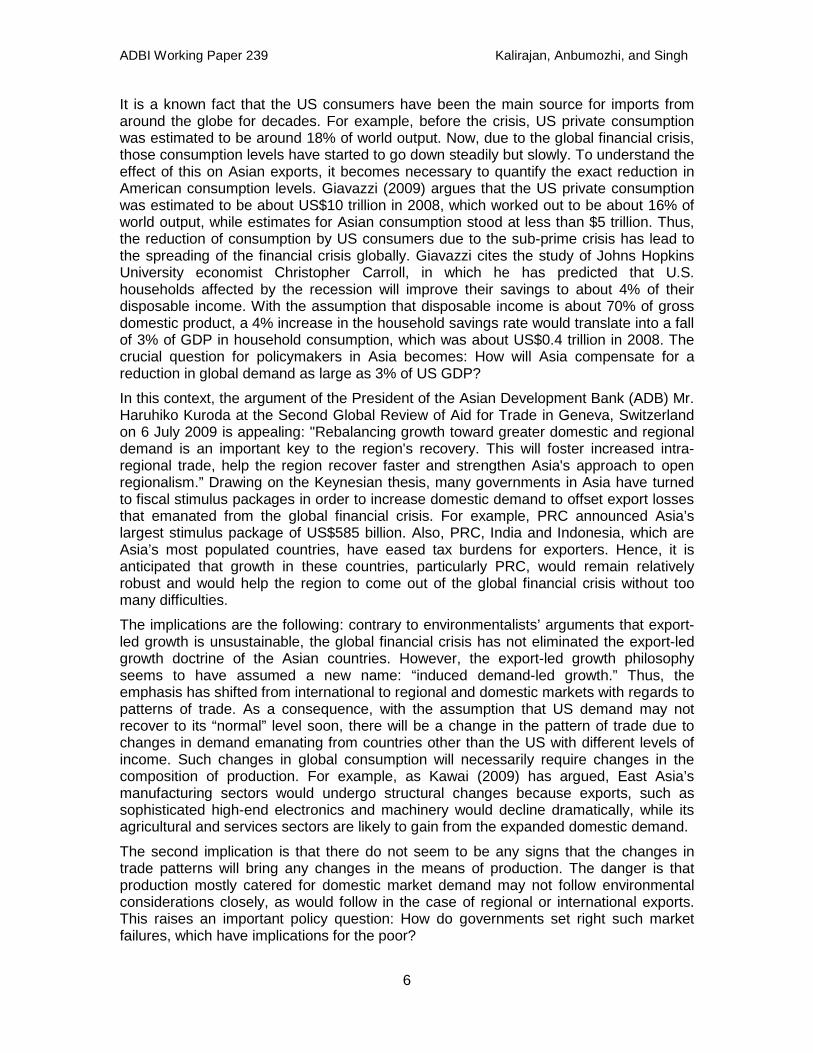
Table 2: ASEAN Trade, 2006 (Value in US$ million; share in percent)
Partner country/region Value Share to total ASEAN trade Exports Imports Total trade Exports Imports Total trade
ASEAN 189,176.8 163,594.5 352,771.4 25.2 25.0 25.1 Japan 81,284.9 80,495.6 161,780.5 10.8 12.3 11.5 USA 96,943.5 64,252.5 161,196.0 12.9 9.8 11.5 European Union (EU)-25 94,471.8 66,118.1 160,589.9 12.6 10.1 11.4 China 65,010.3 74,950.9 139,961.2 8.7 11.5 10.0 Republic of Korea 25,670.0 26,849.7 52,519.6 3.4 4.1 3.7 Australia 23,148.5 13,262.8 36,411.4 3.1 2.0 2.6 India 18,928.1 9,774.6 28,702.7 2.5 1.5 2.0 Canada 3,916.4 2,970.3 6,886.8 0.5 0.5 0.5 Russia 1,583.0 2,841.1 4,424.1 0.2 0.4 0.3 New Zealand 3,018.6 1,531.2 4,549.8 0.4 0.2 0.3 Pakistan 2,986.2 296.1 3,282.4 0.4 - 0.2 Total selected partner countries/region 606,138.2 506,937.5 1,113,075.7 80.7 77.5 79.2 Others 144,569.6 147,160.4 291,730.0 19.3 22.5 20.8 Total 750,707.8 654,097.8 1,404,805.7 100.0 100.0 100.0
Source: Thangavelu (2009).
ADBI Working Paper 239 Kalirajan, Anbumozhi, and Singh
6
It is a known fact that the US consumers have been the main source for imports from around the globe for decades. For example, before the crisis, US private consumption was estimated to be around 18% of world output. Now, due to the global financial crisis, those consumption levels have started to go down steadily but slowly. To understand the effect of this on Asian exports, it becomes necessary to quantify the exact reduction in American consumption levels. Giavazzi (2009) argues that the US private consumption was estimated to be about US$10 trillion in 2008, which worked out to be about 16% of world output, while estimates for Asian consumption stood at less than $5 trillion. Thus, the reduction of consumption by US consumers due to the sub-prime crisis has lead to the spreading of the financial crisis globally. Giavazzi cites the study of Johns Hopkins University economist Christopher Carroll, in which he has predicted that U.S. households affected by the recession will improve their savings to about 4% of their disposable income. With the assumption that disposable income is about 70% of gross domestic product, a 4% increase in the household savings rate would translate into a fall of 3% of GDP in household consumption, which was about US$0.4 trillion in 2008. The crucial question for policymakers in Asia becomes: How will Asia compensate for a reduction in global demand as large as 3% of US GDP?
In this context, the argument of the President of the Asian Development Bank (ADB) Mr. Haruhiko Kuroda at the Second Global Review of Aid for Trade in Geneva, Switzerland on 6 July 2009 is appealing: "Rebalancing growth toward greater domestic and regional demand is an important key to the region's recovery. This will foster increased intra-regional trade, help the region recover faster and strengthen Asia's approach to open regionalism.” Drawing on the Keynesian thesis, many governments in Asia have turned to fiscal stimulus packages in order to increase domestic demand to offset export losses that emanated from the global financial crisis. For example, PRC announced Asia’s largest stimulus package of US$585 billion. Also, PRC, India and Indonesia, which are Asia’s most populated countries, have eased tax burdens for exporters. Hence, it is anticipated that growth in these countries, particularly PRC, would remain relatively robust and would help the region to come out of the global financial crisis without too many difficulties.
The implications are the following: contrary to environmentalists’ arguments that export-led growth is unsustainable, the global financial crisis has not eliminated the export-led growth doctrine of the Asian countries. However, the export-led growth philosophy seems to have assumed a new name: “induced demand-led growth.” Thus, the emphasis has shifted from international to regional and domestic markets with regards to patterns of trade. As a consequence, with the assumption that US demand may not recover to its “normal” level soon, there will be a change in the pattern of trade due to changes in demand emanating from countries other than the US with different levels of income. Such changes in global consumption will necessarily require changes in the composition of production. For example, as Kawai (2009) has argued, East Asia’s manufacturing sectors would undergo structural changes because exports, such as sophisticated high-end electronics and machinery would decline dramatically, while its agricultural and services sectors are likely to gain from the expanded domestic demand.
The second implication is that there do not seem to be any signs that the changes in trade patterns will bring any changes in the means of production. The danger is that production mostly catered for domestic market demand may not follow environmental considerations closely, as would follow in the case of regional or international exports. This raises an important policy question: How do governments set right such market failures, which have implications for the poor?
ADBI Working Paper 239 Kalirajan, Anbumozhi, and Singh
7
Specifically, the objective of this paper is to examine the environmental impact of changing trade patterns on the poor. There are many factors that link environment, trade and the poor. Of these, the important ones which can be influenced to create positive links through government policy reforms are: energy used in production, the scale of production, which has bearing on transportation used in moving goods, and the composition of goods produced. Accordingly, the focus of this paper is measuring the environmental impact of changing trade patterns on the poor through the analysis of these three factors of energy use, transportation, and composition of goods produced.
The following section discusses theoretical links between the impact of trade on environment and the poor. The next section examines the empirical findings concerning the links between the impact of trade on environment and the poor in Asia. The following section suggests alternative methods to reduce the negative environmental impact of changing trade patterns on the poor. A final section brings out the overall policy conclusions of this paper.
2. ENVIRONMENTAL IMPACTS OF TRADE PATTERNS ON THE POOR: THEORETICAL PROPOSITIONS
Drawing on the East Asian growth model of export-led growth, it is rational to argue that increased exports would increase national income. Though controversial, core trade theories such as the Heckscher-Ohlin theorem argue that trade influences growth by improving total factor productivity growth through the deepening of both physical and human capital (Krugman and Obstfeld 2008). The Kuznets inverted “U” environmental curve doctrine emphasizes that with higher national income there are more efforts to improve environmental quality. Thus, the link between trade and growth and then environmental quality improvement appears to be logical. However, it is difficult to conclude that increased exports and improved environmental quality would directly reduce poverty, unless one has information about the scale of production, the type of composition of production and the type of technology used in production. Mass production would usually lead to increased pollution, but with the use of energy efficient technology, the level of pollution can be reduced. When the composition of production is taken into account the link between trade and poor becomes clear. To achieve sustainable growth through trade and poverty reduction simultaneously, exports need to be focused on the production of goods, a sector where the poor predominantly work.
Though it is contestable, the Stolper-Samuelson theorem asserts that an increase in the price of labor-intensive goods raises real labor incomes (Winters 1999). However, if labor-intensive manufacturing is carried out with inefficient technology in terms of energy use and pollution, the benefits of exports towards poverty reduction may be diminished due to the cost involved in cleaning up the damaged environment. Trade without a sound environmental policy can increase pollution and encourage overuse of environmental resources and thereby cause degradation/depletion of natural resources, which has a direct bearing on poverty. Therefore, exports of labor-intensive goods combined with sound environmental policy have the potential to reduce poverty and reduce environmental damage.
Policies are needed to promote “safe” trade by internalizing environmental externalities into both production and individual consumption decisions. There are many ways to internalize environmental externalities such as imposition of a “Pigouvian tax” (Garnaut et al. 2008) and “carbon trading.” Equivalently, it is imperative to introduce and monitor
ADBI Working Paper 239 Kalirajan, Anbumozhi, and Singh
8
harmonization of technical standards and regulations to improve trade between countries, which also has a positive impact on environmental protection. This is predicated on greater international cooperation and mutual recognition of technical standards and regulation across countries, which is very important to enhance trade in the region.5
It is conjecture to draw on the experiences of some countries, for example Japan and its efficient manufacturing, the conclusion that it is possible to increase and sustain positive links between exports, environment and poverty reduction by promoting the “2T’s”— technology and transferability. A production technology with less impact on the environmental that can be transported with little or no environmental degradation has the potential to transfer the benefits arising from exports of such goods into the process of poverty reduction effectively. Among others, “service-led” growth and trade in environmental goods and services (EGS) provide avenues to achieve the above objective because their environmental impacts would be less dramatic, but their impact on the pace of poverty reduction would be significant, which are discussed in the following pages. This does not mean that “manufacturing-led” growth should be neglected completely, as most of the manufacturing in developing countries is labor-intensive. What it means that the shares of services and trade in EGS in GDP should be increased from their present levels, while environmentally friendly technologies are used in manufacturing.
On the other hand, environmental policy in the form of standards higher than the international norms may affect market access and become non-tariff barriers to trade. Multilateral environmental agreements (MEAs) may require the use of trade measures to achieve environmental policy goals (Sankar 2007).
2.1 Environmental Impacts of Trade on the Poor: Empirical Findings in Asia
Given the complexity involved concerning the links between trade, environment and poverty reduction, it becomes necessary to focus on some specified areas of such links that require immediate attention. Researchers have argued that transforming into a low carbon economy is a powerful method to effectively achieve the multiple objectives of energy security, climate change mitigation and poverty reduction (Venkatachalam and Kawai 2009). Hence, the research in this paper is restricted to an analysis of energy production and consumption, which are dependent on the type, scale and method of production of goods and services and production’s overall impact on the environment and poverty. Increased demand for exports, and increased urbanization lead to increased production, which in turn increases the demand for energy. How is the growing energy demand met? There are different kinds of energy resources, which include coal, oil, gas, hydro, biomass, nuclear, and other forms of renewable energy. Of these sources, coal, oil and gas emit greenhouse gases causing climate change: CO2 is the dominant anthropogenic greenhouse gas (Kalirajan 2009). Unfortunately, these three are the major sources of energy used in almost all countries around the world due to their availability. About 80% of primary energy supplies comes from these three sources and their contribution is predicted to rise to 86% in 2030 (International Energy Agency 2009). Table 3 shows the actual marketed total energy use and its projections to 2030. Among the non-Organisation for Economic Co-operation and Development (OECD) Asian countries, People’s Republic of China (PRC) and India have been using more energy than other developing countries in Asia (International Energy Agency 2009). PRC 5 Some of the major harmonization policies of ASEAN are given in Appendix I.
ADBI Working Paper 239 Kalirajan, Anbumozhi, and Singh
9
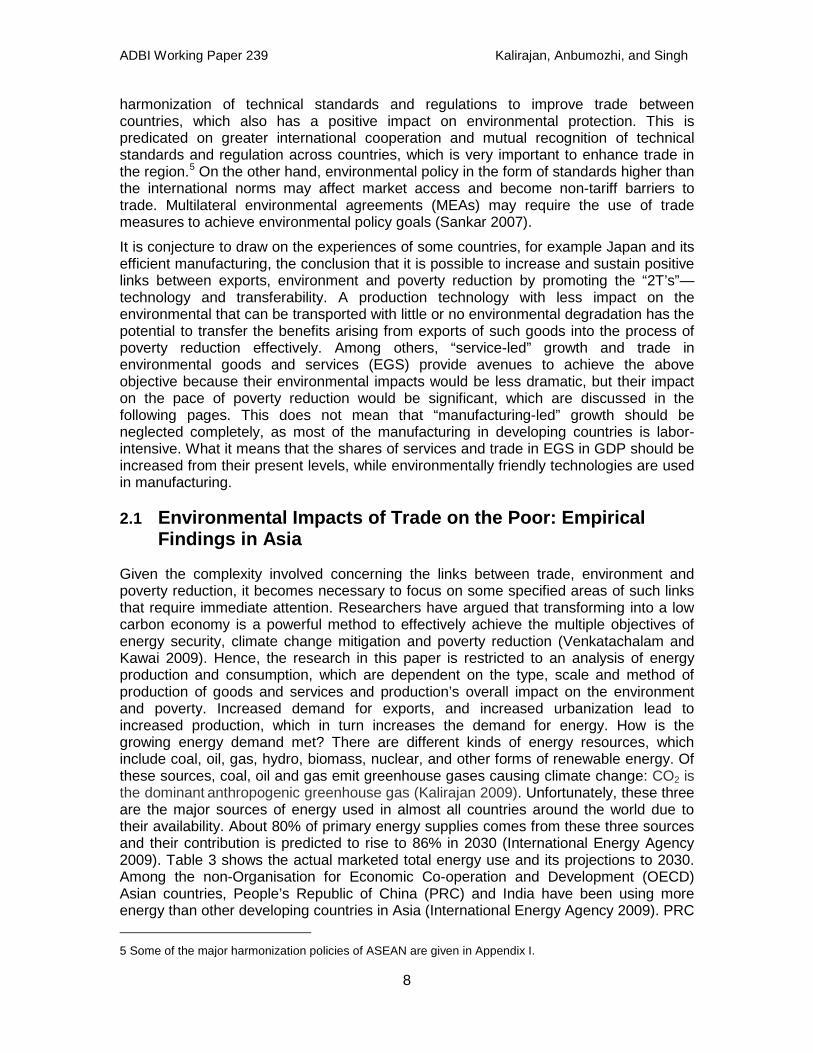
and India will account for about 20% of marketed energy use in 2010 and their shares are projected to increase to 28% in 2030, which would significantly exceed the energy use of the United States. The World Energy Outlook 2008 shows that world energy demand would increase by 45% from 2008 to 2030 with coal accounting for more than a third of the overall rise in demand (International Energy Agency 2008).
Table 3: Marketed Energy Use (Actual and Projected)
Year PRC and India
Rest of Non-OECD Asia United States Rest of World Total
1990 34.9 12.5 84.7 228.1 347.7
2000 50.6 20.7
99.0 248.3 397.9
2006 91.5 26.1
100.0 280.9 472.4
2010 109.6 29.6 99.9 298.8 508.3
2020 150.9 39.4
105.4 339.5 595.7
2030 188.1 51.5
113.6 376.6 678.3 Source: International Energy Agency (2009).
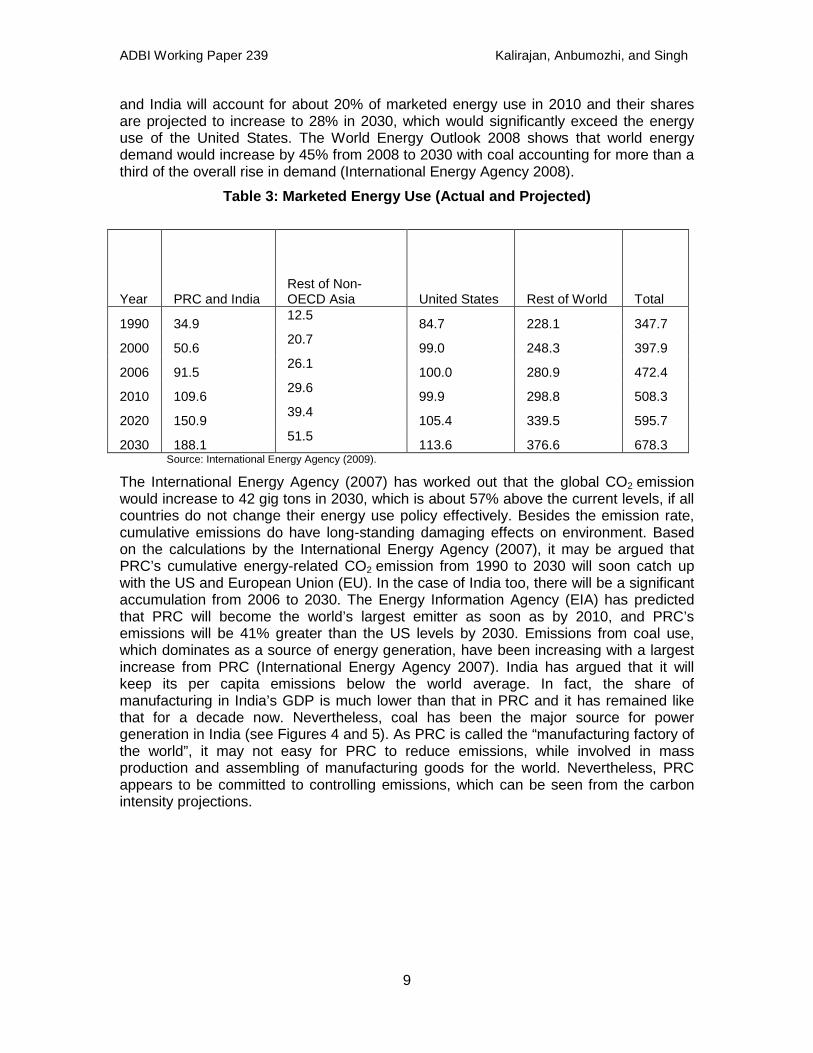
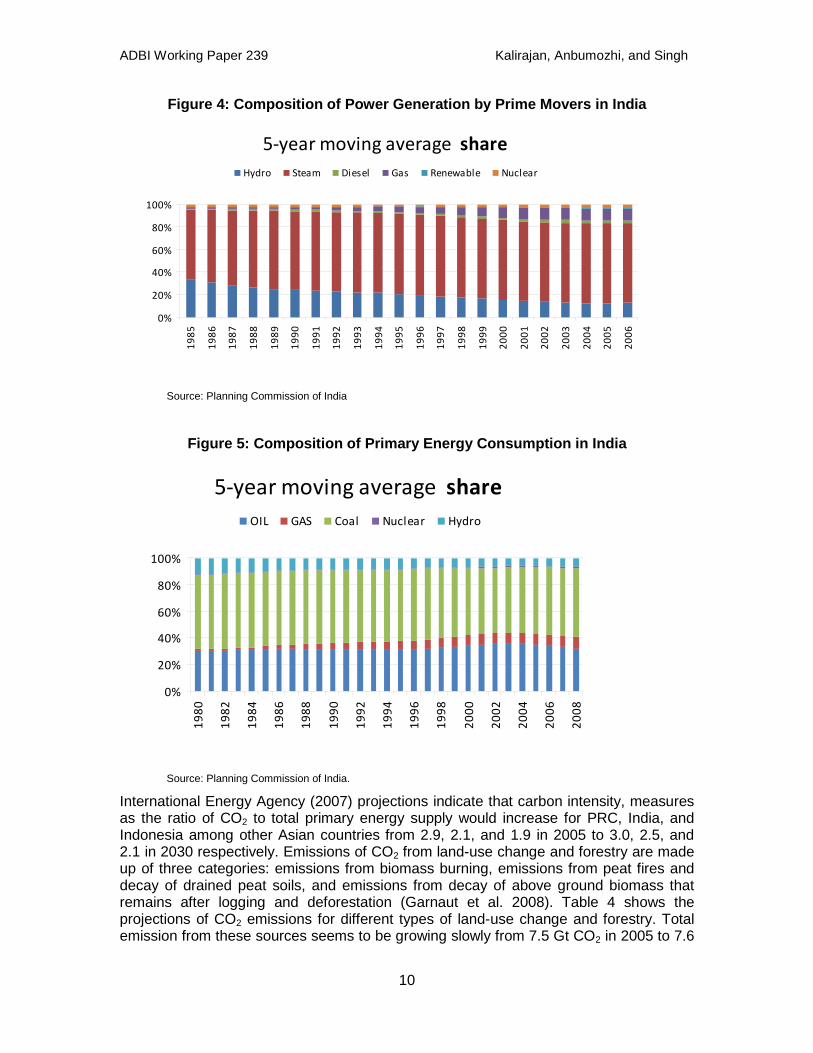
The International Energy Agency (2007) has worked out that the global CO2 emission would increase to 42 gig tons in 2030, which is about 57% above the current levels, if all countries do not change their energy use policy effectively. Besides the emission rate, cumulative emissions do have long-standing damaging effects on environment. Based on the calculations by the International Energy Agency (2007), it may be argued that PRC’s cumulative energy-related CO2 emission from 1990 to 2030 will soon catch up with the US and European Union (EU). In the case of India too, there will be a significant accumulation from 2006 to 2030. The Energy Information Agency (EIA) has predicted that PRC will become the world’s largest emitter as soon as by 2010, and PRC’s emissions will be 41% greater than the US levels by 2030. Emissions from coal use, which dominates as a source of energy generation, have been increasing with a largest increase from PRC (International Energy Agency 2007). India has argued that it will keep its per capita emissions below the world average. In fact, the share of manufacturing in India’s GDP is much lower than that in PRC and it has remained like that for a decade now. Nevertheless, coal has been the major source for power generation in India (see Figures 4 and 5). As PRC is called the “manufacturing factory of the world”, it may not easy for PRC to reduce emissions, while involved in mass production and assembling of manufacturing goods for the world. Nevertheless, PRC appears to be committed to controlling emissions, which can be seen from the carbon intensity projections.
ADBI Working Paper 239 Kalirajan, Anbumozhi, and Singh
10
Figure 4: Composition of Power Generation by Prime Movers in India
5-year moving average share
0%
20%
40%
60%
80%
100%19
85
1986
1987
1988
1989
1990
1991
1992
1993
1994
1995
1996
1997
1998
1999
2000
2001
2002
2003
2004
2005
2006
Hydro Steam Diesel Gas Renewable Nuclear
Source: Planning Commission of India
Figure 5: Composition of Primary Energy Consumption in India
5-year moving average share
0%
20%
40%
60%
80%
100%
1980
1982
1984
1986
1988
1990
1992
1994
1996
1998
2000
2002
2004
2006
2008
OIL GAS Coal Nuclear Hydro
Source: Planning Commission of India.
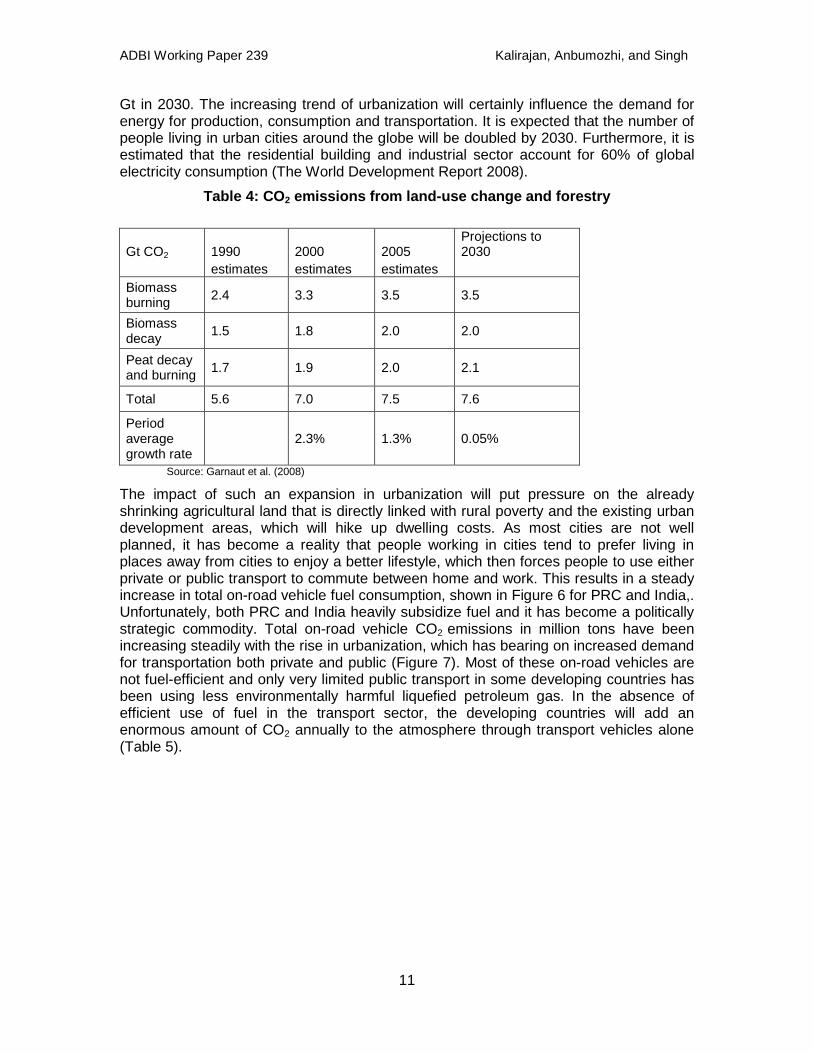
International Energy Agency (2007) projections indicate that carbon intensity, measures as the ratio of CO2 to total primary energy supply would increase for PRC, India, and Indonesia among other Asian countries from 2.9, 2.1, and 1.9 in 2005 to 3.0, 2.5, and 2.1 in 2030 respectively. Emissions of CO2 from land-use change and forestry are made up of three categories: emissions from biomass burning, emissions from peat fires and decay of drained peat soils, and emissions from decay of above ground biomass that remains after logging and deforestation (Garnaut et al. 2008). Table 4 shows the projections of CO2 emissions for different types of land-use change and forestry. Total emission from these sources seems to be growing slowly from 7.5 Gt CO2 in 2005 to 7.6
ADBI Working Paper 239 Kalirajan, Anbumozhi, and Singh
11
Gt in 2030. The increasing trend of urbanization will certainly influence the demand for energy for production, consumption and transportation. It is expected that the number of people living in urban cities around the globe will be doubled by 2030. Furthermore, it is estimated that the residential building and industrial sector account for 60% of global electricity consumption (The World Development Report 2008).
Table 4: CO2 emissions from land-use change and forestry
Gt CO2 1990 2000 2005 Projections to 2030
estimates estimates estimates Biomass burning 2.4 3.3 3.5 3.5
Biomass decay 1.5 1.8 2.0 2.0
Peat decay and burning 1.7 1.9 2.0 2.1
Total 5.6 7.0 7.5 7.6
Period average growth rate
2.3% 1.3% 0.05%
Source: Garnaut et al. (2008)
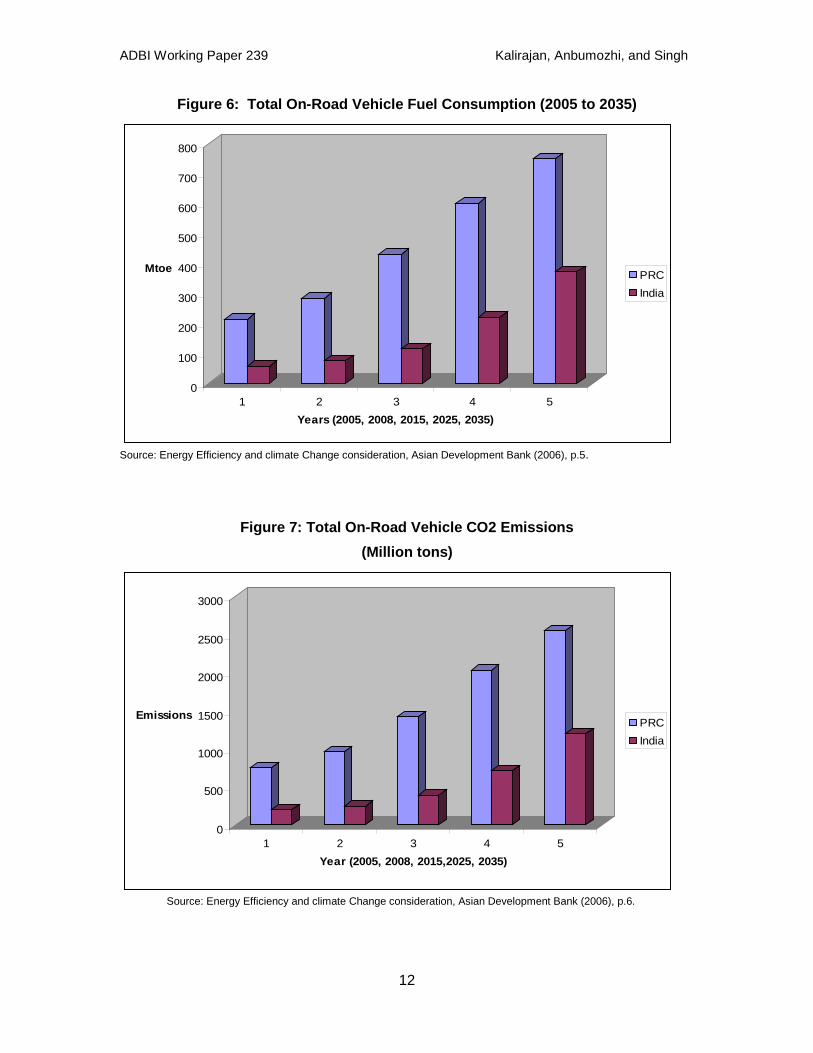
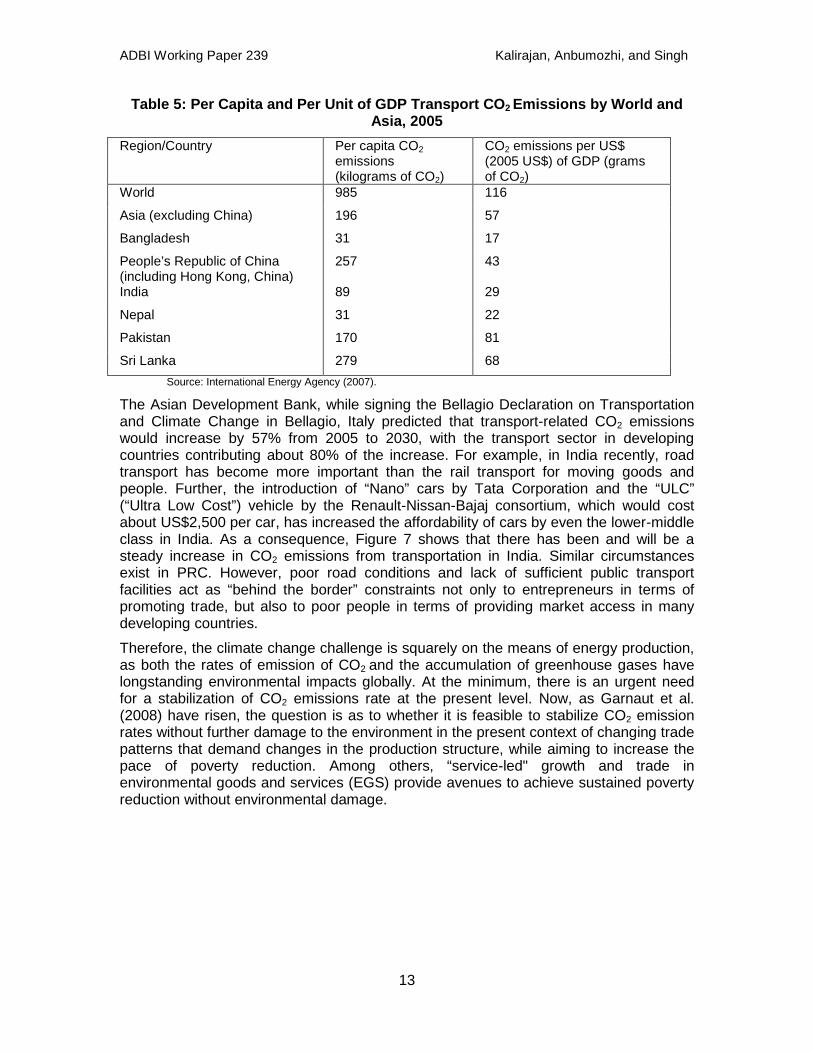
The impact of such an expansion in urbanization will put pressure on the already shrinking agricultural land that is directly linked with rural poverty and the existing urban development areas, which will hike up dwelling costs. As most cities are not well planned, it has become a reality that people working in cities tend to prefer living in places away from cities to enjoy a better lifestyle, which then forces people to use either private or public transport to commute between home and work. This results in a steady increase in total on-road vehicle fuel consumption, shown in Figure 6 for PRC and India,. Unfortunately, both PRC and India heavily subsidize fuel and it has become a politically strategic commodity. Total on-road vehicle CO2 emissions in million tons have been increasing steadily with the rise in urbanization, which has bearing on increased demand for transportation both private and public (Figure 7). Most of these on-road vehicles are not fuel-efficient and only very limited public transport in some developing countries has been using less environmentally harmful liquefied petroleum gas. In the absence of efficient use of fuel in the transport sector, the developing countries will add an enormous amount of CO2 annually to the atmosphere through transport vehicles alone (Table 5).
ADBI Working Paper 239 Kalirajan, Anbumozhi, and Singh
12
Figure 6: Total On-Road Vehicle Fuel Consumption (2005 to 2035)
0
100
200
300
400
500
600
700
800
Mtoe
1 2 3 4 5Years (2005, 2008, 2015, 2025, 2035)
PRCIndia
Source: Energy Efficiency and climate Change consideration, Asian Development Bank (2006), p.5.
Figure 7: Total On-Road Vehicle CO2 Emissions (Million tons)
0
500
1000
1500
2000
2500
3000
Emissions
1 2 3 4 5Year (2005, 2008, 2015,2025, 2035)
PRCIndia
Source: Energy Efficiency and climate Change consideration, Asian Development Bank (2006), p.6.
ADBI Working Paper 239 Kalirajan, Anbumozhi, and Singh
13
Table 5: Per Capita and Per Unit of GDP Transport CO2 Emissions by World and Asia, 2005
Region/Country Per capita CO2 emissions (kilograms of CO2)
CO2 emissions per US$ (2005 US$) of GDP (grams of CO2)
World 985 116
Asia (excluding China) 196 57
Bangladesh 31 17
People’s Republic of China (including Hong Kong, China)
257 43
India 89 29
Nepal 31 22
Pakistan 170 81
Sri Lanka 279 68 Source: International Energy Agency (2007).
The Asian Development Bank, while signing the Bellagio Declaration on Transportation and Climate Change in Bellagio, Italy predicted that transport-related CO2 emissions would increase by 57% from 2005 to 2030, with the transport sector in developing countries contributing about 80% of the increase. For example, in India recently, road transport has become more important than the rail transport for moving goods and people. Further, the introduction of “Nano” cars by Tata Corporation and the “ULC” (“Ultra Low Cost”) vehicle by the Renault-Nissan-Bajaj consortium, which would cost about US$2,500 per car, has increased the affordability of cars by even the lower-middle class in India. As a consequence, Figure 7 shows that there has been and will be a steady increase in CO2 emissions from transportation in India. Similar circumstances exist in PRC. However, poor road conditions and lack of sufficient public transport facilities act as “behind the border” constraints not only to entrepreneurs in terms of promoting trade, but also to poor people in terms of providing market access in many developing countries.
Therefore, the climate change challenge is squarely on the means of energy production, as both the rates of emission of CO2 and the accumulation of greenhouse gases have longstanding environmental impacts globally. At the minimum, there is an urgent need for a stabilization of CO2 emissions rate at the present level. Now, as Garnaut et al. (2008) have risen, the question is as to whether it is feasible to stabilize CO2 emission rates without further damage to the environment in the present context of changing trade patterns that demand changes in the production structure, while aiming to increase the pace of poverty reduction. Among others, “service-led" growth and trade in environmental goods and services (EGS) provide avenues to achieve sustained poverty reduction without environmental damage.
ADBI Working Paper 239 Kalirajan, Anbumozhi, and Singh
14
3. SERVICE-LED GROWTH AND TRADE IN ENVIRONMENTAL GOODS AND SERVICES
Drawing on the Heckscher-Ohlin theory (Krugman and Obstefeld 2008), it is customary to argue that developing countries with a relatively abundant supply of low-skilled labor should concentrate on labor-intensive production and export of goods, including agriculture to reduce poverty. However, empirical studies have asserted that mere relative abundance in low-skilled labor will not guarantee sustained growth of labor-intensive exports (Ninkovic 2009) if the countries do not have good transportation and telecommunications infrastructures. Thus, labor availability should be complemented with improved physical infrastructures to boost labor-intensive production and exports to impact on poverty reduction. At the same time, such production should be environment-friendly.
This implies that if efficient transport and telecommunications infrastructures aren’t in place, the suggested path of growth under traditional theories of trade for developing countries has positive implications on poverty reduction through economic growth, but may have negative implications on environment. Therefore, the importance of having an “environmentally safe pro-growth trade policy” that minimizes the damages caused by environmental externalities arising from production and consumption decisions of individuals, and that increases the pace of poverty reduction need not be overemphasized. Such an “environmentally safe pro-growth trade policy” can be sustained through the “2T’s”—technology, and transferability.
Efficient energy-generating technologies, including renewable energy technologies, assume primary importance in the context of mass production of manufacturing goods for consumption nationally and internationally. These technologies, such as the ultra-supercritical pressure coal-fired power generation technology (USCT), which is an efficient and widely accepted power generation technology used worldwide, can meet future energy demand without significantly increasing CO2 emissions. This necessitates acceleration towards technology transfer from developed to developing countries. For example, only about 2% of the total capacity of coal-fire power generators in India is generated by USCT. Many countries may not view the Global Carbon Emissions Trading Scheme favorably because the inflow of foreign exchange through the Global Carbon Emissions into developing economies has the potential to lead to an appreciation of their real exchange rates vis-à-vis the developed economies. This results in lowered export competitiveness for developing countries. Therefore, the Global Carbon Emissions Trading Scheme needs to be supplemented with a well-defined technology transfer policy and safety mechanisms that will not lower the export competitiveness of developing countries.
With respect to the “wind energy”, the National Development and Reform Committee (2008) in PRC declared that at present PRC cannot produce wind power turbines larger than 1000kw, and that the core technology of manufacturing big wind turbines is still being imported from developed countries. In this context, the Clean Technology Fund (CTF) and Strategic Climate Fund (SCF) should be further strengthened and used effectively to help developing countries receive efficient technology from developed countries. Though the use of renewable energy sources need to be intensified, it becomes necessary to take note of the high cost involved in developing such sources in developing countries. For example, producing solar panels in developing countries is
ADBI Working Paper 239 Kalirajan, Anbumozhi, and Singh
15
very costly due to lack of technology and intermediate inputs. It is reported that even in developed countries such as Australia, the solar panel business is not doing well due to the high cost of installation. Trade policies in some countries do not provide a favorable environment for importing parts for building renewable energy equipments. For example, the import tariff on large wind power generation equipment is the main cause of the high cost of operating wind power plants in PRC. Despite the fact that from January 2008 PRC has started to use a preference tariff policy on the wind power equipments, the system has several limitations leading to rent-seeking activities by firms and bureaucracy, which need to be rectified effectively.
The mass production of manufacturing goods requires transportation facilities from both the production and export point of view. While shipping and air transportation are important, road transportation has the greatest effect on CO2 emissions due to the large number of vehicles involved in road transportation. Integrated urban transport planning is necessary to reduce sizable emissions in the transport sector that is the backbone for moving people and goods across places. More research on fuel-efficient transport vehicles should be carried out either domestically or in collaboration with developed countries. Fuel price subsidies given by governments need to be removed. However, such a move might put pressure on the poor forcing them to pay higher charges for using public transport. Nevertheless, governments need to provide some kind of safety net, such as concession cards for the poor to use public transport without financial difficulties. The money saved from abolishing the fuel subsidy can then be used to carry out research and development of fuel-efficient transport systems. Thus, efficient technology transfer is central in promoting economic growth without seriously damaging the environment. Is it feasible to stop emissions from rising significantly further by changing the present commodity composition of exports? What will be the impact of such changes on growth? What are the ways to transfer the growth benefits to the poor? Here too, the role of “2T’s” is important.
One of the major impacts of the global financial crisis on the Asian economies is the urgent need to replace the consumption (Asia’s export) loss emanated from the reduced spending by US consumers. Given the fact that Asian consumption stood at US$5 trillion compared to the US consumption of US$10 trillion in 2008, it is possible to increase the Asian regional consumption to compensate for the export loss caused particularly by the US. However, based on Engel’s law, it is rational to argue that the basket of Asian regional consumption may not be the same as the basket of the US consumption due to the differences in their per capita income levels. Thus, as argued by Kawai (2009), for the existing type of domestic and regional income distribution in Asia, the expanded domestic demand and regional demand emanating from projected changing trade patterns may have to mostly be met with increased supply from the agricultural and service sectors.
The latest report on services by the World Trade Organization (WTO) (2009) argues that services represent the fastest growing sector of the global economy and two-thirds of global output is derived from the service sector. Just like manufacturing, services also contribute to improvement in productivity in both exporting and importing countries, which in turn impacts wages. For example, many studies have found a significant positive relationship between foreign outsourcing and productivity growth in the US (Amiti and Wei 2006; Olsen 2006). South Asian countries’ largest share of their GDP comes from the services sector. With evolving technologies, services are tradable without any harm to environment and they can be easily transported via satellite without any CO2 emissions. Service providers tend to concentrate in one geographical area in
ADBI Working Paper 239 Kalirajan, Anbumozhi, and Singh
16
order to take advantage of scale economies and externalities, as in the case of the manufacturing sector (Ghani 2009). It is estimated that the ratio of service trade to service output for developing countries has increased much faster than for developed countries. The implication is that developing countries have been able to concentrate on the production of services that are tradable. For example, a majority of information technology-enabled services in India are export oriented and the global financial crisis has not affected the off-shore market consumption of information technology services as severely as in the case of merchandise trade (Ghani 2009).
In terms of poverty reduction, contrary to general perceptions, researchers have proved empirically that service sector growth has significantly reduced poverty. For example, using Indian state level data, Ravallion and Dutt (1996) have shown that the service sector has significantly reduced poverty in India, while Ghani (2009) has obtained similar results using data from 50 countries. Such results can happen mainly through the existence of more flexible labor markets in developing countries, which can attract the informal sector into the formal sector activities that cater to the service sector, such as waiters in restaurants. Thus, a service sector that benefits from technological development also has the ability to transfer its growth benefits to the poor without causing any serious damage to environment. However, efficient transfer of growth to the poor depends on governments’ labor market policies, which facilitate easy market access and widespread participation by the poor. The problem of developing Asia’s rural sector, where the majority of the poor live, is one of providing productive employment to the unemployed, under-employed as well as seasonally employed labor forces. Added to this, there is low productivity of both land and labor in agriculture due to various environmental related problems, such as soil erosion and water scarcity.
The cumulative impact of all these factors is that rural employment is not adequate when measured against a time criterion, productivity criterion or income criterion. An effective way to tackle this problem is to diversify the rural economy through the development of production and trade in environmental goods and services (EGS) that helps greenhouse gas mitigation.6
Thus, EGS is an important means to promote the sustainable development goals laid out in the United Nations Millennium Development Goals and different multilateral environmental agreements, enhancing the mutual supportiveness of trade and environment, which can be seen from paragraph 31(iii) of the Doha Ministerial Declaration. An important factor concerning employment and productivity in EGS is technology, which is one of the “2T’s.” It is reported that about 50% of total EGS to be used by 2030 are yet to be created, which emphasizes the urgent need for funding and
In urban areas as well, the production of environmental goods is labor intensive. For example, environmental protection activities such as carbon sequestration and the Clean Development Mechanism (CDM) create demand for environment-related consultancy services. Some countries do have good potential to export such professional services, and exporting of such services can be sustained if demand for such services is created in the domestic market, allowing the sector to gain more experience. Export growth will, nevertheless, to a large extent depend on quality assurance and the removal of possible obstacles to the "mode 4" provision of services in overseas markets, which necessitates public-private partnerships towards promoting entrepreneurial abilities in this area (OECD 1998).
6 The OECD definition of EGS is given in the Appendix and there is a slight difference between APEC’s
definition and OECD’s definition of EGS (Steenblik 2005). For a comprehensive analysis of EGS, among other studies, see Jha (2008).
ADBI Working Paper 239 Kalirajan, Anbumozhi, and Singh
17
research and development (R & D) to develop and transfer technologies to developing countries (OECD 1998).
The value of global environmental industry production is estimated at over US$650 billion and trade in EGS is estimated to be around US$65 billion only. The three dominant market players have been the US with a share of 37%, Western Europe with a share of 30%, and Japan with a share of 18% (Jha 2008). Though other Asian countries are not big players in EGS market, the United Kingdom Joint Environmental Markets Unit has estimated that the market share of developing countries will be about 20% by 2010. Among ASEAN countries, Indonesia, Malaysia, the Philippines and Thailand are major consumers of EGS and their demand primarily is in the solid-waste handling and disposal services sector, and filtration and purification equipment for water and wastewater. In 2006, PRC and The Republic of Korea were the two Asian countries along with Japan among the top ten exports of the WTO’s “153” list. It is worth noting that PRC has become one of the leading exports in almost all categories of the “153” list. PRC also features along with Japan as one of the top importers of the “153” list (The World Bank 2007). Thus, PRC has been showing keen interest in promoting trade in EGS.
However, there are a few issues that need to be sorted out at the WTO, which may be the reason for non-active participation by other developing countries in EGS trade. For example, there is no clear distinction between goods intended solely for environmental uses and goods intended for both environmental and non-environmental uses. This raises concerns among developing countries about the dumping by developed countries of a broad range of industrial goods in the name of environmental goods, which may have implications for domestic industries and employment in developing countries. This issue needs to be sorted out quickly. Though tariff on trade in EGS is low in many countries, the bound tariff rates are high in South American countries. The issue in defining which goods are EGS may also lead to unnecessary non-tariff barriers.
4. CONCLUSIONS AND POLICY SUGGESTIONS Analyzing the environmental and poverty-reduction impacts of the emerging changing trade patterns and making policy suggestions to minimize environmental impacts and to accelerate the pace of poverty reduction are the main themes of this paper. Though there are many factors that connect the environment, trade, and the poor, a few factors stand out as particularly important from a policy point of view: energy used in production, the scale of production (which has bearing on transportation used in moving goods) and the composition of goods produced. Accordingly, this paper measures the environmental impact of changing trade patterns on the poor by analyzing the roles of these three factors (energy use, transportation and composition of goods produced).
The existing trade pattern involves mass production of manufacturing requiring heavy energy requirements and transportation, which have tremendously contributed to carbon dioxide (CO2) emissions and other environmental problems. Increasing urbanization and other land use practices have added to the flow and stock of emissions. Though trade is linked positively with growth in many cases, the pace of poverty reduction varies across countries. Thus, instead of pointing fingers at various actors for emergent environmental problems, it is imperative to find ways to strengthen the needed links between trade, the environment and poverty reduction.
ADBI Working Paper 239 Kalirajan, Anbumozhi, and Singh
18
• It is possible to increase and sustain positive links between exports, the environment and poverty reduction by promoting the “2T’s”—technology and transferability. A technology with minimal negative impact on the environment generated in the production of goods, which can be transported with little or no environmental degradation, has the potential to transfer the benefits arising from exports of such goods to the poor effectively. Among others, “service-led” growth and trade in environmental goods and services (EGS) provide avenues to achieve the above objective because their environmental impacts are less dramatic, but their impact on the pace of poverty reduction has the potential to be significant. The global financial crisis has created an opportunity for governments in Asia to draw up development policies aimed at “inclusive growth” through increased public spending, which has direct bearing on achieving the first Millennium Development Goal of poverty reduction. Governments need to keep this momentum steadily growing, which can contribute significantly to increases in the EGS share of service sector and trade of gross domestic product (GDP). However, such momentum is dependent on the effective cooperation between developing and developed countries because of the importance of the “2T’s” for sustaining the growth process of the developing countries. Multinational organizations such as The World Bank, Asian Development Bank and World Trade Organization need to play active roles in strengthening and sustaining the cooperation between developing and developed countries to improve the operation of the “2T’s”. The specific policy suggestions are as follows:
• Developing countries need to contribute to international public goods such as efficient and environmentally friendly technologies through research collaboration.
• Developed countries should provide developing countries easy access to efficient technologies.
• The inflow of foreign exchange through the Global Carbon Emissions into developing economies has the potential to lead to an appreciation of their real exchange rates vis-à-vis the developed economies, thus lowering their export competitiveness. Therefore, the Global Carbon Emissions Trading Scheme needs to be supplemented with a well defined technology transfer policy and safety mechanisms that do not lower the export competitiveness of developing countries.
• Eliminate “behind the border” constraints to trade such as bottlenecks in transportation infrastructures to provide better market access, particularly to the poor.
• Governments need to insist on the use of “eco-labels” to provide information on the scientific basis of goods to consumers.
• In order to promote and sustain a low-carbon economy, tariff and non-tariff barriers on EGS should be eliminated effectively.
• Governments need to promote “public-private partnerships” that nurture competitive industries involved in the production of EGS to eliminate barriers to entrepreneurship.
ADBI Working Paper 239 Kalirajan, Anbumozhi, and Singh
19
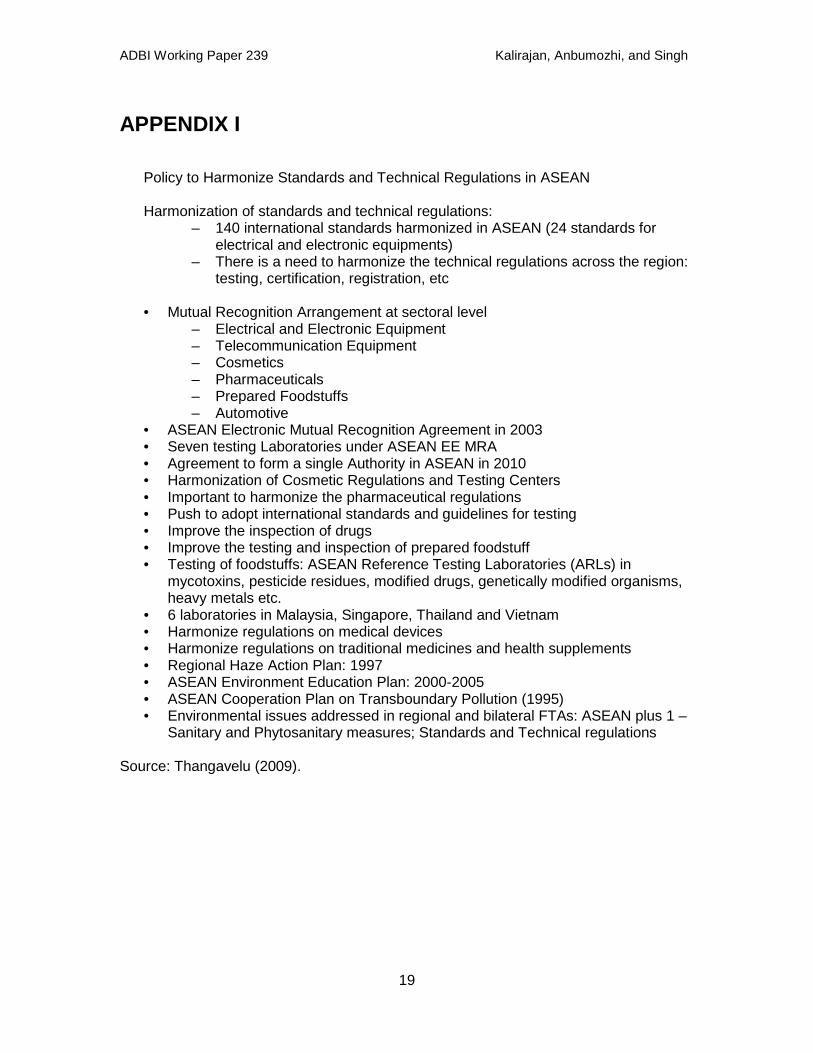
APPENDIX I Policy to Harmonize Standards and Technical Regulations in ASEAN Harmonization of standards and technical regulations:
– 140 international standards harmonized in ASEAN (24 standards for electrical and electronic equipments)
– There is a need to harmonize the technical regulations across the region: testing, certification, registration, etc
• Mutual Recognition Arrangement at sectoral level
– Electrical and Electronic Equipment – Telecommunication Equipment – Cosmetics – Pharmaceuticals – Prepared Foodstuffs – Automotive
• ASEAN Electronic Mutual Recognition Agreement in 2003 • Seven testing Laboratories under ASEAN EE MRA • Agreement to form a single Authority in ASEAN in 2010 • Harmonization of Cosmetic Regulations and Testing Centers • Important to harmonize the pharmaceutical regulations • Push to adopt international standards and guidelines for testing • Improve the inspection of drugs • Improve the testing and inspection of prepared foodstuff • Testing of foodstuffs: ASEAN Reference Testing Laboratories (ARLs) in
mycotoxins, pesticide residues, modified drugs, genetically modified organisms, heavy metals etc.
• 6 laboratories in Malaysia, Singapore, Thailand and Vietnam • Harmonize regulations on medical devices • Harmonize regulations on traditional medicines and health supplements • Regional Haze Action Plan: 1997 • ASEAN Environment Education Plan: 2000-2005 • ASEAN Cooperation Plan on Transboundary Pollution (1995) • Environmental issues addressed in regional and bilateral FTAs: ASEAN plus 1 –
Sanitary and Phytosanitary measures; Standards and Technical regulations Source: Thangavelu (2009).
ADBI Working Paper 239 Kalirajan, Anbumozhi, and Singh
20
APPENDIX II
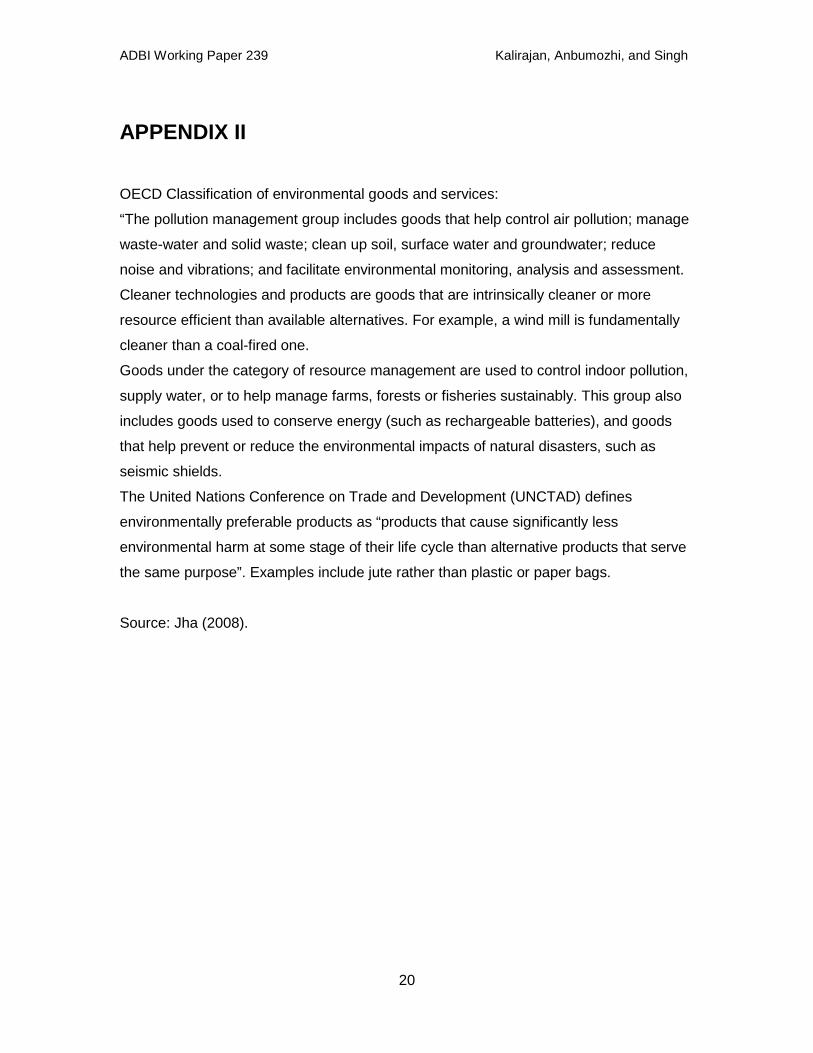
OECD Classification of environmental goods and services:
“The pollution management group includes goods that help control air pollution; manage
waste-water and solid waste; clean up soil, surface water and groundwater; reduce
noise and vibrations; and facilitate environmental monitoring, analysis and assessment.
Cleaner technologies and products are goods that are intrinsically cleaner or more
resource efficient than available alternatives. For example, a wind mill is fundamentally
cleaner than a coal-fired one.
Goods under the category of resource management are used to control indoor pollution,
supply water, or to help manage farms, forests or fisheries sustainably. This group also
includes goods used to conserve energy (such as rechargeable batteries), and goods
that help prevent or reduce the environmental impacts of natural disasters, such as
seismic shields.
The United Nations Conference on Trade and Development (UNCTAD) defines
environmentally preferable products as “products that cause significantly less
environmental harm at some stage of their life cycle than alternative products that serve
the same purpose”. Examples include jute rather than plastic or paper bags.
Source: Jha (2008).
ADBI Working Paper 239 Kalirajan, Anbumozhi, and Singh
21
REFERENCES Amiti, Mary, and Wei, Shang-Jin. 2006. Service off-shoring and Productivity: Evidence
from the United States. NBER Working Paper 11926. Cambridge, MA: National Bureau of Economic Research.
Amiti, Mary, and Caroline Freund. 2008. The Anatomy of China’s Exports. Policy Research Working Paper 4628. The Development Research Group, The World Bank.
Bannister, G. J., and K. Thugge. 2001. International Trade and Poverty. Washington, DC: International Monetary Fund.
Bauer, Armin, Rana Hasan, Rhoda Magsombol, and Guanghua Wan. 2008. The World Bank’s New Poverty Data: Implications for the Asian Development Bank, ADB Sustainable Development Working Paper Series 2. Manila: ADB.
Brian R Copeland, and M. Scott Taylor. 1995. Trade and Transboundary pollution, American Economic Review. 85(4): 716-737.
Douglas Brooks. 2003. Trade and Poverty: What are the Connections? Economics and Research Department Policy Brief Series 21. Manila: Asian Development Bank.
Energy efficiency and Climate Change Consideration. 2006. Manila: Asian Development Bank.
Garnaut, Ross, Stephen Howes, Frank Jotzo, and Peter Sheehan. 2008. Emissions in the Platinum Age: the Implications of Rapid Development for Climate-Change Mitigation. Oxford Review of Economic Policy 24(2): 377-401.
Ghani, Ejaz. 2009. Is Service-led Growth a Miracle for South Asia? The World Bank. (mimeo).
Giavazzi, Francesco. 2009. Growth after the Crisis. Finance and Development. September: 24-25.
Hiruhiko Kuroda. 2008. Challenges for the Asian Economy in 2008 and Beyond. Keynote address delivered to the Asian Development Bank Institute Symposium, Tokyo, 8 February.
International Energy Agency. 2007. World Energy Outlook 2007. Paris: IEA.
________________________. 2008. World Energy Outlook 2008. Paris: IEA.
________________________. 2009. World Energy Outlook 2009. Paris: IEA
Jha, Veena. 2008. Environmental Priorities and Trade Policies for Environmental Goods: A Reality Check. ICTSD Environmental Goods and Services Series Issue Paper 7. Geneva, Switzerland: International Centre for Trade and Sustainable Development.
Kalirajan, Kaliappa. 2009. Balancing Development and Climate Change Challenge: The Case of India. Paper presented at the Western Economic Association International 8th Pacific Rim Conference held at Ryukoku University, Kyoto, 26 March 2009.
ADBI Working Paper 239 Kalirajan, Anbumozhi, and Singh
22
Kawai, Masahiro, 1998. The East Asian Currency Crisis: Causes and Lessons. Contemporary Economic Policy 16(2): 157-172.
_______________. 2009. The Global Financial Crisis and Asia’s Rebalancing Agenda. Paper presented in the plenary session at the Singapore Economic Review Conference, Swiss hotel, Singapore, 6 August.
Krugman,P. and M. Obstfeld. 2008. International Economics: Theory and Policy. 8th Edition. Sydney: Addison Wesley.
McCulloch, N., L. Alan Winters, and X. Cirera. 2001. Trade Liberalization and Poverty: A Handbook. London: Centre for Economic Policy Research.
National Development and Reform Committee. 2008. National Plan on Renewable Energy Development. NDRC.
Ninkovic, Jasminka. 2009. What Determines Export Success in Labor-Intensive Goods? Paper presented at the annual meeting of the ISA’s 50th Annual Convention on “Exploring the Past, Anticipating the Future” held in New York City, 15 February.
OECD. 1998. Government Programmes for Diffusing Environmental Technology. Paris: OECD.
OECD. 2006. Opening Markets for Environmental Goods and Services. Paris: OECD.
Olsen, Karsten Bjerring. 2006. Productivity impacts of off-shoring and outsourcing: A review. OECD Directorate for Science, Technology and Industry (STI) Working Paper 2006/ 1. Paris: OECD.
Planning Commission of India. 2001. Poverty Estimates for 1999-00. http://planningcommission.nic.in/prfebt.htm (accessed on 01.09.2009)
Stern, Nicholas. 2006. Stern Review on the Economics of Climate Change HM Treasury. Government of the United Kingdom, London.
Radelet, Steven, and Jeffrey D. Sachs. 1998. The East Asian Financial Crisis: Diagnosis, Remedies, Prospects. Brookings Papers on Economic Activity. 1998(1): 1-90.
Ravallion, Martin and Gaurav Datt, 1996. How Important to India's Poor Is the Sectoral Composition of Economic Growth?," World Bank Economic Review, 10(1): 1-25.
Reimer, J. J. 2002. Estimating the Poverty Impacts of Trade Liberalization. Policy Research Working Paper 2790. Washington, DC: The World Bank,
Rodriguez, F., and D. Rodrik, 1999. Trade Policy and Economic Growth: A Skeptic’s Guide to the Cross-National Literature. NBER Working Paper 7081. Massachusetts: National Bureau of Economic Research.
Sankar, Ulaganathan. 2007. Trade and Environment. Chennai: Madras School of Economics. (mimeo).
Steenblik, Ronald. 2005. Environmental Goods: A Comparison of APEC and OECD Lists. OECD Trade and Environment Working Paper 2005-04. Paris: OECD.
Thangavelu, Shandre. 2009. Comments on Measuring the Environmental Impacts of Changing Trade Patterns on the Poor. Presentation at the 3rd China-ASEAN Forum on Social Development and Poverty Reduction Conference, Melia Hotel, Hanoi, 28-30 September 2009.
ADBI Working Paper 239 Kalirajan, Anbumozhi, and Singh
23
The Netherlands Environmental Assessment Agency. 2007. Chinese CO2 emissions in Perspective: Country Intercomparison of CO2 Emissions, http://www.mnp.nl/en/index.html (accessed 22 June 2009).
The World Development Report. 2008. Washington, DC: The World Bank.
The World Bank. 2007. International Trade and Climate Change. Washington, DC: The World Bank.
The World Bank. 2007. Warming up to Trade? Harnessing International Trade to Support Climate Change Objectives. Washington, DC: The World Bank.
UNCTAD. 2003. Environmental Goods: Trade Statistics of Developing Countries. TD/B/COM.1/EM.21/ CRP.1. Geneva: UNCTAD.
Venkatachalam, Anbumozhi, and Masahiro Kawai. 2009. Towards a Low Carbon Asia: Challenges of Economic Development. Paper presented at the Western Economic Association International 8th Pacific Rim Conference held at Ryukoku University, Kyoto, 26 March, 2009.
Winters, Alan. 1999. Trade and Poverty: Is there a Connection? Paper presented at the World Bank’s meeting on ‘Openness, Macroeconomic Crises and Poverty’. Kuala Lumpur, 10-12 May.
World Trade Organization. 2009. Opening Markets for Trade in Services: Countries and Sectors in Bilateral and WTO Negotiations. Geneva: WTO.