Embed Size (px)
Citation preview

7/30/2019 ADB Annual Report 2008 - Financial Report
http://slidepdf.com/reader/full/adb-annual-report-2008-financial-report 1/218
ANNUAL REPORT
||FINANCIAL REPORTFINANCIAL REPORT

7/30/2019 ADB Annual Report 2008 - Financial Report
http://slidepdf.com/reader/full/adb-annual-report-2008-financial-report 2/218
About the Asian Development Bank
ADB’s vision is an Asia and Pacific region free of poverty. Its mission is to help its developing
member countries substantially reduce poverty and improve the quality of life of their people.
Despite the region’s many successes, it remains home to two thirds of the world’s poor:
1.8 billion people who live on less than $2 a day, with 903 million struggling on less than
$1.25 a day. ADB is committed to reducing poverty through inclusive economic growth,
environmentally sustainable growth, and regional integration.
Based in Manila, ADB is owned by 67 members, including 48 from the region. Its main
instruments for helping its developing member countries are policy dialogue, loans, equity
investments, guarantees, grants, and technical assistance.
© 2009 Asian Development Bank
Every effort has been made to ensure theaccuracy of the data used in this publication.Variations in data in ADB publicationsoften result from different publication
dates, although differences may also comefrom source and interpretation of data.ADB accepts no responsibility from anyconsequence of their use.
The term “country,” as used in the contextof ADB, refers to a member of ADB and doesnot imply any view on the part of ADB as tothe member’s sovereignty or independentstatus.
In this publication, $ refers to US dollars.
ISSN 306-8370
Printed in the Philippines.
The ADB Annual Report 2008 comprises two separate volumes: Volume 1 is the mainreport and Volume 2 contains the financial statements and statistical annexes.

7/30/2019 ADB Annual Report 2008 - Financial Report
http://slidepdf.com/reader/full/adb-annual-report-2008-financial-report 3/218
2008
ANNUAL REPORT

7/30/2019 ADB Annual Report 2008 - Financial Report
http://slidepdf.com/reader/full/adb-annual-report-2008-financial-report 4/218

7/30/2019 ADB Annual Report 2008 - Financial Report
http://slidepdf.com/reader/full/adb-annual-report-2008-financial-report 5/218
FINANCIAL STATEMENTS AND REPORTS OF INDEPENDENT AUDITORS
I. MANAgEMENT’S DISCUSSION AND ANALySIS
Overview 6
Ordinar Capital Resources 7
Special Funds 24
grant Cofnancin 30
II. ORDINARy CAPITAL RESOURCES (OCR)
Manaement’s Report on Internal Control over Financial Reportin 33
Report o Independent Auditors 34
OCR-1 Balance Seet, 31 December 2008 and 2007 36OCR-2 Statement o Income and Expenses or te years Ended 31 December 2008 and 2007 38
OCR-3 Statement o Cas Flows or te years Ended 31 December 2008 and 2007 39
OCR-4 Statement o Canes in Capital and Reserves or te years Ended 31 December 2008 and 2007 40
OCR-5 Summar Statement o Loans, 31 December 2008 and 2007 42
OCR-6 Summar Statement o Borrowins, 31 December 2008 and 2007 44
OCR-7 Statement o Subscriptions to Capital Stoc and Votin Power, 31 December 2008 46
OCR-8 Notes to Financial Statements, 31 December 2008 and 2007 48
III. ASIAN DEVELOPMENT FUND (ADF) Manaement’s Report on Internal Control over Financial Reportin 71
Report o Independent Auditors 72
ADF-1 Special Purpose Statement o Assets, Liabilities and Fund Balances, 31 December 2008 and 2007 74
ADF-2 Special Purpose Statement o Revenue and Expenses or te years Ended31 December 2008 and 2007 75
ADF-3 Special Purpose Statement o Cas Flows or te years Ended 31 December 2008 and 2007 76
ADF-4 Special Purpose Statement o Canes in Fund Balances or te
years Ended 31 December 2008 and 2007 77
ADF-5 Special Purpose Summar Statement o Loans, 31 December 2008 and 2007 78
ADF-6 Special Purpose Statement o Resources, 31 December 2008 80
ADF-7 Notes to Special Purpose Financial Statements, 31 December 2008 and 2007 81
IV. TEChNICAL ASSISTANCE SPECIAL FUND (TASF)
Manaement’s Report on Internal Control over Financial Reportin 89
Report o Independent Auditors 90
TASF-1 Statement o Financial Position, 31 December 2008 and 2007 92
TASF-2 Statement o Activities and Canes in Net Assets or teyears Ended 31 December 2008 and 2007 93
TASF-3 Statement o Cas Flows or te years Ended 31 December 2008 and 2007 94
TASF-4 Statement o Resources, 31 December 2008 95
TASF-5 Summar Statement o Tecnical Assistance Approved and Eective
or te year Ended 31 December 2008 96
TASF-6 Notes to Financial Statements, 31 December 2008 and 2007 97
Contents

7/30/2019 ADB Annual Report 2008 - Financial Report
http://slidepdf.com/reader/full/adb-annual-report-2008-financial-report 6/218
V. JAPAN SPECIAL FUND (JSF)
Manaement’s Report on Internal Control over Financial Reportin 101
Report o Independent Auditors 102
JSF-1 Statement o Financial Position, 31 December 2008 and 2007 104
JSF-2 Statement o Activities and Canes in Net Assets or te
years Ended 31 December 2008 and 2007 105
JSF-3 Statement o Cas Flows or te years Ended 31 December 2008 and 2007 106
JSF-4 Notes to Financial Statements, 31 December 2008 and 2007 107
VI. ASIAN DEVELOPMENT BANk INSTITUTE SPECIAL FUND (ADBISF)
Report o Independent Auditors 111
ADBISF-1 Statement o Financial Position, 31 December 2008 and 2007 112
ADBISF-2 Statement o Activities and Canes in Net Assets or te years Ended
31 December 2008 and 2007 113
ADBISF-3 Statement o Cas Flows or te years Ended 31 December 2008 and 2007 114
ADBISF-4 Notes to Financial Statements, 31 December 2008 and 2007 115
VII. ASIAN TSUNAMI FUND (ATF)
Manaement’s Report on Internal Control over Financial Reportin 121
Report o Independent Auditors 122
ATF-1 Statement o Financial Position, 31 December 2008 and 2007 124ATF-2 Statement o Activities and Canes in Net Assets or te years Ended
31 December 2008 and 2007 125
ATF-3 Statement o Cas Flows or te years Ended 31 December 2008 and 2007 126
ATF-4 Notes to Financial Statements, 31 December 2008 and 2007 127
VIII. PAkISTAN EARThqUAkE FUND (PEF)
Manaement’s Report on Internal Control over Financial Reportin 130
Report o Independent Auditors 131
PEF-1 Statement o Financial Position, 31 December 2008 and 2007 133
PEF-2 Statement o Activities and Canes in Net Assets or te years Ended
31 December 2008 and 2007 134
PEF-3 Statement o Cas Flows or te years Ended 31 December 2008 and 2007 135PEF-4 Notes to Financial Statements, 31 December 2008 and 2007 136
IX. REgIONAL COOPERATION AND INTEgRATION FUND (RCIF)
Manaement’s Report on Internal Control over Financial Reportin 139
Report o Independent Auditors 140
RCIF-1 Statement o Financial Position, 31 December 2008 and 2007 142
RCIF-2 Statement o Activities and Canes in Net Assets or te year Ended
31 December 2008 and or te Period 26 Februar to 31 December 2007 143
RCIF-3 Statement o Cas Flows or te year Ended 31 December 2008 and or te Period
26 Februar to 31 December 2007 144
RCIF-4 Notes to Financial Statements, 31 December 2008 and 2007 145
X. CLIMATE ChANgE FUND (CCF)Manaement’s Report on Internal Control over Financial Reportin 148
Report o Independent Auditors 149
CCF-1 Statement o Financial Position, 31 December 2008 151
CCF-2 Statement o Activities and Canes in Net Assets or te Period 7 April to 31 December 2008 152
CCF-3 Statement o Cas Flows or te Period 7 April to 31 December 2008 153
CCF-4 Notes to Financial Statements, For te Period 7 April to 31 December 2008 154
7/30/2019 ADB Annual Report 2008 - Financial Report
http://slidepdf.com/reader/full/adb-annual-report-2008-financial-report 7/218
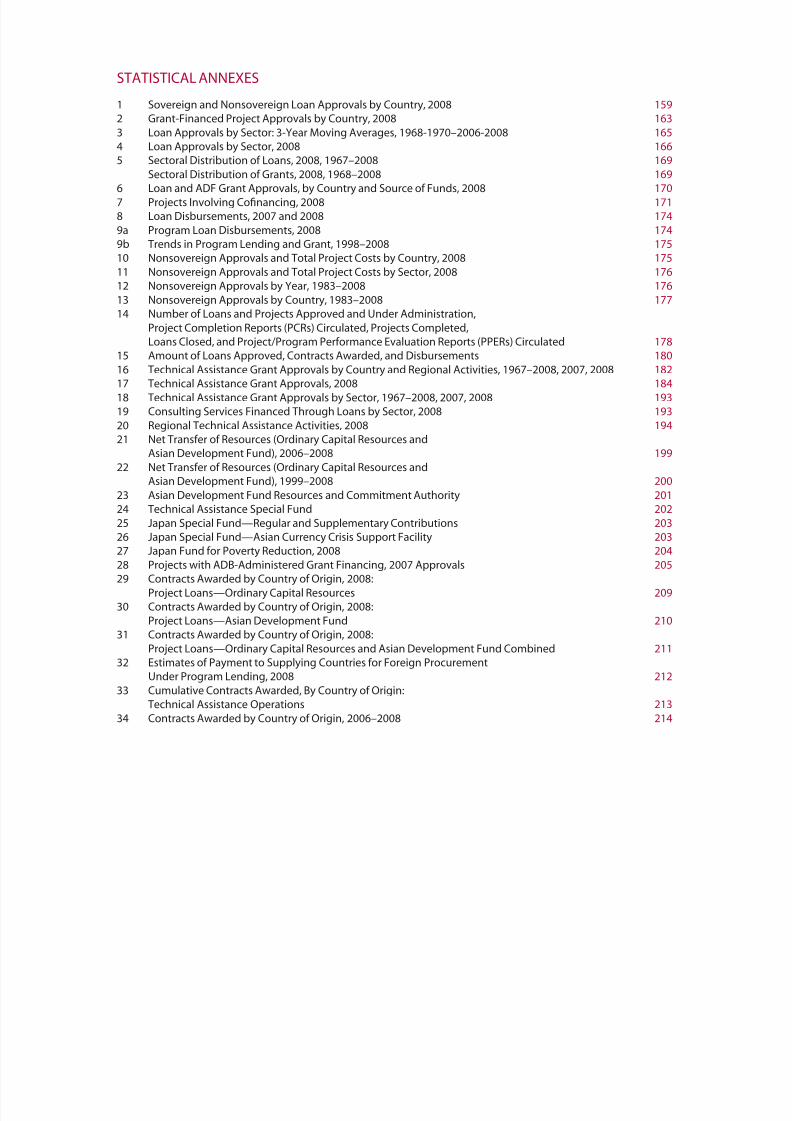
STATISTICAL ANNEXES
1 Sovereign and Nonsovereign Loan Approvals by Country, 2008 159
2 Grant-Financed Project Approvals by Country, 2008 163
3 Loan Approvals by Sector: 3-Year Moving Averages, 1968-1970–2006-2008 165
4 Loan Approvals by Sector, 2008 166
5 Sectoral Distribution of Loans, 2008, 1967–2008 169
Sectoral Distribution of Grants, 2008, 1968–2008 1696 Loan and ADF Grant Approvals, by Country and Source of Funds, 2008 170
7 Projects Involving Cofinancing, 2008 171
8 Loan Disbursements, 2007 and 2008 174
9a Program Loan Disbursements, 2008 174
9b Trends in Program Lending and Grant, 1998–2008 175
10 Nonsovereign Approvals and Total Project Costs by Country, 2008 175
11 Nonsovereign Approvals and Total Project Costs by Sector, 2008 176
12 Nonsovereign Approvals by Year, 1983–2008 176
13 Nonsovereign Approvals by Country, 1983–2008 177
14 Number of Loans and Projects Approved and Under Administration,
Project Completion Reports (PCRs) Circulated, Projects Completed,
Loans Closed, and Project/Program Performance Evaluation Reports (PPERs) Circulated 178
15 Amount of Loans Approved, Contracts Awarded, and Disbursements 18016 Technical Assistance Grant Approvals by Country and Regional Activities, 1967–2008, 2007, 2008 182
17 Technical Assistance Grant Approvals, 2008 184
18 Technical Assistance Grant Approvals by Sector, 1967–2008, 2007, 2008 193
19 Consulting Services Financed Through Loans by Sector, 2008 193
20 Regional Technical Assistance Activities, 2008 194
21 Net Transfer of Resources (Ordinary Capital Resources and
Asian Development Fund), 2006–2008 199
22 Net Transfer of Resources (Ordinary Capital Resources and
Asian Development Fund), 1999–2008 200
23 Asian Development Fund Resources and Commitment Authority 201
24 Technical Assistance Special Fund 202
25 Japan Special Fund—Regular and Supplementary Contributions 203
26 Japan Special Fund—Asian Currency Crisis Support Facility 20327 Japan Fund for Poverty Reduction, 2008 204
28 Projects with ADB-Administered Grant Financing, 2007 Approvals 205
29 Contracts Awarded by Country of Origin, 2008:
Project Loans—Ordinary Capital Resources 209
30 Contracts Awarded by Country of Origin, 2008:
Project Loans—Asian Development Fund 210
31 Contracts Awarded by Country of Origin, 2008:
Project Loans—Ordinary Capital Resources and Asian Development Fund Combined 211
32 Estimates of Payment to Supplying Countries for Foreign Procurement
Under Program Lending, 2008 212
33 Cumulative Contracts Awarded, By Country of Origin:
Technical Assistance Operations 21334 Contracts Awarded by Country of Origin, 2006–2008 214

7/30/2019 ADB Annual Report 2008 - Financial Report
http://slidepdf.com/reader/full/adb-annual-report-2008-financial-report 8/218
M A N A G E
M E N T ’ S D I S C U S S I O N
A N D A
N A L Y S I S
Asian Development Bank6
MANAGEMENT’SDISCUSSION AND ANALYSIS
The Asian Development Bank (ADB) is an international developmentfinancial institution whose vision is to make Asia and the Pacific free of
poverty. ADB was established in 1966 through the Agreement Establishing
the Asian Development Bank (the Charter), ratified by 31 countries to
promote the social and economic development of the region and reduce
poverty. As of 31 December 2008, ADB had 67 members, 48 of which are
in the region.

7/30/2019 ADB Annual Report 2008 - Financial Report
http://slidepdf.com/reader/full/adb-annual-report-2008-financial-report 9/218
7 Annual Report 2008
AB provides various forms of financial assistance to its
developing member countries. he main instruments are
loans, technical assistance, grants, guarantees, and equity
investments. hese instruments are financed through or-
dinary capital resources (C), pecial unds, and various
trust funds. C and pecial unds are used to finance op-
erations that are solely under AB administration. rust
funds are externally funded and are administered by AB
on behalf of donors. he Charter requires that funds from
each resource be kept separate from the others.
AB also provides policy dialogues and advisory ser-
vices and mobilizes financial resources through its co-
financing operations tapping official, commercial, and
export credit sources to maximize the development im-
pact of its assistance. Cofinancing for AB projects can be
in the form of external loans, grants for technical assistance
and components of loan projects, and credit enhancementproducts such as guarantees and syndications.
ORDINARY CAPITAL RESOURCES
unding for C operations comes from three distinct
sources: funds borrowed from private placements and cap-
ital markets, paid-in capital provided by shareholders, and
accumulated retained income (reserves). he financial
strength of C is largely based on the support of share-
holders and on financial policies and practices. hare-
holder support is reflected in the form of capital backingfrom members and in the record of borrowing members in
meeting their debt service obligations.
Borrowed funds, together with equity, are used to
fund C lending and investment activities as well as
other general operations. oans are generally made to de-
veloping member countries that have attained a higher
level of economic development and to private and other
nonsovereign borrowers. overeign loans are priced on a
cost pass-through basis in which the cost of funding the
loans plus a lending spread is passed through to the bor-
rowers. Nonsovereign loans are priced based on marketpractice.
n addition to direct lending, AB also provides guar-
antees to assist governments of developing member coun-
tries and nonsovereign borrowers secure commercial funds
for AB-assisted projects. AB experienced a strong and
growing demand for guarantees as credit enhancement
products.
Basis of Financial Reporting
Statutory Reporting. AB prepares its financial statements
in accordance with accounting principles generally ac-
cepted in the nited tates of America. able 1 presents
selected financial data for 2008.
AB manages its balance sheet by selectively us-
ing derivatives to minimize the interest rate and curren-
cy risks associated with its financial assets and liabilities.
erivative instruments are used to enhance asset and li-
ability management of individual positions and overall
portfolios, and to reduce borrowing costs.
inancial instruments including all derivatives,
structured and swapped borrowings, and marketable in-
vestments are recorded at their fair value while loans and
unswapped borrowings are recorded at carrying book val-
ue. Non-marketable equity investments are valued eitherat cost less any permanent impairment, or using the eq-
uity method.
AB complies with inancial Accounting tandards
(A) No. 133, “Accounting for erivative nstruments
and edging Activities,” along with its related amend-
ments (collectively referred to as “A 133”), including
A 155 (Accounting for Certain ybrid inancial nstru-
ments, an amendment to A 133 and 140). ffective 1
anuary 2008, AB also adopted A 157, “air alue
Measurements,” and A 159, “he air alue ption
for inancial Assets and inancial iabilities (includingan amendment of inancial Accounting tandards Board
tatement No. 115).”
A 133 establishes accounting and reporting stan-
dards for derivative instruments, including certain deriv-
ative instruments embedded in other contracts (collectively
referred to as derivatives), and for hedging activities. t
requires that an entity recognize all derivatives as either
assets or liabilities in the statement of financial position
and measure those instruments at fair value. A 133 al-
lows hedge accounting only if certain qualifying criteria are
met. An assessment of those criteria indicated that most of AB’s derivative transactions are highly effective in hedg-
ing the underlying transactions and are appropriate for re-
ducing funding costs. Compliance with hedge accounting
requirements will impose undue constraints on future bor-
rowings, loans, and hedge programs and will likely detract
AB’s efforts to effectively and efficiently minimize the
funding costs for its borrowing member countries. Accord-

7/30/2019 ADB Annual Report 2008 - Financial Report
http://slidepdf.com/reader/full/adb-annual-report-2008-financial-report 10/218
M A N A G E
M E N T ’ S D I S C U S S I O N
A N D A
N A L Y S I S
Asian Development Bank8
TABLE 1: Selected Financial Data(31 December, amounts in $ Million)
Statutory Basis
2008 2007 2006 2005 2004
Revenue and Expenses
From Loan 1,358.0 1,442.3 1,210.1 1,036.3 1,038.3
From Investments 677.2 683.2 564.5 377.4 265.6
From Guarantees 6.9 5.1 4.1 4.1 3.5
From Equity Investments 3.7 58.9 41.5 3.3 (0.7)
From Other Sources 18.7 18.8 18.7 11.3 6.4
Total Revenue 2,064.5 2,208.3 1,838.9 1,432.4 1,313.1
Borrowings and Related Expenses 1,208.4 1,389.8 1,116.3 893.2 861.7
Administrative Expensesa 141.0 127.3 127.7 135.7 118.3
Technical Assistance to Member Countries 8.4 (0.7) (1.2) (3.4) (2.4)
Provision for Losses (3.5) (0.6) (32.5) (3.5) 2.2
Other Expenses 6.3 4.0 3.7 4.2 3.1
Total Expenses 1,360.6 1,519.8 1,214.0 1,026.2 982.9
Net Realized (Losses) Gains (28.1) 22.9 80.6 16.9 59.4
Net Unrealized Gains (Losses) 450.6 53.8 (135.4) (309.2) 41.0
Cumulative Effect of Change in Accounting Principle – – – (4.6) –
Net Income 1,126.3 765.2 570.1 109.3 430.6
Average Earning Assetsb 50,394 42,780 37,904 36,092 36,364
Annual Return on Average Earning Assets 2.24% 1.79% 1.50% 0.30% 1.18%
Return on Loans 3.84% 5.00% 4.98% 4.35% 4.16%
Return on Investments 3.20% 4.68% 4.18% 2.96% 2.21%
Cost of Borrowings 4.11% 4.32% 4.81% 5.04% 3.37%
Pre-FAS 133/159d Basis
Net Income 699.7 711.4 705.5 415.6 389.6
Average Earning Assetsb 50,443 42,757 37,859 36,076 36,306
Annual Return on Average Earning Assetsc 1.39% 1.66% 1.86% 1.15% 1.07%
Return on Loans 4.14% 5.14% 4.94% 4.35% 4.16%
Return on Investments 3.70% 4.72% 4.27% 2.99% 2.34%
Cost of Borrowings 3.29% 4.68% 4.31% 3.75% 3.58%
Current Value Basis
Net Income 101.9 1,159.0 544.1 93.7 562.8
Average Earning Assetsb 51,575 43,726 39,130 37,948 39,391
Annual Return on Average Earning Assets 0.20% 2.65% 1.31% 0.23% 1.47%
Return on Loans 9.18% 6.40% 2.58% (1.18%) 4.25%
Return on Investments 3.51% 7.77% 5.48% (1.11%) 3.51%
Cost of Borrowings 7.17% 5.32% 3.51% (1.34%) 3.56%
( ) = negative, FAS = Financial Accounting Standards.
a Net of administration expenses allocated to the Asian Development Fund and loan origination costs that are deferred.
b Composed of investments and related swaps, outstanding loans (excluding net unamortized loan origination cost/front-end fees) and related swaps and equity investments.
c Represents net income before net unrealized gains/losses on derivatives, over average earning assets.
d FAS 159 is applicable to 2008 only.
ingly, AB elects not to adopt hedge accounting and re-
ports all derivative instruments on the balance sheet at fair
value while recognizing changes in the fair value of deriva-
tive instruments for the year as part of net income.
A 155 allows fair value measurement for hybrid fi-
nancial instruments that contain embedded features that
would otherwise be required to be treated as a separate
derivative instrument (bifurcated) in the reported finan-

7/30/2019 ADB Annual Report 2008 - Financial Report
http://slidepdf.com/reader/full/adb-annual-report-2008-financial-report 11/218
9 Annual Report 2008
TABLE 2: Condensed Current Value Balance Sheets as at 31 December 2008 and 2007($ Thousand)
31 December 200831 December
2007
StatutoryBasis
Reversal ofFAS 133/159
Effectsa
Pre–FAS133/159 Basis
Current Value Adjustments
Current ValueBasis
Current ValueBasis
Due from banks $ 142,238 $ – $ 142,238 $ – $ 142,238 $ 108,821
Investments and accrued income 15,544,399 – 15,544,399 – 15,544,399 13,440,728
Securities transferred under
repurchase agreement 309,358 – 309,358 – 309,358 5,041,387
Securities purchased under
resale arrangement 511,756 – 511,756 – 511,756 427,132
Loans outstanding and accrued interest 36,150,156 (451) 36,149,705 1,622,166 37,771,871 31,434,283
Provision for loan losses and unamortized
net loan origination costs 59,088 – 59,088 – 59,088 27,087
Equity investment 641,427 (6,060) 635,367 6,060 641,427 808,157
Receivable from members 144,514 – 144,514 (50,790) 93,724 105,027
Receivable from swaps
Borrowings 23,831,087 (2,237,329) 21,593,758 2,237,329 23,831,087 17,968,867
Others 882,793 (163,125) 719,668 163,125 882,793 512,089
Other assets 504,936 – 504,936 – 504,936 463,793
TOTAL $ 78,721,752 $ (2,406,965) $ 76,314,787 $ 3,977,890 $ 80,292,677 $ 70,337,371
Borrowings and accrued interest $ 36,026,446 $ 5,912 $ 36,032,358 $ 1,816,481 $ 37,848,839 $ 32,023,669
Payable for swaps
Borrowings 24,867,815 (1,347,193) 23,520,622 1,347,193 24,867,815 16,936,964
Others 1,198,781 (361,357) 837,424 361,357 1,198,781 583,320
Payable under securities
repurchase arrangement 301,759 – 301,759 – 301,759 5,092,316
Accounts payable and other liabilities 1,057,481 – 1,057,481 – 1,057,481 722,402
Total Liabilities 63,452,282 (1,702,638) 61,749,644 3,525,031 65,274,675 55,358,671
Paid-in capital 3,777,071 – 3,777,071 – 3,777,071 3,842,293
Net notional maintenance of value
receivable (564,383) – (564,383) – (564,383) (661,197)
Ordinary reserve 9,532,487 1,194 9,533,681 877,280 10,410,961 9,642,454
Special reserve 209,723 – 209,723 – 209,723 202,847
Loan loss reserve 195,062 – 195,062 – 195,062 182,100
Surplus 894,594 – 894,594 – 894,594 616,300
Cumulative revaluation adjustments account (23,336) 23,336 – – – –
Net incomeb — 31 December 2008 1,119,473 (426,647) 692,826 (597,852) 94,974 –
Net incomeb — 31 December 2007 227,500c (227,500) – – – 1,153,903
Accumulated other comprehensive income (98,721) (74,710) (173,431) 173,431 – –
Total Equity 15,269,470 (704,327) 14,565,143 452,859 15,018,002 14,978,700
TOTAL $ 78,721,752 $ (2,406,965) $ 76,314,787 $ 3,977,890 $ 80,292,677 $ 70,337,371
( ) = negative, FAS = Financial Accounting Standards.a Includes reversal of unrealized (gains) losses attributed to equity investments accounted for under equity method.b Net income after appropriation of guarantee fees to Special Reserve.c Cumulative effect of FAS 157/159 adoption to prior years’ net income.

7/30/2019 ADB Annual Report 2008 - Financial Report
http://slidepdf.com/reader/full/adb-annual-report-2008-financial-report 12/218
M A N A G E
M E N T ’ S D I S C U S S I O N
A N D A
N A L Y S I S
Asian Development Bank10
cial statements under A 133. As of 31 ecember 2008,
AB holds a relatively small portion of hybrid financial in-
struments in its borrowing portfolio.
A 159 expands the scope of financial assets and liabili-
ties that companies may carry at fair value. ffective 1 anuary
2008, AB utilized this election to fair value all non-hybrid
borrowings that are swapped. As a result of this election, all
borrowings that are swapped and their related derivatives are
reported at fair value, with changes in fair value reported in
earnings. owever, AB still reports all of its loans and those
borrowings that are not swapped at amortized cost.
A 157 defines fair value, establishes a framework
for measuring fair value, and expands disclosure require-
ments about fair value measurements. n compliance with
this standard, and in conjunction with the A 159 elec-
tion above, AB incorporated its credit risk (as a credit
spread) in fair valuing its liabilities. he combined effectof the adoption of A 157 and 159 was to increase the
opening balance of retained income as at 1 anuary 2008
by $227.5 million.
n March 2008, the inancial Accounting tandards
Board (AB) issued A 161 “isclosures about eriva-
tive nstruments and edging Activities—an amendment
of AB tatement No. 133,” which requires enhanced
disclosures about an entity’s derivative and hedging ac-
tivities and thereby improve the transparency of financial
reporting. his statement is effective for financial state-
ments issued for fiscal years and interim periods begin-ning after 15 November 2008.
Supplemental Reporting. Because of the asymmetry creat-
ed in the financial statements resulting from applying fair
value to the derivatives and swapped borrowings, while
loans are carried at amortized cost less provision, man-
agement believes that the reported income does not ap-
propriately capture the true economic income of AB.
herefore, AB has decided to continue issuing two non-
AA supplemental financial reports using current
value and pre-A 133/159 to better reflect its financialposition and risk management. Applications of consistent
approaches on these statements allow better analysis for
management information and decision making.
or current value reporting all financial instruments
are measured using a model based on the present value of
expected cash flow. he model utilizes market data to de-
termine the cash flow and discount rates for each instru-
ment. nder pre-A 133/159, loans, promissory notes,
swapped borrowings, and all derivative instruments are
reported at cost.
Discussion and Analysis on Current Value
able 2 presents estimates of the economic value of C’s
financial assets and liabilities taking into consideration
changes in interest rates, exchange rates, and credit risks.
Current value reflects the exit price for financial instru-
ments with liquid markets and is the estimated fair value.
or financial instruments with no market quotations, cur-
rent value is estimated by discounting the expected cash
flows by applying the appropriate market data. he cur-
rent value results may differ from the actual net realizable
value in the event of liquidation. he reversal of the ef-
fects of A 133/159 removes its impact, as these effects
are part of current value adjustments (ables 3 and 4).
Current Value Balance Sheet
Loans and Related Swaps. Most loans are made to or guaran-
teed by AB members. AB does not sell its loans believ-
ing that there is no market for them. he current value
of loans incorporates management’s best estimate of ex-
pected cash flows including interest. stimated cash flows
from principal repayments and interest are discounted by
the applicable market yield curves for AB’s funding cost
plus lending spread.he current value also includes an appropriate credit
risk assessment. o recognize this inherent risk and oth-
er potential overdue payments, the loan value is adjusted
through loan loss provisioning. AB has never suffered a loss
on sovereign loans except opportunity losses resulting from
the difference between payments for interest and charges
not in accordance with the loan’s contractual terms.
he positive adjustment of $1.5 billion indicates that
the average interest rates on loans on an after-swap basis are
higher than AB would currently originate on similar loans.
Investments and Related Swaps. nder both the statutory
and current value bases, investment securities and relat-
ed derivatives are reported at fair values based on market
quotations when available. therwise, the current value is
calculated using market-based valuation models incorporat-
ing observable market data. he net negative adjustment of
$68.8 million resulted from unrealized losses on asset
swaps due to declining interest rates in related markets.

7/30/2019 ADB Annual Report 2008 - Financial Report
http://slidepdf.com/reader/full/adb-annual-report-2008-financial-report 13/218
11 Annual Report 2008
TABLE 3: Condensed Current Value Income Statements for the Years Ended 31 December 2008 and 2007($ Thousand)
31 December 200831 December
2007
StatutoryBasis
Reversal ofFAS 133/159
Effectsa
Pre–FAS133/159
BasisCurrent Value Adjustments
Current ValueBasis
Current ValueBasis
REVENUE
From loans $ 1,357,981 $ – $ 1,357,981 $ – $ 1,357,981 $ 1,442,338
From investments 677,175 – 677,175 – 677,175 683,212
From guarantees 6,876 – 6,876 – 6,876 5,049
From equity investments 3,737 24,055 27,792 (24,055) 3,737 58,897
From other sources - net 18,685 – 18,685 – 18,685 18,835
Total Revenue 2,064,454 24,055 2,088,509 (24,055) 2,064,454 2,208,331
EXPENSES
Borrowings and related expenses 1,208,391 – 1,208,391 – 1,208,391 1,389,778
Administrative expenses 141,047 – 141,047 – 141,047 127,327
Technical assistance to member countries 8,357 – 8,357 – 8,357 (683)
Provision for losses (3,467) – (3,467) 3,467 – –
Other expenses 6,272 – 6,272 – 6,272 3,998
Total Expenses 1,360,600 – 1,360,600 3,467 1,364,067 1,520,420
Net realized gains (28,096) – (28,096) – (28,096) 22,905
Net unrealized gains 450,591 (450,702)b (111) 24,055 23,944 14
Current value adjustmentsc – – – (597,852) (597,852) 447,543
Provision for losses – – – 3,467 3,467 579
NET INCOME $ 1,126,349 $ (426,647) $ 699,702 $ (597,852) $ 101,850 $ 1,158,952
( ) = negative, FAS = Financial Accounting Standards.a Includes reversal of unrealized (gains) losses attributed to equity investments accounted for under equity method.b FAS 133/159 adjustments are reversed as the current value adjustments incorporate the effect of net unrealized losses on derivatives and swapped borrowings under FAS 133 and
FAS 159.c Current value adjustments include the effect of FAS 133/159 adjustments and the net unrealized losses on equity investments accounted for under equity method.
Equity Investments. nder both statutory and current value
bases, equity investments are reported at fair value when
market values are readily determinable; by applying equi-
ty method for investments in limited partnership and cer-
tain limited liability companies, or for investments where
AB has the ability to exercise significant influence; or at
cost less permanent impairment, if any, which represents
a fair approximation of the current value.
Receivable rom Members. his consists of promissory notes
that may be restricted by member countries. he current
value is based on the cash flow of the projected encash-
ment of the promissory notes discounted using appropri-
ate interest rates.
Borrowings ater Swaps. he current value of these liabili-
ties includes the fair value of the borrowings and asso-ciated financial derivative instruments, and is calculated
using market-based valuation models incorporating ob-
servable market data.
he $926.3 million unfavorable current value adjust-
ment is due to the fact that the average cost of the borrow-
ings on an after-swap basis is higher than the market rate
at which AB can currently obtain new funding.
Current Value Income Statement
or 2008, the current value net income is $101.9 million
compared with pre-A 133/159 net income of $699.7 mil-
lion and statutory reported net income of $1,126.3 mil-
lion (able 3).
Current Value Adjustments. he total current value adjust-
ment of $597.9 million ($447.5 million in 2007) represents
the change in the current value of all AB financial instru-ments during the year. he adjustment reflects changes

7/30/2019 ADB Annual Report 2008 - Financial Report
http://slidepdf.com/reader/full/adb-annual-report-2008-financial-report 14/218
M A N A G E
M E N T ’ S D I S C U S S I O N
A N D A
N A L Y S I S
Asian Development Bank12
in interest rates, currency exchange rates, and credit risks.
his comprised a net unfavorable adjustment of $257.6
million from the change in the valuation of all outstand-
ing financial instruments, $107.6 million from translation
adjustments, and $259.8 million adjustment in pension
and postretirement benefit liability, offset by $27.2 mil-
lion net unrealized gains on investments ($251.3 million
gain for investments; $224.1 million loss for equity invest-
ments) (able 4).
Impact o Changes in Interest Rates. he net decrease in
the current value adjustments on the balance sheet dur-
ing 2008 was $257.6 million. t was a result of the increase
in unrealized losses in the borrowing portfolio of $831.1
million, unfavorable results for investments of $89.5 mil-
lion and equity investments of $24.1 million, offset by in-
crease in unrealized gains for loans of $668.1 million, anddecrease in unrealized losses on other assets of $19.0 mil-
lion.
Impact o Changes in Exchange Rates. ranslation adjust-
ments, reported under the statutory basis as part of “accu-
mulated other comprehensive income”, are presented as
current value adjustments. he general strengthening of
the dollar against most of the major currencies in 2008
resulted in a negative translation adjustment of $107.6
million compared to a favorable adjustment of $126.8 mil-
lion in 2007.
Operating Activities
n pursuing its objectives, AB provides financial assis-
tance through loans, technical assistance, guarantees, and
equity investments to its developing member countries
to help them meet their development needs. his as-
sistance can be provided to sovereign and nonsovereign
entities. AB also actively promotes cofinancing of its de-
velopment projects and programs to complement its own
assistance with funds from both official and commercial
sources including export credit agencies.
Loans. ntil 30 une 2001, AB’s three windows for loans
from C were the pool-based multicurrency loan, the
pool-based single-currency loan in dollars, and the
market-based loan. ith the introduction of the B-
based loan on 1 uly 2001, the pool-based multicurrency loan and market-based loan are no longer offered, and on 1
uly 2002, the pool-based single-currency loan in dol-
lars was retired. ffective anuary 2004, the pool-based
multi currency loans were transformed into pool-based
single currency loans in apanese yen. he B-based
loan is a timely response to borrowers’ demand for loan
products that suit project needs and effectively manage
their external debt. B-based loan products give bor-
rowers a high degree of flexibility in managing interest
rate and exchange rate risks and at the same time provide
low intermediation risk to AB. ince November 2002,
TABLE 4: Summary of Current Value Adjustments($ Thousand)
Balance Sheet Effects as of 31 December 2008Income Statement Effects
Year to Date
Loans AfterSwaps Investmentsa
Borrowings AfterSwaps
Other Assetsb
Less Prior Year
Effectsc
31 December2008
31 December2007
Total Current Value Adjustments
on Balance Sheet $ 1,492,746 $ (62,752) $ (926,345) $ (50,790) $ (710,483) $ (257,624) $ 148,078
Unrealized Gains on Investmentsd 27,224e 232,792
Accumulated Translation Adjustments (107,617)f 126,844
Pension and Post Retirement
Benefit Liability Adjustments (259,835) (60,171)
Total Current Value Adjustments $ (597,852) $ 447,543
( ) = negative, FAS = Financial Accounting Standards.a Relates to investments related swaps and equity investments under equity method.b Relates to receivable from members.c Prior Year Effects include cumulative current value adjustments on all financial instruments and equity investments accounted for under equity method, made in the prior years.d Relates to unrealized gains on investments and equity investments classified as available for sale.e Included in Other Comprehensive Income under statutory basis.f Relates to the translation adjustments for the period and current translation effects from FAS 133/159 reversals.

7/30/2019 ADB Annual Report 2008 - Financial Report
http://slidepdf.com/reader/full/adb-annual-report-2008-financial-report 15/218
13 Annual Report 2008
AB has been offering local currency loans to nonsover-
eign borrowers and expanded this to sovereign borrowers
in August 2005.
Loan Approvals, Disbursements, Repayments, and Prepay-
ments. n 2008, the Board of irectors approved 46 sover-
eign loans totaling $6.9 billion, and 15 nonsovereign loans
totaling $1.8 billion, compared with 2007 approvals of 38
sovereign loans totaling $7.3 billion and 22 nonsovereign
loans totaling $0.9 billion. isbursements in 2008 totaled
$6.5 billion ($5.9 billion for sovereign loans and $0.6 bil-
lion for nonsovereign loans) representing an increase of
25% from the $5.2 billion disbursements in 2007. egular
principal repayments for the year were $1.6 billion ($1.4
billion in 2007) while prepayments amounted to $0.3 bil-
lion ($0.1 billion in 2007). n 2008, eight loans were fully
prepaid. As of 31 ecember 2008, the total loans out-standing after provision for losses and net unamortized
loan origination cost amounted to $35.9 billion, of which
$34.2 billion is for sovereign loans and $1.7 billion is for
nonsovereign loans.
n 2005, AB established the multitranche financing
facility, a debt financing facility that allows AB to deliver
financial resources for a specific program or investment in
a series of separate financing tranches over a fixed period.
inancing tranches may be provided as loans, guarantees,
equity or any combination of these instruments based on
periodic financing requests submitted by the borrower.n 2008, six multitranche financing facilities totaling $4.3
billion (seven multitranche financing facilities totaling
$4.0 billion in 2007), were approved under C. eriodic
financing requests under multitranche financing facilities
amounting to $1.8 billion were approved in 2008 ($2.0 bil-
lion in 2007).
tarting eptember 2005, AB provided lending
without sovereign guarantee to entities that can be consid-
ered public sector borrowers but are structurally separate
from the sovereign or central government. uch entities
include state-owned enterprises, government agencies,municipalities, and local government units. n 2008, two
loans to state-owned enterprises without sovereign guar-
antee totaling $300 million were approved (one loan for
$10 million in 2007).
Status o Loans. ne nonsovereign loan with an outstand-
ing principal balance of $1.7 million (four loans totaling
$16.5 million in 2007) was in non-accrual status as of 31
ecember 2008. he $14.8 million decline is mainly at-
tributed to the sale or restructuring of three loans, which
were in nonaccrual status.
ne sovereign loan was restored to accrual status in
May 2008, following full settlement of overdue principal
and interest.
Loan Charges on Sovereign Loans. B-based loans carry
a floating lending rate that consists of 6-month B
and an effective contractual spread fixed over the life of
the loan. he lending rate is reset every 6 months on each
interest reset date and can be converted to fixed rate at
borrower’s request. he lending rates for pool-based sin-
gle-currency loans are based on the previous semester’s av-
erage cost of borrowings. nterest rates for market-based
loans are either fixed or floating. he floating rates aredetermined based on 6-month B with reset dates of
either 15 March and 15 eptember or 15 une and 15 e-
cember. ffective 2000, all sovereign loans without spe-
cific provisions in the loan agreements were charged with
lending spread of 60 basis points over the base lending
rate. n 2004, 20 basis points of the lending spread were
waived on sovereign loans outstanding from 1 uly 2004 to
30 une 2005 for borrowers that did not have loans in ar-
rears. ubsequently, the policy was extended to cover the
period up to une 2009. n ecember 2007, the Board of
irectors revised the lending rates for all sovereign -B-based loans negotiated on or after 1 ctober 2007
by reducing the effective contractual spread to 20 basis
points over the base lending rate and eliminating the waiv-
er mechanism for such loans.
AB’s variable lending rates for pool-based single-
currency loans in dollars and in apanese yen are shown
below.
Table 5: Lending Ratesa
(% per annum)2008 2007 PSCLs
1 January 1.90 1.31 Japanese yen
6.12 5.91 US dollar
1 July 1.98 1.69 Japanese yen
5.64 6.34 US dollar
PSCL = Pool-based single-currency loan.a Lending rates are set on 1 January and 1 July every year and are valid for 6 months and
are represented net of 20 basis points lending spread waiver.
7/30/2019 ADB Annual Report 2008 - Financial Report
http://slidepdf.com/reader/full/adb-annual-report-2008-financial-report 16/218
M A N A G E
M E N T ’ S D I S C U S S I O N
A N D A
N A L Y S I S
Asian Development Bank14
AB also charges a front-end fee of 1% on sovereign
loans to cover the administrative costs incurred in loan
origination. n 2004, the Board of overnors approved
the waiver of the entire front-end fee on all new sover-
eign loans approved from 1 anuary 2004 to 30 une 2005.
ubsequently, the policy was extended to cover the pe-
riod up to une 2009. n ecember 2007, the Board of
irectors approved the elimination of front-end fees for
sovereign B-based loans negotiated on or after 1
ctober 2007.
AB applied a progressive commitment fee of 75 ba-
sis points on undisbursed loan balances for sovereign proj-
ect loans and a flat commitment fee of 75 basis points for
sovereign program loans. n ctober 2006, as part of the
enhancement of AB’s loan and debt management prod-
ucts, all sovereign project loans negotiated after 1 anu-
ary 2007 carried a flat commitment fee of 35 basis pointson the full amount of undisbursed loan balances. n April
2007, the Board also approved the waiver of 10 basis points
of the commitment charge on the undisbursed balances
of sovereign project loans negotiated after 1 anuary 2007
and 50 basis points of the commitment charge on the un-
disbursed balances of sovereign program loans. he waiver
is applicable to all interest periods starting from 1 anu-
ary 2007 up to and including 30 une 2009. n ecember
2007, the Board of irectors approved the reduction of
the commitment charge from 75 basis points for sover-
eign program loans and 35 basis points for sovereign proj-ect loans to 15 basis points for both sovereign program and
project loans negotiated on or after 1 ctober 2007, and
eliminated the waiver mechanism for such loans.
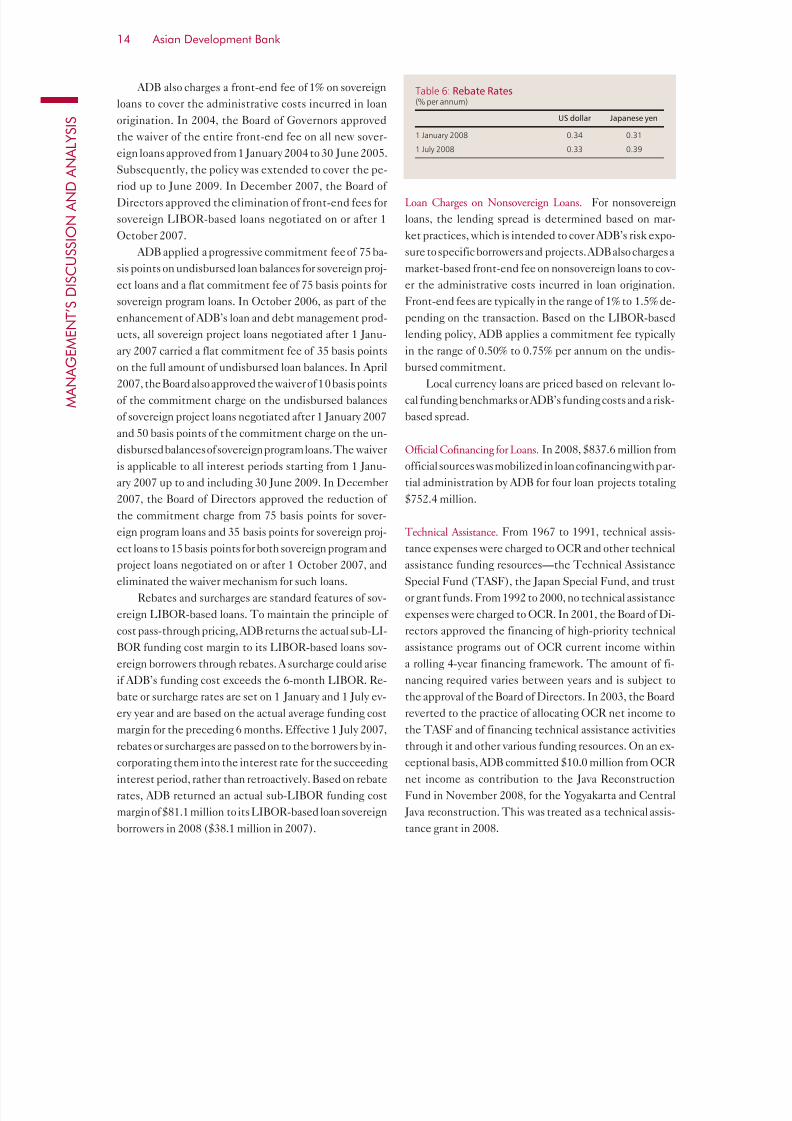
ebates and surcharges are standard features of sov-
ereign B-based loans. o maintain the principle of
cost pass-through pricing, AB returns the actual sub--
B funding cost margin to its B-based loans sov-
ereign borrowers through rebates. A surcharge could arise
if AB’s funding cost exceeds the 6-month B. e-
bate or surcharge rates are set on 1 anuary and 1 uly ev-
ery year and are based on the actual average funding costmargin for the preceding 6 months. ffective 1 uly 2007,
rebates or surcharges are passed on to the borrowers by in-
corporating them into the interest rate for the succeeding
interest period, rather than retroactively. Based on rebate
rates, AB returned an actual sub-B funding cost
margin of $81.1 million to its B-based loan sovereign
borrowers in 2008 ($38.1 million in 2007).
Loan Charges on Nonsovereign Loans. or nonsovereign
loans, the lending spread is determined based on mar-
ket practices, which is intended to cover AB’s risk expo-
sure to specific borrowers and projects. AB also charges a
market-based front-end fee on nonsovereign loans to cov-
er the administrative costs incurred in loan origination.
ront-end fees are typically in the range of 1% to 1.5% de-
pending on the transaction. Based on the B-based
lending policy, AB applies a commitment fee typically
in the range of 0.50% to 0.75% per annum on the undis-bursed commitment.
ocal currency loans are priced based on relevant lo-
cal funding benchmarks or AB’s funding costs and a risk-
based spread.
Ofcial Conancing or Loans. n 2008, $837.6 million from
official sources was mobilized in loan cofinancing with par-
tial administration by AB for four loan projects totaling
$752.4 million.
Technical Assistance. rom 1967 to 1991, technical assis-tance expenses were charged to C and other technical
assistance funding resources—the echnical Assistance
pecial und (A), the apan pecial und, and trust
or grant funds. rom 1992 to 2000, no technical assistance
expenses were charged to C. n 2001, the Board of i-
rectors approved the financing of high-priority technical
assistance programs out of C current income within
a rolling 4-year financing framework. he amount of fi-
nancing required varies between years and is subject to
the approval of the Board of irectors. n 2003, the Board
reverted to the practice of allocating C net income tothe A and of financing technical assistance activities
through it and other various funding resources. n an ex-
ceptional basis, AB committed $10.0 million from C
net income as contribution to the ava econstruction
und in November 2008, for the ogyakarta and Central
ava reconstruction. his was treated as a technical assis-
tance grant in 2008.
Table 6: Rebate Rates(% per annum)
US dollar Japanese yen
1 January 2008 0.34 0.31
1 July 2008 0.33 0.39

7/30/2019 ADB Annual Report 2008 - Financial Report
http://slidepdf.com/reader/full/adb-annual-report-2008-financial-report 17/218
15 Annual Report 2008
Guarantees. AB provides guarantees1 as credit enhance-
ments for eligible projects to cover risks that the project and
its commercial cofinancing partners cannot easily absorb
or manage on its own. educing these risks can make a sig-
nificant difference in mobilizing debt funding for projects.
AB has used its guarantee instruments successfully for in-
frastructure projects, financial institutions, capital markets,
and trade finance. hese instruments generally are not rec-
ognized in the balance sheet and have off-balance sheet risks.
or guarantees issued and modified after 31 ecember 2002
in accordance with inancial Accounting tandards Board n-
terpretation No. 45 (N 45), “uarantor’s Accounting and
isclosure equirements for uarantees, ncluding ndirect
uarantees of ndebtedness to thers,” AB recognized at
the inception of a guarantee the noncontingent aspect of
its obligations. AB’s total exposure on signed and effec-
tive loan guarantees is disclosed in Note of C inancialtatements. n 2008, AB provided $10.0 million for one po-
litical risk guarantee operation.
Syndications. yndications enable AB to mobilize cofi-
nancing by transferring some or all of the risks associated
with its loans and guarantees to other financing partners2.
yndications thus decrease and diversify the risk profile of
AB’s financing portfolio. yndications may be on a fund-
ed or unfunded basis and may be arranged on an individ-
ual, portfolio, or any other basis consistent with industry
practices. n 2008, $565.0 million for syndications throughB-loans3 was provided for three projects.
Equity Investments. n accordance with AB’s Charter
which mandates that its nonsovereign operations pro-
mote the investment of private capital in the region for
development, AB provides assistance in the form of eq-
uity investments, in addition to loans without government
guarantees, and other financing schemes. he Charter al-
lows the use of C for equity investments in private
enterprises up to 10% of its unimpaired paid-in capital
together with reserves and surplus, exclusive of specialreserves. he total equity investment portfolio for C
for both outstanding and undisbursed approved facilities
amounted to $911.14 million at end 2008. his represent-
ed about 61% of the ceiling defined by the Charter.
As of 31 ecember 2008, the total exposure of non-
sovereign operations in equity investments amounted to
about $815.0 million.
n 2008, seven equity investments totaling $123.1
million were approved compared with five equity invest-
ments totaling $79.8 million in 2007. n the same year,
AB disbursed a total of $125.7 million in equity invest-
ments, 8.7% increase from $115.6 million disbursed in
2007, and received a total amount of $53.6 million from
capital distributions and divestments, whether in full or
in part, in 20 projects. he divestments were carried out
in a manner consistent with good business practices, af-
ter AB’s development role in its investments have been
fulfilled, and without destabilizing the companies con-
cerned.
Capital and Resources
Capital. otal shareholders’ equity on a statutory basis
increased from $14.3 billion as of 31 ecember 2007 to
$15.3 billion as of 31 ecember 2008. his was due pri-
marily to net income for the year of $1.1 billion; the favor-
able effect of A 157/159 adoption to prior years’ income
amounting to $227.5 million; the net effect of change in
special drawing rights value on capital and reserves of
$33.1 million; and additional capital subscription receivedof $7.4 million. hese were offset by net decrease in other
comprehensive income of $276.7 million (adjustment to
pension and post retirement benefit obligation of $259.8
million, unfavorable translation adjustments of $43.4 mil-
lion; and amortization of A 133 adjustment of $0.7 mil-
lion; offset by unrealized gain on investments and equity
investments of $27.2 million); and allocations to the Asian
evelopment und and Climate Change und of $40.0
million each, and to the echnical Assistance pecial
und of $23.0 million.
he total authorized and subscribed capital of ABis 3,546,311 shares valued at $54,890.2 million as of 31
ecember 2008. f the subscribed capital, $3,860.6 mil-
1 ADB offers two types of guarantee products—political risk and partial credit—designed to facilitate cofinancing by mitigating risk exposure of commercial lenders and capitalmarket investors. A political risk guarantee covers against specifically defined political risks. A partial credit guarantee provides comprehensive cover (of commercial and politicalrisks) for a specific portion of the debt service provided by cofinanciers. These guarantees are issued for projects in which ADB satisfies its participation requirement.
2 Depending on whether ADB retains risk or not, there may or may not be a contingent liability to ADB.3 A B-loan is a tranche of a direct loan nominally advanced by ADB, subject to eligible financial institutions’ taking funded risk participations within such a tranche and without
recourse to ADB. It complements an A-loan funded by ADB.4 Excluding ADB’s share on net unrealized gains of investee companies accounted under equity method totaling $6.1 million.
7/30/2019 ADB Annual Report 2008 - Financial Report
http://slidepdf.com/reader/full/adb-annual-report-2008-financial-report 18/218
M A N A G E
M E N T ’ S D I S C U S S I O N
A N D A
N A L Y S I S
Asian Development Bank16
lion was paid-in and $51,029.6 million was callable. Callable
capital can be called only if required to meet AB’s obliga-
tions incurred on borrowings or guarantees under C. No
call has ever been made on AB’s callable capital.
o ensure it has adequate risk-bearing capacity, AB
reviews its income outlook annually. Based on that review,
the Board of irectors allocates a portion of the previous
year’s net income to reserves to ensure that the level is
commensurate with the income planning framework. n
addition, to the extent feasible, it allocates part of the
net income to support development activities in its de-
veloping member countries. n May 2008, the Board of
overnors approved the allocation of 2007 net income of
$760.2 million to the cumulative revaluation adjustments
account for $87.6 million, to loan loss reserve for $13.0 mil-
lion, to surplus and ordinary reserves for $278.3 million
each, to Asian evelopment und and Climate Changeund for $40.0 million each, and to echnical Assistance
pecial und for $23.0 million.
n ecember 2008, the Board of irectors approved
the revised policy on AB’s lending limitation, which limits
the total amount of disbursed loans, approved equity invest-
ments, and the maximum amount that could be demanded
from AB under its guarantee portfolio, to the total amount
of AB’s unimpaired subscribed capital, reserves, and sur-
plus. n addition, the gross outstanding borrowings shall not
exceed the sum of callable capital from nonborrowing mem-
bers, paid-in capital, and reserves (including surplus). As of 31 ecember 2008, headroom for lending was $29.2 billion
and for borrowings, $8.9 billion, based on the new policy
(compared with $35.5 billion for lending and $16.4 billion
for borrowings as of 31 ecember 20075).
n 6 May, the Board of irectors reported to the
Board of overnors on the status of AB’s resources and
highlighted the need to initiate a study on financial re-
sources. Accordingly, AB prepared a working paper
that provided the required analysis and context to assess
AB’s financial resource position during the implemen-
tation period of trategy 2020, and reviewed all possibleavenues for resource mobilization.
he working paper was discussed by the Board of i-
rectors on 6 ctober. he irectors noted that, while the
technical issues were well presented in the working paper,
the developmental and political issues are equally impor-
tant to address in the context of the general capital in-
crease and therefore requested the preparation of a second
working paper. he second working paper was discussed
by the Board of irectors in ebruary 2009. Management
is currently reviewing and preparing a proposal on the fifth
general capital increase for AB, which is scheduled for
board of directors’ discussion in April 2009.
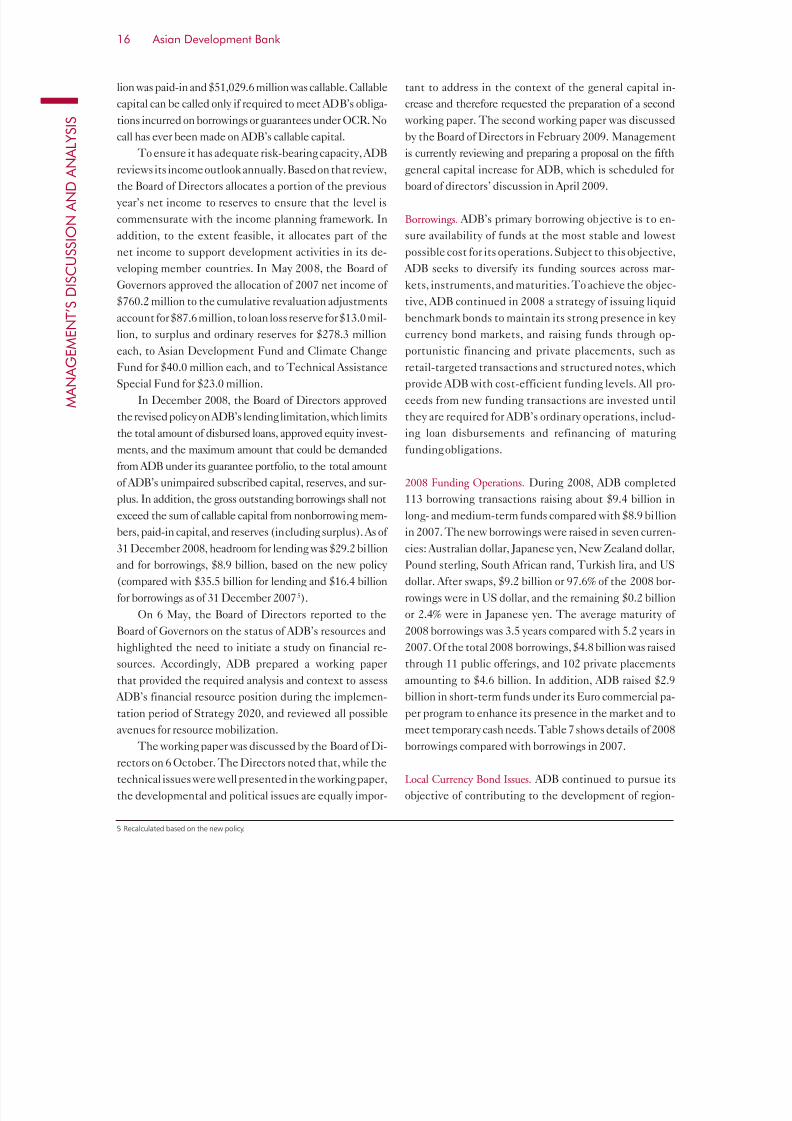
Borrowings. AB’s primary borrowing objective is to en-
sure availability of funds at the most stable and lowest
possible cost for its operations. ubject to this objective,
AB seeks to diversify its funding sources across mar-
kets, instruments, and maturities. o achieve the objec-
tive, AB continued in 2008 a strategy of issuing liquid
benchmark bonds to maintain its strong presence in key
currency bond markets, and raising funds through op-
portunistic financing and private placements, such asretail-targeted transactions and structured notes, which
provide AB with cost-efficient funding levels. All pro-
ceeds from new funding transactions are invested until
they are required for AB’s ordinary operations, includ-
ing loan disbursements and refinancing of maturing
funding obligations.
2008 Funding Operations. uring 2008, AB completed
113 borrowing transactions raising about $9.4 billion in
long- and medium-term funds compared with $8.9 billion
in 2007. he new borrowings were raised in seven curren-cies: Australian dollar, apanese yen, New ealand dollar,
ound sterling, outh African rand, urkish lira, and
dollar. After swaps, $9.2 billion or 97.6% of the 2008 bor-
rowings were in dollar, and the remaining $0.2 billion
or 2.4% were in apanese yen. he average maturity of
2008 borrowings was 3.5 years compared with 5.2 years in
2007. f the total 2008 borrowings, $4.8 billion was raised
through 11 public offerings, and 102 private placements
amounting to $4.6 billion. n addition, AB raised $2.9
billion in short-term funds under its uro commercial pa-
per program to enhance its presence in the market and tomeet temporary cash needs. able 7 shows details of 2008
borrowings compared with borrowings in 2007.
Local Currency Bond Issues. AB continued to pursue its
objective of contributing to the development of region-
5 Recalculated based on the new policy.

7/30/2019 ADB Annual Report 2008 - Financial Report
http://slidepdf.com/reader/full/adb-annual-report-2008-financial-report 19/218
17 Annual Report 2008
Currency Composition of Outstanding Borrowings(Before Swaps)
Japanese Yen10.2%
OtherCurrenciesa
42.7%
U.S. Dollar47.1%
al bond markets. Although this year’s market conditions
have not been favorable for AB to issue local currency
bonds, AB raised about $200 million equivalent through
cross-currency swaps to meet local currency funding re-
quirements in ndian rupee, ndonesian rupiah, and hil-
ippine peso.
Use o Derivatives. AB undertakes currency and inter-est rate swaps to raise, on a fully hedged basis, curren-
cies needed for operations in a cost efficient way while
maintaining its borrowing presence in major capital mar-
kets. igures 1 and 2 show the effects of swaps on the in-
terest rate structure and currency composition of AB’s
outstanding borrowings as of 31 ecember 2008. nterest
rate swaps are also used for asset and liability management
a Other currencies include Australian dollar, Canadian dollar, Chinese yuan, Euro, Hong Kong dollar, Indian rupee, Kazakhstan tenge, Malaysian ringgit, Mexican peso, New Taiwandollar, New Zealand dollar, Philippine peso, Pound sterling, Singapore dollar, South African rand, Swiss franc, Thai baht, and Turkish lira.
b Other currencies include Chinese yuan, Indian rupee, Kazakhstan tenge, Philippine peso, Pound sterling, and Swiss franc.
Figure 1: Effect on Currency Composition
Currency Composition of Outstanding Borrowings(Af ter Swaps)
OtherCurrenciesb
1.8%
Japanese Yen13.1%
U.S. Dollar
85.1%
Interest Rate Structure of Outstanding Borrowings(Before Swaps)
Variable6.6%
Fixed93.4%
Interest Rate Structure of Outstanding Borrowings(After Swaps)
Fixed14.5%
Variable85.5%
Figure 2: Effect on Interest Rate Structures
Table 7: Borrowings(Amounts in $ Million)
2008 2007
Long TermTotal Principal Amount 9,372.1 8,854.3Average Maturity to First Call (years) 3.5 5.2Average Final Maturity (years) 4.4 9.4Number of Transactions
Public Offerings 11 10
Private Placements 102 84Number of Currencies (before swaps)Public Offerings 4 8Private Placements 6 9
Short Terma Total Principal Amountb 2,866.6 3,139.1Number of Transactions 21 24Number of Currencies 2 3
a All euro-commercial papers.b At year-end, the outstanding principal amount was nil in 2008 and 2007.
7/30/2019 ADB Annual Report 2008 - Financial Report
http://slidepdf.com/reader/full/adb-annual-report-2008-financial-report 20/218
M A N A G E
M E N T ’ S D I S C U S S I O N
A N D A
N A L Y S I S
Asian Development Bank18
purposes to match the liabilities to the interest rate char-
acteristics of loans.
Liquidity Portfolio
he liquidity portfolio helps ensure the uninterrupted
availability of funds to meet loan disbursements, debt ser- vicing, and other cash requirements. t also contributes to
AB’s earning base. AB’s nvestment Authority governs
liquid asset investments. ts primary objective is to main-
tain the security and liquidity of funds invested. ubject
to these two parameters, AB seeks to maximize the total
return on its investments. n compliance with its Charter,
AB does not convert currencies for investment; invest-
ments are made in the same currencies in which they are
received. At present, liquid investments are held in 21
currencies.
iquid assets are held in government and govern-ment-related debt instruments, time deposits, and other
unconditional obligations of banks and financial institu-
tions, and, to a limited extent, in corporate bonds, mort-
gage-backed securities, and asset-backed securities of
high credit quality. hey are held in four subportfoli-
os—prudential liquidity, operational cash, cash cushion,
and discretionary liquidity—all of which have different
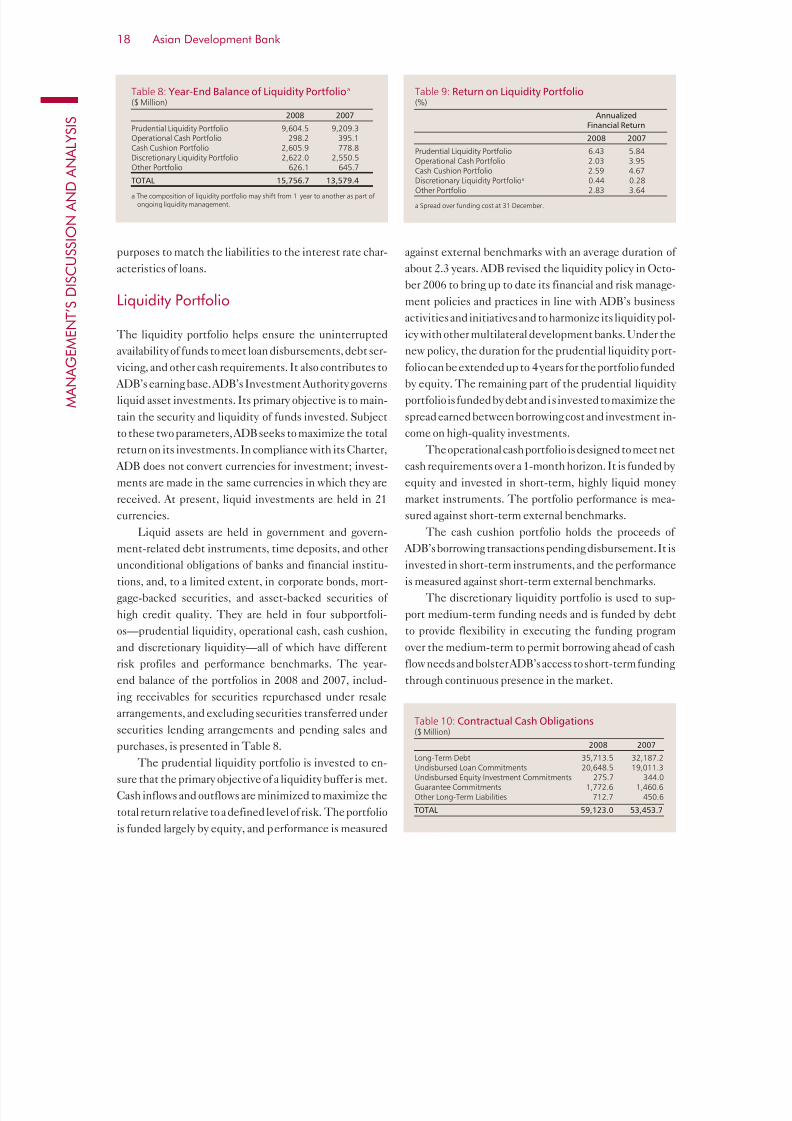
risk profiles and performance benchmarks. he year-
end balance of the portfolios in 2008 and 2007, includ-
ing receivables for securities repurchased under resale
arrangements, and excluding securities transferred undersecurities lending arrangements and pending sales and
purchases, is presented in able 8.
he prudential liquidity portfolio is invested to en-
sure that the primary objective of a liquidity buffer is met.
Cash inflows and outflows are minimized to maximize the
total return relative to a defined level of risk. he portfolio
is funded largely by equity, and performance is measured
against external benchmarks with an average duration of
about 2.3 years. AB revised the liquidity policy in cto-
ber 2006 to bring up to date its financial and risk manage-
ment policies and practices in line with AB’s business
activities and initiatives and to harmonize its liquidity pol-
icy with other multilateral development banks. nder the
new policy, the duration for the prudential liquidity port-folio can be extended up to 4 years for the portfolio funded
by equity. he remaining part of the prudential liquidity
portfolio is funded by debt and is invested to maximize the
spread earned between borrowing cost and investment in-
come on high-quality investments.
he operational cash portfolio is designed to meet net
cash requirements over a 1-month horizon. t is funded by
equity and invested in short-term, highly liquid money
market instruments. he portfolio performance is mea-
sured against short-term external benchmarks.
he cash cushion portfolio holds the proceeds of AB’s borrowing transactions pending disbursement. t is
invested in short-term instruments, and the performance
is measured against short-term external benchmarks.
he discretionary liquidity portfolio is used to sup-
port medium-term funding needs and is funded by debt
to provide flexibility in executing the funding program
over the medium-term to permit borrowing ahead of cash
flow needs and bolster AB’s access to short-term funding
through continuous presence in the market.
Table 8: Year-End Balance of Liquidity Portfolioa
($ Million)
2008 2007
Prudential Liquidity Portfolio 9,604.5 9,209.3Operational Cash Portfolio 298.2 395.1Cash Cushion Portfolio 2,605.9 778.8Discretionary Liquidity Portfolio 2,622.0 2,550.5Other Portfolio 626.1 645.7
TOTAL 15,756.7 13,579.4
a The composition of liquidity portfolio may shift from 1 year to another as part ofongoing liquidity management.
Table 9: Return on Liquidity Portfolio(%)
AnnualizedFinancial Return
2008 2007
Prudential Liquidity Portfolio 6.43 5.84Operational Cash Portfolio 2.03 3.95Cash Cushion Portfolio 2.59 4.67
Discretionary Liquidity Portfolioa 0.44 0.28Other Portfolio 2.83 3.64
a Spread over funding cost at 31 December.
Table 10: Contractual Cash Obligations($ Million)
2008 2007
Long-Term Debt 35,713.5 32,187.2Undisbursed Loan Commitments 20,648.5 19,011.3Undisbursed Equity Investment Commitments 275.7 344.0Guarantee Commitments 1,772.6 1,460.6Other Long-Term Liabilities 712.7 450.6
TOTAL 59,123.0 53,453.7
7/30/2019 ADB Annual Report 2008 - Financial Report
http://slidepdf.com/reader/full/adb-annual-report-2008-financial-report 21/218
19 Annual Report 2008
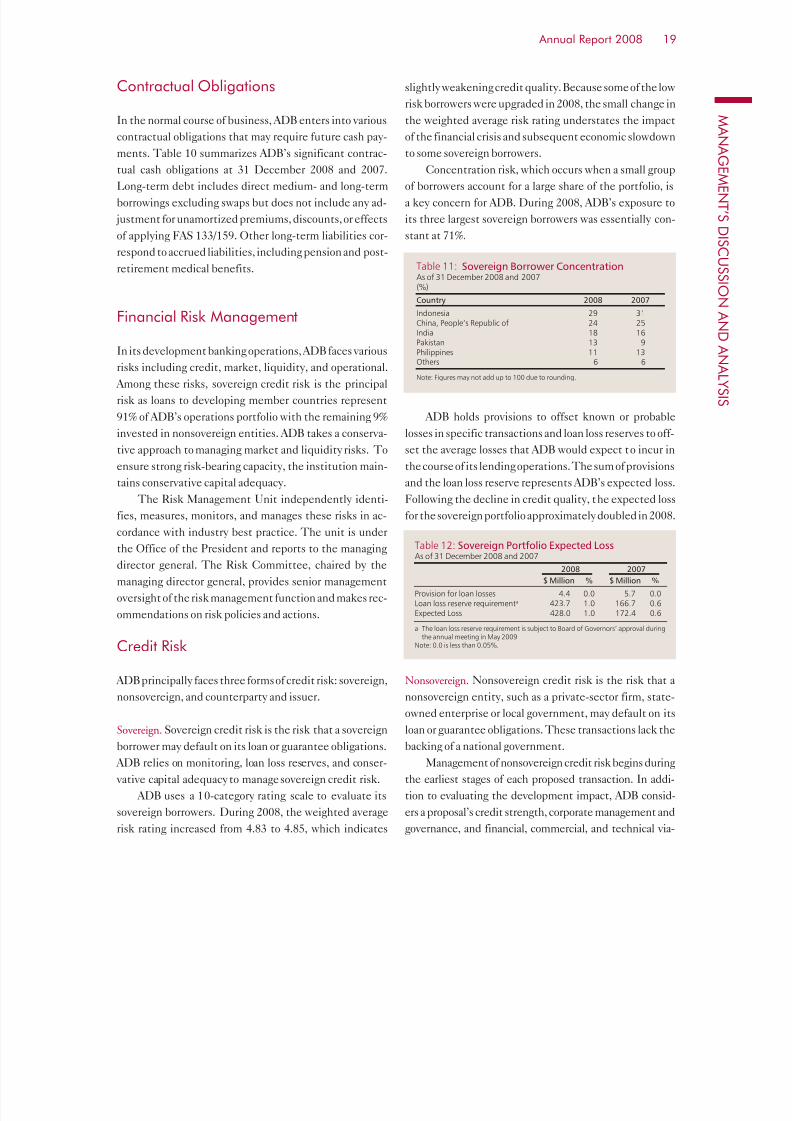
Table 11: Sovereign Borrower ConcentrationAs of 31 December 2008 and 2007(%)
Country 2008 2007
Indonesia 29 31China, People’s Republic of 24 25India 18 16Pakistan 13 9
Philippines 11 13Others 6 6
Note: Figures may not add up to 100 due to rounding.
Contractual Obligations
n the normal course of business, AB enters into various
contractual obligations that may require future cash pay-
ments. able 10 summarizes AB’s significant contrac-
tual cash obligations at 31 ecember 2008 and 2007.
ong-term debt includes direct medium- and long-term
borrowings excluding swaps but does not include any ad-
justment for unamortized premiums, discounts, or effects
of applying A 133/159. ther long-term liabilities cor-
respond to accrued liabilities, including pension and post-
retirement medical benefits.
Financial Risk Management
n its development banking operations, AB faces variousrisks including credit, market, liquidity, and operational.
Among these risks, sovereign credit risk is the principal
risk as loans to developing member countries represent
91% of AB’s operations portfolio with the remaining 9%
invested in nonsovereign entities. AB takes a conserva-
tive approach to managing market and liquidity risks. o
ensure strong risk-bearing capacity, the institution main-
tains conservative capital adequacy.
he isk Management nit independently identi-
fies, measures, monitors, and manages these risks in ac-
cordance with industry best practice. he unit is underthe ffice of the resident and reports to the managing
director general. he isk Committee, chaired by the
managing director general, provides senior management
oversight of the risk management function and makes rec-
ommendations on risk policies and actions.
Credit Risk
AB principally faces three forms of credit risk: sovereign,
nonsovereign, and counterparty and issuer.
Sovereign. overeign credit risk is the risk that a sovereign
borrower may default on its loan or guarantee obligations.
AB relies on monitoring, loan loss reserves, and conser-
vative capital adequacy to manage sovereign credit risk.
AB uses a 10-category rating scale to evaluate its
sovereign borrowers. uring 2008, the weighted average
risk rating increased from 4.83 to 4.85, which indicates
slightly weakening credit quality. Because some of the low
risk borrowers were upgraded in 2008, the small change in
the weighted average risk rating understates the impact
of the financial crisis and subsequent economic slowdown
to some sovereign borrowers.
Concentration risk, which occurs when a small group
of borrowers account for a large share of the portfolio, is
a key concern for AB. uring 2008, AB’s exposure to
its three largest sovereign borrowers was essentially con-
stant at 71%.
AB holds provisions to offset known or probable
losses in specific transactions and loan loss reserves to off-
set the average losses that AB would expect to incur in
the course of its lending operations. he sum of provisions
and the loan loss reserve represents AB’s expected loss.
ollowing the decline in credit quality, the expected loss
for the sovereign portfolio approximately doubled in 2008.
Nonsovereign. Nonsovereign credit risk is the risk that a
nonsovereign entity, such as a private-sector firm, state-
owned enterprise or local government, may default on itsloan or guarantee obligations. hese transactions lack the
backing of a national government.
Management of nonsovereign credit risk begins during
the earliest stages of each proposed transaction. n addi-
tion to evaluating the development impact, AB consid-
ers a proposal’s credit strength, corporate management and
governance, and financial, commercial, and technical via-
Table 12: Sovereign Portfolio Expected LossAs of 31 December 2008 and 2007
2008 2007
$ Million % $ Million %
Provision for loan losses 4.4 0.0 5.7 0.0Loan loss reserve requirementa 423.7 1.0 166.7 0.6Expected Loss 428.0 1.0 172.4 0.6
a The loan loss reserve requirement is subject to Board of Governors’ approval duringthe annual meeting in May 2009.
Note: 0.0 is less than 0.05%.
7/30/2019 ADB Annual Report 2008 - Financial Report
http://slidepdf.com/reader/full/adb-annual-report-2008-financial-report 22/218
M A N A G E
M E N T ’ S D I S C U S S I O N
A N D A
N A L Y S I S
Asian Development Bank20
bility. Not only do the business units undertake this due
diligence, but the isk Management nit also conducts an
independent assessment of each proposed transaction.
Currently, AB uses a 7-scale rating system to eval-
uate its nonsovereign borrowers. uring 2008, average
credit quality worsened, and the weighted average credit
rating increased from 3.5 to 3.7. he deteriorating macro-
economic conditions in some developing member coun-
tries led to the downgrade of firms operating in these
environments.
AB uses a variety of limits to manage concentration
risk in the nonsovereign portfolio. he total assistance to
a single project must not exceed 25% of the total project
cost or $250.0 million, whichever is lower. his limit en-
sures that exposure to a single project or obligor does not
exceed 5% of the Board-approved ceiling of $5.0 billion for
nonsovereign operations. urthermore, there are nonsov-ereign exposure limits for corporate groups, industry sub-
sectors, and countries.
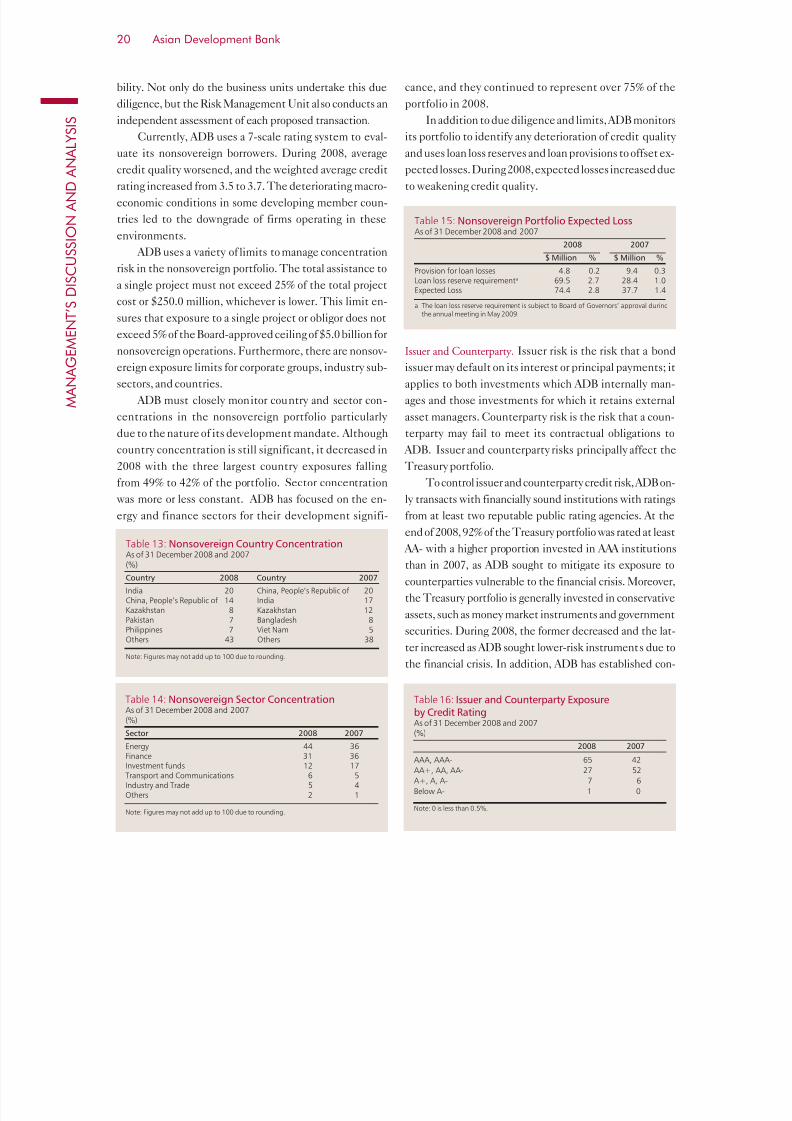
AB must closely monitor country and sector con-
centrations in the nonsovereign portfolio particularly
due to the nature of its development mandate. Although
country concentration is still significant, it decreased in
2008 with the three largest country exposures falling
from 49% to 42% of the portfolio. ector concentration
was more or less constant. AB has focused on the en-
ergy and finance sectors for their development signifi-
cance, and they continued to represent over 75% of the
portfolio in 2008.
n addition to due diligence and limits, AB monitors
its portfolio to identify any deterioration of credit quality
and uses loan loss reserves and loan provisions to offset ex-
pected losses. uring 2008, expected losses increased due
to weakening credit quality.
Table 13: Nonsovereign Country ConcentrationAs of 31 December 2008 and 2007(%)
Country 2008 Country 2007
India 20 China, People’s Republic of 20China, People’s Republic of 14 India 17Kazakhstan 8 Kazakhstan 12Pakistan 7 Bangladesh 8Philippines 7 Viet Nam 5Others 43 Others 38
Note: Figures may not add up to 100 due to rounding.
Table 14: Nonsovereign Sector Concentration
As of 31 December 2008 and 2007(%)
Sector 2008 2007
Energy 44 36Finance 31 36Investment funds 12 17Transport and Communications 6 5Industry and Trade 5 4Others 2 1
Note: Figures may not add up to 100 due to rounding.
Table 16: Issuer and Counterparty Exposure
by Credit RatingAs of 31 December 2008 and 2007(%)
2008 2007
AAA, AAA- 65 42
AA+, AA, AA- 27 52
A+, A, A- 7 6
Below A- 1 0
Note: 0 is less than 0.5%.
Table 15: Nonsovereign Portfolio Expected LossAs of 31 December 2008 and 2007
2008 2007
$ Million % $ Million %
Provision for loan losses 4.8 0.2 9.4 0.3Loan loss reserve requirementa 69.5 2.7 28.4 1.0Expected Loss 74.4 2.8 37.7 1.4
a The loan loss reserve requirement is subject to Board of Governors’ approval duringthe annual meeting in May 2009.
Issuer and Counterparty. ssuer risk is the risk that a bondissuer may default on its interest or principal payments; it
applies to both investments which AB internally man-
ages and those investments for which it retains external
asset managers. Counterparty risk is the risk that a coun-
terparty may fail to meet its contractual obligations to
AB. ssuer and counterparty risks principally affect the
reasury portfolio.
o control issuer and counterparty credit risk, AB on-
ly transacts with financially sound institutions with ratings
from at least two reputable public rating agencies. At the
end of 2008, 92% of the reasury portfolio was rated at least AA- with a higher proportion invested in AAA institutions
than in 2007, as AB sought to mitigate its exposure to
counterparties vulnerable to the financial crisis. Moreover,
the reasury portfolio is generally invested in conservative
assets, such as money market instruments and government
securities. uring 2008, the former decreased and the lat-
ter increased as AB sought lower-risk instruments due to
the financial crisis. n addition, AB has established con-

7/30/2019 ADB Annual Report 2008 - Financial Report
http://slidepdf.com/reader/full/adb-annual-report-2008-financial-report 23/218
21 Annual Report 2008
servative exposure limits for its corporate investments, de-
pository relationships, and other asset classes.
AB has not been materially impacted by the collapse
in credit quality of mortgage-backed securities. AB’s
exposure to these instruments is small, and any losses have
been offset by gains in AB’s higher quality investments,
whose values have increased as investors have moved to saf-er assets.
o mitigate counterparty credit risk arising through
derivative transactions, AB has strict counterparty eligi-
bility criteria. n general, AB will only undertake swap
transactions with counterparties that have met the re-
quired minimum counterparty credit rating, executed an
nternational waps and erivatives Association Master
Agreement, and signed a credit support annex. nder the
credit support annex, derivative positions are marked-to-
market daily and collateral calls, mainly cash and rea-
sury securities, are made in accordance with the creditsupport annex. AB also sets exposure limits for individ-
ual swap counterparties and monitors these limits against
both current and potential exposures.
Market Risks
Market risk is the risk of loss on financial instruments due
to changes in market prices. AB principally faces three
forms of market risk: interest rate, foreign exchange, and
equity price.
Interest Rate. AB is primarily exposed to interest rate risk
through the reasury portfolio. nterest rate risk in the
operations portfolio is fully hedged as borrowers’ inter-
est payments are matched to AB’s borrowing expenses.
herefore, the borrower assumes the risk of fluctuating
interest rates whereas AB’s margin remains largely con-
stant. AB monitors and manages interest rate risks in
the reasury portfolio by employing various quantitative
methods. t marks all positions to market, monitors inter-
est rate risk metrics, and employs stress testing and sce-
nario analysis.
AB principally uses two metrics to measure interest
rate risk, duration and interest rate value-at-risk (a). u-
ration is the estimated percentage change in the portfolio’s
value in response to a 1% parallel change in interest rates.
uring 2008, interest rate risk as measured by duration re-mained essentially constant. Although the portfolio’s asset
composition shifted from deposits to government securi-
ties the aggregate maturity of the assets did not materially
change. nterest rate a is a measure of possible loss at a
given confidence level in a given timeframe due to changes in
interest rates. AB uses a 95% confidence level and a 1-year
time horizon. n other words, AB would expect to lose at
least this amount once every 20 years due to fluctuations in
interest rates. nlike duration, which AB uses to measure
interest rate risk across the reasury portfolio, AB only uses
a for the rudential iquidity ortfolio, which is the mostexposed to interest rate risk. n 2008, interest rate risk in the
rudential iquidity ortfolio increased primarily due to the
increase in interest rate volatility.
Foreign Exchange. n line with the Charter, AB ensures
that its operations assume a minimum exposure to ex-
change rate risk. n both the operations and reasury port-
folios, AB is required to match its loans and investments
to the same currencies in which funds are received. Bor-
rowed funds or funds to be invested may only be converted
into other currencies provided that they are fully hedgedthrough cross currency swaps or forward exchange agree-
ments. iven its multicurrency operations, however, AB
is exposed to fluctuations in reported dollar results
due to currency translation adjustments.
Equity Price. quity price risk arises through AB’s invest-
ments in equity securities and private equity funds. AB’s
Table 18: Interest Rate Risk As of 31 December 2008 and 2007(%)
2008 2007
Duration 1.6 1.5Interest Rate VaR 4.9 3.5
VaR = value-at-risk.
Table 17: Issuer and Counterparty Exposure by Asset ClassAs of 31 December 2008 and 2007(%)
2008 2007
Government Securities 45 27Government Sponsored Entity Securities 25 12Deposits 10 39Corporate Securities 9 9Derivative Exposures 3 7Asset- and Mortgage-Backed Securities 4 4Cash 3 2
Note: Figures may not add up to 100 due to rounding.

7/30/2019 ADB Annual Report 2008 - Financial Report
http://slidepdf.com/reader/full/adb-annual-report-2008-financial-report 24/218
M A N A G E
M E N T ’ S D I S C U S S I O N
A N D A
N A L Y S I S
Asian Development Bank22
Charter limits equity investments to 10% of unimpaired
paid-in capital, reserves, and surplus less special reserves.
Additionally, private equity funds are limited to 5% of this
sum. AB manages equity price risk using the same due
diligence and monitoring procedures as described under
nonsovereign credit risk.
Liquidity Risk
AB’s liquidity policy ensures the availability of sufficient
cash flows to meet all financial and operational commit-
ments despite uncertain borrowing conditions. nder the
current framework, AB holds sufficient liquidity to fund
18 months of operations. AB’s liquidity requirements
are primarily determined by expected loan disburse-
ments, loan amortization prepayments, debt payments,
and cash from net income.n addition, AB holds discretionary liquidity to provide
flexibility in funding and debt redemptions. iquidity levels
and net cash requirements are monitored on an ongoing basis
and reviewed by the Board of irectors quarterly.
Operational Risk
perational risk is the risk of loss resulting from inadequate
or failed internal processes, people and systems, or from ex-
ternal events. AB is exposed to many types of operational
risk, which it mitigates through sound internal controls. ABhas a rigorous process for approving transactions to minimize
errors in the lending function. AB has also adopted a strat-
egy to strengthen business continuity, and particularly in-
formation technologies, to reduce the impact of disruptions.
Capital Adequacy
Capital is a financial institution’s ultimate protection
against unexpected losses that may arise from various
risks. n AB’s context, it also protects shareholders from
the possibility of having to contribute callable or addition-al paid-in capital. AB uses stress testing to assess its capi-
tal adequacy on a regular basis. hroughout 2008, AB’s
capital position remained strong.
he capital stress test assesses AB’s ability to absorb
credit shocks, which are the institution’s principal risk, while
supporting continued lending in line with its development
mandate. he desired outcome of the stress test is that AB
should have sufficient capital to (i) absorb an income loss
due to the credit shock, and (ii) generate sufficient income
to support post-shock loan growth. or the stress test, AB
generates thousands of potential portfolio scenarios and im-
poses credit shocks that are large enough to account for 99%
of those scenarios. AB then assesses the impact of these
shocks on its capital by modeling its equity-to-loan ratio over
the next 10 years. ith an equity-to-loan ratio of 38% at the
end of 2008, the current stress test results comfortably ex-
ceeded the desired outcome described above.
Asset and Liability Management. he objectives of asset
and liability management for AB is to safeguard AB’s
net worth and overall capital adequacy, promote steady
growth in AB’s risk bearing capacity, and define sound
financial policies to undertake acceptable levels of finan-
cial risks to provide resources for developmental lend-
ing purposes at the lowest and most stable funding costto the borrowers along with the most reasonable lending
terms, while safeguarding AB’s financial strength. he
asset and liability management safeguards net worth from
foreign exchange rate risks, protects net interest margin
from fluctuation in interest rates, and provides sufficient
liquidity to meet AB’s operations. AB also adheres to
cost pass-through pricing policy for the loans to sovereign
borrowers, and allocates the most cost efficient borrow-
ings to fund the loans. he asset and liability management
objectives and practices were clarified and formalized in
2006 through the Board-approved comprehensive assetand liability management policy framework. he frame-
work has formalized the guiding principles for manag-
ing C financial assets and liabilities, and provided the
governing framework to guide all asset and liability man-
agement-related financial policies, including liquidity, in-
vestments, equity management, and capital adequacy.
Internal Control Over Financial Reporting
n line with global best practices on corporate governance,
AB’s management carried out an evaluation of the ade-quacy and effectiveness of internal control over financial
reporting using criteria established in nternal Control -
ntegrated ramework issued by the Committee of the
ponsoring rganization of the readway Commission
(C). he evaluation includes test of key controls
over financial reporting, and AB’s external auditors con-
curred that AB maintained effective internal control
over financial reporting for 2008.

7/30/2019 ADB Annual Report 2008 - Financial Report
http://slidepdf.com/reader/full/adb-annual-report-2008-financial-report 25/218
23 Annual Report 2008
Summary of Financial Performance
Net Income. Net income before net unrealized gains was
$675.8 million, compared with $711.4 million in 2007.
he decrease of $35.6 million (5.0%) was predominantly
due to the following:
PLOOLRQGHFUHDVHLQRYHUDOOORDQLQFRPHPDLQ-
ly due to $65.8 million net decrease in interest in-
come and other loan charges, $22.0 million increase in
expenses on asset swaps hedging loan products, and
$2.9 million decrease in provision for loan losses. e-
spite a higher outstanding loan portfolio, overall loan
income decreased because of lower dollar B
compared with the same period in 2007;
PLOOLRQGHFUHDVHLQLQYHVWPHQWLQFRPHUHVXOW-
ing from lower investment returns associated withthe decrease in the interest rate environment;
PLOOLRQGHFUHDVHLQLQFRPHIURPHTXLW\LQYHVW-
ments resulting mainly from $60.0 million reduction
in the proportionate share of income from private
equity funds, which are accounted for under equity
method, $17.0 million decrease in net realized gains
on disposal of equity investments, and recognition of
$8.7 million impairment loss mostly associated with
restructured accounts, net of $5.0 million increase in
dividend income;
PLOOLRQLQFUHDVHLQDGPLQLVWUDWLYHH[SHQVHVDO-located to C. his was driven by the $15.9 million
increase in overall administrative expenses ($363.7
million in 2008; $347.8 million in 2007) mainly attrib-
uted to increases in salaries ($9.5 million), business
travel ($3.3 million), and contractual services ($2.2
million). his was offset by $1.5 million decrease in
deferred loan origination costs related to new loans
and guarantees;
PLOOLRQLQFUHDVHLQWHFKQLFDODVVLVWDQFHWRPHP-
ber countries following the $10.0 million grant pro-
vided to the ava econstruction und; and PLOOLRQGHFUHDVHLQRYHUDOOERUURZLQJVDQGUH-
lated expenses resulting mainly from declining inter-
est rates in some markets compared with the same
period in 2007.
Net unrealized gains of $450.6 million for the year
ended 31 ecember 2008 ($53.8 million in 2007) are pri-
marily the favorable result of A 133, 155, and 159 ap-
plication totaling $451.0 million ($57.5 million in 2007),
increasing the net income to $1,126.3 million for the year
ended 31 ecember 2008 from $765.2 million for the year
ended 31 ecember 2007.
Net Unrealized Gains and Losses on Financial Instruments
as per FAS 133, 155, and 159. AB posted net unrealized gain
of $1,441.7 million on derivatives used for hedging trans-
actions compared to net unrealized loss of $351.1 million
in 2007. Corresponding unrealized loss on the hedged
borrowings were $1,522.9 million in 2008 compared to an
unrealized gain of $408.6 million in 2007. he gain on de-
rivatives were primarily due to significant downward shift
of the short to medium-term yield curves of the major cur-
rencies, partially offset by the weakening of most major
currencies (with the exception of apanese yen) againstthe dollar in 2008. he effect of declining interest
rates coupled with strengthening of the dollar during
the period had a net effect of increasing the borrowing re-
lated derivatives value, i.e. swaps. he impact was largely
felt on the swaps relating to non-structured debts which
are designed to behave as long-term fixed assets denom-
inated in the hedged-borrowings in original currencies.
he liability portion of the swaps would behave similar to
long-term dollar B-based liabilities.
ffective 1 anuary 2008, AB adopted A 159
for non-structured swapped borrowings. he adoptionof A 159 resulted in a favorable adjustment of $227.5
million, which was recorded as an adjustment to the be-
ginning balance of reserves. air valuation of the non-
structured swapped borrowings resulted in an unrealized
loss of $2,035.9 million for 2008 offsetting the gain on the
hedged swap position of $2,001.4 million. owever, the
liquidity crisis resulting from the current global financial
situation led to widening of the funding spreads resulting
in a net gain of $531.7 million from the application of cred-
it spread (A 157) to the entire portfolio that are carried
at fair value, including structured borrowings.he appreciation of apanese yen against the dol-
lar in 2008 affected the structured debt portfolio to a cer-
tain extent. he decrease in value of the underlying debts
outweighed the increase in the value of the embedded de-
rivatives, which are highly sensitive to the expected foreign
exchange rates movements. n an after-swap basis, the
change in fair value of the structured debts led to an unreal-
7/30/2019 ADB Annual Report 2008 - Financial Report
http://slidepdf.com/reader/full/adb-annual-report-2008-financial-report 26/218
M A N A G E
M E N T ’ S D I S C U S S I O N
A N D A
N A L Y S I S
Asian Development Bank24
ized gain of $140.0 million for the year ended 31 ecember
2008. he unrealized gains were due mainly to movements
of foreign exchanges and interest rates. As the structured
instruments are fully hedged, the swaps would economi-
cally offset any foreign exchange and interest rate risks of
the instruments (Note M of C inancial tatements).
CRITICAL ACCOUNTING POLICIES AND ESTIMATES
ignificant accounting policies are contained in Note B of
C’s financial statements. As disclosed in the financial
statements, Management estimates the fair value of fi-
nancial instruments. stimates by their nature are based
on judgment and available information; therefore, actual
results may differ and might have a material impact on the
financial statements.
Fair Value o Financial Instruments. nder statutory report-
ing, AB carries its financial instruments and derivatives,
as defined by A 133 and A 159, on a fair value basis.
hese financial instruments include embedded derivatives
that are valued and accounted for in the balance sheet as
a whole. air values are usually based on quoted market
prices. f market prices are not readily available, fair values
are usually determined using market-based pricing models
incorporating readily observable market data and require
judgment and estimates.he pricing models used for determining fair values
of AB’s financial instruments are based on discounted
expected cash flows using observable market data. AB
reviews the pricing models to assess the appropriateness
of assumptions to reasonably reflect the valuation of the
financial instruments. n addition, the fair values derived
from the models are subject to ongoing internal and ex-
ternal verification and review. he models use market-
sourced inputs such as interest rates, exchange rates, and
option volatilities. election of these inputs may involve
some judgment and may impact net income. AB believesthat the estimates of fair values are reasonable given exist-
ing controls and processes.
inancial Accounting tandards Board issued A 157–
air alue Measurements, in eptember 2006, and A
159–air alue ption for inancial Assets and inancial
iabilities, in ebruary 2007. A 157 emphasizes the def-
inition and methods for measuring fair value, and expands
disclosure requirements for financial reporting purposes,
while A 159 expands the scope of financial instruments
that may be carried at fair value. hese are discussed in
more detail in Note B of C’s financial statements.
Provision or Loan Losses. rovision against loan losses for
impaired loans reflects management’s judgment and esti-
mate of the present value of expected future cash flows dis-
counted at the loan’s effective interest rate. AB considers
a loan impaired when, based on current information and
events, it is probable that AB will be unable to collect all
the amounts due according to the loan’s contractual terms.
n 2006, the Board approved the revision of the loan loss
provisioning methodology for AB’s nonsovereign operations
to a risk-based model. he assessment applies the concept of
expected loss to establish loss provision and loss reserve, simi-
lar to the concept applied to AB’s sovereign operations ap-proved in 2004. he provisioning estimate is performed by the
isk Management nit on a quarterly basis.
n the revised methodology, AB uses an internal risk
rating system to estimate the probability of default based
on its past loan loss experience and various tools available
in the market. oans that are considered impaired based
on the probability of default are provisioned through the
income statement. hose that are not impaired will be
provisioned through the establishment of a loss reserve in
the equity section as an allocation of net income subject
to the approval of the Board of overnors.
SPECIAL FUNDS
AB is authorized by its Charter to establish and adminis-
ter special funds. hese are the Asian evelopment und,
echnical Assistance pecial und, apan pecial und,
AB nstitute pecial und, the Asian sunami und, the
akistan arthquake und, the egional Cooperation and
ntegration und, and the Climate Change und. inan-
cial statements for each fund are prepared in accordance
with generally accepted accounting principles except for A’s which are special purpose financial statements pre-
pared in accordance with A egulations.
Asian Development Fund
A is AB’s concessional financing window for devel-
oping member countries with low per capita gross na-

7/30/2019 ADB Annual Report 2008 - Financial Report
http://slidepdf.com/reader/full/adb-annual-report-2008-financial-report 27/218
25 Annual Report 2008
tional product and limited debt repayment capacity. t
is the only multilateral source of concessional assistance
dedicated exclusively to reducing poverty and to improv-
ing the quality of life in Asia and the acific. hirty-two
donor members (regional and nonregional) have contrib-
uted to the fund. Cofinancing with bilateral and multi-
lateral development partners complement AB’s A
resources.
n August 2008, the Board of overnors adopted the
resolution providing for the ninth replenishment of the
A (A ) and the fourth regularized replenishment
of the A. he resolution provides for a substantial re-
plenishment of the A to finance AB’s concessional
program for the 4-year period from anuary 2009, and for a
replenishment of the A in conjunction with the A
replenishment, to finance technical assistance operations
under the A. otal replenishment size is specialdrawing rights () 7.1 billion ($11.3 billion), consist-
ing of 6.9 billion for A and 0.2 billion for
A. About 37% of the replenishment will be financed
from new donor contributions amounting to 2.6 bil-
lion ($4.2 billion equivalent). he replenishment shall be
effective upon receipt of the nstruments of Contribu-
tion for nqualified Contribution commitments in an ag-
gregate amount equivalent to at least 1.3 billion, and
such date should not be later than 1 uly 2009.
Currency Management. ffective 1 anuary 2006, the newcurrency management framework for A, which was ap-
proved by the Board of irectors in ctober 2005, was
implemented. nder this new framework, the practice of
managing A resources in as many as 15 currencies was
discontinued, and an approach based on special drawing
rights () basket of currencies was introduced. A
donor contributions and loan reflows received in curren-
cies that do not constitute are immediately convert-
ed into one of currencies to maintain -based
liquidity portfolio. n addition, the borrower’s obligations
for new A loans are now determined in .
Loan Conversion. n uly 2007, as an application of the
Board-approved new currency management framework,
AB offered a full-fledged special drawing rights ()
approach to A legacy loans by providing A borrow-
ers the option to convert their existing liability (i.e., dis-
bursed and outstanding loan balance) in various currencies
into , while the undisbursed portions will be treated
as new loans. he conversion will shorten the time horizon
to achieve the full benefits, reduce exchange rate volatility
associated with legacy A loans, and provide a consistent
debt portfolio management framework across peer multi-
lateral banks and all A loans. he conversion was made
available beginning 1 anuary 2008. A series of workshops
were conducted from late 2007 to ctober 2008 to promote
borrowers’ awareness of the conversion option, and assist
borrowers in making informed decisions. As of ecember
2008, 16 out of 30 A borrowing countries have signified
their agreement to the conversion and $11.5 billion of out-
standing legacy loans had been converted to loans.
Revised Framework or Grants and Hard-Term Facility. n
eptember 2007, the Board of irectors approved the
revised A grant framework which limits grants eligi-bility to A-only countries and introduced a new hard-
term A lending facility. he facility will have a fixed
interest rate of 150 basis points below the weighted av-
erage of the 10-year fixed swap rates of the special draw-
ing rights component currencies plus the C lending
spread, or the current A rate, whichever is higher.
ther terms are similar to those of regular A loans.
n general, blend countries with per capita income not
exceeding the nternational evelopment Association
operational cutoff for more than 2 consecutive years and
an active ordinary capital resources lending program areeligible to borrow from this new facility. he interest
rate will be reset every anuary through a board informa-
tion paper. he rate will apply to all hard-term loans ap-
proved that year and will be fixed for the life of the loan.
or hard-term A loans approved in 2008, the interest
rate was set at 3.15%. hree loans were approved under
this new facility in 2008.
Financial Framework. n ecember 2007, the Board of i-
rectors approved a new A financial framework that aims
to enhance the long-term financial capacity of A and im-prove prudential financial management practices. he new
framework establishes tranching of liquidity to improve the
liquidity management and prudential minimum liquidity
level A should maintain. he new framework allows
A to have a higher and more stable commitment author-
ity for future replenishments and ensure that liquidity is
managed in a transparent and efficient manner.

7/30/2019 ADB Annual Report 2008 - Financial Report
http://slidepdf.com/reader/full/adb-annual-report-2008-financial-report 28/218
M A N A G E
M E N T ’ S D I S C U S S I O N
A N D A
N A L Y S I S
Asian Development Bank26
Heavily Indebted Poor Countries (HIPC) Debt Relie. A
donors requested AB’s participation in the C debt
relief. n line with this, AB Board of overnors adopted
Board esolution No. 329 on 7 April 2008 for AB to par-
ticipate in the C debt relief, and to provide Afghan-
istan with debt relief. he estimated principal amount
of Afghanistan’s A debt to be forgiven and charged
against A income is $89.8 million.6
he C nitiative was launched in 1996 by the n-
ternational evelopment Association and nternational
Monetary und to reduce the excessive debt burden faced
by the world’s poorest countries. A “sunset clause” was
stipulated to prevent the C debt relief from becoming
a permanent facility, minimize moral hazard, and encour-
age early adoption of reform programs. his has been ex-
tended several times with the latest “sunset clause” being
end-2006 with a “ring-fence” of its application to coun-tries satisfying the income and indebtedness criteria using
end-2004 data. hus far, Afghanistan is the only A bor-
rower that has qualified for C debt relief. hile other
A borrowers have met the C indebtedness crite-
ria, it is not possible to currently estimate whether these
countries will qualify for C debt relief.
nder the policy, upon approval of debt relief for a
country by the Board of irectors, the principal compo-
nent of the estimated debt relief costs will be recorded
as a reduction of the disbursed and outstanding loans on
a provisional basis and charged against A income. henternational evelopment Association and nternation-
al Monetary und boards will decide when a country has
satisfied the conditions for reaching the completion point.
pon reaching the completion point the debt relief will
become irrevocable. he accumulated provision for C
debt relief will be reduced when debt relief is provided on
the loan service payment date. As of 31 ecember 2008,
provision of $0.5 million has been written off under this
arrangement, bringing the balance to $87.5 million, at 31
ecember 2008 exchange rate.
Contributed Resources. uring the eighth replenishment of
the A (A ), donors recommended a replenishment
of $7.0 billion, consisting of $3.3 billion in new contributions
from donors and $3.7 billion from internal resources based on
the exchange rate specified in the esolution of the Board
of overnors. A , which covers the 4-year period from
2005 to 2008, became effective in April 2005 after instru-
ments of contribution deposited with AB for unqualified
contribution exceeded 50% of all pledged contributions. As
of 31 ecember 2008, 30 donors have committed a total of $3.7 billion7 to A , including contributions of reland
($32.5 million) and Brunei arussalam ($9.5 million). otal
deposited installment payments amounting to $3.4 billion7
include $3.0 billion for A operations, $0.2 billion for ech-
nical Assistance pecial und, and $0.2 billion for financing
forgone interest of grants. he remaining unpaid contribu-
tions under A as of 31 ecember 2008 amounted to
$168.8 million7 (or details of amounts released for opera-
tional commitment in 2008, see the column labeled “Addi-
tion” in tatistical Annex 23.)
n May 2008, the Board of overnors approved thetransfer of $40 million to A as part of C’s net in-
come allocation ($40 million in 2007). n addition, a to-
tal of $1,133.3 million from loan savings and cancellations
have been included in the commitment authority. his
resulted from Management’s continuous assessment of
6 Based on the disbursed and outstanding debt as of 20 March 2006, converted to US dollar using the exchange rate as of 7 April 2008.7 US dollar equivalent at 31 December 2008 exchange rates.
Table 19: Asian Development Fund CommitmentAuthoritya
31 December 2008 and 2007($ Million)
2008 2007
Carryover from ADF VIII Commitment Authorityb 124.4 126.9
ADF IX Contributionsc 2,976.5 2,144.4
ADF VIII Contributions 161.6 164.6
OCR Net Income Transfer 160.0 120.0
Expanded Advance Commitment Authority 3,895.7 2,979.7
Loans Savings and Cancellation 1,133.3 890.8
Credits from AcceleratedNote Encashment Program 63.0 –
Provision for Disbursement Risk d (158.4) (157.9)
Provision for Foreign Exchange Volatilitye 15.2 –
Total ADF IX Commitment Authority 8,371.3 6,268.5
Loans and Grants Committed 8,248.7 5,833.1
ADF Commitment Authority Availablefor Future Commitments 122.6 435.4
( ) = negative, ADF = Asian Development Fund, OCR = ordinary capital resources.a The schedule reflects cumulative commitment authority for ADF IX.b The US dollar equivalent of SDR80.4 million at each year-end exchange rates.
c Contributions received to finance forgone interest of grants are excluded as theyhave been incorporated as cash inflows in the computation of Expanded AdvanceCommitment Authority.
d Applies to contribution and net income transfer received prior to the adoption ofthe new ADF Financial Framework in December 2007.
e Represents an allowance to cover the shortfall in the commitment authority due toexchange rate fluctuation during the last 3 months of 2008.
Note: Total may not add due to rounding.

7/30/2019 ADB Annual Report 2008 - Financial Report
http://slidepdf.com/reader/full/adb-annual-report-2008-financial-report 29/218
27 Annual Report 2008
opportunities for freeing committed resources through
cancellations of unused loan balances. uring 2008, prom-
issory notes totaling $603.1 million have been encashed,
$58.6 million of which was transferred to the echnical
Assistance pecial und.
Loan Approvals, Disbursements, and Repayments. n 2008,
36 A loans totaling $1.8 billion were approved com-
pared with 36 loans totaling $1.9 billion in 2007. is-
bursements during 2008 totaled $2.0 billion, an increase
of 26.3% from $1.6 billion in 2007. At the end of the year,
cumulative disbursements from A resources were
$27.0 billion. oan repayments during the year amount-
ed to $676.9 million. At year-end, outstanding A loans
amounted to $26.4 billion.
Status o Loans. At the end of the year, 28 sovereign loans toMyanmar with total principal outstanding of $565.8 mil-
lion were in non-accrual status representing about 2.1% of
the total outstanding A loans.
Investment Portolio Position. he A investment port-
folio8 amounted to $6.3 billion at 31 ecember 2008 com-
pared with $7.0 billion in 2007. About 16% of the portfolio
was invested in bank deposits, and 84% was invested in
fixed income securities. he annualized rate of return on
A investments including unrealized gains and losses
was 5.2% (4.7% in 2007).
Grants. ith the introduction of grant financing in A
, 27 grants (24 in 2007) were approved in 2008 totaling
$707.4 million ($519.3 million in 2007), while 27 grants
(17 in 2007) totaling $539.8 million ($377.8 million in
2007) became effective.
Conancing or Loans. n 2008, $87.0 million was mobilized
in official loan cofinancing for two loan projects totaling
$126.0 million.
Technical Assistance Special Fund
he echnical Assistance pecial und was established
to provide technical assistance on a grant basis to devel-
oping member countries of the Asian evelopment Bank
and regional technical assistance.
n August 2008, the Board of overnors adopted the
resolution providing for the ninth replenishment of the
A (A ) and the fourth regularized replenishment
of the echnical Assistance pecial und (A). Con-
sidering the demand estimate and the availability of fundsfrom other sources, the donors agreed to contribute 3% of
the total replenishment size as the fourth replenishment
of the A. he replenishment will cover the 4-year pe-
riod 2009 to 2012 (see related notes under A).
Contributed Resources. As of 31 ecember 2008, 28 do-
nors committed a total of $219.5 million to A, as part
of the A and the third regularized replenishment
of A. f the total commitment, $202.9 million have
been received.
uring the year, ndia made a direct voluntary con-tribution amounting to $0.25 million, and akistan, $0.07
million. n addition, $23.0 million was allocated to A
as part of C’s 2007 net income allocation, and a total
of $7.0 million regularized replenishment was received.
At the end of 2008, total A resources amounted to
$1,402.6 million, of which $1,299.9 million was commit-
ted, leaving an uncommitted balance of $102.7 million
(tatistical Annex 24).
Operations. echnical assistance (A) commitments
(approved and effective) increased from $77.5 millionin 2007 to $108.2 million in 2008 for 156 A projects that
were made effective during the year, net of $15.6 mil-
lion ($11.9 million in 2007) write back of undisbursed
commitments for completed and cancelled A projects.
ndisbursed commitments for technical assistance in-
creased to $222.7 million as of 31 ecember 2008 ($183.7
Table 20: Technical Assistance Special FundCumulative Resources($ Million)
2008 2007
Regularized ReplenishmentContributions 432.6 425.7
Allocations from OCR Net Income 706.0 683.0Direct Voluntary Contributions 89.2 88.8Income from Investment andOther Sources 178.3 167.3
Transfers from the TASF to the ADF (3.5) (3.5)
TOTAL 1,402.6 1,361.3
( ) = negative, ADF = Asian Development Fund, OCR = ordinary capital resources,TASF = Technical Assistance Special Fund.
8 Includes securities purchased under resale arrangement.
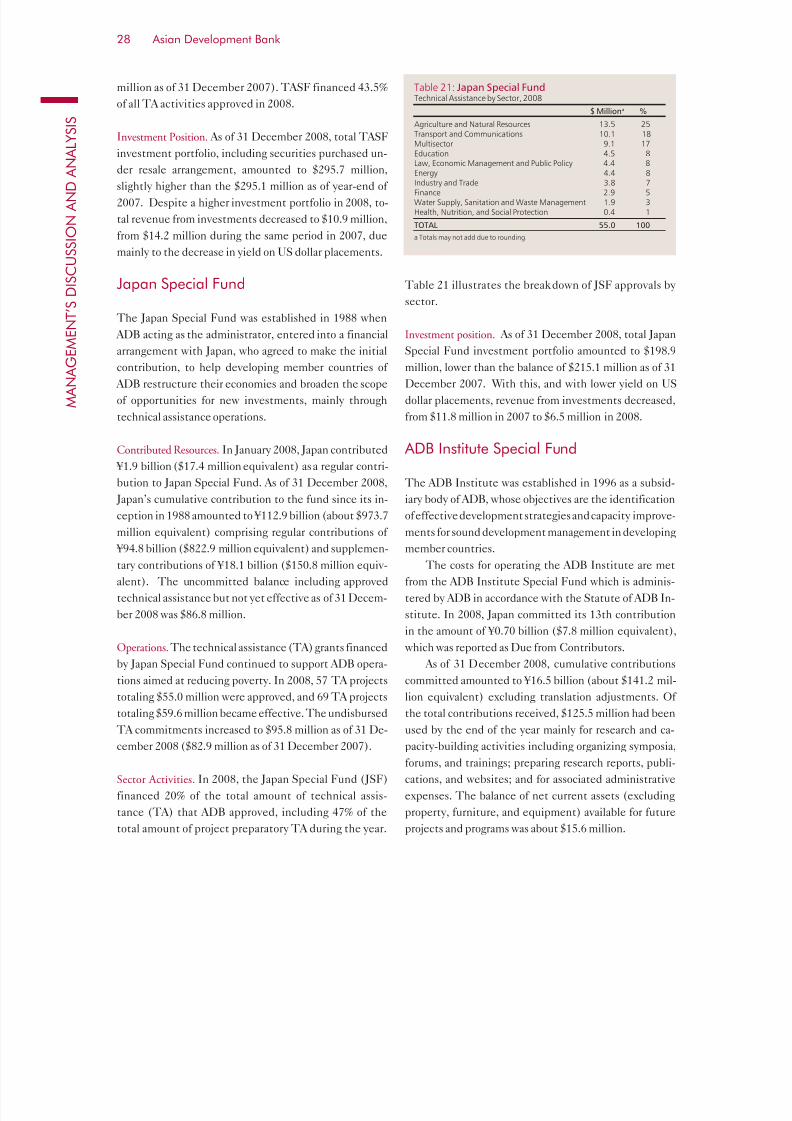
7/30/2019 ADB Annual Report 2008 - Financial Report
http://slidepdf.com/reader/full/adb-annual-report-2008-financial-report 30/218
M A N A G E
M E N T ’ S D I S C U S S I O N
A N D A
N A L Y S I S
Asian Development Bank28
million as of 31 ecember 2007). A financed 43.5%
of all A activities approved in 2008.
nvestment Position. As of 31 ecember 2008, total A
investment portfolio, including securities purchased un-
der resale arrangement, amounted to $295.7 million,
slightly higher than the $295.1 million as of year-end of
2007. espite a higher investment portfolio in 2008, to-
tal revenue from investments decreased to $10.9 million,
from $14.2 million during the same period in 2007, due
mainly to the decrease in yield on dollar placements.
Japan Special Fund
he apan pecial und was established in 1988 when
AB acting as the administrator, entered into a financial
arrangement with apan, who agreed to make the initialcontribution, to help developing member countries of
AB restructure their economies and broaden the scope
of opportunities for new investments, mainly through
technical assistance operations.
Contributed Resources. n anuary 2008, apan contributed
¥1.9 billion ($17.4 million equivalent) as a regular contri-
bution to apan pecial und. As of 31 ecember 2008,
apan’s cumulative contribution to the fund since its in-
ception in 1988 amounted to ¥112.9 billion (about $973.7
million equivalent) comprising regular contributions of ¥94.8 billion ($822.9 million equivalent) and supplemen-
tary contributions of ¥18.1 billion ($150.8 million equiv-
alent). he uncommitted balance including approved
technical assistance but not yet effective as of 31 ecem-
ber 2008 was $86.8 million.
Operations. he technical assistance (A) grants financed
by apan pecial und continued to support AB opera-
tions aimed at reducing poverty. n 2008, 57 A projects
totaling $55.0 million were approved, and 69 A projects
totaling $59.6 million became effective. he undisbursedA commitments increased to $95.8 million as of 31 e-
cember 2008 ($82.9 million as of 31 ecember 2007).
Sector Activities. n 2008, the apan pecial und ()
financed 20% of the total amount of technical assis-
tance (A) that AB approved, including 47% of the
total amount of project preparatory A during the year.
able 21 illustrates the breakdown of approvals by
sector.
Investment position. As of 31 ecember 2008, total apan
pecial und investment portfolio amounted to $198.9million, lower than the balance of $215.1 million as of 31
ecember 2007. ith this, and with lower yield on
dollar placements, revenue from investments decreased,
from $11.8 million in 2007 to $6.5 million in 2008.
ADB Institute Special Fund
he AB nstitute was established in 1996 as a subsid-
iary body of AB, whose objectives are the identification
of effective development strategies and capacity improve-
ments for sound development management in developingmember countries.
he costs for operating the AB nstitute are met
from the AB nstitute pecial und which is adminis-
tered by AB in accordance with the tatute of AB n-
stitute. n 2008, apan committed its 13th contribution
in the amount of ¥0.70 billion ($7.8 million equivalent),
which was reported as ue from Contributors.
As of 31 ecember 2008, cumulative contributions
committed amounted to ¥16.5 billion (about $141.2 mil-
lion equivalent) excluding translation adjustments. f
the total contributions received, $125.5 million had beenused by the end of the year mainly for research and ca-
pacity-building activities including organizing symposia,
forums, and trainings; preparing research reports, publi-
cations, and websites; and for associated administrative
expenses. he balance of net current assets (excluding
property, furniture, and equipment) available for future
projects and programs was about $15.6 million.
Table 21: Japan Special FundTechnical Assistance by Sector, 2008
$ Milliona %
Agriculture and Natural Resources 13.5 25Transport and Communications 10.1 18Multisector 9.1 17Education 4.5 8Law, Economic Management and Public Policy 4.4 8
Energy 4.4 8Industry and Trade 3.8 7Finance 2.9 5Water Supply, Sanitation and Waste Management 1.9 3Health, Nutrition, and Social Protection 0.4 1
TOTAL 55.0 100
a Totals may not add due to rounding.

7/30/2019 ADB Annual Report 2008 - Financial Report
http://slidepdf.com/reader/full/adb-annual-report-2008-financial-report 31/218
29 Annual Report 2008
Asian Tsunami Fund
he Asian sunami und was established on 11 ebru-
ary 2005 in response to the special circumstances sur-
rounding the developing member countries that were
stricken by the effects of the tsunami on 26 ecember
2004.
Contributed Resources. AB contributed $600 million
to the fund, of which, $50 million unutilized funds
were transferred back to C ($40 million in Novem-
ber 2005 and $10 million in une 2006). n addition,
Australia contributed $3.8 million, and uxembourg,
$1.0 million. As of 31 ecember 2008, total resources
of the fund amounted to $625.9 million, $579.5 million
of which has been utilized, leaving an uncommitted bal-
ance of $46.4 million ($40.0 million as of 31 ecember2007).
Operations. here were no technical assistance or grants
that were approved or made effective during the year. he
balance of undisbursed commitments as of 31 ecember
2008 amounted to $248.3 million, compared with $389.1
million as of year-end of 2007.
Investment position. As of 31 ecember 2008, Asian suna-
mi und’s investment portfolio amounted to $251.3 mil-
lion ($366.5 million as of 31 ecember 2007). ith thelower portfolio, and lower yield on dollar placements,
revenue from investments decreased, from $22.3 million
in 2007 to $9.1 million in 2008.
Pakistan Earthquake Fund
he akistan arthquake und was established in No-
vember 2005 in response to the special needs of akistan
subsequent to the earthquake on 8 ctober 2005. he
dedicated fund is to deliver emergency grant financing for
investment projects and technical assistance to supportimmediate reconstruction, rehabilitation and associated
development activities.
Contributed Resources. AB contributed $80 million to
the fund. n addition, Australia contributed $15.0 mil-
lion; Belgium, $14.3 million; inland, $12.3 million; and
Norway, $20.0 million. As of 31 ecember 2008, total re-
sources of the fund amounted to $142.4 million, $140.2
million of which has been utilized, leaving an uncommit-
ted balance of $2.2 million (negative $3.5 million as of 31
ecember 2007).
he contributions of Belgium and Norway were in
the form of debt-for-development swap agreements. he
agreements involved the conversion of akistan’s loan
service payments to the two countries for their loans to
akistan of up to €9.9 million and $20.0 million, respec-
tively, into Belgium’s and Norway’s contributions to the
akistan arthquake und. Belgium’s contributions were
made in three equal installments of €3.3 million from 2007
to 2008, while Norway’s contributions were undertaken
in four equal installments of $5.0 million in 2006–2008.
Operations. here were no technical assistance or grants
that were approved or made effective during the year. hebalance of undisbursed commitments as of 31 ecember
2008 amounted to $66.2 million, compared with $73.2
million as of year-end of 2007.
Investment position. As of 31 ecember 2008, akistan
arthquake und’s investment portfolio amounted to
$61.3 million ($60.7 million as of 31 ecember 2007).
ith the increase in the average investment portfolio, rev-
enue from investments for 2008 increased to $3.1 million
from $2.4 million in 2007.
Regional Cooperation and IntegrationFund
he egional Cooperation and ntegration und was es-
tablished in ebruary 2007 in response to the increasing
demand for regional cooperation and integration activities
among AB’s member countries in Asia and the acific.
ts main objective is to improve regional cooperation and
integration (C) in Asia and the acific by facilitating the
pooling and provision of additional financial and knowl-
edge resources to support C activities.
Contributed Resources. AB contributed $40 million to the
fund as part of the 2006 C net income allocation. As of
31 ecember 2008, total resources of the fund amounted
to $42.5 million, $17.9 million of which has been utilized,
leaving an uncommitted balance of $24.6 million ($33.8
million as of 31 ecember 2007).

7/30/2019 ADB Annual Report 2008 - Financial Report
http://slidepdf.com/reader/full/adb-annual-report-2008-financial-report 32/218
M A N A G E
M E N T ’ S D I S C U S S I O N
A N D A
N A L Y S I S
Asian Development Bank30
Operations. n 2008, 13 technical assistance totaling $10.5
million became effective (four technical assistance and
one supplementary approval totaling $7.4 million in
2007). he balance of undisbursed commitments as of
31 ecember 2008 amounted to $16.6 million, compared
with $7.4 million as of year-end of 2007.
Investment position. As of 31 ecember 2008, egional
Cooperation and ntegration und’s investment port-
folio amounted to $39.3 million ($39.9 million as of 31
ecember 2007). ith the increase in average volume of
investments, which was offset by lower yield on dollar
placements, revenue from investments for 2008 was just
slightly higher than the revenue for 2007 ($1.24 million in
2008; $1.19 million in 2007).
Climate Change Fund
he Climate Change und was established in April 2008
to facilitate greater investments in MCs to address the
causes and consequences of climate change alongside
AB’s own assistance in various related sectors.
Contributed Resources. AB provided the initial contribu-
tion of $40.0 million in May 2008, as part of C’s 2007
net income allocation. ith accumulated investment in-
come of $0.5 million, total resources of the fund as of 31
ecember 2008 amounted to $40.5 million, $3.1 millionof which has been utilized, leaving an uncommitted bal-
ance of $37.4 million.
Operations. n 2008, one technical assistance amounting
to $3.0 million was approved and became effective. here
has been no disbursement yet for this technical assistance.
Investment position. As of 31 ecember 2008, Climate
Change und’s investment portfolio amounted to $38.9
million, providing $0.5 million revenue for the period.
GRANT COFINANCING
rust funds and project-specific grants are key instruments
to mobilize and channel grants from external sources to fi-
nance technical assistance and components of investment
projects. hey play an important role in complementing
AB’s own resources to meet capacity development and
other specific demands from MCs. Multilateral, bilateral,
and private sector partners have contributed more than $2.0
billion in grants to AB operations (able 22). n 2008, a
total of $154.2 million in grant cofinancing was mobilized
comprising $84.2 million for 76 technical assistance proj-
ects and $70.0 million for 17 investment projects. By year-
end, there were 29 trust funds under active administration
by AB which included 19 active single donor trust funds
to finance activities in various sectors or for specific themes,
and 10 multidonor trust funds to finance activities with a
thematic focus, including poverty reduction, governance,
gender and development, managing for development re-
sults, /A, water, energy, education, information
and communications technology, and trade and finance.
nitially, trust funds were established through donor-specific channel financing agreements, for a wide range
of sectors, focused primarily on financing technical assis-
tance operations. More recently, in response to the chang-
ing needs of developing member countries and consistent
with AB’s financing partnership strategy 9 and harmoniza-
tion efforts, AB has established some trust funds based
on common agreements with development partners and
financing through instruments of contribution. hese are
established under an umbrella facility of sector- and theme-
focused financing partnership, and finance technical assis-
tance and grant components of investment projects.
Technical Assistance and Grant Funds under Financing Part-
nership Facilities and Special Initiatives. AB has estab-
lished two multidonor and three single donor trust funds
under the financing partnership facilities framework, to
support both technical assistance and grant components
of investment projects in priority sectors consistent with
trategy 2020. ince 2006, about $100.0 million has been
mobilized from bilateral sources to finance activities in
the water sector, for clean energy, and for regional coop-
eration and integration. apan made its initial contributions of $23.1 million
to the Asian Clean nergy und and $11.5 million to the
nvestment Climate acilitation und, the two new ini-
tiatives that were established last year under the Clean
nergy inancing artnership acility and egional Co-
9 ADB. 2006. ADB’s Financing Partnership Strategy . Manila.
7/30/2019 ADB Annual Report 2008 - Financial Report
http://slidepdf.com/reader/full/adb-annual-report-2008-financial-report 33/218
31 Annual Report 2008
operation and ntegration acility. Austria and pain each
contributed $5 million to the Multidonor ater rust
und. pain and weden made their first contributions of
$5 million and $4.7 million respectively, to the Multido-
nor Clean nergy und. Australia expressed its intent to
make a total additional contribution of A$25 million each
to these multidonor funds by 2011.
nder AB’s Carbon Market nitiative, the uture
Carbon und was established in 2008 complementing the
existing Asia acific Carbon und. he fund will provide
financing up front for AB-supported projects that will
continue to generate carbon credits after 2012. he initial
target size of the fund is $100 million and may be increased
to $200 million if there is sufficient demand.
Japan Fund for Poverty Reduction
he apan und for overty eduction () was estab-
lished in May 2000 as a trust fund to support poverty re-
duction and social development activities that can add
substantial value to AB projects. ince 2000, apan has
contributed $360.4 million in total. o date, $300.3 million
for 116 projects has been approved, of which 13 projects val-
ued at $34.0 million were approved in 2008 (www.adb.org/
; tatistical Annex 27). A number of projects have been
completed this year and these are the subjects of knowledge-
sharing sessions organized by AB. n 2008, the publi-
cation series was launched which will focus on the impact and
outcomes, and lessons learned from projects.
Japan Scholarship Program
he apan cholarship rogram () was established in
1988 to provide an opportunity for well-qualified citizens
of developing member countries to undertake postgradu-
ate studies in economics, management, science and tech-
nology, and other development-related fields at selected
educational institutions in Asia and the acific. is
funded by apan and administered by AB. Currently, 20
institutions in 10 countries participate.Between 1988 and 2008, apan contributed $100.1
million. A total of 2,417 scholarships has been awarded
to recipients from 35 member countries. ecently, an av-
erage of about 150 scholarships have been awarded each
year. f the total, 2,053 have completed their courses.
omen have received 823 scholarships.

7/30/2019 ADB Annual Report 2008 - Financial Report
http://slidepdf.com/reader/full/adb-annual-report-2008-financial-report 34/218
M A N A G E
M E N T ’ S D I S C U S S I O N
A N D A
N A L Y S I S
Asian Development Bank32
Table 22: Schedule of Contributions and Net AssetsGrants from External SourcesAs of 31 December 2008($ Million)
Contribution Net Assetsa
Administered by ADB
Country
Australia 161.3 13.6Austria 6.0 3.3Belgium 29.2 27.1Brunei Darussalam 0.6 (0.0)Canada 124.1 51.6China, People’s Republic of 20.2 8.3Denmark 24.7 2.9European Community 250.0 93.9Finland 56.8 31.5France 33.4 4.1Ireland 2.2 0.5Italy 2.7 0.9Japanb 526.8 214.2Korea, Republic of 20.1 13.9Luxembourg 18.2 15.5The Netherlands 370.1 126.8New Zealand 31.6 0.6Norway 117.5 43.6
Portugal 15.0 15.1Spain 47.6 37.8Sweden 142.2 49.9Switzerland 40.0 28.0United Kingdom and Northern Ireland 491.9 139.8United States 1.8 0.4
Subtotal 2,534.0 923.3
Others
Cities Alliance 0.5 (0.0)Global Environment Fund 76.0 28.3Nordic Development Fund 11.0 (0.4)Private Sector/Foundations 3.0 0.1Public Private Infrastructure Advisory Facility 0.4 (0.0)Trust Fund for Forest (Viet Nam) 17.2 1.5United Nation Development Programme 111.2 0.3
Subtotal 219.3 29.8
Not Administered by ADBCountry
Switzerland 25.7 6.6Kuwait 15.0 1.0
Subtotal 40.7 7.6
Grand Total 2,794.1 960.7
Note: Figures may not add to total due to rounding.( ) Negative; 0.0 is less than $50,000.a Excludes projects approved but not yet effective.b Includes Japan Fund for Poverty Reduction, Japan Scholarship Program, Japan Fund for Information, Communication and Technology, and Japan Fund for Public Policy Training.
7/30/2019 ADB Annual Report 2008 - Financial Report
http://slidepdf.com/reader/full/adb-annual-report-2008-financial-report 35/218
33 Annual Report 2008
ORDINARY CAPITAL RESOURCES
Management's Report on Internal Control over Financial Reporting
he management of Asian evelopment Bank (“AB”) is responsible for establishing and
maintaining adequate internal control over financial reporting. AB's internal control overfinancial reporting is a process designed to provide reasonable assurance regarding the reliabil-
ity of financial reporting and the preparation of financial statements for external purposes in
accordance with generally accepted accounting principles in the nited tates of America.
AB's internal control over financial reporting includes those policies and procedures that
(i) pertain to the maintenance of records that, in reasonable detail, accurately and fairly re-
flect the transactions and dispositions of the assets of AB; (ii) provide reasonable assurance
that transactions are recorded as necessary to permit preparation of financial statements in
accordance with generally accepted accounting principles, and that receipts and expenditures
of AB are being made only in accordance with authorizations of management and directors
of AB; and (iii) provide reasonable assurance regarding prevention or timely detection of
unauthorized acquisition, use or disposition of AB's assets that could have a material effecton the financial statements.
Because of its inherent limitations, internal control over financial reporting may not prevent
or detect misstatements. Also, projections of any evaluation of effectiveness to future periods
are subject to the risk that controls may become inadequate because of changes in conditions,
or that the degree of compliance with the policies or procedures may deteriorate.
AB's management assessed the effectiveness of AB's internal control over financial report-
ing as of 31 ecember 2008. n making this assessment, AB's management used the criteria
set forth by the Committee of ponsoring rganizations of the readway Commission in
Internal Control – Integrated Framework. Based on that assessment, management believes that as
of 31 ecember 2008, AB's internal control over financial reporting is effective based uponthe criteria established in Internal Control – Integrated Framework.
aruhiko uroda
resident
Bindu N. ohani
ice resident (inance and Administration)
ong-ang ung
Controller
5 March 2009

7/30/2019 ADB Annual Report 2008 - Financial Report
http://slidepdf.com/reader/full/adb-annual-report-2008-financial-report 36/218
O R D I N A R Y C A P I T A L R E S O U R
C E S
Asian Development Bank34
Report of Independent Auditors to the Asian Development Bank
n our opinion, the accompanying balance sheets and the related statements of income and expenses,
cash flows, and changes in capital and reserves present fairly, in all material respects, the financial
position of the Asian evelopment Bank (“AB” or “the Bank”)—rdinary Capital esources at
31 ecember 2008 and 2007, and the results of its operations and its cash flows for the years then
ended, in conformity with accounting principles generally accepted in the nited tates of America.
Also in our opinion, management’s assertion that AB maintained effective internal control over
financial reporting as of 31 ecember 2008 is fairly stated, in all material respects, based on criteria
established in nternal Control—ntegrated ramework issued by the Committee of ponsoring
rganizations of the readway Commission (C). he management of AB is responsible for
these financial statements, for maintaining effective internal control over financial reporting and for
its assertion of the effectiveness of internal control over financial reporting, included in the accom-
panying Management’s eport on nternal Control over inancial eporting. ur responsibility is to
express opinions on these financial statements and on AB’s internal control over financial report-
ing based on our integrated audit in 2008 and financial statement audit in 2007. e conducted our
audits of the financial statements in accordance with auditing standards generally accepted in thenited tates of America and our audit of internal control over financial reporting in accordance
with attestation standards established by the American nstitute of Certified ublic Accountants.
hose standards require that we plan and perform the audits to obtain reasonable assurance about
whether the financial statements are free of material misstatement and whether effective internal
control over financial reporting was maintained in all material respects. ur audits of the financial
statements included examining, on a test basis, evidence supporting the amounts and disclosures
in the financial statements, assessing the accounting principles used and significant estimates made
by management, and evaluating the overall financial statement presentation. ur audit of internal
control over financial reporting included obtaining an understanding of internal control over financial
reporting, assessing the risk that a material weakness exists, and testing and evaluating the design
and operating effectiveness of internal control based on the assessed risk. ur audits also included
performing such other procedures as we considered necessary in the circumstances. e believe thatour audits provide a reasonable basis for our opinions.
PricewaterhouseCoopers LLP
pwc.com/sg
8 Cross Street #17-00
PWC Building
Singapore 048424
Telephone (65) 6236 3388
Facsimile (65) 6236 3300
GST No.: M90362193L
Reg. No.: T09LL0001D
PricewaterhouseCoopers LLP (Registration No. T09LL0001D) is an accounting limited liability partnership registered in Singapore under the Limited Liability Partner-ships Act (Chapter 163A). It was converted from a partnership (with the name “PricewaterhouseCoopers” and Registration no. 000640) to an accounting limitedliability partnership on 1 January 2009. PricewaterhouseCoopers LLP is part of the network of member firms of PricewaterhouseCoopers International Limited, eachof which is a separate and independent legal entity.

7/30/2019 ADB Annual Report 2008 - Financial Report
http://slidepdf.com/reader/full/adb-annual-report-2008-financial-report 37/218
35 Annual Report 2008
ur audits were conducted for the purpose of forming an opinion on the basic financial statements
taken as a whole. he accompanying summary statements of loans and of borrowings as at 31 e-
cember 2008 and 2007, and of statement of subscriptions to capital stock and voting power as at 31
ecember 2008 are presented for purposes of additional analyses and are not required parts of the
basic financial statements. uch information has been subjected to the auditing procedures applied in
the audits of the basic financial statements and in our opinion, is fairly stated in all material respects
in relation to the basic financial statements taken as a whole.
A company’s internal control over financial reporting is a process effected by those charged with
governance, management, and other personnel, designed to provide reasonable assurance regarding
the preparation of reliable financial statements in accordance with accounting principles generally
accepted in the nited tates of America. A company’s internal control over financial reporting in-
cludes those policies and procedures that (i) pertain to the maintenance of records that, in reasonable
detail, accurately and fairly reflect the transactions and dispositions of the assets of the company;
(ii) provide reasonable assurance that transactions are recorded as necessary to permit preparation of
financial statements in accordance with generally accepted accounting principles, and that receipts and
expenditures of the company are being made only in accordance with authorizations of management
and those charged with governance; and (iii) provide reasonable assurance regarding prevention, or
timely detection of unauthorized acquisition, use, or disposition of the company’s assets that could
have a material effect on the financial statements.
Because of its inherent limitations, internal control over financial reporting may not prevent or detect
misstatements. Also, projections of any evaluation of effectiveness to future periods are subject to
the risk that controls may become inadequate because of changes in conditions, or that the degreeof compliance with the policies or procedures may deteriorate.
ricewaterhouseCoopers
ublic Accountants and Certified ublic Accountants
ingapore
5 March 2009

7/30/2019 ADB Annual Report 2008 - Financial Report
http://slidepdf.com/reader/full/adb-annual-report-2008-financial-report 38/218
O R D I N A R Y C A P I T A L R E S O U R
C E S
Asian Development Bank36
ASIAN DEVELOPMENT BANK—ORDINARY CAPITAL RESOURCES
BALANCE SHEET
31 December 2008 and 2007
Expressed in Thousands of United States Dollars (Note B)
A S S E T S
2008 2007
DUE FROM BANKS (Notes B and C) $ 142,238 $ 108,821
INVESTMENTS (Notes B, C, D, L, and P)Government and government-guaranteed obligations $ 6,485,000 $ 2,343,130Time deposits 1,481,370 7,491,886Other securities 7,446,149 15,412,519 3,461,927 13,296,943
SECURITIES TRANSFERRED UNDER REPURCHASEAGREEMENT (Notes B and P) 309,358 5,041,387
SECURITIES PURCHASED UNDER RESALE
ARRANGEMENT (Notes B and P) 511,756 427,132
LOANS OUTSTANDING (OCR-5) (Notes A, B, E, and Q)(Including FAS 133 adjustment of $451– 2008 and$538 – 2007; net unamortized loan origination costsof $68,262 – 2008 and $42,130 – 2007)Sovereign 34,256,740 29,008,793Nonsovereign 1,662,494 1,289,129
35,919,234 30,297,922
Less—provision for loan losses 9,174 35,910,060 15,043 30,282,879
EQUITY INVESTMENTS (Notes A, B, G, and P) 641,427 808,157
ACCRUED REVENUEOn investments 131,880 143,785On loans 299,184 431,064 320,514 464,299
RECEIVABLE FROM MEMBERS (Note K)Nonnegotiable, noninterest-bearing demandobligations (Note C) 144,514 174,805
RECEIVABLE FROM SWAPS (Notes B, H, P, and Q)Borrowings 23,831,087 17,968,867Others 882,793 24,713,880 512,089 18,480,956
OTHER ASSETSProperty, furniture, and equipment (Notes B and I) 158,235 154,239Investment related receivables 229,390 138,149Unamortized issuance cost of borrowings 2,781 58,869Miscellaneous (Note N) 114,530 504,936 112,536 463,793
TOTAL $78,721,752 $69,549,172
The accompanying notes are an integral part of these financial statements (OCR-8).

7/30/2019 ADB Annual Report 2008 - Financial Report
http://slidepdf.com/reader/full/adb-annual-report-2008-financial-report 39/218
37 Annual Report 2008
OCR-1
LIABILITIES, CAPITAL, AND RESERVES
2008 2007
BORROWINGS (OCR-6) (Notes B, H, J, and P)At amortized cost $ 4,627,521 $28,615,661At fair value 31,012,976 $35,640,497 2,954,704 $31,570,365
ACCRUED INTEREST ON BORROWINGS 385,949 388,935
PAYABLE FOR SWAPS (Notes B, H, J, P, and Q)Borrowings $24,867,815 $16,936,964Others 1,198,781 26,066,596 583,320 17,520,284
PAYABLE UNDER SECURITIES REPURCHASE AGREEMENT
(Note B) 301,759 5,092,316
ACCOUNTS PAYABLE AND OTHER LIABILITIESInvestment related payables 275,066 230,114Undisbursed technical assistance commitments (Note M) 10,489 2,318Accrued pension and postretirement medical benefit
costs (Note O) 635,300 368,284Miscellaneous (Notes B, F, I, and N) 136,626 1,057,481 121,686 722,402
TOTAL LIABILITIES 63,452,282 55,294,302
CAPITAL AND RESERVES (OCR-4)Capital stock (OCR-7) (Notes B and K)Authorized and subscribed
(SDR35,463,110,000 – 2008 and 2007) 54,890,156 55,977,810Less—”callable” shares subscribed 51,029,546 52,040,702
“Paid-in” shares subscribed 3,860,610 3,937,108Less—subscription installments not due 9,848 19,664
Subscription installments matured 3,850,762 3,917,444Less—capital transferred to the
Asian Development Fund 73,691 75,151
3,777,071 3,842,293
Net notional amounts required to maintain value ofcurrency holdings (Notes B and K) (564,383) (661,197)
Ordinary reserve (Note L) 9,532,487 9,245,332Special reserve (Note L) 209,723 202,847Loan loss reserve (Note L) 195,062 182,100Surplus (Note L) 894,594 616,300Cumulative revaluation adjustments account (Note L) (23,336) (110,959)Cumulative effect of FAS 157/159 adoption (Note B) 227,500 –Net income after appropriation (OCR-2) (Note L) 1,119,473 760,174Accumulated other comprehensive income (OCR-4)
(Notes B and L) (98,721) 15,269,470 177,980 14,254,870
TOTAL $78,721,752 $69,549,172

7/30/2019 ADB Annual Report 2008 - Financial Report
http://slidepdf.com/reader/full/adb-annual-report-2008-financial-report 40/218
O R D I N A R Y C A P I T A L R E S O U R
C E S
Asian Development Bank38
OCR-2
ASIAN DEVELOPMENT BANK—ORDINARY CAPITAL RESOURCES
STATEMENT OF INCOME AND EXPENSES
For the Years Ended 31 December 2008 and 2007
Expressed in Thousands of United States Dollars (Note B)
2008 2007
REVENUE (Note M)From loans (Notes B and E)
Interest $1,316,105 $1,385,036Commitment charge 59,668 55,206Other (17,792) $1,357,981 2,096 $1,442,338
From investments (Notes B and D) Interest 677,175 683,212
From guarantees (Notes B and F) 6,876 5,049
From equity investments 3,737 58,897
From other sources—net (Notes E and R) 18,685 18,835
TOTAL REVENUE $2,064,454 $2,208,331
EXPENSES (Note M)Borrowings and related expenses (Note J) 1,208,391 1,389,778Administrative expenses (Note M) 141,047 127,327Technical assistance to member countries 8,357 (683)Provision for losses (Notes B and E) (3,467) (579)Other expenses 6,272 3,998
TOTAL EXPENSES 1,360,600 1,519,841
NET REALIZED GAINS (LOSSES)From loans 525 3,980From investments (Notes D and M) (24,837) (2,801)From equity investments (Note M) (3,884) 21,793From borrowings 70 (106)Others 30 39
NET REALIZED (LOSSES) GAINS (28,096) 22,905
NET UNREALIZED GAINS (Note M) 450,591 53,828
NET INCOME $1,126,349 $ 765,223
The accompanying notes are an integral part of these financial statements (OCR-8).

7/30/2019 ADB Annual Report 2008 - Financial Report
http://slidepdf.com/reader/full/adb-annual-report-2008-financial-report 41/218
39 Annual Report 2008
OCR-3
ASIAN DEVELOPMENT BANK—ORDINARY CAPITAL RESOURCES
STATEMENT OF CASH FLOWS
For the Years Ended 31 December 2008 and 2007
Expressed in Thousands of United States Dollars (Note B)
2008 2007 CASH FLOWS FROM OPERATING ACTIVITIES
Interest and other charges on loans received $ 1,230,411 $ 1,202,933Interest on investments received 633,155 635,459Interest received for securities purchased under resale arrangement 5,634 17,080Interest and other financial expenses paid (913,351) (1,236,490)Administrative expenses paid (118,517) (95,784)Technical assistance disbursed (136) (1,477)Others—net 49,153 13,452
Net Cash Provided by Operating Activities 886,349 535,173
CASH FLOWS FROM INVESTING ACTIVITIESSales of investments 7,979,848 8,205,482Maturities of investments 152,126,260 176,587,583
Purchases of investments (162,198,163) (184,797,477)Net receipts (payments) on future contracts 1,082 (372)Net (payments for) receipts from securities purchased under resale arrangement (61,122) 1,990Principal collected on loans 1,919,052 1,454,419Loans disbursed (6,340,161) (5,074,927)Net currency and interest rate swaps 2,097 (8,329)Property, furniture, and equipment acquired (20,302) (9,569)Purchases of equity investments (125,697) (115,603)Sales of equity investments 53,550 112,107
Net Cash Used in Investing Activities (6,663,556) (3,644,696)
CASH FLOWS FROM FINANCING ACTIVITIESNet proceeds of new borrowings 11,803,386 11,874,946Borrowings redeemed (6,301,308) (9,137,838)Matured capital subscriptions collected1 4,618 4,618Borrowing issuance expenses paid (13,030) (30,506)Demand obligations of members encashed 9,255 8,068
Net currency and interest rate swaps 408,500 368,067Resources transferred to ADF (40,000) (40,000)Resources transferred to TASF (23,000) –Resources transferred to CCF (40,000) –Resources transferred to RCIF – (40,000)
Net Cash Provided by Financing Activities 5,808,421 3,007,355
Effect of Exchange Rate Changes on Due from Banks 2,203 5,571
Net Increase (Decrease) in Due from Banks 33,417 (96,597)
Due from Banks at Beginning of Year 108,821 205,418
Due from Banks at End of Year $ 142,238 $ 108,821
RECONCILIATION OF NET INCOME TO NET CASH PROVIDED BY OPERATING ACTIVITIES:Net Income (OCR-2) $ 1,126,349 $ 765,223Adjustments to reconcile net income to net cash provided by operating activities:
Depreciation and amortization 301,985 81,127Provision for losses written back—net (3,467) (579)Net realized losses (gains) from investments and other borrowings 19,963 (18,886)Proportionate share in losses (earnings) on equity investments 12,160 (47,827)Net unrealized gains (450,591) (53,828)Change in accrued revenue from loans, investments, and other swaps (116,103) (252,022)Change in receivable from ADF - allocation of administrative expenses (2,973) (2,902)Change in accrued interest on borrowings and swaps, and other expenses 224,249 144,002Change in undisbursed technical assistance commitments 8,171 (2,409)Change in pension and postretirement benefit liability (259,835) (60,171)Others—net 26,441 (16,555)
Net Cash Provided by Operating Activities $ 886,349 $ 535,173
1 Supplementary disclosure of noncash financing activities:
Nonnegotiable, noninterest-bearing demand promissory notes amounting to $2,726 ($2,738 - 2007) were received from members.
The accompanying notes are an integral part of these financial statements (OCR-8).

7/30/2019 ADB Annual Report 2008 - Financial Report
http://slidepdf.com/reader/full/adb-annual-report-2008-financial-report 42/218
O R D I N A R Y C A P I T A L R E S O U R
C E S
Asian Development Bank40
ASIAN DEVELOPMENT BANK—ORDINARY CAPITAL RESOURCES
STATEMENT OF CHANGES IN CAPITAL AND RESERVES
For the Years Ended 31 December 2008 and 2007
Expressed in Thousands of United States Dollars (Notes B and K)
Cumulative Accumulated
Net Notional Revaluation Net Income Other
Capital Maintenance Ordinary Special Loan Loss Adjustments After Comprehensive
Stock of Value Reserve Reserve Reserve Surplus Account Appropriations Income Total
Balance-
1 January 2007 $3,652,800 $(672,899) $8,993,737 $197,799 $130,100 $330,117 $ 27,519 $565,886 $ (82,160) $13,142,899
Comprehensive incomefor the year 2007 (Note L) 765,223 260,140 1,025,363
Appropriation of guaranteefees to Special Reserve(Note L) 5,049 (5,049) –
Change in SDR value ofpaid-in shares subscribed 185,667 185,667
Change in subscription
installments not due (2,889) (2,889)Additional paid-in shares
subscribed during the year 10,242 10,242
Change in SDR value ofcapital transferred toAsian Development Fund (3,527) (3,527)
Change in notionalmaintenance of value(Note K) 11,702 11,702
Allocation of 2006 net incometo ordinary reserve, loan lossreserve and surplus and transfer
from cumulative revaluationaccount (Note L) 286,183 52,000 286,183 (138,479) (485,886) –
Allocation of 2006 net income
to ADF and RCIF (Note L) (80,000) (80,000)Charge to ordinary reserve for
change in SDR value of capitalstock (Note L) (34,587) (34,587)
Balance-
31 December 2007 $3,842,293 $(661,197) $9,245,332 $202,847 $182,100 $616,300 $(110,959) $760,174 $177,980 $14,254,870

7/30/2019 ADB Annual Report 2008 - Financial Report
http://slidepdf.com/reader/full/adb-annual-report-2008-financial-report 43/218
41 Annual Report 2008
Cumulative Accumulated
Net Notional Revaluation Net Income Other
Capital Maintenance Ordinary Special Loan Loss Adjustments After Comprehensive
Stock of Value Reserve Reserve Reserve Surplus Account Appropriations Income Total
Balance-31 December 2007 $ 3,842,293 $ (661,197) $ 9,245,332 $ 202,847 $ 182,100 $ 616,300 $(110,959) $ 760,174 $177,980 $ 14,254,870
Cumulative effect of FAS157/159 adoption 227,500 227,500
Comprehensive incomefor the year 2008 (Note L) 1,126,349 (276,701) 849,648
Appropriation of guarantee
fees to Special Reserve(Note L) 6,876 (6,876) –
Change in SDR value ofpaid-in shares subscribed (74,035) (74,035)
Change in subscriptioninstallments not due 7,353 7,353
Change in SDR value of
capital transferred toAsian Development Fund 1,460 1,460
Change in notional
maintenance of value(Note K) 96,814 96,814
Allocation of 2007 net income
to ordinary reserve, loan lossreserve and surplus and transferto cumulative revaluation
account (Note L) 278,294 12,962 278,294 87,623 (657,174) –Allocation of 2007 net income to
ADF, TASF and CCF (Note L) (103,000) (103,000)
Charge to ordinary reserve forchange in SDR value of capitalstock (Note L) 8,860 8,860
Balance-31 December 2008 $3,777,071 $(564,383) $9,532,487 $209,723 $195,062 $894,594 $(23,336) $1,346,973 $(98,721) $15,269,470
Note: Figures may not add to total due to rounding.
Accumulated Other Comprehensive Income (Note L)
For the Years Ended 31 December 2008 and 2007
Expressed in Thousands of United States Dollar (Note B)
Pension/
FAS 133 Accumulated Unrealized Postretirement Accumulated Other
Adjustments and Translation Investment Liability Adjustment- Comprehensive
Amortization Adjustments Holding Gains FAS 158 Income
2008 2007 2008 2007 2008 2007 2008 2007 2008 2007
Balance, 1 January $ (289) $ (1,154) $(113,385) $(200,039) $433,376 $200,584 $(141,722) $(81,551) $177,980 $(82,160)Amortization (669) 865 – – – – – – (669) 865Other comprehensive
income for the year – – (43,420) 86,654 27,223 232,792 (259,835) (60,171) (276,032) 259,275
Balance, 31 December $ (958) $ (289) $(156,805) $(113,385) $460,599 $433,376 $(401,557) $(141,722) $(98,721) $177,980
The accompanying notes are an integral part of these financial statements (OCR-8).
OCR-4

7/30/2019 ADB Annual Report 2008 - Financial Report
http://slidepdf.com/reader/full/adb-annual-report-2008-financial-report 44/218
O R D I N A R Y C A P I T A L R E S O U R
C E S
Asian Development Bank42
ASIAN DEVELOPMENT BANK—ORDINARY CAPITAL RESOURCES
SUMMARY STATEMENT OF LOANS
31 December 2008 and 2007
Expressed in Thousands of United States Dollars (Note B)
Undisbursed LoansLoans Balances of Not Yet Total Percent of
Borrowers/Guarantors Outstanding1 Effective Loans2 Effective Loans Total Loans
Afghanistan $ 72,745 $ 31,667 $ – $ 104,412 0.18Azerbaijan 55,328 235,552 215,400 506,280 0.90Bangladesh 517,884 822,182 82,000 1,422,066 2.52Bhutan – – 51,000 51,000 0.09Cambodia 7,000 – – 7,000 0.01China, People’s Rep. of 8,464,133 4,223,072 1,658,852 14,346,057 25.38Cook Islands – – 8,630 8,630 0.02Fiji Islands 94,832 24,565 – 119,397 0.21Georgia 25,000 – – 25,000 0.04India 6,453,809 4,289,109 1,563,480 12,306,398 21.77Indonesia 10,160,917 545,360 95,000 10,801,277 19.11Kazakhstan 216,529 25,128 390,000 631,657 1.12
Korea, Rep. of 108,847 – – 108,847 0.19Lao People’s Dem. Rep. 62,743 7,257 – 70,000 0.12Malaysia 212,368 – – 212,368 0.38Maldives 1,500 10,500 – 12,000 0.02Marshall Islands 3,142 – – 3,142 0.01Micronesia, Fed. States of 101 4,699 – 4,800 0.01Mongolia 12,500 2,000 – 14,500 0.03Myanmar – – – – –Nauru 1,214 – – 1,214 0.00Nepal 16,929 – – 16,929 0.03Pakistan 4,345,421 2,003,171 599,300 6,947,892 12.29Papua New Guinea 123,821 113,878 – 237,699 0.42Philippines 3,891,694 171,821 490,000 4,553,515 8.06Sri Lanka 319,722 566,342 7,500 893,564 1.58Thailand 51,145 – – 51,145 0.09Uzbekistan 440,428 301,006 85,000 826,434 1.46Viet Nam 173,220 425,787 1,552,200 2,151,207 3.84
35,832,972 13,803,096 6,798,362 56,434,430 99.88Regional 18,000 14,500 32,500 65,000 0.12
TOTAL – 31 December 2008 35,850,972 13,817,596 6,830,862 56,499,430 100.00Provision for loan losses (9,174) – – (9,174)Unamortized loan origination cost – net 68,262 – – 68,262
NET BALANCE – 31 December 2008 $35,910,060 $13,817,596 $6,830,862 $56,558,518
Made up of:Sovereign Loans $34,252,384 $13,099,342 $5,498,830 $52,850,556Nonsovereign Loans
Private Sector 1,573,676 718,254 1,032,032 3,323,962Public Sector 84,000 – 300,000 384,000
Net balance – 31 December 2008 $35,910,060 $13,817,596 $6,830,862 $56,558,518
TOTAL – 31 December 2007 $30,255,792 $12,971,665 $6,039,610 $49,267,067
Provision for loan losses (15,043) – – (15,043)Unamortized front-end fee 42,130 – – 42,130
NET BALANCE – 31 December 2007 $30,282,879 $12,971,665 $6,039,610 $49,294,154
Made up of:Sovereign Loans $29,003,104 $12,814,137 $5,061,815 $46,879,056Nonsovereign Loans
Private Sector 1,248,775 113,528 797,795 2,160,098Public Sector 31,000 44,000 180,000 255,000
Net balance – 31 December 2007 $30,282,879 $12,971,665 $6,039,610 $49,294,154
1 Amounts outstanding on the multicurrency fixed lending rate loans totaled $33,734 ($38,049 - 2007), on pool-based loans totaled $10,257,327
($10,861,527 - 2007) and on LIBOR-based loans and market-based loans totaled $25,559,911 ($19,356,215 - 2007). The average yield on loans was
3.84% (5% - 2007).
2 Of the undisbursed balances, ADB has made irrevocable commitments to disburse various amounts totaling $333,541 ($361,280 - 2007).

7/30/2019 ADB Annual Report 2008 - Financial Report
http://slidepdf.com/reader/full/adb-annual-report-2008-financial-report 45/218
43 Annual Report 2008
MATURITY OF EFFECTIVE LOANS
Twelve Months Five YearsEnding Ending
31 December Amount 31 December Amount
2009 $ 1,987,970 2018 14,245,1842010 2,370,739 2023 11,685,1932011 2,641,966 2028 7,521,7772012 2,935,736 2033 3,086,3662013 3,152,033 over 2033 41,604
Total $49,668,568
3
SUMMARY OF CURRENCIES RECEIVABLE ON LOANS OUTSTANDING
Currency 2008 2007 Currency 2008 2007
Chinese yuan $ 83,098 $ 23,001 Kazakhstan tenge 39,727 49,776Euro – 920 Pakistan rupee 131 –
Japanese yen 5,566,126 4,607,011 Philippine peso 81,011 42,856Indian rupee 190,354 143,024 Swiss franc 3,247 3,502Indonesian rupiah 10,762 – United States dollar 29,876,516 25,385,702
Total $35,850,972 $30,255,792
3 Includes undisbursed commitment relating to Revolving Credit Facility of Trade Financing Facilitation Program amounting to $14,500.
The accompanying notes are an integral part of these financial statements (OCR-8).
OCR-5

7/30/2019 ADB Annual Report 2008 - Financial Report
http://slidepdf.com/reader/full/adb-annual-report-2008-financial-report 46/218
O R D I N A R Y C A P I T A L R E S O U R
C E S
Asian Development Bank44
ASIAN DEVELOPMENT BANK—ORDINARY CAPITAL RESOURCES
SUMMARY STATEMENT OF BORROWINGS
31 December 2008 and 2007
Expressed in Thousands of United States Dollars (Note B)
Borrowings Swap Arrangements2
Principal Outstanding1 Payable (Receivable)3
2008 2007 2008 2007
Australian dollar $ 6,010,372 $ 5,729,446 $ (6,094,769) $(5,463,460)Canadian dollar 1,327,790 1,526,591 (1,496,399) (1,521,721)Chinese yuan 145,574 136,909 28,805 14,363
(31,718)Euro 42,851 47,117 (45,899) (45,819)Hong Kong dollar 365,694 345,983 (367,466) (353,274)Indian rupee 100,867 126,791 26,779 16,384
(27,398)Japanese yen 3,639,786 4,607,002 4,472,977 2,706,761
(3,285,653) (3,220,956)Kazakhstan tenge 39,727 49,776 – –Malaysian ringgit 472,027 421,941 (447,571) (421,221)Mexican peso 121,615 155,913 (123,482) (153,378)New Taiwan dollar 153,801 146,437 (154,063) (146,437)New Zealand dollar 402,099 463,271 (413,403) (464,535)Philippine peso 150,736 168,824 3,584 (130,271)
(121,092)Pound sterling 882,641 695,816 (767,883) (517,914)Singapore dollar 400,826 380,307 (404,681) (392,574)South African rand 2,469,917 1,850,334 (2,483,788) (1,742,132)Swiss franc 414,266 374,924Thai baht 327,484 349,708 (329,481) (356,683)Turkish lira 1,416,566 474,746 (1,334,657) (483,611)United States dollar 16,787,230 13,517,474 20,335,670 14,199,456
(5,901,684) (2,554,881)
Subtotal 35,671,869 31,569,310 $ 1,036,728 $(1,031,903)
Unamortized discounts/ premiums andtransition adjustments (31,372) 1,055ATAFAS 133 Adjustments
Total $35,640,497 $31,570,365
MATURITY STRUCTURE OF BORROWINGS OUTSTANDING5
Twelve Months Ending Five Years Ending31 December Amount 31 December Amount
2009 6,877,509 2018 8,233,8292010 6,723,106 2023 215,6012011 4,981,028 2028 2,237,1642012 3,262,047 2033 39,2472013 3,102,338 over 2034 –
Total $35,671,869
1 Reported at Fair Value upon adoption of FAS 157/159 effective 1 January 2008, except for unswapped borrowings which are reported at net of principal
amount and unamortized discount/premium of zero coupon bonds. The aggregate face amounts and discounted values of zero coupon and deep discount
borrowings (in United States dollar equivalents) are:Aggregate Face Amount Discounted Value
2008 2007 2008 2007
Australian dollar $1,188,688 $1,506,016 $1,040,308 $1,258,707Canadian dollar 657,516 814,913 554,656 660,746Philippine peso 52,615 60,643 44,914 47,538South African rand 386,809 161,672 305,381 125,014Swiss franc 461,212 434,223 320,561 286,703Turkish lira 712,080 255,334 552,518 217,699United States dollar 1,898,326 1,977,963 1,445,211 1,229,074
2 Include currency and interest rate swaps. At 31 December 2008, the remaining maturity of swap agreements ranged from less than one year to 35 years. Ap-proximately 81.57% of the swap receivables and 87.29% of the payables are due before 1 January 2014.
3 Adjusted by the cumulative effect of the adoption of FAS 133 effective 1 January 2001.

7/30/2019 ADB Annual Report 2008 - Financial Report
http://slidepdf.com/reader/full/adb-annual-report-2008-financial-report 47/218
45 Annual Report 2008
OCR-6
Net Currency Obligation3 Weighted Average
2008 2007 Cost (%) After Swaps4
$ (84,397) $ 265,986 (11.75)(168,609) 4,870 3.67142,661 151,272 4.43
(3,048) 1,298 0.63(1,772) (7,291) 0.18
100,248 143,175 7.39
4,827,110 4,092,807 1.18
39,727 49,776 6.6924,456 720 0.47(1,867) 2,535 0.05
(262) – 0.10(11,304) (1,264) (6.50)33,228 38,553 3.11
114,758 177,902 11.80(3,855) (12,267) 1.93
(13,871) 108,202 3.88414,266 374,924 5.33
(1,997) (6,975) 30.1781,909 (8,865) (0.06)
31,221,216 25,162,049 3.62
$ 36,708,597 $ 30,537,407 3.32
2.54(1.75)
4.11
INTEREST RATE SWAP ARRANGEMENTS
Average Rate (%)
Notional Receive Pay Amount Fixed Floating6 Maturing Through7
Receive Fixed Swaps: Australian dollar8 $ 55,350 2.64 0.66 2027-2032Chinese yuan 146,299 3.34 4.26 2015Euro9 110,699 4.40 3.62 2010Indian rupee 103,167 5.40 7.77 2014
Philippine peso 34,362 4.92 2010United States dollar 11,151,658 3.51 2.64 2009-2043United States dollar10 55,350 2.14 0.60 2016-2027
Receive Floating Swaps: Japanese yen 742,237 0.88 0.62 0.59 2009-2032United States dollar 1,000,000 1.91 2.82 2011
Total $13,399,122
4 Calculation is based on average carry book value of borrowings net of fair value of swaps. Thus, the weighted average cost may be negative if the related
swaps payable exposure is in a different currency and the fair value of swaps receivable exceeds the carry book value of borrowings.
5 Bonds with put and call options were considered maturing on the first put or call date.6 Represent average current floating rates, net of spread.7 Swaps with early termination date were considered maturing on the first termination date.8 Consists of dual currency swaps with interest receivable in Australian dollar and interest payable in Japanese yen.9 Consists of dual currency swap with interest receivable in Euro and interest payable in Japanese yen.10 Consists of dual currency swaps with interest receivable in United States dollar and interest payable in Japanese yen.
The accompanying notes are an integral part of these financial statements (OCR-8).

7/30/2019 ADB Annual Report 2008 - Financial Report
http://slidepdf.com/reader/full/adb-annual-report-2008-financial-report 48/218
O R D I N A R Y C A P I T A L R E S O U R
C E S
Asian Development Bank46
ASIAN DEVELOPMENT BANK—ORDINARY CAPITAL RESOURCES
STATEMENT OF SUBSCRIPTIONS TO CAPITAL STOCK AND VOTING POWER
31 December 2008
Expressed in Thousands of United States Dollars (Note B)
SUBSCRIBED CAPITAL VOTING POWER
Number of Percent Par Value Of Shares Number of PercentMEMBERS Shares of Total Total Callable Paid-in Votes of Total
REGIONAL Afghanistan 1,195 0.034 $ 18,496 $ 12,584 $ 5,913 14,427 0.325Armenia 10,557 0.298 163,402 151,918 11,485 23,789 0.537Australia 204,740 5.773 3,168,986 2,947,061 221,925 217,972 4.917Azerbaijan 15,736 0.444 243,563 226,429 17,134 28,968 0.653Bangladesh 36,128 1.019 559,193 520,033 39,160 49,360 1.114Bhutan 220 0.006 3,405 3,049 356 13,452 0.303Brunei Darussalam 12,462 0.351 192,888 179,329 13,559 25,694 0.580Cambodia 1,750 0.049 27,087 22,474 4,612 14,982 0.338China, People’s Rep. of 228,000 6.429 3,529,007 3,281,806 247,201 241,232 5.442Cook Islands 94 0.003 1,455 1,362 93 13,326 0.301Fiji Islands 2,406 0.068 37,240 34,625 2,616 15,638 0.353Georgia 12,081 0.341 186,991 173,850 13,141 25,313 0.571Hong Kong, China 19,270 0.543 298,263 277,368 20,895 32,502 0.733India 224,010 6.317 3,467,249 3,224,444 242,805 237,242 5.352Indonesia 192,700 5.434 2,982,630 2,773,768 208,861 205,932 4.646Japan 552,210 15.571 8,547,162 7,948,593 598,569 565,442 12.756Kazakhstan 28,536 0.805 441,683 410,742 30,941 41,768 0.942Kiribati 142 0.004 2,198 2,043 155 13,374 0.302Korea, Republic of 178,246 5.026 2,758,909 2,565,727 193,182 191,478 4.320Kyrgyz Republic 10,582 0.298 163,789 152,320 11,469 23,814 0.537Lao PDR 492 0.014 7,615 6,795 820 13,724 0.310Malaysia 96,350 2.717 1,491,315 1,386,869 104,446 109,582 2.472Maldives 142 0.004 2,198 2,043 155 13,374 0.302
Marshall Islands 94 0.003 1,455 1,362 93 13,326 0.301Micronesia, Fed. States of 142 0.004 2,198 2,043 155 13,374 0.302Mongolia 532 0.015 8,234 7,662 573 13,764 0.310Myanmar 19,270 0.543 298,263 277,368 20,895 32,502 0.733Nauru 142 0.004 2,198 2,043 155 13,374 0.302Nepal 5,202 0.147 80,517 74,868 5,650 18,434 0.416New Zealand 54,340 1.532 841,080 782,186 58,894 67,572 1.524Pakistan 77,080 2.174 1,193,052 1,109,501 83,551 90,312 2.037Palau 114 0.003 1,765 1,641 124 13,346 0.301Papua New Guinea 3,320 0.094 51,387 47,812 3,575 16,552 0.373Philippines 84,304 2.377 1,304,866 1,213,499 91,367 97,536 2.200Samoa 116 0.003 1,795 1,610 186 13,348 0.301Singapore 12,040 0.340 186,356 173,308 13,048 25,272 0.570Solomon Islands 236 0.007 3,653 3,405 248 13,468 0.304Sri Lanka 20,520 0.579 317,611 295,369 22,242 33,752 0.761
Taipei,China 38,540 1.087 596,526 554,766 41,760 51,772 1.168Tajikistan 10,134 0.286 156,855 145,819 11,036 23,366 0.527Thailand 48,174 1.358 745,642 693,419 52,223 61,406 1.385Timor-Leste 350 0.010 5,417 5,030 387 13,582 0.306Tonga 142 0.004 2,198 2,043 155 13,374 0.302Turkmenistan 8,958 0.253 138,653 128,902 9,751 22,190 0.501Tuvalu 50 0.001 774 712 62 13,282 0.300Uzbekistan 23,834 0.672 368,905 343,072 25,833 37,066 0.836Vanuatu 236 0.007 3,653 3,405 248 13,468 0.304Viet Nam 12,076 0.341 186,914 165,476 21,437 25,308 0.571
Total Regional (Forward) 2,247,995 63.390 34,794,691 32,341,552 2,453,140 2,883,131 65.040

7/30/2019 ADB Annual Report 2008 - Financial Report
http://slidepdf.com/reader/full/adb-annual-report-2008-financial-report 49/218
47 Annual Report 2008
SUBSCRIBED CAPITAL VOTING POWER
Number of Percent Par Value Of Shares Number of PercentMEMBERS Shares of Total Total Callable Paid-in Votes of Total
Total Regional (Forward) 2,247,995 63.390 34,794,691 32,341,552 2,453,140 2,883,131 65.040
NONREGIONAL Austria 12,040 0.340 186,356 173,308 13,048 25,272 0.570Belgium 12,040 0.340 186,356 173,308 13,048 25,272 0.570Canada 185,086 5.219 2,864,780 2,664,168 200,612 198,318 4.474Denmark 12,040 0.340 186,356 173,308 13,048 25,272 0.570Finland 12,040 0.340 186,356 173,308 13,048 25,272 0.570France 82,356 2.322 1,274,714 1,185,437 89,278 95,588 2.156Germany 153,068 4.316 2,369,202 2,203,277 165,925 166,300 3.752
Ireland 12,040 0.340 186,356 173,246 13,110 25,272 0.570Italy 63,950 1.803 989,824 920,498 69,326 77,182 1.741Luxembourg 12,040 0.340 186,356 173,246 13,110 25,272 0.570The Netherlands 36,294 1.023 561,762 522,432 39,330 49,526 1.117Norway 12,040 0.340 186,356 173,308 13,048 25,272 0.570Portugal 12,040 0.340 186,356 173,246 13,110 25,272 0.570Spain 12,040 0.340 186,356 173,308 13,048 25,272 0.570Sweden 12,040 0.340 186,356 173,308 13,048 25,272 0.570Switzerland 20,650 0.582 319,623 297,226 22,397 33,882 0.764Turkey 12,040 0.340 186,356 173,308 13,048 25,272 0.570United Kingdom 72,262 2.038 1,118,478 1,040,159 78,319 85,494 1.929United States 552,210 15.571 8,547,162 7,948,593 598,569 565,442 12.756
Total Nonregional 1,298,316 36.610 20,095,465 18,687,995 1,407,470 1,549,724 34.960
TOTAL 3,546,311 100.000 $54,890,156 $51,029,546 $3,860,610 4,432,855 100.000
Note: Figures may not add due to rounding.
The accompanying notes are an integral part of these financial statements (OCR-8).
OCR-7
7/30/2019 ADB Annual Report 2008 - Financial Report
http://slidepdf.com/reader/full/adb-annual-report-2008-financial-report 50/218
ASIAN DEVELOPMENT BANK —ORDINARY CAPITAL RESOURCES
NOTES TO FINANCIAL STATEMENTS
31 December 2008 and 2007
Asian Development Bank48
O R D I N A R Y C A P I T A L R E S O U R
C E S
NOTE A—NATURE OF OPERATIONS ANDLIMITATIONS ON LOANS, GUARANTEES AND EQUITY INVESTMENTS
Nature of Operations
he Asian evelopment Bank (AB), a multilateral de- velopment financial institution, was established in 1966with its headquarters in Manila, hilippines. AB and itsoperations are governed by the Agreement stablishingthe Asian evelopment Bank (the Charter). ts purposeis to foster economic development and co-operation in
the Asian and acific region and to contribute to theacceleration of the process of economic developmentof the developing member countries (MCs) in theregion, collectively and individually. ith the adoptionof its poverty reduction strategy at the end of 1999,
AB made reducing poverty in the region its main goal. AB provides financial and technical assistance (A) forprojects and programs, which will contribute to achievingthis purpose.
Mobilizing financial resources, includingcofinancing, is an integral part of AB's operationalactivities. n addition, AB, alone or jointly, administerson behalf of donors, including members, their agencies
and other development institutions, funds restricted forspecific uses, which include A grants as well as regionalprograms.
AB's ordinary operations comprise loans, equity investments, and guarantees. uring the years 2001 and2002, limited technical assistance to member countriesto support high priority A programs was included. ABfinances its ordinary operations through borrowings,paid-in capital, and reserves.
Limitations on Loans, Guarantees, andEquity Investments
Article 12, paragraph 1 of the Charter provides that thetotal amount outstanding of loans, equity investments,and guarantees made by AB shall not exceed the totalof AB's unimpaired subscribed capital, reserves, andsurplus, exclusive of the special reserve. n ecember2008, the Board of irectors approved the revised pol-icy on AB’s lending limitations, which limits the totalamount of disbursed loans, approved equity investments,and the maximum amount that could be demanded from
AB under its guarantee portfolio, to the total amount
of AB's unimpaired subscribed capital, reserves andsurplus. At 31 ecember 2008 and 2007, the total of suchloans, equity investments, and guarantees aggregatedapproximately 55.7% and 46.9%, respectively, of thetotal subscribed capital, reserves, and surplus as defined,based on this new policy.
Article 12, paragraph 3 of the Charter providesthat equity investments shall not exceed 10% of theunimpaired paid-in capital together with reservesand surplus, exclusive of the special reserve. At 31ecember 2008, such equity investments representedapproximately 6.1% (7.6% - 2007) of the paid-in capital,
reserves, and surplus, as defined.
NOTE B—SUMMARY OF SIGNIFICANT ACCOUNTING POLICIES
Functional Currencies and Reporting Currency
he currencies of members are all functional currenciesas these are the currencies of the primary economic envi-ronment in which AB generates and expends cash. hereporting currency is the nited tates dollar ().
Translation of Currencies
AB adopts the use of daily exchange rates for account-ing and financial reporting purposes. his allows transac-tions in currencies other than to be translated tothe reporting currency using exchange rates applicable atthe time of transactions. At the end of each accountingmonth, translations of assets, liabilities, capital, and re-serves denominated in non- are adjusted using theapplicable rates of exchange at the end of the reportingperiod. hese translation adjustments, other than thoserelating to the non-functional currencies (Note M) andto the maintenance of pecial rawing ight ()capital values (Notes and ), are charged or credited to
“Accumulated translation adjustments” and reported in“CAA AN ” as part of “Accumulatedother comprehensive income.”
Valuation of Capital Stock
he authorized capital stock of AB is defined in Article4, paragraph 1 of the Charter “in terms of nited tatesdollars of the weight and fineness in effect on 31 anuary 1966” (the 1966 dollar) and the value of each share is
7/30/2019 ADB Annual Report 2008 - Financial Report
http://slidepdf.com/reader/full/adb-annual-report-2008-financial-report 51/218
OCR-8
31 December 2007 and 200631 December 2007 and 2006
49 Annual Report 2008
CONTINUED
defined as 10,000 1966 dollars. he capital stock had his-torically been translated into the current nited tatesdollar (AB's unit of account) on the basis of its par valuein terms of gold. rom 1973 until 31 March 1978, the ratearrived at on this basis was $1.20635 per 1966 dollar. ince1 April 1978, at which time the econd Amendment tothe Articles of Agreement of the nternational Monetary und (M) came into effect, currencies no longer havepar values in terms of gold. ending AB's selection of the appropriate successor to the 1966 dollar, the capitalstock has been valued for purposes of these financialstatements in terms of the at the value in current
nited tates dollars as computed by the M, with eachshare valued at 10,000. As of 31 ecember 2008, the value of the in
terms of the current nited tates dollar was $1.54781($1.57848 – 2007) giving a value for each share of AB'scapital equivalent to $15,478.10 ($15,784.80 – 2007).owever, AB could decide to fix the value of each shareat $12,063.50 based on the 31 March 1978 par value of the nited tates dollar in terms of gold.
Derivative Financial Instruments
AB reports all derivative transactions in accordance
with tatement of inancial Accounting tandards(A) No. 133, “Accounting for erivative nstrumentsand edging Activities,” along with its amendments,collectively referred as A 133. A 133 requires thatderivative instruments be recorded in the Balance heetas either assets or liabilities measured at fair value. heinitial application of A 133 in anuary 2001 gave rise toa transition loss of $81,657,000 in other comprehensiveincome and a gain of $34,656,000 was reported in netincome. he amount recorded in other comprehensiveincome as transition loss is being reclassified into earn-ings in the same period or periods in which the underlyingtransactions affect earnings.
n applying A 133 for purposes of financialstatement reporting, AB has elected not to define any qualifying hedging relationships. ather, all derivativeinstruments, as defined by A 133, have been markedto fair value, and all changes in fair value have beenrecognized in net income. AB has elected not todefine any qualifying hedging relationships, not becauseeconomic hedges do not exist, but rather because theapplication of A 133 hedging criteria does not makefully evident AB’s risk management strategies.
n ebruary 2006, the inancial Accountingtandards Board issued A 155, “Accounting for Certainybrid inancial nstruments, an amendment of ABtatements No. 133 and 140.” AB decided to early adoptthe provisions which allow hybrid financial instrumentsthat contain embedded derivatives requiring bifurcationunder A 133 to be measured at fair value, effective 1
anuary 2006. ith this, A 133 as presented in AB’sfinancial statements incorporates the provisions of A155.
AB issues hybrid instruments, i.e. structureddebts, to lower its cost of borrowings, which are generally
fully hedged through derivative transactions. ABmeasures and reports any of its qualified bifurcablestructured debts and their corresponding derivatives atfair value with changes in fair value recognized in netincome. his consistent accounting treatment wouldfully capture the economic hedging relationship betweenthe hybrid instruments and their derivatives.
Investments
All investment securities and negotiable certificate of deposits held by AB other than derivative instrumentsare considered by Management to be “Available for
ale” and are reported at estimated fair value, whichrepresents their fair market value. ime deposits arereported at cost, which is a reasonable estimate of fair value. nrealized gains and losses are reported in“CAA AN ” as part of “Accumulatedother comprehensive income.” ealized gains andlosses are included in income from investments and aremeasured by the difference between amortized costand the net proceeds of sales. ith respect to exchangetraded futures, realized gains or losses are reported basedon daily settlement of the net cash margin.
nterest income on investment securities and timedeposits is recognized as earned and reported, net of
amortizations of premiums and discounts.nrealized losses on investment securities are
assessed to determine whether the impairment isdeemed to be other than temporary. f the impairmentis deemed to be other than temporary, the investment iswritten down to the impaired value, which becomes thenew cost basis of the investments. mpairment losses arenot reversed for subsequent recoveries in the value of the investments, until it is sold.

7/30/2019 ADB Annual Report 2008 - Financial Report
http://slidepdf.com/reader/full/adb-annual-report-2008-financial-report 52/218
ASIAN DEVELOPMENT BANK —ORDINARY CAPITAL RESOURCES
NOTES TO FINANCIAL STATEMENTS
31 December 2008 and 2007
Asian Development Bank50
O R D I N A R Y C A P I T A L R E S O U R
C E S
Securities Transferred Under Repurchase Agreementand Securities Purchased Under Resale Arrangement
AB accounts for transfers of financial assets in ac-cordance with A 140, “Accounting for ransfers andervicing of inancial Assets and xtinguishmentsof iabilities - a replacement of A 125.” n general,transfers are accounted for as sales when control overthe transferred assets has been relinquished. therwisethe transfers are accounted for as repurchase/resaleagreements and collateralized financing arrangements.nder repurchase agreements, securities transferred are
recorded as assets and reported at estimated fair valueand cash collateral received are recorded as liabilities. AB monitors the fair value of the securities transferredunder repurchase agreements and the collateral. nderresale arrangements, securities purchased are recordedas assets, while securities received are not recorded asliabilities and are not re-pledged. All outstanding securi-ties as of 31 ecember 2008 and 2007 classified undersecurities transferred under repurchase agreement cor-rectly reflect the nature of the transactions.
Loans
AB's loans are made to or guaranteed by members, withthe exception of nonsovereign loans, and have maturitiesranging between 3 and 32 years. AB requires its borrow-ers to absorb exchange risks attributable to fluctuationsin the value of the currencies which it has disbursed.oan interest income and loan commitment fees arerecognized on accrual basis. n line with AB's principleof cost pass through pricing, any variation in the actualcost of borrowings is passed to B-based borrowersas surcharge or rebate.
t is the policy of AB to place loans in non-accrualstatus for which principal, interest, or other chargesare overdue by six months. nterest and other charges
on non-accruing loans are included in income only tothe extent that payments have been received by AB.
AB maintains a position of not taking part in debtrescheduling agreements with respect to sovereign loans.n the case of nonsovereign loans, AB may agree to debtrescheduling only after alternative courses of action havebeen exhausted.
AB determines that a loan is impaired andtherefore subject to provisioning when principal orinterest is in arrears for one year for sovereign loans
(unless there is clear and convincing evidence warrantingthe deferment or acceleration of such provisioning) andsix months for nonsovereign loans. f the present valueof expected future cash flows discounted at the loan’seffective interest rate is less than the carrying valueof the loan, a valuation allowance is established with acorresponding charge to provision for loan losses.
AB’s periodic evaluation of the adequacy of theprovision for loan losses is based on its past loan lossexperience, known and inherent risks in existing loans,and adverse situations that may affect a borrower’s ability to repay.
n ecember 2006, the Board approved theapplication of the concept of expected loss fornonsovereign credit exposure to establish loss provisionand loss reserve, the same concept that was applied tosovereign operations in 2004. n line with accountingprinciples generally accepted in the nited tates of
America, the amount of expected loss pertaining tocredit exposures that are impaired and rated substandardor worse is charged to the income statement, followingthe discounted cash flow method described above, whilethose that are better are recorded as loss reserve in theequity section of the balance sheet. Any adjustmentto loan loss reserve following this new methodology is
subject to the approval of the Board of overnors.ffective 2000, AB levies front-end fees on all new
sovereign loans. hese fees are deferred and amortizedover the life of the loans after offsetting deferred directloan origination costs. n 2004, AB waived the entirefront-end fee on all new sovereign loans approved duringthe year. ubsequently, the policy was extended tocover the period up to une 2009. n ecember 2007,the Board approved the elimination of front-end fees onsovereign B-based loans negotiated on and after 1ctober 2007.
AB levies a commitment charge on theundisbursed balance of effective loans. nless otherwise
provided by the loan agreement, the charges take effectcommencing on the 60th day after the loan signing dateand are credited to loan income.
Guarantees
AB extends guarantees to sovereign and nonsovereignborrowers. uarantees are regarded as outstanding whenthe underlying financial obligation of the borrower isincurred. AB would be required to perform under its

7/30/2019 ADB Annual Report 2008 - Financial Report
http://slidepdf.com/reader/full/adb-annual-report-2008-financial-report 53/218
OCR-8
31 December 2007 and 200631 December 2007 and 2006
51 Annual Report 2008
CONTINUED
guarantees if the payments guaranteed were not madeby the debtor, and the guaranteed party called the guar-antee by demanding payments from AB in accordancewith the term of the guarantee.
rior to 1 anuary 2003, guarantees in the absenceof any call, were not reflected in the financial statementsbut disclosed as a note to the financial statements (Note
F) in accordance with the provisions of AB No. 5, Accounting for Contingencies. AB nterpretation No.45 (N 45), “uarantor’s Accounting and isclosureequirements for uarantees, ncluding ndirectuarantees of ndebtedness to thers,” which came
into effect in 2003, requires the recognition of two typesof liabilities that are associated with guarantees: (a)the stand-by ready obligation to perform, and (b) thecontingent liability. AB recognizes at the inceptionof a guarantee, a liability for the stand-by ready obligation to perform on guarantees issued and modifiedafter 31 ecember 2002. he liability is included in“Miscellaneous liabilities.”
ront-end fee income on guarantees received isdeferred and amortized over the term of the guaranteecontract and the unamortized balance of deferred front-end fee of guarantee is included in “Miscellaneousliabilities.”
Equity Investments
All equity investments are considered as “Available forale” and are reported at estimated fair value.
nvestments in equity securities with readily determinable market price are reported at fair value,with unrealized gains and losses reported in “CAA
AN ” as part of “Accumulated othercomprehensive income.”
nvestments in equity securities without readily determinable fair values are reported at cost or atimpaired value, for investments where the impairment
is deemed other than temporary. hese investmentsare assessed each quarter to reflect the amount thatcan be realized using valuation techniques appropriateto the market and industry of each investment. henimpairment is identified and is deemed to be other thantemporary, the equity investment is written down to theimpaired value, which becomes the new cost basis of theequity investments. mpairment losses are not reversedfor subsequent recoveries in the value of the equity investments, until it is sold.
AB applies the equity method of accounting toinvestments in limited liability partnerships (s) andcertain limited liability companies (Cs) that maintaina specific ownership account for each investor.
Variable Interest Entities
AB complies with N 46, “Consolidation of ariablenterest ntities – an interpretation of AB No. 51,Consolidated inancial tatements.” N 46 requires anentity to consolidate and provide disclosures for any for which it is the primary beneficiary. An entity that will
absorb a majority of ’s expected losses or receive amajority of expected residual return is deemed to be theprimary beneficiary of the . ariable interests can arisefrom equity investments, loans, and guarantees. AB isrequired to disclose information about its involvement in
where AB holds significant variable interest (Note).
Property, Furniture, and Equipment
roperty, furniture, and equipment are stated at costand, except for land, depreciated over estimated usefullives on a straight-line basis. Maintenance, repairs, and
minor betterments are charged to expense.
Borrowings
Borrowings are generally reported on the balance sheet attheir carrying book value, adjusted for any unamortizeddiscounts or premium. As part of its borrowing strat-egy, AB issues various types of contractual obligations,which include structured debts containing embeddedderivatives in order to minimize the cost of borrowings.
AB simultaneously enters into currency and/or interestrate swaps to fully hedge the debt.
pon the adoption of A 155 on 1 anuary 2006,
AB no longer bifurcates and fair values the embeddedderivatives (the debt was valued at its carrying book
value) in the structured debt portfolio that meet thebifurcation criteria under A 133. nstead, ABmeasures and reports at fair value any structured debtthat contains embedded derivatives that would otherwisebe bifurcated under A 133 as a whole, with changes infair value reported in net income.
ffective 1 anuary 2008, AB adopted theprovisions of A 159 for non-hybrid borrowings that are

7/30/2019 ADB Annual Report 2008 - Financial Report
http://slidepdf.com/reader/full/adb-annual-report-2008-financial-report 54/218
ASIAN DEVELOPMENT BANK —ORDINARY CAPITAL RESOURCES
NOTES TO FINANCIAL STATEMENTS
31 December 2008 and 2007
Asian Development Bank52
O R D I N A R Y C A P I T A L R E S O U R
C E S
swapped. urther information relating to the adoption of A 159 and the reasons for electing A 159 for thesefinancial instruments are discussed in detail in Note .Borrowing valuations are further adjusted for the creditspread by currency.
Accounting Estimates
he preparation of the financial statements in con-formity with generally accepted accounting principlesrequires Management to make reasonable estimates andassumptions that affect the reported amounts of assets
and liabilities and disclosure of contingent liabilities atthe end of the year and the reported amounts of revenuesand expenses during the year. he actual results coulddiffer from those estimates.
Accounting and Reporting Developments
ffective 1 anuary 2008, AB adopted A 157 and A159. A 157 defines fair value () which focuses on theprice that would be received to sell the asset or paid totransfer the liability (exit price) and establishes a frame-work for measuring through a hierarchy that ranksthe quality and reliability of the data used in measure-
ments. A 159 expands the scope of financial instrumentsthat may be carried at . t offers an irrevocable option tocarry the majority of financial assets and liabilities at ,on an instrument-by-instrument basis, with changes in recognized in earnings. air alue ption may be electedat the time an entity recognizes an eligible financial assetor liability. A 159 also allows a one time election forexisting financial assets and liabilities, on an instrument-by-instrument basis, at the initial adoption date. headoption of A 157 and 159 was applied prospectively and the cumulative effect of changes in valuation of thefinancial assets and liabilities for which the air alueption have been elected were reported as an adjustment
to the 1 anuary 2008 balance of reserves.n March 2008, the inancial Accounting tandards
Board (AB) issued tatement No. 161 “isclosuresabout erivative nstruments and edging Activities– an amendment of AB tatement No. 133,” whichwill be applicable for fiscal years beginning after 15November 2008 and interim periods within thosefiscal years. his statement amends and expands thedisclosure requirements of A 133 to provide userswith better understanding of (i) how and why an entity
uses derivatives; (ii) how derivative instruments andrelated hedged items are accounted for under A 133and its related interpretations; and (iii) how derivativeinstruments and hedged items affect an entity’s financialposition, performance, and cash flows. AB is currently assessing the impact of this standard on its financialstatements.
n ecember 2008, the AB issued AB taff osition () A 132()-1, which amends 132()to require more detailed disclosures about employers'plan assets, including employers' investment strategies,major categories of plan assets, concentration of risk
within plan assets, and valuation techniques used tomeasure the fair value of plan assets. his aims toaddress financial statement users' concerns “about thelack of transparency surrounding the types of assets andassociated risks in an employer's defined benefit pensionor other postretirement plan and events in the economy and markets that could have a significant effect on the
value of the plan assets.” An entity must provide the's disclosures in financial statements for fiscal yearsending after 15 ecember 2009.
Statement of Cash Flows
or the purposes of the tatement of Cash lows, ABconsiders that its cash and cash equivalents are limitedto “ M BAN.”
Reclassification
Certain non-material reclassifications of prior year’samounts and information have been made to conform tothe current year’s presentation.
NOTE C—RESTRICTIONS ON USE OF CURRENCIES AND DEMAND OBLIGATIONS OFMEMBERS
n accordance with Article 24, paragraph 2(i) of the Charter,the use by AB or by any recipient from AB of certaincurrencies may be restricted by members to payments forgoods or services produced and intended for use in theirterritories. ith respect to the currencies of 42 MCsfor 2008 (44 - 2007), cash in banks (due from banks) anddemand obligations totaling $70,095,000 ($65,915,000– 2007) and $144,515,000 ($174,805,000 – 2007), respec-tively, may be, but are not currently so restricted.

7/30/2019 ADB Annual Report 2008 - Financial Report
http://slidepdf.com/reader/full/adb-annual-report-2008-financial-report 55/218
OCR-8
31 December 2007 and 200631 December 2007 and 2006
53 Annual Report 2008
CONTINUED
n accordance with Article 24, paragraphs 2(i)and (ii) of the Charter, one member (one - 2007) hasrestricted the use by AB or by any recipient from ABof its currency to payments for goods or services producedin its territory. As such, cash in banks (due from banks)and investments totaling $20,000 ($20,000 - 2007) and$3,182,000 ($3,082,000 - 2007), respectively, have beenrestricted. None of the demand obligations held by ABin 2008 and in 2007 was restricted.
NOTE D—INVESTMENTS
he main investment management objective is to main-tain security and liquidity. ubject to these parameters, AB seeks the highest possible return on its investments.nvestments are governed by the nvestment Authority approved by the Board of irectors in 1999, and reviewedin 2006. he review endorsed a portfolio strategy that islargely consistent with the 1999 approach.
AB may purchase and sell exchange traded financialfutures and option contracts, and enter into currency and interest rate swaps, and forward rate agreements.xposure to interest rate risk may be adjusted withindefined bands to reflect changing market conditions.hese adjustments are made through the purchase and
sale of securities, and financial futures. Accordingly,financial futures are held for risk management purposes.
At 31 ecember 2008, the notional amount of outstandingpurchase and sales futures contracts were $6,300,000 and$7,000,000, respectively, ($99,300,000 and $54,200,000,respectively – 2007).
ncluded in “ther securities” as of 31 ecember2008 were corporate bonds and other obligations of banksamounting to $6,688,083,000 ($2,622,373,000 – 2007)and asset/mortgage-backed securities of $758,066,000($838,716,000 – 2007).
he currency compositions of the investmentportfolio as of 31 ecember 2008 and 2007 expressed in
nited tates dollars are as follows:
Currency 2008 2007
Australian dollar $ 412,599,000 $ 462,654,000Canadian dollar 261,180,000 306,592,000Euro 898,121,000 854,590,000Japanese yen 1,277,485,000 928,670,000Pound sterling 208,158,000 288,721,000Swiss franc 463,590,000 457,381,000United States dollar 11,407,590,000 9,480,057,000Others 483,796,000 518,278,000
Total $15,412,519,000 $13,296,943,000
he estimated fair value and amortized cost of theinvestments by contractual maturity at 31 ecember2008 are as follows:
Estimated AmortizedFair Value Cost
Due in one year or less $ 6,119,336,000 $ 6,100,549,000Due after one year
through five years 6,802,245,000 6,595,104,000Due after five years
through ten years 2,490,938,000 2,393,526,000
Total $15,412,519,000 $15,089,179,000
Additional information relating to investments ingovernment and government-guaranteed obligationsand other securities are as follows:
2008 2007 As of 31 December:Amortized cost $13,607,809,000 $5,770,063,000Estimated fair value 13,931,149,000 5,805,057,000Gross unrealized gains 364,824,000 60,811,000Gross unrealized losses (41,484,000) (25,817,000)
For the years ended31 December: Change in net
unrealized gainsfrom prior year 288,346,000 76,994,000
Proceeds from sales 7,979,848,000 8,205,482,000Gross gain on sales 53,508,000 13,466,000Gross loss on sales (81,408,000) (19,411,000)
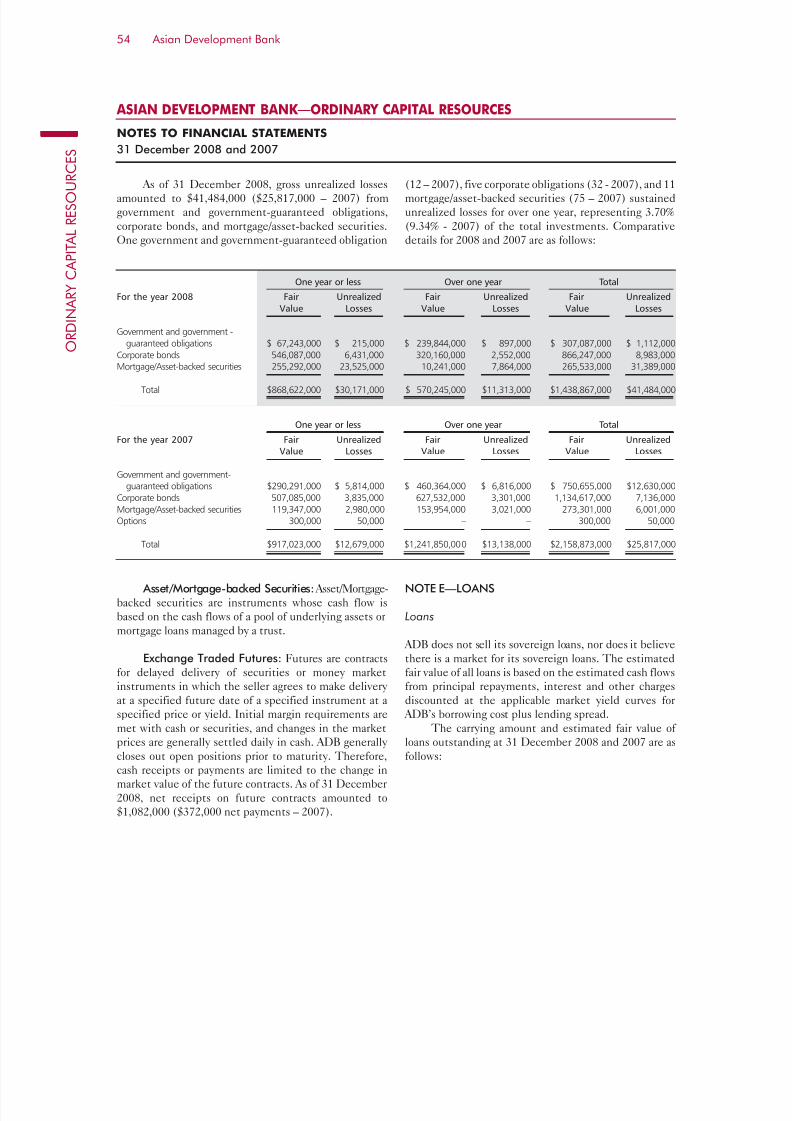
7/30/2019 ADB Annual Report 2008 - Financial Report
http://slidepdf.com/reader/full/adb-annual-report-2008-financial-report 56/218
ASIAN DEVELOPMENT BANK —ORDINARY CAPITAL RESOURCES
NOTES TO FINANCIAL STATEMENTS
31 December 2008 and 2007
Asian Development Bank54
O R D I N A R Y C A P I T A L R E S O U R
C E S
As of 31 ecember 2008, gross unrealized lossesamounted to $41,484,000 ($25,817,000 – 2007) fromgovernment and government-guaranteed obligations,corporate bonds, and mortgage/asset-backed securities.ne government and government-guaranteed obligation
(12 – 2007), five corporate obligations (32 - 2007), and 11mortgage/asset-backed securities (75 – 2007) sustainedunrealized losses for over one year, representing 3.70%(9.34% - 2007) of the total investments. Comparativedetails for 2008 and 2007 are as follows:
One year or less Over one year Total
For the year 2008 Fair Unrealized Fair Unrealized Fair UnrealizedValue Losses Value Losses Value Losses
Government and government -guaranteed obligations $ 67,243,000 $ 215,000 $ 239,844,000 $ 897,000 $ 307,087,000 $ 1,112,000
Corporate bonds 546,087,000 6,431,000 320,160,000 2,552,000 866,247,000 8,983,000Mortgage/Asset-backed securities 255,292,000 23,525,000 10,241,000 7,864,000 265,533,000 31,389,000
Total $868,622,000 $30,171,000 $ 570,245,000 $11,313,000 $1,438,867,000 $41,484,000
One year or less Over one year Total
For the year 2007 Fair Unrealized Fair Unrealized Fair UnrealizedValue Losses Value Losses Value Losses
Government and government-guaranteed obligations $290,291,000 $ 5,814,000 $ 460,364,000 $ 6,816,000 $ 750,655,000 $12,630,000
Corporate bonds 507,085,000 3,835,000 627,532,000 3,301,000 1,134,617,000 7,136,000Mortgage/Asset-backed securities 119,347,000 2,980,000 153,954,000 3,021,000 273,301,000 6,001,000Options 300,000 50,000 – – 300,000 50,000
Total $917,023,000 $12,679,000 $1,241,850,000 $13,138,000 $2,158,873,000 $25,817,000
Asset/Mortgage-backed Securities: Asset/Mortgage-backed securities are instruments whose cash flow isbased on the cash flows of a pool of underlying assets ormortgage loans managed by a trust.
Exchange Traded Futures: utures are contractsfor delayed delivery of securities or money marketinstruments in which the seller agrees to make delivery at a specified future date of a specified instrument at a
specified price or yield. nitial margin requirements aremet with cash or securities, and changes in the marketprices are generally settled daily in cash. AB generally closes out open positions prior to maturity. herefore,cash receipts or payments are limited to the change inmarket value of the future contracts. As of 31 ecember2008, net receipts on future contracts amounted to$1,082,000 ($372,000 net payments – 2007).
NOTE E—LOANS
Loans
AB does not sell its sovereign loans, nor does it believethere is a market for its sovereign loans. he estimatedfair value of all loans is based on the estimated cash flowsfrom principal repayments, interest and other chargesdiscounted at the applicable market yield curves for
AB’s borrowing cost plus lending spread.he carrying amount and estimated fair value of
loans outstanding at 31 ecember 2008 and 2007 are asfollows:

7/30/2019 ADB Annual Report 2008 - Financial Report
http://slidepdf.com/reader/full/adb-annual-report-2008-financial-report 57/218
OCR-8
31 December 2007 and 200631 December 2007 and 2006
55 Annual Report 2008
CONTINUED
rior to 1 uly 1986, the lending rate of AB wasbased on a multicurrency fixed lending rate system underwhich loans carried interest rates fixed at the time of loanapproval for the entire life of the loans. ffective 1 uly 1986, AB adopted a multicurrency pool-based variablelending rate system. n addition, in uly 1992, ABintroduced a nited tates dollar pool-based variablelending rate system, and in November 1994, a market-based lending rate system was made available to financialintermediaries of sovereign and nonsovereign borrowers.
he outstanding balances of pool-basedmulticurrency loans were subsequently transformed
into pool-based single currency loans in apanese yen,effective 1 anuary 2004.
Commencing 1 uly 2001, AB offered B-basedloans (Bs) in the following currencies – uro, apanese
yen, and nited tates dollar. he B lending facility offersborrowers the flexibility of (i) choice of currency and interestrate basis; (ii) change the original loan terms (currency andinterest rate basis) at any time during the life of the loan;and (iii) options to cap or collar the floating lending rate atany time during the life of the loan. ith the introductionof Bs, all other loan windows are no longer offered toborrowers. n November 2002, AB offered local currency loans (Cs) to nonsovereign borrowers. n August 2005,
AB also offered Cs to sovereign borrowers. n November2006, AB introduced series of enhancements to sovereignBs negotiated after 1 anuary 2007, offering additionalmajor currencies that AB can efficiently intermediate, andadditional repayment options including (i) annuity methodwith various discount factors, (ii) straight-line repayment,(iii) bullet repayment, and (iv) custom-tailored repayment.
n 2008, AB received prepayments for 11 loans(6 loans – 2007) amounting to $277,053,000 ($80,139,000– 2007) and collected prepayment premiums of $3,937,000
($210,000 - 2007). Ninety percent of the prepaid amounts in2008 were pool-based single currency dollar and apanese
yen loans compared to 87% for pool-based single currency dollar loans in 2007.
Loan Charges
ince 1988, AB has charged front-end fees for non-sovereign loans. ffective 1 anuary 2000, AB leviedfront-end fee of 1% for sovereign loans for which the loannegotiations are completed after that date. n addition, aflat commitment fee of 0.75% was charged for new pro-
gram loans and a progressive commitment fee of 0.75%was maintained for project loans. ffective 1 anuary 2000, the lending spread applied to all outstanding pool-based sovereign loans and new sovereign market-basedloans was increased from 0.4% to 0.6%.
n 2004, the Board approved the waiver of theentire 1% front-end fee on all new sovereign loansapproved during 1 anuary 2004 to 30 une 2005 (waiverof 50 basis points on sovereign loans approved in 2003)and waiver of 20 basis points of the lending spread onsovereign loans outstanding from 1 uly 2004 – 30 une2005 for borrowers that do not have loans in arrears.ubsequently, the policy was extended to cover the
period up to une 2009.he front-end fees received on nonsovereign loans
for the year ended 31 ecember 2008 were $10,987,000($4,576,000 – 2007). Administrative expenses relating todirect loan origination of $35,540,000 for the year ended31 ecember 2008 ($34,080,000 – 2007) were deferredand offset against front-end fees received. he excess, if any, is amortized over the life of each loan.
n November 2006, the Board approved a change inthe commitment charge policy for all sovereign project
2008 2007
Carrying Estimated Carrying EstimatedValue Fair Value Value Fair Value
Fixed rate multicurrency loans $ 22,246,000 $ 27,157,000 $ 22,462,000 $ 28,279,000Pool-based single currency (JPY) loans 3,202,996,000 3,683,699,000 3,138,612,000 3,594,501,000Pool-based single currency (US$) loans 7,049,324,000 8,609,127,000 7,716,536,000 8,537,918,000LIBOR-based loans 25,219,728,000 25,084,442,000 19,135,910,000 19,012,074,000Fixed rate loans 11,470,000 12,806,000 15,587,000 17,811,000Local currency loans 404,296,000 413,728,000 253,772,000 270,787,000
Total $35,910,060,000 $37,830,959,000 $30,282,879,000 $31,461,370,000

7/30/2019 ADB Annual Report 2008 - Financial Report
http://slidepdf.com/reader/full/adb-annual-report-2008-financial-report 58/218
ASIAN DEVELOPMENT BANK —ORDINARY CAPITAL RESOURCES
NOTES TO FINANCIAL STATEMENTS
31 December 2008 and 2007
Asian Development Bank56
O R D I N A R Y C A P I T A L R E S O U R
C E S
B-based loans negotiated after 1 anuary 2007, from75 basis points on a progressive structure of undisbursedloan balances to a flat fee of 35 basis points on the fullamount of undisbursed balances. urther to this, the Boardalso approved in April 2007, the waiver of 10 basis pointsof the commitment charge on the undisbursed balancesof sovereign project loans negotiated after 1 anuary 2007and 50 basis points of the commitment charge on theundisbursed balances of sovereign program loans.
n ecember 2007, the Board approved the revisionof loan charges for sovereign B-based loans negotiatedon and after 1 ctober 2007 by a) providing a credit of
0.4% for the duration of the loan, resulting to an effectivecontractual spread of 0.2%; b) reducing the commitmentcharge from 0.75% and 0.35% for sovereign program andproject loans to 0.15% for both sovereign program andproject loans; and c) eliminating front-end fees.
ndisbursed loan commitments and an analysis of loans by borrowing member countries as of 31 ecember2008 are shown in C-5. he carrying amounts of loanoutstanding by loan products at 31 ecember 2008 and2007 are as follows:
2008 2007
Sovereign LoansFixed rate multicurrency loans $ 22,246,000 $ 22,462,000
Pool-based single currency(JPY) loans 3,202,996,000 3,136,766,000Pool-based single currency
(US$) loans 7,054,332,000 7,722,916,000LIBOR-based loans 23,901,052,000 18,078,713,000
34,180,626,000 28,960,857,000
Provision for loan losses (4,356,000) (5,689,000)Unamortized direct loan
origination cost 76,114,000 47,936,000
71,758,000 42,247,000
Subtotal 34,252,384,000 29,003,104,000
Nonsovereign LoansPool-based single currency
(JPY) loans – 1,846,000Fixed rate loans 11,488,000 15,586,000
LIBOR-based loans 1,253,775,000 1,018,846,000Local currency loans 404,952,000 258,657,000Others 131,000 –
1,670,346,000 1,294,935,000
Provision for loan losses (4,818,000) (9,354,000)Unamortized front-end
fee (7,852,000) (5,806,000)
(12,670,000) (15,160,000)
Subtotal 1,657,676,000 1,279,775,000
Total $35,910,060,000 $30,282,879,000
Loans in Non-accrual Status
ne nonsovereign loan was in non-accrual status as of 31ecember 2008 (four – 2007). he principal outstand-ing at that date was $1,674,000 ($16,507,000 – 2007) of which $1,315,000 ($9,659,000 - 2007) was overdue. oansin non-accrual status resulted in $151,000 ($3,223,000– 2007) not being recognized as income from nonsover-eign loans for the year ended 31 ecember 2008, and atotal of $525,000 as of 31 ecember 2008 ($8,314,000– 2007). he significant decrease resulted mainly fromthe waiver of loan charges totaling $4,735,000 due to sale
of two loans in anuary 2008 and restructuring of oneloan in April 2008, and recovery of $2,717,000 from therestructured loan.
n 2008, one sovereign loan was restored to accrualstatus and loan charges of $1,130,000 for 2007 wasrecognized as income for the current year.
Loan Loss Provision
AB has not suffered any losses of principal on sovereignloans. uring the year, $1,333,000 loan loss provision waswritten back on two loans ($427,000 on one loan – 2007).
Accumulated loan loss provision for sovereign loans as of
31 ecember 2008 was $4,356,000 ($5,689,000 – 2007).oan loss provisions for nonsovereign loans totaling
$4,968,000 were written back/off mainly due to sale of two loans. his reduced the balance of accumulated loanloss provision for nonsovereign loans to $4,818,000 as of 31 ecember 2008 ($9,354,000 – 2007).
nformation pertaining to loans which were subjectto loan loss provisions at 31 ecember 2008 and 2007 isas follows:
2008 2007
Loans not subject toloss provisions $35,841,044,000 $30,233,596,000
Loans subject to
loss provisions 9,928,000 22,196,000
Total $35,850,972,000 $30,255,792,000
Average amount ofloans subject toloss provisions $ 11,325,000 $ 30,019,000
Related interest incomeon such loansrecognized in the year $ 4,946,000 $ 921,000
Cash received on relatedinterest income onsuch loans $ 4,933,000 $ 782,000

7/30/2019 ADB Annual Report 2008 - Financial Report
http://slidepdf.com/reader/full/adb-annual-report-2008-financial-report 59/218
OCR-8
31 December 2007 and 200631 December 2007 and 2006
57 Annual Report 2008
CONTINUEDCONTINUED
he changes in the provision for loan losses during 2008 and 2007 are as follows:
2008 2007
Sovereign Nonsovereign Sovereign NonsovereignLoans Loans Total Loans Loans Total
Balance 1 January $5,689,000 $9,354,000 $15,043,000 $6,116,000 $22,223,000 $28,339,000 Provision written back - net (1,333,000) (2,134,000) (3,467,000) (427,000) (152,000) (579,000)Provision written off – (2,400,000) (2,400,000) – (12,717,000) (12,717,000)Translation adjustment – (2,000) (2,000) – – –
Balance 31 December $4,356,000 $4,818,000 $9,174,000 $5,689,000 $9,354,000 $15,043,000
Cofinancing
AB functions as lead lender in cofinancing arrangementswith other participating financial institutions who alsoprovide funds to AB’s sovereign and nonsovereign bor-rowers. n such capacity, AB provides loan administra-tion services, which include loan disbursements and loancollections. he participating financial institutions haveno recourse to AB for their outstanding loan balances.
oans administered by AB on behalf of
participating institutions as at 31 ecember 2008 and2007 are as follows:
2008
No.ofAmount Loans
Sovereign loans $503,017,000 36Nonsovereign loans 403,517,000 10
Total $906,534,000 46
2007
No.ofAmount Loans
Sovereign loans $527,247,000 32Nonsovereign loans 432,865,000 12
Total $960,112,000 44
uring the year ended 31 ecember 2008, a total of $115,000 ($490,000 - 2007) was received as compensationfor arranging and administering such loans. his amounthas been included in “ncome from other sources.”
NOTE F—GUARANTEES
AB extends guarantees to public sector and privatesector borrowers. uch guarantees include (i) partialcredit guarantees where only certain principal and/or
interest payments are covered; and (ii) political risk guarantees, which provide coverage against well-definedsovereign risks. hile counterguarantees from the hostgovernment are required for all public sector guarantees,guarantees for private sector projects may be providedwith or without a host government counterguarantee. A counterguarantee takes the form of a member govern-ment agreement to indemnify AB for any payments itmakes under the guarantee. n the event that a guaranteeis called, AB has the contractual right to require pay-ment from the government, on demand, or as AB may otherwise direct.
uaranteed payments under partial creditguarantees are generally due 10 or more years fromthe loan inception date. AB’s political risk guaranteeis callable when a guaranteed event has occurred andsuch an event has resulted in debt service default to theguaranteed lender.
n ctober 2008, AB paid a total of 10,375,000($127,000 equivalent) under a partial credit guaranteeagreement. he amount was booked as a loan arising froma guarantee call with a corresponding 100% provision forlosses.

7/30/2019 ADB Annual Report 2008 - Financial Report
http://slidepdf.com/reader/full/adb-annual-report-2008-financial-report 60/218
ASIAN DEVELOPMENT BANK —ORDINARY CAPITAL RESOURCES
NOTES TO FINANCIAL STATEMENTS
31 December 2008 and 2007
Asian Development Bank58
O R D I N A R Y C A P I T A L R E S O U R
C E S
he committed and outstanding amounts of these guarantee obligations as of 31 ecember 2008 and 2007covered:
None of the outstanding amounts as of 31ecember 2008 were subject to call. he committedamount represents the maximum potential amount
of undiscounted future payment that AB could berequired to make, inclusive of standby portion forwhich AB is committed but not currently at risk. heoutstanding amount represents the guaranteed amountutilized under the related loans, which have beendisbursed as of the end of a reporting period, exclusiveof the standby portion. AB estimates that the present
value of guarantees outstanding at 31 ecember 2008was $1,130,777,000 ($965,849,000 – 2007).
As of 31 ecember 2008, a total liability of $23,257,000 ($13,668,000 – 2007) relating to stand-by ready obligation for seven partial credit risk guarantees(five – 2007) and two political risk guarantees (two -
2007) has been included in “Miscellaneous liabilities”on the balance sheet for all guarantees issued after31 ecember 2002.
NOTE G—EQUITY INVESTMENTS
AB's investments in equity securities issued by privateenterprises located in MCs include $208,071,000($212,463,000 – 2007) investments in limited liability
2008 2007
Committed Outstanding Committed OutstandingAmount Amount Amount Amount
Partial Credit Guaranteeswith counterguarantee $1,164,044,000 $1,097,258,000 $1,001,492,000 $ 962,160,000without counterguarantee 432,363,000 363,075,000 280,863,000 271,881,000
1,596,407,000 1,460,333,000 1,282,355,000 1,234,041,000
Political Risk Guaranteeswith counterguarantee 145,156,000 129,419,000 146,813,000 134,210,000without counterguarantee 30,070,000 24,899,000 30,462,000 27,306,000
175,226,000 154,318,000 177,275,000 161,516,000
Others 950,000 950,000 950,000 950,000
Total $1,772,583,000 $1,615,601,000 $1,460,580,000 $1,396,507,000
partnership and limited liability companies. uch eq-uity investments are accounted for under the equity method.
As of 31 ecember 2008, there were six (six – 2007) equity investments which were reported at fair
value totaling $238,497,000 ($462,115,000 – 2007). neinvestment (nil – 2007) sustained unrealized losses of $106,816,000 as of year end of 2008.
Accumulated net unrealized gains on equity investments reported at market value were $116,895,000at 31 ecember 2008 ($340,958,000 – 2007) and werereported in “CAA AN ” as part of “Accumulated other comprehensive income.”
Approved equity investment facility that has notbeen disbursed was $275,740,000 at 31 ecember2008 ($344,046,000 – 2007).
NOTE H—DERIVATIVE INSTRUMENTS
he fair value of outstanding currency and interest rateswap agreements is determined at the estimated amountthat AB would receive or pay to terminate the agree-ments using market-based valuation models. he basisof valuation is the present value of expected cash flowsbased on observable market data.

7/30/2019 ADB Annual Report 2008 - Financial Report
http://slidepdf.com/reader/full/adb-annual-report-2008-financial-report 61/218
OCR-8
31 December 2007 and 200631 December 2007 and 2006
59 Annual Report 2008
CONTINUED
Interest rate swaps: nder a typical interestrate swap agreement, one party agrees to make periodicpayments based on a notional principal amount and aninterest rate that is fixed at the outset of the agreement.he counterparty agrees to make floating rate paymentsbased on the same notional principal amount. he termsof AB's interest rate swap agreements usually matchthe terms of particular borrowings.
Currency swaps: nder a typical currency swapagreement, one party agrees to make periodic paymentsin one currency while the counterparty agrees to make
periodic payments in another currency. he paymentsmay be fixed at the outset of the agreement or vary basedon interest rates. A receivable is created for the currency swapped out, and a payable is created for the currency swapped in. he terms of AB's currency swap agreementsusually match the terms of particular borrowings.
ncluded in eceivable/ayable from waps-thersare interest rate and currency swaps that AB has enteredinto for the purpose of hedging specific investments andloans. he loan related swaps were executed to betteralign the composition of certain outstanding loans withfunding sources.
NOTE I—PROPERTY, FURNITURE, AND EQUIPMENT
n 1991, under the terms of an agreement with thehilippines (overnment), AB returned the formerheadquarters premises, which had been provided by theovernment. n accordance with the agreement as sup-plemented by a memorandum of understanding, ABwas compensated $22,657,000 for the return of thesepremises. he compensation is in lieu of being providedpremises under the agreement and accordingly, is de-ferred and amortized over the estimated life of the newheadquarters building as a reduction of occupancy ex-pense. he amortization for the year ended 31 ecember
2008 amounted to $386,000 ($387,000 – 2007) reducingdepreciation expense for the new headquarters build-ing from $4,427,000 ($4,471,000 – 2007) to $4,041,000($4,084,000 – 2007). At 31 ecember 2008, the un-amortized deferred compensation balance (included in“ACCN AAB AN AB- Miscellaneous”) was $8,218,000 ($9,529,000 – 2007).
At 31 ecember 2008 accumulated depreciation forproperty, furniture, and equipment was $158,259,000($147,999,000 – 2007).
NOTE J—BORROWINGS
he key objective of AB’s borrowing strategy is to raisefunds at the lowest possible cost for the benefit of itsborrowers. AB uses financial derivative instrumentsin connection with its borrowing activities to increasecost efficiency, while achieving risk management objec-tives. Currency swaps enable AB to raise operationally needed currencies in a cost-efficient way and to maintainits borrowing presence in the major capital markets.nterest rate swaps are used generally to reduce interestrate mismatches arising from lending operations.
NOTE K—CAPITAL STOCK, CAPITAL TRANSFERREDTO ASIAN DEVELOPMENT FUND,MAINTENANCE OF VALUE OFCURRENCY HOLDINGS, ANDMEMBERSHIP
Capital Stock
he authorized capital stock of AB as of the end of 2008and 2007 consists of 3,546,311 shares, all of which havebeen subscribed by members. f the subscribed shares,3,296,887 are “callable” and 249,424 are “paid-in.” he
“callable” share capital is subject to call by AB only asand when required to meet AB's obligations incurred onborrowings of funds for inclusion in its rdinary Capitalesources (C) or on guarantees chargeable to suchresources. he “paid-in” share capital has been paid or ispayable in installments, partly in convertible currenciesand partly in the currency of the subscribing memberwhich may be convertible. n accordance with Article 6,paragraph 3 of the Charter, AB accepts non-negotiable,non-interest-bearing demand obligations in satisfactionof the portion payable in the currency of the member,provided such currency is not required by AB for theconduct of its operations. he settlement of such amounts
is not determinable and, accordingly, it is not practicableto determine a fair value for these receivables.
As of 31 ecember 2008, all matured installmentsamounting to $3,850,762,000 ($3,917,444,000 - 2007)were received. nstallments not due aggregating$9,848,000 ($19,664,000 - 2007) are as follows:
or the ear ending 31 ecember:
2009 $6,563,000 2010 $3,285,000
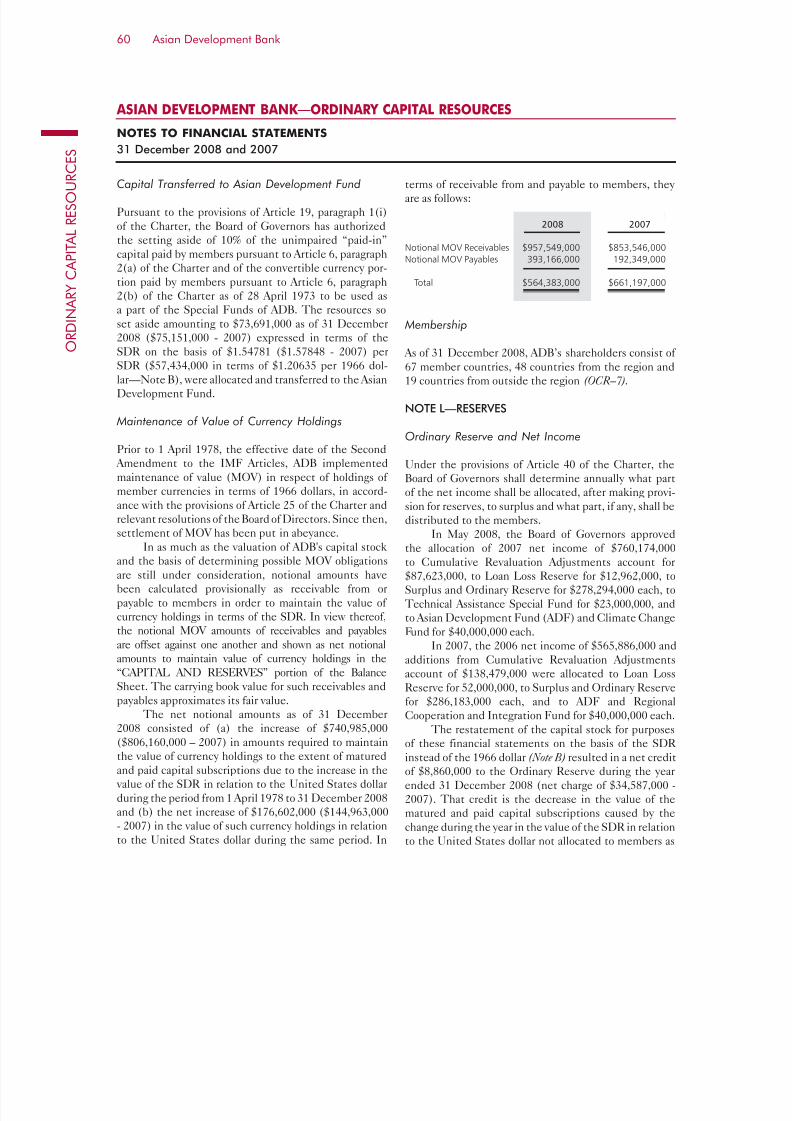
7/30/2019 ADB Annual Report 2008 - Financial Report
http://slidepdf.com/reader/full/adb-annual-report-2008-financial-report 62/218
ASIAN DEVELOPMENT BANK —ORDINARY CAPITAL RESOURCES
NOTES TO FINANCIAL STATEMENTS
31 December 2008 and 2007
Asian Development Bank60
O R D I N A R Y C A P I T A L R E S O U R
C E S
Capital Transferred to Asian Development Fund
ursuant to the provisions of Article 19, paragraph 1(i)of the Charter, the Board of overnors has authorizedthe setting aside of 10% of the unimpaired “paid-in”capital paid by members pursuant to Article 6, paragraph2(a) of the Charter and of the convertible currency por-tion paid by members pursuant to Article 6, paragraph2(b) of the Charter as of 28 April 1973 to be used asa part of the pecial unds of AB. he resources soset aside amounting to $73,691,000 as of 31 ecember2008 ($75,151,000 - 2007) expressed in terms of the
on the basis of $1.54781 ($1.57848 - 2007) per ($57,434,000 in terms of $1.20635 per 1966 dol-lar—Note B), were allocated and transferred to the Asianevelopment und.
Maintenance of Value of Currency Holdings
rior to 1 April 1978, the effective date of the econd Amendment to the M Articles, AB implementedmaintenance of value (M) in respect of holdings of member currencies in terms of 1966 dollars, in accord-ance with the provisions of Article 25 of the Charter andrelevant resolutions of the Board of irectors. ince then,
settlement of M has been put in abeyance.n as much as the valuation of AB's capital stock
and the basis of determining possible M obligationsare still under consideration, notional amounts havebeen calculated provisionally as receivable from orpayable to members in order to maintain the value of currency holdings in terms of the . n view thereof,the notional M amounts of receivables and payablesare offset against one another and shown as net notionalamounts to maintain value of currency holdings in the“CAA AN ” portion of the Balanceheet. he carrying book value for such receivables andpayables approximates its fair value.
he net notional amounts as of 31 ecember2008 consisted of (a) the increase of $740,985,000($806,160,000 – 2007) in amounts required to maintainthe value of currency holdings to the extent of maturedand paid capital subscriptions due to the increase in the
value of the in relation to the nited tates dollarduring the period from 1 April 1978 to 31 ecember 2008and (b) the net increase of $176,602,000 ($144,963,000- 2007) in the value of such currency holdings in relationto the nited tates dollar during the same period. n
terms of receivable from and payable to members, they are as follows:
2008 2007
Notional MOV Receivables $957,549,000 $853,546,000Notional MOV Payables 393,166,000 192,349,000
Total $564,383,000 $661,197,000
Membership
As of 31 ecember 2008, AB’s shareholders consist of 67 member countries, 48 countries from the region and19 countries from outside the region (OCR–7).
NOTE L—RESERVES
Ordinary Reserve and Net Income
nder the provisions of Article 40 of the Charter, theBoard of overnors shall determine annually what partof the net income shall be allocated, after making provi-sion for reserves, to surplus and what part, if any, shall bedistributed to the members.
n May 2008, the Board of overnors approvedthe allocation of 2007 net income of $760,174,000to Cumulative evaluation Adjustments account for$87,623,000, to oan oss eserve for $12,962,000, tourplus and rdinary eserve for $278,294,000 each, toechnical Assistance pecial und for $23,000,000, andto Asian evelopment und (A) and Climate Changeund for $40,000,000 each.
n 2007, the 2006 net income of $565,886,000 andadditions from Cumulative evaluation Adjustmentsaccount of $138,479,000 were allocated to oan osseserve for 52,000,000, to urplus and rdinary eservefor $286,183,000 each, and to A and egionalCooperation and ntegration und for $40,000,000 each.
he restatement of the capital stock for purposesof these financial statements on the basis of the instead of the 1966 dollar (Note B) resulted in a net creditof $8,860,000 to the rdinary eserve during the yearended 31 ecember 2008 (net charge of $34,587,000 -2007). hat credit is the decrease in the value of thematured and paid capital subscriptions caused by thechange during the year in the value of the in relationto the nited tates dollar not allocated to members as
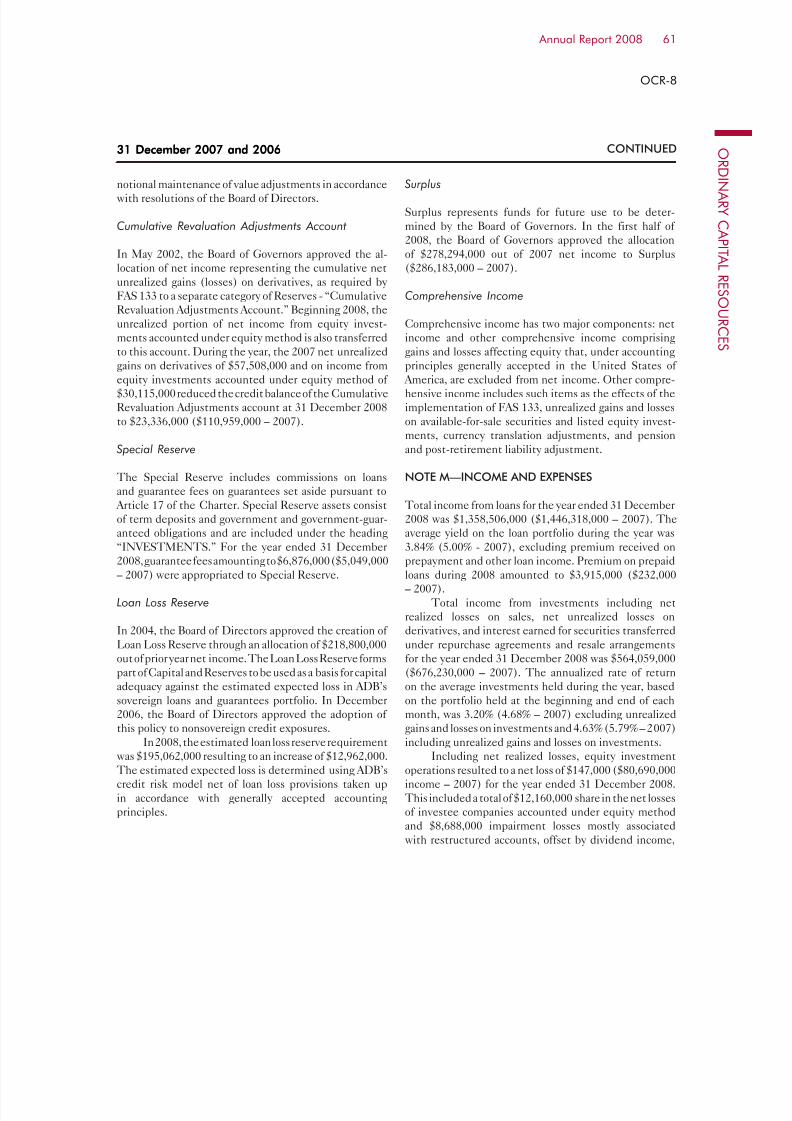
7/30/2019 ADB Annual Report 2008 - Financial Report
http://slidepdf.com/reader/full/adb-annual-report-2008-financial-report 63/218
OCR-8
31 December 2007 and 200631 December 2007 and 2006
61 Annual Report 2008
CONTINUED
notional maintenance of value adjustments in accordancewith resolutions of the Board of irectors.
Cumulative Revaluation Adjustments Account
n May 2002, the Board of overnors approved the al-location of net income representing the cumulative netunrealized gains (losses) on derivatives, as required by A 133 to a separate category of eserves - “Cumulativeevaluation Adjustments Account.” Beginning 2008, theunrealized portion of net income from equity invest-ments accounted under equity method is also transferred
to this account. uring the year, the 2007 net unrealizedgains on derivatives of $57,508,000 and on income fromequity investments accounted under equity method of $30,115,000 reduced the credit balance of the Cumulativeevaluation Adjustments account at 31 ecember 2008to $23,336,000 ($110,959,000 – 2007).
Special Reserve
he pecial eserve includes commissions on loansand guarantee fees on guarantees set aside pursuant to
Article 17 of the Charter. pecial eserve assets consistof term deposits and government and government-guar-
anteed obligations and are included under the heading“NMN.” or the year ended 31 ecember2008, guarantee fees amounting to $6,876,000 ($5,049,000– 2007) were appropriated to pecial eserve.
Loan Loss Reserve
n 2004, the Board of irectors approved the creation of oan oss eserve through an allocation of $218,800,000out of prior year net income. he oan oss eserve formspart of Capital and eserves to be used as a basis for capitaladequacy against the estimated expected loss in AB’ssovereign loans and guarantees portfolio. n ecember
2006, the Board of irectors approved the adoption of this policy to nonsovereign credit exposures.
n 2008, the estimated loan loss reserve requirementwas $195,062,000 resulting to an increase of $12,962,000.he estimated expected loss is determined using AB’scredit risk model net of loan loss provisions taken upin accordance with generally accepted accountingprinciples.
Surplus
urplus represents funds for future use to be deter-mined by the Board of overnors. n the first half of 2008, the Board of overnors approved the allocationof $278,294,000 out of 2007 net income to urplus($286,183,000 – 2007).
Comprehensive Income
Comprehensive income has two major components: netincome and other comprehensive income comprising
gains and losses affecting equity that, under accountingprinciples generally accepted in the nited tates of America, are excluded from net income. ther compre-hensive income includes such items as the effects of theimplementation of A 133, unrealized gains and losseson available-for-sale securities and listed equity invest-ments, currency translation adjustments, and pensionand post-retirement liability adjustment.
NOTE M—INCOME AND EXPENSES
otal income from loans for the year ended 31 ecember2008 was $1,358,506,000 ($1,446,318,000 – 2007). he
average yield on the loan portfolio during the year was3.84% (5.00% - 2007), excluding premium received onprepayment and other loan income. remium on prepaidloans during 2008 amounted to $3,915,000 ($232,000– 2007).
otal income from investments including netrealized losses on sales, net unrealized losses onderivatives, and interest earned for securities transferredunder repurchase agreements and resale arrangementsfor the year ended 31 ecember 2008 was $564,059,000($676,230,000 – 2007). he annualized rate of returnon the average investments held during the year, basedon the portfolio held at the beginning and end of each
month, was 3.20% (4.68% – 2007) excluding unrealizedgains and losses on investments and 4.63% (5.79% – 2007)including unrealized gains and losses on investments.
ncluding net realized losses, equity investmentoperations resulted to a net loss of $147,000 ($80,690,000income – 2007) for the year ended 31 ecember 2008.his included a total of $12,160,000 share in the net lossesof investee companies accounted under equity methodand $8,688,000 impairment losses mostly associatedwith restructured accounts, offset by dividend income,

7/30/2019 ADB Annual Report 2008 - Financial Report
http://slidepdf.com/reader/full/adb-annual-report-2008-financial-report 64/218
ASIAN DEVELOPMENT BANK —ORDINARY CAPITAL RESOURCES
NOTES TO FINANCIAL STATEMENTS
31 December 2008 and 2007
Asian Development Bank62
O R D I N A R Y C A P I T A L R E S O U R
C E S
gains on disposals, and other income of $15,823,000,$4,804,000, and $75,000 respectively.
ncome from other sources primarily includedincome received as executing agency amounting to$9,979,000 ($9,843,000 – 2007), interests earned onbank accounts and on staff accounts totaling $1,369,000($645,000 – 2007) and $1,682,000 ($2,265,000 – 2007),respectively, and reversals of expenses charged to prior
years of $4,335,000 ($4,719,000 – 2007).otal interest expense incurred for the year
ended 31 ecember 2008 amounted to $1,181,410,000($1,368,177,000 – 2007). ther borrowings and related
expenses consisted of amortization of borrowings’issuance costs and other expenses of $26,981,000($21,601,000 – 2007).
Administrative expenses (other than thosepertaining directly to ordinary operations and specialoperations) for the year ended 31 ecember 2008 wereapportioned between C and A in proportion of the relative volume of operational activities of each fund.f the total administrative expenses of $363,724,000($347,803,000 – 2007), $187,138,000 ($186,396,000– 2007) was accordingly charged to A. he balance of administrative expenses after allocation was reduced by the deferral of direct loan origination costs of $35,539,000
($34,080,000 – 2007) related to new loans that becameeffective for the year ended 31 ecember 2008 ( Notes B
and E).n November 2008, following the approval by the
Board of irectors in eptember 2007, AB entered intoa rust fund rant Arrangement with nternational Bank for econstruction and evelopment and nternationalevelopment Association, to provide $10,000,000 asa contribution to the ava econstruction und. hiswas charged to C current income as “CNCA
AANC MMB CN.” Net of write-back for the year totaling $1,643,000 ($683,000– 2007) representing cancellations of the undisbursed
amounts of completed A projects committed in priorperiods, technical assistance for the year amounted to$8,357,000.
As of 31 ecember 2008, the net cumulative amountof A commitments that had been charged to C netincome amounted to $76,205,000 ($67,848,000 – 31ecember 2007) out of which $65,716,000 ($65,530,000– 2007) had been disbursed.
or the year ended 31 ecember 2008, total write-back of provision for losses amounted to $3,467,000($579,000 - 2007). his corresponded to $1,333,000 fortwo sovereign loans and $2,134,000 for a nonsovereignloan, resulting mainly from repayments and loanrestructuring.
ther expenses of $6,271,000 ($3,998,000 – 2007)included non-borrowings related financial expensessuch as fees paid to external asset managers and bank charges.
Net unrealized gains incorporated $429,000net losses ($3,680,000 – 2007) from the translation
adjustments of financial instruments denominated innon-functional currencies (outh African and andMexican eso), and net unrealized gains on derivativesof $451,020,000 ($57,508,000 – 2007), which were madeup of:
2008 2007
Unrealized gains (losses) on:Hybrid financial instruments
and related swaps* $387,136,000 $ (5,322,000)Non-hybrid financial
instruments andrelated swaps* 249,942,000 108,028,000
Investments related swaps (88,279,000) (4,182,000)Loan related swaps (98,625,000) (38,089,000)FX Forward 263,000 (1,958,000)
Amortization of the FAS 133transition adjustment 583,000 (969,000)
Total $451,020,000 $ 57,508,000
*Figures are not comparable due to the adoption of FAS 157 and 159 effective
1 January 2008, where (a) credit risk (spread) were incorporated in fair valuing
the outstanding financial instruments, and (b) non-hybrid swapped borrowings
which were recorded at amortized cost in 2007, were recorded at fair value in
2008.
NOTE N—OTHER ASSETS AND LIABILITIES—MISCELLANEOUS
At 31 ecember 2008 and 2007, AB had the follow-ing receivables from/payables to special funds and trustfunds resulting from administrative arrangements andoperating activities:

7/30/2019 ADB Annual Report 2008 - Financial Report
http://slidepdf.com/reader/full/adb-annual-report-2008-financial-report 65/218
OCR-8
31 December 2007 and 200631 December 2007 and 2006
63 Annual Report 2008
CONTINUED
2008 2007
Amounts receivable from:
Asian Development Fund(Note M) $31,743,000 $28,750,000
Technical AssistanceSpecial Fund – 14,000
Japan Special Fund 145,000 159,000Asian Tsunami Fund 669,000 343,000Pakistan Earthquake Fund 4,000 5,000Regional Cooperation and
Integration Fund 15,000 –Climate Change Fund 6,000 –
Asian Development Bank Institute Special Fund 847,000 341,000Staff Retirement Plan – 11,012,000Agency Trust Funds (net) 842,000 1,984,000
Total $34,271,000 $42,608,000
Amounts payable to:
Technical Assistance SpecialFund $ 12,000 $ –
Staff Retirement Plan 14,205,000 –
Total $14,217,000 $ –
NOTE O—STAFF RETIREMENT PLAN ANDPOSTRETIREMENT MEDICAL BENEFITS
Staff Retirement Plan
AB has a contributory defined benefit taff etirementlan (the lan). very employee, as defined under thelan, shall, as a condition of service, become a participantfrom the first day of service, provided that at such a date,the employee has not reached the normal retirement ageof 60. he lan applies also to members of the Board of irectors who elect to join the lan. etirement ben-efits are based on length of service and highest averageremuneration during two years of eligible service. helan assets are segregated and are not included in theaccompanying Balance heet. he costs of administeringthe lan are absorbed by AB, except for fees paid tothe investment managers and related charges, includingcustodian fees, which are borne by the lan.
articipants hired on or before 30 eptember 2006are required to contribute 9 1/3% of their salary to thelan while those hired after that date do not anymorecontribute to the plan. articipants may also makeadditional voluntary contributions. AB's contributionis determined at a rate sufficient to cover that part of the costs of the lan not covered by the participants'contributions.
Expected Contributions
he expected amount of contributions to the lan for
2009 amounts to $51,499,000 ($43,291,000 – 2007)representing AB’s contributions of $29,394,000($22,902,000 – 2007), based on budgeted contribu-tion rate of 19% (16% - 2007), participants’ mandatory contributions of $11,605,000 ($11,889,000 – 2007) anddiscretionary contributions of $10,500,000 ($8,500,000– 2007).
Investment Strategy
Contributions in excess of current benefits paymentsare invested in international financial markets and in a
variety of investment vehicles. he lan employs nine
external asset managers and one global custodian whofunction within the guidelines established by the lan’snvestment Committee. he investment of these assets,over the long term, is expected to produce higher returnsthan short-term investments. he investment policy incorporates the lan’s package of desired investment re-turn and tolerance for risk, taking into account the natureand duration of the lan’s liabilities. he lan’s assets arediversified among different markets and different assetclasses. he use of derivatives for speculation, leverage ortaking risks is prohibited. elected derivatives are usedfor hedging and transactional efficiency purposes.
he lan’s investment policy is periodically
reviewed and revised to reflect the best interest of thelan’s participants and beneficiaries. he current policy,adopted in anuary 2003, specifies an asset-mix structureof 70% of assets in equities and 30% in fixed incomesecurities. At present, investments of the lan’s assetsare divided into three categories: equity, Non-equity, and fixed income.

7/30/2019 ADB Annual Report 2008 - Financial Report
http://slidepdf.com/reader/full/adb-annual-report-2008-financial-report 66/218
ASIAN DEVELOPMENT BANK —ORDINARY CAPITAL RESOURCES
NOTES TO FINANCIAL STATEMENTS
31 December 2008 and 2007
Asian Development Bank64
O R D I N A R Y C A P I T A L R E S O U R
C E S
As of 31 ecember 2008 and 2007, the breakdownof the fair value of plan assets held are as follows:
2008
Amount Percentage
Equity SecuritiesUS $ 320,303,000Non-US 215,489,000
535,792,000 58.6%Fixed Income Securities 362,584,000 39.6Other Assets (Liabilities) – net 16,254,000 1.8
Total $ 914,630,000 100.0%
2007
Amount Percentage
Equity SecuritiesUS $ 541,837,000Non-US 407,222,000
949,059,000 72.9%Fixed Income Securities 362,646,000 27.9Other Assets (Liabilities) – net (10,150,000) (0.8)
Total $1,301,555,000 100.0%
All investments excluding time deposits are valued using market prices. ime deposits are reportedat cost which is a reasonable estimate of fair value.ixed income securities include government andgovernment guaranteed obligations, corporate bonds andtime deposits. ther assets include forward exchangecontracts in various foreign currencies transacted to
hedge currency exposure in the investment portfolio,which are reported at fair value.
or the year ended 31 ecember 2008 the net returnon the lan assets was -29.5% (6.0% – 2007). AB expectsthe long-term rate of return on the assets to be 8%.
Assumptions
he assumed overall rate of return takes into accountlong-term return expectations of the underlying as-set classes within the investment portfolio mix, andthe expected duration of the lan’s liabilities. eturn
expectations are forward looking and, in general, notmuch weight is given to short-term experience. nlessthere is a drastic change in investment policy or marketenvironment, the assumed investment return of 8% onthe lan’s assets is expected to remain broadly the same,
year to year.
Postretirement Medical Benefits Plan
n 1993, AB adopted a cost-sharing plan for retirees’medical insurance premiums. nder the plan, AB isobligated to pay 75% of the roup Medical nsurancelan premiums for retirees, including retired members
of the Board of irectors, and their eligible dependentswho elected to participate. he cost-sharing plan is cur-rently unfunded.
enerally accepted accounting principles requirean actuarially determined assessment of the periodiccost of postretirement medical benefits.
he following table sets forth the pension andpostretirement medical benefits at 31 ecember 2008and 2007:
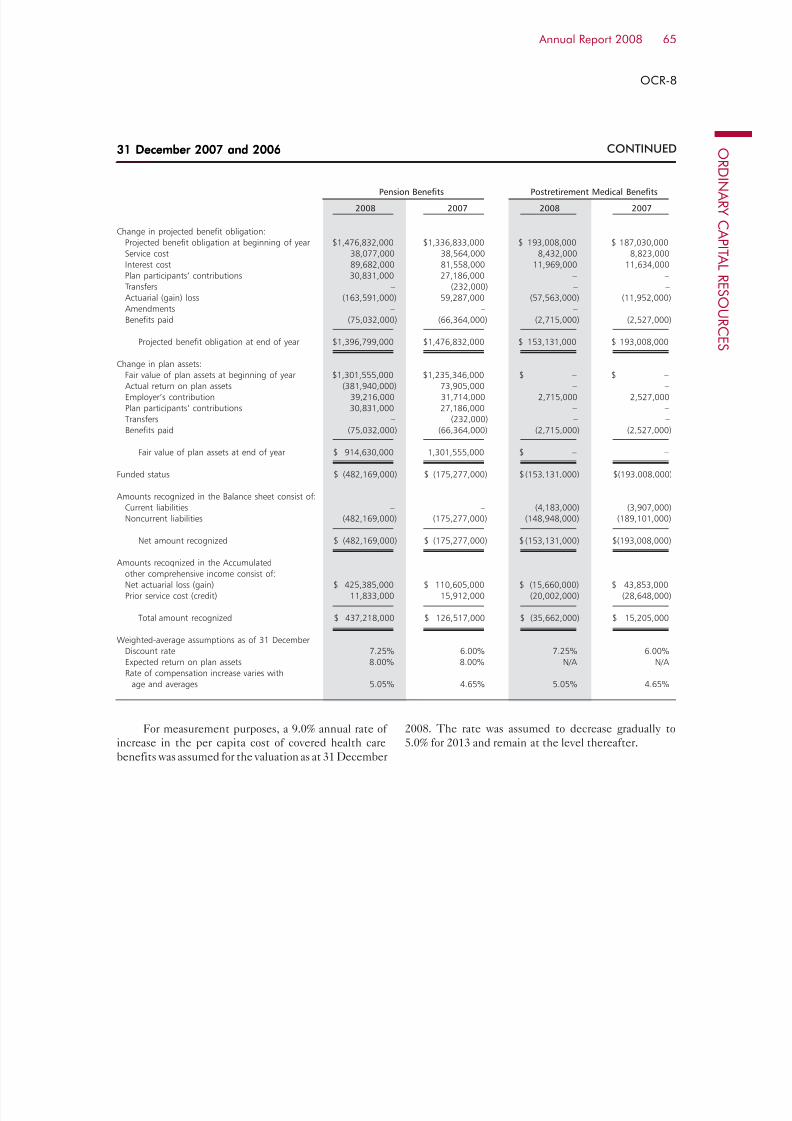
7/30/2019 ADB Annual Report 2008 - Financial Report
http://slidepdf.com/reader/full/adb-annual-report-2008-financial-report 67/218
OCR-8
31 December 2007 and 200631 December 2007 and 2006
65 Annual Report 2008
CONTINUED
or measurement purposes, a 9.0% annual rate of increase in the per capita cost of covered health carebenefits was assumed for the valuation as at 31 ecember
Pension Benefits Postretirement Medical Benefits
2008 2007 2008 2007
Change in projected benefit obligation:
Projected benefit obligation at beginning of year $1,476,832,000 $1,336,833,000 $ 193,008,000 $ 187,030,000
Service cost 38,077,000 38,564,000 8,432,000 8,823,000
Interest cost 89,682,000 81,558,000 11,969,000 11,634,000
Plan participants’ contributions 30,831,000 27,186,000 – –
Transfers – (232,000) – –
Actuarial (gain) loss (163,591,000) 59,287,000 (57,563,000) (11,952,000)
Amendments – – – –
Benefits paid (75,032,000) (66,364,000) (2,715,000) (2,527,000)
Projected benefit obligation at end of year $1,396,799,000 $1,476,832,000 $ 153,131,000 $ 193,008,000
Change in plan assets:
Fair value of plan assets at beginning of year $1,301,555,000 $1,235,346,000 $ – $ –
Actual return on plan assets (381,940,000) 73,905,000 – –
Employer’s contribution 39,216,000 31,714,000 2,715,000 2,527,000
Plan participants’ contributions 30,831,000 27,186,000 – –
Transfers – (232,000) – –
Benefits paid (75,032,000) (66,364,000) (2,715,000) (2,527,000)
Fair value of plan assets at end of year $ 914,630,000 1,301,555,000 $ – –
Funded status $ (482,169,000) $ (175,277,000) $ (153,131,000) $(193,008,000)
Amounts recognized in the Balance sheet consist of:
Current liabilities – – (4,183,000) (3,907,000)
Noncurrent liabilities (482,169,000) (175,277,000) (148,948,000) (189,101,000)
Net amount recognized $ (482,169,000) $ (175,277,000) $ (153,131,000) $(193,008,000)
Amounts recognized in the Accumulated
other comprehensive income consist of:
Net actuarial loss (gain) $ 425,385,000 $ 110,605,000 $ (15,660,000) $ 43,853,000
Prior service cost (credit) 11,833,000 15,912,000 (20,002,000) (28,648,000)
Total amount recognized $ 437,218,000 $ 126,517,000 $ (35,662,000) $ 15,205,000
Weighted-average assumptions as of 31 December
Discount rate 7.25% 6.00% 7.25% 6.00%
Expected return on plan assets 8.00% 8.00% N/A N/A
Rate of compensation increase varies with
age and averages 5.05% 4.65% 5.05% 4.65%
2008. he rate was assumed to decrease gradually to5.0% for 2013 and remain at the level thereafter.

7/30/2019 ADB Annual Report 2008 - Financial Report
http://slidepdf.com/reader/full/adb-annual-report-2008-financial-report 68/218
ASIAN DEVELOPMENT BANK —ORDINARY CAPITAL RESOURCES
NOTES TO FINANCIAL STATEMENTS
31 December 2008 and 2007
Asian Development Bank66
O R D I N A R Y C A P I T A L R E S O U R
C E S
he accumulated benefit obligation of the pension
plan as of 31 ecember 2008 was $1,306,323,000($1,374,738,000 – 2007).
he estimated net loss and prior service cost forthe defined benefit pension plans that will be amortizedfrom accumulated other comprehensive income intonet periodic benefit cost over the next fiscal year are$8,940,000 and $4,079,000, respectively. heestimated net loss and prior service credit for the otherpostretirement benefits plan that will be amortizedfrom accumulated other comprehensive income intonet periodic benefit cost over the next fiscal year is$(27,000) and $(8,646,000), respectively.
A one-percentage-point change in assumed health
care trend rates would have the following effects:
1-Percentage- 1-Percentage-Point Increase Point Decrease
Effect on total service andinterest cost components $ 5,234,000 $ (3,953,000)
Effect on postretirementbenefit obligation 27,449,000 (21,903,000)
Estimated Future Benefits Payments
he following table shows the benefit payments expectedto be paid in each of the next five years and subsequentfive years. he expected benefit payments are basedon the same assumptions used to measure the benefitobligation at 31 ecember 2008:
Pension PostretirementBenefits Medical Benefits
2009 $ 68,830,000 $ 4,183,0002010 66,041,000 4,802,0002011 71,501,000 5,475,0002012 76,081,000 6,137,0002013 78,628,000 6,780,0002014-2018 460,645,000 43,674,000
NOTE P—FAIR VALUE OF FINANCIAL INSTRUMENTS
he carrying amounts and estimated fair values of AB'ssignificant financial instruments as of 31 ecember 2008and 2007 are summarized in the next page.
The Fair Value Option
ffective 1 anuary 2008, AB elected the air alueption on all borrowings with associated derivativeinstruments. his election allows AB to mitigate theearnings volatility in its statutory reporting that is causedby the different accounting treatment of the borrowingand its related derivative without having to apply the
complex hedge accounting requirements of A 133.
Fair Value Measurement
A 157 defines fair value as the price that would bereceived to sell an asset or paid to transfer a liability atmeasurement date (exit price) in an orderly transactionamong willing participants with an assumption that thetransaction takes place in the entity’s principal market,the most advantageous market for the asset or liability.he most advantageous market is the market where thesale of the asset or transfer of liability would maximize theamount received for the asset or minimize the amountpaid to transfer the liability. he fair value measurementis not adjusted for transaction cost.
AB determines fair values using inputs based onquoted or observable market prices and cash flow models.nputs for the models are based on observable marketdata such as yield curves, interest rates, volatilities, andforeign exchange rates. arameters and models used for
valuation are subject to internal review and periodicexternal validation.
Pension Benefits Postretirement Medical Benefits
2008 2007 2008 2007
Components of net periodic benefit cost:
Service cost $38,077,000 $38,564,000 $ 8,432,000 $ 8,823,000Interest cost 89,682,000 81,558,000 11,969,000 11,634,000Expected return on plan assets (98,293,000) (88,047,000) – –Amortization of prior service cost 4,079,000 4,079,000 (8,646,000) (8,646,000)Recognized actuarial loss 1,862,000 2,569,000 1,950,000 3,304,000
Net periodic benefit cost $35,407,000 $38,723,000 $13,705,000 $15,115,000

7/30/2019 ADB Annual Report 2008 - Financial Report
http://slidepdf.com/reader/full/adb-annual-report-2008-financial-report 69/218
OCR-8
31 December 2007 and 200631 December 2007 and 2006
67 Annual Report 2008
CONTINUED
ollowing guidelines are applied in determiningthe fair values of financial instruments:
Borrowings and associated derivative instruments. tructured borrowings issued by AB are valued by usingthe discounted cash flow models based on embeddedoptions such as caps, floors, calls, and credit spread. hesemodels use pay-off profiles within the realm of acceptedmarket practices such as ull-hite, Black and choles,ibor Market Model as applicable. Non-structured
swapped borrowings, forward foreign exchange, interestrate, and cross currency swap contracts are fair valuedwith observable market inputs using discounted cashflow models. Market observable inputs, such as yieldcurves, foreign exchange rates, basis spreads, creditspreads, cross currency rates, and volatilities are appliedto the models to determine fair value of borrowings.Classified under evel 2 are swapped borrowings and therelated derivatives for which AB can obtain observablemarket inputs in the form of primary broker quotes for
similar debt instruments. ncluded in evel 3 category are swapped borrowings fair-valued using significantunobservable inputs.
Investments, asset swaps, repurchase agreements and
resale arrangements. eadily marketable investmentsare fair valued using active market quotes in evel 1category. evel 2 category includes investments andrepurchase agreements fair valued with significant othermarket observable inputs. ncluded in evel 3 category
are insignificant portfolio of investments fair valuedusing significant unobservable inputs including pricesprovided by third parties such as the custodians andasset managers. orward foreign exchange, interest rate,and cross currency swap contracts are fair valued withobservable market inputs using discounted cash flowmodels. Market observable inputs, such as yield curves,foreign exchange rates, basis spreads, credit spreads,cross currency rates, and volatilities are applied to themodels to determine fair value of investments.
2008 2007
Carrying Estimated Carrying Estimated
Amounta Fair Value Amounta Fair Value
On-balance sheet financial instruments:
ASSETS:
Due from banks $ 142,238,000 $ 142,238,000 $ 108,821,000 $ 108,821,000Investments (Note D) 15,412,519,000 15,412,519,000 13,296,943,000 13,296,943,000Securities transferred under repurchase agreement 309,358,000 309,358,000 5,041,387,000 5,041,387,000Securities purchased under resale arrangement 511,756,000 511,756,000 427,132,000 427,132,000Loans outstanding (Note E) 35,910,060,000 37,830,959,000 30,282,879,000 31,461,370,000Equity investments (Note G) 641,427,000 641,427,000 808,157,000 808,157,000Other assets
Non-negotiable, non-interest-bearingdemand obligations 144,514,000 93,724,000 174,805,000 105,027,000
Receivable from swaps – others (Note H) 882,793,000 882,793,000 512,089,000 512,089,000Receivable from swaps – borrowings (Note H) 23,831,087,000 23,831,087,000 17,968,867,000 17,968,867,000Future guarantee receivable 23,257,000 23,257,000 13,668,000 13,668,000
LIABILITIES:
Borrowings (Note J) 36,026,446,000 37,848,839,000 31,959,299,000 32,023,669,000Other liabilities
Payable for swaps – others (Note H) 1,198,781,000 1,198,781,000 583,321,000 583,321,000Payable for swaps – borrowings (Note H) 24,867,815,000 24,867,815,000 16,936,964,000 16,936,964,000Guarantee liability 23,257,000 23,257,000 13,668,000 13,668,000
2008 2007
Outstanding Present Outstanding Present
Amount Value Amount Value
Off-balance sheet financial instruments: Guarantees (Note F) $ 1,189,851,000 $ 769,204,000 $ 1,060,328,000 $ 689,145,000
a The carrying amount for borrowings and swaps are inclusive of accrued interest.

7/30/2019 ADB Annual Report 2008 - Financial Report
http://slidepdf.com/reader/full/adb-annual-report-2008-financial-report 70/218
ASIAN DEVELOPMENT BANK —ORDINARY CAPITAL RESOURCES
NOTES TO FINANCIAL STATEMENTS
31 December 2008 and 2007
Asian Development Bank68
O R D I N A R Y C A P I T A L R E S O U R
C E S
Equity Investments. eadily marketable equity investments are fair valued using quoted prices in activemarkets.
Fair Value Hierarchy
A 157 establishes a fair value hierarchy that gives thehighest priority to quoted prices in active markets foridentical assets or liabilities (evel 1), next priority toobservable market inputs or market corroborated data
(evel 2), and the lowest priority to unobservable inputswithout market corroborated data (evel 3). A 157requires the fair value measurement to maximize the useof market observable inputs.
Assets and liabilities measured at fair value on arecurring basis:
The fair value of the following financial assets and
liabilities as of 31 December 2008 were reported based on the
following:
Fair Value Measurements
Quoted Prices in Significant SignificantActive Markets for Other Observable UnobservableIdentical Assets Inputs Inputs
31 December 2008 (Level 1) (Level 2) (Level 3)
Assets
Investments $15,412,519,000 $6,410,116,000 $ 8,978,004,000 $ 24,399,000Securities transferred under
repurchase agreement 309,358,000 309,358,000 – –Securities purchased under
resale arrangement 511,756,000 – 511,756,000 –Investments related swaps 544,796,000 – 544,796,000 –Loans related swaps 337,997,000 – 337,997,000 –Borrowings related swaps 23,831,087,000 – 23,831,087,000 –Equity investments 238,497,000 238,497,000 – –
Total $41,186,010,000 $6,957,971,000 $34,203,640,000 $ 24,399,000
Liabilities
Borrowings $31,012,976,000 – $24,528,881,000 $6,484,095,000Borrowings related swaps 24,867,815,000 – 24,867,815,000 –Investments related swaps 745,289,000 – 745,289,000 –Loans related swaps 453,492,000 – 453,492,000 –
Total $57,079,572,000 $ – $50,595,477,000 $6,484,095,000
Assets (liabilities) measured at fair value on a recurring basis using significant unobservable inputs (level 3):
Investments Borrowings
Balance, 1 January 2008 $127,442,000 $(5,034,939,000)Total gains (losses) – (realized/unrealized)
Included in earnings 52,000 384,233,000Included in other comprehensive income (8,652,000) 550,965,000
Purchases, sales, and paydowns 1,262,000 –Issuances, redemptions, and maturities – (2,384,354,000)Transfers out of Level 3 (95,705,000) –
Balance, 31 December 2008 $ 24,399,000 $(6,484,095,000)
The amount of net losses for the period included in earningsattributable to the change in net unrealized gains relatingto assets/liabilities still held at the reporting date $ – $ 282,466,000

7/30/2019 ADB Annual Report 2008 - Financial Report
http://slidepdf.com/reader/full/adb-annual-report-2008-financial-report 71/218
OCR-8
31 December 2007 and 200631 December 2007 and 2006
69 Annual Report 2008
The following table provides the effect of the initial adoption of FAS 157 and FAS 159.
Carrying value Carrying value1 January 2008, Net gain 1 January 2008,
prior to adoption upon adoption after adoption Borrowings $31,959,300,000 $(227,500,000) $31,731,800,000
Cumulative effect to1 January 2008 balance of reserves $227,500,000
he fair value of borrowings for which the fair value
option has been elected exceeds the aggregate principalbalance by $1,541,598,000.
he estimated gain from fair value changes includedin earnings that are attributable to the widening of thecredit spreads was $531,665,000 for the year ended 31ecember 2008. Changes in fair value resulting fromchanges in instrument-specific credit risk were estimatedby incorporating AB's current observable credit spreadby currency into the relevant valuation technique usedto value the borrowing instruments.
he related interest expense continues to bemeasured based on the contractual interest ratesand reported as such in the tatement of ncome and
xpenses.
NOTE Q—CREDIT RISK
AB is exposed to risk if the borrowers fall in arrears onpayments. AB manages country risk for lending opera-tions through continuous monitoring of creditworthinessof the borrowers and rigorous capital adequacy frame-work. uarantees involve elements of credit risk whichare also not reflected on the balance sheet. Credit risk represents the potential loss due to possible nonperform-ance by obligors and counterparties under the terms of the contract.
As of 31 ecember 2008, AB has a significantconcentration of credit risk to Asian and the acific regionassociated with loan and guarantee products with creditexposure determined based on fair value of loans andoutstanding guarantees amounting to $39,446,560,000($32,857,877,000 – 2007).
AB undertakes derivative transactions with itseligible counterparties and transacts in various financialinstruments as part of liquidity and asset/liability management purposes that may involve credit risks.
or all investment securities and their derivatives, AB
manages credit risks by following the guidelines set forthin the nvestment Authority (Note D).
AB has a potential risk of loss if the swapcounterparty fails to perform its obligations. n order toreduce such credit risk, AB only enters into long-termswap transactions with counterparties eligible under
AB's swap guidelines which include a requirementthat the counterparties have a credit rating of A-/A3 orhigher and requires certain counterparties with executedCredit upport Annex, to provide collateral in form of cash or other approved liquid securities based on mark-to-market exposure.
As of 31 ecember 2008, AB had received
collateral of $418,995,000 ($461,017,000 – 2007) inconnection with the swap agreements. AB has alsoentered into master swap agreements which containlegally enforceable close-out netting provisions for allcounterparties with outstanding swap transactions.
NOTE R—SPECIAL AND TRUST FUNDS
AB's operations include special operations, which arefinanced from special fund resources, consisting of the
Asian evelopment und, the echnical Assistancepecial und, apan pecial und, the Asian evelopmentBank nstitute pecial und, the Asian sunami und,
the akistan arthquake und, the egional Cooperationand ntegration und, and the Climate Change und.
he C and special fund resources are at alltimes used, committed, and invested entirely separatefrom each other. he Board of overnors may approveallocation of the net income of C to special funds,based on the funding and operational requirements forthe funds. he administrative and operational expensespertaining to the C and special funds are chargedto the respective special funds. he administrative
CONTINUED
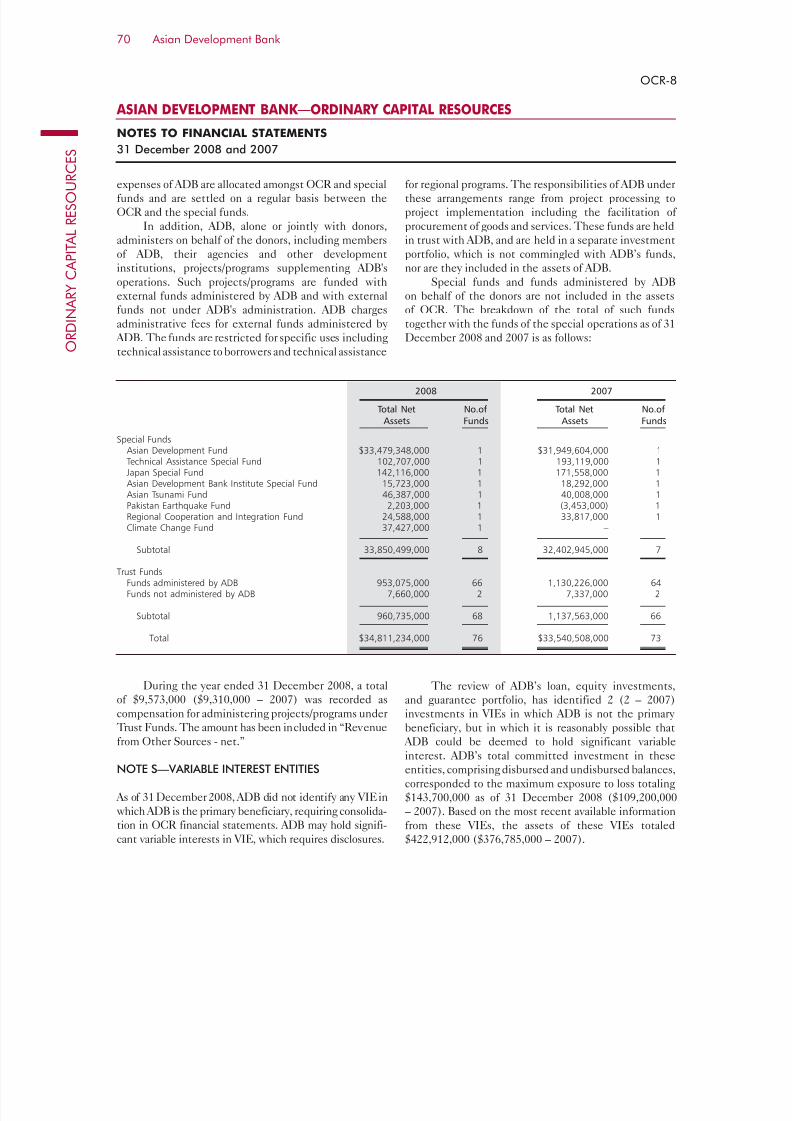
7/30/2019 ADB Annual Report 2008 - Financial Report
http://slidepdf.com/reader/full/adb-annual-report-2008-financial-report 72/218
ASIAN DEVELOPMENT BANK —ORDINARY CAPITAL RESOURCES
NOTES TO FINANCIAL STATEMENTS
31 December 2008 and 2007
Asian Development Bank70
O R D I N A R Y C A P I T A L R E S O U R
C E S
expenses of AB are allocated amongst C and specialfunds and are settled on a regular basis between theC and the special funds.
n addition, AB, alone or jointly with donors,administers on behalf of the donors, including membersof AB, their agencies and other developmentinstitutions, projects/programs supplementing AB'soperations. uch projects/programs are funded withexternal funds administered by AB and with externalfunds not under AB's administration. AB chargesadministrative fees for external funds administered by
AB. he funds are restricted for specific uses including
technical assistance to borrowers and technical assistance
2008 2007
Total Net No.of Total Net No.ofAssets Funds Assets Funds
Special FundsAsian Development Fund $33,479,348,000 1 $31,949,604,000 1Technical Assistance Special Fund 102,707,000 1 193,119,000 1Japan Special Fund 142,116,000 1 171,558,000 1Asian Development Bank Institute Special Fund 15,723,000 1 18,292,000 1Asian Tsunami Fund 46,387,000 1 40,008,000 1Pakistan Earthquake Fund 2,203,000 1 (3,453,000) 1Regional Cooperation and Integration Fund 24,588,000 1 33,817,000 1
Climate Change Fund 37,427,000 1 –
Subtotal 33,850,499,000 8 32,402,945,000 7
Trust FundsFunds administered by ADB 953,075,000 66 1,130,226,000 64Funds not administered by ADB 7,660,000 2 7,337,000 2
Subtotal 960,735,000 68 1,137,563,000 66
Total $34,811,234,000 76 $33,540,508,000 73
for regional programs. he responsibilities of AB underthese arrangements range from project processing toproject implementation including the facilitation of procurement of goods and services. hese funds are heldin trust with AB, and are held in a separate investmentportfolio, which is not commingled with AB’s funds,nor are they included in the assets of AB.
pecial funds and funds administered by ABon behalf of the donors are not included in the assetsof C. he breakdown of the total of such fundstogether with the funds of the special operations as of 31ecember 2008 and 2007 is as follows:
uring the year ended 31 ecember 2008, a totalof $9,573,000 ($9,310,000 – 2007) was recorded as
compensation for administering projects/programs underrust unds. he amount has been included in “evenuefrom ther ources - net.”
NOTE S—VARIABLE INTEREST ENTITIES
As of 31 ecember 2008, AB did not identify any inwhich AB is the primary beneficiary, requiring consolida-tion in C financial statements. AB may hold signifi-cant variable interests in , which requires disclosures.
he review of AB’s loan, equity investments,and guarantee portfolio, has identified 2 (2 – 2007)
investments in s in which AB is not the primary beneficiary, but in which it is reasonably possible that
AB could be deemed to hold significant variableinterest. AB’s total committed investment in theseentities, comprising disbursed and undisbursed balances,corresponded to the maximum exposure to loss totaling$143,700,000 as of 31 ecember 2008 ($109,200,000– 2007). Based on the most recent available informationfrom these s, the assets of these s totaled$422,912,000 ($376,785,000 – 2007).
OCR-8

7/30/2019 ADB Annual Report 2008 - Financial Report
http://slidepdf.com/reader/full/adb-annual-report-2008-financial-report 73/218
71 Annual Report 2008
ASIAN DEVELOPMENT FUND
Management's Report on Internal Control over Financial Reporting
he management of Asian evelopment Bank (“AB”) is responsible for establishing and
maintaining adequate internal control over financial reporting. AB's internal control overfinancial reporting is a process designed to provide reasonable assurance regarding the reliabil-
ity of financial reporting and the preparation of financial statements for external purposes in
accordance with generally accepted accounting principles in the nited tates of America.
AB's internal control over financial reporting includes those policies and procedures that
(i) pertain to the maintenance of records that, in reasonable detail, accurately and fairly re-
flect the transactions and dispositions of the assets of AB; (ii) provide reasonable assurance
that transactions are recorded as necessary to permit preparation of financial statements in
accordance with generally accepted accounting principles, and that receipts and expenditures
of AB are being made only in accordance with authorizations of management and directors
of AB; and (iii) provide reasonable assurance regarding prevention or timely detection of
unauthorized acquisition, use or disposition of AB's assets that could have a material effecton the financial statements.
Because of its inherent limitations, internal control over financial reporting may not prevent
or detect misstatements. Also, projections of any evaluation of effectiveness to future periods
are subject to the risk that controls may become inadequate because of changes in conditions,
or that the degree of compliance with the policies or procedures may deteriorate.
AB's management assessed the effectiveness of AB's internal control over financial report-
ing as of 31 ecember 2008. n making this assessment, AB's management used the criteria
set forth by the Committee of ponsoring rganizations of the readway Commission in
Internal Control – Integrated Framework. Based on that assessment, management believes that as
of 31 ecember 2008, AB's internal control over financial reporting is effective based uponthe criteria established in Internal Control – Integrated Framework.
aruhiko uroda
resident
Bindu N. ohani
ice resident (inance and Administration)
ong-ang ung
Controller
5 March 2009

7/30/2019 ADB Annual Report 2008 - Financial Report
http://slidepdf.com/reader/full/adb-annual-report-2008-financial-report 74/218
Asian Development Bank72
A S I A N
D E V E L O P M E N T F U N D
PricewaterhouseCoopers LLP (Registration No. T09LL0001D) is an accounting limited liability partnership registered in Singapore under the Limited Liability Partner-ships Act (Chapter 163A). It was converted from a partnership (with the name “PricewaterhouseCoopers” and Registration no. 000640) to an accounting limitedliability partnership on 1 January 2009. PricewaterhouseCoopers LLP is part of the network of member firms of PricewaterhouseCoopers International Limited, eachof which is a separate and independent legal entity.
Report of Independent Auditors to the Asian Development Bank
n our opinion, the accompanying special purpose statements of assets, liabilities, fund balances and
the related special purpose statements of revenues and expenses, cash flows and changes in fund
balances present fairly, in all material respects, the financial position of Asian evelopment Bank (“AB” or “the Bank”)—Asian evelopment und at 31 ecember 2008 and 2007 and the results of
its operations and its cash flows for the years then ended, in conformity with accounting principles
generally accepted in the nited tates of America, with the exception of loan loss provisioning which
has been eliminated with the adoption of special purpose financial statements. Also in our opinion,
management’s assertion that AB maintained effective internal control over financial reporting as of
31 ecember 2008 is fairly stated, in all material respects, based on criteria established in nternal
Control - ntegrated ramework issued by the Committee of ponsoring rganizations of the read-
way Commission (C). he management of AB is responsible for these financial statements, for
maintaining effective internal control over financial reporting and for its assertion of the effectiveness
of internal control over financial reporting, included in the accompanying Management’s eport on
nternal Control over inancial eporting. ur responsibility is to express opinions on these financial
statements and on AB’s internal control over financial reporting based on our integrated audit in
2008 and financial statement audit in 2007. e conducted our audits of the financial statements in
accordance with auditing standards generally accepted in the nited tates of America and our audit
of internal control over financial reporting in accordance with attestation standards established by
the American nstitute of Certified ublic Accountants. hose standards require that we plan and
perform the audits to obtain reasonable assurance about whether the financial statements are free of
material misstatement and whether effective internal control over financial reporting was maintained
in all material respects. ur audits of the financial statements included examining, on a test basis,
evidence supporting the amounts and disclosures in the financial statements, assessing the accounting
principles used and significant estimates made by management, and evaluating the overall financial
statement presentation. ur audit of internal control over financial reporting included obtaining an
understanding of internal control over financial reporting, assessing the risk that a material weakness
exists, and testing and evaluating the design and operating effectiveness of internal control based on
the assessed risk. ur audits also included performing such other procedures as we considered neces-
sary in the circumstances. e believe that our audits provide a reasonable basis for our opinions.
PricewaterhouseCoopers LLP
pwc.com/sg
8 Cross Street #17-00
PWC Building
Singapore 048424Telephone (65) 6236 3388
Facsimile (65) 6236 3300
GST No.: M90362193L
Reg. No.: T09LL0001D

7/30/2019 ADB Annual Report 2008 - Financial Report
http://slidepdf.com/reader/full/adb-annual-report-2008-financial-report 75/218
73 Annual Report 2008
ur audits were conducted for the purpose of forming an opinion on the special purpose financialstatements taken as a whole. he accompanying special purpose statements of loans as at 31 ecem-
ber 2008 and 2007, and of resources as at 31 ecember 2008 are presented for purposes of additional
analyses and are not required parts of the special purpose financial statements. uch information
has been subjected to the auditing procedures applied in the audits of the special purpose financial
statements and in our opinion is fairly stated in all material respects in relation to the special purpose
financial statements taken as a whole.
A company’s internal control over financial reporting is a process effected by those charged with
governance, management, and other personnel, designed to provide reasonable assurance regarding
the preparation of reliable financial statements in accordance with accounting principles generally
accepted in the nited tates of America. A company’s internal control over financial reporting in-
cludes those policies and procedures that (i) pertain to the maintenance of records that, in reasonabledetail, accurately and fairly reflect the transactions and dispositions of the assets of the company;
(ii) provide reasonable assurance that transactions are recorded as necessary to permit preparation of
financial statements in accordance with generally accepted accounting principles, and that receipts and
expenditures of the company are being made only in accordance with authorizations of management
and those charged with governance; and (iii) provide reasonable assurance regarding prevention, or
timely detection of unauthorized acquisition, use, or disposition of the company’s assets that could
have a material effect on the financial statements.
Because of its inherent limitations, internal control over financial reporting may not prevent or detect
misstatements. Also, projections of any evaluation of effectiveness to future periods are subject to
the risk that controls may become inadequate because of changes in conditions, or that the degree
of compliance with the policies or procedures may deteriorate.
ricewaterhouseCoopers
ublic Accountants and Certified ublic Accountants
ingapore
5 March 2009
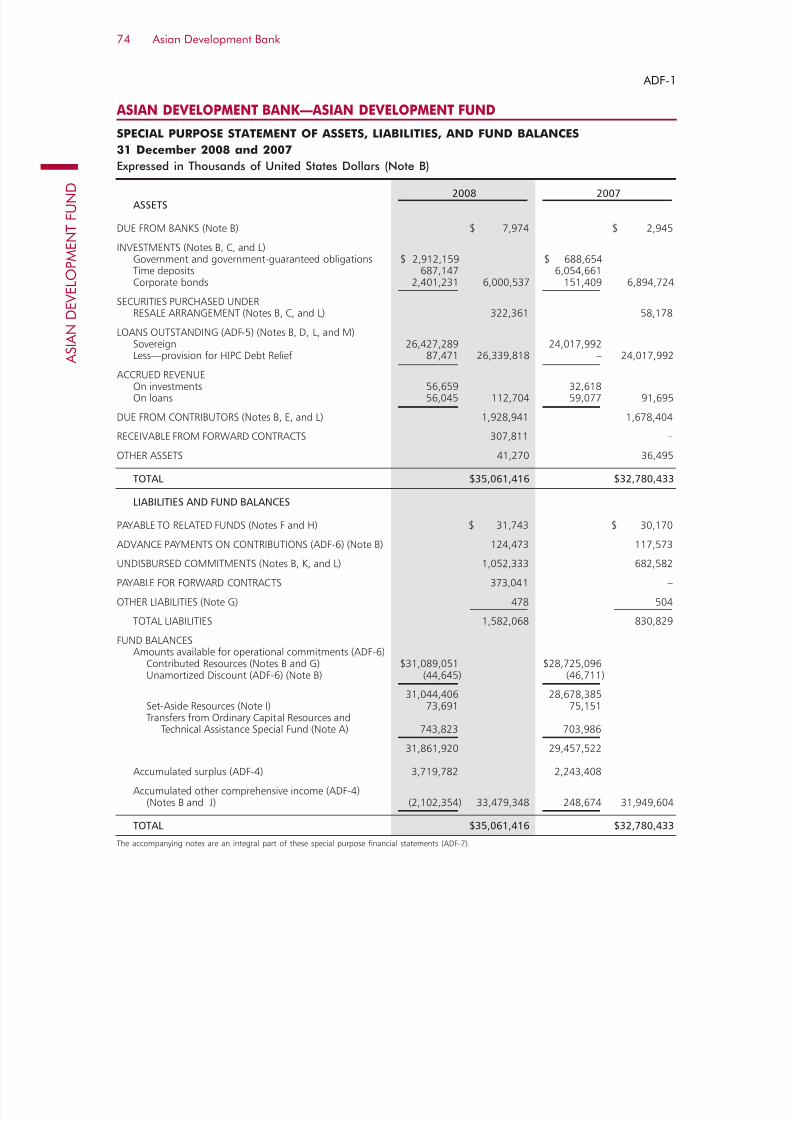
7/30/2019 ADB Annual Report 2008 - Financial Report
http://slidepdf.com/reader/full/adb-annual-report-2008-financial-report 76/218
Asian Development Bank74
A S I A N
D E V E L O P M E N T F U N D
ADF-1
ASIAN DEVELOPMENT BANK—ASIAN DEVELOPMENT FUND
SPECIAL PURPOSE STATEMENT OF ASSETS, LIABILITIES, AND FUND BALANCES
31 December 2008 and 2007
Expressed in Thousands of United States Dollars (Note B)
2008 2007 ASSETS
DUE FROM BANKS (Note B) $ 7,974 $ 2,945
INVESTMENTS (Notes B, C, and L)Government and government-guaranteed obligations $ 2,912,159 $ 688,654Time deposits 687,147 6,054,661Corporate bonds 2,401,231 6,000,537 151,409 6,894,724
SECURITIES PURCHASED UNDERRESALE ARRANGEMENT (Notes B, C, and L) 322,361 58,178
LOANS OUTSTANDING (ADF-5) (Notes B, D, L, and M)Sovereign 26,427,289 24,017,992
Less—provision for HIPC Debt Relief 87,471 26,339,818 – 24,017,992
ACCRUED REVENUEOn investments 56,659 32,618On loans 56,045 112,704 59,077 91,695
DUE FROM CONTRIBUTORS (Notes B, E, and L) 1,928,941 1,678,404
RECEIVABLE FROM FORWARD CONTRACTS 307,811 –
OTHER ASSETS 41,270 36,495
TOTAL $35,061,416 $32,780,433
LIABILITIES AND FUND BALANCES
PAYABLE TO RELATED FUNDS (Notes F and H) $ 31,743 $ 30,170
ADVANCE PAYMENTS ON CONTRIBUTIONS (ADF-6) (Note B) 124,473 117,573
UNDISBURSED COMMITMENTS (Notes B, K, and L) 1,052,333 682,582
PAYABLE FOR FORWARD CONTRACTS 373,041 – OTHER LIABILITIES (Note G) 478 504
TOTAL LIABILITIES 1,582,068 830,829
FUND BALANCESAmounts available for operational commitments (ADF-6)
Contributed Resources (Notes B and G) $31,089,051 $28,725,096Unamortized Discount (ADF-6) (Note B) (44,645) (46,711)
31,044,406 28,678,385
Set-Aside Resources (Note I) 73,691 75,151Transfers from Ordinary Capital Resources andTechnical Assistance Special Fund (Note A) 743,823 703,986
31,861,920 29,457,522
Accumulated surplus (ADF-4) 3,719,782 2,243,408
Accumulated other comprehensive income (ADF-4)(Notes B and J) (2,102,354) 33,479,348 248,674 31,949,604
TOTAL $35,061,416 $32,780,433
The accompanying notes are an integral part of these special purpose financial statements (ADF-7).

7/30/2019 ADB Annual Report 2008 - Financial Report
http://slidepdf.com/reader/full/adb-annual-report-2008-financial-report 77/218
75 Annual Report 2008
ADF-2
ASIAN DEVELOPMENT BANK—ASIAN DEVELOPMENT FUND
SPECIAL PURPOSE STATEMENT OF REVENUE AND EXPENSES
For the Years Ended 31 December 2008 and 2007
Expressed in Thousands of United States Dollars (Note B)
2008 2007
REVENUEFrom loans (Notes B and D) $ 250,568 $ 218,761From investments (Notes B and C) 258,880 317,579From other sources—net 1,066 $ 510,514 1,277 $ 537,617
EXPENSESGrants (Notes B and K) 539,800 377,760Administrative expenses (Note H) 187,138 186,396Amortization of discounts on contributions
(Notes B and G) 6,547 4,237Provision for HIPC Debt Relief (Notes D and M) 89,788 –
Other expenses 17 823,290 25 568,418
NET REALIZED GAINSFrom loans (Note B) 2,088,211 –From investments 362 2,088,573 – –
NET UNREALIZED (LOSSES) GAINS (Note B) (299,423) 13,486
REVENUE IN EXCESS OF (LESS THAN) EXPENSES $1,476,374 $ (17,315)
The accompanying notes are an integral part of these special purpose financial statements (ADF-7).

7/30/2019 ADB Annual Report 2008 - Financial Report
http://slidepdf.com/reader/full/adb-annual-report-2008-financial-report 78/218
Asian Development Bank76
A S I A N
D E V E L O P M E N T F U N D
ADF-3
ASIAN DEVELOPMENT BANK—ASIAN DEVELOPMENT FUND
SPECIAL PURPOSE STATEMENT OF CASH FLOWS
For the Years Ended 31 December 2008 and 2007
Expressed in Thousands of United States Dollars (Note B)
2008 2007
CASH FLOWS FROM OPERATING ACTIVITIESInterest charges on loans received $ 228,544 $ 185,569Interest on investments received 201,334 302,569Interest received from securities under resale arrangement 939 2,022Cash received from other sources 1,066 1,247Administrative expenses paid (184,109) (183,664)Grants disbursed (177,466) (62,804)Financial expenses paid (16) (24)
Net Cash Provided by Operating Activities 70,292 244,915
CASH FLOWS FROM INVESTING ACTIVITIESSales of investments 362 –
Maturities of investments 132,364,873 135,378,128Purchases of investments (131,564,370) (135,503,687)Net payments for securities purchased under resale arrangement (247,866) (3,863)Net payments for forward contracts (12,644) –Principal collected on loans 676,889 586,409Loans disbursed (2,015,224) (1,592,955)
Net Cash Used in Investing Activities (797,980) (1,135,968)
CASH FLOWS FROM FINANCING ACTIVITIESContributions received and encashed1 698,028 847,961Cash received from Ordinary Capital Resources 40,000 40,000
Net Cash Provided by Financing Activities 738,028 887,961
Effect of Exchange Rate Changes on Due from Banks (5,311) 3,435
Net Increase in Due from Banks 5,029 343
Due from Banks at Beginning of Year 2,945 2,602
Due from Banks at End of Year $ 7,974 $ 2,945
RECONCILIATION OF REVENUE IN EXCESS OF (LESS THAN) EXPENSESTO NET CASH PROVIDED BY OPERATING ACTIVITIES:
Revenue in excess of (less than) expenses (ADF-2) $ 1,476,374 $ (17,315)Adjustments to reconcile revenue in excess of (less than) expenses
to net cash provided by operating activities:Amortization of discounts/premiums on investments (26,222) (18,570)Amortization of discounts/premiums on forward contracts (3,089) –Amortization of discount under ANE 6,547 4,237Grants approved and effective 539,800 377,760Capitalized charges on loans (27,421) (24,675)Net loss on sales of investments (362) –
Provision for HIPC debt relief 89,788 –Change in disbursed grants (170,098) (51,051)Change in advances under TA grants (7,333) (11,801)Change in accrued revenue on investments and loans (21,898) (2,934)Change in accrued expenses 2,993 2,780Change in other assets (0) (30)Translation adjustments (1,788,787) (13,486)
Net Cash Provided by Operating Activities $ 70,292 $ 244,915
0 – Less than $500.
1 Supplementary disclosure on noncash financing activities:Nonnegotiable, noninterest-bearing demand promissory notes amounting to $823,323 ($783,246 - 2007) were received from contributing members.
The accompanying notes are an integral part of these special purpose financial statements (ADF-7).

7/30/2019 ADB Annual Report 2008 - Financial Report
http://slidepdf.com/reader/full/adb-annual-report-2008-financial-report 79/218
77 Annual Report 2008
ADF-4
ASIAN DEVELOPMENT BANK—ASIAN DEVELOPMENT FUND
SPECIAL PURPOSE STATEMENT OF CHANGES IN FUND BALANCES
For the Years Ended 31 December 2008 and 2007
Expressed in Thousands of United States Dollars (Note B)
AccumulatedTransfers Other
Contributed Set-Aside from OCR Accumulated ComprehensiveResources Resources & TASF Surplus Income Total
Balance - 1 January 2007 $25,963,646 $71,624 $663,614 $2,260,723 $287,863 $29,247,470
Comprehensive incomefor the year 2007 (Note J) (17,315) (39,189) (56,504)
Change in amounts availablefor operational commitments
Contributed Resources 2,727,913 2,727,913Unamortized Discount (13,174) (13,174)
Transfer from ordinary capital resources 40,000 40,000Change in SDR value of set-aside resources 3,527 3,527Change in value of transfers from
Technical Assistance Special Fund 372 372
Balance - 31 December 2007 $28,678,385 $75,151 $703,986 $2,243,408 $248,674 $31,949,604
Comprehensive incomefor the year 2008 (Note J) 1,476,374 (2,351,028) (874,654)
Change in amounts availablefor operational commitments
Contributed Resources 2,363,955 2,363,955Unamortized Discount 2,066 2,066
Transfer from ordinary capital resources 40,000 40,000Change in SDR value of set-aside resources (1,460) (1,460)
Change in value of transfers fromTechnical Assistance Special Fund (163) (163)
Balance - 31 December 2008 $31,044,406 $73,691 $743,823 $3,719,782 $(2,102,354) $33,479,348
Accumulated Other Comprehensive Income (Note J)
For the Years Ended 31 December 2008 and 2007
Expressed in Thousands of United States Dollars (Note B)
Accumulated Translation Unrealized Investment Accumulated OtherAdjustments Holding Gains (Losses) Comprehensive Income
2008 2007 2008 2007 2008 2007
Balance, 1 January $ 241,638 $ 288,700 $ 7,036 $ (837) $ 248,674 $287,863Other comprehensive income
for the year (2,451,641) (47,062) 100,613 7,873 (2,351,028) (39,189)
Balance, 31 December $(2,210,003) $ 241,638 $107,649 $ 7,036 $(2,102,354) $248,674
The accompanying notes are an integral part of these special purpose financial statements (ADF-7).

7/30/2019 ADB Annual Report 2008 - Financial Report
http://slidepdf.com/reader/full/adb-annual-report-2008-financial-report 80/218
Asian Development Bank78
A S I A N
D E V E L O P M E N T F U N D
ASIAN DEVELOPMENT BANK—ASIAN DEVELOPMENT FUND
SPECIAL PURPOSE SUMMARY STATEMENT OF LOANS
31 December 2008 and 2007
Expressed in Thousands of United States Dollars (Note B)
Undisbursed LoansLoans Balances of Not Yet Total Percent of
Borrowers/Guarantors1 Outstanding Effective Loans2 Effective2 Loans Total Loans
Afghanistan $ 463,601 $ 324,022 $ – $ 787,623 2.39
Armenia 8,100 59,343 17,337 84,780 0.26
Azerbaijan 26,558 31,570 – 58,128 0.18
Bangladesh 5,743,777 1,156,028 84,850 6,984,655 21.16
Bhutan 115,992 56,852 29,148 201,992 0.61
Cambodia 812,591 215,568 – 1,028,159 3.11
Cook Islands 26,770 76 7,002 33,848 0.10
Georgia 72,560 38,141 – 110,701 0.34
Indonesia 1,130,869 463,476 80,500 1,674,845 5.07Kazakhstan 7,353 525 – 7,878 0.02
Kiribati 14,520 – – 14,520 0.04
Kyrgyz Republic 570,858 53,359 – 624,217 1.89
Lao PDR 1,129,607 75,169 – 1,204,776 3.65
Maldives 67,199 24,061 7,078 98,338 0.30
Marshall Islands 67,748 – – 67,748 0.21
Micronesia, Fed. States of 48,699 19,100 – 67,799 0.21
Mongolia 575,286 90,020 – 665,306 2.02
Myanmar 565,751 – – 565,751 1.71
Nepal 1,564,986 328,870 – 1,893,856 5.74
Pakistan 6,403,379 763,024 230,229 7,396,632 22.41
Papua New Guinea 301,809 68,417 104,146 474,372 1.44
Philippines 907,770 – – 907,770 2.75Samoa 84,867 41,645 2,647 129,159 0.39
Solomon Islands 56,169 – – 56,169 0.17
Sri Lanka 2,614,832 403,603 61,996 3,080,431 9.33
Tajikistan 237,101 146,593 – 383,694 1.16
Thailand 45,870 – – 45,870 0.14
Tonga 44,317 – – 44,317 0.13
Tuvalu 6,989 990 – 7,979 0.02
Uzbekistan 26,126 113,257 45,504 184,887 0.56
Vanuatu 53,816 – – 53,816 0.16
Viet Nam 2,630,421 1,107,475 330,708 4,068,604 12.33
Regional 998 593 – 1,591 –
TOTAL – 31 December 2008 26,427,289 5,581,777 1,001,145 33,010,211 100.00Provision for HIPC Debt Relief (87,471) – – (87,471) NET BALANCE –
31 December 2008 $ 26,339,818 $ 5,581,777 $ 1,001,145 $ 32,922,740
NET BALANCE –
31 December 2007 $ 24,017,992 $ 6,127,364 $ 1,048,872 $ 31,194,228
1 Loans other than those made directly to a member or to its central bank have been guaranteed by the member.
2 Loans negotiated before 1 January 1983 were denominated in current United States dollars. Loans negotiated after that date are denominated in Special DrawingRights (SDR) for the purpose of commitment. The undisbursed portions of such SDR loans are translated into United States dollars at the applicable exchange ratesas of the end of a reporting period. Of the undisbursed balances, ADB has entered into irrevocable commitments to disburse various amounts totaling $27,601($49,996 - 2007).

7/30/2019 ADB Annual Report 2008 - Financial Report
http://slidepdf.com/reader/full/adb-annual-report-2008-financial-report 81/218
79 Annual Report 2008
MATURITY OF EFFECTIVE LOANS
Twelve Months Five YearsEnding 31 December Amount Ending 31 December Amount
2009 $ 1,135,914 2018 7,094,0272010 945,246 2023 7,272,1002011 1,059,334 2028 5,751,7822012 1,136,702 2033 4,000,0912013 1,214,380 2038 1,805,918
2043 436,2122048 157,360
Total $ 32,009,066
SUMMARY OF CURRENCIES RECEIVABLE ON LOANS OUTSTANDING
Currency 2008 2007 Currency 2008 2007
Australian dollar $ 59,046 $ 230,396 Norwegian krone 112,091 279,628Canadian dollar 278,119 921,698 Pound sterling 189,337 497,311Danish krone 36,809 82,874 Singapore dollar 86 2,603Euro 2,235,000 5,051,792 Swedish krona 98,374 296,379Japanese yen 6,262,394 11,740,188 Swiss franc 128,826 356,988Korean won 24,536 96,630 Thai baht 863 4,103Malaysian ringgit 875 6,923 United States dollar 2,101,757 3,911,724
New Zealand dollar 1,279 12,958 Special Drawing Rights3
14,897,897 525,797
Total $26,427,289 $24,017,992
3 Basket of currencies defined by the International Monetary Fund consisting of the Euro, Japanese yen, Pound sterling and US dollar.
The accompanying notes are an integral part of these special purpose financial statements (ADF-7).
ADF-5

7/30/2019 ADB Annual Report 2008 - Financial Report
http://slidepdf.com/reader/full/adb-annual-report-2008-financial-report 82/218
Asian Development Bank80
A S I A N
D E V E L O P M E N T F U N D
ADF-6
ASIAN DEVELOPMENT BANK—ASIAN DEVELOPMENT FUND
SPECIAL PURPOSE STATEMENT OF RESOURCES
31 December 2008
Expressed in Thousands of United States Dollars (Note B)
Effective Effective Amounts
Amounts Amounts Committed Not Yet Amounts
Committed At Exchange At 31 December 2008 Available Available
During Rates Per Exchange For Operational For Operational Amounts Amounts
2008 Resolutions Rates Commitments Commitments Received Receivable
CONTRIBUTED RESOURCES
Australia $ – $ 1,528,867 $ 1,317,489 $ – $ 1,317,489 $ 1,317,489 $ –Austria – 196,897 271,000 17,512 253,488 253,488 –Belgium – 181,749 234,752 1,814 232,938 232,938 –Brunei Darussalam1 9,500 9,500 9,500 – 9,500 9,500 –Canada 5,934 1,581,659 1,638,863 18,205 1,620,657 1,620,657 –China, People’s
Republic of – 28,004 28,004 – 28,004 28,004 –
Denmark 1,198 211,781 268,061 3,804 264,257 264,257 –Finland 614 132,515 148,550 1,907 146,644 146,644 –France – 1,096,317 1,359,361 – 1,359,361 1,359,361 –Germany – 1,479,254 2,036,586 104,845 1,931,741 1,931,741 –Hong Kong – 54,459 54,459 – 54,459 54,459 –Indonesia – 14,960 14,960 – 14,960 14,960 –Ireland – 28,046 32,470 – 32,470 32,470 –Italy 112,428 916,215 915,630 – 915,630 915,630 –Japan – 8,602,366 15,759,886 – 15,759,886 15,759,886 –Korea, Rep. of 1,400 267,256 220,135 2,541 217,594 217,594 –Luxembourg – 38,328 47,818 – 47,818 47,818 –Malaysia – 14,667 12,435 – 12,435 12,435 –Nauru – 1,933 1,933 – 1,933 1,433 500The Netherlands – 587,468 798,349 – 798,349 798,349 –New Zealand 295 113,174 100,894 561 100,334 100,334 –Norway – 200,475 187,696 4,255 183,440 183,440 –
Portugal – 65,994 93,709 – 93,709 93,709 –Singapore – 7,734 9,130 – 9,130 9,130 –Spain – 295,384 384,090 4,879 379,211 379,211 –Sweden 1,674 338,996 284,391 5,197 279,194 279,194 –Switzerland – 288,698 444,559 – 444,559 444,559 –Taipei,China – 63,475 60,990 – 60,990 60,990 –Thailand – 9,470 9,019 – 9,019 9,019 –Turkey – 110,520 110,520 2,524 107,996 107,996 –United Kingdom – 1,051,133 868,016 – 868,016 868,016 –United States – 3,767,249 3,767,249 278,054 3,489,195 3,489,195 –
Total 133,042 2 23,284,544 31,490,504 3 446,0984 31,044,4065 31,043,906 6 500
SET-ASIDE RESOURCES – 73,691 – 73,691 73,691 –
TRANSFER FROM ORDINARY CAPITAL RESOURCES 40,000 740,000 – 740,000 740,000 –
TRANSFERS FROM TECHNICALASSISTANCE SPECIAL FUND7 – – 3,823 – 3,823 3,823 –
TOTAL $173,042 $23,284,544 $32,308,018 $446,098 $31,861,920 $31,861,420 $500
Note: Figures may not add due to rounding.
1 Became a member of ADB in June 2006, and have committed and fully paid its contribution to ADF IX in June 2008.2 Except for Brunei and Italy, amounts committed during the year represents the discount due to the accelerated note encashment (ANE).3 Represents amounts committed per Instrument of Contribution including discount on donor’s contributions due to the ANE for ADF IX totaling $56,758.4 Includes the balance of unamortized discount on donor’s contributions due to the ANE for ADF IX totaling $44,645.5 Includes the amortized discount on donor’s contributions due to the ANE for ADF IX totaling $12,113 and the foregone interest received.
6 Excludes advance payments received from donors totaling $124,473, which have not been made available for operational commitments as of 31 December
2008.
7 Includes translation adjustments amounting to $352 as of 31 December 2008.
The accompanying notes are an integral part of these special purpose financial statements (ADF-7).

7/30/2019 ADB Annual Report 2008 - Financial Report
http://slidepdf.com/reader/full/adb-annual-report-2008-financial-report 83/218
ADF-7
81 Annual Report 2008
ASIAN DEVELOPMENT BANK—ASIAN DEVELOPMENT FUND
NOTES TO SPECIAL PURPOSE FINANCIAL STATEMENTS
31 December 2008 and 2007
NOTE A—NATURE OF OPERATIONS
he Asian evelopment und (A) was establishedon 28 une 1974 to more effectively carry out the specialoperations of the Asian evelopment Bank (AB) by providing resources on concessional terms which aremade available almost exclusively to the least developedborrowing countries.
he resources of A have been subsequently augmented by eight replenishments, the most recentof which became effective in April 2005 consistingof $3,302,547,000 in contributions from donors and
$3,700,000,000 from internal resources to cover theoperational requirements for the four-year period from anuary 2005. nder this replenishment, AB wasauthorized to provide financing in the form of grants forprojects and programs of high developmental priority.
n August 2008, the Board of overnors approvedthe resolution providing for the ninth replenishment of the Asian evelopment und (A ) and the fourthregularized replenishment of the echnical Assistancepecial und (A). he resolution provides for asubstantial replenishment of the A to finance AB’sconcessional program for the four-year period from anuary 2009, and for a replenishment of the A in conjunction
with the A replenishment, to finance technicalassistance operations under the fund. otal replenishmentsize is 7,111,290,000, of which 2,641,290,000will come from new donor contributions. onorsagreed to allocate 3% of the total replenishment size(equivalent to 8% of total donor contributions) to A.he replenishment shall be effective upon receiptof the nstruments of Contribution for nqualifiedContribution commitments in an aggregate amountequivalent to at least 1,320,645,000, and such dateshould not be later than 1 uly 2009.
NOTE B— SUMMARY OF SIGNIFICANT
ACCOUNTING POLICIES
n May 2001, the Board of irectors approved theadoption of the special purpose financial statements for
A. ue to the nature and organization of A, thesefinancial statements have been prepared for the spe-cific purpose of reflecting the sources and applicationsof member contributions and are presented in dollarequivalents at the reporting dates. ith the adoption
of the special purpose financial statements, loan lossprovisioning has been eliminated. ith the exceptionsof the aforementioned, the A financial statementsare prepared in accordance with accounting principlesgenerally accepted in the nited tates of America.
n November 2005, to improve A currency management practices, the Board of overnors accepteda resolution to adopt a full-fledged special drawing rights() approach to facilitate resource administration andoperational planning for the benefit of borrowers. hecurrency management framework was implemented on 1
anuary 2006 whereby AB is authorized to convert A
resources held in various currencies into the currencieswhich constitute the , to value disbursements,repayments and loan charges in terms of , and todetermine the value of contributors’ paid-in contributionsand all other resources of the und in terms of , incase of withdrawal of a Contributor or termination of
A.n uly 2007, as an application of the Board-approved
currency management exercise, AB decided to offera full-fledged special drawing rights () approachto A legacy loans by providing A borrowers theoption to convert their existing liability (i.e., disbursedand outstanding loan balance) in various currencies into
, while the undisbursed portions will be treated asnew loans. he conversion was made available beginning1 anuary 2008, and as of 31 ecember 2008, 16 outof 30 A borrowing countries have opted to converttheir loans, which were carried out on the nearest loanservice payment dates from their concurrence. heconversion resulted in a realized gain of $2,088,211,000with a corresponding reduction in other comprehensiveincome.
Functional Currencies and Reporting Currency
he implementation of the full-fledged framework
is expected to change the primary economic environmentof A. ntil this process is completed, and a significantchange in the primary economic environment becomesevident, the currencies of contributing member countriesare functional currencies as these represent the curren-cies of the primary economic environment in which Agenerates and expends cash. he nited tates dollar isthe reporting currency of the fund.
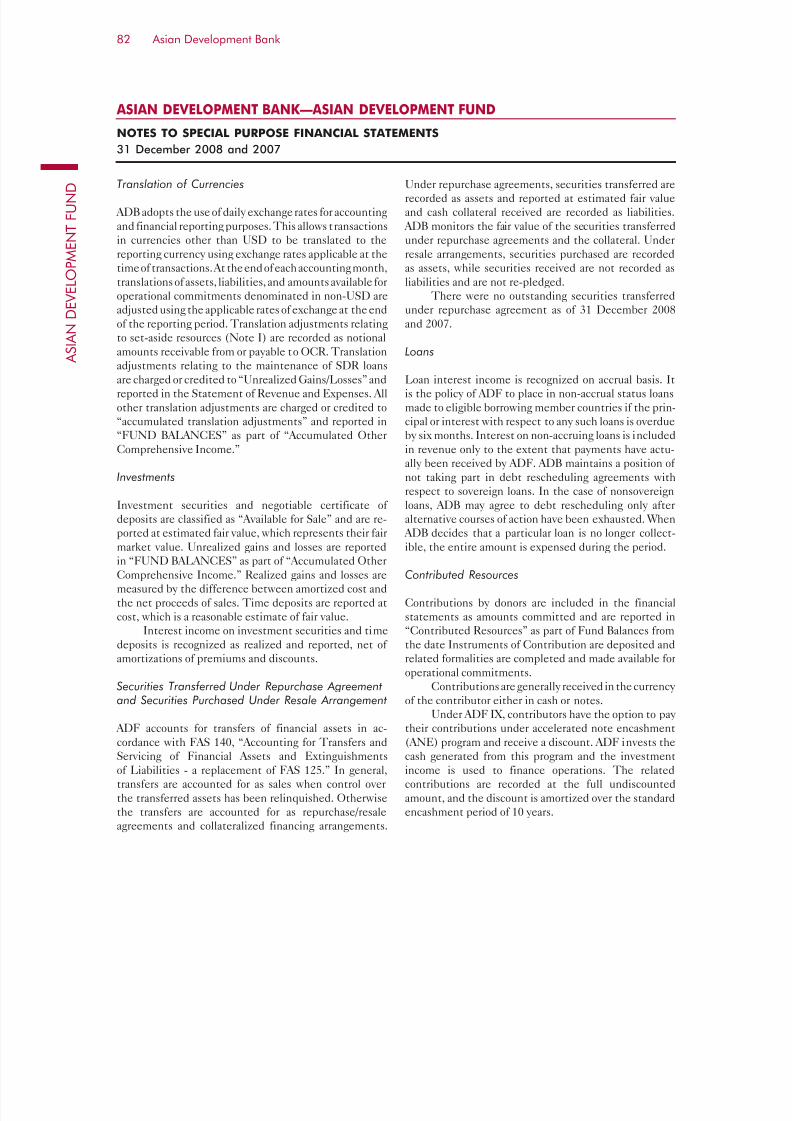
7/30/2019 ADB Annual Report 2008 - Financial Report
http://slidepdf.com/reader/full/adb-annual-report-2008-financial-report 84/218
ASIAN DEVELOPMENT BANK—ASIAN DEVELOPMENT FUND
NOTES TO SPECIAL PURPOSE FINANCIAL STATEMENTS
31 December 2008 and 2007
Asian Development Bank82
A S I A N
D E V E L O P M E N T F U N D Translation of Currencies
AB adopts the use of daily exchange rates for accountingand financial reporting purposes. his allows transactionsin currencies other than to be translated to thereporting currency using exchange rates applicable at thetime of transactions. At the end of each accounting month,translations of assets, liabilities, and amounts available foroperational commitments denominated in non- areadjusted using the applicable rates of exchange at the endof the reporting period. ranslation adjustments relatingto set-aside resources (Note ) are recorded as notional
amounts receivable from or payable to C. ranslationadjustments relating to the maintenance of loansare charged or credited to “nrealized ains/osses” andreported in the tatement of evenue and xpenses. Allother translation adjustments are charged or credited to“accumulated translation adjustments” and reported in“N BAANC” as part of “Accumulated therComprehensive ncome.”
Investments
nvestment securities and negotiable certificate of deposits are classified as “Available for ale” and are re-
ported at estimated fair value, which represents their fairmarket value. nrealized gains and losses are reportedin “N BAANC” as part of “Accumulated therComprehensive ncome.” ealized gains and losses aremeasured by the difference between amortized cost andthe net proceeds of sales. ime deposits are reported atcost, which is a reasonable estimate of fair value.
nterest income on investment securities and timedeposits is recognized as realized and reported, net of amortizations of premiums and discounts.
Securities Transferred Under Repurchase Agreementand Securities Purchased Under Resale Arrangement
A accounts for transfers of financial assets in ac-cordance with A 140, “Accounting for ransfers andervicing of inancial Assets and xtinguishmentsof iabilities - a replacement of A 125.” n general,transfers are accounted for as sales when control overthe transferred assets has been relinquished. therwisethe transfers are accounted for as repurchase/resaleagreements and collateralized financing arrangements.
nder repurchase agreements, securities transferred arerecorded as assets and reported at estimated fair valueand cash collateral received are recorded as liabilities.
AB monitors the fair value of the securities transferredunder repurchase agreements and the collateral. nderresale arrangements, securities purchased are recordedas assets, while securities received are not recorded asliabilities and are not re-pledged.
here were no outstanding securities transferredunder repurchase agreement as of 31 ecember 2008and 2007.
Loans
oan interest income is recognized on accrual basis. tis the policy of A to place in non-accrual status loansmade to eligible borrowing member countries if the prin-cipal or interest with respect to any such loans is overdueby six months. nterest on non-accruing loans is includedin revenue only to the extent that payments have actu-ally been received by A. AB maintains a position of not taking part in debt rescheduling agreements withrespect to sovereign loans. n the case of nonsovereignloans, AB may agree to debt rescheduling only afteralternative courses of action have been exhausted. hen
AB decides that a particular loan is no longer collect-ible, the entire amount is expensed during the period.
Contributed Resources
Contributions by donors are included in the financialstatements as amounts committed and are reported in“Contributed esources” as part of und Balances fromthe date nstruments of Contribution are deposited andrelated formalities are completed and made available foroperational commitments.
Contributions are generally received in the currency of the contributor either in cash or notes.
nder A , contributors have the option to pay their contributions under accelerated note encashment(AN) program and receive a discount. A invests thecash generated from this program and the investmentincome is used to finance operations. he relatedcontributions are recorded at the full undiscountedamount, and the discount is amortized over the standardencashment period of 10 years.
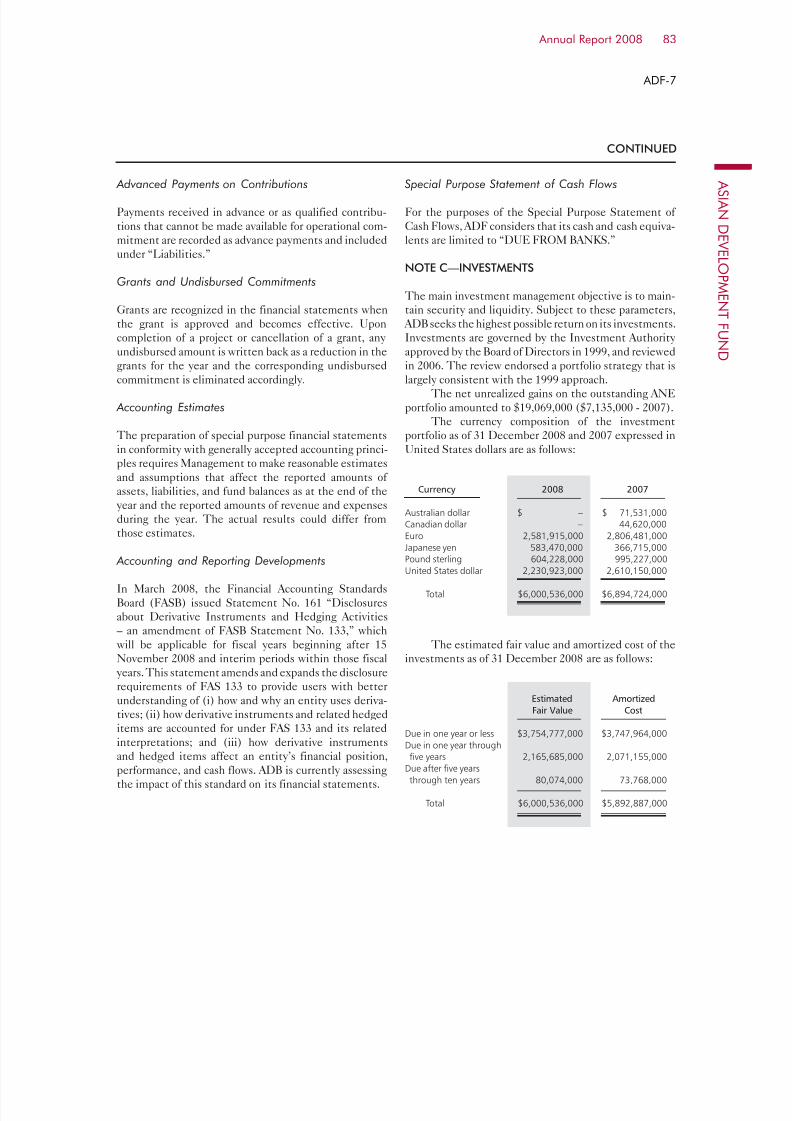
7/30/2019 ADB Annual Report 2008 - Financial Report
http://slidepdf.com/reader/full/adb-annual-report-2008-financial-report 85/218
83 Annual Report 2008
ASIAN DEVELOPMENT BANK—ASIAN DEVELOPMENT FUND
NOTES TO SPECIAL PURPOSE FINANCIAL STATEMENTS
31 December 2008 and 2007
Advanced Payments on Contributions
ayments received in advance or as qualified contribu-tions that cannot be made available for operational com-mitment are recorded as advance payments and includedunder “iabilities.”
Grants and Undisbursed Commitments
rants are recognized in the financial statements whenthe grant is approved and becomes effective. poncompletion of a project or cancellation of a grant, any
undisbursed amount is written back as a reduction in thegrants for the year and the corresponding undisbursedcommitment is eliminated accordingly.
Accounting Estimates
he preparation of special purpose financial statementsin conformity with generally accepted accounting princi-ples requires Management to make reasonable estimatesand assumptions that affect the reported amounts of assets, liabilities, and fund balances as at the end of the
year and the reported amounts of revenue and expensesduring the year. he actual results could differ from
those estimates.
Accounting and Reporting Developments
n March 2008, the inancial Accounting tandardsBoard (AB) issued tatement No. 161 “isclosuresabout erivative nstruments and edging Activities– an amendment of AB tatement No. 133,” whichwill be applicable for fiscal years beginning after 15November 2008 and interim periods within those fiscal
years. his statement amends and expands the disclosurerequirements of A 133 to provide users with betterunderstanding of (i) how and why an entity uses deriva-
tives; (ii) how derivative instruments and related hedgeditems are accounted for under A 133 and its relatedinterpretations; and (iii) how derivative instrumentsand hedged items affect an entity’s financial position,performance, and cash flows. AB is currently assessingthe impact of this standard on its financial statements.
Special Purpose Statement of Cash Flows
or the purposes of the pecial urpose tatement of Cash lows, A considers that its cash and cash equiva-lents are limited to “ M BAN.”
NOTE C—INVESTMENTS
he main investment management objective is to main-tain security and liquidity. ubject to these parameters,
AB seeks the highest possible return on its investments.nvestments are governed by the nvestment Authority
approved by the Board of irectors in 1999, and reviewedin 2006. he review endorsed a portfolio strategy that islargely consistent with the 1999 approach.
he net unrealized gains on the outstanding ANportfolio amounted to $19,069,000 ($7,135,000 - 2007).
he currency composition of the investmentportfolio as of 31 ecember 2008 and 2007 expressed innited tates dollars are as follows:
Currency 2008 2007
Australian dollar $ – $ 71,531,000Canadian dollar – 44,620,000
Euro 2,581,915,000 2,806,481,000Japanese yen 583,470,000 366,715,000Pound sterling 604,228,000 995,227,000United States dollar 2,230,923,000 2,610,150,000
Total $6,000,536,000 $6,894,724,000
he estimated fair value and amortized cost of theinvestments as of 31 ecember 2008 are as follows:
Estimated Amortized
Fair Value Cost
Due in one year or less $3,754,777,000 $3,747,964,000Due in one year throughfive years 2,165,685,000 2,071,155,000
Due after five yearsthrough ten years 80,074,000 73,768,000
Total $6,000,536,000 $5,892,887,000
ADF-7
CONTINUED
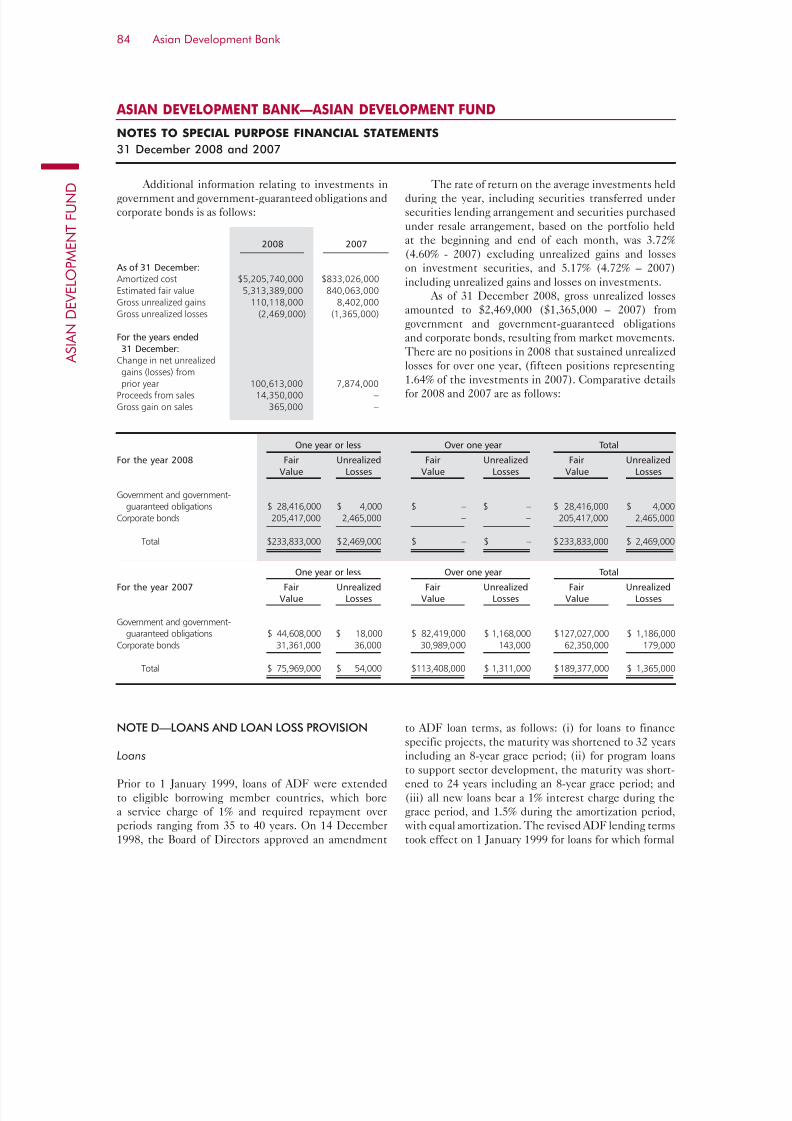
7/30/2019 ADB Annual Report 2008 - Financial Report
http://slidepdf.com/reader/full/adb-annual-report-2008-financial-report 86/218
ASIAN DEVELOPMENT BANK—ASIAN DEVELOPMENT FUND
NOTES TO SPECIAL PURPOSE FINANCIAL STATEMENTS
31 December 2008 and 2007
Asian Development Bank84
A S I A N
D E V E L O P M E N T F U N D Additional information relating to investments in
government and government-guaranteed obligations andcorporate bonds is as follows:
2008 2007
As of 31 December: Amortized cost $5,205,740,000 $833,026,000Estimated fair value 5,313,389,000 840,063,000Gross unrealized gains 110,118,000 8,402,000Gross unrealized losses (2,469,000) (1,365,000) For the years ended31 December:
Change in net unrealizedgains (losses) fromprior year 100,613,000 7,874,000
Proceeds from sales 14,350,000 –Gross gain on sales 365,000 –
he rate of return on the average investments heldduring the year, including securities transferred undersecurities lending arrangement and securities purchasedunder resale arrangement, based on the portfolio heldat the beginning and end of each month, was 3.72%(4.60% - 2007) excluding unrealized gains and losseson investment securities, and 5.17% (4.72% – 2007)including unrealized gains and losses on investments.
As of 31 ecember 2008, gross unrealized lossesamounted to $2,469,000 ($1,365,000 – 2007) fromgovernment and government-guaranteed obligationsand corporate bonds, resulting from market movements.
here are no positions in 2008 that sustained unrealizedlosses for over one year, (fifteen positions representing1.64% of the investments in 2007). Comparative detailsfor 2008 and 2007 are as follows:
One year or less Over one year Total
For the year 2008 Fair Unrealized Fair Unrealized Fair UnrealizedValue Losses Value Losses Value Losses
Government and government-guaranteed obligations $ 28,416,000 $ 4,000 $ – $ – $ 28,416,000 $ 4,000
Corporate bonds 205,417,000 2,465,000 – – 205,417,000 2,465,000
Total $233,833,000 $ 2,469,000 $ – $ – $ 233,833,000 $ 2,469,000
One year or less Over one year Total
For the year 2007 Fair Unrealized Fair Unrealized Fair UnrealizedValue Losses Value Losses Value Losses
Government and government-guaranteed obligations $ 44,608,000 $ 18,000 $ 82,419,000 $ 1,168,000 $ 127,027,000 $ 1,186,000
Corporate bonds 31,361,000 36,000 30,989,000 143,000 62,350,000 179,000
Total $ 75,969,000 $ 54,000 $113,408,000 $ 1,311,000 $ 189,377,000 $ 1,365,000
NOTE D—LOANS AND LOAN LOSS PROVISION
Loans
rior to 1 anuary 1999, loans of A were extendedto eligible borrowing member countries, which borea service charge of 1% and required repayment overperiods ranging from 35 to 40 years. n 14 ecember1998, the Board of irectors approved an amendment
to A loan terms, as follows: (i) for loans to financespecific projects, the maturity was shortened to 32 yearsincluding an 8-year grace period; (ii) for program loansto support sector development, the maturity was short-ened to 24 years including an 8-year grace period; and(iii) all new loans bear a 1% interest charge during thegrace period, and 1.5% during the amortization period,with equal amortization. he revised A lending termstook effect on 1 anuary 1999 for loans for which formal

7/30/2019 ADB Annual Report 2008 - Financial Report
http://slidepdf.com/reader/full/adb-annual-report-2008-financial-report 87/218
ADF-7
85 Annual Report 2008
ASIAN DEVELOPMENT BANK—ASIAN DEVELOPMENT FUND
NOTES TO SPECIAL PURPOSE FINANCIAL STATEMENTS
31 December 2008 and 2007
loan negotiations were completed on or after 1 anuary 1999. A requires borrowers to absorb exchange risksattributable to fluctuations in the value of the currenciesdisbursed.
n eptember 2007, the Board of irectors approveda new hard-term A lending facility. he facility willhave a fixed interest rate of 150 basis points below theweighted average of the ten-year fixed swap rates of thespecial drawing rights component currencies plus theC lending spread, or the current A rate, whicheveris higher. ther terms are similar to those of regular Aloans. he interest rate will be reset every anuary and
will apply to all hard-term loans approved that year andwill be fixed for the life of the loan. or hard-term Aloans approved in 2008, the interest rate was set at 3.15%(3.85% – 2007). hree loans were approved under thisfacility in 2008 (nil – 2007).
AB believes that there is no comparable market,nor AB intends to sell A loans. he use of marketdata to arrive at the loan at fair value will give meaninglessresults. As such, the fair value of loans is determined basedon the terms at which a similar loan would currently bemade by AB to a similar borrower. or such loans, fair
value approximates the carrying amount. he estimatedfair value of loans is not affected by credit risks because
the amount of any such adjustment is not considered tohave a material effect based on AB's experience withits borrowers.
ndisbursed loan commitments and an analysis of loans by country as of 31 ecember 2008 are shown in
A-5. As of 31 ecember 2008 and 2007, loans to borrowers
that exceeded 5% of the total loans outstanding were asfollows:
2008 2007
Pakistan $ 6,403,379,000 $ 5,444,555,000Bangladesh 5,743,777,000 5,399,187,000
Vietnam, SocialistRepublic of 2,630,421,000 2,298,804,000Sri Lanka 2,614,832,000 2,539,657,000Nepal 1,564,986,000 1,486,034,000Others (individually lessthan 5% of total loans) 7,469,894,000 6,849,755,000
Total Outstanding Loans 26,427,289,000 $24,017,992,000
Provision for HIPCDebt Relief (87,471,000) –
Net Outstanding Loans $26,339,818,000 $24,017,992,000
he principal amount outstanding of sovereignloans in non-accrual status as of 31 ecember 2008was $565,751,000 ($488,901,000 – 2007) of which$263,444,000 ($209,477,000 - 2007) was overdue. oansin non-accrual status resulted in $5,176,000 ($4,691,000– 2007) not being recognized as income from loans forthe year ended 31 ecember 2008. he accumulatedinterest on these loans that was not recognized as incomeas of 31 ecember 2008 would have totaled $63,802,000($50,260,000 – 2007). he loans in non-accrual statusas of 31 ecember 2008 were 28 loans to Myanmarrepresenting 2.1% of the total outstanding loans (28
loans to Myanmar – 2007).uring the period, provision for C debt relief amounting to $89,788,000 relating to the Afghanistandebt relief under the C initiative was recognized andcharged to income. f this amount, a total of $527,000 waswritten-off as the loan service payments of some affectedloans fell due. his brought the balance of rovision forC debt relief as of 31 ecember 2008, including theeffects of translation adjustments, to $87,471,000 (nil– 31 ecember 2007) (ee Note M).
NOTE E—DUE FROM CONTRIBUTORS
ncluded in “ue rom Contributors” are notes of contributors and contributions receivable. Notes of contributors are non-negotiable, non-interest-bearingand, subject to certain restrictions imposed by applicableBoard of overnors' resolutions, encashable by AB atpar upon demand.
AB currently expects that the notes outstandingat 31 ecember 2008 will be encashed in varying amountsover a six-year period ending 31 ecember 2014.
he fair value of notes of contributors is determinedbased on the terms at which notes are currently beingaccepted from contributors. n this basis, the fair valueof outstanding notes of contributors approximates their
carrying amount.
NOTE F—PAYABLE TO RELATED FUNDS
he C and special fund resources are at all timesused, committed, and invested entirely separate fromeach other. he administrative and operational expensespertaining to the C and A are allocated based onoperational activities and are settled regularly. nder
A and third regularized replenishment of echnical
CONTINUED
7/30/2019 ADB Annual Report 2008 - Financial Report
http://slidepdf.com/reader/full/adb-annual-report-2008-financial-report 88/218
ASIAN DEVELOPMENT BANK—ASIAN DEVELOPMENT FUND
NOTES TO SPECIAL PURPOSE FINANCIAL STATEMENTS
31 December 2008 and 2007
Asian Development Bank86
A S I A N
D E V E L O P M E N T F U N D Assistance pecial und (A), a specific portion of
the total contributions are to be allocated to A. Areceives all contributions of members and subsequently transfers A’s portion to A.
As of 31 ecember 2008, $31,743,000 representingadministration charges was payable to C ($28,750,000– 2007). No payable to A was outstanding in 2008while $1,419,000 in 2007 corresponds to contributionsfrom donors incorporated in A for the thirdregularized replenishment of A.
NOTE G—CONTRIBUTED RESOURCES/
OTHER LIABILITIES
As of 31 ecember 2008, contributions from 30 donors to-taling $3,431,219,000 (28 donors totaling $3,290,116,000– 2007) were committed for A . f these, contribu-tions totaling $3,153,949,000 ($2,270,884,000 – 2007),including amortized discount totaling $12,112,000($7,523,000 – 2007), were received and made availablefor operational commitment. hese were recorded in“Contributed esources.”
n May 2008, the Board of overnors approved theallocation of $40,000,000 from C's 2007 net incometo A.
As of 31 ecember 2008, taly's promissory notereceived under A has a remaining balance of €342,000 ($481,000 equivalent). his was recorded ineferred Credits and included in “ther liabilities.”
NOTE H—ADMINISTRATIVE EXPENSES AND ADMINISTRATION CHARGE
Administrative expenses represent administration chargefrom C which is an apportionment of all administra-tive expenses of AB (other than those pertainingdirectly to ordinary operations and special operations),in the proportion of the relative volume of operational
activities of each fund.
NOTE I—SET-ASIDE RESOURCES
ursuant to the provisions of Article 19, paragraph 1(i)of the Articles of Agreement stablishing the Asianevelopment Bank (the Charter), the Board of overnorshas authorized the setting aside of 10% of the unimpaired“paid-in” capital paid by member countries pursuantto Article 6, paragraph 2(a) of the Charter and of the
convertible currency portion paid by member countriespursuant to Article 6, paragraph 2(b) of the Charter as of 28 April 1973, to be used as a part of the pecial undsof AB. he capital so set aside was allocated and trans-ferred from the C to A as et-Aside esources.
he capital stock of AB is defined in Article 4,paragraph 1 of the Charter, “in terms of nited tatesdollars of the weight and fineness in effect on 31 anuary 1966” (the 1966 dollar). herefore, et-Aside esourceshad historically been translated into the current nitedtates dollar (AB's unit of account), on the basis of itspar value in terms of gold. rom 1973 until 31 March
1978, the rate arrived at on this basis was $1.20635per 1966 dollar. ince 1 April 1978, at which time theecond Amendment to the Articles of Agreement of thenternational Monetary und (M) came into effect,currencies no longer had par values in terms of gold.ending AB's selection of the appropriate successor tothe 1966 dollar, the et-Aside esources have been valuedfor purposes of the accompanying financial statements interms of the pecial rawing ight (), at the valuein current nited tates dollars as computed by the M.
As of 31 ecember 2008, the value of the in terms of the current nited tates dollar was $1.54781 ($1.57848- 2007). n this basis, et-Aside esources amounted to
$73,691,000 ($75,151,000 - 2007). f the capital stock of AB as of 31 ecember 2008 had been valued in termsof $12,063.50 per share, et-Aside esources would havebeen $57,434,000.
NOTE J—COMPREHENSIVE INCOME
Comprehensive ncome has two major components:revenue in excess of (less than) expenses and othercomprehensive income. ther Comprehensive ncomeincludes unrealized gains and losses on “Available forale” securities and translation adjustments of functionalcurrencies.
NOTE K—GRANTS AND UNDISBURSEDCOMMITMENTS
he A introduced financing in the form of grantsfor the first time. As of 31 ecember 2008 and 2007, 27grants amounting to $707,360,000 and 24 grants amount-ing to $519,340,000 were approved, respectively. uringthe year, grants totaling $539,800,000 ($377,760,000– 2007) became effective.

7/30/2019 ADB Annual Report 2008 - Financial Report
http://slidepdf.com/reader/full/adb-annual-report-2008-financial-report 89/218
ADF-7
87 Annual Report 2008
ASIAN DEVELOPMENT BANK—ASIAN DEVELOPMENT FUND
NOTES TO SPECIAL PURPOSE FINANCIAL STATEMENTS
31 December 2008 and 2007
he fair value of undisbursed commitmentsapproximates the amount outstanding, because ABexpects that disbursements will substantially be made forall the projects/programs covered by the commitments.
NOTE L—FAIR VALUE MEASUREMENTS
A 157 defines fair value as the price that would bereceived to sell an asset or paid to transfer a liability atmeasurement date (exit price) in an orderly transactionamong willing participants with an assumption that thetransaction takes place in the entity’s principal market,
the most advantageous market for the asset or liability.he most advantageous market is the market where thesale of the asset or transfer of liability would maximize theamount received for the asset or minimize the amountpaid to transfer the liability. he fair value measurementis not adjusted for transaction cost.
A 157 also establishes a fair value hierarchy that gives the highest priority to quoted prices inactive markets for identical assets or liabilities (evel
1), next priority to observable market inputs or marketcorroborated data (evel 2), and the lowest priority tounobservable inputs without market corroborated data(evel 3). A 157 requires the fair value measurementto maximize the use of market observable inputs.
he following guidelines are applied in determiningthe fair values of financial instruments:
Investments, forward contracts, and securities purchased under resale arrangements
eadily marketable investments are fair valued using ac-
tive market quotes in evel 1 category. evel 2 category includes investments, resale arrangements, and forwardcontracts which are fair valued with significant othermarket observable inputs. orward foreign exchangecontracts are fair valued using discounted cash flowmodels.
he fair value of the following financial assets of A as of 31 ecember 2008 were reported based onthe following:
CONTINUED
Fair Value Measurements
Quoted Prices in Significant SignificantActive Markets for Other Observable UnobservableIdentical Assets Inputs Inputs
31 December 2008 (Level 1) (Level 2) (Level 3)
Assets Investments $6,000,536,000 $3,951,007,000 $2,049,529,000 $ –Securities purchased under
resale arrangement 322,361,000 – 322,361,000 –Receivable - forward contracts 307,811,000 – 307,811,000 –
Total $6,630,708,000 $3,951,007,000 $2,679,701,000 $ – Liabilities
Payable - forward contracts $ 373,041,000 $ – $ 373,041,000 $ –
ee Notes C, , , and for discussions relatingto investments, loans, due from contributors, andundisbursed commitments. n all other cases, thecarrying amounts of A's assets, liabilities, and fundbalances are considered to approximate fair values for allsignificant financial instruments.
NOTE M—HEAVILY INDEBTED POOR COUNTRIES(HIPC) INITIATIVE
n April 2008, the Board of overnors adopted theresolution on roviding eavily ndebted oor Countries(C) elief from Asian evelopment und ebt, for
AB to participate in the C debt relief initiative.
7/30/2019 ADB Annual Report 2008 - Financial Report
http://slidepdf.com/reader/full/adb-annual-report-2008-financial-report 90/218
ASIAN DEVELOPMENT BANK—ASIAN DEVELOPMENT FUND
NOTES TO SPECIAL PURPOSE FINANCIAL STATEMENTS
31 December 2008 and 2007
Asian Development Bank88
A S I A N
D E V E L O P M E N T F U N D he C debt relief initiative was launched in
1996 by the nternational evelopment Association(A) and nternational Monetary und (M) toaddress the debt problems of heavily indebted poorcountries to ensure that reform efforts in these countriesare not put at risk due to their high external debt burden.nder the C debt relief initiative, all bilateral and
multilateral creditors provide debt relief for countriesthat demonstrated good policy performance over anextended period to bring their debt service burden tosustainable level. As of 31 ecember 2008, Afghanistanis the only borrower that has qualified for C debtrelief.
ADF-7

7/30/2019 ADB Annual Report 2008 - Financial Report
http://slidepdf.com/reader/full/adb-annual-report-2008-financial-report 91/218
89 Annual Report 2008
TECHNICAL ASSISTANCE SPECIAL FUND
Management's Report on Internal Control over Financial Reporting
he management of Asian evelopment Bank (“AB”) is responsible for establishing and
maintaining adequate internal control over financial reporting. AB's internal control overfinancial reporting is a process designed to provide reasonable assurance regarding the reliabil-
ity of financial reporting and the preparation of financial statements for external purposes in
accordance with generally accepted accounting principles in the nited tates of America.
AB's internal control over financial reporting includes those policies and procedures that
(i) pertain to the maintenance of records that, in reasonable detail, accurately and fairly re-
flect the transactions and dispositions of the assets of AB; (ii) provide reasonable assurance
that transactions are recorded as necessary to permit preparation of financial statements in
accordance with generally accepted accounting principles, and that receipts and expenditures
of AB are being made only in accordance with authorizations of management and directors
of AB; and (iii) provide reasonable assurance regarding prevention or timely detection of
unauthorized acquisition, use or disposition of AB's assets that could have a material effecton the financial statements.
Because of its inherent limitations, internal control over financial reporting may not prevent
or detect misstatements. Also, projections of any evaluation of effectiveness to future periods
are subject to the risk that controls may become inadequate because of changes in conditions,
or that the degree of compliance with the policies or procedures may deteriorate.
AB's management assessed the effectiveness of AB's internal control over financial report-
ing as of 31 ecember 2008. n making this assessment, AB's management used the criteria
set forth by the Committee of ponsoring rganizations of the readway Commission in
Internal Control – Integrated Framework. Based on that assessment, management believes that as
of 31 ecember 2008, AB's internal control over financial reporting is effective based uponthe criteria established in Internal Control – Integrated Framework.
aruhiko uroda
resident
Bindu N. ohani
ice resident (inance and Administration)
ong-ang ung
Controller
5 March 2009

7/30/2019 ADB Annual Report 2008 - Financial Report
http://slidepdf.com/reader/full/adb-annual-report-2008-financial-report 92/218
Asian Development Bank90
T E C H N I C A L A S S I S T
A N C E S P E C I A L F U N D
Report of Independent Auditors to the Asian Development Bank
n our opinion, the accompanying statements of financial position and the related statements of ac-
tivities and changes in net assets and cash flows present fairly, in all material respects, the financial
position of the Asian evelopment Bank (“AB” or “the Bank”)—echnical Assistance pecial und
at 31 ecember 2008 and 2007, and the results of its activities and changes in net assets and its cash
flows for the years then ended, in conformity with accounting principles generally accepted in the
nited tates of America. Also in our opinion, management’s assertion that AB maintained effective
internal control over financial reporting as of 31 ecember 2008 is fairly stated, in all material respects,
based on criteria established in nternal Control – ntegrated ramework issued by the Committee of
ponsoring rganizations of the readway Commission (C). he management of AB is respon-
sible for these financial statements, for maintaining effective internal control over financial reporting
and for its assertion of the effectiveness of internal control over financial reporting, included in the
accompanying Management's eport on nternal Control over inancial eporting. ur responsibil-
ity is to express opinions on these financial statements and on AB’s internal control over financial
reporting based on our integrated audit in 2008 and financial statement audit in 2007. e conducted
our audits of the financial statements in accordance with auditing standards generally accepted inthe nited tates of America and our audit of internal control over financial reporting in accordance
with attestation standards established by the American nstitute of Certified ublic Accountants.
hose standards require that we plan and perform the audits to obtain reasonable assurance about
whether the financial statements are free of material misstatement and whether effective internal
control over financial reporting was maintained in all material respects. ur audits of the financial
statements included examining, on a test basis, evidence supporting the amounts and disclosures in
the financial statements, assessing the accounting principles used and significant estimates made
by management, and evaluating the overall financial statement presentation. ur audit of internal
control over financial reporting included obtaining an understanding of internal control over financial
reporting, assessing the risk that a material weakness exists, and testing and evaluating the design
and operating effectiveness of internal control based on the assessed risk. ur audits also included
performing such other procedures as we considered necessary in the circumstances. e believe thatour audits provide a reasonable basis for our opinions.
PricewaterhouseCoopers LLP
pwc.com/sg
8 Cross Street #17-00
PWC Building
Singapore 048424Telephone (65) 6236 3388
Facsimile (65) 6236 3300
GST No.: M90362193L
Reg. No.: T09LL0001D
PricewaterhouseCoopers LLP (Registration No. T09LL0001D) is an accounting limited liability partnership registered in Singapore under the Limited Liability Partner-ships Act (Chapter 163A). It was converted from a partnership (with the name “PricewaterhouseCoopers” and Registration no. 000640) to an accounting limitedliability partnership on 1 January 2009. PricewaterhouseCoopers LLP is part of the network of member firms of PricewaterhouseCoopers International Limited, eachof which is a separate and independent legal entity.

7/30/2019 ADB Annual Report 2008 - Financial Report
http://slidepdf.com/reader/full/adb-annual-report-2008-financial-report 93/218
91 Annual Report 2008
ur audits were conducted for the purpose of forming an opinion on the basic financial state-ments taken as a whole. he accompanying statement of resources as at 31 ecember 2008
and summary statement of technical assistance approved and effective for the year ended
31 ecember 2008 are presented for purposes of additional analyses and are not required parts of
the basic financial statements. uch information has been subjected to the auditing procedures ap-
plied in the audits of the basic financial statements and in our opinion, is fairly stated in all material
respects in relation to the basic financial statements taken as a whole.
A company’s internal control over financial reporting is a process effected by those charged with
governance, management, and other personnel, designed to provide reasonable assurance regarding
the preparation of reliable financial statements in accordance with accounting principles generally
accepted in the nited tates of America. A company’s internal control over financial reporting in-
cludes those policies and procedures that (i) pertain to the maintenance of records that, in reasonabledetail, accurately and fairly reflect the transactions and dispositions of the assets of the company;
(ii) provide reasonable assurance that transactions are recorded as necessary to permit preparation of
financial statements in accordance with generally accepted accounting principles, and that receipts and
expenditures of the company are being made only in accordance with authorizations of management
and those charged with governance; and (iii) provide reasonable assurance regarding prevention, or
timely detection of unauthorized acquisition, use, or disposition of the company’s assets that could
have a material effect on the financial statements.
Because of its inherent limitations, internal control over financial reporting may not prevent or detect
misstatements. Also, projections of any evaluation of effectiveness to future periods are subject to
the risk that controls may become inadequate because of changes in conditions, or that the degree
of compliance with the policies or procedures may deteriorate.
ricewaterhouseCoopers
ublic Accountants and Certified ublic Accountants
ingapore
5 March 2009

7/30/2019 ADB Annual Report 2008 - Financial Report
http://slidepdf.com/reader/full/adb-annual-report-2008-financial-report 94/218
Asian Development Bank92
T E C H N I C A L A S S I S T
A N C E S P E C I A L F U N D
TASF-1
ASIAN DEVELOPMENT BANK—TECHNICAL ASSISTANCE SPECIAL FUND
STATEMENT OF FINANCIAL POSITION
31 December 2008 and 2007
Expressed in Thousands of United States Dollars (Note B)
2008 2007
ASSETS
DUE FROM BANKS (Note B) $ 1,692 $ 1,306
INVESTMENTS (Notes B, C, and G)Time deposits $156,114 $295,078Corporate bonds 139,429 295,543 – 295,078
SECURITIES PURCHASED UNDERRESALE ARRANGEMENT (Notes B and G) 111 –
ACCRUED REVENUE 124 788
DUE FROM CONTRIBUTORS (Notes B and F) 17,304 68,489
OTHER ASSETS (Note D) 10,674 11,264
TOTAL $325,448 $376,925
LIABILITIES AND UNCOMMITTED BALANCES
MISCELLANEOUS LIABILITIES (Note D) $ 19 $ 88
UNDISBURSED COMMITMENTS (Notes B, E, and G) 222,722 183,718
UNCOMMITTED BALANCES (TASF-2 and TASF-4) (Notes B and F),represented by:
Unrestricted net assets 102,707 193,119
TOTAL $325,448 $376,925
The accompanying notes are an integral part of these financial statements (TASF-6).

7/30/2019 ADB Annual Report 2008 - Financial Report
http://slidepdf.com/reader/full/adb-annual-report-2008-financial-report 95/218
93 Annual Report 2008
TASF-2
ASIAN DEVELOPMENT BANK—TECHNICAL ASSISTANCE SPECIAL FUND
STATEMENT OF ACTIVITIES AND CHANGES IN NET ASSETS
For the Years Ended 31 December 2008 and 2007
Expressed in Thousands of United States Dollars (Note B)
2008 2007
CHANGES IN UNRESTRICTED NET ASSETS
CONTRIBUTIONS (TASF-4) (Notes B and F) $ 30,269 $ 52
REVENUEFrom investments (Notes B and C) 10,880 14,162From other sources—net (Note E) 138 195
Total 41,287 14,409
EXPENSESTechnical assistance—net (TASF-5) (Notes B and E) 108,159 77,532Financial expenses 8 5
Total 108,167 77,537
CONTRIBUTIONS AND REVENUE LESS THAN EXPENSES (66,880) (63,128)
EXCHANGE (LOSSES) GAINS—net (Note B) (23,532) 35,714
DECREASE IN NET ASSETS (90,412) (27,414)
NET ASSETS AT BEGINNING OF YEAR 193,119 220,533
NET ASSETS AT END OF YEAR $102,707 $193,119The accompanying notes are an integral part of these financial statements (TASF-6).

7/30/2019 ADB Annual Report 2008 - Financial Report
http://slidepdf.com/reader/full/adb-annual-report-2008-financial-report 96/218
Asian Development Bank94
T E C H N I C A L A S S I S T
A N C E S P E C I A L F U N D
TASF-3
ASIAN DEVELOPMENT BANK—TECHNICAL ASSISTANCE SPECIAL FUND
STATEMENT OF CASH FLOWS
For the Years Ended 31 December 2008 and 2007
Expressed in Thousands of United States Dollars (Note B)
2008 2007 CASH FLOWS FROM OPERATING ACTIVITIES
Contributions received $ 85,526 $ 51,698Interest on investments received 9,972 14,721Cash received from other sources 172 199Technical assistance disbursed (70,044) (77,872)Financial expenses paid (9) (5)
Net Cash Provided by (Used in) Operating Activities 25,617 (11,259) CASH FLOWS FROM INVESTING ACTIVITIES
Maturities of investments 11,780,926 3,513,304Purchases of investments (11,804,622) (3,502,634)Net payments for securities purchased under resale arrangement (290) (198)
Net Cash (Used in) Provided by Investing Activities (23,986) 10,472
Effect of Exchange Rate Changes on Due from Banks (1,245) 265
Net Increase (Decrease) in Due from Banks 386 (522) Due from Banks at Beginning of Year 1,306 1,828
Due from Banks at End of Year $ 1,692 $ 1,306
RECONCILIATION OF DECREASE IN NET ASSETSTO NET CASH PROVIDED BY (USED IN) OPERATING ACTIVITIES:
Decrease in net assets (TASF-2) $ (90,412) $ (27,414)Adjustments to reconcile decrease in net assets
to net cash provided by (used in) operating activities:Amortization of discounts/premiums on investments (1,529) –Change in accrued revenue 622 558Change in due from contributors 47,187 49,918Change in other assets (826) 35Change in miscellaneous liabilities (64) (29)Change in undisbursed commitments 39,004 (344)Translation adjustments 31,635 (33,983)
Net Cash Provided by (Used in) Operating Activities $ 25,617 $ (11,259)
The accompanying notes are an integral part of these financial statements (TASF-6).

7/30/2019 ADB Annual Report 2008 - Financial Report
http://slidepdf.com/reader/full/adb-annual-report-2008-financial-report 97/218
95 Annual Report 2008
TASF-4
ASIAN DEVELOPMENT BANK—TECHNICAL ASSISTANCE SPECIAL FUND
STATEMENT OF RESOURCES
31 December 2008
Expressed in Thousands of United States Dollars (Note B)
Contributions DirectCommitted Voluntary Regularized Total
During 2008 Contributions Replenishment1 Contributions
DIRECT VOLUNTARY CONTRIBUTIONS
Australia $ – $ 2,484 $ 29,368 $ 31,852Austria – 159 3,793 3,952Bangladesh – 47 – 47Belgium – 1,394 3,207 4,601Canada – 3,346 26,638 29,984China, People’s Rep. of – 1,600 1,996 3,596Denmark – 1,963 4,034 5,997
Finland – 237 2,058 2,295France – 1,698 20,969 22,667Germany – 3,315 26,642 29,957Hong Kong, China – 100 1,397 1,497India 250 3,310 – 3,310Indonesia – 250 40 290Italy 6,950 774 16,320 17,094Japan – 47,710 157,606 205,316Korea, Rep. of – 1,900 8,104 10,004Luxembourg – – 238 238Malaysia – 909 333 1,242Nauru – – 67 67The Netherlands – 1,338 11,823 13,161New Zealand – 1,096 2,234 3,330
Norway – 3,279 4,308 7,587Pakistan 70 1,736 – 1,736Portugal – – 1,344 1,344Singapore – 1,100 266 1,366Spain – 190 6,189 6,379Sri Lanka – 6 – 6Sweden – 861 6,855 7,716Switzerland – 1,035 5,463 6,498Taipei,China – 200 1,710 1,910Thailand – – 202 202Turkey – – 2,720 2,720United Kingdom – 5,617 21,662 27,279United States – 1,500 65,031 66,531
Total $ 7,269 $ 89,154 $ 432,617 $ 521,771
Transfers to Asian Development Fund (3,472)
Allocation from OCR Net Income 23,000 706,000
Other Resources2 178,257
TOTAL $30,269 $1,402,556
Note: Figures may not add to total due to rounding.1 Represents TASF portion of contributions to the replenishment of the Asian Development Fund and the Technical Assistance Special Fund authorized by Governors’
Resolution Nos. 182, 214 and 300 at historical values.2 Represents income, repayments, and reimbursement accruing to TASF since 1980.
The accompanying notes are an integral part of these financial statements (TASF-6).
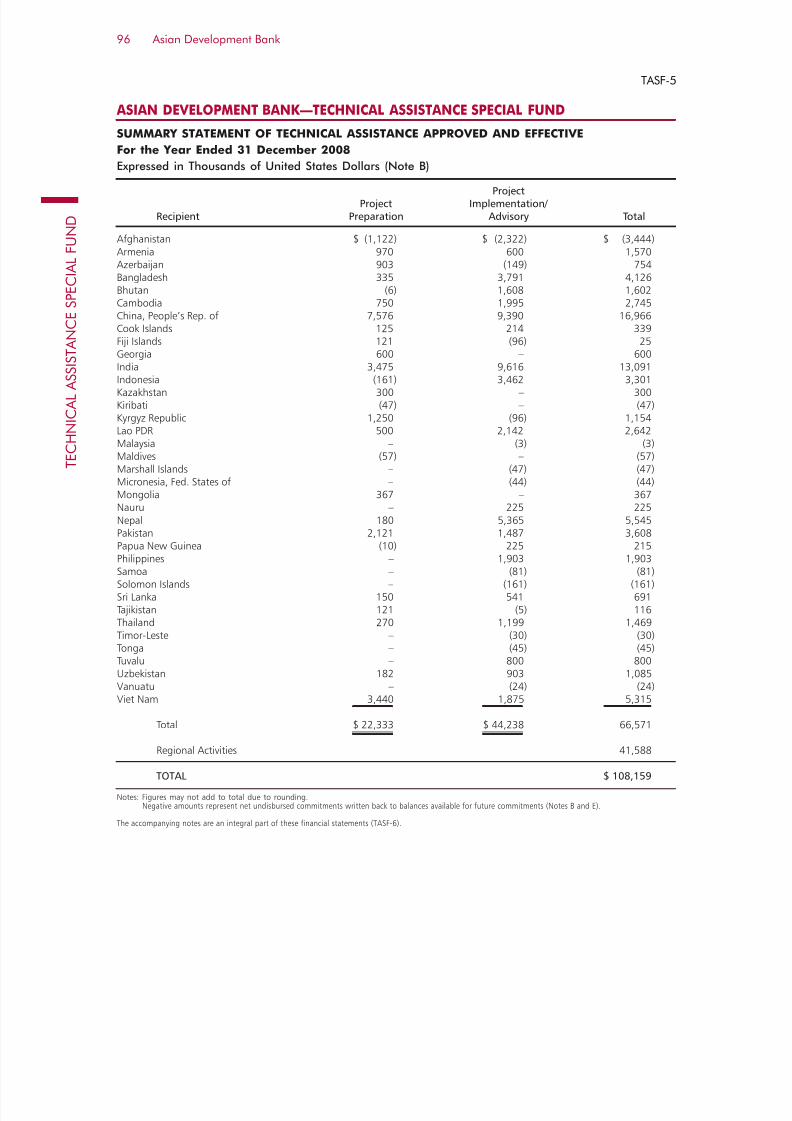
7/30/2019 ADB Annual Report 2008 - Financial Report
http://slidepdf.com/reader/full/adb-annual-report-2008-financial-report 98/218
Asian Development Bank96
T E C H N I C A L A S S I S T
A N C E S P E C I A L F U N D
TASF-5
ASIAN DEVELOPMENT BANK—TECHNICAL ASSISTANCE SPECIAL FUND
SUMMARY STATEMENT OF TECHNICAL ASSISTANCE APPROVED AND EFFECTIVE
For the Year Ended 31 December 2008
Expressed in Thousands of United States Dollars (Note B)
ProjectProject Implementation/
Recipient Preparation Advisory Total
Afghanistan $ (1,122) $ (2,322) $ (3,444)Armenia 970 600 1,570Azerbaijan 903 (149) 754Bangladesh 335 3,791 4,126Bhutan (6) 1,608 1,602Cambodia 750 1,995 2,745China, People’s Rep. of 7,576 9,390 16,966Cook Islands 125 214 339Fiji Islands 121 (96) 25
Georgia 600 – 600India 3,475 9,616 13,091Indonesia (161) 3,462 3,301Kazakhstan 300 – 300Kiribati (47) – (47)Kyrgyz Republic 1,250 (96) 1,154Lao PDR 500 2,142 2,642Malaysia – (3) (3)Maldives (57) – (57)Marshall Islands – (47) (47)Micronesia, Fed. States of – (44) (44)Mongolia 367 – 367Nauru – 225 225Nepal 180 5,365 5,545
Pakistan 2,121 1,487 3,608Papua New Guinea (10) 225 215Philippines – 1,903 1,903Samoa – (81) (81)Solomon Islands – (161) (161)Sri Lanka 150 541 691Tajikistan 121 (5) 116Thailand 270 1,199 1,469Timor-Leste – (30) (30)Tonga – (45) (45)Tuvalu – 800 800Uzbekistan 182 903 1,085Vanuatu – (24) (24)Viet Nam 3,440 1,875 5,315
Total $ 22,333 $ 44,238 66,571
Regional Activities 41,588
TOTAL $ 108,159
Notes: Figures may not add to total due to rounding.Negative amounts represent net undisbursed commitments written back to balances available for future commitments (Notes B and E).
The accompanying notes are an integral part of these financial statements (TASF-6).

7/30/2019 ADB Annual Report 2008 - Financial Report
http://slidepdf.com/reader/full/adb-annual-report-2008-financial-report 99/218
TASF-6
31 December 2007 and 200631 December 2007 and 2006
97 Annual Report 2008
ASIAN DEVELOPMENT BANK—TECHNICAL ASSISTANCE SPECIAL FUND
NOTES TO FINANCIAL STATEMENTS
31 December 2008 and 2007
NOTE A—NATURE OF OPERATIONS
he echnical Assistance pecial und (A) wasestablished to provide technical assistance on a grantbasis to developing member countries (MCs) of the
Asian evelopment Bank (AB) and for regional techni-cal assistance. A resources consist of direct voluntary contributions by members, allocations from the netincome of rdinary Capital esources (C) and Asianevelopment und (A) contributions, and revenuefrom investments and other sources.
he eighth replenishment of the Asian evel-
opment und (A ) and the third regularizedreplenishment of the echnical Assistance pecial und(A) became effective in April 2005. nder theresolution, a specific portion of the contribution is to beallocated to A.
n August 2008, the Board of overnors adoptedthe resolution providing for the ninth replenishment of the Asian evelopment und (A ) and the fourthregularized replenishment of the A. n conjunctionwith the A replenishment, the resolution providesfor a replenishment of the A to finance technicaloperations under the fund. otal replenishment size is7,111,290,000, of which 2,641,290,000 will
come from new donor contributions. onors agreed toallocate 3% of the total replenishment size (equivalentto 8% of total donor contributions) to A. he
A replenishment shall be effective upon receiptof the nstruments of Contribution for nqualifiedContribution commitments in an aggregate amountequivalent to at least 1,320,645,000, and such dateshould not be later than 1 uly 2009.
NOTE B— SUMMARY OF SIGNIFICANT ACCOUNTING POLICIES
Presentation of the Financial Statements
he financial statements of the A are presented onthe basis of those for not-for-profit organizations.
A reports donors’ contributions of cash andother assets as unrestricted assets as these are madeavailable to A without conditions other than for thepurpose of pursuing its objectives.
Functional and Reporting Currency
he nited tates dollar is the functional and report-ing currency, representing the currency of the primary economic operating environment of A.
Translation of Currencies
AB adopts the use of daily exchange rates for account-ing and financial reporting purposes. his allows transac-tions denominated in non- dollar to be translated tothe reporting currency using exchange rates applicable
at the time of transactions. Contributions included inthe financial statements during the year are recognizedat applicable exchange rates as of the respective datesof commitment. At the end of each accounting month,translations of assets, liabilities, and uncommittedbalances which are denominated in non- dollar areadjusted using the applicable rates of exchange at theend of the reporting period. hese translation adjust-ments are accounted for as exchange gains or losses andare credited or charged to operations.
Investments
All investment securities held by A are reported atestimated fair value, which represents their fair market
value. ealized and unrealized gains and losses are in-cluded in revenue. ime deposits are reported at costwhich is a reasonable estimate of fair value.
nterest income on investment securities and timedeposits are recognized as realized and reported, net of amortizations of premiums and discounts.
Securities Purchased Under Resale Arrangements
A accounts for transfer of financial assets in ac-cordance with A 140, “Accounting for ransfers and
ervicing of inancial Assets and xtinguishments of iabilities – a replacement of A 125.” n general,transfers are accounted for as sales under A 140 whencontrol over the transferred assets has been relinquished.therwise, the transfers are accounted for as repurchase/ resale arrangements and collateralized financing arrange-ments. ecurities purchased under resale arrangementare recorded as assets while securities received are notrecorded as liabilities and are not re-pledged.

7/30/2019 ADB Annual Report 2008 - Financial Report
http://slidepdf.com/reader/full/adb-annual-report-2008-financial-report 100/218
ASIAN DEVELOPMENT BANK—TECHNICAL ASSISTANCE SPECIAL FUND
NOTES TO FINANCIAL STATEMENTS
31 December 2008 and 2007
Asian Development Bank98
T E C H N I C A L A S S I S T
A N C E S P E C I A L F U N D
Contributions
he contributions from donors and the allocations fromC net income are included in the financial statements,from the date of effectivity of the contribution agreement,and the Board of overnors’ approval, respectively.
Technical Assistance to Member Countries andUndisbursed Commitments
echnical assistance is recognized in the financial state-ments when the project is approved and becomes effec-
tive. pon completion or cancellation of a A project,any undisbursed amount is written back as a reductionin technical assistance for the year and the correspondingundisbursed commitment is eliminated accordingly.
Accounting Estimates
he preparation of financial statements in conformity with generally accepted accounting principles requiresManagement to make reasonable estimates and assump-tions that affect the reported amounts of assets andliabilities and uncommitted balances as at the end of the
year and the reported amounts of revenue and expenses
during the year. he actual results could differ fromthose estimates.
Statement of Cash Flows
or the purposes of the tatement of Cash lows, theA considers that its cash and cash equivalents arelimited to “ M BAN.”
N C—NMN
he main investment management objective is to main-tain security and liquidity. ubject to these parameters,
AB seeks the highest possible return on its investments.nvestments are governed by the nvestment Authority approved by the Board of irectors in 1999, and reviewedin 2006. he review endorsed a portfolio strategy that islargely consistent with the 1999 approach.
nvestment securities and negotiable certificateof deposits held as of 31 ecember 2008 are considered“Available for ale” and are reported at fair value, whichrepresents their fair market value. nrealized gains andlosses are included in revenue from investments.
he currency composition of the investmentportfolio as of 31 ecember 2008 and 2007 expressed innited tates dollars are as follows:
Currency 2008 2007
Australian dollar $ 25,642,000 $ 26,278,000Canadian dollar 42,759,000 155,810,000Euro 16,327,000 6,479,000United States dollar 199,591,000 92,493,000Others 11,224,000 14,018,000
Total $295,543,000 $295,078,000
he annualized rate of return on the averageinvestments held during the year, based on the portfolioheld at the beginning and end of each month was 3.60%(4.90% – 2007).
NOTE D—RELATED PARTY TRANSACTIONS
he C and special fund resources are at all times used,committed, and invested entirely separate from each other.nder A and the third regularized replenishmentof A, a specific portion of the total contributions are
to be allocated to A. A receives all contributionsof members and subsequently transfers A’s portionto A. egional technical assistance projects andprograms may be combined activities between special andtrust funds. nterfund accounts are settled on a regularbasis between A and the other funds.
he interfund account balances included in otherassets and miscellaneous liabilities are as follows:
2008 2007Receivable from:
OCR $ 12,000 $ –ADF – 1,419,000
JSF 21,000 2,000RCIF 22,000 –Agency Trust Funds – Net 73,000 –
Total $ 128,000 $1,421,000 Payable to:
OCR $ – $ 14,000Agency Trust Funds – Net – 35,000
Total $ – $ 49,000

7/30/2019 ADB Annual Report 2008 - Financial Report
http://slidepdf.com/reader/full/adb-annual-report-2008-financial-report 101/218
TASF-6
31 December 2007 and 200631 December 2007 and 2006
99 Annual Report 2008
ASIAN DEVELOPMENT BANK—TECHNICAL ASSISTANCE SPECIAL FUND
NOTES TO FINANCIAL STATEMENTS
31 December 2008 and 2007
TASF-6
NOTE E—UNDISBURSED COMMITMENTS
ndisbursed commitments are denominated in nitedtates dollars and represent effective ongoing grant-financed A projects/programs which are not yetdisbursed as of the end of the year. uring 2008, anamount of $15,646,000 ($11,875,000 – 2007) represent-ing completed and canceled A projects was writtenback as a reduction in technical assistance of the periodand the corresponding undisbursed commitment waseliminated. he fair value of undisbursed commitmentsapproximates the amounts undisbursed, because AB
expects that disbursements will be made for all projects/ programs covered by the commitments.
NOTE F— CONTRIBUTIONS ANDUNCOMMITTED BALANCES
ince inception in 1967, direct contributions have beenmade by 29 member countries. ndia and akistan madedirect and voluntary contribution in 2008 of s10,000,000($250,000 equivalent) and $70,000 respectively.
n 1986, 1992 and 2005, the Board of overnorsof AB, in authorizing replenishments of the A,provided for allocations to the A in aggregate
amounts equivalent to $72,000,000, $141,000,000 and$220,000,000, respectively, to be used for technicalassistance to A borrowing MCs and for regionaltechnical assistance. he total amount received for A replenishment for the years ended 31 ecember 2008and 2007 amounted to $52,434,000 and $51,622,000respectively, leaving a total of $17,304,000 as due fromcontributors ($68,489,000 – 2007).
n 2008, $23,000,000 was allocated out of C netincome to A bringing the accumulated allocation outof C net income to $706,000,000.
ome of the direct contributions received can besubject to restricted procurement sources, while some
are given on condition that the technical assistance bemade on a reimbursable basis. he total contributions
received for the years ended 31 ecember 2008 and2007 were without restrictions.
ncommitted balances comprised of amounts whichhave not been committed by AB as at 31 ecember2008 and 2007. hese balances include approved A projects/programs that are not yet effective.
NOTE G—FAIR VALUE MEASUREMENTS
A 157 defines fair value as the price that would bereceived to sell an asset or paid to transfer a liability atmeasurement date (exit price) in an orderly transaction
among willing participants with an assumption that thetransaction takes place in the entity’s principal market,the most advantageous market for the asset or liability.he most advantageous market is the market where thesale of the asset or transfer of liability would maximize theamount received for the asset or minimize the amountpaid to transfer the liability. he fair value measurementis not adjusted for transaction cost.
A 157 also establishes a fair value hierarchy that gives the highest priority to quoted prices inactive markets for identical assets or liabilities (evel1), next priority to observable market inputs or marketcorroborated data (evel 2), and the lowest priority to
unobservable inputs without market corroborated data(evel 3). A 157 requires the fair value measurementto maximize the use of market observable inputs.
he following guidelines are applied in determiningthe fair values of financial instruments:
Investments and securities purchased under resalearrangements
eadily marketable investments are fair valued using ac-tive market quotes in evel 1 category. evel 2 category includes investments and securities purchased underresale arrangements which are fair valued with significant
other market observable inputs.
CONTINUED
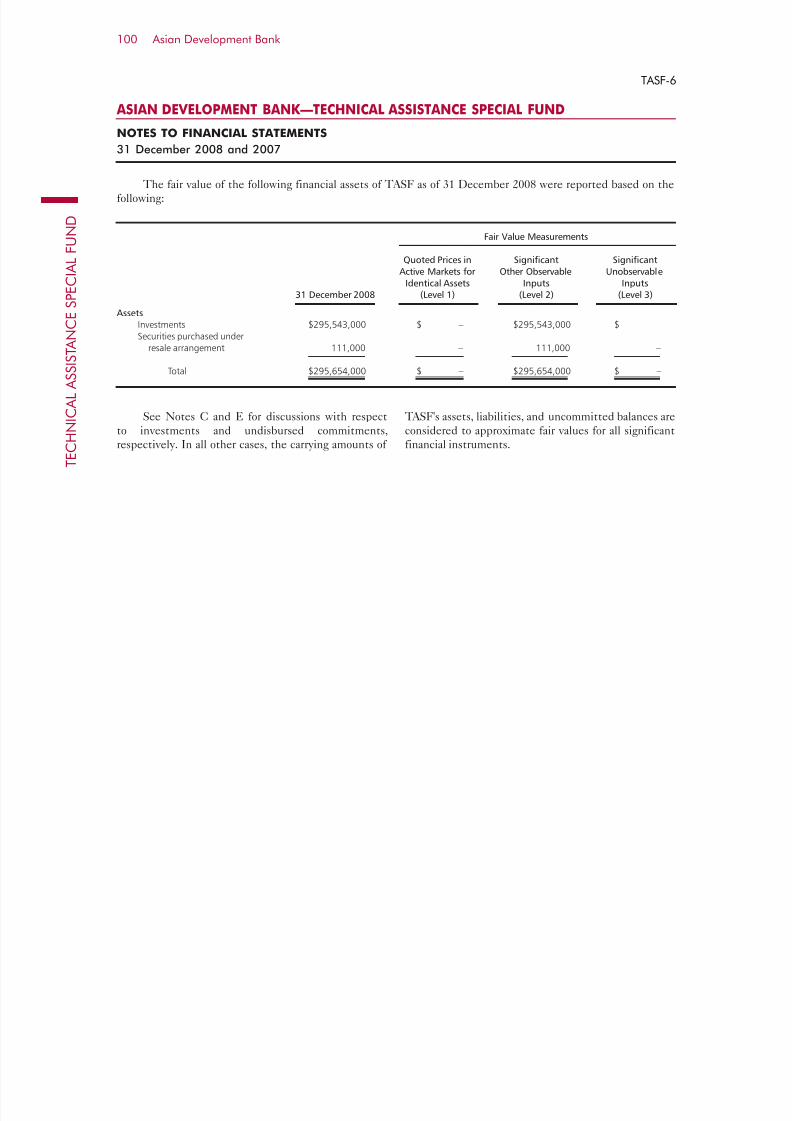
7/30/2019 ADB Annual Report 2008 - Financial Report
http://slidepdf.com/reader/full/adb-annual-report-2008-financial-report 102/218
ASIAN DEVELOPMENT BANK—TECHNICAL ASSISTANCE SPECIAL FUND
NOTES TO FINANCIAL STATEMENTS
31 December 2008 and 2007
Asian Development Bank100
T E C H N I C A L A S S I S T
A N C E S P E C I A L F U N D
he fair value of the following financial assets of A as of 31 ecember 2008 were reported based on thefollowing:
ee Notes C and for discussions with respectto investments and undisbursed commitments,respectively. n all other cases, the carrying amounts of
A's assets, liabilities, and uncommitted balances areconsidered to approximate fair values for all significantfinancial instruments.
Fair Value Measurements
Quoted Prices in Significant SignificantActive Markets for Other Observable Unobservable
Identical Assets Inputs Inputs31 December 2008 (Level 1) (Level 2) (Level 3)
Assets Investments $295,543,000 $ – $295,543,000 $ –Securities purchased under
resale arrangement 111,000 – 111,000 –
Total $295,654,000 $ – $295,654,000 $ –
TASF-6

7/30/2019 ADB Annual Report 2008 - Financial Report
http://slidepdf.com/reader/full/adb-annual-report-2008-financial-report 103/218
101 Annual Report 2008
JAPAN SPECIAL FUND
Management's Report on Internal Control over Financial Reporting
he management of Asian evelopment Bank (“AB”) is responsible for establishing and
maintaining adequate internal control over financial reporting. AB's internal control overfinancial reporting is a process designed to provide reasonable assurance regarding the reliabil-
ity of financial reporting and the preparation of financial statements for external purposes in
accordance with generally accepted accounting principles in the nited tates of America.
AB's internal control over financial reporting includes those policies and procedures that
(i) pertain to the maintenance of records that, in reasonable detail, accurately and fairly re-
flect the transactions and dispositions of the assets of AB; (ii) provide reasonable assurance
that transactions are recorded as necessary to permit preparation of financial statements in
accordance with generally accepted accounting principles, and that receipts and expenditures
of AB are being made only in accordance with authorizations of management and directors
of AB; and (iii) provide reasonable assurance regarding prevention or timely detection of
unauthorized acquisition, use or disposition of AB's assets that could have a material effecton the financial statements.
Because of its inherent limitations, internal control over financial reporting may not prevent
or detect misstatements. Also, projections of any evaluation of effectiveness to future periods
are subject to the risk that controls may become inadequate because of changes in conditions,
or that the degree of compliance with the policies or procedures may deteriorate.
AB's management assessed the effectiveness of AB's internal control over financial report-
ing as of 31 ecember 2008. n making this assessment, AB's management used the criteria
set forth by the Committee of ponsoring rganizations of the readway Commission in
Internal Control – Integrated Framework. Based on that assessment, management believes that as
of 31 ecember 2008, AB's internal control over financial reporting is effective based uponthe criteria established in Internal Control – Integrated Framework.
aruhiko uroda
resident
Bindu N. ohani
ice resident (inance and Administration)
ong-ang ung
Controller
5 March 2009

7/30/2019 ADB Annual Report 2008 - Financial Report
http://slidepdf.com/reader/full/adb-annual-report-2008-financial-report 104/218
Asian Development Bank102
J A P A N
S P E C I A L F U N D
PricewaterhouseCoopers LLP
pwc.com/sg
8 Cross Street #17-00
PWC Building
Singapore 048424
Telephone (65) 6236 3388
Facsimile (65) 6236 3300
GST No.: M90362193L
Reg. No.: T09LL0001D
Report of Independent Auditors to the Asian Development Bank
n our opinion, the accompanying statements of financial position and the related statements of ac-
tivities and changes in net assets and cash flows present fairly, in all material respects, the financial
position of the Asian evelopment Bank (“AB” or “the Bank”)—apan pecial und at 31 ecember
2008 and 2007, and the results of its activities and changes in net assets and its cash flows for the
years then ended, in conformity with accounting principles generally accepted in the nited tates of
America. Also in our opinion, management’s assertion that AB maintained effective internal control
over financial reporting as of 31 ecember 2008 is fairly stated, in all material respects, based on
criteria established in nternal Control - ntegrated ramework issued by the Committee of ponsor-
ing rganizations of the readway Commission (C). he management of AB is responsible
for these financial statements, for maintaining effective internal control over financial reporting and
for its assertion of the effectiveness of internal control over financial reporting, included in the ac-
companying Management’s eport on nternal Control over inancial eporting. ur responsibility
is to express opinions on these financial statements and on AB’s internal control over financial
reporting based on our integrated audit in 2008 and financial statement audit in 2007. e conducted
our audits of the financial statements in accordance with auditing standards generally accepted inthe nited tates of America and our audit of internal control over financial reporting in accordance
with attestation standards established by the American nstitute of Certified ublic Accountants.
hose standards require that we plan and perform the audits to obtain reasonable assurance about
whether the financial statements are free of material misstatement and whether effective internal
control over financial reporting was maintained in all material respects. ur audits of the financial
statements included examining, on a test basis, evidence supporting the amounts and disclosures in
the financial statements, assessing the accounting principles used and significant estimates made
by management, and evaluating the overall financial statement presentation. ur audit of internal
control over financial reporting included obtaining an understanding of internal control over financial
reporting, assessing the risk that a material weakness exists, and testing and evaluating the design
and operating effectiveness of internal control based on the assessed risk. ur audits also included
performing such other procedures as we considered necessary in the circumstances. e believe thatour audits provide a reasonable basis for our opinions.
PricewaterhouseCoopers LLP (Registration No. T09LL0001D) is an accounting limited liability partnership registered in Singapore under the Limited Liability Partner-ships Act (Chapter 163A). It was converted from a partnership (with the name “PricewaterhouseCoopers” and Registration no. 000640) to an accounting limitedliability partnership on 1 January 2009. PricewaterhouseCoopers LLP is part of the network of member firms of PricewaterhouseCoopers International Limited, eachof which is a separate and independent legal entity.

7/30/2019 ADB Annual Report 2008 - Financial Report
http://slidepdf.com/reader/full/adb-annual-report-2008-financial-report 105/218
103 Annual Report 2008
A company’s internal control over financial reporting is a process effected by those charged
with governance, management, and other personnel, designed to provide reasonable assur-
ance regarding the preparation of reliable financial statements in accordance with accounting
principles generally accepted in the nited tates of America. A company’s internal control
over financial reporting includes those policies and procedures that (i) pertain to the main-
tenance of records that, in reasonable detail, accurately and fairly reflect the transactions and
dispositions of the assets of the company; (ii) provide reasonable assurance that transactions
are recorded as necessary to permit preparation of financial statements in accordance with
generally accepted accounting principles, and that receipts and expenditures of the company
are being made only in accordance with authorizations of management and those charged with
governance; and (iii) provide reasonable assurance regarding prevention, or timely detection of
unauthorized acquisition, use, or disposition of the company’s assets that could have a material
effect on the financial statements.
Because of its inherent limitations, internal control over financial reporting may not prevent
or detect misstatements. Also, projections of any evaluation of effectiveness to future periods
are subject to the risk that controls may become inadequate because of changes in conditions,
or that the degree of compliance with the policies or procedures may deteriorate.
ricewaterhouseCoopers
ublic Accountants and Certified ublic Accountants
ingapore
5 March 2009
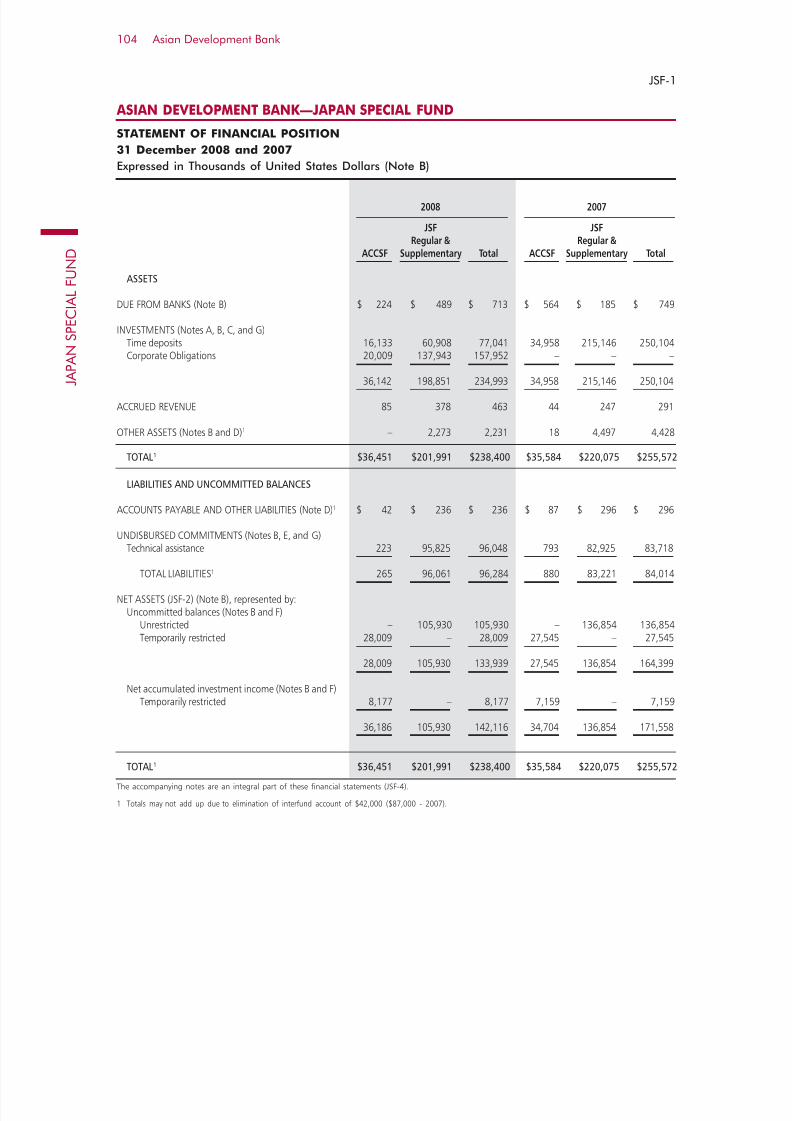
7/30/2019 ADB Annual Report 2008 - Financial Report
http://slidepdf.com/reader/full/adb-annual-report-2008-financial-report 106/218
Asian Development Bank104
J A P A N
S P E C I A L F U N D
JSF-1
ASIAN DEVELOPMENT BANK—JAPAN SPECIAL FUND
STATEMENT OF FINANCIAL POSITION
31 December 2008 and 2007
Expressed in Thousands of United States Dollars (Note B)
2008 2007
JSF JSFRegular & Regular &
ACCSF Supplementary Total ACCSF Supplementary Total
ASSETS
DUE FROM BANKS (Note B) $ 224 $ 489 $ 713 $ 564 $ 185 $ 749
INVESTMENTS (Notes A, B, C, and G)Time deposits 16,133 60,908 77,041 34,958 215,146 250,104
Corporate Obligations 20,009 137,943 157,952 – – –
36,142 198,851 234,993 34,958 215,146 250,104
ACCRUED REVENUE 85 378 463 44 247 291
OTHER ASSETS (Notes B and D)1 – 2,273 2,231 18 4,497 4,428
TOTAL1 $36,451 $201,991 $238,400 $35,584 $220,075 $255,572
LIABILITIES AND UNCOMMITTED BALANCES
ACCOUNTS PAYABLE AND OTHER LIABILITIES (Note D)1 $ 42 $ 236 $ 236 $ 87 $ 296 $ 296
UNDISBURSED COMMITMENTS (Notes B, E, and G)Technical assistance 223 95,825 96,048 793 82,925 83,718
TOTAL LIABILITIES1 265 96,061 96,284 880 83,221 84,014
NET ASSETS (JSF-2) (Note B), represented by:Uncommitted balances (Notes B and F)
Unrestricted – 105,930 105,930 – 136,854 136,854Temporarily restricted 28,009 – 28,009 27,545 – 27,545
28,009 105,930 133,939 27,545 136,854 164,399
Net accumulated investment income (Notes B and F)Temporarily restricted 8,177 – 8,177 7,159 – 7,159
36,186 105,930 142,116 34,704 136,854 171,558
TOTAL1 $36,451 $201,991 $238,400 $35,584 $220,075 $255,572
The accompanying notes are an integral part of these financial statements (JSF-4).
1 Totals may not add up due to elimination of interfund account of $42,000 ($87,000 - 2007).

7/30/2019 ADB Annual Report 2008 - Financial Report
http://slidepdf.com/reader/full/adb-annual-report-2008-financial-report 107/218
105 Annual Report 2008
JSF-2
ASIAN DEVELOPMENT BANK—JAPAN SPECIAL FUND
STATEMENT OF ACTIVITIES AND CHANGES IN NET ASSETS
For the Years Ended 31 December 2008 and 2007
Expressed in Thousands of United States Dollars (Note B)
2008 2007
JSF JSFRegular & Regular &
ACCSF Supplementary Total ACCSF Supplementary Total
CHANGES IN UNRESTRICTED NET ASSETS
CONTRIBUTIONS (Notes B and F) $ – $ 17,373 $ 17,373 $ – $ 27,674 $ 27,674
REVENUE FROM INVESTMENTS (Notes B and C) – 6,459 6,459 – 11,807 11,807
REVENUE FROM OTHER SOURCES – 91 91 – 198 198
NET ASSETS REVERTED BACK TO TEMPORARILY RESTRICTED ASSETS (Notes B and F) (437) – (437) (26) – (26)
Total (437) 23,923 23,486 (26) 39,679 39,653
EXPENSESTechnical assistance—net (Notes B, E, and F) (449) 53,812 53,363 (37) 32,521 32,484Administrative expenses (Note F) 12 1,278 1,290 11 1,235 1,246Financial expenses 0 0 0 – 0 0
Total (437) 55,090 54,653 (26) 33,756 33,730
CONTRIBUTIONS AND REVENUE (LESS THAN)
IN EXCESS OF EXPENSES – (31,167) (31,167) – 5,923 5,923
EXCHANGE GAINS (LOSSES) (Note B) – 243 243 – (12) (12)
(DECREASE) INCREASE IN UNRESTRICTED NET ASSETS – (30,924) (30,924) – 5,911 5,911
CHANGES IN TEMPORARILY RESTRICTED NET ASSETS
REVENUE FROM INVESTMENTS AND OTHER SOURCES(Notes B and C) 1,045 – 1,045 1,829 – 1,829
NET ASSETS REVERTED BACK TO TEMPORARILY RESTRICTED ASSETS (Notes B and F) 437 – 437 26 – 26
INCREASE IN TEMPORARILY RESTRICTED NET ASSETS 1,482 – 1,482 1,855 – 1,855
INCREASE (DECREASE) IN NET ASSETS 1,482 (30,924) (29,442) 1,855 5,911 7,766
NET ASSETS AT BEGINNING OF YEAR 34,704 136,854 171,558 32,849 130,943 163,792
NET ASSETS AT END OF YEAR $36,186 $105,930 $142,116 $34,704 $136,854 $171,558
0 – Less than $500.
The accompanying notes are an integral part of these financial statements (JSF-4).
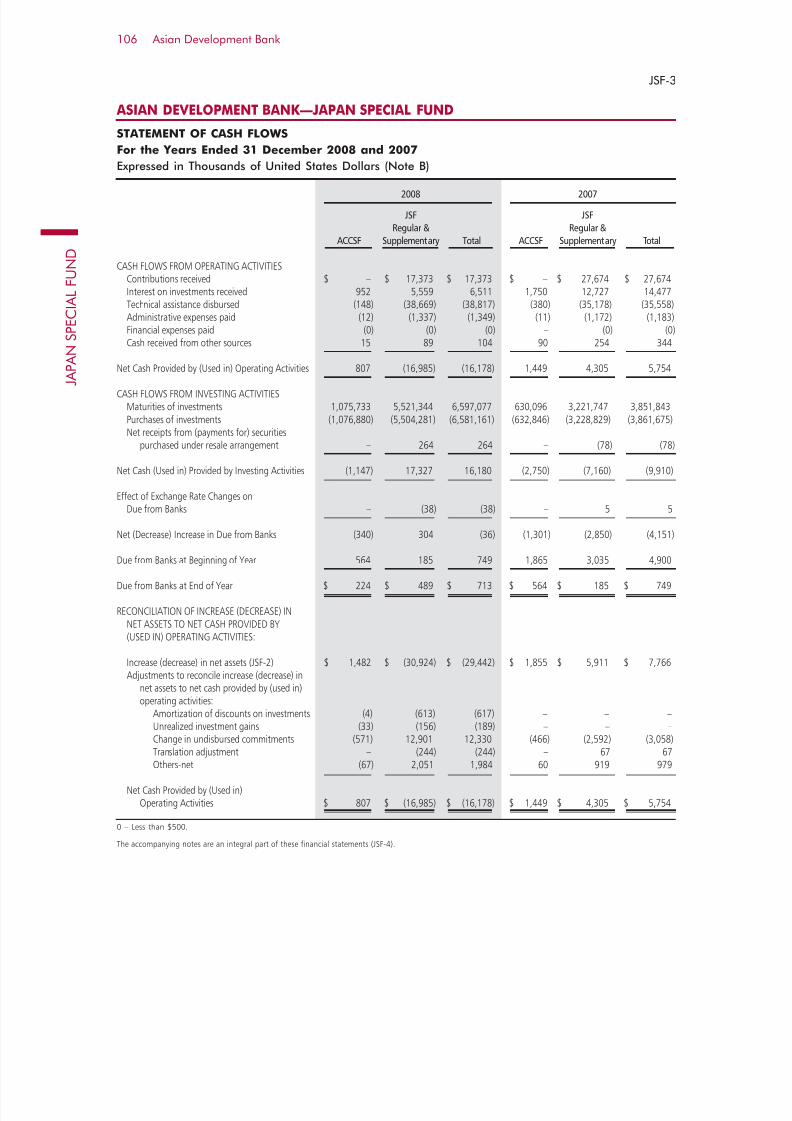
7/30/2019 ADB Annual Report 2008 - Financial Report
http://slidepdf.com/reader/full/adb-annual-report-2008-financial-report 108/218
Asian Development Bank106
J A P A N
S P E C I A L F U N D
JSF-3
ASIAN DEVELOPMENT BANK—JAPAN SPECIAL FUND
STATEMENT OF CASH FLOWS
For the Years Ended 31 December 2008 and 2007
Expressed in Thousands of United States Dollars (Note B)
2008 2007
JSF JSF
Regular & Regular &
ACCSF Supplementary Total ACCSF Supplementary Total
CASH FLOWS FROM OPERATING ACTIVITIESContributions received $ – $ 17,373 $ 17,373 $ – $ 27,674 $ 27,674Interest on investments received 952 5,559 6,511 1,750 12,727 14,477Technical assistance disbursed (148) (38,669) (38,817) (380) (35,178) (35,558)Administrative expenses paid (12) (1,337) (1,349) (11) (1,172) (1,183)Financial expenses paid (0) (0) (0) – (0) (0)Cash received from other sources 15 89 104 90 254 344
Net Cash Provided by (Used in) Operating Activities 807 (16,985) (16,178) 1,449 4,305 5,754
CASH FLOWS FROM INVESTING ACTIVITIESMaturities of investments 1,075,733 5,521,344 6,597,077 630,096 3,221,747 3,851,843Purchases of investments (1,076,880) (5,504,281) (6,581,161) (632,846) (3,228,829) (3,861,675)Net receipts from (payments for) securities
purchased under resale arrangement – 264 264 – (78) (78)
Net Cash (Used in) Provided by Investing Activities (1,147) 17,327 16,180 (2,750) (7,160) (9,910)
Effect of Exchange Rate Changes onDue from Banks – (38) (38) – 5 5
Net (Decrease) Increase in Due from Banks (340) 304 (36) (1,301) (2,850) (4,151)
Due from Banks at Beginning of Year 564 185 749 1,865 3,035 4,900
Due from Banks at End of Year $ 224 $ 489 $ 713 $ 564 $ 185 $ 749
RECONCILIATION OF INCREASE (DECREASE) INNET ASSETS TO NET CASH PROVIDED BY (USED IN) OPERATING ACTIVITIES:
Increase (decrease) in net assets (JSF-2) $ 1,482 $ (30,924) $ (29,442) $ 1,855 $ 5,911 $ 7,766Adjustments to reconcile increase (decrease) in
net assets to net cash provided by (used in)operating activities:
Amortization of discounts on investments (4) (613) (617) – – –Unrealized investment gains (33) (156) (189) – – –Change in undisbursed commitments (571) 12,901 12,330 (466) (2,592) (3,058)Translation adjustment – (244) (244) – 67 67Others-net (67) 2,051 1,984 60 919 979
Net Cash Provided by (Used in)Operating Activities $ 807 $ (16,985) $ (16,178) $ 1,449 $ 4,305 $ 5,754
0 – Less than $500.
The accompanying notes are an integral part of these financial statements (JSF-4).

7/30/2019 ADB Annual Report 2008 - Financial Report
http://slidepdf.com/reader/full/adb-annual-report-2008-financial-report 109/218
JSF-4
ASIAN DEVELOPMENT BANK—JAPAN SPECIAL FUND
NOTES TO FINANCIAL STATEMENTS
31 December 2008 and 2007
107 Annual Report 2008
NOTE A—NATURE OF OPERATIONS
he apan pecial und () was established inMarch 1988 when overnment of apan and the Asianevelopment Bank (AB) entered into a financial ar-rangement whereby overnment of apan agreed to makean initial contribution and AB became the administra-tor. he purpose of is to help developing membercountries (MCs) of AB restructure their economiesand broaden the scope of opportunities for new invest-ments, thereby assisting the recycling of funds to MCsof AB. hile resources are used mainly to finance
technical assistance (A) operations, these resourcesmay also be used for equity investment operations in AB’s MCs. nder the agreement between AB and apan, AB may invest the proceeds of pendingdisbursement.
n March 1999, the Board approved the acceptanceand administration by AB of the Asian Currency Crisisupport acility (ACC) to assist Asian currency crisis-affected member countries (CAMCs). unded by overnment of apan, ACC was established within
to assist in the economic recovery of CAMCs throughinterest payment assistance (A) grants, A grants, andguarantees. ith the general fulfillment of the purpose
of the facility, overnment of apan and AB agreed toterminate the ACC on 22 March 2002. he ACCaccount is to be kept open until the completion of all A disbursements and the settlement of all administrativeexpenses.
NOTE B— SUMMARY OF SIGNIFICANT ACCOUNTING POLICIES
Presentation of the Financial Statements
he financial statements of are presented on thebasis of those for not-for-profit organizations and as
unrestricted and temporarily restricted net assets. ACC funds are separately reported in the financialstatements.
reports the contributions of cash and otherassets as restricted support if they are received withdonor stipulations that limit the use of the donatedassets. hen the donor restriction expires, that is, whena stipulated time or purpose restriction is accomplished,temporarily restricted net assets are reclassified tounrestricted net assets and reported in the tatement of
Activities and Changes in Net Assets as “N AA M CN.”
Functional and Reporting Currency
he nited tates dollar is the functional and report-ing currency, representing the currency of the primary economic operating environment of .
Translation of Currencies
AB adopts the use of daily exchange rates for account-
ing and financial reporting purposes. his allows transac-tions denominated in non- dollar to be translated tothe reporting currency using exchange rates applicableat the time of transactions. Contributions included inthe financial statements during the year are recognizedat applicable exchange rates as of the respective datesof commitment. At the end of each accounting month,translations of assets, liabilities, and uncommittedbalances which are denominated in non- dollar areadjusted using the applicable rates of exchange at theend of the reporting period. hese translation adjust-ments are accounted for as exchange gains or losses andare credited or charged to operations.
Investments
All investment securities held by are reported atestimated fair value, which represents their fair market
value. ealized and unrealized gains and losses are in-cluded in revenue. ime deposits are reported at costwhich is a reasonable estimate of fair value.
nterest income on investment securities and timedeposits are recognized as realized and reported, net of amortizations of premiums and discounts.
Securities Purchased Under Resale Arrangements
accounts for transfer of financial assets in accordancewith A 140, “Accounting for ransfers and ervicingof inancial Assets and xtinguishments of iabilities– a replacement of A 125.” n general, transfers areaccounted for as sales under A 140 when control overthe transferred assets has been relinquished. therwise,the transfers are accounted for as repurchase/resale ar-rangements and collateralized financing arrangements.ecurities purchased under resale arrangement are

7/30/2019 ADB Annual Report 2008 - Financial Report
http://slidepdf.com/reader/full/adb-annual-report-2008-financial-report 110/218
ASIAN DEVELOPMENT BANK—JAPAN SPECIAL FUND
NOTES TO FINANCIAL STATEMENTS
31 December 2008 and 2007
Asian Development Bank108
J A P A N
S P E C I A L F U N D
recorded as assets while securities received are notrecorded as liabilities and are not re-pledged.
here were no outstanding securities purchasedunder resale arrangements as of 31 ecember 2008 and2007.
Contributions
Contributions by apan are included in the financial state-ments from the date indicated by apan that funds areexpected to be made available. Contributions which arerestricted by the donor for specific A projects/programs
or for A grants are classified as temporarily restrictedcontributions. hose without any stipulation as to spe-cific use are accounted for and reported as unrestrictedcontributions.
Technical Assistance and Undisbursed Commitments
echnical assistance is recognized in the financial state-ments when the project is approved and becomes effec-tive. pon completion of a A project or cancellationof a grant, any undisbursed amount is written back as areduction in the A for the year and the correspondingundisbursed commitment is eliminated accordingly.
Advances are provided from technical assistancegrant funds to the executing agency or co-operatinginstitution, for the purpose of making paymentsfor eligible expenses. he advances shall be subjectto liquidation and charged against undisbursedcommitment, any unutilized portion shall be refundedto the fund. hese are included in other assets.
Accounting Estimates
he preparation of financial statements in conformity with generally accepted accounting principles requiresManagement to make reasonable estimates and as-
sumptions that affect the reported amounts of assetsand liabilities as at the end of the year and the reportedamounts of income and expenses during the year. heactual results could differ from those estimates.
Statement of Cash Flows
or the purposes of the tatement of Cash lows, the considers that its cash and cash equivalents are limited to“ M BAN.”
NOTE C—INVESTMENTS
he main investment management objective is to main-tain security and liquidity. ubject to these parameters,
AB seeks the highest possible return on its investments.nvestments are governed by the nvestment Authority approved by the Board of irectors in 1999, and reviewedin 2006. he review endorsed a portfolio strategy that islargely consistent with the 1999 approach.
nvestment securities and negotiable certificateof deposits held as of 31 ecember 2008 are considered“Available for ale” and are reported at fair value, which
represents their fair market value. nrealized gains andlosses are included in revenue from investments.he annualized rates of return on the average
investments held under ACC and funds duringthe year, based on the portfolio held at the beginning andend of each month were 2.90% and 2.94%, respectively (5.24% and 5.26%, respectively - 2007).
NOTE D—RELATED PARTY TRANSACTIONS
he rdinary Capital esources (C) and special fundresources are at all times used, committed, and investedentirely separate from each other. he administrative
and operational expenses pertaining to C and specialfund resources are charged to the respective funds. headministrative expenses of are settled on a regular ba-sis between C and . egional technical assistanceprojects and programs may be combined activities betweenspecial and trust funds. nterfund accounts are settled ona regular basis between and the other funds.
he interfund balances between other funds,which are included in other assets and liabilities are asfollows:
2008 2007Amounts Receivable by:
JSF from: ACCSF $ 42,000 $ 87,000Agency Trust Funds 19,000 –
Total $ 61,000 $ 87,000
Amounts Payable by:
JSF to: OCR $145,000 $159,000TASF 21,000 2,000Agency Trust Funds – 24,000
Total $166,000 $185,000
ACCSF to: JSF $ 42,000 $ 87,000

7/30/2019 ADB Annual Report 2008 - Financial Report
http://slidepdf.com/reader/full/adb-annual-report-2008-financial-report 111/218
JSF-4
ASIAN DEVELOPMENT BANK—JAPAN SPECIAL FUND
NOTES TO FINANCIAL STATEMENTS
31 December 2008 and 2007
109 Annual Report 2008
NOTE E—UNDISBURSED COMMITMENTS
ndisbursed commitments are denominated in nitedtates dollars and represent effective A projects/pro-grams not yet disbursed. Completed but partially can-celled A projects amounting to $6,883,000 was writtenback as a reduction in technical assistance during 2008($4,749,000 – 2007), and the corresponding undisbursedcommitments was eliminated. ut of this amount,$449,000 ($37,000 – 2007) corresponds to ACC. hefair value of undisbursed commitments approximatesthe amounts outstanding, because AB expects that
disbursements will substantially be made for all theprojects/programs covered by the commitments.
NOTE F—CONTRIBUTIONS ANDUNCOMMITTED BALANCES
All contributions for the years ended 31 ecember 2008and 2007 were received during the respective years.
ffective 31 ecember 2002, all remainingtemporarily restricted net assets under weretransferred and integrated into the unrestricted regularnet assets, as concurred by apan, in order to optimizethe use of . imilarly, apan lifted the restrictionover the use of net accumulated investment income,which under the original terms of agreement between
AB and apan, may only be used for defraying ’sadministrative expenses. apan agreed to use the netaccumulated investment income as additional resourcesfor funding future AB operations.
ncommitted balances comprised of amounts
which have not been committed by AB as at31 ecember 2008 and 2007. hese balances includeapproved A projects/programs that are not yeteffective.
As of 31 ecember 2008 and 2007 these balancesare as follows:
2008 2007
JSF JSF
Regular and Regular andACCSF Supplementary Total ACCSF Supplementary Total
Uncommitted balances $28,009,000 $105,930,000 $133,939,000 $27,545,000 $136,854,000 $164,399,000
TA projects/programs approved byJapan and ADB but not yet effective – (14,840,000) (14,840,000) – (20,135,000) (20,135,000)
TA projects/programs approved byJapan and not yet effective – (4,300,000) (4,300,000) – (12,925,000) (12,925,000)
Uncommitted balances available fornew commitments $28,009,000 $86,790,000 $114,799,000 $27,545,000 $103,794,000 $131,339,000
he temporarily restricted uncommitted balanceremaining available as of 31 ecember 2008 correspondsto funds under ACC of $28,009,000 ($27,545,000- 2007) to cover completion of A disbursements andthe amount of net accumulated investment income of $8,177,000 ($7,159,000 – 2007) for settlement of alladministrative expenses.
Net assets reverted back to temporarily restrictedassets under ACC relate to savings on financially completed technical assistance net of amount fromaccumulated investment income, released fromrestrictions to defray the administrative expenses of
ACC.
CONTINUED

7/30/2019 ADB Annual Report 2008 - Financial Report
http://slidepdf.com/reader/full/adb-annual-report-2008-financial-report 112/218
ASIAN DEVELOPMENT BANK—JAPAN SPECIAL FUND
NOTES TO FINANCIAL STATEMENTS
31 December 2008 and 2007
Asian Development Bank110
J A P A N
S P E C I A L F U N D
Fair Value Measurements
Quoted Prices in Significant SignificantActive Markets for Other Observable Unobservable
Identical Assets Inputs Inputs31 December 2008 (Level 1) (Level 2) (Level 3)
Assets Investments $234,993,000 $12,185,000 $222,808,000 $ –
NOTE G—FAIR VALUE MEASUREMENTS
A 157 defines fair value as the price that would bereceived to sell an asset or paid to transfer a liability atmeasurement date (exit price) in an orderly transactionamong willing participants with an assumption that thetransaction takes place in the entity’s principal market,the most advantageous market for the asset or liability.he most advantageous market is the market where thesale of the asset or transfer of liability would maximize theamount received for the asset or minimize the amountpaid to transfer the liability. he fair value measurement
is not adjusted for transaction cost.A 157 also establishes a fair value hierarchy that gives the highest priority to quoted prices inactive markets for identical assets or liabilities (evel1), next priority to observable market inputs or marketcorroborated data (evel 2), and the lowest priority to
unobservable inputs without market corroborated data(evel 3). A 157 requires the fair value measurementto maximize the use of market observable inputs.
he following guidelines are applied in determiningthe fair values of financial instruments:
Investments and securities purchased underresale arrangements
eadily marketable investments are fair valued using ac-tive market quotes in evel 1 category. evel 2 category includes investments and securities purchased under
resale arrangements which are fair valued with significantother market observable inputs.he fair value of the following financial assets of
as of 31 ecember 2008 were reported based on thefollowing:
ee Notes C and for discussions relating toinvestments and undisbursed commitments. n all othercases, the carrying amounts of ’s assets, liabilities, and
uncommitted balances are considered to approximatefair values for all significant financial instruments.
JSF-4
7/30/2019 ADB Annual Report 2008 - Financial Report
http://slidepdf.com/reader/full/adb-annual-report-2008-financial-report 113/218
111 Annual Report 2008
Report of Independent Auditors to the Asian Development Bank
n our opinion, the accompanying statement of financial position and the related statements of ac-
tivities and changes in net assets, and cash flows present fairly, in all material respects, the financial
position of the Asian evelopment Bank (“AB” or “the Bank”)—Asian evelopment Bank nstitute
pecial und at 31 ecember 2008 and 2007, and the results of its operations and its cash flows for
the years then ended, in conformity with accounting principles generally accepted in the nited
tates of America. hese financial statements are the responsibility of the management of the Asian
evelopment Bank nstitute. ur responsibility is to express an opinion on these financial state-
ments based on our audits. e conducted our audits of these statements in accordance with auditing
standards generally accepted in the nited tates of America. hose standards require that we plan
and perform the audit to obtain reasonable assurance about whether the financial statements are
free of material misstatement. An audit includes examining, on a test basis, evidence supporting the
amounts and disclosures in the financial statements, assessing the accounting principles used and
significant estimates made by management, and evaluating the overall financial statement presenta-
tion. e believe that our audits provide a reasonable basis for our opinion.
ricewaterhouseCoopers
ublic Accountants and Certified ublic Accountants
ingapore
5 March 2009
PricewaterhouseCoopers LLP
pwc.com/sg
8 Cross Street #17-00
PWC Building
Singapore 048424Telephone (65) 6236 3388
Facsimile (65) 6236 3300
GST No.: M90362193L
Reg. No.: T09LL0001D
PricewaterhouseCoopers LLP (Registration No. T09LL0001D) is an accounting limited liability partnership registered in Singapore under the Limited Liability Partner-ships Act (Chapter 163A). It was converted from a partnership (with the name “PricewaterhouseCoopers” and Registration no. 000640) to an accounting limitedliability partnership on 1 January 2009. PricewaterhouseCoopers LLP is part of the network of member firms of PricewaterhouseCoopers International Limited, eachof which is a separate and independent legal entity.
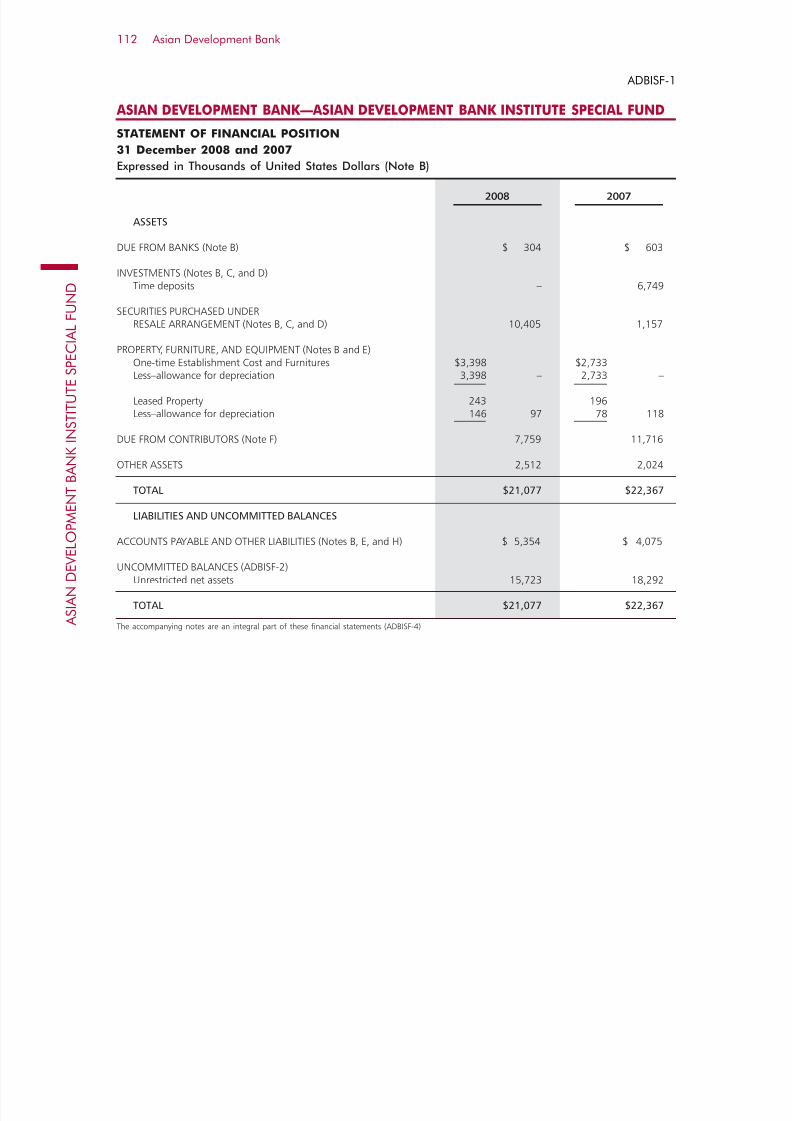
7/30/2019 ADB Annual Report 2008 - Financial Report
http://slidepdf.com/reader/full/adb-annual-report-2008-financial-report 114/218
Asian Development Bank112
A S I A N
D E V E L O P M E N T B A N K I N S T I T U T E S P E C I A L F U N D
ADBISF-1
ASIAN DEVELOPMENT BANK—ASIAN DEVELOPMENT BANK INSTITUTE SPECIAL FUND
STATEMENT OF FINANCIAL POSITION
31 December 2008 and 2007
Expressed in Thousands of United States Dollars (Note B)
2008 2007
ASSETS
DUE FROM BANKS (Note B) $ 304 $ 603
INVESTMENTS (Notes B, C, and D)Time deposits – 6,749
SECURITIES PURCHASED UNDERRESALE ARRANGEMENT (Notes B, C, and D) 10,405 1,157
PROPERTY, FURNITURE, AND EQUIPMENT (Notes B and E)One-time Establishment Cost and Furnitures $3,398 $2,733Less–allowance for depreciation 3,398 – 2,733 –
Leased Property 243 196Less–allowance for depreciation 146 97 78 118
DUE FROM CONTRIBUTORS (Note F) 7,759 11,716
OTHER ASSETS 2,512 2,024
TOTAL $21,077 $22,367
LIABILITIES AND UNCOMMITTED BALANCES
ACCOUNTS PAYABLE AND OTHER LIABILITIES (Notes B, E, and H) $ 5,354 $ 4,075
UNCOMMITTED BALANCES (ADBISF-2)Unrestricted net assets 15,723 18,292
TOTAL $21,077 $22,367
The accompanying notes are an integral part of these financial statements (ADBISF-4)

7/30/2019 ADB Annual Report 2008 - Financial Report
http://slidepdf.com/reader/full/adb-annual-report-2008-financial-report 115/218
113 Annual Report 2008
ADBISF-2
ASIAN DEVELOPMENT BANK—ASIAN DEVELOPMENT BANK INSTITUTE SPECIAL FUND
STATEMENT OF ACTIVITIES AND CHANGES IN NET ASSETS
For the Years Ended 31 December 2008 and 2007
Expressed in Thousands of United States Dollars (Note B)
2008 2007
CHANGES IN UNRESTRICTED NET ASSETS
CONTRIBUTIONS (Notes B and F) $ 7,759 $ 11,716
REVENUEIncome from investments (Notes B and C) 85 71Income from other sources (Note G) 256 7
Total 8,100 11,794
EXPENSESAdministrative expenses 9,743 8,782Program expenses 3,814 2,388
Total 13,557 11,170
CONTRIBUTIONS AND REVENUE (LESS THAN) IN EXCESS OF EXPENSES (5,457) 624
EXCHANGE LOSSES—NET (159) (93)
TRANSLATION ADJUSTMENTS (Note B) 3,337 730
EFFECT OF FASB STATEMENT NO. 158 (Note I) (290) (377)
(DECREASE) INCREASE IN UNRESTRICTED NET ASSETS (2,569) 884
NET ASSETS AT BEGINNING OF YEAR 18,292 17,408
NET ASSETS AT END OF YEAR $ 15,723 $ 18,292
The accompanying notes are an integral part of these financial statements (ADBISF-4).

7/30/2019 ADB Annual Report 2008 - Financial Report
http://slidepdf.com/reader/full/adb-annual-report-2008-financial-report 116/218
Asian Development Bank114
A S I A N
D E V E L O P M E N T B A N K I N S T I T U T E S P E C I A L F U N D
ADBISF-3
ASIAN DEVELOPMENT BANK—ASIAN DEVELOPMENT BANK INSTITUTE SPECIAL FUND
STATEMENT OF CASH FLOWS
For the Years Ended 31 December 2008 and 2007
Expressed in Thousands of United States Dollars (Note B)
2008 2007
CASH FLOWS FROM OPERATING ACTIVITIESContributions received $ 12,163 $ 11,144Interest on investments received 87 70Expenses paid (13,009) (10,839)Others—net 97 (86)
Net Cash (Used in) Provided by Operating Activities (662) 289
CASH FLOWS FROM INVESTING ACTIVITIESMaturities of investments 220,580 155,105
Purchases of investments (212,945) (156,267)Net (payments for) receipts from securities under resale arrangement (7,406) 511
Net Cash Provided by (Used in) Investing Activities 229 (651) Effect of Exchange Rate Changes on Due from Banks 134 269
Net Decrease in Due from Banks (299) (93) Due from Banks at Beginning of Year 603 696
Due from Banks at End of Year $ 304 $ 603
RECONCILIATION OF (DECREASE) INCREASE IN UNRESTRICTED NET ASSETS
TO NET CASH (USED IN) PROVIDED BY OPERATING ACTIVITIES:(Decrease) Increase in unrestricted net assets (ADBISF-2) $ (2,569) $ 884Adjustments to reconcile (decrease) increase in unrestricted net assets
to net cash (used in) provided by operating activities:Depreciation 48 177Change in due from contributors 4,404 (572)Change in other assets (488) (233)Change in accounts payable and other liabilities 1,279 808Translation adjustments (3,337) (730)Others—net 1 (45)
Net Cash (Used in) Provided by Operating Activities $ (662) $ 289
The accompanying notes are an integral part of these financial statements (ADBISF-4).

7/30/2019 ADB Annual Report 2008 - Financial Report
http://slidepdf.com/reader/full/adb-annual-report-2008-financial-report 117/218
ADBISF-4
ASIAN DEVELOPMENT BANK—ASIAN DEVELOPMENT BANK INSTITUTE SPECIAL FUND
NOTES TO FINANCIAL STATEMENTS
31 December 2008 and 2007
115 Annual Report 2008
NOTE A—NATURE OF OPERATIONS
n 1996, the Asian evelopment Bank (AB) approvedthe establishment of the Asian evelopment Bank nstitute (the nstitute) in okyo, apan as a subsidiary body of AB. he nstitute commenced its operationsupon the receipt of the first funds from apan on 24 March1997, and it was inaugurated on 10 ecember 1997. henstitute’s funds may consist of voluntary contributions,donations, and grants from AB member countries,non-government organizations, and foundations. heobjectives of the nstitute, as defined under its tatute,
are the identification of effective development strate-gies and capacity improvement for sound developmentmanagement in developing member countries.
NOTE B— SUMMARY OF SIGNIFICANT ACCOUNTING POLICIES
Presentation of the Financial Statements
he financial statements of the nstitute are presentedon the basis of those for not-for-profit organizations.
he nstitute reports donor’s contributed cashand other assets as unrestricted support as these are
made available to the nstitute without conditions otherthan for the purposes of pursuing the objectives of thenstitute.
Functional Currency and Reporting Currency
he functional currency of the nstitute is the apanese yen. he reporting currency is the nited tates dollar.
Translation of Currencies
Assets, liabilities, and uncommitted balances are trans-lated from the functional currency to the reporting
currency at the applicable rates of exchange at the endof a reporting period. Commitments included in thefinancial statements during the year are recognized atthe applicable exchange rates as of the respective datesof commitment. evenue and expense amounts in cur-rency other than the nited tates dollar are translatedfor each semi-monthly period generally at the applicablerates of exchange at the beginning of each period; suchpractice approximates the application of average rates ineffect during the period. ranslation adjustments are ac-
counted for as exchange gains or losses and are creditedor charged to operations.
Investments
All investment securities held by the nstitute are re-ported at estimated fair value which represents their fairmarket value. ealized and unrealized gains and lossesare included in revenue. ime deposits are reported atcost which is a reasonable estimate of fair value.
Securities Purchased Under Resale Arrangements
AB accounts for transfer of financial assets in accordancewith A 140, “Accounting for ransfers and ervicingof inancial Assets and xtinguishments of iabilities– a replacement of A 125.” n general, transfers areaccounted for as sales under A 140 when control overthe transferred assets has been relinquished. therwise,the transfers are accounted for as repurchase/resale ar-rangements and collateralized financing arrangements.ecurities purchased under resale arrangement arerecorded as assets and reported at estimated fair value,while securities received are not recorded as liabilitiesand are not re-pledged.
Property, Furniture, and Equipment
roperty, furniture, and equipment are stated at cost anddepreciated over their estimated useful lives using thestraight-line method. Maintenance, repairs and minorbetterments are charged to expense.
he nstitute distinguishes between capitalleases and operating leases based on the objective of the expenditure. xpenditures amounting to morethan $30,000 for a single asset or a combination of assets forming an integral part of a separate asset arecapitalized.
Contributions
Contributions from donors are included in the financialstatements from the date committed.
Accounting Estimates
he preparation of the financial statements in conformity with generally accepted accounting principles requires

7/30/2019 ADB Annual Report 2008 - Financial Report
http://slidepdf.com/reader/full/adb-annual-report-2008-financial-report 118/218
ASIAN DEVELOPMENT BANK—ASIAN DEVELOPMENT BANK INSTITUTE SPECIAL FUND
NOTES TO FINANCIAL STATEMENTS
31 December 2008 and 2007
Asian Development Bank116
A S I A N
D E V E L O P M E N T B A N K I N S T I T U T E S P E C I A L F U N D
Management to make estimates and assumptions thataffect the reported amounts of assets and liabilities as atthe end of the year and the reported amounts of revenueand expenses during the year. Actual results could differfrom those estimates.
Accounting and Reporting Developments
n ecember 2008, the AB issued AB taff osition() A 132()-1, which amends 132() to requiremore detailed disclosures about employers' plan assets,including employers' investment strategies, major cat-
egories of plan assets, concentration of risk within planassets, and valuation techniques used to measure the fair value of plan assets. his aims to address financial state-ment users' concerns “about the lack of transparency surrounding the types of assets and associated risks in anemployer's defined benefit pension or other postretire-ment plan and events in the economy and markets thatcould have a significant effect on the value of the planassets.” An entity must provide the 's disclosuresin financial statements for fiscal years ending after 15ecember 2009.
Statement of Cash Flows
or the purposes of the tatement of Cash lows, thenstitute considers that its cash and cash equivalents arelimited to “ M BAN.”
Reclassification
Certain non-material reclassifications of prior year’samounts and information have been made to conform tothe current year’s presentation.
NOTE C—INVESTMENTS
he main investment management objective is tomaintain security and liquidity. ubject to these param-eters, AB administers the nstitute’s investments andseeks the highest possible return on its investments.nvestments are governed by the nvestment Authority approved by the Board of irectors in 1999, and reviewedin 2006. he review endorsed a portfolio approach that islargely consistent with the 1999 approach.
he investment portfolio was composed wholly of investments denominated in apanese yen as of 31
ecember 2007. All such investments were due withinone year. he total investment income reported as of 31 ecember 2008 consisted of interest income earnedduring the year.
he annualized rate of return on the averageinvestments held during the year including receivablefor securities purchased under resale arrangement, basedon the portfolio held at the beginning and end of eachmonth was 0.58% (0.58% - 2007).
NOTE D—FAIR VALUE MEASUREMENTS
A 157 defines fair value as the price that would bereceived to sell an asset or paid to transfer a liability atmeasurement date (exit price) in an orderly transactionamong willing participants with an assumption that thetransaction takes place in the entity’s principal market,the most advantageous market for the asset or liability.he most advantageous market is the market where thesale of the asset or transfer of liability would maximize theamount received for the asset or minimize the amountpaid to transfer the liability. he fair value measurementis not adjusted for transaction cost.
A 157 also establishes a fair value hierarchy that gives the highest priority to quoted prices in
active markets for identical assets or liabilities (evel1), next priority to observable market inputs or marketcorroborated data (evel 2), and the lowest priority tounobservable inputs without market corroborated data(evel 3). A 157 requires the fair value measurementto maximize the use of market observable inputs.
he following guidelines are applied in determiningthe fair values of financial instruments:
Investments and securities purchased under resalearrangements
eadily marketable investments are fair valued using ac-
tive market quotes in evel 1 category. evel 2 category includes investments and securities purchased underresale arrangements which are fair valued with significantother market observable inputs.
he fair value of the following financial assets of AB as of 31 ecember 2008 were reported basedon the following:

7/30/2019 ADB Annual Report 2008 - Financial Report
http://slidepdf.com/reader/full/adb-annual-report-2008-financial-report 119/218
ADBISF-4
ASIAN DEVELOPMENT BANK—ASIAN DEVELOPMENT BANK INSTITUTE SPECIAL FUND
NOTES TO FINANCIAL STATEMENTS
31 December 2008 and 2007
117 Annual Report 2008
ee Note B for discussions relating to investments
and securities purchased under resale arrangements. nall other cases, the carrying amounts of AB's assets,liabilities, and uncommitted balances are consideredto approximate fair values for all significant financialinstruments.
NOTE E—LEASED ASSETS
n 6 anuary 2006, the nstitute concluded an agreementregarding the lease of a server, which requires AB topay a total amount of $205,000 over the period of 60months for the lease of the server.
he following is a schedule by years of future
minimum lease payments under capital lease togetherwith present value of the net minimum lease payment asof 31 ecember 2008:
Year ending 31 December2009 $ 53,0002010 53,000
Total minimum lease payment 106,000Less: Amount representing interest 3,000
Present value of net minimum lease payments $103,000
NOTE F—CONTRIBUTIONS
n 2008, the overnment of apan committed its 13th contribution to AB amounting to ¥700,900,000($7,759,000 equivalent), which was transferred to theund on 15 anuary 2009. he amount contributed wasreported in 31 ecember 2008 balance sheet as “uefrom Contributors.”
NOTE G—INCOME FROM OTHER SOURCES
ncome from other sources in 2008 primarily consistsof sublease rental income of $171,000, received accord-ing to a space sharing agreement with the apaneseepresentative ffice of AB. he transactions with
AB were made in the ordinary course of business andwere negotiated at arm's length.
NOTE H—DUE TO ADB
Accounts payable and other liabilities include amountsdue to AB of $847,000 and $341,000 at 31 ecember2008 and 2007, respectively. he payable results from
transactions in the normal course of business.
NOTE I—STAFF RETIREMENT PLAN ANDPOSTRETIREMENT MEDICAL BENEFITS
Staff Retirement Plan
he nstitute participates in the contributory definedbenefit taff etirement lan (the lan) of AB. very employee, as defined under the lan, shall, as a condi-tion of service, become a participant from the first day of service, provided that at such a date, the employee hasnot reached the normal retirement age of 60. etirementbenefits are based on length of service and highest aver-age remuneration during two years of eligible service. helan assets are segregated and are not included in theaccompanying Balance heet. he costs of administeringthe lan are absorbed by AB, except for fees paid tothe investment managers and related charges, includingcustodian fees, which are borne by the lan.
articipants hired on or before 30 eptember 2006are required to contribute 9 1/3% of their salary to thelan while those hired after that date do not anymore
Fair Value Measurements
Quoted Prices in Significant SignificantActive Markets for Other Observable UnobservableIdentical Assets Inputs Inputs
31 December 2008 (Level 1) (Level 2) (Level 3)
AssetsSecurities purchased under
resale arrangement $10,405,000 $ – $10,405,000 $ –
CONTINUED
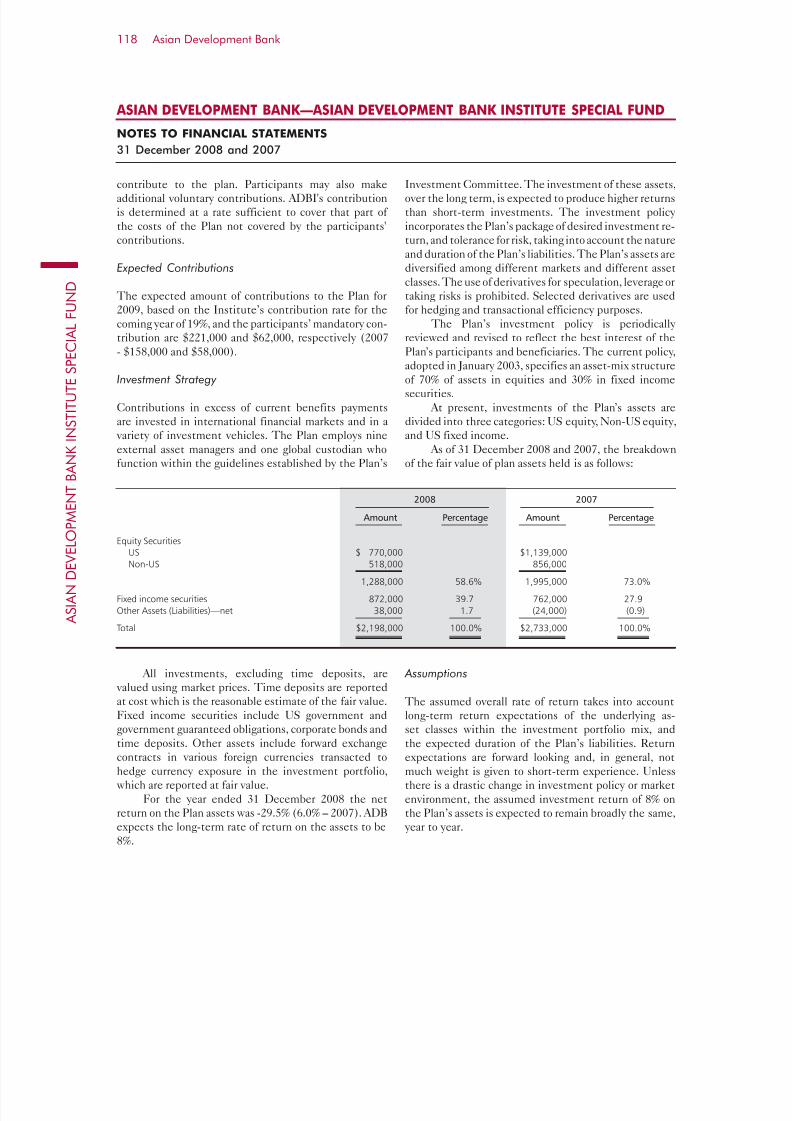
7/30/2019 ADB Annual Report 2008 - Financial Report
http://slidepdf.com/reader/full/adb-annual-report-2008-financial-report 120/218
ASIAN DEVELOPMENT BANK—ASIAN DEVELOPMENT BANK INSTITUTE SPECIAL FUND
NOTES TO FINANCIAL STATEMENTS
31 December 2008 and 2007
Asian Development Bank118
A S I A N
D E V E L O P M E N T B A N K I N S T I T U T E S P E C I A L F U N D
contribute to the plan. articipants may also makeadditional voluntary contributions. AB's contributionis determined at a rate sufficient to cover that part of the costs of the lan not covered by the participants'contributions.
Expected Contributions
he expected amount of contributions to the lan for2009, based on the nstitute’s contribution rate for thecoming year of 19%, and the participants’ mandatory con-tribution are $221,000 and $62,000, respectively (2007
- $158,000 and $58,000).
Investment Strategy
Contributions in excess of current benefits paymentsare invested in international financial markets and in a
variety of investment vehicles. he lan employs nineexternal asset managers and one global custodian whofunction within the guidelines established by the lan’s
nvestment Committee. he investment of these assets,over the long term, is expected to produce higher returnsthan short-term investments. he investment policy incorporates the lan’s package of desired investment re-turn, and tolerance for risk, taking into account the natureand duration of the lan’s liabilities. he lan’s assets arediversified among different markets and different assetclasses. he use of derivatives for speculation, leverage ortaking risks is prohibited. elected derivatives are usedfor hedging and transactional efficiency purposes.
he lan’s investment policy is periodically reviewed and revised to reflect the best interest of the
lan’s participants and beneficiaries. he current policy,adopted in anuary 2003, specifies an asset-mix structureof 70% of assets in equities and 30% in fixed incomesecurities.
At present, investments of the lan’s assets aredivided into three categories: equity, Non- equity,and fixed income.
As of 31 ecember 2008 and 2007, the breakdownof the fair value of plan assets held is as follows:
2008 2007
Amount Percentage Amount Percentage
Equity SecuritiesUS $ 770,000 $1,139,000Non-US 518,000 856,000
1,288,000 58.6% 1,995,000 73.0%
Fixed income securities 872,000 39.7 762,000 27.9Other Assets (Liabilities)—net 38,000 1.7 (24,000) (0.9)
Total $2,198,000 100.0% $2,733,000 100.0%
All investments, excluding time deposits, are valued using market prices. ime deposits are reportedat cost which is the reasonable estimate of the fair value.ixed income securities include government andgovernment guaranteed obligations, corporate bonds andtime deposits. ther assets include forward exchangecontracts in various foreign currencies transacted tohedge currency exposure in the investment portfolio,which are reported at fair value.
or the year ended 31 ecember 2008 the netreturn on the lan assets was -29.5% (6.0% – 2007). ABexpects the long-term rate of return on the assets to be8%.
Assumptions
he assumed overall rate of return takes into accountlong-term return expectations of the underlying as-set classes within the investment portfolio mix, andthe expected duration of the lan’s liabilities. eturnexpectations are forward looking and, in general, notmuch weight is given to short-term experience. nlessthere is a drastic change in investment policy or marketenvironment, the assumed investment return of 8% onthe lan’s assets is expected to remain broadly the same,
year to year.

7/30/2019 ADB Annual Report 2008 - Financial Report
http://slidepdf.com/reader/full/adb-annual-report-2008-financial-report 121/218
ADBISF-4
ASIAN DEVELOPMENT BANK—ASIAN DEVELOPMENT BANK INSTITUTE SPECIAL FUND
NOTES TO FINANCIAL STATEMENTS
31 December 2008 and 2007
119 Annual Report 2008
Postretirement Medical Benefits Plan
he nstitute participates in the cost-sharing plan of AB for retirees’ medical insurance premiums. nderthe plan, the nstitute is obligated to pay 75% of theroup Medical nsurance lan premiums for retireesand their eligible dependents who elected to participate.he cost-sharing plan is currently unfunded.
enerally accepted accounting principles requirean actuarially determined assessment of the periodiccost of postretirement medical benefits.
he following table sets forth the pension andpostretirement benefits at 31 ecember 2008 and31 ecember 2007:
PostretirementPension Benefits Medical Benefits
2008 2007 2008 2007
Change in benefit obligation:Projected benefit obligation at beginning of year $ 4,960,000 $ 4,269,000 $ 98,000 $ 231,000Service cost 163,000 126,000 20,000 14,000Interest cost 305,000 258,000 7,000 15,000Plan participants’ contributions 322,000 49,000 – –Transfers – 232,000 – –Actuarial (gain) loss (818,000) 430,000 (8,000) (152,000)Benefits paid (88,000) (404,000) (21,000) (10,000)
Projected benefit obligation at end of year $ 4,844,000 $ 4,960,000 $ 96,000 $ 98,000
Change in plan assets:Fair value of plan assets at beginning of year $ 2,733,000 $ 2,623,000 $ – $ –Actual return on plan assets (851,000) 149,000 – –Employer’s contribution 82,000 84,000 21,000 10,000
Plan participants’ contributions 322,000 49,000 – –Transfers – 232,000 – –Benefits paid (88,000) (404,000) (21,000) (10,000)
Fair value of plan assets at end of year $ 2,198,000 $ 2,733,000 $ – $ –
Funded Status $(2,646,000) $(2,227,000) $ (96,000) $ (98,000)
Amounts recognized in the Balance sheet consist of:Current liability $ – $ – $ – $ –Non-current liability (2,646,000) (2,227,000) (96,000) (98,000)
Net amount recognized $(2,646,000) $(2,227,000) $ (96,000) $ (98,000)
Amounts recognized in the Unrestricted net assetsconsist of:
Net actuarial loss (gain) $ 994,000 $ 761,000 $ (395,000) $ (426,000)Prior service cost (credit) 10,000 15,000 (1,000) (32,000)
Net amount recognized $ 1,004,000 $ 776,000 $ (396,000) $ (458,000)
Weighted-average assumptions as of 31 DecemberDiscount rate 7.25% 6.00% 7.25% 6.00%Expected return on plan assets 8.00% 8.00% N/A N/ARate of compensation increase varies with
age and averages 5.05% 4.65% 5.05% 4.65%
CONTINUED

7/30/2019 ADB Annual Report 2008 - Financial Report
http://slidepdf.com/reader/full/adb-annual-report-2008-financial-report 122/218
ASIAN DEVELOPMENT BANK—ASIAN DEVELOPMENT BANK INSTITUTE SPECIAL FUND
NOTES TO FINANCIAL STATEMENTS
31 December 2008 and 2007
Asian Development Bank120
A S I A N
D E V E L O P M E N T B A N K I N S T I T U T E S P E C I A L F U N D
or measurement purposes, a 9.0% annual rate of increase in the per capita cost of covered health carebenefits was assumed for the valuation as at 31 ecember
2008. he rate was assumed to decrease gradually to5.0% for 2013 and remain at that level thereafter.
PostretirementPension Benefits Medical Benefits
2008 2007 2008 2007
Components of net periodic benefit cost:Service cost $163,000 $126,000 $ 20,000 $ 14,000Interest cost 305,000 258,000 7,000 15,000Expected return on plan assets (226,000) (198,000) – –
Amortization of prior service cost 5,000 5,000 (31,000) (31,000)Recognized actuarial loss 26,000 – (39,000) (24,000)
Net periodic benefit cost $273,000 $191,000 $(43,000) $(26,000)
he accumulated benefit obligation of the pensionplan as of 31 ecember 2008 was $4,635,000 ($4,726,000– 2007).
A one-percentage-point change in assumed healthcare cost trend rates would have the following effects:
1-Percentage- 1-Percentage-
Point Increase Point Decrease
Effect on total service andinterest cost components $ 7,000 $ (5,000)
Effect on postretirementbenefit obligation 22,000 (19,000)
Estimated Future Benefits Payments
he following table shows the benefit payments expectedto be paid in each of the next five years and subsequentfive years. he expected benefit payments are basedon the same assumptions used to measure the benefitobligation at 31 ecember 2008:
PostretirementPension Benefits Medical Benefits
2009 $ 215,000 $ –2010 179,000 –2011 209,000 –2012 241,000 –2013 272,000 1,0002014-2018 1,671,000 12,000
ADBISF-4

7/30/2019 ADB Annual Report 2008 - Financial Report
http://slidepdf.com/reader/full/adb-annual-report-2008-financial-report 123/218
121 Annual Report 2008
ASIAN TSUNAMI FUND
Management's Report on Internal Control over Financial Reporting
he management of Asian evelopment Bank (“AB”) is responsible for establishing and
maintaining adequate internal control over financial reporting. AB's internal control overfinancial reporting is a process designed to provide reasonable assurance regarding the reliabil-
ity of financial reporting and the preparation of financial statements for external purposes in
accordance with generally accepted accounting principles in the nited tates of America.
AB's internal control over financial reporting includes those policies and procedures that
(i) pertain to the maintenance of records that, in reasonable detail, accurately and fairly re-
flect the transactions and dispositions of the assets of AB; (ii) provide reasonable assurance
that transactions are recorded as necessary to permit preparation of financial statements in
accordance with generally accepted accounting principles, and that receipts and expenditures
of AB are being made only in accordance with authorizations of management and directors
of AB; and (iii) provide reasonable assurance regarding prevention or timely detection of
unauthorized acquisition, use or disposition of AB's assets that could have a material effecton the financial statements.
Because of its inherent limitations, internal control over financial reporting may not prevent
or detect misstatements. Also, projections of any evaluation of effectiveness to future periods
are subject to the risk that controls may become inadequate because of changes in conditions,
or that the degree of compliance with the policies or procedures may deteriorate.
AB's management assessed the effectiveness of AB's internal control over financial report-
ing as of 31 ecember 2008. n making this assessment, AB's management used the criteria
set forth by the Committee of ponsoring rganizations of the readway Commission in
Internal Control – Integrated Framework. Based on that assessment, management believes that as
of 31 ecember 2008, AB's internal control over financial reporting is effective based uponthe criteria established in Internal Control – Integrated Framework.
aruhiko uroda
resident
Bindu N. ohani
ice resident (inance and Administration)
ong-ang ung
Controller
5 March 2009

7/30/2019 ADB Annual Report 2008 - Financial Report
http://slidepdf.com/reader/full/adb-annual-report-2008-financial-report 124/218
Asian Development Bank122
A S I A N
T S U N A M I F U N D
Report of Independent Auditors to the Asian Development Bank
n our opinion, the accompanying statements of financial position and the related statements of ac-
tivities and changes in net assets and cash flows present fairly, in all material respects, the financial
position of the Asian evelopment Bank (“AB” or “the Bank”)—Asian sunami und at 31 ecember
2008 and 2007, and the results of its activities and changes in net assets and its cash flows for the
years then ended, in conformity with accounting principles generally accepted in the nited tates of
America. Also in our opinion, management’s assertion that AB maintained, effective internal control
over financial reporting as of 31 ecember 2008 is fairly stated, in all material respects, based on
criteria established in nternal Control - ntegrated ramework issued by the Committee of ponsor-
ing rganizations of the readway Commission (C). he management of AB is responsible
for these financial statements, for maintaining effective internal control over financial reporting and
for its assertion of the effectiveness of internal control over financial reporting, included in the ac-
companying Management's eport on nternal Control over inancial eporting. ur responsibility
is to express opinions on these financial statements and on AB’s internal control over financial re-
porting based on our integrated audit in 2008 and financial statement audit in 2007. e conducted
our audits of the financial statements in accordance with auditing standards generally accepted inthe nited tates of America and our audit of internal control over financial reporting in accordance
with attestation standards established by the American nstitute of Certified ublic Accountants.
hose standards require that we plan and perform the audits to obtain reasonable assurance about
whether the financial statements are free of material misstatement and whether effective internal
control over financial reporting was maintained in all material respects. ur audits of the financial
statements included examining, on a test basis, evidence supporting the amounts and disclosures in
the financial statements, assessing the accounting principles used and significant estimates made
by management, and evaluating the overall financial statement presentation. ur audit of internal
control over financial reporting included obtaining an understanding of internal control over financial
reporting, assessing the risk that a material weakness exists, and testing and evaluating the design
and operating effectiveness of internal control based on the assessed risk. ur audits also included
performing such other procedures as we considered necessary in the circumstances. e believe thatour audits provide a reasonable basis for our opinions.
PricewaterhouseCoopers LLP
pwc.com/sg
8 Cross Street #17-00
PWC Building
Singapore 048424Telephone (65) 6236 3388
Facsimile (65) 6236 3300
GST No.: M90362193L
Reg. No.: T09LL0001D
PricewaterhouseCoopers LLP (Registration No. T09LL0001D) is an accounting limited liability partnership registered in Singapore under the Limited Liability Partner-ships Act (Chapter 163A). It was converted from a partnership (with the name “PricewaterhouseCoopers” and Registration no. 000640) to an accounting limitedliability partnership on 1 January 2009. PricewaterhouseCoopers LLP is part of the network of member firms of PricewaterhouseCoopers International Limited, eachof which is a separate and independent legal entity.
7/30/2019 ADB Annual Report 2008 - Financial Report
http://slidepdf.com/reader/full/adb-annual-report-2008-financial-report 125/218
123 Annual Report 2008
A company’s internal control over financial reporting is a process effected by those charged withgovernance, management, and other personnel, designed to provide reasonable assurance regardingthe preparation of reliable financial statements in accordance with accounting principles generally accepted in the nited tates of America. A company’s internal control over financial reporting in-cludes those policies and procedures that (i) pertain to the maintenance of records that, in reasonabledetail, accurately and fairly reflect the transactions and dispositions of the assets of the company;(ii) provide reasonable assurance that transactions are recorded as necessary to permit preparation of financial statements in accordance with generally accepted accounting principles, and that receipts andexpenditures of the company are being made only in accordance with authorizations of managementand those charged with governance; and (iii) provide reasonable assurance regarding prevention, ortimely detection of unauthorized acquisition, use, or disposition of the company’s assets that couldhave a material effect on the financial statements.
Because of its inherent limitations, internal control over financial reporting may not prevent or detect
misstatements. Also, projections of any evaluation of effectiveness to future periods are subject to
the risk that controls may become inadequate because of changes in conditions, or that the degree
of compliance with the policies or procedures may deteriorate.
ricewaterhouseCoopers
ublic Accountants and Certified ublic Accountants
ingapore
5 March 2009

7/30/2019 ADB Annual Report 2008 - Financial Report
http://slidepdf.com/reader/full/adb-annual-report-2008-financial-report 126/218
Asian Development Bank124
A S I A N
T S U N A M I F U N D
ATF-1
ASIAN DEVELOPMENT BANK—ASIAN TSUNAMI FUND
STATEMENT OF FINANCIAL POSITION
31 December 2008 and 2007
Expressed in Thousands of United States Dollars (Note B)
2008 2007
ASSETS
DUE FROM BANKS (Note B) $ 383 $ 161
INVESTMENTS (Notes B, C, and G)Time deposits $ 93,032 $366,524Corporate bonds 158,256 251,288 – 366,524
ACCRUED REVENUE 731 375
ADVANCES FOR GRANTS (Note B) 43,017 62,443
TOTAL $295,419 $429,503
LIABILITIES AND UNCOMMITTED BALANCES
ACCOUNTS PAYABLE AND OTHER LIABILITIES (Note D) $ 694 $ 363
UNDISBURSED COMMITMENTS (Notes B, E, and G) 248,338 389,132
UNCOMMITTED BALANCES (ATF-2) (Notes B and F), represented by:Unrestricted net assets 46,387 40,008
TOTAL $295,419 $429,503
The accompanying notes are an integral part of these financial statements (ATF-4).

7/30/2019 ADB Annual Report 2008 - Financial Report
http://slidepdf.com/reader/full/adb-annual-report-2008-financial-report 127/218
125 Annual Report 2008
ATF-2
ASIAN DEVELOPMENT BANK—ASIAN TSUNAMI FUND
STATEMENT OF ACTIVITIES AND CHANGES IN NET ASSETS
For the Years Ended 31 December 2008 and 2007
Expressed in Thousands of United States Dollars (Note B)
2008 2007
CHANGES IN UNRESTRICTED NET ASSETS
REVENUEFrom investments (Notes B and C) $ 9,125 $ 22,257From other sources 215 $ 9,340 389 $ 22,646
EXPENSESTechnical assistance (Notes B and E) – (115)Administrative expenses (Note D) 2,849 2,218
Financial expenses 2 2,851 1 2,104
REVENUE IN EXCESS OF EXPENSES 6,489 20,542
EXCHANGE LOSSES (Note B) (110) (16) INCREASE IN NET ASSETS 6,379 20,526
NET ASSETS AT BEGINNING OF YEAR 40,008 19,482
NET ASSETS AT END OF YEAR $ 46,387 $ 40,008
The accompanying notes are an integral part of these financial statements (ATF-4).

7/30/2019 ADB Annual Report 2008 - Financial Report
http://slidepdf.com/reader/full/adb-annual-report-2008-financial-report 128/218
Asian Development Bank126
A S I A N
T S U N A M I F U N D
ATF-3
ASIAN DEVELOPMENT BANK—ASIAN TSUNAMI FUND
STATEMENT OF CASH FLOWS
For the Years Ended 31 December 2008 and 2007
Expressed in Thousands of United States Dollars (Note B)
2008 2007 CASH FLOWS FROM OPERATING ACTIVITIES
Interest on investments received $ 7,622 $ 22,644Grants / Technical assistance disbursed (121,820) (128,707)Administrative expenses paid (2,178) (2,107)Cash received from other sources 216 387
Net Cash Used in Operating Activities (116,160) (107,783) CASH FLOWS FROM INVESTING ACTIVITIES
Maturities of investments 9,337,364 9,180,041
Purchases of investments (9,220,982) (9,072,380) Net Cash Provided by Investing Activities 116,382 107,661
Net Increase (Decrease) in Due from Banks 222 (122) Due from Banks at Beginning of Year 161 283
Due from Banks at End of Year $ 383 $ 161
RECONCILIATION OF INCREASE IN NET ASSETSTO NET CASH USED IN OPERATING ACTIVITIES:
Increase in net assets (ATF-2) $ 6,379 $ 20,526
Adjustments to reconcile increase in net assetsto net cash used in operating activities:Amortization of discounts/premiums on investments (834) –Change in accrued revenue (357) 386Change in advances for grants 19,427 (20,543)Change in accounts payable and other liabilities 331 110Change in undisbursed commitments (140,794) (108,262)Change in unrealized investment gains (312) –
Net Cash Used in Operating Activities $ (116,160) $ (107,783)
The accompanying notes are an integral part of these financial statements (ATF-4).
7/30/2019 ADB Annual Report 2008 - Financial Report
http://slidepdf.com/reader/full/adb-annual-report-2008-financial-report 129/218
ATF-4
ASIAN DEVELOPMENT BANK—ASIAN TSUNAMI FUND
NOTES TO FINANCIAL STATEMENTS
31 December 2008 and 2007
127 Annual Report 2008
NOTE A— NATURE OF OPERATIONS
he Asian sunami und (A) was established on 11ebruary 2005 in response to the special circumstancessurrounding the developing member countries (MCs)that were stricken by the effects of the tsunami on 26ecember 2004. he purpose of A is to provideemergency grant financing promptly and effectively toaffected MCs in the form of technical assistance (As)and investment projects to support reconstruction,rehabilitation and associated development activities fol-lowing the tsunami disaster.
A will serve as a dedicated source of grantfinancing to support priority rehabilitation andreconstruction needs on a multi-sector basis. esourcesfrom the und will be available to central governmentsand other suitable entities including non-governmentalorganizations.
A’s resources may consist of allocations from thenet income of rdinary Capital esources (C) andcontributions from bilateral, multilateral and individualsources.
NOTE B— SUMMARY OF SIGNIFICANT ACCOUNTING POLICIES
Presentation of the Financial Statements
he financial statements of the A are presented onthe basis of those for not-for-profit organizations.
A reports donors’ contributions of cash and otherassets as unrestricted assets as these are made availableto A without conditions other than for the purpose of pursuing its objectives.
Functional and Reporting Currency
he nited tates dollar is the functional and report-
ing currency, representing the currency of the primary economic operating environment of A.
Translation of Currencies
AB adopts the use of daily exchange rates for account-ing and financial reporting purposes. his allows transac-tions denominated in non- dollar to be translated to
the reporting currency using exchange rates applicableat the time of transactions. Contributions included inthe financial statements during the year are recognizedat applicable exchange rates as of the respective datesof commitment. At the end of each accounting month,translations of assets, liabilities, and uncommittedbalances which are denominated in non- dollar areadjusted using the applicable rates of exchange at theend of the reporting period. hese translation adjust-ments are accounted for as exchange gains or losses andare credited or charged to operations.
Investments
All investment securities held by A are reported atestimated fair value, which represents their fair market
value. ealized and unrealized gains and losses are in-cluded in revenue. ime deposits are reported at costwhich is a reasonable estimate of fair value.
nterest income on investment securities and timedeposits are recognized as realized and reported, net of amortizations of premiums and discounts.
Contributions
he contributions from donors and the allocations fromC net income are included in the financial statements,from the date of effectivity of the contribution agreement,and the Board of overnors’ approval, respectively.
Technical Assistance, Grants and UndisbursedCommitments
echnical Assistance and grants are recognized in thefinancial statements when the project is approved andbecomes effective. pon completion of the A projector cancellation of a grant, any undisbursed amount iswritten back as a reduction in technical assistance or
grants for the year and the corresponding undisbursedcommitment is eliminated accordingly.
Advances are provided from technical assistancegrant funds to the executing agency or co-operatinginstitution, for the purpose of making payments foreligible expenses. he advances shall be subject toliquidation and charged against undisbursed commitment,any unutilized portion shall be refunded to the fund.

7/30/2019 ADB Annual Report 2008 - Financial Report
http://slidepdf.com/reader/full/adb-annual-report-2008-financial-report 130/218
ASIAN DEVELOPMENT BANK—ASIAN TSUNAMI FUND
NOTES TO FINANCIAL STATEMENTS
31 December 2008 and 2007
Asian Development Bank128
A S I A N
T S U N A M I F U N D
Accounting Estimates
he preparation of financial statements in conformity with generally accepted accounting principles requiresManagement to make reasonable estimates and assump-tions that affect the reported amounts of assets andliabilities and uncommitted balances as at the end of the
year and the reported amounts of revenue and expensesduring the year. he actual results could differ fromthose estimates.
Statement of Cash Flows
or the purposes of the tatement of Cash lows, Aconsiders that its cash and cash equivalents are limitedto “ M BAN.”
NOTE C—INVESTMENTS
he main investment management objective is to main-tain security and liquidity. ubject to these parameters,
AB seeks the highest possible return on its investments.nvestments are governed by the nvestment Authority approved by the Board of irectors in 1999, and reviewedin 2006. he review endorsed a portfolio strategy that is
largely consistent with the 1999 approach.nvestment securities and negotiable certificate of
deposits held as of 31 ecember 2008 are classified as“Available for ale” and are reported at fair value, whichrepresents their fair market value. nrealized gains andlosses are included in revenue from investments.
he annualized rate of return on the averageinvestments held during the year, based on the portfolioheld at the beginning and end of each month was 2.96%(5.27% – 2007).
NOTE D—RELATED PARTY TRANSACTIONS
he C and special fund resources are at all timesused, committed, and invested entirely separate fromeach other. he administrative and operational expensespertaining to A are settled on a regular basis betweenC and A. As of 31 ecember 2008, $669,000($343,000 – 2007) was payable to C which is includedin accounts payable and other liabilities.
NOTE E—UNDISBURSED COMMITMENTS
ndisbursed commitments are denominated in nitedtates dollars and represent effective technical assist-ance and grants not yet disbursed. he fair value of undisbursed commitments approximates the amountsoutstanding, because AB expects that disbursementswill substantially be made for all the projects/programscovered by the commitments.
n 2008, there were no undisbursed commitmentson closed A projects that were written back as areduction of technical assistance ($115,000 – 2007).
NOTE F— CONTRIBUTIONS ANDUNCOMMITTED BALANCES
n April and May 2005, AB contributed $600,000,000from C surplus to A. Contributions were alsoreceived from Australia and uxembourg amounting to$3,796,000 and $1,000,000, respectively. n November2005, following the establishment of akistan arthquakeund () in response to the special circumstancessurrounding the 8 ctober 2005 earthquake in akistan,unutilized A fund of $40,000,000 was transferredback to C, which was subsequently transferred to
. Another $10,000,000 was returned to C in une2006 and was committed as ABs contribution to the
ava econstruction und in November 2008, to supportpost-disaster management, rehabilitation, immediateconstruction, and urgent vital development activities in
ogyakarta and Central ava in ndonesia.No contributions were received in 2008 and 2007.ncommitted balances comprised of amounts
which have not been committed by AB as at 31ecember 2008 and 2007.
NOTE G—FAIR VALUE MEASUREMENTS
A 157 defines fair value as the price that would bereceived to sell an asset or paid to transfer a liability atmeasurement date (exit price) in an orderly transactionamong willing participants with an assumption that thetransaction takes place in the entity’s principal market,the most advantageous market for the asset or liability.he most advantageous market is the market where thesale of the asset or transfer of liability would maximize the
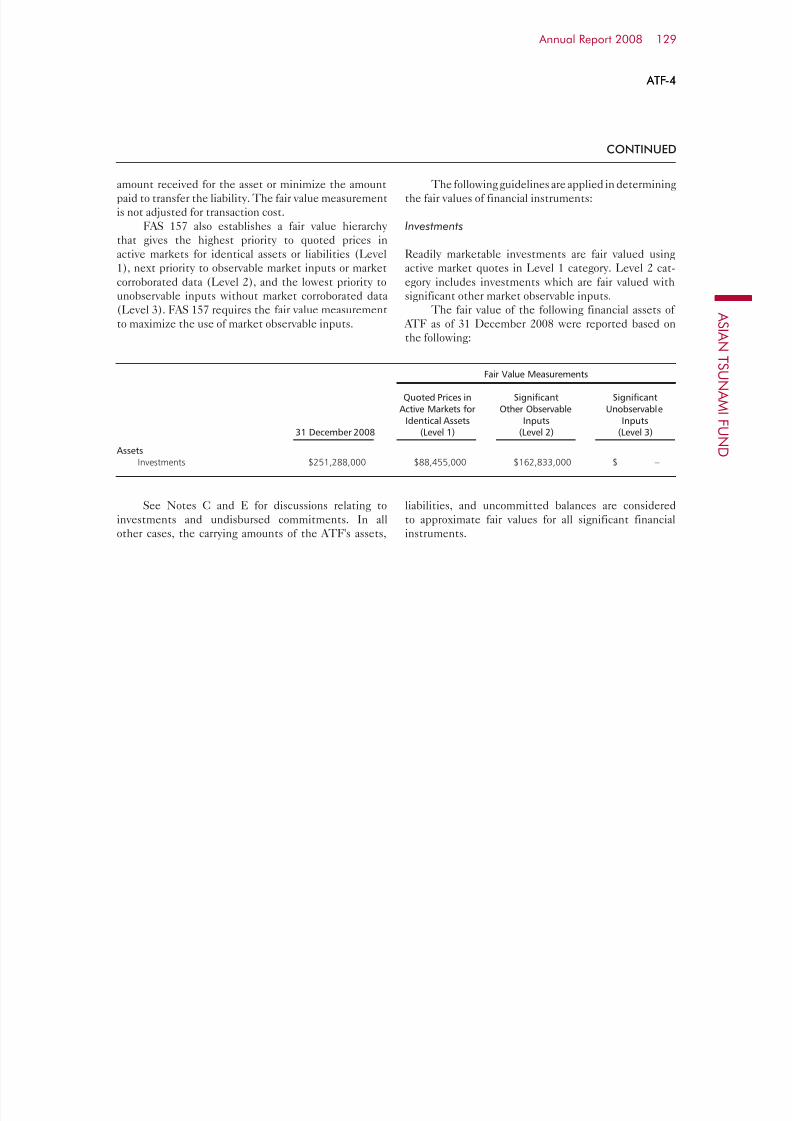
7/30/2019 ADB Annual Report 2008 - Financial Report
http://slidepdf.com/reader/full/adb-annual-report-2008-financial-report 131/218
ATF-4
ASIAN DEVELOPMENT BANK—ASIAN TSUNAMI FUND
NOTES TO FINANCIAL STATEMENTS
31 December 2008 and 2007
129 Annual Report 2008
ATF-4
amount received for the asset or minimize the amountpaid to transfer the liability. he fair value measurementis not adjusted for transaction cost.
A 157 also establishes a fair value hierarchy that gives the highest priority to quoted prices inactive markets for identical assets or liabilities (evel1), next priority to observable market inputs or marketcorroborated data (evel 2), and the lowest priority tounobservable inputs without market corroborated data(evel 3). A 157 requires the fair value measurementto maximize the use of market observable inputs.
he following guidelines are applied in determiningthe fair values of financial instruments:
Investments
eadily marketable investments are fair valued usingactive market quotes in evel 1 category. evel 2 cat-egory includes investments which are fair valued withsignificant other market observable inputs.
he fair value of the following financial assets of A as of 31 ecember 2008 were reported based onthe following:
ee Notes C and for discussions relating toinvestments and undisbursed commitments. n all
other cases, the carrying amounts of the A's assets,
Fair Value Measurements
Quoted Prices in Significant SignificantActive Markets for Other Observable Unobservable
Identical Assets Inputs Inputs31 December 2008 (Level 1) (Level 2) (Level 3)
Assets Investments $251,288,000 $88,455,000 $162,833,000 $ –
liabilities, and uncommitted balances are consideredto approximate fair values for all significant financial
instruments.
CONTINUED
7/30/2019 ADB Annual Report 2008 - Financial Report
http://slidepdf.com/reader/full/adb-annual-report-2008-financial-report 132/218
Asian Development Bank130
P A
K I S T A N
E A R T H Q U A K E F U N D
PAKISTAN EARTHQUAKE FUND
Management's Report on Internal Control over Financial Reporting
he management of Asian evelopment Bank (“AB”) is responsible for establishing and
maintaining adequate internal control over financial reporting. AB's internal control overfinancial reporting is a process designed to provide reasonable assurance regarding the reliabil-
ity of financial reporting and the preparation of financial statements for external purposes in
accordance with generally accepted accounting principles in the nited tates of America.
AB's internal control over financial reporting includes those policies and procedures that
(i) pertain to the maintenance of records that, in reasonable detail, accurately and fairly re-
flect the transactions and dispositions of the assets of AB; (ii) provide reasonable assurance
that transactions are recorded as necessary to permit preparation of financial statements in
accordance with generally accepted accounting principles, and that receipts and expenditures
of AB are being made only in accordance with authorizations of management and directors
of AB; and (iii) provide reasonable assurance regarding prevention or timely detection of
unauthorized acquisition, use or disposition of AB's assets that could have a material effecton the financial statements.
Because of its inherent limitations, internal control over financial reporting may not prevent
or detect misstatements. Also, projections of any evaluation of effectiveness to future periods
are subject to the risk that controls may become inadequate because of changes in conditions,
or that the degree of compliance with the policies or procedures may deteriorate.
AB's management assessed the effectiveness of AB's internal control over financial report-
ing as of 31 ecember 2008. n making this assessment, AB's management used the criteria
set forth by the Committee of ponsoring rganizations of the readway Commission in
Internal Control – Integrated Framework. Based on that assessment, management believes that as
of 31 ecember 2008, AB's internal control over financial reporting is effective based uponthe criteria established in Internal Control – Integrated Framework.
aruhiko uroda
resident
Bindu N. ohani
ice resident (inance and Administration)
ong-ang ung
Controller
5 March 2009
7/30/2019 ADB Annual Report 2008 - Financial Report
http://slidepdf.com/reader/full/adb-annual-report-2008-financial-report 133/218
131 Annual Report 2008
Report of Independent Auditors to the Asian Development Bank
n our opinion, the accompanying statements of financial position and the related statements of ac-
tivities and changes in net assets and cash flows present fairly, in all material respects, the financial
position of the Asian evelopment Bank (“AB” or “the Bank”)—akistan arthquake und at 31ecember 2008 and 2007, and the results of its activities and changes in net assets and its cash flows
for the years then ended, in conformity with accounting principles generally accepted in the nited
tates of America. Also in our opinion, management’s assertion that AB maintained effective inter-
nal control over financial reporting as of 31 ecember 2008 is fairly stated, in all material respects,
based on criteria established in nternal Control - ntegrated ramework issued by the Committee of
ponsoring rganizations of the readway Commission (C). he management of AB is respon-
sible for these financial statements, for maintaining effective internal control over financial reporting
and for its assertion of the effectiveness of internal control over financial reporting, included in the
accompanying Management’s eport on nternal Control over inancial eporting. ur responsibil-
ity is to express opinions on these financial statements and on AB’s internal control over financial
reporting based on our integrated audit in 2008 and financial statement audit in 2007. e conducted
our audits of the financial statements in accordance with auditing standards generally accepted inthe nited tates of America and our audit of internal control over financial reporting in accordance
with attestation standards established by the American nstitute of Certified ublic Accountants.
hose standards require that we plan and perform the audits to obtain reasonable assurance about
whether the financial statements are free of material misstatement and whether effective internal
control over financial reporting was maintained in all material respects. ur audits of the financial
statements included examining, on a test basis, evidence supporting the amounts and disclosures in
the financial statements, assessing the accounting principles used and significant estimates made
by management, and evaluating the overall financial statement presentation. ur audit of internal
control over financial reporting included obtaining an understanding of internal control over financial
reporting, assessing the risk that a material weakness exists, and testing and evaluating the design
and operating effectiveness of internal control based on the assessed risk. ur audits also included
performing such other procedures as we considered necessary in the circumstances. e believe thatour audits provide a reasonable basis for our opinions.
PricewaterhouseCoopers LLP
pwc.com/sg
8 Cross Street #17-00
PWC Building
Singapore 048424
Telephone (65) 6236 3388
Facsimile (65) 6236 3300
GST No.: M90362193L
Reg. No.: T09LL0001D
PricewaterhouseCoopers LLP (Registration No. T09LL0001D) is an accounting limited liability partnership registered in Singapore under the Limited Liability Partner-ships Act (Chapter 163A). It was converted from a partnership (with the name “PricewaterhouseCoopers” and Registration no. 000640) to an accounting limitedliability partnership on 1 January 2009. PricewaterhouseCoopers LLP is part of the network of member firms of PricewaterhouseCoopers International Limited, eachof which is a separate and independent legal entity.
7/30/2019 ADB Annual Report 2008 - Financial Report
http://slidepdf.com/reader/full/adb-annual-report-2008-financial-report 134/218
Asian Development Bank132
P A
K I S T A N
E A R T H Q U A K E F U N D
A company’s internal control over financial reporting is a process effected by those charged withgovernance, management, and other personnel, designed to provide reasonable assurance regarding
the preparation of reliable financial statements in accordance with accounting principles generally
accepted in the nited tates of America. A company’s internal control over financial reporting in-
cludes those policies and procedures that (i) pertain to the maintenance of records that, in reasonable
detail, accurately and fairly reflect the transactions and dispositions of the assets of the company;
(ii) provide reasonable assurance that transactions are recorded as necessary to permit preparation of
financial statements in accordance with generally accepted accounting principles, and that receipts and
expenditures of the company are being made only in accordance with authorizations of management
and those charged with governance; and (iii) provide reasonable assurance regarding prevention, or
timely detection of unauthorized acquisition, use, or disposition of the company’s assets that could
have a material effect on the financial statements.
Because of its inherent limitations, internal control over financial reporting may not prevent or detect
misstatements. Also, projections of any evaluation of effectiveness to future periods are subject to
the risk that controls may become inadequate because of changes in conditions, or that the degree
of compliance with the policies or procedures may deteriorate.
ricewaterhouseCoopers
ublic Accountants and Certified ublic Accountants
ingapore
5 March 2009

7/30/2019 ADB Annual Report 2008 - Financial Report
http://slidepdf.com/reader/full/adb-annual-report-2008-financial-report 135/218
133 Annual Report 2008
PEF-1
ASIAN DEVELOPMENT BANK—PAKISTAN EARTHQUAKE FUND
STATEMENT OF FINANCIAL POSITION
31 December 2008 and 2007
Expressed in Thousands of United States Dollars (Note B)
2008 2007
ASSETS
DUE FROM BANKS (Note B) $ 823 $ 1,601
INVESTMENTS (Notes B, C, and G)Government or government-guaranteed obligations $ 8,066 $ –Time deposits 53,237 61,303 60,690 60,690
ACCRUED REVENUE 111 121
DUE FROM CONTRIBUTORS (Notes B and F) 2,973 6,395
ADVANCES FOR GRANTS (Note B) 3,187 1,007
TOTAL $68,397 $69,814
LIABILITIES AND UNCOMMITTED BALANCES
MISCELLANEOUS LIABILITIES (Note D) $ 33 $ 30
UNDISBURSED COMMITMENTS (Notes B, E, and G) 66,161 73,237
UNCOMMITTED BALANCES (PEF-2) (Notes B and F), represented by:Unrestricted net assets 2,203 (3,453)
TOTAL $68,397 $ 69,814
The accompanying notes are an integral part of these financial statements (PEF-4).

7/30/2019 ADB Annual Report 2008 - Financial Report
http://slidepdf.com/reader/full/adb-annual-report-2008-financial-report 136/218
Asian Development Bank134
P A
K I S T A N
E A R T H Q U A K E F U N D
PEF-2
ASIAN DEVELOPMENT BANK—PAKISTAN EARTHQUAKE FUND
STATEMENT OF ACTIVITIES AND CHANGES IN NET ASSETS
For the Years Ended 31 December 2008 and 2007
Expressed in Thousands of United States Dollars (Note B)
2008 2007
CHANGES IN UNRESTRICTED NET ASSETS
CONTRIBUTIONS (Notes B and F) $ 10,225 $ 19,123
REVENUEFrom investments (Notes B and C) $ 3,078 $ 2,387From other sources 171 3,249 201 2,588
Total 13,474 21,711
EXPENSESGrants (Note B) – 30,000Technical assistance (Notes B and E) – 2,000Administrative expenses (Note D) 171 171 70 32,070
CONTRIBUTIONS AND REVENUE IN EXCESS OF(LESS THAN) EXPENSES 13,303 (10,359)
NET EXCHANGE (LOSSES) GAINS (Note B) (7,647) 860
INCREASE (DECREASE) IN NET ASSETS 5,656 (9,499)
NET ASSETS AT BEGINNING OF YEAR (3,453) 6,046
NET ASSETS AT END OF YEAR $ 2,203 $ (3,453)
The accompanying notes are an integral part of these financial statements (PEF-4).

7/30/2019 ADB Annual Report 2008 - Financial Report
http://slidepdf.com/reader/full/adb-annual-report-2008-financial-report 137/218
135 Annual Report 2008
PEF-3
ASIAN DEVELOPMENT BANK—PAKISTAN EARTHQUAKE FUND
STATEMENT OF CASH FLOWS
For the Years Ended 31 December 2008 and 2007
Expressed in Thousands of United States Dollars (Note B)
2008 2007
CASH FLOWS FROM OPERATING ACTIVITIESContributions received $ 13,094 $ 25,100Interest on investments received 2,940 2,331Cash received from other sources 171 201Grants and technical assistance disbursed (9,256) (1,980)Administrative and financial expenses paid (168) (40)
Net Cash Provided by Operating Activities 6,781 25,612
CASH FLOWS FROM INVESTING ACTIVITIES
Maturities of investments 1,134,641 767,960Acquisition of investments (1,141,160) (793,545) Net Cash Used in Investing Activities (6,519) (25,585) Effect of Exchange Rate Changes on Due from Banks (1,040) (44) Net Decrease in Due from Banks (778) (17) Due from Banks at Beginning of Year 1,601 1,618
Due from Banks at End of Year $ 823 $ 1,601
RECONCILIATION OF INCREASE (DECREASE) IN NET ASSETS
TO NET CASH PROVIDED BY OPERATING ACTIVITIES:
Increase (decrease) in net assets (PEF-2) $ 5,656 $ (9,499)Adjustments to reconcile increase (decrease) in net assets
to net cash provided by operating activities:Amortization of discounts/premiums on investments (97) –Change in accrued revenue 10 (56)Change in due from contributors 2,255 5,257Change in advances for grants (2,180) (717)Change in miscellaneous liabilities 4 30Change in undisbursed commitments (7,077) 30,737Translation adjustments 8,261 (140)Change in unrealized investment holding gains (51) –
Net Cash Provided by Operating Activities $ 6,781 $ 25,612
The accompanying notes are an integral part of these financial statements (PEF-4).

7/30/2019 ADB Annual Report 2008 - Financial Report
http://slidepdf.com/reader/full/adb-annual-report-2008-financial-report 138/218
ASIAN DEVELOPMENT BANK—PAKISTAN EARTHQUAKE FUND
NOTES TO FINANCIAL STATEMENTS
31 December 2008 and 2007
Asian Development Bank136
P A
K I S T A N
E A R T H Q U A K E F U N D
NOTE A—NATURE OF OPERATIONS
he akistan arthquake und () was establishedon 14 November 2005 in response to the special circum-stances confronted by akistan resulting from the effectsof an earthquake on 8 ctober 2005. he objective of the is to deliver emergency grant financing promptly andeffectively to akistan in the form of technical assistance(A) and investment projects to support reconstruction,rehabilitation, and associated development activities.
resources will be available to the overnmentof akistan and other suitable entities acceptable to the
overnment of akistan and AB, including, whereappropriate, non-government organizations.’s resources may consist of allocations from the
net income of rdinary Capital esources (C) andcontributions from bilateral, multilateral, and individualsources.
NOTE B— SUMMARY OF SIGNIFICANT
ACCOUNTING POLICIES
Presentation of the Financial Statements
he financial statements of the are presented on
the basis of those for not-for-profit organizations. reports donors’ contributions of cash and other
assets as unrestricted assets as these are made availableto without conditions other than for the purpose of pursuing its objectives.
Functional and Reporting Currency
he nited tates dollar is the functional and report-ing currency, representing the currency of the primary economic operating environment of .
Translation of Currencies
AB adopts the use of daily exchange rates for account-ing and financial reporting purposes. his allows transac-tions denominated in non- dollar to be translated tothe reporting currency using exchange rates applicableat the time of transactions. Contributions included inthe financial statements during the year are recognizedat applicable exchange rates as of the respective datesof commitment. At the end of each accounting month,translations of assets, liabilities, and uncommitted
balances which are denominated in non- dollar areadjusted using the applicable rates of exchange at theend of the reporting period. hese translation adjust-ments are accounted for as exchange gains or losses andare credited or charged to operations.
Investments
All investment securities held by are reported atestimated fair value, which represents their fair market
value. ealized and unrealized gains and losses are in-cluded in revenue. ime deposits are reported at cost
which is a reasonable estimate of fair value.nterest income on investment securities and timedeposits are recognized as realized and reported, net of amortizations of premiums and discounts.
Contributions
he contributions from donors and the allocations fromC net income are included in the financial statements,from the date of effectivity of the contribution agreement,and the Board of overnors’ approval, respectively.
Technical Assistance, Grants and Undisbursed
Commitments
echnical assistance and grants are recognized in thefinancial statements when the project is approved andbecomes effective. pon completion of a A project orcancellation of a grant, any undisbursed amount is writ-ten back as a reduction in technical assistance or grantsfor the year and the corresponding undisbursed commit-ment is eliminated accordingly.
Advances are provided from technical assistancegrant funds to the executing agency or co-operatinginstitution, for the purpose of making payments foreligible expenses. he advances shall be subject to
liquidation and charged against undisbursed commitment,any unutilized portion shall be refunded to the fund.
Accounting Estimates
he preparation of financial statements in conform-ity with generally accepted accounting principles requiresManagement to make reasonable estimates and assump-tions that affect the reported amounts of assets and liabili-ties and uncommitted balances as at the end of the year and

7/30/2019 ADB Annual Report 2008 - Financial Report
http://slidepdf.com/reader/full/adb-annual-report-2008-financial-report 139/218
PEF-4
ASIAN DEVELOPMENT BANK—PAKISTAN EARTHQUAKE FUND
NOTES TO FINANCIAL STATEMENTS
31 December 2008 and 2007
137 Annual Report 2008
CONTINUED
the reported amounts of revenue and expenses during the year. he actual results could differ from those estimates.
Statement of Cash Flows
or the purposes of the tatement of Cash lows, considers that its cash and cash equivalents are limitedto “ M BAN.”
NOTE C—INVESTMENTS
he main investment management objective is to main-
tain security and liquidity. ubject to these parameters, AB seeks the highest possible return on its investments.nvestments are governed by the nvestment Authority approved by the Board of irectors in 1999, and reviewedin 2006. he review endorsed a portfolio strategy that islargely consistent with the 1999 approach.
nvestment securities and negotiable certificateof deposits as of 31 ecember 2008 are considered“Available for ale” and are reported at fair value, whichrepresents their fair market value. nrealized gains andlosses are included in revenue from investments.
he currency compositions of the investmentportfolio as of 31 ecember 2008 and 2007 expressed in
nited tates dollars are as follows:
Currency 2008 2007
Pakistan rupee $25,087,000 $22,689,000United States dollar 36,216,000 38,001,000 Total $61,303,000 $60,690,000
he annualized rate of return on the averageinvestments held during the year, based on the portfolioheld at the beginning and end of each month was 5.24%(5.81% – 2007).
NOTE D—RELATED PARTY TRANSACTIONS
he C and special fund resources are at all timesused, committed, and invested entirely separate fromeach other. he administrative and operational expensespertaining to are settled on a regular basis betweenC and . As of 31 ecember 2008, $4,000 waspayable to C ($5,000 – 2007) which is included inmiscellaneous liabilities.
NOTE E—UNDISBURSED COMMITMENTS
ndisbursed commitments are denominated in nitedtates dollars and represent effective grants not yetdisbursed. he fair value of undisbursed commitmentsapproximates the amounts outstanding, because ABexpects that disbursements will substantially be made forall the projects/programs covered by the commitments.
NOTE F— CONTRIBUTIONS ANDUNCOMMITTED BALANCES
n November 2005, AB transferred $80,000,000 fromC urplus to . Contributions were also receivedfrom Australia and inland amounting to $15,036,000and $12,261,000, respectively.
n 2006 and 2007, instruments of contributionswere received from the overnment of Norway andthe ingdom of Belgium which undertook to makecontributions to the a maximum amount of $20,000,000 and €9,924,000, respectively. his is by way of a debt-for development swap arrangement withakistan, where akistan shall match the value of debtand debt service cancellations with equivalent amountsin akistan rupees, which shall be transferred to the und
as Norway’s and Belgium’s contributions. n 2008, received the remaining contributions due from Norway and Belgium amounting to $5,000,000 and €3,308,000($5,225,000 equivalent), respectively.
n 2006, the overnment of Australia committed A$20,000,000 ($15,036,000 equivalent). f this amount, A$4,300,000 ($2,973,000 equivalent) has not beenreceived as of 31 ecember 2008 and was recorded as“ue from Contributors.”
ncommitted balances comprised of amountswhich have not been committed by AB as at 31ecember 2008, and committed amount which exceededcumulative resources as of 31 ecember 2007. his
shortfall was covered by additional contributions fromNorway and Belgium in 2008.
NOTE G—FAIR VALUE MEASUREMENTS
A 157 defines fair value as the price that would bereceived to sell an asset or paid to transfer a liability atmeasurement date (exit price) in an orderly transactionamong willing participants with an assumption that thetransaction takes place in the entity’s principal market,

7/30/2019 ADB Annual Report 2008 - Financial Report
http://slidepdf.com/reader/full/adb-annual-report-2008-financial-report 140/218
ASIAN DEVELOPMENT BANK—PAKISTAN EARTHQUAKE FUND
NOTES TO FINANCIAL STATEMENTS
31 December 2008 and 2007
Asian Development Bank138
P A
K I S T A N
E A R T H Q U A K E F U N D
PEF-4
the most advantageous market for the asset or liability.he most advantageous market is the market where thesale of the asset or transfer of liability would maximize theamount received for the asset or minimize the amountpaid to transfer the liability. he fair value measurementis not adjusted for transaction cost.
A 157 also establishes a fair value hierarchy that gives the highest priority to quoted prices inactive markets for identical assets or liabilities (evel1), next priority to observable market inputs or marketcorroborated data (evel 2), and the lowest priority tounobservable inputs without market corroborated data
(evel 3). A 157 requires the fair value measurement
to maximize the use of market observable inputs.he following guidelines are applied in determining
the fair values of financial instruments:
Investments
eadily marketable investments are fair valued usingactive market quotes in evel 1 category. evel 2 cat-egory includes investments which are fair valued withsignificant other market observable inputs.
he fair value of the following financial assets of as of 31 ecember 2008 were reported based on
the following:
Fair Value Measurements
Quoted Prices in Significant SignificantActive Markets for Other Observable Unobservable
Identical Assets Inputs Inputs31 December 2008 (Level 1) (Level 2) (Level 3)
Assets Investments $61,303,000 $ – $61,303,000 $ –
ee Notes C and for discussions relating to
investments and undisbursed commitments. n all othercases, the carrying amount of ’s assets, liabilities and
uncommitted balances are considered to approximate
fair values for all significant financial instruments.
7/30/2019 ADB Annual Report 2008 - Financial Report
http://slidepdf.com/reader/full/adb-annual-report-2008-financial-report 141/218
139 Annual Report 2008
REGIONAL COOPERATION AND INTEGRATION FUND
Management's Report on Internal Control over Financial Reporting
he management of Asian evelopment Bank (“AB”) is responsible for establishing and
maintaining adequate internal control over financial reporting. AB's internal control overfinancial reporting is a process designed to provide reasonable assurance regarding the reliabil-
ity of financial reporting and the preparation of financial statements for external purposes in
accordance with generally accepted accounting principles in the nited tates of America.
AB's internal control over financial reporting includes those policies and procedures that
(i) pertain to the maintenance of records that, in reasonable detail, accurately and fairly re-
flect the transactions and dispositions of the assets of AB; (ii) provide reasonable assurance
that transactions are recorded as necessary to permit preparation of financial statements in
accordance with generally accepted accounting principles, and that receipts and expenditures
of AB are being made only in accordance with authorizations of management and directors
of AB; and (iii) provide reasonable assurance regarding prevention or timely detection of
unauthorized acquisition, use or disposition of AB's assets that could have a material effecton the financial statements.
Because of its inherent limitations, internal control over financial reporting may not prevent
or detect misstatements. Also, projections of any evaluation of effectiveness to future periods
are subject to the risk that controls may become inadequate because of changes in conditions,
or that the degree of compliance with the policies or procedures may deteriorate.
AB's management assessed the effectiveness of AB's internal control over financial report-
ing as of 31 ecember 2008. n making this assessment, AB's management used the criteria
set forth by the Committee of ponsoring rganizations of the readway Commission in
Internal Control – Integrated Framework. Based on that assessment, management believes that as
of 31 ecember 2008, AB's internal control over financial reporting is effective based uponthe criteria established in Internal Control – Integrated Framework.
aruhiko uroda
resident
Bindu N. ohani
ice resident (inance and Administration)
ong-ang ung
Controller
5 March 2009
7/30/2019 ADB Annual Report 2008 - Financial Report
http://slidepdf.com/reader/full/adb-annual-report-2008-financial-report 142/218
Asian Development Bank140
R E
G I O N A L C O O P E R A T I O N
A N
D I N T E G R A T I O N
F U N D
PricewaterhouseCoopers LLP
pwc.com/sg
8 Cross Street #17-00
PWC Building
Singapore 048424
Telephone (65) 6236 3388
Facsimile (65) 6236 3300
GST No.: M90362193L
Reg. No.: T09LL0001D
Report of Independent Auditors to the Asian Development Bank
n our opinion, the accompanying statements of financial position and the related statements of ac-
tivities and changes in net assets and cash flows present fairly, in all material respects, the financial
position of the Asian evelopment Bank (“AB” or “the Bank”)—egional Cooperation and ntegra-tion und at 31 ecember 2008 and 2007, and the results of its activities and changes in net assets
and its cash flows for the year ended 31 ecember 2008 and for the period from 26 ebruary 2007
(establishment of the und) to 31 ecember 2007, in conformity with accounting principles gener-
ally accepted in the nited tates of America. Also in our opinion, management’s assertion that AB
maintained effective internal control over financial reporting as of 31 ecember 2008 is fairly stated,
in all material respects, based on criteria established in nternal Control - ntegrated ramework issued
by the Committee of ponsoring rganizations of the readway Commission (C). he manage-
ment of AB is responsible for these financial statements, for maintaining effective internal control
over financial reporting and for its assertion of the effectiveness of internal control over financial
reporting, included in the accompanying Management’s eport on nternal Control over inancial
eporting. ur responsibility is to express opinions on these financial statements and on AB’s
internal control over financial reporting based on our integrated audit in 2008 and financial state-
ment audit in 2007. e conducted our audits of the financial statements in accordance with auditing
standards generally accepted in the nited tates of America and our audit of internal control over
financial reporting in accordance with attestation standards established by the American nstitute of
Certified ublic Accountants. hose standards require that we plan and perform the audits to obtain
reasonable assurance about whether the financial statements are free of material misstatement and
whether effective internal control over financial reporting was maintained in all material respects.
ur audits of the financial statements included examining, on a test basis, evidence supporting the
amounts and disclosures in the financial statements, assessing the accounting principles used and
significant estimates made by management, and evaluating the overall financial statement presenta-
tion. ur audit of internal control over financial reporting included obtaining an understanding of
internal control over financial reporting, assessing the risk that a material weakness exists, and test-
ing and evaluating the design and operating effectiveness of internal control based on the assessed
risk. ur audits also included performing such other procedures as we considered necessary in the
circumstances. e believe that our audits provide a reasonable basis for our opinions.
PricewaterhouseCoopers LLP (Registration No. T09LL0001D) is an accounting limited liability partnership registered in Singapore under the Limited Liability Partner-ships Act (Chapter 163A). It was converted from a partnership (with the name “PricewaterhouseCoopers” and Registration no. 000640) to an accounting limitedliability partnership on 1 January 2009. PricewaterhouseCoopers LLP is part of the network of member firms of PricewaterhouseCoopers International Limited, eachof which is a separate and independent legal entity.

7/30/2019 ADB Annual Report 2008 - Financial Report
http://slidepdf.com/reader/full/adb-annual-report-2008-financial-report 143/218
141 Annual Report 2008
A company’s internal control over financial reporting is a process effected by those charged withgovernance, management, and other personnel, designed to provide reasonable assurance regarding
the preparation of reliable financial statements in accordance with accounting principles generally
accepted in the nited tates of America. A company’s internal control over financial reporting in-
cludes those policies and procedures that (i) pertain to the maintenance of records that, in reasonable
detail, accurately and fairly reflect the transactions and dispositions of the assets of the company;
(ii) provide reasonable assurance that transactions are recorded as necessary to permit preparation of
financial statements in accordance with generally accepted accounting principles, and that receipts and
expenditures of the company are being made only in accordance with authorizations of management
and those charged with governance; and (iii) provide reasonable assurance regarding prevention, or
timely detection of unauthorized acquisition, use, or disposition of the company’s assets that could
have a material effect on the financial statements.
Because of its inherent limitations, internal control over financial reporting may not prevent or detect
misstatements. Also, projections of any evaluation of effectiveness to future periods are subject to
the risk that controls may become inadequate because of changes in conditions, or that the degree
of compliance with the policies or procedures may deteriorate.
ricewaterhouseCoopers
ublic Accountants and Certified ublic Accountants
ingapore
5 March 2009

7/30/2019 ADB Annual Report 2008 - Financial Report
http://slidepdf.com/reader/full/adb-annual-report-2008-financial-report 144/218
Asian Development Bank142
R E
G I O N A L C O O P E R A T I O N
A N
D I N T E G R A T I O N
F U N D
RCIF-1
ASIAN DEVELOPMENT BANK—REGIONAL COOPERATION AND INTEGRATION FUND
STATEMENT OF FINANCIAL POSITION
31 December 2008 and 2007
Expressed in Thousands of United States Dollars (Note B)
2008 2007
ASSETS
DUE FROM BANKS (Note B) $ 1,446 $ 1,240
INVESTMENTS (Notes B, C, and G)Government and government-guaranteed obligations $ 6,104 $ –Time deposits 8,199 39,925Corporate bonds 24,973 39,276 – 39,925
ACCRUED REVENUE 154 61
ADVANCES FOR GRANTS (Note B) 335 –
TOTAL $41,211 $41,226
LIABILITIES AND UNCOMMITTED BALANCES
MISCELLANEOUS LIABILITIES (Note D) $ 52 $ 9
UNDISBURSED COMMITMENTS (Notes B, E, and G) 16,571 7,400
UNCOMMITTED BALANCES (RCIF-2) (Notes B and F), represented by:Unrestricted net assets 24,588 33,817
TOTAL $41,211 $41,226
The accompanying notes are an integral part of these financial statements (RCIF-4).
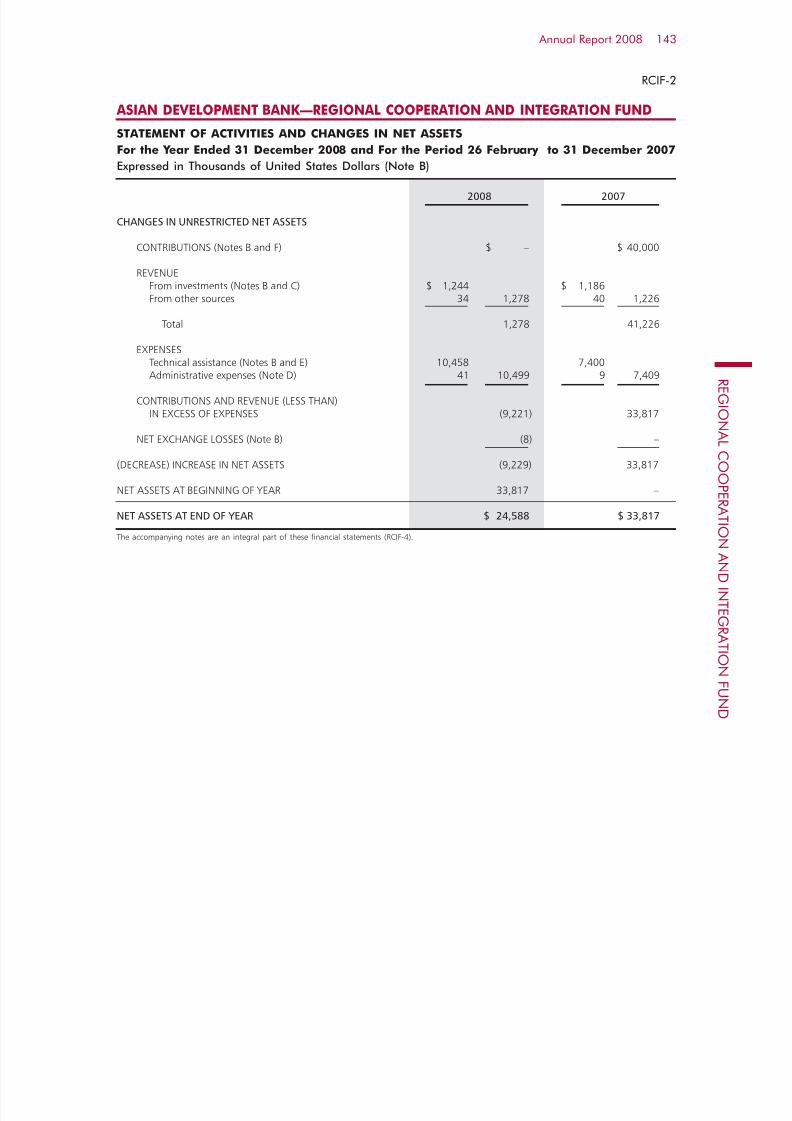
7/30/2019 ADB Annual Report 2008 - Financial Report
http://slidepdf.com/reader/full/adb-annual-report-2008-financial-report 145/218
143 Annual Report 2008
RCIF-2
ASIAN DEVELOPMENT BANK—REGIONAL COOPERATION AND INTEGRATION FUND
STATEMENT OF ACTIVITIES AND CHANGES IN NET ASSETS
For the Year Ended 31 December 2008 and For the Period 26 February to 31 December 2007
Expressed in Thousands of United States Dollars (Note B)
2008 2007
CHANGES IN UNRESTRICTED NET ASSETS
CONTRIBUTIONS (Notes B and F) $ – $ 40,000
REVENUEFrom investments (Notes B and C) $ 1,244 $ 1,186From other sources 34 1,278 40 1,226
Total 1,278 41,226
EXPENSES Technical assistance (Notes B and E) 10,458 7,400Administrative expenses (Note D) 41 10,499 9 7,409
CONTRIBUTIONS AND REVENUE (LESS THAN)IN EXCESS OF EXPENSES (9,221) 33,817
NET EXCHANGE LOSSES (Note B) (8) –
(DECREASE) INCREASE IN NET ASSETS (9,229) 33,817
NET ASSETS AT BEGINNING OF YEAR 33,817 –
NET ASSETS AT END OF YEAR $ 24,588 $ 33,817
The accompanying notes are an integral part of these financial statements (RCIF-4).
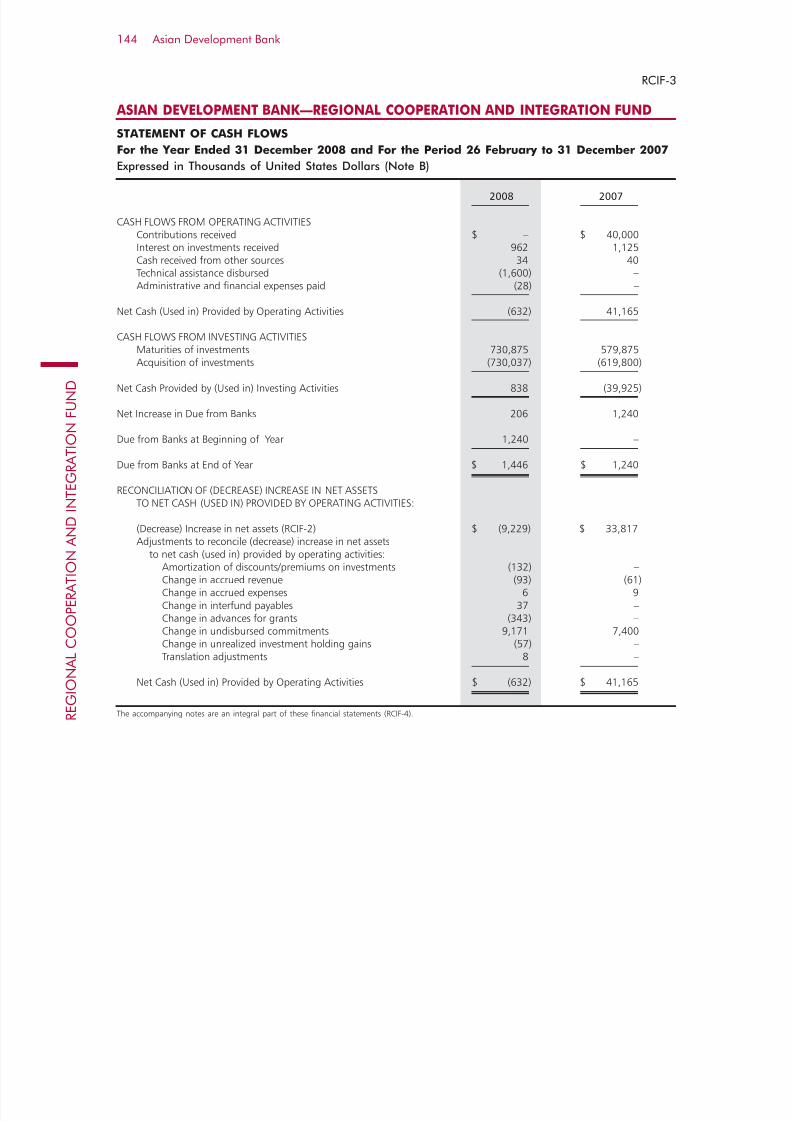
7/30/2019 ADB Annual Report 2008 - Financial Report
http://slidepdf.com/reader/full/adb-annual-report-2008-financial-report 146/218
Asian Development Bank144
R E
G I O N A L C O O P E R A T I O N
A N
D I N T E G R A T I O N
F U N D
RCIF-3
ASIAN DEVELOPMENT BANK—REGIONAL COOPERATION AND INTEGRATION FUND
STATEMENT OF CASH FLOWS
For the Year Ended 31 December 2008 and For the Period 26 February to 31 December 2007
Expressed in Thousands of United States Dollars (Note B)
2008 2007
CASH FLOWS FROM OPERATING ACTIVITIESContributions received $ – $ 40,000Interest on investments received 962 1,125Cash received from other sources 34 40Technical assistance disbursed (1,600) –Administrative and financial expenses paid (28) –
Net Cash (Used in) Provided by Operating Activities (632) 41,165
CASH FLOWS FROM INVESTING ACTIVITIES
Maturities of investments 730,875 579,875Acquisition of investments (730,037) (619,800) Net Cash Provided by (Used in) Investing Activities 838 (39,925) Net Increase in Due from Banks 206 1,240
Due from Banks at Beginning of Year 1,240 –
Due from Banks at End of Year $ 1,446 $ 1,240
RECONCILIATION OF (DECREASE) INCREASE IN NET ASSETSTO NET CASH (USED IN) PROVIDED BY OPERATING ACTIVITIES:
(Decrease) Increase in net assets (RCIF-2) $ (9,229) $ 33,817Adjustments to reconcile (decrease) increase in net assetsto net cash (used in) provided by operating activities:
Amortization of discounts/premiums on investments (132) –Change in accrued revenue (93) (61)Change in accrued expenses 6 9Change in interfund payables 37 –Change in advances for grants (343) –Change in undisbursed commitments 9,171 7,400Change in unrealized investment holding gains (57) –Translation adjustments 8 –
Net Cash (Used in) Provided by Operating Activities $ (632) $ 41,165
The accompanying notes are an integral part of these financial statements (RCIF-4).

7/30/2019 ADB Annual Report 2008 - Financial Report
http://slidepdf.com/reader/full/adb-annual-report-2008-financial-report 147/218
ASIAN DEVELOPMENT BANK—REGIONAL COOPERATION AND INTEGRATION FUND
NOTES TO FINANCIAL STATEMENTS
31 December 2008 and 2007
145 Annual Report 2008
RCIF-4
NOTE A—NATURE OF OPERATIONS
he egional Cooperation and ntegration und (C),together with egional Cooperation and ntegration(C)rust unds, was established on 26 ebruary 2007 under the “umbrella” of egional Cooperation andntegration inancing artnership acility (C),in response to the increasing demand for regional coop-eration and integration activities among AB’s membercountries in Asia and the acific. ts main objective is toenhance regional cooperation and integration in Asia andthe acific by facilitating the pooling and provision of
additional financial and knowledge resources to supportC activities.inancial assistance will be provided in the form
of untied grants for technical assistance (A), includingadvisory, project preparatory, and regional A.
C’s resources may consist of contributions from AB and other bilateral, multilateral, and individualsources, including companies and foundations.
NOTE B—SUMMARY OF SIGNIFICANT
ACCOUNTING POLICIES
Presentation of the Financial Statements
he financial statements of the C are presented onthe basis of those for not-for-profit organizations.
C reports donors’ contributions of cash andother assets as unrestricted assets as these are madeavailable to C without conditions other than for thepurpose of pursuing its objectives.
Functional and Reporting Currency
he nited tates dollar is the functional and report-ing currency, representing the currency of the primary economic operating environment of C.
Translation of Currencies
AB adopts the use of daily exchange rates for account-ing and financial reporting purposes. his allows transac-tions denominated in non- dollar to be translated tothe reporting currency using exchange rates applicableat the time of transactions. Contributions included inthe financial statements during the year are recognizedat applicable exchange rates as of the respective dates
of commitment. At the end of each accounting month,translations of assets, liabilities, and uncommittedbalances which are denominated in non- dollar areadjusted using the applicable rates of exchange at theend of the reporting period. hese translation adjust-ments are accounted for as exchange gains or losses andare credited or charged to operations.
Investments
All investment securities held by C are reported atestimated fair value, which represents their fair market
value. ealized and unrealized gains and losses are in-cluded in revenue. ime deposits are reported at costwhich is a reasonable estimate of fair value.
nterest income on investment securities and timedeposits are recognized as realized and reported, net of amortizations of premiums and discounts.
Contributions
he contributions from donors and allocations from thenet income of rdinary Capital esources are includedin the financial statements, from the date of effectivity of the contributions agreement, and the Board of overnors’
approval, respectively.
Technical Assistance, Grants and UndisbursedCommitments
echnical assistance is recognized in the financialstatements when the project is approved and becomeseffective. pon completion of the project or cancellationof a technical assistance, any undisbursed amount is writ-ten back as a reduction in technical assistance for the
year and the corresponding undisbursed commitment iseliminated accordingly.
Advances are provided from technical assistance
grant funds to the executing agency or co-operatinginstitution, for the purpose of making payments foreligible expenses. he advances shall be subject toliquidation and charged against undisbursed commitment,any unutilized portion shall be refunded to the fund.
Accounting Estimates
he preparation of financial statements in conformity with generally accepted accounting principles requires

7/30/2019 ADB Annual Report 2008 - Financial Report
http://slidepdf.com/reader/full/adb-annual-report-2008-financial-report 148/218
ASIAN DEVELOPMENT BANK—REGIONAL COOPERATION AND INTEGRATION FUND
NOTES TO FINANCIAL STATEMENTS
31 December 2008 and 2007
Asian Development Bank146
R E
G I O N A L C O O P E R A T I O N
A N
D I N T E G R A T I O N
F U N D
Management to make reasonable estimates and assump-tions that affect the reported amounts of assets andliabilities and uncommitted balances as at the end of the
year and the reported amounts of revenue and expensesduring the year. he actual results could differ fromthose estimates.
Statement of Cash Flows
or the purposes of the tatement of Cash lows, Cconsiders that its cash and cash equivalents are limitedto “ M BAN.”
NOTE C—INVESTMENTS
he main investment management objective is to main-tain security and liquidity. ubject to these parameters,
AB seeks the highest possible return on its investments.nvestments are governed by the nvestment Authority approved by the Board of irectors in 1999, and reviewedin 2006. he review endorsed a portfolio strategy that islargely consistent with the 1999 approach.
nvestment securities and negotiable certificateof deposits held as of 31 ecember 2008 are considered“Available for ale” and are reported at fair value, which
represents their fair market value. nrealized gains andlosses are included in revenue from investments.
he annualized rate of return on the averageinvestments held during the period ended 31 ecember2008, based on the portfolio held at the beginning andend of each month, was 3.12% (5.31% - 2007).
NOTE D—RELATED PARTY TRANSACTIONS
he C and special fund resources are at all timesused, committed, and invested entirely separate fromeach other. egional technical assistance projects andprograms may be combined activities between special
and trust funds. he administrative and operational ex-penses pertaining to C are settled on a regular basisbetween C and the other funds. As of 31 ecember2008, $15,000 (nil-2007) and $22,000 (nil-2007) was pay-able to C and A, respectively, which are includedin miscellaneous liabilities.
NOTE E— TECHNICAL ASSISTANCE ANDUNDISBURSED COMMITMENTS
uring the year, there were thirteen (four technical as-sistance (A) and one supplementary approval – 2007)A grants totaling $10,458,000 ($7,400,000 – 2007)which became effective.
ndisbursed commitments are denominatedin nited tates dollars and represent technicalassistance not yet disbursed. he fair value of undisbursed commitments approximates the amountsoutstanding, because AB expects that disbursements
will substantially be made for all the projects/programscovered by the commitments.
NOTE F— CONTRIBUTIONS ANDUNCOMMITTED BALANCES
n May 2007, the Board of overnors approved the al-location of $40,000,000 to the C from the 2006 C net income.
ncommitted balances comprised of amountswhich have not been committed by AB as at 31ecember 2008.
NOTE G—FAIR VALUE MEASUREMENTS
A 157 defines fair value as the price that would bereceived to sell an asset or paid to transfer a liability atmeasurement date (exit price) in an orderly transactionamong willing participants with an assumption that thetransaction takes place in the entity’s principal market,the most advantageous market for the asset or liability.he most advantageous market is the market where thesale of the asset or transfer of liability would maximize theamount received for the asset or minimize the amountpaid to transfer the liability. he fair value measurementis not adjusted for transaction cost.
A 157 also establishes a fair value hierarchy that gives the highest priority to quoted prices inactive markets for identical assets or liabilities (evel1), next priority to observable market inputs or marketcorroborated data (evel 2), and the lowest priority tounobservable inputs without market corroborated data(evel 3). A 157 requires the fair value measurementto maximize the use of market observable inputs.
he following guidelines are applied in determiningthe fair values of financial instruments:

7/30/2019 ADB Annual Report 2008 - Financial Report
http://slidepdf.com/reader/full/adb-annual-report-2008-financial-report 149/218
ASIAN DEVELOPMENT BANK—REGIONAL COOPERATION AND INTEGRATION FUND
NOTES TO FINANCIAL STATEMENTS
31 December 2008 and 2007
147 Annual Report 2008
RCIF-4
Fair Value Measurements
Quoted Prices in Significant SignificantActive Markets for Other Observable Unobservable
Identical Assets Inputs Inputs31 December 2008 (Level 1) (Level 2) (Level 3)
Assets Investments $39,276,000 $ – $39,276,000 $ –
Investments
eadily marketable investments are fair valued usingactive market quotes in evel 1 category. evel 2 cat-egory includes investments which are fair valued withsignificant other market observable inputs.
ee Notes C and for discussions relating toinvestments and undisbursed commitments. n all othercases, the carrying amount of C’s assets, liabilities
he fair values of the following financial assets of C as of 31 ecember 2008 were reported based onthe following:
and uncommitted balances are considered to approximatefair values for all significant financial instruments.
CONTINUED

7/30/2019 ADB Annual Report 2008 - Financial Report
http://slidepdf.com/reader/full/adb-annual-report-2008-financial-report 150/218
Asian Development Bank148
C L I M A T E C H A N G E F U N D
CLIMATE CHANGE FUND
Management's Report on Internal Control over Financial Reporting
he management of Asian evelopment Bank (“AB”) is responsible for establishing and
maintaining adequate internal control over financial reporting. AB's internal control overfinancial reporting is a process designed to provide reasonable assurance regarding the reliabil-
ity of financial reporting and the preparation of financial statements for external purposes in
accordance with generally accepted accounting principles in the nited tates of America.
AB's internal control over financial reporting includes those policies and procedures that
(i) pertain to the maintenance of records that, in reasonable detail, accurately and fairly re-
flect the transactions and dispositions of the assets of AB; (ii) provide reasonable assurance
that transactions are recorded as necessary to permit preparation of financial statements in
accordance with generally accepted accounting principles, and that receipts and expenditures
of AB are being made only in accordance with authorizations of management and directors
of AB; and (iii) provide reasonable assurance regarding prevention or timely detection of
unauthorized acquisition, use or disposition of AB's assets that could have a material effecton the financial statements.
Because of its inherent limitations, internal control over financial reporting may not prevent
or detect misstatements. Also, projections of any evaluation of effectiveness to future periods
are subject to the risk that controls may become inadequate because of changes in conditions,
or that the degree of compliance with the policies or procedures may deteriorate.
AB's management assessed the effectiveness of AB's internal control over financial report-
ing as of 31 ecember 2008. n making this assessment, AB's management used the criteria
set forth by the Committee of ponsoring rganizations of the readway Commission in
Internal Control – Integrated Framework. Based on that assessment, management believes that as
of 31 ecember 2008, AB's internal control over financial reporting is effective based uponthe criteria established in Internal Control – Integrated Framework.
aruhiko uroda
resident
Bindu N. ohani
ice resident (inance and Administration)
ong-ang ung
Controller
5 March 2009

7/30/2019 ADB Annual Report 2008 - Financial Report
http://slidepdf.com/reader/full/adb-annual-report-2008-financial-report 151/218
149 Annual Report 2008
Report of Independent Auditors to the Asian Development Bank
n our opinion, the accompanying statements of financial position and the related statements of activities
and changes in net assets and cash flows present fairly, in all material respects, the financial position
of the Asian evelopment Bank (“AB” or “the Bank”)—Climate Change und at 31 ecember 2008,
and the results of its activities and changes in net assets and its cash flows for the period from 7 April
2008 (establishment of the und) to 31 ecember 2008, in conformity with accounting principles
generally accepted in the nited tates of America. Also in our opinion, management’s assertion that
AB maintained, effective internal control over financial reporting as of 31 ecember 2008 is fairly
stated, in all material respects, based on criteria established in nternal Control – ntegrated rame-
work issued by the Committee of ponsoring rganizations of the readway Commission (C).
he management of AB is responsible for these financial statements, for maintaining effective
internal control over financial reporting and for its assertion of the effectiveness of internal control
over financial reporting, included in the accompanying Management's eport on nternal Control over
inancial eporting. ur responsibility is to express opinions on these financial statements and on
AB’s internal control over financial reporting based on our integrated audit in 2008. e conducted
our audits of the financial statements in accordance with auditing standards generally accepted inthe nited tates of America and our audit of internal control over financial reporting in accordance
with attestation standards established by the American nstitute of Certified ublic Accountants.
hose standards require that we plan and perform the audits to obtain reasonable assurance about
whether the financial statements are free of material misstatement and whether effective internal
control over financial reporting was maintained in all material respects. ur audits of the financial
statements included examining, on a test basis, evidence supporting the amounts and disclosures in
the financial statements, assessing the accounting principles used and significant estimates made
by management, and evaluating the overall financial statement presentation. ur audit of internal
control over financial reporting included obtaining an understanding of internal control over financial
reporting, assessing the risk that a material weakness exists, and testing and evaluating the design
and operating effectiveness of internal control based on the assessed risk. ur audits also included
performing such other procedures as we considered necessary in the circumstances. e believe thatour audits provide a reasonable basis for our opinions.
PricewaterhouseCoopers LLP
pwc.com/sg
8 Cross Street #17-00
PWC Building
Singapore 048424
Telephone (65) 6236 3388
Facsimile (65) 6236 3300
GST No.: M90362193L
Reg. No.: T09LL0001D
PricewaterhouseCoopers LLP (Registration No. T09LL0001D) is an accounting limited liability partnership registered in Singapore under the Limited Liability Partner-ships Act (Chapter 163A). It was converted from a partnership (with the name “PricewaterhouseCoopers” and Registration no. 000640) to an accounting limitedliability partnership on 1 January 2009. PricewaterhouseCoopers LLP is part of the network of member firms of PricewaterhouseCoopers International Limited, eachof which is a separate and independent legal entity.
7/30/2019 ADB Annual Report 2008 - Financial Report
http://slidepdf.com/reader/full/adb-annual-report-2008-financial-report 152/218
Asian Development Bank150
C L I M A T E C H A N G E F U N D
A company’s internal control over financial reporting is a process effected by those charged with
governance, management, and other personnel, designed to provide reasonable assurance regardingthe preparation of reliable financial statements in accordance with accounting principles generally
accepted in the nited tates of America. A company’s internal control over financial reporting in-
cludes those policies and procedures that (i) pertain to the maintenance of records that, in reasonable
detail, accurately and fairly reflect the transactions and dispositions of the assets of the company;
(ii) provide reasonable assurance that transactions are recorded as necessary to permit preparation of
financial statements in accordance with generally accepted accounting principles, and that receipts and
expenditures of the company are being made only in accordance with authorizations of management
and those charged with governance; and (iii) provide reasonable assurance regarding prevention, or
timely detection of unauthorized acquisition, use, or disposition of the company’s assets that could
have a material effect on the financial statements.
Because of its inherent limitations, internal control over financial reporting may not prevent or detectmisstatements. Also, projections of any evaluation of effectiveness to future periods are subject to
the risk that controls may become inadequate because of changes in conditions, or that the degree
of compliance with the policies or procedures may deteriorate.
ricewaterhouseCoopers
ublic Accountants and Certified ublic Accountants
ingapore
5 March 2009

7/30/2019 ADB Annual Report 2008 - Financial Report
http://slidepdf.com/reader/full/adb-annual-report-2008-financial-report 153/218
151 Annual Report 2008
CCF-1
ASIAN DEVELOPMENT BANK—CLIMATE CHANGE FUND
STATEMENT OF FINANCIAL POSITION
31 December 2008
Expressed in Thousands of United States Dollars (Note B)
ASSETS
DUE FROM BANKS (Note B) $ 1,564
INVESTMENTS (Notes B, C, and G)Time deposits $ 10,921Corporate obligations 27,973 38,894
ACCRUED REVENUE 50
TOTAL $ 40,508
LIABILITIES AND UNCOMMITTED BALANCES
MISCELLANEOUS LIABILITIES (Note D) $ 81
UNDISBURSED COMMITMENTS (Notes B, E, and G) 3,000
UNCOMMITTED BALANCES (CCF-2) (Notes B and F), represented by:Unrestricted net assets 37,427
TOTAL $ 40,508
The accompanying notes are an integral part of these financial statements (CCF-4).

7/30/2019 ADB Annual Report 2008 - Financial Report
http://slidepdf.com/reader/full/adb-annual-report-2008-financial-report 154/218
Asian Development Bank152
C L I M A T E C H A N G E F U N D
CCF-2
ASIAN DEVELOPMENT BANK—CLIMATE CHANGE FUND
STATEMENT OF ACTIVITIES AND CHANGES IN NET ASSETS
For the Period 7 April to 31 December 2008
Expressed in Thousands of United States Dollars (Note B)
CHANGES IN UNRESTRICTED NET ASSETS
CONTRIBUTIONS (Notes B and F) $ 40,000
REVENUEFrom investments (Notes B and C) 545From other sources 9
Total 40,554
EXPENSESAdministrative expenses (Note D) 124
Technical assistance (Note B) 3,000
Total 3,124
CONTRIBUTIONS AND REVENUE IN EXCESS OF EXPENSES 37,430
NET EXCHANGE LOSSES (Note B) (3)
NET ASSETS AT END OF PERIOD $ 37,427
The accompanying notes are an integral part of these financial statements (CCF-4).

7/30/2019 ADB Annual Report 2008 - Financial Report
http://slidepdf.com/reader/full/adb-annual-report-2008-financial-report 155/218
153 Annual Report 2008
CCF-3
ASIAN DEVELOPMENT BANK—CLIMATE CHANGE FUND
STATEMENT OF CASH FLOWS
For the Period 7 April to 31 December 2008
Expressed in Thousands of United States Dollars (Note B)
CASH FLOWS FROM OPERATING ACTIVITIESContributions received $ 40,000Interest on investments received 315Administrative expenses paid (46)Cash received from other sources 9
Net Cash Provided by Operating Activities 40,278
CASH FLOWS FROM INVESTING ACTIVITIESMaturities of investments 336,872Acquisition of investments (375,586)
Net Cash Used in Investing Activities (38,714) Due from Banks at End of Period $ 1,564
RECONCILIATION OF INCREASE IN NET ASSETSTO NET CASH PROVIDED BY OPERATING ACTIVITIES:
Increase in net assets (CCF-2) $ 37,427Adjustments to reconcile increase in net assets
to net cash provided by operating activities:Amortization of discounts on investments (180)Change in accrued revenue (50)Change in miscellaneous assets (0)Change in miscellaneous liabilities 78
Change in undisbursed commitments 3,000Translation adjustments 3
Net Cash Provided by Operating Activities $ 40,278
0 - Less than $500.The accompanying notes are an integral part of these financial statements (CCF-4).

7/30/2019 ADB Annual Report 2008 - Financial Report
http://slidepdf.com/reader/full/adb-annual-report-2008-financial-report 156/218
ASIAN DEVELOPMENT BANK—CLIMATE CHANGE FUND
NOTES TO FINANCIAL STATEMENTS
For the Period 7 April to 31 December 2008
Asian Development Bank154
C L I M A T E C H A N G E F U N D
NOTE A—NATURE OF OPERATIONS
he Climate Change und (CC) was established on 7 April 2008 to facilitate greater investments in developingmember countries (MCs) to address the causes andconsequences of climate change alongside AB’s ownassistance in various related sectors. he CC will be akey mechanism to pool resources within AB to addressclimate change through (i) technical assistance (A),(ii) investment components for both private and publicsector projects, and (iii) any other form of cooperationthat partners and AB may agree upon for a defined
program of activities.inancial assistance will be provided in the formof untied grants for components of investment projects,for advisory, project preparatory, and regional technicalassistance (A); as well as for any other activities thatmay be agreed between external contributors and AB.
CC’s resources may consist of contributions from AB and other bilateral, multilateral, and individualsources, including companies and foundations. NOTE B— SUMMARY OF SIGNIFICANT
ACCOUNTING POLICIES
Presentation of the Financial Statements
he financial statements of the CC are presented onthe basis of those for not-for-profit organizations.
CC reports donors’ contributions of cash and otherassets as unrestricted assets as these are made availableto CC without conditions other than for the purpose of pursuing its objectives.
Functional and Reporting Currency
he nited tates dollar is the functional and report-ing currency, representing the currency of the primary
economic operating environment of CC.
Translation of Currencies
AB adopts the use of daily exchange rates for account-ing and financial reporting purposes. his allows transac-tions denominated in non- dollar to be translated tothe reporting currency using exchange rates applicableat the time of transactions. Contributions included inthe financial statements during the year are recognized
at applicable exchange rates as of the respective datesof commitment. At the end of each accounting month,translations of assets, liabilities, and uncommittedbalances which are denominated in non- dollar areadjusted using the applicable rates of exchange at theend of the reporting period. hese translation adjust-ments are accounted for as exchange gains or losses andare credited or charged to operations.
Investments
All investment securities held by CC are reported at
estimated fair value, which represents their fair market value. ealized and unrealized gains and losses are in-cluded in revenue. ime deposits are reported at costwhich is a reasonable estimate of fair value.
nterest income on investment securities and timedeposits are recognized as realized and reported, net of amortizations of premiums and discounts.
Contributions
he contributions from donors and the allocations fromnet income of rdinary Capital esources are includedin the financial statements, from the date of effectivity of
the contributions agreement, and the Board of overnors'approval, respectively.
Technical Assistance and Undisbursed Commitments
echnical assistance is recognized in the financialstatements when the project is approved and becomeseffective. pon completion of the project or cancellationof a technical assistance, any undisbursed amount is writ-ten back as a reduction in technical assistance for the
year and the corresponding undisbursed commitment iseliminated accordingly.
Accounting Estimates
he preparation of financial statements in conformity with generally accepted accounting principles requiresManagement to make reasonable estimates and assump-tions that affect the reported amounts of assets andliabilities and uncommitted balances as at the end of the
year and the reported amounts of revenue and expensesduring the year. he actual results could differ fromthose estimates.

7/30/2019 ADB Annual Report 2008 - Financial Report
http://slidepdf.com/reader/full/adb-annual-report-2008-financial-report 157/218
CCF-4
ASIAN DEVELOPMENT BANK—CLIMATE CHANGE FUND
NOTES TO FINANCIAL STATEMENTS
For the Period 7 April to 31 December 2008
155 Annual Report 2008
Statement of Cash Flows
or the purposes of the tatement of Cash lows, CCconsiders that its cash and cash equivalents are limitedto “ M BAN.” NOTE C—INVESTMENTS
he main investment management objective is to main-tain security and liquidity. ubject to these parameters,
AB seeks the highest possible return on its investments.nvestments are governed by the nvestment Authority
approved by the Board of irectors in 1999, and reviewedin 2006. he review endorsed a portfolio strategy that islargely consistent with the 1999 approach.
nvestment securities and negotiable certificateof deposits held as of 31 ecember 2008 are considered“Available for ale” and are reported at fair value, whichrepresents their fair market value. nrealized gains andlosses are included in revenue from investments.
nterest on investment securities and timedeposits are recognized as realized and reported net of amortizations of premiums and discounts.
he annualized rate of return on the averageinvestments held during the period ended 31 ecember
2008, based on the portfolio held at the beginning andend of each month, was 2.59%.
NOTE D—RELATED PARTY TRANSACTIONS
he C and special fund resources are at all times used,committed, and invested entirely separate from eachother. he administrative and operational expenses per-taining to CC are settled on a regular basis between C and CC. As of 31 ecember 2008, $6,000 was payable toC which is included in miscellaneous liabilities.
NOTE E—UNDISBURSED COMMITMENTS
ndisbursed commitments are denominated in nitedtates dollars and represent technical assistance not yetdisbursed. he fair value of undisbursed commitmentsapproximates the amounts outstanding, because AB
expects that disbursements will substantially be made forall the projects/programs covered by the commitments.
NOTE F— CONTRIBUTIONS ANDUNCOMMITTED BALANCES
n May 2008, the Board of overnors approved the al-location of $40,000,000 to the CC from the 2007 C net income.
ncommitted balances comprised of amountswhich have not been committed by AB as at 31ecember 2008.
NOTE G—FAIR VALUE MEASUREMENTS
A 157 defines fair value as the price that would bereceived to sell an asset or paid to transfer a liability atmeasurement date (exit price) in an orderly transactionamong willing participants with an assumption that thetransaction takes place in the entity’s principal market,the most advantageous market for the asset or liability.he most advantageous market is the market where thesale of the asset or transfer of liability would maximize theamount received for the asset or minimize the amountpaid to transfer the liability. he fair value measurement
is not adjusted for transaction cost.A 157 also establishes a fair value hierarchy
that gives the highest priority to quoted prices inactive markets for identical assets or liabilities (evel1), next priority to observable market inputs or marketcorroborated data (evel 2), and the lowest priority tounobservable inputs without market corroborated data(evel 3). A 157 requires the fair value measurementto maximize the use of market observable inputs.
he following guidelines are applied in determiningthe fair values of financial instruments:
Investments
eadily marketable investments are fair valued usingactive market quotes in evel 1 category. evel 2 cat-egory includes investments which are fair valued withsignificant other market observable inputs.
CONTINUED

7/30/2019 ADB Annual Report 2008 - Financial Report
http://slidepdf.com/reader/full/adb-annual-report-2008-financial-report 158/218
ASIAN DEVELOPMENT BANK—CLIMATE CHANGE FUND
NOTES TO FINANCIAL STATEMENTS
For the Period 7 April to 31 December 2008
Asian Development Bank156
C L I M A T E C H A N G E F U N D
he fair value of the following financial assets of CC as of 31 ecember 2008 were reported based on thefollowing:
Fair Value Measurements
Quoted Prices in Significant SignificantActive Markets for Other Observable Unobservable
Identical Assets Inputs Inputs31 December 2008 (Level 1) (Level 2) (Level 3)
Assets Investments $38,894,000 $ – $38,894,000 $ –
CCF-4
ee Notes C and for discussions relating toinvestments and undisbursed commitments. n all othercases, the carrying amount of CC’s assets, liabilities and
uncommitted balances are considered to approximatefair values for all significant financial instruments.

7/30/2019 ADB Annual Report 2008 - Financial Report
http://slidepdf.com/reader/full/adb-annual-report-2008-financial-report 159/218
S T A T I S T I C
A L A N N E X E S
Asian Development Bank158
7/30/2019 ADB Annual Report 2008 - Financial Report
http://slidepdf.com/reader/full/adb-annual-report-2008-financial-report 160/218
157 Annual Report 2008
STATISTICAL ANNEXES

7/30/2019 ADB Annual Report 2008 - Financial Report
http://slidepdf.com/reader/full/adb-annual-report-2008-financial-report 161/218
159 Annual Report 2008
Statistical Annex 1
SOVEREIGN AND NONSOVEREIGN LOAN APPROVALS BY COUNTRY, 2008
($ million)
Total DateOCR ADF Total Project Costa Approved
SOVEREIGN
ArmeniaRural Road Sector (Supplementary) – 17.32 17.32 23.44 7 Nov
Subtotal – 17.32 17.32 23.44
Azerbaijan
Road Network Development Program – Tranche 2 55.40 – 55.40 73.90 22 AugPower Transmission Enhancement 160.00 – 160.00 240.00 10 Sep
Subtotal 215.40 – 215.40 313.90
Bangladesh Emergency Disaster Damage Rehabilitation (Sector) – 120.00 120.00 220.00 31 JanSkills Development – 50.00 50.00 66.70 6 Jun
Emergency Assistance for Food Security – 170.00 170.00 1,293.00 22 JulPublic-Private Infrastructure Development Facility 82.00 83.00 165.00 925.00 2 OctSecond Urban Governance and Infrastructure Improvement (Sector) – 87.00 87.00 167.50 28 Oct
Subtotal 82.00 510.00 592.00 2,672.20
BhutanGreen Power Development 51.00 29.00 80.00 234.45 29 Oct
Subtotal 51.00 29.00 80.00 234.45
Cambodia Road Asset Management – 6.00 6.00 58.35 21 JanEmergency Food Assistance – 17.50 17.50 40.08 2 OctFinancial Sector Program II Cluster (Subprogram 2) – 10.30 10.30 10.30 5 Dec
Promoting Economic Diversification Program (Subprogram 1) – 20.00 20.00 22.00 5 Dec
Subtotal – 53.80 53.80 130.73
China, People’s Republic of Gansu Baiyin Urban Development 80.00 – 80.00 161.53 23 JanGansu Heihe Rural Hydropower Development Investment Program –
Tranche 2: Dagushan Hydropower Project 28.00 – 28.00 61.92 28 JanXinjiang Municipal Infrastructure and Environmental Improvement 105.00 – 105.00 190.90 23 AprGuangdong Energy Efficiency and Environment Improvement
Investment Program – Tranche 1 35.00 – 35.00 50.00 9 JunIntegrated Ecosystem and Water Resources Management in the
Baiyangdian Basin 100.00 – 100.00 273.38 24 JunNingxia Integrated Ecosystem and Agricultural Development 100.00 – 100.00 221.02 29 AugCentral Yunnan Roads Development 200.00 – 200.00 745.00 25 SepLanzhou–Chongqing Railway Development 300.00 – 300.00 8,608.90 18 NovDryland Sustainable Agriculture 83.00 – 83.00 204.69 25 NovChongqing–Lichuan Railway Development 150.00 – 150.00 3,071.10 8 DecSonghua River Basin Water Pollution Control and Management 200.00 – 200.00 396.33 11 DecGuangxi Wuzhou Urban Development 100.00 – 100.00 263.40 15 DecQingdao Water Resources and Wetland Protection 45.00 – 45.00 105.80 17 Dec
Subtotal 1,526.00 – 1,526.00 14,353.96
– = nil, ADF = Asian Development Fund, OCR = ordinary capital resources.a Total project cost includes financing by ADB, governments, beneficiaries, and subborrowers; cofinancing from official, export credit, and commercial sources; equity
sponsors; and local participating private companies and financial institutions.

7/30/2019 ADB Annual Report 2008 - Financial Report
http://slidepdf.com/reader/full/adb-annual-report-2008-financial-report 162/218
S T A T I S T I C
A L A N N E X E S
Asian Development Bank160
Total DateOCR ADF Total Project Costa Approved
CONTINUED
Cook Islands Avatiu Port Development 8.63 6.88 15.51 18.19 20 Nov
Subtotal 8.63 6.88 15.51 18.19
Georgia Municipal Services Development – 40.00 40.00 63.25 12 SepEmergency Assistance for Post-Conflict Recovery – 70.00 70.00 70.00 12 Nov
Subtotal – 110.00 110.00 133.25
India Uttarakhand Urban Sector Development Investment Program –
Tranche 1 60.00 – 60.00 85.70 1 FebRural Roads Sector II Investment Program – Tranche 2 77.65 – 77.65 100.46 17 MarNational Power Grid Development Investment Program – Tranche 1 400.00 – 400.00 429.42 28 MarAssam Governance and Public Resource Management Sector
Development Program (Subprogram II) 100.00 – 100.00 100.00 17 Sep
Bihar State Highways 420.00 – 420.00 468.00 18 SepOrissa Integrated Irrigated Agriculture and Water Management
Investment Program – Tranche 1 47.20 – 47.20 67.50 26 SepRural Roads Sector II Investment Program – Tranche 3 130.00 – 130.00 168.80 26 SepKhadi Reform and Development Program 150.00 – 150.00 150.00 2 OctUrban Water Supply and Environmental Improvement in Madhya
Pradesh (Supplementary) 71.00 – 71.00 108.00 13 OctUttarakhand State-Road Investment Program – Tranche 2 140.00 – 140.00 200.00 22 OctHimachal Pradesh Clean Energy Development Investment
Program – Tranche 1 150.00 – 150.00 224.80 27 OctUttarakhand Power Sector Investment Program – Tranche 2 62.40 – 62.40 89.14 23 Dec
Subtotal 1,808.25 – 1,808.25 2,191.82
Indonesia Vocational Education Strengthening – 80.00 80.00 115.00 31 MarRural Infrastructure Support to PNPM Mandiri – 50.00 50.00 62.50 29 SepInfrastructure Reform Sector Development Program (Subprogram 2) 280.00 – 280.00 280.00 27 NovSecond Local Government Finance and Governance Reform
Program Cluster (Subprogram 1) 350.00 – 350.00 350.00 4 DecFourth Development Policy Support Program 200.00 – 200.00 200.00 16 DecIntegrated Citarum Water Resources Management Investment
Program – Tranche 1 20.00 30.00 50.00 88.63 22 Dec
Subtotal 850.00 160.00 1,010.00 1,096.13
KazakhstanCAREC Transport Corridor I (Zhambyl Oblast Section)
[Western Europe–Western People’s Republic of ChinaInternational Transit Corridor] Investment Program – Tranche 1 340.00 – 340.00 400.00 30 Dec
Subtotal 340.00 – 340.00 400.00
Maldives Private Sector Development – 7.50 7.50 7.80 20 Jun
Subtotal – 7.50 7.50 7.80
– = nil, ADF = Asian Development Fund, CAREC = Central Asia Regional Economic Cooperation, OCR = ordinary capital resources, PNPM = Program NasionalPemberdayaan Masyarakat (National Program for Community Empowerment).a Total project cost includes financing by ADB, governments, beneficiaries, and subborrowers; cofinancing from official, export credit, and commercial sources; equity
sponsors; and local participating private companies and financial institutions.

7/30/2019 ADB Annual Report 2008 - Financial Report
http://slidepdf.com/reader/full/adb-annual-report-2008-financial-report 163/218
161 Annual Report 2008
Total DateOCR ADF Total Project Costa Approved
Pakistan Barani Integrated Water Resources Sector 55.00 20.00 75.00 104.50 3 MarPreparing the Lahore Rapid Mass Transit System – 6.00 6.00 7.50 4 Jun
Power Distribution Enhancement Investment Program – Tranche 1 242.00 10.00 252.00 327.00 12 SepAccelerating Economic Transformation Program (Subprogram 1) 300.00 200.00 500.00 500.00 30 SepSecond Balochistan Resource Management Program (Subprogram 1) 45.00 55.00 100.00 100.00 11 DecSindh Growth and Rural Revitalization Program (Subprogram 1) – 100.00 100.00 100.00 11 DecPunjab Millennium Development Goals Program (Subprogram 1) – 100.00 100.00 100.00 11 DecSindh Cities Improvement Investment Program – Tranche 1 – 38.00 38.00 50.00 19 Dec
Subtotal 642.00 529.00 1,171.00 1,289.00
Papua New GuineaHighlands Region Road Improvement Investment Program –
Tranche 1b – 100.00 100.00 140.00 22 Dec
Subtotal – 100.00 100.00 140.00
Philippines Development Policy Support Program (Subprogram 2) 250.00 – 250.00 250.00 30 SepAgrarian Reform Communities Project II 70.00 – 70.00 208.40 27 OctGovernance in Justice Sector Reform Program (Subprogram 1) 300.00 – 300.00 300.00 16 Dec
Subtotal 620.00 – 620.00 758.40
SamoaSanitation and Drainage (Supplementary) – 2.78 2.78 7.81 12 Sep
Subtotal – 2.78 2.78 7.81
Sri Lanka Southern Transport Development (Supplementary) 90.00 – 90.00 179.10 6 MarDry Zone Urban Water and Sanitation – 59.78 59.78 113.33 28 Nov
Subtotal 90.00 59.78 149.78 292.43
UzbekistanSurkhandarya Water Supply and Sanitation – 30.00 30.00 40.00 3 NovWater Resources Management Sector 85.00 15.00 100.00 148.00 17 Dec
Subtotal 85.00 45.00 130.00 188.00
Viet Nam Song Bung 4 Hydropower 196.00 – 196.00 267.30 26 JunHo Chi Minh City–Long Thanh–Dau Giay Expressway Construction 410.20 – 410.20 932.40 30 SepGreater Mekong Subregion Sustainable Tourism Development – 10.00 10.00 11.11 15 OctGreater Mekong Subregion: Ha Noi–Lang Son, Greater Mekong
Subregion: Ha Long–Mong Cai, and Ben Luc-Long ThanhExpressways Technical Assistance – 26.00 26.00 30.80 23 Oct
Health Care in the South Central Coast Region – 72.00 72.00 80.00 7 NovEmergency Rehabilitation of Calamity Damage (Supplementary) – 25.50 25.50 30.00 8 DecSupport for the Implementation of the Poverty Reduction
Program V (Subprogram 1) – 25.00 25.00 32.14 8 Dec
Subtotal 606.20 158.50 764.70 1,383.75
Total Sovereign 6,924.48 1,789.56 8,714.04 25,635.26
– = nil, ADF = Asian Development Fund, OCR = ordinary capital resources.a Total project cost includes financing by ADB, governments, beneficiaries, and subborrowers; cofinancing from official, export credit, and commercial sources; equity
sponsors; and local participating private companies and financial institutions.b Consists of two ADF loans.

7/30/2019 ADB Annual Report 2008 - Financial Report
http://slidepdf.com/reader/full/adb-annual-report-2008-financial-report 164/218
S T A T I S T I C
A L A N N E X E S
Asian Development Bank162
Total DateOCR ADF Total Project Costa Approved
CONTINUED
NONSOVEREIGN
Afghanistan
Roshan Expansion (Phase III) 60.00 – 60.00 175.00 29 Jul
Subtotal 60.00 – 60.00 175.00
China, People’s Republic of Municipal District Energy Infrastructure Development 200.00 – 200.00 1,285.14 2 JunInner Mongolia Wind Power 24.08 – 24.08 73.42 4 Sep
Subtotal 224.08 – 224.08 1,358.56
India Gujarat Paguthan Wind Energy Financing Facility (Samana Phase I) 45.00 – 45.00 67.64 17 AprMundra Ultra Mega Power 450.00 – 450.00 4,226.75 17 AprCLP Wind Farms Private Limited (Samana Phase II and the
Saundatti Project) 60.00 – 60.00 169.13 17 Apr
GTL Infrastructure Limited Phase II Telecommunication Infrastructure 150.00 – 150.00 1,184.54 23 MayNational Highway 1 Panipat–Jalandhar Toll Road 100.00 – 100.00 1,067.00 23 OctColumbia Asia Hospitals Development 38.64 – 38.64 154.55 10 NovRural Electrification Corporation of India 225.00 – 225.00 225.00 27 Nov
Subtotal 1,068.64 – 1,068.64 7,094.61
IndonesiaBank Mandiri (Persero) 75.00 – 75.00 300.00 29 Jul
Subtotal 75.00 – 75.00 300.00
Maldives Housing Development Finance Corporation 7.50 – 7.50 33.00 9 Apr
Subtotal 7.50 – 7.50 33.00
PhilippinesAcquisition and Rehabilitation of the Masinloc Coal-Fired
Thermal Power Plant 200.00 – 200.00 1,100.00 15 JanPrivatization and Refurbishment of the Calaca Coal-Fired
Thermal Power Plant 120.00 – 120.00 890.00 2 Jun
Subtotal 320.00 – 320.00 1,990.00
Viet Nam Saigon Thuong Tin Bank (Sacombank) 25.00 – 25.00 25.00 10 Dec
Subtotal 25.00 – 25.00 25.00
Total Nonsovereign 1,780.23 – 1,780.23 10,976.18
TOTAL 8,704.71 1,789.56 10,494.27 36,611.44
– = nil, ADF = Asian Development Fund, OCR = ordinary capital resources.a Total project cost includes financing by ADB, governments, beneficiaries, and subborrowers; cofinancing from official, export credit, and commercial sources; equity
sponsors; and local participating private companies and financial institutions.

7/30/2019 ADB Annual Report 2008 - Financial Report
http://slidepdf.com/reader/full/adb-annual-report-2008-financial-report 165/218
163 Annual Report 2008
Statistical Annex 2
GRANT-FINANCED PROJECT APPROVALS BY COUNTRY, 2008
($ million)
DateADF Other Sourcesa Total Approved
Afghanistan Agriculture Market Infrastructure 30.00 – 30.00 21 Nov
Development of Mini Hydropower Plants in Badakhshan and Bamyan Provinces – 12.00 JFPR 12.00 28 NovEnergy Sector Development Investment Program – Tranche 1 164.00 – 164.00 2 DecRoad Network Development Investment Program – Tranche 1 60.00 – 60.00 2 Dec
Subtotal 254.00 12.00 266.00
Bangladesh Emergency Disaster Damage Rehabilitation (Sector)a – 10.00 Canada 10.00 28 MarPost-Literacy and Continuing Education (Supplementary)a – 2.50 Switzerland 2.50 1 JulSkills Developmenta – 6.00 Switzerland 6.00 17 Dec
Subtotal – 18.50 18.50
Bhutan Green Power Developmenta 25.28 – 25.28 29 OctGreen Power Developmenta – 1.00 ACEF-CEFPF 1.00 26 Dec
Subtotal 25.28 1.00 26.28
Cambodia Road Asset Managementa – 4.80 Australia 4.80 21 JanHealth Sector Support (Supplementary)a – 1.80 United Kingdom 1.80 31 MarEmergency Food Assistancea 17.50 – 17.50 2 OctPublic Financial Management for Rural Development Program (Subprogram 1) 6.71 – 6.71 4 DecPublic Financial Management for Rural Development Project 4.10 – 4.10 4 DecCapacity Development in Sanitary and Phytosanitary Standards
Management Systemsa 2.00 – 2.00 5 Dec
Subtotal 30.31 6.60 36.91
China, People’s Republic of Capacity Building for Energy Efficiency Implementation – 0.80 CEF-CEFPF 0.80 4 JunNingxia Integrated Ecosystem and Agricultural Developmenta – 4.55 GEF 4.55 29 AugDryland Sustainable Agriculturea – 0.35 Spain 0.35 25 Nov
Subtotal – 5.70 5.70
Kyrgyz Republic Southern Agriculture Area Development (Supplementary)a – 2.50 GEF 2.50 15 MayInvestment Climate Improvement Program (Subprogram 1) 12.50 – 12.50 3 NovInvestment Climate Improvement Program System Support Project 2.90 – 2.90 3 NovCommunity-Based Infrastructure Services Sector 30.00 – 30.00 3 NovCAREC Transport Corridor 1 (Bishkek–Torugart Road) 20.00 – 20.00 14 Nov
Subtotal 65.40 2.50 67.90
Lao People’s Democratic Republic Alternative Livelihood for Upland Ethnic Groups in Houaphanh Province – 1.82 JFPR 1.82 13 FebGreater Mekong Subregion Sustainable Tourism Developmenta 10.00 – 10.00 15 Oct
Subtotal 10.00 1.82 11.82
Micronesia, Federated States of Weno Water Supply Well Remediation – 0.98 JFPR 0.98 17 Jul
Subtotal – 0.98 0.98
MongoliaWestern Regional Road Corridor Development – Phase I 37.60 – 37.60 26 FebCommunity-Based Local Road Upgrading and Maintenance in the
Western Region of Mongolia – 2.00 JFPR 2.00 10 JulWater Point and Extension Station Establishment for Poor Herding Families – 2.00 JFPR 2.00 30 JulPoverty Reduction through Community-Based Natural Resource Management – 2.00 JFPR 2.00 5 AugEnergy Conservation and Emissions Reduction from Poor Households – 2.00 JFPR 2.00 23 SepAgriculture and Rural Development 14.72 – 14.72 29 Sep
– = nil, ACEF-CEFPF = Asian Clean Energy Fund (Japan) under the Clean Energy Financing Partnership Facility, ADF = Asian Development Fund, CAREC = CentralAsia Regional Economic Cooperation, CEF-CEFPF = Clean Energy Fund under the Clean Energy Financing Partnership Facility, GEF = Global Environment Facility,JFPR = Japan Fund for Poverty Reduction.a Grant component of a loan project.

7/30/2019 ADB Annual Report 2008 - Financial Report
http://slidepdf.com/reader/full/adb-annual-report-2008-financial-report 166/218
S T A T I S T I C
A L A N N E X E S
Asian Development Bank164
DateADF Other Sourcesa Total Approved
CONTINUED
Education Sector Reform 10.00 – 10.00 21 NovFood and Nutrition Social Welfare Program 9.00 – 9.00 10 DecFood and Nutrition Social Welfare – Capacity Development Project 3.00 – 3.00 10 Dec
Subtotal 74.32 8.00 82.32
NepalEducation Sector Program Cluster (Subprogram II) 8.00 – 8.00 24 JanInformation and Communication Technology Development 25.00 – 25.00 28 JanGovernance Support Program (Subprogram 1) 106.30 – 106.30 22 OctRural Reconstruction and Rehabilitation Sector Development
Project (Supplementary) – 20.00 United Kingdom 20.00 11 Nov
Subtotal 139.30 20.00 159.30
Philippines Developing Microinsurance – 1.00 JFPR 1.00 15 Feb
Subtotal – 1.00 1.00
SamoaSanitation and Drainagea 2.22 – 2.22 12 Sep
Subtotal 2.22 – 2.22Solomon Islands
Road Improvement Sector (Supplementary) – 0.47 Australia 0.47 30 AprDomestic Maritime Support (Sector) 14.00 5.25 EC 19.25 25 Nov
Subtotal 14.00 5.72 19.72
Sri LankaImprovement of Rural Access Roads and Livelihood Development for the Poor – 2.00 JFPR 2.00 21 JanDry Zone Urban Water and Sanitationa 23.22 2.00 NET-WFPF 25.22 28 Nov
Subtotal 23.22 4.00 27.22
TajikistanRural Development (Supplementary)a – 3.50 GEF 3.50 15 MayCommunity Participatory Flood Management – 3.00 JFPR 3.00 8 SepNurek 500 kV Switchyard Reconstruction 54.77 – 54.77 17 Nov
Subtotal 54.77 6.50 61.27
TongaIntegrated Urban Development Sector 11.30 – 11.30 27 May
Subtotal 11.30 – 11.30
Tuvalu Improved Financial Management Program 3.24 – 3.24 16 Dec
Subtotal 3.24 – 3.24
Uzbekistan Land Improvementa – 3.00 GEF 3.00 09 JanSurkhandarya Water Supply and Sanitationa – 1.50 MDTF-WFPF 1.50 3 Nov
Subtotal – 4.50 4.50
Viet NamCommunity-Based Early Childhood Care and Development – 1.90 JFPR 1.90 19 FebLivelihood Improvement of Vulnerable Ethnic Minority Communities
Affected by the Song Bung 4 Hydropower Project in Quang Nam Province a – 2.00 JFPR 2.00 26 JunDemand-Driven Skills Training for Poverty Reduction in the Cuu Long
(Mekong) River Delta – 1.30 JFPR 1.30 18 Jul
Subtotal – 5.20 5.20
TOTAL 707.36 104.01 811.37
– = nil, ADF = Asian Development Fund, EC = European Commission, GEF = Global Environment Facility, JFPR = Japan Fund for Poverty Reduction, MDTF-WFPF =Multidonor Trust Fund under the Water Financing Partnership Facility, NET-WFPF = The Netherlands Trust Fund for the Water Financing Partnership Facility.a Grant component of a loan project.

7/30/2019 ADB Annual Report 2008 - Financial Report
http://slidepdf.com/reader/full/adb-annual-report-2008-financial-report 167/218
165 Annual Report 2008
Statistical Annex 3
LOAN APPROVALS BY SECTOR: 3-YEAR MOVING AVERAGES, 1968-1970–2006-2008
Law, Water
Health, Economic Transport Supply,
Total Agriculture Nutrition, Management, and Sanitation,
Lendinga and Natural and Social Industry and Public Commu- and Waste Multi-
($ million) Resources Education Energy Finance Protection and Trade Policy nications Management sector
Average during (percent of total lending)
1968–1970 128.44 18.32 0.78 11.98 14.27 – 24.92 – 24.03 5.32 0.38
1969–1971 199.25 19.16 0.50 25.38 13.45 – 15.89 – 21.68 3.70 0.25
1970–1972 271.92 13.86 0.82 33.06 10.71 – 9.95 – 21.48 9.93 0.18
1971–1973 330.53 12.72 1.02 32.18 11.29 – 7.68 – 23.88 11.23 –
1972–1974 428.42 14.17 0.79 26.71 12.73 – 8.46 – 21.32 13.33 2.49
1973–1975 543.15 16.57 1.28 23.03 13.35 – 16.03 – 17.68 9.16 2.89
1974–1976 661.29 17.48 0.73 20.74 14.67 – 14.53 – 16.61 9.06 6.18
1975–1977 774.22 17.85 1.49 21.50 13.09 – 12.17 – 16.97 8.43 8.51
1976–1978 940.36 17.56 2.95 21.11 11.01 1.36 10.16 – 15.98 8.97 10.90
1977–1979 1,098.92 19.65 5.13 22.84 9.54 1.17 9.55 – 12.10 8.71 11.31
1978–1980 1,282.01 22.81 5.56 23.74 7.71 1.41 8.42 – 12.39 8.05 9.931979–1981 1,454.96 24.70 5.35 26.21 7.29 1.72 9.21 – 9.41 7.67 8.45
1980–1982 1,598.97 29.52 4.41 27.61 6.04 2.01 7.43 – 11.53 5.87 5.59
1981–1983 1,751.46 31.78 5.19 26.60 6.61 2.91 8.00 – 7.52 6.87 4.52
1982–1984 1,937.03 34.36 5.34 28.98 4.09 1.88 4.05 – 12.12 5.94 3.25
1983–1985 1,978.52 31.63 5.27 24.63 4.48 2.42 3.75 – 12.75 8.36 6.71
1984–1986 2,013.77 32.17 4.95 25.26 3.82 2.02 2.23 – 14.40 6.02 9.11
1985–1987 2,081.84 27.37 3.97 17.47 7.80 2.19 7.53 – 20.54 4.75 8.38
1986–1988 2,512.17 22.78 5.20 18.76 8.07 1.60 12.68 – 23.12 1.47 6.32
1987–1989 3,053.72 19.80 4.97 16.07 12.42 1.91 12.30 – 23.47 3.42 5.65
1988–1990 3,564.93 22.53 6.33 20.48 11.10 1.35 7.43 – 20.68 3.38 6.71
1989–1991 4,115.49 22.51 5.25 25.79 9.55 1.43 6.67 – 17.93 3.09 7.77
1990–1992 4,610.39 18.03 5.00 28.91 7.96 1.14 6.40 – 20.60 2.04 9.911991–1993 5,022.89 11.37 5.18 31.01 6.60 1.26 8.48 0.09 23.46 3.07 9.47
1992–1994 4,665.65 9.19 4.90 29.63 6.11 1.56 5.08 0.09 29.31 4.43 9.70
1993–1995 4,791.51 10.83 5.74 31.66 5.61 1.13 3.58 0.09 26.79 6.34 8.22
1994–1996 4,806.49 14.06 5.64 27.54 6.15 1.65 1.52 1.77 25.64 5.63 10.39
1995–1997 6,718.17 10.34 6.71 18.66 30.08 1.70 1.29 1.84 16.33 5.21 7.85
1996–1998 6,883.72 7.34 5.46 11.67 34.80 5.50 1.19 2.02 18.49 3.87 9.67
1997–1999 6,776.72 5.50 4.64 9.76 34.15 6.76 1.97 4.38 16.84 4.92 11.08
1998–2000 5,499.56 7.77 4.01 13.94 12.54 8.09 4.64 5.30 23.49 4.64 15.58
1999–2001 5,284.95 10.68 4.96 15.92 3.60 3.58 5.02 10.96 23.99 4.22 17.07
2000–2002 5,526.40 10.94 5.35 17.02 8.60 1.58 3.83 9.51 27.04 2.98 13.15
2001–2003 5,693.81 9.03 4.10 14.27 7.44 1.35 2.61 10.40 33.23 5.33 12.242002–2004 5,593.92 6.53 4.29 14.79 7.63 2.65 3.03 8.65 37.43 4.99 10.01
2003–2005 5,628.15 5.28 2.93 15.03 3.83 2.74 2.30 9.84 37.50 7.49 13.05
2004–2006 6,021.31 7.20 3.25 17.03 11.82 1.83 1.01 8.76 28.71 7.12 13.26
2005–2007 7,663.50 5.43 1.97 16.41 13.32 0.47 0.37 9.47 30.80 7.24 14.52
2006–2008 9,241.38 5.01 1.90 18.61 10.52 0.94 0.82 12.06 29.19 5.22 15.71
Cumulativea $ million
(1968–2008) 143,528.39 17,063.03 6,023.83 28,502.50 16,690.00 3,292.22 5,715.04 7,741.44 35,115.60 7,311.66 16,073.08
– = nil.a Totals may not add because of rounding.

7/30/2019 ADB Annual Report 2008 - Financial Report
http://slidepdf.com/reader/full/adb-annual-report-2008-financial-report 168/218
S T A T I S T I C
A L A N N E X E S
Asian Development Bank166
Statistical Annex 4
LOAN APPROVALS BY SECTOR, 2008
$ Million
OCR ADF Total
AGRICULTURE AND NATURAL RESOURCES CAM Emergency Food Assistance – 17.50 17.50
IND Orissa Integrated Irrigated Agriculture and Water ManagementInvestment Program – Tranche 1 47.20 – 47.20
PHI Agrarian Reform Communities Project II 70.00 – 70.00PRC Ningxia Integrated Ecosystem and Agricultural Development 100.00 – 100.00PRC Dryland Sustainable Agriculture 83.00 – 83.00UZB Water Resources Management Sector 85.00 15.00 100.00VIE Emergency Rehabilitation of Calamity Damage (Supplementary) – 25.50 25.50
Subtotal 385.20 58.00 443.20
EDUCATIONBAN Skills Development – 50.00 50.00INO Vocational Education Strengthening – 80.00 80.00
Subtotal – 130.00 130.00
ENERGY AZE Power Transmission Enhancement 160.00 – 160.00BHU Green Power Development 51.00 29.00 80.00IND Gujarat Paguthan Wind Energy Financing Facilitya (Samana Phase I) 45.00 – 45.00IND Mundra Ultra Mega Powera 450.00 – 450.00IND CLP Wind Farms Private Limiteda (Samana Phase II and
the Saundatti Project) 60.00 – 60.00IND National Power Grid Development Investment Program – Tranche 1 400.00 – 400.00IND Himachal Pradesh Clean Energy Development Investment Program – Tranche 1 150.00 – 150.00IND Uttarakhand Power Sector Investment Program – Tranche 1 62.40 – 62.40PAK Power Distribution Enhancement Investment Program – Tranche 1 242.00 10.00 252.00PHI Acquisition and Rehabilitation of the Masinloc Coal-Fired Thermal Power Planta 200.00 – 200.00PHI Privatization and Refurbishment of the Calaca Coal-Fired Thermal Power Planta 120.00 – 120.00PRC Municipal District Energy Infrastructure Developmenta 200.00 – 200.00PRC Inner Mongolia Wind Powera 24.08 – 24.08PRC Gansu Heihe Rural Hydropower Development Investment Program – Tranche 2:
Dagushan Hydropower 28.00 – 28.00PRC Guangdong Energy Efficiency and Environment Improvement Investment Program –
Tranche 1 35.00 – 35.00VIE Song Bung 4 Hydropower 196.00 – 196.00
Subtotal 2,423.48 39.00 2,462.48
FINANCECAM Financial Sector Program II Cluster (Subprogram 2) – 10.30 10.30INO Bank Mandiri (Persero)a 75.00 – 75.00MLD Housing Development Finance Corporationa 7.50 – 7.50VIE Saigon Thuong Tin Bank (Sacombank)a 25.00 – 25.00
Subtotal 107.50 10.30 117.80
HEALTH, NUTRITION, AND SOCIAL PROTECTION IND Columbia Asia Hospitals Developmenta 38.64 – 38.64PAK Punjab Millennium Development Goals Program (Subprogram 1) – 100.00 100.00VIE Health Care in the South Central Coast Region – 72.00 72.00
Subtotal 38.64 172.00 210.64
– = nil, ADF = Asian Development Fund, AZE = Azerbaijan, BAN = Bangladesh, BHU = Bhutan, CAM = Cambodia, IND = India, INO = Indonesia,MLD = Maldives, OCR = ordinary capital resources, PAK = Pakistan, PHI = Philippines, PRC = People’s Republic of China, UZB = Uzbekistan, VIE = Viet Nam.a Nonsovereign Loan.

7/30/2019 ADB Annual Report 2008 - Financial Report
http://slidepdf.com/reader/full/adb-annual-report-2008-financial-report 169/218
167 Annual Report 2008
$ Million
OCR ADF Total
CONTINUED
INDUSTRY AND TRADE IND Khadi Reform and Development Program 150.00 – 150.00
MLD Private Sector Development – 7.50 7.50VIE Greater Mekong Subregion Sustainable Tourism Development – 10.00 10.00
Subtotal 150.00 17.50 167.50
LAW, ECONOMIC MANAGEMENT, AND PUBLIC POLICY CAM Promoting Economic Diversification Program (Subprogram 1) – 20.00 20.00IND Assam Governance and Public Resource Management Sector Development Program
(Subprogram II) 100.00 – 100.00INO Second Local Government Finance and Governance Reform Program Cluster
(Subprogram 1) 350.00 – 350.00INO Fourth Development Policy Support Program 200.00 – 200.00PAK Accelerating Economic Transformation Program (Subprogram 1) 300.00 200.00 500.00PAK Second Balochistan Resource Management Program (Subprogram 1) 45.00 55.00 100.00PAK Sindh Growth and Rural Revitalization Program (Subprogram 1) – 100.00 100.00
PHI Development Policy Support Program (Subprogram 2) 250.00 – 250.00PHI Governance in Justice Sector Reform Program (Subprogram 1) 300.00 – 300.00VIE Support for the Implementation of the Poverty Reduction Program V (Subprogam 1) – 25.00 25.00
Subtotal 1,545.00 400.00 1,945.00
TRANSPORT AND COMMUNICATIONS ARM Rural Road Sector (Supplementary) – 17.32 17.32AZE Road Network Development Program – Tranche 2 55.40 – 55.40CAM Road Asset Management – 6.00 6.00COO Avatiu Port Development 8.63 6.88 15.51IND GTL Infrastructure Limited Phase II Telecommunication Infrastructurea 150.00 – 150.00IND National Highway 1 Panipat-Jalandhar Toll Roada 100.00 – 100.00IND Rural Roads Sector II Investment Program – Tranche 2 77.65 – 77.65IND Bihar State Highways 420.00 – 420.00IND Rural Roads Sector II Investment Program – Tranche 3 130.00 – 130.00IND Uttarakhand State-Road Investment Program – Tranche 2 140.00 – 140.00KAZ CAREC Transport Corridor I (Zhambyl Oblast Section) [Western Europe-
Western People’s Republic of China International Transit Corridor]Investment Program – Tranche 1 340.00 – 340.00
PAK Preparing the Lahore Rapid Mass Transit System – 6.00 6.00PNG Highlands Region Road Improvement Investment Program – Tranche 1b – 100.00 100.00PRC Central Yunnan Roads Development 200.00 – 200.00PRC Lanzhou–Chongqing Railway Development 300.00 – 300.00PRC Chongqing–Lichuan Railway Development 150.00 – 150.00SRI Southern Transport Development (Supplementary) 90.00 – 90.00VIE Ho Chi Minh City–Long Thanh–Dau Giay Expressway Construction 410.20 – 410.20VIE Greater Mekong Subregion: Ha Noi–Lang Son, Greater Mekong Subregion:
Ha Long-Mong Cai, and Ben Luc–Long Thanh Expressways Technical Assistance – 26.00 26.00
Subtotal 2,571.88 162.20 2,734.08
– = nil, ADF = Asian Development Fund, ARM = Armenia, AZE = Azerbaijan, CAM = Cambodia, CAREC = Central Asia Regional Economic Cooperation, COO =Cook Islands, IND = India, INO = Indonesia, KAZ = Kazakhstan, MLD = Maldives, OCR = ordinary capital resources, PAK = Pakistan, PHI = Philippines, PNG = PapuaNew Guinea, PRC = People’s Republic of China, SRI = Sri Lanka, VIE = Viet Nam.a Nonsovereign Loan.b Consists of two ADF loans.
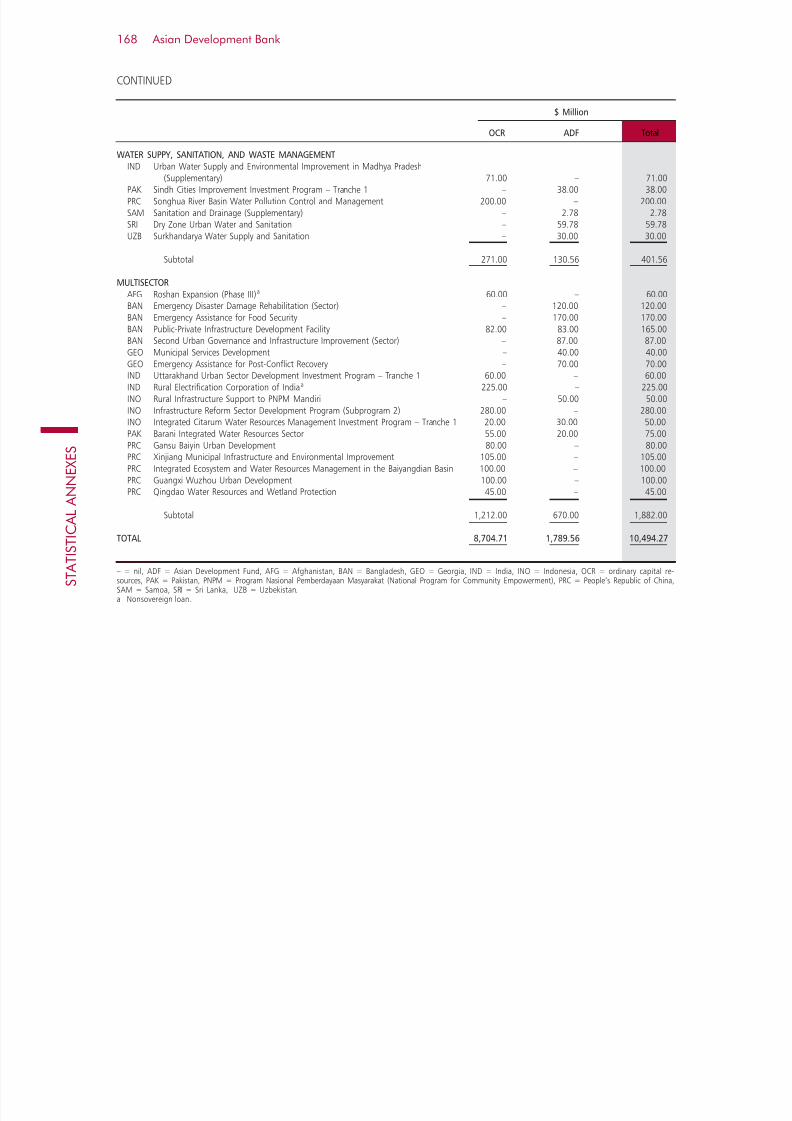
7/30/2019 ADB Annual Report 2008 - Financial Report
http://slidepdf.com/reader/full/adb-annual-report-2008-financial-report 170/218
S T A T I S T I C
A L A N N E X E S
Asian Development Bank168
WATER SUPPY, SANITATION, AND WASTE MANAGEMENT IND Urban Water Supply and Environmental Improvement in Madhya Pradesh
(Supplementary) 71.00 – 71.00PAK Sindh Cities Improvement Investment Program – Tranche 1 – 38.00 38.00PRC Songhua River Basin Water Pollution Control and Management 200.00 – 200.00SAM Sanitation and Drainage (Supplementary) – 2.78 2.78SRI Dry Zone Urban Water and Sanitation – 59.78 59.78UZB Surkhandarya Water Supply and Sanitation – 30.00 30.00
Subtotal 271.00 130.56 401.56
MULTISECTOR AFG Roshan Expansion (Phase III)a 60.00 – 60.00BAN Emergency Disaster Damage Rehabilitation (Sector) – 120.00 120.00BAN Emergency Assistance for Food Security – 170.00 170.00BAN Public-Private Infrastructure Development Facility 82.00 83.00 165.00BAN Second Urban Governance and Infrastructure Improvement (Sector) – 87.00 87.00
GEO Municipal Services Development – 40.00 40.00GEO Emergency Assistance for Post-Conflict Recovery – 70.00 70.00IND Uttarakhand Urban Sector Development Investment Program – Tranche 1 60.00 – 60.00IND Rural Electrification Corporation of Indiaa 225.00 – 225.00INO Rural Infrastructure Support to PNPM Mandiri – 50.00 50.00INO Infrastructure Reform Sector Development Program (Subprogram 2) 280.00 – 280.00INO Integrated Citarum Water Resources Management Investment Program – Tranche 1 20.00 30.00 50.00PAK Barani Integrated Water Resources Sector 55.00 20.00 75.00PRC Gansu Baiyin Urban Development 80.00 – 80.00PRC Xinjiang Municipal Infrastructure and Environmental Improvement 105.00 – 105.00PRC Integrated Ecosystem and Water Resources Management in the Baiyangdian Basin 100.00 – 100.00PRC Guangxi Wuzhou Urban Development 100.00 – 100.00PRC Qingdao Water Resources and Wetland Protection 45.00 – 45.00
Subtotal 1,212.00 670.00 1,882.00
TOTAL 8,704.71 1,789.56 10,494.27
– = nil, ADF = Asian Development Fund, AFG = Afghanistan, BAN = Bangladesh, GEO = Georgia, IND = India, INO = Indonesia, OCR = ordinary capital re-sources, PAK = Pakistan, PNPM = Program Nasional Pemberdayaan Masyarakat (National Program for Community Empowerment), PRC = People’s Republic of China,SAM = Samoa, SRI = Sri Lanka, UZB = Uzbekistan.a Nonsovereign loan.
$ Million
OCR ADF Total
CONTINUED
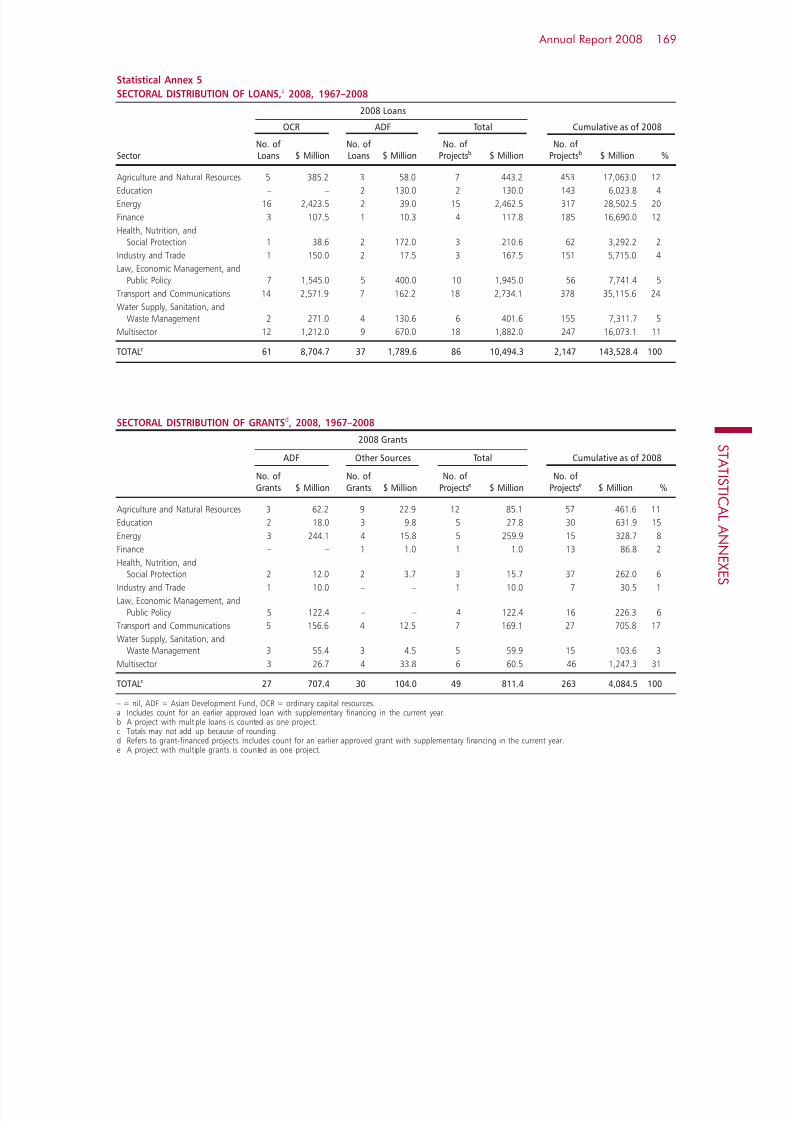
7/30/2019 ADB Annual Report 2008 - Financial Report
http://slidepdf.com/reader/full/adb-annual-report-2008-financial-report 171/218
169 Annual Report 2008
Statistical Annex 5
SECTORAL DISTRIBUTION OF LOANS,a 2008, 1967–2008
2008 Loans
OCR ADF Total Cumulative as of 2008
No. of No. of No. of No. ofSector Loans $ Million Loans $ Million Projectsb $ Million Projectsb $ Million %
Agriculture and Natural Resources 5 385.2 3 58.0 7 443.2 453 17,063.0 12Education – – 2 130.0 2 130.0 143 6,023.8 4
Energy 16 2,423.5 2 39.0 15 2,462.5 317 28,502.5 20
Finance 3 107.5 1 10.3 4 117.8 185 16,690.0 12
Health, Nutrition, andSocial Protection 1 38.6 2 172.0 3 210.6 62 3,292.2 2
Industry and Trade 1 150.0 2 17.5 3 167.5 151 5,715.0 4
Law, Economic Management, andPublic Policy 7 1,545.0 5 400.0 10 1,945.0 56 7,741.4 5
Transport and Communications 14 2,571.9 7 162.2 18 2,734.1 378 35,115.6 24
Water Supply, Sanitation, andWaste Management 2 271.0 4 130.6 6 401.6 155 7,311.7 5
Multisector 12 1,212.0 9 670.0 18 1,882.0 247 16,073.1 11
TOTALc
61 8,704.7 37 1,789.6 86 10,494.3 2,147 143,528.4 100
SECTORAL DISTRIBUTION OF GRANTSd, 2008, 1967–2008
2008 Grants
ADF Other Sources Total Cumulative as of 2008
No. of No. of No. of No. ofGrants $ Million Grants $ Million Projectse $ Million Projectse $ Million %
Agriculture and Natural Resources 3 62.2 9 22.9 12 85.1 57 461.6 11
Education 2 18.0 3 9.8 5 27.8 30 631.9 15
Energy 3 244.1 4 15.8 5 259.9 15 328.7 8
Finance – – 1 1.0 1 1.0 13 86.8 2
Health, Nutrition, andSocial Protection 2 12.0 2 3.7 3 15.7 37 262.0 6
Industry and Trade 1 10.0 – – 1 10.0 7 30.5 1
Law, Economic Management, andPublic Policy 5 122.4 – – 4 122.4 16 226.3 6
Transport and Communications 5 156.6 4 12.5 7 169.1 27 705.8 17
Water Supply, Sanitation, andWaste Management 3 55.4 3 4.5 5 59.9 15 103.6 3
Multisector 3 26.7 4 33.8 6 60.5 46 1,247.3 31
TOTALc 27 707.4 30 104.0 49 811.4 263 4,084.5 100
– = nil, ADF = Asian Development Fund, OCR = ordinary capital resources.
a Includes count for an earlier approved loan with supplementary financing in the current year.b A project with multiple loans is counted as one project.c Totals may not add up because of rounding.d Refers to grant-financed projects. Includes count for an earlier approved grant with supplementary financing in the current year.e A project with multiple grants is counted as one project.

7/30/2019 ADB Annual Report 2008 - Financial Report
http://slidepdf.com/reader/full/adb-annual-report-2008-financial-report 172/218
S T A T I S T I C
A L A N N E X E S
Asian Development Bank170
Statistical Annex 6
LOAN AND ADF GRANT APPROVALS, BY COUNTRY AND SOURCE OF FUNDS, 2008
(amounts in $ million)
OCR ADF Loan Loan Grant Total %
SovereignAfghanistan – – 254.0 254.0 2.3
Armenia – 17.3 – 17.3 0.2Azerbaijan 215.4 – – 215.4 1.9Bangladesh 82.0 510.0 – 592.0 5.3Bhutan 51.0 29.0 25.3 105.3 0.9Cambodia – 53.8 30.3 84.1 0.8China, People’s Republic of 1,526.0 – – 1,526.0 13.6Cook Islands 8.6 6.9 – 15.5 0.1Georgia – 110.0 – 110.0 1.0India 1,808.3 – – 1,808.3 16.1Indonesia 850.0 160.0 – 1,010.0 9.0Kazakhstan 340.0 – – 340.0 3.0Kyrgyz Republic – – 65.4 65.4 0.6Lao People’s Democratic Republic – – 10.0 10.0 0.1Maldives – 7.5 – 7.5 0.1Mongolia – – 74.3 74.3 0.7
Nepal – – 139.3 139.3 1.2Pakistan 642.0 529.0 – 1,171.0 10.5Papua New Guinea – 100.0 – 100.0 0.9Philippines 620.0 – – 620.0 5.5Samoa – 2.8 2.2 5.0 0.0Solomon Islands – – 14.0 14.0 0.1Sri Lanka 90.0 59.8 23.2 173.0 1.5Tajikistan – – 54.8 54.8 0.5Tonga – – 11.3 11.3 0.1Tuvalu – – 3.2 3.2 0.0Uzbekistan 85.0 45.0 – 130.0 1.2Viet Nam 606.2 158.5 – 764.7 6.8
Subtotal 6,924.5 1,789.6 707.4 9,421.4 84.1
Nonsovereign Afghanistan 60.0 – – 60.0 0.5China, People’s Republic of 224.1 – – 224.1 2.0India 1,068.6 – – 1,068.6 9.5Indonesia 75.0 – – 75.0 0.7Maldives 7.5 – – 7.5 0.1Philippines 320.0 – – 320.0 2.9Viet Nam 25.0 – – 25.0 0.2
Subtotal 1,780.2 – – 1,780.2 15.9
TOTALa 8,704.7 1,789.6 707.4 11,201.6 100.0
– = nil, ADF = Asian Development Fund, OCR = ordinary capital resources.a Totals may not add up because of rounding.

7/30/2019 ADB Annual Report 2008 - Financial Report
http://slidepdf.com/reader/full/adb-annual-report-2008-financial-report 173/218
171 Annual Report 2008
Statistical Annex 7
PROJECTS INVOLVING COFINANCING,a 2008
($ million)
Cofinancing
Official
ADB Grants Loans Commercial Source of Cofinancing
CENTRAL AND WEST ASIA 187.30 10.50 20.00 10.00 DVA cofinancing 10.50 – 10.00
Non-DVA cofinancing – 20.00 –
Afghanistan Roshan Expansion (Phase III)b 60.00 10.00c, d Commercial lender with ADB political risk guarantee
20.00 Société de Promotion et de Participation pour la
Coopération Economique, France
Kyrgyz Republic
Southern Agriculture Area Development (Supplementary)e 20.00 2.50c Global Environment Facility (GEF)
Tajikistan
Rural Development (Supplementary)e 17.10 3.50c GEF
Uzbekistan
Land Improvemente 60.20 3.00c GEFSurkhandarya Water Supply and Sanitation 30.00 1.50c Multidonor Trust Fund under the Water Financing
Partnership Facility EAST ASIA 1,572.08 5.70 – 6,381.52
DVA cofinancing 5.70 – 200.00
Non-DVA cofinancing – – 6,181.52
China, People’s Republic of
Central Yunnan Roads Development 200.00 211.50 Industrial and Commercial Bank of China (ICBC),People’s Republic of China (PRC)
Chongqing–Lichuan Railway Development 150.00 1,385.60 China Construction Bank (CCB), PRC
Dryland Sustainable Agriculture 83.00 0.35c SpainGansu Baiyin Urban Development 80.00 12.08 Domestic banksCapacity Building for Energy Efficiency Clean Energy Fund under the Clean Energy Financing
Implementation 35.00 0.80c Partnership FacilityGuangxi Wuzhou Urban Development 100.00 80.90 CCB, PRCInner Mongolia Wind Powerb 24.08 25.00 ICBC, PRCIntegrated Ecosystem and Water Resources Management
in the Baiyangdian Basin 100.00 4.60 CCB, PRCLanzhou–Chongqing Railway Development 300.00 3,166.40 CCB, PRC
838.00 ICBC, PRCMunicipal District Energy Infrastructure Developmentb 200.00 200.00c Commercial lenders under ADB B-loan
457.14 Commercial banksNingxia Integrated Ecosystem and Agricultural Development 100.00 4.55c GEF
Songhua River Basin Water Pollution Control andManagement 200.00 0.30 Domestic banks
PACIFIC 14.00 5.72 – –
DVA cofinancing 5.72 – –
Non-DVA cofinancing – – –
Solomon Islands
Domestic Maritime Support (Sector) 14.00 5.25c European CommissionRoad Improvement Sector (Supplementary)e – 0.47c Australian Agency for International Development
(AusAID), Australia
– = nil, DVA = direct value-added.a List excludes technical assistance projects.b Nonsovereign private sector loan.c DVA cofinancing .d Cancelled/not made effective.e Anchor ADB project was approved in prior years with cofinancing arranged this year.

7/30/2019 ADB Annual Report 2008 - Financial Report
http://slidepdf.com/reader/full/adb-annual-report-2008-financial-report 174/218
S T A T I S T I C
A L A N N E X E S
Asian Development Bank172
SOUTH ASIA 1,838.80 166.30 1,420.00 4,650.56
DVA cofinancing 41.50 370.00 140.00Non-DVA cofinancing 124.80 1,050.00 4,510.56
Bangladesh
Emergency Disaster Damage Rehabilitation (Sector) 120.00 10.00c Canadian International Development Agency, Canada60.00c Japan Bank for International Cooperation (JBIC), Japan20.00c OPEC Fund for International Development (OFID)
Post-Literacy and Continuing Education (Supplementary)e – 2.50c Swiss Agency for Development and Cooperation (SDC),Switzerland
Public–Private Infrastructure Development Facility 165.00 100.00 Islamic Development Bank
Second Urban Governance and Infrastructure Improvement(Sector) 87.00 4.70 Deutsche Gesellschaft für Technische
Zusammenarbeit, Germany
36.10 Kredinstalt für Wiederaufbau (KfW), GermanySkills Development 50.00 6.00c SDC
Bhutan
Green Power Development 105.30 1.00c
Asian Clean Energy Fund (Japan) under the CleanEnergy Financing Partnership Facility
55.46 Oesterreichische Kontrollbank Aktiengessellschaft,Austria
India Infrastructure Project Financing Facilitye 300.00 2,124.00 Commercial lendersMundra Ultra Mega Powerb, f 450.00 450.00 International Finance Corporation (IFC) A Loan
1,470.10 Domestic banks
300.00 Korea Export Insurance Corporation (KEIC),Republic of Korea
500.00 The Export–Import Bank of Korea (KEXIM),
Republic of KoreaNational Highway 1 Panipat–Jalandhar Toll Roadb 100.00 140.00c,d Commercial lenders under ADB B-loan
561.00 Domestic banks
Orissa Integrated Irrigated Agriculture andWater Management Investment Program 47.20 30.00c OFID
Rural Electrification Corporation of Indiag
225.00 80.00c
Agence Française de Developpement, France100.00c European Investment Bank 80.00c KfW
Nepal Governance Support Program (Subprogram 1) 106.30 12.00 Denmark
30.00 Department for International Development (DFID),
United Kingdom6.60 Norway3.40 SDC
2.25 United Nations Capital Development Fund4.70 United Nations Development Programme9.15 United Nations Population Fund
13.90 United Nations Children’s Fund0.50 Unted Nations Volunteers
Rural Reconstruction and Rehabilitation Sector
Development Project (Supplementary)e – 20.00c DFID
1.50 SDC
Sri Lanka Dry Zone Urban Water and Sanitation 83.00 2.00c The Netherlands Trust Fund for the Water Financing
Partnership Facility
CONTINUED
Cofinancing
Official
ADB Grants Loans Commercial Source of Cofinancing
– = nil, DVA = direct value-added.a List excludes technical assistance projects.b Nonsovereign private sector loan.c DVA cofinancing .d Cancelled/not made effective.e Anchor ADB project was approved in prior years with cofinancing arranged this year.f Includes a tranche of up to $200 million funded by ADB to KEXIM through a risk participation agreement.g Nonsovereign public sector loan.
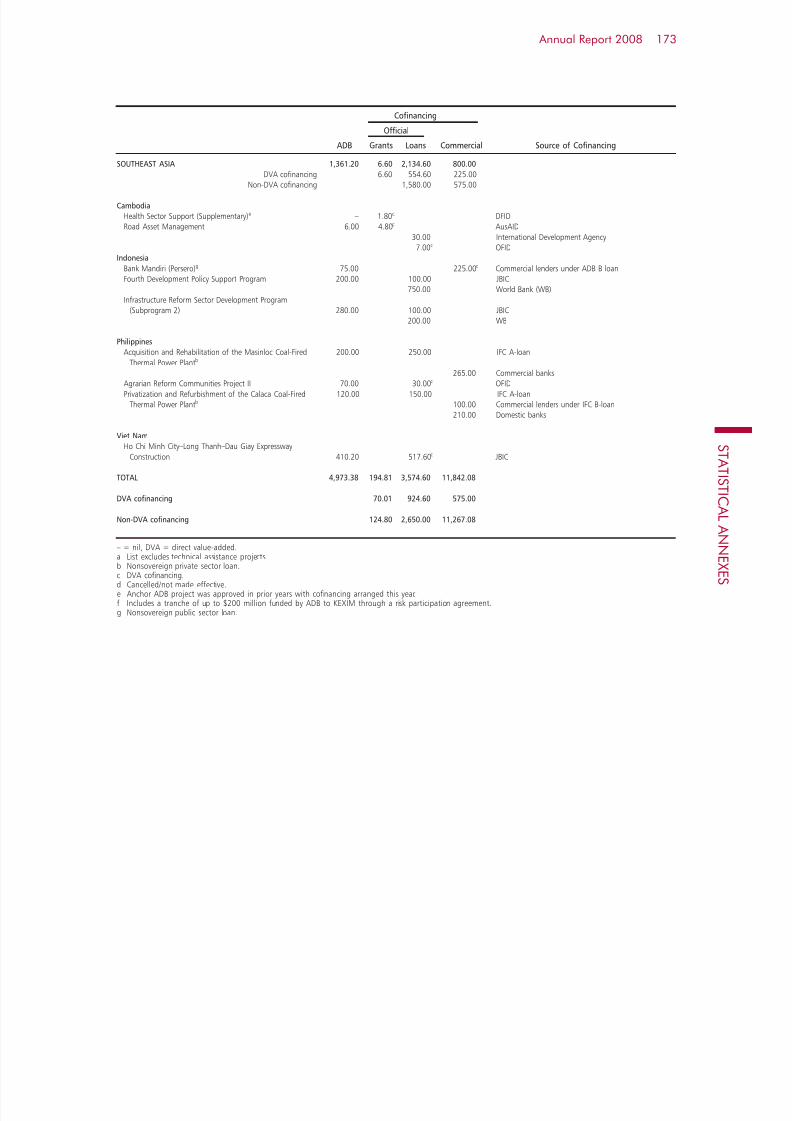
7/30/2019 ADB Annual Report 2008 - Financial Report
http://slidepdf.com/reader/full/adb-annual-report-2008-financial-report 175/218
173 Annual Report 2008
SOUTHEAST ASIA 1,361.20 6.60 2,134.60 800.00
DVA cofinancing 6.60 554.60 225.00Non-DVA cofinancing 1,580.00 575.00
Cambodia Health Sector Support (Supplementary)e – 1.80c DFIDRoad Asset Management 6.00 4.80c AusAID
30.00 International Development Agency7.00c OFID
Indonesia
Bank Mandiri (Persero)g 75.00 225.00c Commercial lenders under ADB B loanFourth Development Policy Support Program 200.00 100.00 JBIC
750.00 World Bank (WB)
Infrastructure Reform Sector Development Program(Subprogram 2) 280.00 100.00 JBIC
200.00 WB
Philippines
Acquisition and Rehabilitation of the Masinloc Coal-Fired 200.00 250.00 IFC A-loanThermal Power Plantb 265.00 Commercial banks
Agrarian Reform Communities Project II 70.00 30.00c OFID
Privatization and Refurbishment of the Calaca Coal-Fired 120.00 150.00 IFC A-loanThermal Power Plantb 100.00 Commercial lenders under IFC B-loan
210.00 Domestic banks
Viet Nam
Ho Chi Minh City–Long Thanh–Dau Giay Expressway
Construction 410.20 517.60 c JBIC
TOTAL 4,973.38 194.81 3,574.60 11,842.08
DVA cofinancing 70.01 924.60 575.00
Non-DVA cofinancing 124.80 2,650.00 11,267.08
– = nil, DVA = direct value-added.a List excludes technical assistance projects.b Nonsovereign private sector loan.c DVA cofinancing.d Cancelled/not made effective.e Anchor ADB project was approved in prior years with cofinancing arranged this year.f Includes a tranche of up to $200 million funded by ADB to KEXIM through a risk participation agreement.g Nonsovereign public sector loan.
Cofinancing
Official
ADB Grants Loans Commercial Source of Cofinancing

7/30/2019 ADB Annual Report 2008 - Financial Report
http://slidepdf.com/reader/full/adb-annual-report-2008-financial-report 176/218
S T A T I S T I C
A L A N N E X E S
Asian Development Bank174
Statistical Annex 9a
PROGRAM LOAN DISBURSEMENTS, 2008
($ million)
OCR ADF Total
Afghanistan – 2.53 2.53
Bangladesh – 96.94 96.94
Cambodia – 47.37 47.37
India 290.00 – 290.00Indonesia 830.00 – 830.00
Lao People’s Democratic Republic – 8.66 8.66
Nepal – 2.59 2.59
Pakistan 1,011.42 508.19 1,519.62
Philippines 587.55 – 587.55
Sri Lanka 15.00 – 15.00
Viet Nam – 47.01 47.01
TOTALa 2,733.98 713.30 3,447.28
– = nil, ADF = Asian Development Fund, OCR = ordinary capital resources.a Totals may not add up because of rounding.
Statistical Annex 8
LOAN DISBURSEMENTS, 2007 and 2008
(amounts in $ thousand)
2 0 0 7
% of % of % ofTotal Total Total
OCR OCR ADF ADF Total Disbursements
Projecta Nondevelopment Finance Institution 1,931,730 37 906,931 56 2,838,661 41Development Finance Institution 17,178 – – – 17,178 –
Total Project Loans 1,948,908 37 906,931 56 2,855,839 41
Programb 1,972,574 38 566,069 35 2,538,643 37Sectorc 821,662 16 144,630 9 966,292 14Private Sectord 490,627 9 – – 490,627 7
TOTALe 5,233,771 100 1,617,630 100 6,851,401 100
2 0 0 8
% of % of % of % Change
Total Total Total (2008/2007) OCR OCR ADF ADF Total Disbursements OCR ADF Total
Projecta Nondevelopment Finance Institution 2,256,882 35 1,170,673 57 3,427,555 40 17 29 21Development Finance Institution 127,860 2 – – 127,860 2 644 – 644
Total Project Loans 2,384,742 37 1,170,673 57 3,555,415 42 22 29 24
Programb 2,733,977 42 713,296 35 3,447,273 40 39 26 36Sectorc 759,288 12 158,665 8 917,953 11 (8) 10 (5)Private Sectord 594,382 9 – – 594,382 7 21 – 21
TOTALe 6,472,389 100 2,042,634 100 8,515,023 100 24 26 24
– = nil, ( ) = negative, ADF = Asian Development Fund, OCR = ordinary capital resources.
a A project loan is provided to finance specific projects. ADB uses development finance institutions in its developing member countries (DMCs) as vehicles to financesmall to medium-sized projects in the private sector.
b A program loan is provided to support DMCs’ efforts to improve the policy, institutional, and investment environment of sector development. It helps meet short-term costs that policy adjustments entail.
c A sector loan is provided to develop a specific sector or subsector. It finances a large number of subprojects in a single sector or subsector.d Includes nonsovereign public sector loans and excludes equity investments.e Totals may not add up because of rounding.

7/30/2019 ADB Annual Report 2008 - Financial Report
http://slidepdf.com/reader/full/adb-annual-report-2008-financial-report 177/218
175 Annual Report 2008
Statistical Annex 9b
TRENDS IN PROGRAM LENDING AND GRANT, 1998–2008
Program Loan and ADF Grant Project Loan and ADF Grant Total
Year $ Million % $ Mill ion % $ Mil lion
1998 2,627.5 44 3,355.0 56 5,982.5
1999 1,694.0 34 3,239.6 66 4,933.6
2000 1,102.0 20 4,480.6 80 5,582.6
2001 1,583.0 30 3,755.7 70 5,338.7
2002 1,702.2 30 3,955.7 70 5,657.9
2003 1,139.5 19 4,945.3 81 6,084.8
2004 1,121.4 22 3,917.6 78 5,039.0
2005 1,143.5 19 4,863.7 81 6,007.2
2006 3,204.6 43 4,331.6 57 7,536.2
2007 2,521.0 24 7,963.9 76 10,484.9
2008 2,631.1 23 8,570.6 77 11,201.6
ADF = Asian Development Fund.
Statistical Annex 10
NONSOVEREIGN APPROVALS AND TOTAL PROJECT COSTS BY COUNTRY,a
2008($ million)
Equity Total Complementary Partial Political Swap Total Project
Invest- ADB Loan Credit Risk with ADB Cost/
Loan ment Funds (B-Loan) Guarantee Guarantee DMCs Approvals Fund Size
Afghanistan
Roshan Expansion (Phase III) 60.00 – 60.00 – – 10.00 – 70.00 175.00
China, People’s Republic of
Municipal District Energy Infrastructure
Development 200.00 – 200.00 200.00 – – – 400.00 1,285.14
Inner Mongolia Wind Power 24.08 – 24.08 – – – – 24.08 73.42
India
Mundra Ultra Mega Power 450.00 – 450.00 – – – – 450.00 4,226.75
Gujarat Paguthan Wind Energy
Financing Facilityb 105.00 – 105.00 – – – – 105.00 236.77India Mortgage Guarantee Company – 18.58 18.58 – – – – 18.58 27.87
Columbia Asia Hospitals Development 38.64 – 38.64 – – – – 38.64 154.55
GTL Infrastructure Limited Phase II
Telecommunication Infrastructure 150.00 – 150.00 – – – – 150.00 1,184.54
National Highway 1 Panipat–Jalandhar
Toll Road 100.00 – 100.00 140.00 – – – 240.00 1,067.00
Rural Electrification Corporation of India 225.00 – 225.00 – – – – 225.00 225.00
Indonesia
Bank Mandiri (Persero) 75.00 – 75.00 225.00 – – – 300.00 300.00
Maldives
Housing Development Finance Corporation 7.50 4.50 12.00 – – – – 12.00 33.00
Philippines
Acquisition and Rehabilitation of the
Masinloc Coal-Fired Power Project 200.00 – 200.00 – – – – 200.00 1,100.00
Privatization and Refurbishment of theCalaca Coal-Fired Thermal Power Plant 120.00 – 120.00 – – – – 120.00 890.00
Viet Nam
Saigon Thuong Tin Bank (Sacombank) 25.00 – 25.00 – – – – 25.00 25.00
Regional
Asian Clean Energy Private Equity Funds – 100.00 100.00 – – – – 100.00 1,100.00
TOTAL 1,780.23 123.08 1,903.31 565.00 – 10.00 – 2,478.30 12,104.05
– = nil, DMC = developing member country.a Includes projects processed by the Private Sector Operations Department and regional departments of ADB.b This project is composed of two loans: (i) Gujarat Paguthan Wind Energy Financing Facility (Samana Phase I - loan amount: $45.0 million; and (ii) CPL Wind Farms
Private Limited (Samana Phase II and the Saundatti Project) - loan amount: $60.0 million.

7/30/2019 ADB Annual Report 2008 - Financial Report
http://slidepdf.com/reader/full/adb-annual-report-2008-financial-report 178/218
S T A T I S T I C
A L A N N E X E S
Asian Development Bank176
Statistical Annex 11
NONSOVEREIGN APPROVALS AND TOTAL PROJECT COSTS BY SECTOR, a 2008
($ million)
Total Complementary Partial Political Swap Total TotalEquity ADB Loan Credit Risk with ADB Project
Sector Loan Investment Funds (B-Loan) Guarantee Guarantee DMCs Approvals Cost
Infrastructure 1,634.08 100.00 1,734.08 340.00 – 10.00 – 2,084.08 11,563.63
Investment Funds andFinancial Institutions 107.50 23.08 130.58 225.00 – – – 355.58 385.87
Health 38.64 – 38.64 – – – – 38.64 154.55
TOTALb 1,780.23 123.08 1,903.31 565.00 – 10.00 – 2,478.30 12,104.05
– = nil, DMC = developing member country.a Includes projects processed by the Private Sector Operations Department and regional departments of ADB.b Totals may not add up because of rounding.
Statistical Annex 12
NONSOVEREIGN APPROVALS BY YEAR,a, b 1983–2008
(amounts in $ million)
Total Complementary Partial Political Swap Total TotalNo. of Equity ADB Loan Credit Risk with ADB Project
Year Projects Loan Investmentc Funds (B-Loan) Guarantee Guarantee DMCs Approvals Cost
1983 2 – 2.96 2.96 – – – – 2.96 36.00
1984 1 – 0.42 0.42 – – – – 0.42 2.80
1985 3 – 3.40 3.40 – – – – 3.40 26.50
1986 4 6.46 6.01 12.47 – – – – 12.47 20.32
1987 7 20.50 27.61 48.11 5.00 – – – 53.11 519.24
1988 12 58.00 35.67 93.67 – – – – 93.67 502.32
1989 16 95.70 67.59 163.29 51.10 – – – 214.39 1,038.66
1990 17 78.85 35.94 114.79 24.00 – – – 138.79 2,026.13
1991 10 156.80 20.52 177.32 – – – – 177.32 1,325.18
1992 4 50.00 5.42 55.42 81.50 – – – 136.92 402.29
1993 9 182.10 20.70 202.80 19.30 – – – 222.10 1,505.701994 9 – 48.70 48.70 – – – – 48.70 919.20
1995 8 68.00 99.41 167.41 5.83 – – – 173.24 1,050.32
1996 7 98.50 80.15 178.65 91.50 – – – 270.15 1,788.77
1997 6 45.00 49.50 94.50 – 50.00 – – 144.50 1,239.69
1998 6 136.12 39.44 175.56 151.08 65.00 – – 391.64 1,152.70
1999 3 101.50 7.40 108.90 61.50 – – – 170.40 847.70
2000 9 152.00 77.65 229.65 45.00 – 122.00 – 396.65 1,629.84
2001 6 37.50 30.36 67.86 – – – – 67.86 648.00
2002 6 110.00 25.53 135.53 – – 60.00 – 195.53 1,136.60
2003 7 167.00 35.65 202.65 170.00 170.00 – – 542.65 2,300.00
2004 14 92.50 164.37 256.87 – – 10.00 – 266.87 2,227.70
2005 13 513.02 176.50 689.52 – 18.40 50.00 – 757.92 8,676.42
2006 18 450.00 230.50 680.50 330.00 109.80 15.00 – 1,135.30 7,678.34
2007 23 725.27 79.75 805.02 200.00 376.00 – – 1,381.02 3,644.542008 16 1,780.23 123.08 1,903.31 565.00 – 10.00 – 2,478.31 12,104.05
TOTAL 236 5,125.05 1,494.23 6,619.28 1,800.81 789.20 267.00 – 9,476.29 54,449.01
– = nil, DMC = developing member country.a Includes nonsovereign projects processed by the Private Sector Operations Department and regional departments of ADB. Regional departments started nonsovereign
operations in 2007.b Net of facilities canceled in full before signing.c Includes equity investments, lines of equity, and equity underwriting.

7/30/2019 ADB Annual Report 2008 - Financial Report
http://slidepdf.com/reader/full/adb-annual-report-2008-financial-report 179/218
177 Annual Report 2008
Statistical Annex 13
NONSOVEREIGN APPROVALS BY COUNTRY,a, b 1983–2008
(amounts in $ million)
Total Complementary Partial Political Swap Total TotalNo. of Equity ADB Loan Credit Risk with ADB Project
Projects Loan Investmentc Funds (B-Loan) Guarantee Guarantee DMCs Approvals Cost
Afghanistan 6 135.00 8.10 143.10 30.00 – 35.00 – 208.10 650.70
Azerbaijan 4 66.00 – 66.00 – – – – 66.00 66.00
Bangladesh 8 137.20 14.98 152.18 20.00 – 70.00 – 242.18 890.36
Bhutan 1 – 0.53 0.53 – – – – 0.53 0.79
Cambodia 1 8.00 – 8.00 – – – – 8.00 32.00
China, People’s
Republic of 21 571.30 369.30 940.60 646.50 107.00 – – 1,694.10 6,519.28
Georgia 1 25.00 – 25.00 – – – – 25.00 125.00
India 37 1,660.61 237.31 1,897.92 370.00 – – – 2,267.92 15,690.85
Indonesia 15 557.00 23.85 580.85 288.50 9.80 – – 879.15 7,472.02
Kazakhstan 5 225.00 – 225.00 – 325.00 – – 550.00 1,050.00
Korea, Republic of 3 – 8.96 8.96 – – – – 8.96 288.00
Lao People’s
Democratic Republic 1 50.00 – 50.00 – – 50.00 – 100.00 1,450.00
Malaysia 2 10.00 2.00 12.00 – – – – 12.00 29.24
Maldives 2 12.00 4.50 16.50 – – – – 16.50 37.50
Mongolia 2 14.50 1.60 16.10 – – – – 16.10 50.00
Nepal 4 49.55 3.26 52.81 5.83 – – – 58.64 218.03
Pakistan 27 429.10 53.38 482.48 129.90 109.00 – – 721.38 2,997.01
Philippines 28 595.32 40.85 636.17 113.58 18.40 – – 768.15 4,688.72
Samoa 1 – 0.40 0.40 – – – – 0.40 1.60
Sri Lanka 13 99.50 13.58 113.08 – 115.00 52.00 – 280.08 543.48
Thailand 10 71.46 77.07 148.53 170.00 – – – 318.53 3,067.55
Viet Nam 8 218.50 – 218.50 26.50 – 60.00 – 305.00 1,520.00
Regional 36 190.00 634.57 824.57 – 105.00 – – 929.57 7,060.87
TOTAL 236 5,125.05 1,494.23 6,619.28 1,800.81 789.20 267.00 – 9,476.30 54,449.01
– = nil, DMC = developing member country.
a Includes nonsovereign projects processed by the Private Sector Operations Department and regional departments of ADB. Regional departments started nonsovereignoperations in 2007.b Net of facilities canceled in full before signing.c Includes equity investments, lines of equity, and equity underwriting.

7/30/2019 ADB Annual Report 2008 - Financial Report
http://slidepdf.com/reader/full/adb-annual-report-2008-financial-report 180/218
S T A T I S T I C
A L A N N E X E S
Asian Development Bank178
Statistical Annex 14
NUMBER OF LOANS AND PROJECTS APPROVED AND UNDER ADMINISTRATION, PROJECT COMPLETION
REPORTS (PCRs) CIRCULATED, PROJECTS COMPLETED, LOANS CLOSED, AND PROJECT/PROGRAM
PERFORMANCE EVALUATION REPORTS (PPERs) CIRCULATED
(as of 31 December 2008)
Cumulative Cumulative Cumulative Cumulative Cumulative CumulativeNo. of No. of No. of No. of No. of No. of
Loans Effective Projects Blended Supplementary CofinancedApproveda Loans Approvedb Loans Loans Projectsc
Afghanistan 23 22 21 1 1 5
Armenia 3 2 2 – 1 –
Azerbaijan 13 11 9 3 – –
Bangladesh 192 188 169 14 4 26
Bhutan 25 23 22 2 – 1
Cambodia 46 46 36 2 1 9
China, People’s Republic of 154 142 151 – – 21
Cook Islands 15 13 14 1 – –
Fiji Islands 16 16 16 – – 1
Georgia 3 3 3 – – –
Hong Kong, China 5 5 5 – – –
India 130 119 106 3 2 15
Indonesia 297 293 261 25 2 26Kazakhstan 17 15 12 2 – 3
Kiribati 6 6 6 – – –
Korea, Republic of 81 81 80 – – –
Kyrgyz Republic 26 26 20 – – 4
Lao People’s Democratic Republic 68 68 60 1 3 9
Malaysia 77 77 75 1 1 –
Maldives 19 17 19 – – 2
Marshall Islands 12 12 11 1 – –
Micronesia, Federated States of 8 8 6 1 – –
Mongolia 41 41 35 – – 2
Myanmar 32 32 28 2 2 6
Nauru 1 1 1 – – –
Nepal 116 116 104 2 9 20
Pakistan 284 272 214 45 5 38Papua New Guinea 63 61 48 12 2 8
Philippines 204 200 173 18 4 33
Samoa 33 31 28 – 4 3
Singapore 14 14 14 – – –
Solomon Islands 16 16 15 – – 3
Sri Lanka 143 141 121 11 7 26
Taipei,China 12 12 12 – – –
Tajikistan 23 22 17 3 – 5
Thailand 84 84 80 2 2 7
Timor-Leste – – – – – –
Tonga 15 14 15 – – 1
Turkmenistan – – – – – –
Tuvalu 3 3 2 – 1 –
Uzbekistan 29 25 24 4 – 4
Vanuatu 9 9 8 – 1 –Viet Nam 98 86 84 4 1 15
Regional 7 6 20f 1 – 1
TOTAL 2,463 2,379 2,147 161 53 294
– = 0.a Includes nonsovereign loans but excludes terminated loans.b A project with multiple loans is counted as one project. Supplementary loans, special implementation assistance loans, and subprogram loans of program loan
clusters are not counted as separate projects.c These are non-ADB funds generated by ADB’s financing partnership operations including loans, credit enhancements, and grants, fully or partially administered by
ADB, and/or cofinanced under cooperation/sector-wide approach arrangements.d Includes projects/loans which have been approved but awaiting effectivity, inactive loans, fully disbursed nonsovereign loans, but still under administration; excludes
projects/loans exclusively financed from other sources.
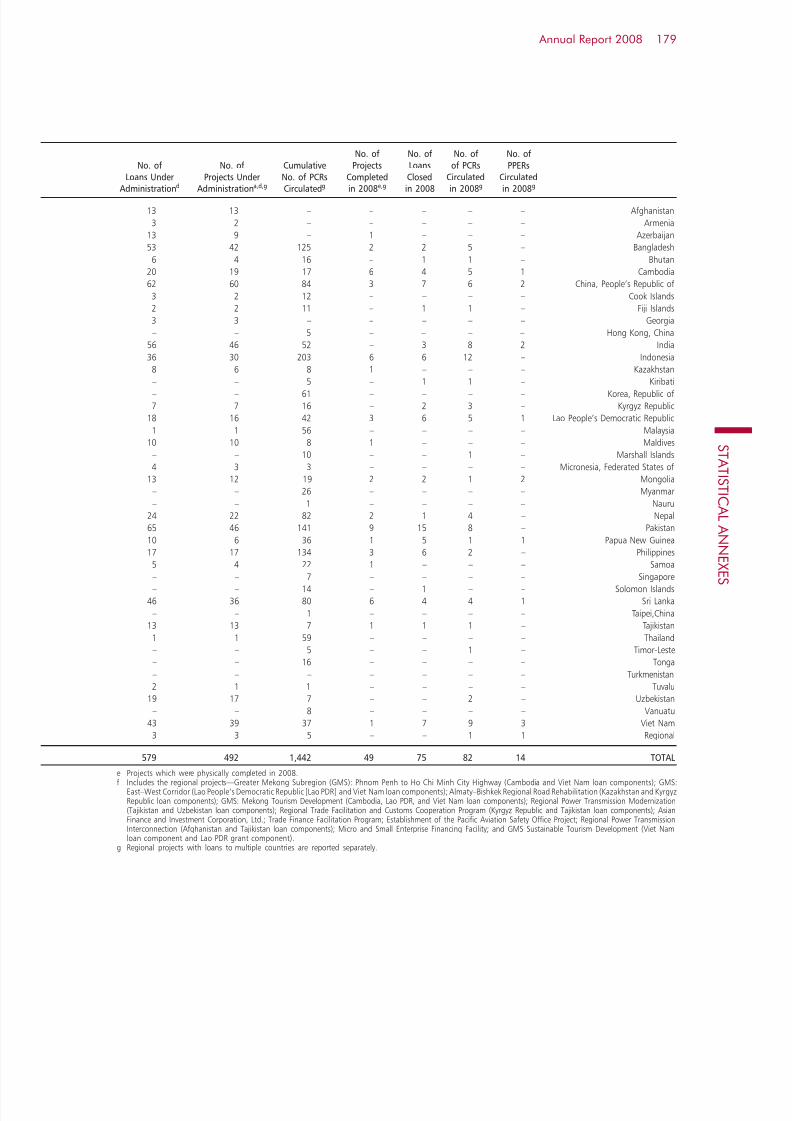
7/30/2019 ADB Annual Report 2008 - Financial Report
http://slidepdf.com/reader/full/adb-annual-report-2008-financial-report 181/218
179 Annual Report 2008
No. of No. of No. of No. ofNo. of No. of Cumulative Projects Loans of PCRs PPERs
Loans Under Projects Under No. of PCRs Completed Closed Circulated CirculatedAdministrationd Administrationa,d,g Circulatedg in 2008e,g in 2008 in 2008g in 2008g
13 13 – – – – – Afghanistan
3 2 – – – – – Armenia
13 9 – 1 – – – Azerbaijan
53 42 125 2 2 5 – Bangladesh
6 4 16 – 1 1 – Bhutan
20 19 17 6 4 5 1 Cambodia
62 60 84 3 7 6 2 China, People’s Republic of
3 2 12 – – – – Cook Islands
2 2 11 – 1 1 – Fiji Islands
3 3 – – – – – Georgia
– – 5 – – – – Hong Kong, China
56 46 52 – 3 8 2 India
36 30 203 6 6 12 – Indonesia8 6 8 1 – – – Kazakhstan
– – 5 – 1 1 – Kiribati
– – 61 – – – – Korea, Republic of
7 7 16 – 2 3 – Kyrgyz Republic
18 16 42 3 6 5 1 Lao People’s Democratic Republic
1 1 56 – – – – Malaysia
10 10 8 1 – – – Maldives
– – 10 – – 1 – Marshall Islands
4 3 3 – – – – Micronesia, Federated States of
13 12 19 2 2 1 2 Mongolia
– – 26 – – – – Myanmar
– – 1 – – – – Nauru
24 22 82 2 1 4 – Nepal
65 46 141 9 15 8 – Pakistan10 6 36 1 5 1 1 Papua New Guinea
17 17 134 3 6 2 – Philippines
5 4 22 1 – – – Samoa
– – 7 – – – – Singapore
– – 14 – 1 – – Solomon Islands
46 36 80 6 4 4 1 Sri Lanka
– – 1 – – – – Taipei,China
13 13 7 1 1 1 – Tajikistan
1 1 59 – – – – Thailand
– – 5 – – 1 – Timor-Leste
– – 16 – – – – Tonga
– – – – – – – Turkmenistan
2 1 1 – – – – Tuvalu
19 17 7 – – 2 – Uzbekistan
– – 8 – – – – Vanuatu43 39 37 1 7 9 3 Viet Nam
3 3 5 – – 1 1 Regional
579 492 1,442 49 75 82 14 TOTAL
e Projects which were physically completed in 2008.f Includes the regional projects—Greater Mekong Subregion (GMS): Phnom Penh to Ho Chi Minh City Highway (Cambodia and Viet Nam loan components); GMS:
East–West Corridor (Lao People’s Democratic Republic [Lao PDR] and Viet Nam loan components); Almaty–Bishkek Regional Road Rehabilitation (Kazakhstan and KyrgyzRepublic loan components); GMS: Mekong Tourism Development (Cambodia, Lao PDR, and Viet Nam loan components); Regional Power Transmission Modernization(Tajikistan and Uzbekistan loan components); Regional Trade Facilitation and Customs Cooperation Program (Kyrgyz Republic and Tajikistan loan components); AsianFinance and Investment Corporation, Ltd.; Trade Finance Facilitation Program; Establishment of the Pacific Aviation Safety Office Project; Regional Power TransmissionInterconnection (Afghanistan and Tajikistan loan components); Micro and Small Enterprise Financing Facility; and GMS Sustainable Tourism Development (Viet Namloan component and Lao PDR grant component).
g Regional projects with loans to multiple countries are reported separately.

7/30/2019 ADB Annual Report 2008 - Financial Report
http://slidepdf.com/reader/full/adb-annual-report-2008-financial-report 182/218
S T A T I S T I C
A L A N N E X E S
Asian Development Bank180
Statistical Annex 15
AMOUNT OF LOANS APPROVED, CONTRACTS AWARDED, AND DISBURSEMENTS
($ million; as of 31 December 2008)
CumulativeCumulative Loans Cumulative Net Contracts Contracts
Approveda Effective Loansb, c Awarded in 2008c, d, e Awardedc, d, e
Afghanistan 952.28 925.19 53.21 608.84
Armenia 83.92 67.37 22.90 22.90
Azerbaijan 585.40 373.00 31.80 85.35
Bangladesh 9,857.49 8,833.74 506.21 6,811.09
Bhutan 256.06 173.44 18.78 135.87
Cambodia 1,001.14 1,005.91 109.59 857.67
China, People’s Republic of 21,004.18 17,960.92 1,312.17 14,069.07
Cook Islands 45.01 27.99 – 30.18
Fiji Islands 249.90 217.09 6.18 193.63
Georgia 135.00 133.00 69.86 69.86
Hong Kong, China 101.50 94.50 – 94.50
India 20,586.50 16,548.83 1,006.44 13,231.83
Indonesia 23,523.30 19,418.06 1,031.96 17,029.71
Kazakhstan 1,066.60 646.52 10.56 449.40Kiribati 15.14 13.70 0.07 14.49
Korea, Republic of 6,338.33 5,560.33 – 5,572.55
Kyrgyz Republic 603.50 605.51 9.57 546.20
Lao People’s Democratic Republic 1,211.34 1,216.76 30.85 1,103.55
Malaysia 1,997.54 1,413.98 – 1,422.40
Maldives 116.31 106.04 4.46 78.74
Marshall Islands 78.13 64.15 – 65.12
Micronesia, Federated States of 75.14 70.15 1.56 48.71
Mongolia 676.54 671.49 18.86 576.46
Myanmar 530.86 411.83 – 418.77
Nauru 5.00 2.30 – 2.30
Nepal 2,300.98 2,032.93 64.61 1,717.87
Pakistan 19,761.84 17,057.83 1,804.11 14,137.67
Papua New Guinea 1,126.99 892.88 16.36 725.78
Philippines 10,772.83 8,597.89 627.95 7,650.91
Samoa 159.37 149.93 9.58 119.51
Singapore 181.08 144.44 – 130.22
Solomon Islands 79.31 65.82 0.02 65.39
Sri Lanka 4,355.53 4,141.72 605.84 3,553.77
Taipei,China 100.39 91.14 – 90.28
Tajikistan 372.54 369.70 67.09 292.69
Thailand 5,388.07 4,207.65 – 4,158.08
Tonga 57.79 52.26 – 58.18
Tuvalu 7.82 8.15 0.04 7.67
Uzbekistan 1,230.90 948.27 58.63 548.57
Vanuatu 51.25 48.99 – 47.91
Viet Nam 6,294.12 4,219.83 372.58 2,677.82
Regionalg 191.50 174.61 0.67 1.28
TOTALh 143,528.39 119,765.84 7,872.48 99,522.80
– = nil or data not applicable.a Data include nonsovereign loans but exclude terminated loans. The US dollar equivalent is in accordance with the exchange rate prevailing within ADB at the time
of loan approval.b Net refers to effective loan amounts less cancellat ions.c The US dollar equivalent is in accordance with the exchange rate prevailing in ADB on 31 December 2008.d Data exclude nonsovereign loans.e Contracts awarded for development finance institutions/credit loans are based on the amount of subloan disbursements.

7/30/2019 ADB Annual Report 2008 - Financial Report
http://slidepdf.com/reader/full/adb-annual-report-2008-financial-report 183/218
181 Annual Report 2008
% of Cumulative % of CumulativeContracts Awarded Disbursementsto Cumulative Net Disbursements Cumulative to Cumulative Net
Effective Loansc in 2008 Disbursementsf Effective Loans
65.81 80.54 559.50 60.47 Afghanistan
33.99 8.03 8.03 11.92 Armenia
22.88 20.76 87.88 23.56 Azerbaijan
77.10 615.64 6,856.05 77.61 Bangladesh
78.34 4.27 116.59 67.22 Bhutan
85.26 113.45 789.34 78.47 Cambodia
78.33 1,292.81 13,437.54 74.82 China, People’s Republic of
107.81 1.34 27.91 99.69 Cook Islands
89.19 9.67 192.53 88.69 Fiji Islands
52.52 69.86 94.86 71.32 Georgia
100.00 – 94.50 100.00 Hong Kong, China
79.96 1,655.63 12,005.42 72.55 India
87.70 1,003.15 18,400.99 94.76 Indonesia
69.51 8.31 619.04 95.75 Kazakhstan105.74 – 13.70 100.00 Kiribati
100.22 – 5,560.32 100.00 Korea, Republic of
90.20 27.11 552.15 91.19 Kyrgyz Republic
90.70 52.51 1,134.33 93.23 Lao People’s Democratic Republic
100.60 – 1,413.98 100.00 Malaysia
74.25 2.72 71.49 67.41 Maldives
101.51 – 64.15 100.00 Marshall Islands
69.44 3.56 46.35 66.07 Micronesia, Federated States of
85.85 34.68 579.47 86.30 Mongolia
101.68 – 411.83 100.00 Myanmar
100.00 – 2.30 100.00 Nauru
84.50 61.66 1,703.70 83.80 Nepal
82.88 1,923.34 14,234.56 83.45 Pakistan
81.28 19.88 710.59 79.58 Papua New Guinea
88.99 853.17 8,389.48 97.58 Philippines
79.71 2.63 108.29 72.22 Samoa
90.15 – 144.44 100.00 Singapore
99.35 0.07 65.82 100.00 Solomon Islands
85.80 259.54 3,161.71 76.34 Sri Lanka
99.06 – 91.14 100.00 Taipei,China
79.17 50.01 223.10 60.35 Tajikistan
98.82 – 4,207.65 100.00 Thailand
111.32 – 52.26 100.00 Tonga
94.12 0.60 7.16 87.86 Tuvalu
57.85 48.97 534.00 56.31 Uzbekistan
97.80 – 48.99 100.00 Vanuatu
63.46 264.56 2,633.66 62.41 Viet Nam
0.73 26.55 162.84 93.26 Regional
83.10 8,515.02 99,619.63 83.18 TOTAL
f The cumulative disbursements may exceed the cumulative contracts awarded due to disbursed amount without procurement contract summary sheet, e.g., interestduring construction, contingencies, and nonsovereign loans which do not require procurement.
g Data include regional loan on Establishment of the Pacific Aviation Safety Office and private sector loans to Asian Finance and Investment Corporation Ltd., TradeFinance Facilitation Program, and Micro and Small Enterprise Financing Facility.
h Totals may not add up because of rounding.

7/30/2019 ADB Annual Report 2008 - Financial Report
http://slidepdf.com/reader/full/adb-annual-report-2008-financial-report 184/218
Asian Development Bank182
S T A T I S T I C
A L A N N E X E S
Statistical Annex 16
TECHNICAL ASSISTANCE GRANT APPROVALS BY COUNTRY AND REGIONAL ACTIVITIES,a, b 1967–2008, 2007, 2008
(amounts in $ thousand)
1 9 6 7 – 2 0 0 8 2 0 0 7
TASF JSF PEF RCIF Other
No. Amount % No. Financing Financing Financing Financing Sources Total %
Afghanistan 60 65,647.70 1.85 2 2,800.00 – – – 1,700.00 4,500.00 1.78
Armenia 5 2,200.00 0.06 3 900.00 – – – – 900.00 0.36Azerbaijan 22 12,122.00 0.34 – – – – – – – –Bangladesh 331 183,156.17 5.17 8 4,867.85 1,825.00 – – 1,000.00 7,692.85 3.04
Bhutan 105 42,443.15 1.20 4 1,080.00 1,600.00 – – – 2,680.00 1.06Brunei Darussalam 1 600.00c 0.02 – – – – – – – –Cambodia 151 99,384.60 2.80 5 1,259.00 475.00 – – 1,250.00 2,984.00 1.18China, People’s
Republic of 563 310,321.65 8.75 33 17,314.00 – – – 3,168.00 20,482.00 8.10
Cook Islands 29 9,995.00 0.28 1 – 500.00 – – 200.00 700.00 0.28Fiji Islands 80 27,349.80 0.77 1 250.00 – – – – 250.00 0.10Georgia 2 720.00 0.02 1 120.00 – – – – 120.00 0.05
India 254 181,634.86 5.12 11 3,500.00 6,800.00 – – 500.00 10,800.00 4.27Indonesia 498 276,609.17d 7.80 9 14,510.00d 900.00 – – 750.00 16,160.00 6.39Kazakhstan 58 26,177.00 0.74 1 60.00 – – – – 60.00 0.02Kiribati 36 12,840.70 0.36 – – – – – – – –
Korea, Republic of 33 5,010.15 0.14 – – – – – – – –Kyrgyz Republic 71 40,951.40 1.15 3 1,200.00 – – – 500.00 1,700.00 0.67Lao People’s
Democratic Republic 234 118,107.08 3.33 5 1,350.00 2,293.00 – – 500 .00 4,143.00 1.64
Malaysia 93 25,352.30 0.71 – – – – – – – –Maldives 56 19,525.00 0.55 – – – – – – – –Marshall Islands 46 18,757.00 0.53 – – – – – – – –
Micronesia, FederatedStates of 42 24,428.00 0.69 1 – 400.00 – – – 400.00 0.16
Mongolia 134 69,370.65 1.96 3 450.00 2,100.00 – – – 2,550.00 1.01Myanmar 38 10,716.00 0.30 – – – – – – – –
Nauru 7 1,946.81 0.05 – – – – – – – –Nepal 279 132,139.70 3.73 10 4,850.00 1,950.00 – 300.00 120.00 7,220.00 2.86Pakistan 325 187,931.13 5.30 10 5,733.00 1,000.00 2,000.00 – 11,500.00 20,233.00 8.00
Palau, Republic of 3 2,100.00 0.06 2 – 1,700.00 – – – 1,700.00 0.67
Papua New Guinea 137 54,651.12 1.54 5 160.00 1,500.00 – – 213.52 1,873.52 0.74Philippines 334 158,264.25 4.46 4 1,300.00 1,350.00 – – – 2,650.00 1.05Samoa 85 27,081.50 0.76 3 105.00 1,100.00 – – 1,250.00 2,455.00 0.97
Singapore 2 577.42 0.02 – – – – – – – –Solomon Islands 59 18,245.24 0.51 2 800.00 2,000.00 – – – 2,800.00 1.11Sri Lanka 229 96,398.10 2.72 1 – – – – 600.00 600.00 0.24
Taipei,China 1 100.00 0.003 – – – – – – – –Tajikistan 58 33,886.06 0.96 5 1,661.06 600.00 – – 1,000.00 3,261.06 1.29Thailand 159 60,299.60 1.70 2 300.00 700.00 – – – 1,000.00 0.40
Timor-Leste 30 28,550.90 0.81 1 3,000.00 – – – 12,000.00 15,000.00 5.93Tonga 55 16,051.50 0.45 – – – – – – – –Turkmenistan 4 715.00 0.02 1 150.00 – – – – 150.00 0.06Tuvalu 20 5,914.75 0.17 – – – – – – – –
Uzbekistan 71 37,080.00 1.05 2 1,400.00 – – – – 1,400.00 0.55Vanuatu 55 16,364.76 0.46 1 – 600.00 – – – 600.00 0.24Viet Nam 235 177,804.46 5.01 20 3,295.00 6,745.00 – – 3,085.00 13,125.00 5.19
All DMCs 5,090 2,639,521.68 74.44 160 72,414.90 36,138.00 2,000.00 300.00 39,336.52 150,189.43 59.40Regional 1,509 906,254.61 25.56 82 38,277.25 6,950.00 – 7,100.00 50,325.70 102,652.95 40.60
TOTAL 6,599 3,545,776.29 100.00 242 110,692.15 43,088.00 2,000.00 7,400.00 89,662.22 252,842.38 100.00
– = nil or data not applicable, CCF = Climate Change Fund, DMC = developing member country, JSF = Japan Special Fund, PEF = Pakistan Earthquake Fund,RCIF = Regional Cooperation and Integration Fund, TASF = Technical Assistance Special Fund.a Excludes technical assistance financed under loans that are included in ADB’s loan data.b Data are adjusted to exclude technical assistance projects withdrawn by governments.c Reimbursable technical assistance.d Includes $10 million from ordinary capital resources as a contribution to the Java Reconstruction Fund.

7/30/2019 ADB Annual Report 2008 - Financial Report
http://slidepdf.com/reader/full/adb-annual-report-2008-financial-report 185/218
183 Annual Report 2008
2008
TASF JSF RCIF CCF OtherNo. Financing Financing Financing Financing Sources Total %
3 1,155.00 1,800.00 – – – 2,955.00 1.08 Afghanistan
1 1,000.00 – – – – 1,000.00 0.36 Armenia2 1,150.00 – – – – 1,150.00 0.42 Azerbaijan8 2,925.00 990.00 – 600.00 – 4,515.00 1.64 Bangladesh
3 950.00 650.00 888.00 – – 2,488.00 0.91 Bhutan1 – – – – 600.00 c 600.00 0.22 Brunei Darussalam8 3,221.00 1,800.00 – – – 5,021.00 1.83 Cambodia
China, People’s31 15,900.00 – – 1,400.00 2,150.00 19,450.00 7.09 Republic of
2 350.00 – – – – 350.00 0.13 Cook Islands2 125.00 – – – – 125.00 0.05 Fiji Islands1 600.00 – – – – 600.00 0.22 Georgia
25 14,165.00 9,800.00 – – 3,450.00 27,415.00 9.99 India8 3,950.00 1,300.00 – – 7,700.00 12,950.00 4.72 Indonesia1 300.00 – – – – 300.00 0.11 Kazakhstan1 – 800.00 – – – 800.00 0.29 Kiribati
– – – – – – – – Korea, Republic of3 1,250.00 – – – – 1,250.00 0.46 Kyrgyz Republic
Lao People’s9 3,545.00 600.00 – – 977.00 5,122.00 1.87 Democratic Republic
– – – – – – – – Malaysia– – – – – – – – Maldives– – – – – – – – Marshall Islands
Micronesia, Federated1 – 750.00 – – – 750.00 0.27 States of6 1,300.00 3,200.00 – – 1,000.00 5,500.00 2.00 Mongolia– – – – – – – – Myanmar
1 225.00 – – – – 225.00 0.08 Nauru10 2,600.00 1,300.00 – – 646.00 4,546.00 1.66 Nepal10 6,202.00 1,600.00 – – 80.00 7,882.00 2.87 Pakistan
1 – 400.00 – – – 400.00 0.15 Palau, Republic of
4 225.00 2,800.00 – – – 3,025.00 1.10 Papua New Guinea11 3,850.00 3,160.00 – – 2,400.00 9,410.00 3.43 Philippines
1 – 1,200.00 – – – 1,200.00 0.44 Samoa
– – – – – – – – Singapore1 1,000.00 – – – 600.00 1,600.00 0.58 Solomon Islands6 1,550.00 300.00 – – 50.00 1,900.00 0.69 Sri Lanka
– – – – – – – – Taipei,China2 240.00 – 650.00 – – 890.00 0.32 Tajikistan4 1,270.00 – – – 1,500.00 2,770.00 1.01 Thailand
2 – 1,300.00 – – – 1,300.00 0.47 Timor-Leste1 – 700.00 – – – 700.00 0.26 Tonga– – – – – – – – Turkmenistan2 800.00 – – – 327.75 1,127.75 0.41 Tuvalu
3 350.00 1,200.00 – – – 1,550.00 0.56 Uzbekistan– – – – – – – – Vanuatu
22 6,465.00 5,600.00 – – 14,790.00 26,855.00 9.78 Viet Nam
197 76,663.00 41,250.00 1,538.00 2,000.00 36,270.75 157,721.75 57.46 All DMCs102 42,641.97 13,700.00 8,920.00 3,000.00 48,517.63 116,779.60 42.54 Regional
299 119,304.97 54,950.00 10,458.00 5,000.00 84,788.38 274,501.35 100.00 TOTAL
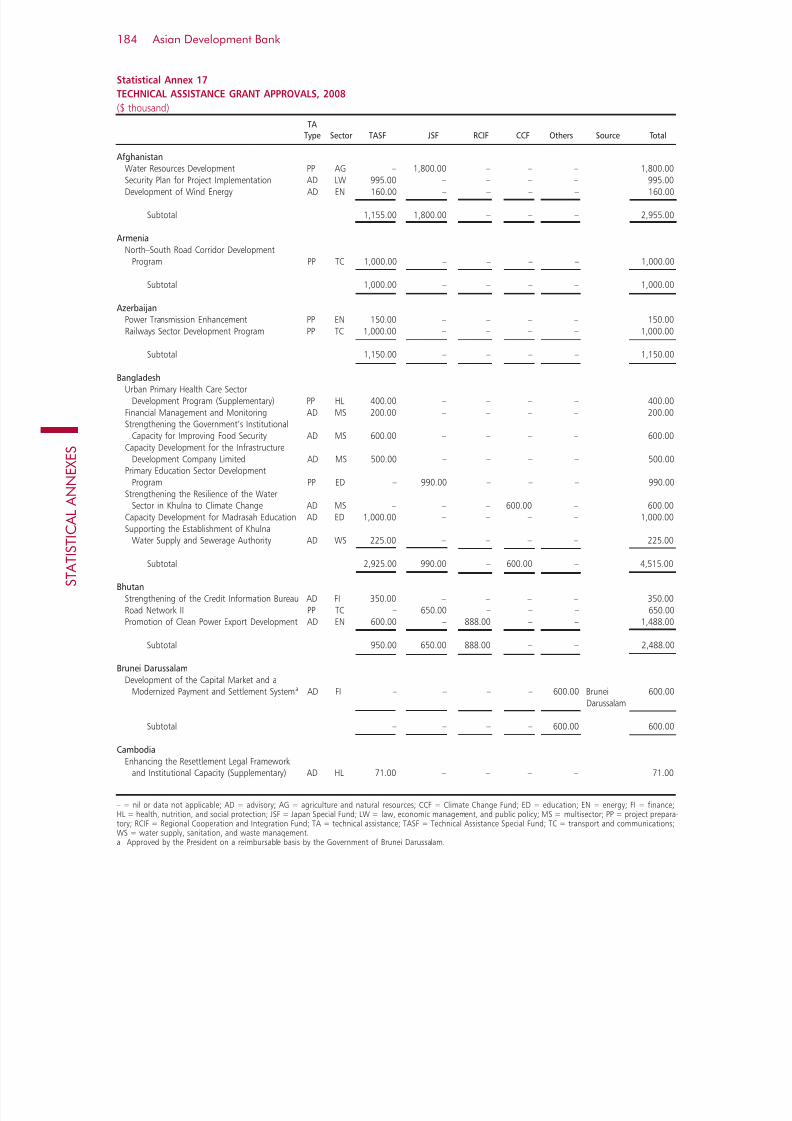
7/30/2019 ADB Annual Report 2008 - Financial Report
http://slidepdf.com/reader/full/adb-annual-report-2008-financial-report 186/218
Asian Development Bank184
S T A T I S T I C
A L A N N E X E S
Statistical Annex 17
TECHNICAL ASSISTANCE GRANT APPROVALS, 2008
($ thousand)
TA
Type Sector TASF JSF RCIF CCF Others Source Total
Afghanistan Water Resources Development PP AG – 1,800.00 – – – 1,800.00
Security Plan for Project Implementation AD LW 995.00 – – – – 995.00Development of Wind Energy AD EN 160.00 – – – – 160.00
Subtotal 1,155.00 1,800.00 – – – 2,955.00
Armenia North–South Road Corridor Development
Program PP TC 1,000.00 – – – – 1,000.00
Subtotal 1,000.00 – – – – 1,000.00
Azerbaijan Power Transmission Enhancement PP EN 150.00 – – – – 150.00Railways Sector Development Program PP TC 1,000.00 – – – – 1,000.00
Subtotal 1,150.00 – – – – 1,150.00
Bangladesh Urban Primary Health Care Sector
Development Program (Supplementary) PP HL 400.00 – – – – 400.00Financial Management and Monitoring AD MS 200.00 – – – – 200.00Strengthening the Government’s Institutional
Capacity for Improving Food Security AD MS 600.00 – – – – 600.00Capacity Development for the Infrastructure
Development Company Limited AD MS 500.00 – – – – 500.00Primary Education Sector Development
Program PP ED – 990.00 – – – 990.00Strengthening the Resilience of the Water
Sector in Khulna to Climate Change AD MS – – – 600.00 – 600.00Capacity Development for Madrasah Education AD ED 1,000.00 – – – – 1,000.00
Supporting the Establishment of KhulnaWater Supply and Sewerage Authority AD WS 225.00 – – – – 225.00
Subtotal 2,925.00 990.00 – 600.00 – 4,515.00
Bhutan Strengthening of the Credit Information Bureau AD FI 350.00 – – – – 350.00Road Network II PP TC – 650.00 – – – 650.00Promotion of Clean Power Export Development AD EN 600.00 – 888.00 – – 1,488.00
Subtotal 950.00 650.00 888.00 – – 2,488.00
Brunei Darussalam Development of the Capital Market and a
Modernized Payment and Settlement Systema AD FI – – – – 600.00 Brunei 600.00Darussalam
Subtotal – – – – 600.00 600.00
Cambodia Enhancing the Resettlement Legal Framework
and Institutional Capacity (Supplementary) AD HL 71.00 – – – – 71.00
– = nil or data not applicable; AD = advisory; AG = agriculture and natural resources; CCF = Climate Change Fund; ED = education; EN = energy; FI = finance;HL = health, nutrition, and social protection; JSF = Japan Special Fund; LW = law, economic management, and public policy; MS = multisector; PP = project prepara-tory; RCIF = Regional Cooperation and Integration Fund; TA = technical assistance; TASF = Technical Assistance Special Fund; TC = transport and communications;WS = water supply, sanitation, and waste management.a Approved by the President on a reimbursable basis by the Government of Brunei Darussalam.

7/30/2019 ADB Annual Report 2008 - Financial Report
http://slidepdf.com/reader/full/adb-annual-report-2008-financial-report 187/218
185 Annual Report 2008
CONTINUED
TA
Type Sector TASF JSF RCIF CCF Others Source Total
Private Sector and Small and Medium-SizedEnterprise Development Program PP LW 550.00 – – – – 550.00
Second Rural Water Supply and SanitationSector PP WS – 500.00 – – – 500.00Strengthening Technical and Vocational
Education and Training PP ED – 800.00 – – – 800.00Strengthening Institutional Capacity for
Emergency Response to Food Crisis andImproving Food Security AD AG 1,500.00 – – – – 1,500.00
Implementation of Key Policy Triggers ofSubprogram 3 AD FI 300.00 – – – – 300.00
Enhancing Private Sector Competitiveness AD LW 800.00 – – – – 800.00Provincial/Rural Road Asset Management PP TC – 500.00 – – – 500.00
Subtotal 3,221.00 1,800.00 – – – 5,021.00
China, People’s Republic of Western Yunnan Roads Development II
(Supplementary) PP TC 100.00 – – – – 100.00Lanzhou Sustainable Urban Transport
(Supplementary) PP TC 150.00 – – – – 150.00Asset-Backed Securitization for Expressway
Financing and Corporate Debt Restructuringin Yunnan Province AD FI 150.00 – – – – 150.00
Providing Emergency Response to SichuanEarthquake AD MS 1,000.00 – – – – 1,000.00
Urban Wastewater Reuse and SludgeUtilization Policy Study AD WS 700.00 – – – 300.00 MDTF-WFPF 1,000.00
People’s Republic of China: Supporting FiscalReforms in High Priority Sectors AD LW 1,000.00 – – – – 1,000.00
Qinghai Rural Water Resources Management PP AG 700.00 – – – – 700.00Chongqing Urban–Rural Infrastructure
Development Demonstration PP MS 900.00 – – – – 900.00
Strengthening the Capacity of the Judiciaryto Implement Economic Laws AD LW 400.00 – – – – 400.00
Heilongjiang Road Development II(Yichun to Nenjiang) PP TC 600.00 – – – – 600.00
Anhui Road Network Development PP TC 600.00 – – – – 600.00River Basin Water Resources Allocation and
Management Policy AD AG 500.00 – – – 250.00 MDTF-WFPF 750.00Capacity Strengthening in Planning and
Implementation of Integrated GasificationCombined Cycle Plan AD EN 200.00 – – – – 200.00
Enhancing the Competitiveness and Efficiencyof Railway Passenger Operations AD TC 500.00 – – – – 500.00
New Models for Civil Society Participation inPoverty Reduction AD HL 400.00 – – – – 400.00
Guangxi Border Cities Development PP MS 800.00 – – – – 800.00
Improvement of Public Employment ServiceSystem in the Western Region AD HL 400.00 – – – – 400.00
Chongqing–Guiyang Railway Development PP TC 500.00 – – – – 500.00Provincial Development Strategies for Two
Northeastern Provinces AD MS 800.00 – – – – 800.00Railway Sector Energy Efficiency Strategy AD TC – – – – 800.00 CEF 800.00
– = nil or data not applicable; AD = advisory; AG = agriculture and natural resources; CCF = Climate Change Fund; CEF = Clean Energy Fund; ED = education; EN= energy; FI = finance; HL = health, nutrition, and social protection; JSF = Japan Special Fund; LW = law, economic management, and public policy; MDTF-WFPF =Multidonor Trust Fund under the Water Financing Partnership Facility; MS = multisector; PP = project preparatory; RCIF = Regional Cooperation and Integration Fund;TA = technical assistance; TASF = Technical Assistance Special Fund; TC = transport and communications; WS = water supply, sanitation, and waste management.

7/30/2019 ADB Annual Report 2008 - Financial Report
http://slidepdf.com/reader/full/adb-annual-report-2008-financial-report 188/218
Asian Development Bank186
S T A T I S T I C
A L A N N E X E S
CONTINUED
TA
Type Sector TASF JSF RCIF CCF Others Source Total
Transport Efficiency through LogisticsDevelopment Policy Study AD TC 500.00 – – – – 500.00
Rural Finance Development and Supervision AD FI 400.00 – – – – 400.00Wuhan Urban Environmental Improvement PP WS 700.00 – – – – 700.00Jiangxi Sustainable Forest Ecosystem
Development PP AG 700.00 – – – – 700.00Preparing National Guidelines for Eco-
Compensation in River Basins and aFramework for Soil Pollution Management AD AG 400.00 – – – 400.00 MDTF-WFPF 800.00
Design of the National Sulfur Dioxide EmissionTrading System AD EN 500.00 – – – – 500.00
Fiscal Policy Support for EconomicDevelopment in Henan AD LW 400.00 – – – – 400.00
Utilization of Foreign Capital to PromoteEnergy Conservation and Energy-EfficientPower Generation Scheduling AD EN 600.00 – – 900.00 – 1,500.00
China Clean Development Mechanism FundCapacity Development AD EN 300.00 – – 500.00 – 800.00
Promoting a More Inclusive and EffectiveDisaster Risk Management System AD MS 650.00 – – – – 650.00
Enabling the Protection of Jiaozhou BayWater Quality and Wetland Ecosystem AD MS 350.00 – – – 400.00 MDTF-WFPF 750.00
Subtotal 15,900.00 – – 1,400.00 2,150.00 19,450.00
Cook Islands Infrastructure Development (Supplementary) PP MS 125.00 – – – – 125.00Public Sector Review and Improvement AD LW 225.00 – – – – 225.00
Subtotal 350.00 – – – – 350.00
Fiji IslandsFourth Road Upgrading (Sector)
(Supplementary) PP TC 50.00 – – – – 50.00Preparing Economic Restructuring Program
Loan (Supplementary) PP LW 75.00 – – – – 75.00
Subtotal 125.00 – – – – 125.00
GeorgiaAjara Bypass Roads Development PP TC 600.00 – – – – 600.00
Subtotal 600.00 – – – – 600.00
India Chhattisgarh State Roads Sector Development
(Supplementary) PP TC 990.00 – – – – 990.00Mainstreaming Public–Private Partnerships at
State Level (Supplementary) AD LW 2,000.00 – – – – 2,000.00Capacity Development of the National Capital
Region Planning Board AD MS 2,000.00 – – – – 2,000.00Developing the Power System Master Plan
for Bihar AD EN 600.00 – – – – 600.00Knowledge Management for Enhanced
Operational Effectiveness AD MS 1,000.00 – – – – 1,000.00
– = nil or data not applicable; AD = advisory; AG = agriculture and natural resources; CCF = Climate Change Fund; EN = energy; FI = finance; JSF = Japan Special Fund;LW = law, economic management, and public policy; MDTF-WFPF = Multidonor Trust Fund under the Water Financing Partnership Facility; MS = multisector; PP = projectpreparatory; RCIF = Regional Cooperation and Integration Fund; TA = technical assistance; TASF = Technical Assistance Special Fund; TC = transport and communications;WS = water supply, sanitation, and waste management.

7/30/2019 ADB Annual Report 2008 - Financial Report
http://slidepdf.com/reader/full/adb-annual-report-2008-financial-report 189/218
187 Annual Report 2008
TA
Type Sector TASF JSF RCIF CCF Others Source Total
Energy Efficiency Enhancement Projectin Assam PP EN – 1,000.00 – – – 1,000.00
Integrated Renewable Energy Development PP EN 1,400.00 – – – – 1,400.00Bihar Urban Development PP WS – 1,000.00 – – – 1,000.00National Capital Region Planning Board PP MS – 700.00 – – – 700.00Integrated Flood and River Erosion
Management – Arunachal Pradesh PP AG 150.00 – – – 750.00 MDTF-WFPF 900.00Supporting the Assam Governance and Public
Resource Management Sector DevelopmentProgram (Subprogram II) AD LW – 600.00 – – – 600.00
Institutional Strengthening of the Bihar RoadSector AD TC 1,000.00 – – – – 1,000.00
Institutional Development of Integrated WaterResources Management in Orissa AD AG – – – – 250.00 MDTF-WFPF 250.00
Preparing and Enhancing Readiness ofProposed North Eastern State RoadsInvestment Program PP TC 800.00 – – – – 800.00
Integrated Flood and Riverbank Erosion Risk
Management – Assam (Phase 2): Processingand Institutional Strengthening PP AG 150.00 – – – 750.00 MDTF-WFPF 900.00
Capacity Building for Reforming the Khadiand Village Industry Subsector AD IN – 2,000.00 – – – 2,000.00
Promoting Inclusive Urban Development inIndian Cities AD MS 1,000.00 – – – – 1,000.00
Public–Private Partnerships Pilot ProjectsInitiative (Mainstreaming Public–PrivatePartnerships) PP MS – 2,000.00 – – – 2,000.00
Facilitating the Operations of the EnergyConservation Fund “Energy Smart” inMadhya Pradesh AD EN – – – – 1,700.00 DEN-E2 1,700.00
Capacity Building for Himachal PradeshPower Sector Agencies AD EN 900.00 – – – – 900.00
Capacity Development Programs for Executing
Agency Staff of India Projects AD MS 225.00 – – – – 225.00Agribusiness Infrastructure Development
Investment Program (Phase 2) PP AG 1,000.00 – – – – 1,000.00Bihar State Highways II PP TC 700.00 – – – – 700.00Dedicated Freight Corridor PP TC – 1,500.00 – – – 1,500.00Preparing Nonsovereign Urban Infrastructure
Projects PP MS 250.00 1,000.00 – – – 1,250.00
Subtotal 14,165.00 9,800.00 – – 3,450.00 27,415.00
Indonesia Integrated Citarum Water Resources
Management (Supplementary) PP AG – – – – 200.00 GEF 200.00Metropolitan Sanitation Management and
Health (Supplementary) PP WS – – – – 500.00 MDTF-WFPF 500.00
Enhance Continuing Skills Development AD ED 500.00 – – – – 500.00Regional Roads Development PP TC – 1,300.00 – – – 1,300.00Strengthening Environmental Practices for
Road Network Development in Kalimantan AD TC 150.00 – – – – 150.00Local Government Finance and Governance
Reform AD LW 1,500.00 – – – – 1,500.00
– = nil or data not applicable; AD = advisory; AG = agriculture and natural resources; CCF = Climate Change Fund; DEN-E2 = Second Danish Cooperation Fund forRenewable Energy and Energy Efficiency in Rural Areas; ED = education; EN = energy; GEF = Global Environment Facility; IN = industry and trade; JSF = Japan Special Fund;LW = law, economic management, and public policy; MDTF-WFPF = Multidonor Trust Fund under the Water Financing Partnership Facility; MS = multisector;PP = project preparatory; RCIF = Regional Cooperation and Integration Fund; TA = technical assistance; TASF = Technical Assistance Special Fund; TC = transportand communications; WS = water supply, sanitation, and waste management.

7/30/2019 ADB Annual Report 2008 - Financial Report
http://slidepdf.com/reader/full/adb-annual-report-2008-financial-report 190/218
Asian Development Bank188
S T A T I S T I C
A L A N N E X E S
CONTINUED
TA
Type Sector TASF JSF RCIF CCF Others Source Total
Institutional Strengthening for IntegratedWater Resources Management in the 6 Cis MDTF-
River Basin Territory AD MS 1,000.00 – – – 7,000.00 WFPF/The 8,000.00NetherlandsSocial Security Reform and Economic Modeling
Capacity Building AD MS 800.00 – – – – 800.00
Subtotal 3,950.00 1,300.00 – – 7,700.00 12,950.00
Kazakhstan CAREC Transport Corridor I (Zhambyl
Oblast Section) PP TC 150.00 – – – – 150.00CAREC Transport Corridor I (Zhambyl
Oblast Section) (Supplementary) PP TC 150.00 – – – – 150.00
Subtotal 300.00 – – – – 300.00
KiribatiEconomic Management and Public Sector
Reform AD LW – 800.00 – – – 800.00
Subtotal – 800.00 – – – 800.00
Kyrgyz RepublicCAREC Transport Corridor I
(Bishkek–Torugart Road) PP TC 150.00 – – – – 150.00Investment Climate Improvement Program PP MS 500.00 – – – – 500.00Implementation Support for Investment
Climate Reform PP MS 600.00 – – – – 600.00
Subtotal 1,250.00 – – – – 1,250.00
Lao People’s Democratic Republic
Sector-Wide Approach in Education SectorDevelopment (Supplementary) AD ED – – – – 477.00 Australia 477.00
Agriculture and Natural Resources SectorNeeds Assessment (Supplementary) AD AG 245.00 – – – – 245.00
Piloting Community e-Centers for Better Health AD HL – – – – 500.00 EAKPF 500.00Strengthening Public Financial Management AD LW 1,100.00 – – – – 1,100.00Greater Mekong Subregion Nam Theun 2
Hydroelectric Project – Social SafeguardsMonitoring AD EN 400.00 – – – – 400.00
Strengthening Higher Education PP ED – 600.00 – – – 600.00Health Sector Development Program PP HL 500.00 – – – – 500.00Building Lao PDR’s Capacity to Develop
Special Economic Zones AD LW 700.00 – – – – 700.00Capacity Strengthening for Enhancing Aid
Effectiveness AD LW 600.00 – – – – 600.00
Subtotal 3,545.00 600.00 – – 977.00 5,122.00
Micronesia, Federated States of Strengthening Public Sector Performance AD LW – 750.00 – – – 750.00
Subtotal – 750.00 – – – 750.00
– = nil or data not applicable; AD = advisory; AG = agriculture and natural resources; CAREC = Central Asia Regional Economic Cooperation; CCF = Climate ChangeFund; EAKPF = Republic of Korea e-Asia and Knowledge Partnership Fund; ED = education; EN = energy; HL = health, nutrition, and social protection; JSF = JapanSpecial Fund; Lao PDR = Lao People’s Democratic Republic; LW = law, economic management, and public policy; MDTF-WFPF = Multidonor Trust Fund under theWater Financing Partnership Facility; MS = multisector; PP = project preparatory; RCIF = Regional Cooperation and Integration Fund; TA = technical assistance;TASF = Technical Assistance Special Fund; TC = transport and communications.
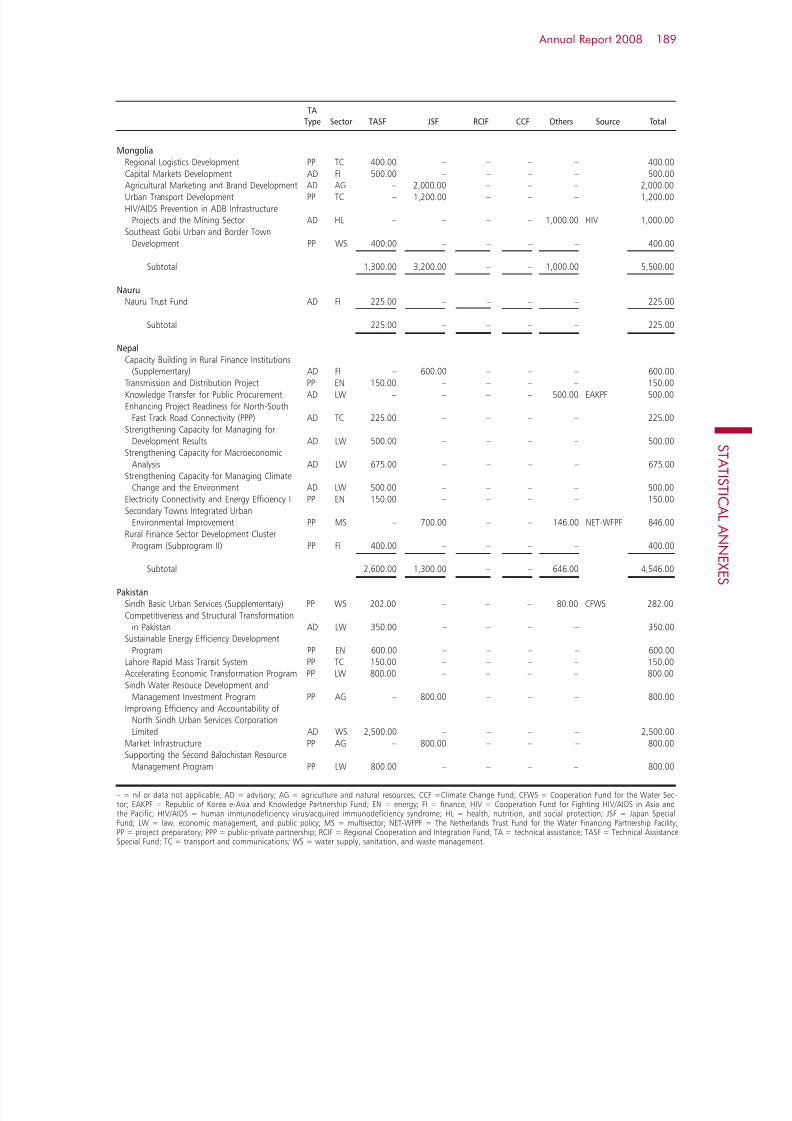
7/30/2019 ADB Annual Report 2008 - Financial Report
http://slidepdf.com/reader/full/adb-annual-report-2008-financial-report 191/218
189 Annual Report 2008
TA
Type Sector TASF JSF RCIF CCF Others Source Total
Mongolia Regional Logistics Development PP TC 400.00 – – – – 400.00
Capital Markets Development AD FI 500.00 – – – – 500.00Agricultural Marketing and Brand Development AD AG – 2,000.00 – – – 2,000.00Urban Transport Development PP TC – 1,200.00 – – – 1,200.00HIV/AIDS Prevention in ADB Infrastructure
Projects and the Mining Sector AD HL – – – – 1,000.00 HIV 1,000.00Southeast Gobi Urban and Border Town
Development PP WS 400.00 – – – – 400.00
Subtotal 1,300.00 3,200.00 – – 1,000.00 5,500.00
Nauru Nauru Trust Fund AD FI 225.00 – – – – 225.00
Subtotal 225.00 – – – – 225.00
Nepal Capacity Building in Rural Finance Institutions
(Supplementary) AD FI – 600.00 – – – 600.00Transmission and Distribution Project PP EN 150.00 – – – – 150.00Knowledge Transfer for Public Procurement AD LW – – – – 500.00 EAKPF 500.00Enhancing Project Readiness for North-South
Fast Track Road Connectivity (PPP) AD TC 225.00 – – – – 225.00Strengthening Capacity for Managing for
Development Results AD LW 500.00 – – – – 500.00Strengthening Capacity for Macroeconomic
Analysis AD LW 675.00 – – – – 675.00Strengthening Capacity for Managing Climate
Change and the Environment AD LW 500.00 – – – – 500.00Electricity Connectivity and Energy Efficiency I PP EN 150.00 – – – – 150.00Secondary Towns Integrated Urban
Environmental Improvement PP MS – 700.00 – – 146.00 NET-WFPF 846.00
Rural Finance Sector Development ClusterProgram (Subprogram II) PP FI 400.00 – – – – 400.00
Subtotal 2,600.00 1,300.00 – – 646.00 4,546.00
PakistanSindh Basic Urban Services (Supplementary) PP WS 202.00 – – – 80.00 CFWS 282.00Competitiveness and Structural Transformation
in Pakistan AD LW 350.00 – – – – 350.00Sustainable Energy Efficiency Development
Program PP EN 600.00 – – – – 600.00Lahore Rapid Mass Transit System PP TC 150.00 – – – – 150.00Accelerating Economic Transformation Program PP LW 800.00 – – – – 800.00Sindh Water Resouce Development and
Management Investment Program PP AG – 800.00 – – – 800.00
Improving Efficiency and Accountability ofNorth Sindh Urban Services CorporationLimited AD WS 2,500.00 – – – – 2,500.00
Market Infrastructure PP AG – 800.00 – – – 800.00Supporting the Second Balochistan Resource
Management Program PP LW 800.00 – – – – 800.00
– = nil or data not applicable; AD = advisory; AG = agriculture and natural resources; CCF =Climate Change Fund; CFWS = Cooperation Fund for the Water Sec-tor; EAKPF = Republic of Korea e-Asia and Knowledge Partnership Fund; EN = energy; FI = finance; HIV = Cooperation Fund for Fighting HIV/AIDS in Asia andthe Pacific; HIV/AIDS = human immunodeficiency virus/acquired immunodeficiency syndrome; HL = health, nutrition, and social protection; JSF = Japan SpecialFund; LW = law, economic management, and public policy; MS = multisector; NET-WFPF = The Netherlands Trust Fund for the Water Financing Partnership Facility;PP = project preparatory; PPP = public-private partnership; RCIF = Regional Cooperation and Integration Fund; TA = technical assistance; TASF = Technical AssistanceSpecial Fund; TC = transport and communications; WS = water supply, sanitation, and waste management.

7/30/2019 ADB Annual Report 2008 - Financial Report
http://slidepdf.com/reader/full/adb-annual-report-2008-financial-report 192/218
Asian Development Bank190
S T A T I S T I C
A L A N N E X E S
CONTINUED
TA
Type Sector TASF JSF RCIF CCF Others Source Total
Improving Private Sector Participation andPublic Expenditure Management AD LW 800.00 – – – – 800.00
Subtotal 6,202.00 1,600.00 – – 80.00 7,882.00
Palau, Republic of Development of a Sustainable Health
Financing Scheme AD HL – 400.00 – – – 400.00
Subtotal – 400.00 – – – 400.00
Papua New Guinea Power Sector Development PP EN – 1,200.00 – – – 1,200.00Pilot Border Trade and Investment Development PP IN – 900.00 – – – 900.00Support for Development Planning AD LW 225.00 – – – – 225.00National Transport Development Plan
(2011–2020) AD TC – 700.00 – – – 700.00
Subtotal 225.00 2,800.00 – – – 3,025.00
Philippines Capacity Building for Housing Microfinance
(Supplementary) AD MS – – – – 500.00 EAKPF 500.00Philippines Basic Urban Services Sector PP MS – 650.00 – – – 650.00Strengthening Provincial and Local Planning
and Expenditure Management Phase 2 AD LW 650.00 – – – – 650.00Pasuquin East Wind Farm Development PP EN – – – – 200.00 CEF 200.00Road Sector Improvement PP TC – 660.00 – – – 660.00Integrated Natural Resources and Environmental
Management Sector Development Program PP AG – 850.00 – – – 850.00Water District Development Sector PP WS – – – – 1,200.00 MDTF-WFPF 1,200.00Improving Public Expenditure Management AD LW 800.00 – – – – 800.00Irrigation System Operation Efficiency
Improvement PP AG – 1,000.00 – – – 1,000.00Harmonization and Development Effectiveness AD LW 900.00 – – – – 900.00Supporting Governance in Justice Sector
Reform in the Philippines AD LW 1,500.00 – – – 500.00 GDCF 2,000.00
Subtotal 3,850.00 3,160.00 – – 2,400.00 9,410.00
SamoaAfulilo Environmental Enhancement PP EN – 1,200.00 – – – 1,200.00
Subtotal – 1,200.00 – – – 1,200.00
Solomon Islands Establishment of the Solomon Islands
Maritime Safety Administration AD TC 1,000.00 – – – 600.00 EC 1,600.00
Subtotal 1,000.00 – – – 600.00 1,600.00
– = nil or data not applicable; AD = advisory; AG = agriculture and natural resources; CCF = Climate Change Fund; CEF = Clean Energy Fund; EAKPF = Republic ofKorea e-Asia and Knowledge Partnership Fund; EC = European Commission; EN = energy; GDCF = Gender and Development Cooperation Fund; HL = health, nutri-tion, and social protection; IN = industry and trade; JSF = Japan Special Fund; LW = law, economic management, and public policy; MDTF-WFPF = Multidonor TrustFund under the Water Financing Partnership Facility; MS = multisector; PP = project preparatory; RCIF = Regional Cooperation and Integration Fund; TA = technicalassistance; TASF = Technical Assistance Special Fund; TC = transport and communications; WS = water supply, sanitation, and waste management.

7/30/2019 ADB Annual Report 2008 - Financial Report
http://slidepdf.com/reader/full/adb-annual-report-2008-financial-report 193/218
191 Annual Report 2008
TA
Type Sector TASF JSF RCIF CCF Others Source Total
Sri Lanka Independent External Monitoring of
Resettlement Activities of the SouthernTransport Development Project(Supplementary) AD TC 175.00 – – – – 175.00
Land Use Planning of the Southern HighwayCorridor AD TC 300.00 – – – – 300.00
Institutional Strengthening for DecentralizedService Delivery in the Water Sector AD WS 700.00 – – – 50.00 CFWS 750.00
Deepening of Fiscal Management Reforms PP LW – 300.00 – – – 300.00Assessing Colombo Municipality Wastewater
Systems PP WS 150.00 – – – – 150.00Establishment of a Central Procurement Unit
in the Road Development Authority AD TC 225.00 – – – – 225.00
Subtotal 1,550.00 300.00 – – 50.00 1,900.00
Tajikistan Cotton Sector Restructuring (Supplementary) PP AG 240.00 – – – – 240.00CAREC Transport Corridor III
(Dushanbe–Uzbekistan Border Road) PP TC – – 650.00 – – 650.00
Subtotal 240.00 – 650.00 – – 890.00
Thailand Greater Mekong Subregion Highway Expansion PP TC 150.00 – – – – 150.00Greater Mekong Subregion Highway Expansion
(Supplementary) PP TC 120.00 – – – – 120.00Capital Market Development Phase II AD FI 1,000.00 – – – – 1,000.00Capacity Building and School Networking for
Educational Services (e-Learning) in Thailand AD ED – – – – 500.00 EAKPF 500.00Mainstreaming Energy Efficiency Measures in
Thai Municipalities AD EN – – – – 1,000.00 CEF 1,000.00
Subtotal 1,270.00 – – – 1,500.00 2,770.00
Timor-Leste Road Network Development PP TC – 800.00 – – – 800.00Capacity Building to Strengthen Public Sector
Management and Governance Skills, Phase III AD ED – 500.00 – – – 500.00
Subtotal – 1,300.00 – – – 1,300.00
TongaUrban Planning and Management System AD MS – 700.00 – – – 700.00
Subtotal – 700.00 – – – 700.00
Tuvalu Capacity Building for Taxation Reforms
(Supplementary) AD LW – – – – 270.00 Australia 270.00Capacity Development for Public Financial
Management AD LW 800.00 – – – 57.75 Australia 857.75
Subtotal 800.00 – – – 327.75 1,127.75
– = nil or data not applicable; AD = advisory; AG = agriculture and natural resources; CAREC = Central Asia Regional Economic Cooperation; CCF = ClimateChange Fund; CEF = Clean Energy Fund; CFWS = Cooperation Fund for the Water Sector; EAKPF = Republic of Korea e-Asia and Knowledge Partnership Fund;ED = education; EN = energy; FI = finance; JSF = Japan Special Fund; LW = law, economic management, and public policy; MS = multisector; PP = project preparatory;RCIF = Regional Cooperation and Integration Fund; TA = technical assistance; TASF = Technical Assistance Special Fund; TC = transport and communications;WS = water supply, sanitation, and waste management.

7/30/2019 ADB Annual Report 2008 - Financial Report
http://slidepdf.com/reader/full/adb-annual-report-2008-financial-report 194/218
Asian Development Bank192
S T A T I S T I C
A L A N N E X E S
Uzbekistan Djizzak and Surkhandarya Rural Water Supply
and Sanitation Sector (Supplementary) PP WS 200.00 – – – – 200.00Eligibility of State-Owned Road Enterprises for
Participation in ADB-Financed Projects AD TC 150.00 – – – – 150.00Water Resources Management Sector PP AG – 1,200.00 – – – 1,200.00
Subtotal 350.00 1,200.00 – – – 1,550.00
Viet Nam Support for Public–Private Development of the
O Mon Thermal Power Complex (Supplementary) PP EN 740.00 – – – – 740.00
Developing Benefit Sharing Mechanisms forPeople Adversely Affected by PowerGeneration Projects (Supplementary) AD EN – – – – 240.00 MDTF-WFPF 240.00
Ho Chi Minh City Metro Rail System(Supplementary) PP TC 500.00 – – – – 500.00
Health Care in the South Central Coast Region(Supplementary) PP HL 500.00 – – – – 500.00
Viet Nam Water Sector Review (Supplementary) AD MS – – – – 550.00 The 550.00Netherlands
Making Markets Work Better for the PoorPhase 2 AD IN 400.00 – – – 8,000.00 United 8,400.00
KingdomSecond Small and Medium-Sized Enterprise
Development Program PP LW – 500.00 – – – 500.00Skills Enhancement PP ED – 600.00 – – – 600.00Support for Developing Capital Markets and
Building Capacity in the Financial Sector AD FI 1,000.00 – – – – 1,000.00Hue Water Supply PP WS – – – – 1,500.00 NET-WFPF 1,500.00Ho Chi Minh City Water Supply PP WS – – – – 1,500.00 France 1,500.00Higher Education Sector Development PP ED – 1,000.00 – – – 1,000.00
Strengthening Water Management andIrrigation Systems Rehabilitation PP AG – 1,000.00 – – – 1,000.00
Supporting Civil Service Reform AD LW 1,000.00 – – – – 1,000.00Central Region Rural Water Supply and
Sanitation Sector PP WS 600.00 – – – – 600.00Da Nang Water Supply PP WS – – – – 1,500.00 MDTF-WFPF 1,500.00Hai Phong Water Supply PP WS – – – – 1,000.00 NET-WFPF 1,000.00Greater Mekong Subregion Ha Noi–Lang Son
and Ha Long–Mong Cai Expressway PP TC 1,500.00 – – – – 1,500.00Ben Luc–Long Thanh Expressway PP TC – 1,500.00 – – – 1,500.00Geo-Information Technology for Hazard Risk
Assessment AD AG – – – – 500.00 EAKPF 500.00Sustainable Rural Infrastructure Development
Project in the Northern Mountain Provinces PP MS – 1,000.00 – – – 1,000.00Capacity Building of the National Power
Transmission Corporation in a CompetitivePower Market Environment AD EN 225.00 – – – – 225.00
Subtotal 6,465.00 5,600.00 – – 14,790.00 26,855.00
TOTAL 76,663.00 41,250.00 1,538.00 2,000.00 36,270.75 157,721.75
– = nil or data not applicable; AD = advisory; AG = agriculture and natural resources; CCF = Climate Change Fund; EAKPF = Republic of Korea e-Asia and KnowledgePartnership Fund; ED = education; EN = energy; FI = finance; HL = health, nutrition, and social protection; IN = industry and trade; JSF = Japan Special Fund; LW= law, economic management, and public policy; MDTF-WFPF = Multidonor Trust Fund under the Water Financing Partnership Facility; MS = multisector; NET-WFPF =The Netherlands Trust Fund for the Water Financing Partnership Facility; PP = project preparatory; RCIF = Regional Cooperation and Integration Fund; TA = technicalassistance; TASF = Technical Assistance Special Fund; TC = transport and communications; WS = water supply, sanitation, and waste management.
CONTINUED
TA
Type Sector TASF JSF RCIF CCF Others Source Total
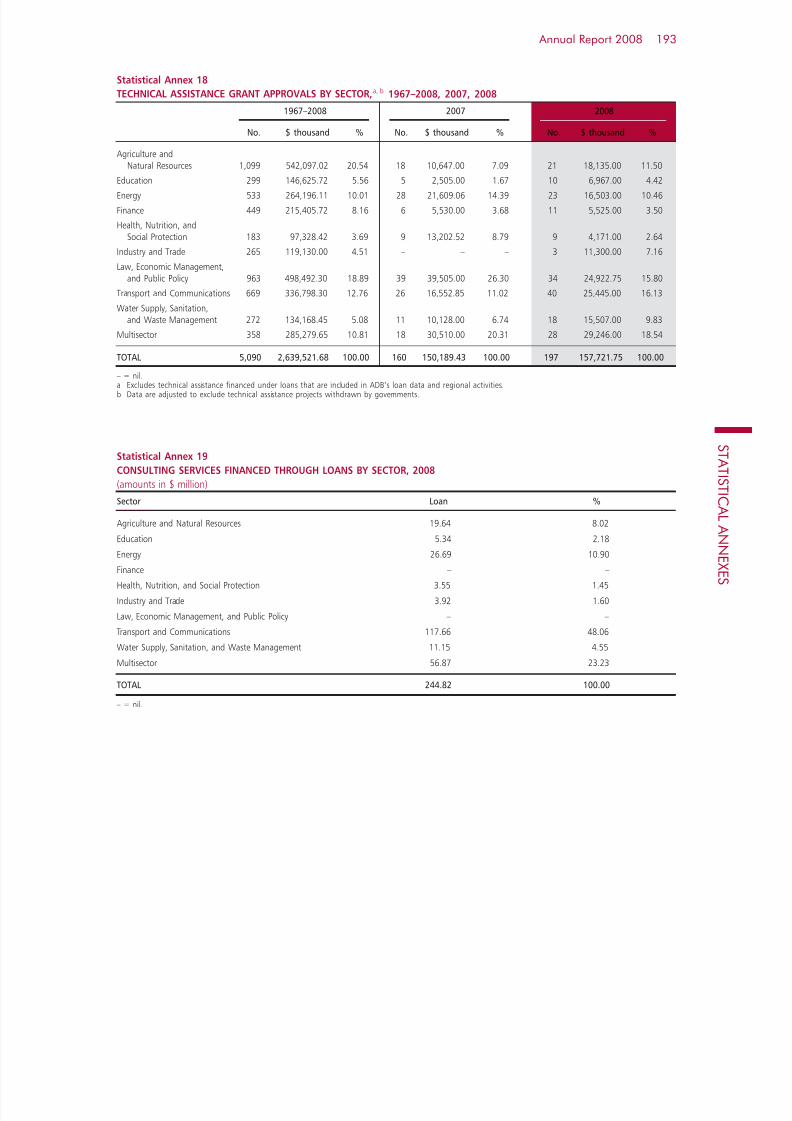
7/30/2019 ADB Annual Report 2008 - Financial Report
http://slidepdf.com/reader/full/adb-annual-report-2008-financial-report 195/218
193 Annual Report 2008
Statistical Annex 18
TECHNICAL ASSISTANCE GRANT APPROVALS BY SECTOR,a, b 1967–2008, 2007, 2008
1967–2008 2007 2008
No. $ thousand % No. $ thousand % No. $ thousand %
Agriculture andNatural Resources 1,099 542,097.02 20.54 18 10,647.00 7.09 21 18,135.00 11.50
Education 299 146,625.72 5.56 5 2,505.00 1.67 10 6,967.00 4.42
Energy 533 264,196.11 10.01 28 21,609.06 14.39 23 16,503.00 10.46
Finance 449 215,405.72 8.16 6 5,530.00 3.68 11 5,525.00 3.50
Health, Nutrition, andSocial Protection 183 97,328.42 3.69 9 13,202.52 8.79 9 4,171.00 2.64
Industry and Trade 265 119,130.00 4.51 – – – 3 11,300.00 7.16
Law, Economic Management,and Public Policy 963 498,492.30 18.89 39 39,505.00 26.30 34 24,922.75 15.80
Transport and Communications 669 336,798.30 12.76 26 16,552.85 11.02 40 25,445.00 16.13
Water Supply, Sanitation,and Waste Management 272 134,168.45 5.08 11 10,128.00 6.74 18 15,507.00 9.83
Multisector 358 285,279.65 10.81 18 30,510.00 20.31 28 29,246.00 18.54
TOTAL 5,090 2,639,521.68 100.00 160 150,189.43 100.00 197 157,721.75 100.00
– = nil.a Excludes technical assistance financed under loans that are included in ADB’s loan data and regional activities.b Data are adjusted to exclude technical assistance projects withdrawn by governments.
Statistical Annex 19
CONSULTING SERVICES FINANCED THROUGH LOANS BY SECTOR, 2008
(amounts in $ million)
Sector Loan %
Agriculture and Natural Resources 19.64 8.02
Education 5.34 2.18
Energy 26.69 10.90
Finance – –
Health, Nutrition, and Social Protection 3.55 1.45
Industry and Trade 3.92 1.60
Law, Economic Management, and Public Policy – –
Transport and Communications 117.66 48.06
Water Supply, Sanitation, and Waste Management 11.15 4.55
Multisector 56.87 23.23
TOTAL 244.82 100.00
– = nil.

7/30/2019 ADB Annual Report 2008 - Financial Report
http://slidepdf.com/reader/full/adb-annual-report-2008-financial-report 196/218
Asian Development Bank194
S T A T I S T I C
A L A N N E X E S
Statistical Annex 20
REGIONAL TECHNICAL ASSISTANCE ACTIVITIES, 2008
($ thousand)
TASF JSF RCIF CCF Others Source Total
CONFERENCE Supporting the Boao Forum for Asia – – – – 500.00 PRC RPRF 500.00
Supporting Regional Capacities for Financial
Asset and Liability and Risk Management – – 320.00 – – 320.00Supporting the Third High–Level Forum on Aid
Effectiveness and its Preparatory ConsultationProcess 500.00 – – – – 500.00
Natural Catastrophe Risk Insurance Mechanismsfor the Asia and Pacific Region – 800.00 – – – 800.00
South Asian Bond Markets Conference 66.00 – – – – 66.00South Asia Forum on the Impact of Global
Economic and Financial Crisis 800.00 – – – – 800.00Public Debt and Risk Management Forum 650.00 – – – – 650.00Strengthening Capacity of the Developing
Member Countries for Managing CreditEnhancement Products 500.00 – – – – 500.00
Subtotal 2,516.00 800.00 320.00 – 500.00 4,136.00
RESEARCH Establishment of Regional Knowledge Hubs
(Supplementary) 150.00 – – – – 150.00Bond Financing for Infrastructure Projects in
the ASEAN+3 Region – 700.00 – – – 700.00Developing Securitization Markets in ASEAN+3 – 700.00 – – – 700.00Strategic Partnerships for Policy Development
and Action to Foster Regional Cooperationin South Asia – – 700.00 – – 700.00
Promoting Energy Efficiency in the Pacific – – – – 1,200.00 CEF 1,200.00Asian Development Outlook 2009 460.00 – – – – 460.00Knowledge Sharing on Infrastructure
Public-Private Partnerships in Asia – – – – 500.00 EAKPF 500.00Quantifying the Costs and Benefits of Regional
Economic Integration in Asia 910.00 – – – – 910.00Minimizing Foreign Exchange Settlement Risk
in the ASEAN+3 Region: Support for Groupof Experts – – – – 850.00 ICFF 850.00
Enterprise Development and the Challenge ofInclusive Growth 500.00 – – – – 500.00
Subtotal 2,020.00 1,400.00 700.00 – 2,550.00 6,670.00 STUDY
Central Asia Regional Economic Cooperation:Transport Sector Strategy Study(Supplementary) 325.00 – – – – 325.00
Enhancing Effective Regulation of Water andEnergy Infrastructure and Utility Services(Supplementary) – – – – 700.00 Australia 700.00
A Development Framework for SustainableUrban Transport (Supplementary) – – – – 220.00 United 220.00
KingdomDevelopment Study of GMS Economic Corridors
(Supplementary) 200.00 – – – 400.00 PRC RPRF 600.00Managing the Cities in Asia (Supplementary) – – – – 2,000.00 Spain 2,000.00
– = nil or data not applicable; ASEAN+3 = Association of Southeast Asian Nations, plus the People’s Republic of China, Japan, and Republic of Korea; CCF = ClimateChange Fund; CEF = Clean Energy Fund; EAKPF = Republic of Korea e-Asia and Knowledge Partnership Fund; GMS = Greater Mekong Subregion; ICFF = InvestmentClimate Facilitation Fund; JSF = Japan Special Fund; PRC RPRF = People’s Republic of China Regional Cooperation and Poverty Reduction Fund; RCIF = RegionalCooperation and Integration Fund; TASF = Technical Assistance Special Fund.

7/30/2019 ADB Annual Report 2008 - Financial Report
http://slidepdf.com/reader/full/adb-annual-report-2008-financial-report 197/218
195 Annual Report 2008
ASEAN+3 Regional Guarantee and InvestmentMechanism Phase 2 (Supplementary) 400.00 – – – – 400.00
Improving the Implementation of EnvironmentalSafeguards for ADB Projects in Central and
West Asia 150.00 – – – – 150.00Equity in the Delivery of Public Services in
Selected Developing Member Countries 500.00 – – – – 500.00Strengthening Pacific Economic Analysis and
Policy Development 1,500.00 – – – 400.00 Australia 1,900.00Selected Evaluation Studies for 2008 1,493.00 – – – – 1,493.00Managing Water in Asia’s River Basins:
Charting Progress and Facilitating Investment – 2,000.00 – – – 2,000.00Strengthening Coastal and Marine Resources
Management in the Coral Triangle of thePacific (Phase 1) – – – – 850.00 Finland/ 850.00
GEFSouth Asian Regional Cooperation in 2030:
The Potential Role of India and Pakistan – – 750.00 – – 750.00Preparing a Response in the Pacific to High Prices 225.00 – – – – 225.00
Addressing Climate Change in the Asia andPacific Region 1,250.00 – – – – 1,250.00
Improving Price Collection of Non–HouseholdExpenditure Components and UpdatingPurchasing Power Parity Estimates forSelected Developing Member Countries 600.00 – – – – 600.00
Adopting the Supply and Use Framework Towards 1993 System of National AccountsCompliance in Selected Developing MemberCountries 800.00 – – – – 800.00
Developing a Computable General EquilibriumModeling Framework for Analyzing theImpacts of Power Trading BetweenMongolia and the People’s Republic of China – – – – 150.00 PRC RPRF 150.00
Harmonization of Bond Standards in ASEAN+3 – – – – 950.00 EAKPF/ICFF 950.00Attracting and Managing Foreign Direct
Investments in the Transitional Economiesof Southeast Asia 225.00 – – – – 225.00
Macroprudential Framework for the EarlyDetection of Financial Vulnerabilities 225.00 – – – – 225.00
Subtotal 7,893.00 2,000.00 750.00 – 5,670.00 16,313.00
TRAININGGreater Mekong Subregion Phnom Penh Plan
for Development Management III(Supplementary) – – – – 900.00 PRC RPRF/ 900.00
New ZealandStrengthening Pro-Poor Policy in the Pacific
(Supplementary) 24.00 – – – 232.00 Australia 256.00Anticorruption Seminars, 2008–2009 450.00 – – – – 450.00
Enhancing Collaboration with Supreme AuditInstitutions through Project Procurement–Related Audits 140.00 – – – – 140.00
Capacity Building and Institutional Strengtheningof the Free Trade Agreement Units of SelectedASEAN Member Countries – – – – 500.00 PRC RPRF 500.00
TASF JSF RCIF CCF Others Source Total
– = nil or data not applicable; ASEAN = Association of Southeast Asian Nations; ASEAN+3 = Association of Southeast Asian Nations, plus the People’s Republic ofChina, Japan, and Republic of Korea; CCF = Climate Change Fund; EAKPF = Republic of Korea e-Asia and Knowledge Partnership Fund; GEF = Global EnvironmentFacility; ICFF = Investment Climate Facilitation Fund; JSF = Japan Special Fund; PRC RPRF = People’s Republic of China Regional Cooperation and Poverty ReductionFund; RCIF = Regional Cooperation and Integration Fund; TASF = Technical Assistance Special Fund.

7/30/2019 ADB Annual Report 2008 - Financial Report
http://slidepdf.com/reader/full/adb-annual-report-2008-financial-report 198/218
Asian Development Bank196
S T A T I S T I C
A L A N N E X E S
Capacity Building for Bond Market Developmentin ASEAN+3 – – 500.00 – – 500.00
Strengthening the Asian Ombudsman Association 900.00 – – – – 900.00Pacific Financial Technical Assistance Centre
2008–2011 1,000.00 – – – – 1,000.00Strengthening Governance and Accountability
in Pacific Island Countries (Phase 2) – 1,500.00 – – 400.00 Australia 1,900.00Targeted Capacity Building for Mainstreaming
Indigenous Peoples Concerns in Development 600.00 – – – – 600.00Promoting South Asian Regional Economic
Cooperation II 1,500.00 – – – – 1,500.00
Subtotal 4,614.00 1,500.00 500.00 – 2,032.00 8,646.00 OTHERS
Core Environment Program and BiodiversityConservation Corridors Initiative in theGreater Mekong Subregion (Supplementary) 400.00 – – – 6,200.00 PRC RPRF/ 6,600.00
Finland/The
NetherlandsDevelopment Partnership Program for South Asia
(Supplementary) – – – – 588.00 Norway/ 588.00Sweden
Strengthening Country Safeguard Systems(Supplementary) 597.97 – – – – 597.97
Enhancing Gender and Development Capacity inDeveloping Member Countries – Phase 2(Supplementary) – – – – 1,000.00 GDCF 1,000.00
Promoting Gender Equality and Women’sEmpowerment (Supplementary) – – – – 1,000.00 GDCF 1,000.00
Fighting HIV/AIDS in Asia and the Pacific(Supplementary) – – – – 1,300.00 HIV 1,300.00
Enhancement of Subregional Cooperation inBIMP–EAGA and IMT–GT (Supplementary) 121.00 – – – – 121.00
Energy Sector Strategy and Development 2007(Supplementary) 1,000.00 – – – – 1,000.00
Private Sector Development Initiative(Supplementary) – – – – 300.00 Australia 300.00
Mainstreaming Environment for PovertyReduction (Supplementary) – – – – 2,600.00 Poverty and 2,600.00
EnvironmentFund
Rolling Out Air Quality Management in Asia(Supplementary) – – – – 484.63 Sweden 484.63
Promoting Effective Water Management Policiesand Practices – Phase 5 (Supplementary) – – – – 1,219.00 CFWS 1,219.00
Promoting South Asian Regional EconomicCooperation (Supplementary) 80.00 – – – – 80.00
Implementation of the Seed Capital AssistanceFacility – – – – 4,200.00 GEF 4,200.00
Energy for All Initiative – – – – 2,300.00 The 2,300.00Netherlands
TASF JSF RCIF CCF Others Source Total
CONTINUED
– = nil or data not applicable; ASEAN = Association of Southeast Asian Nations; ASEAN+3 = Association of Southeast Asian Nations, plus the People’s Republic ofChina, Japan, and Republic of Korea; BIMP-EAGA = Brunei Darussalam-Indonesia-Malaysia-Philippines East ASEAN Growth Area; CCF = Climate Change Fund; CFWS= Cooperation Fund for the Water Sector; GDCF = Gender and Development Cooperation Fund; GEF = Global Environment Facility; HIV = Cooperation Fund forFighting HIV/AIDS in Asia and the Pacific; HIV/AIDS = human immunodeficiency virus/acquired immunodeficiency syndrome; IMT-GT = Indonesia-Malaysia-ThailandGrowth Triangle; JSF = Japan Special Fund; PRC RPRF = People’s Republic of China Regional Cooperation and Poverty Reduction Fund; RCIF = Regional Cooperationand Integration Fund; TASF = Technical Assistance Special Fund.

7/30/2019 ADB Annual Report 2008 - Financial Report
http://slidepdf.com/reader/full/adb-annual-report-2008-financial-report 199/218
197 Annual Report 2008
Support for Implementation of the SecondGovernance and Anticorruption Action Plan – – – – 2,600.00 GCF 2,600.00
Strengthening Sound Environmental Managementin the Brunei Darussalam, Indonesia, Malaysia,
and Philippines East ASEAN Growth Area 1,500.00 – – – – 1,500.00Strengthening Sound Environmental Management
in the Brunei Darussalam, Indonesia, Malaysia,and Philippines East ASEAN Growth Area(Supplementary) – – – – 500.00 GEF 500.00
Integrating Human Trafficking and Safe MigrationConcerns for Women and Children into RegionalCooperation – – 1,000.00 – – 1,000.00
Enhancing Transport and Trade Facilitation in theGreater Mekong Subregion – – 1,000.00 – 750.00 Australia/ 1,750.00
PRC RPRFPyanj River Basin Flood Management 1,600.00 – – – – 1,600.00Greater Mekong Subregion Flood and Drought
Risk Management and Mitigation – 2,000.00 – – – 2,000.00Comprehensive Midterm Review of the Brunei
Darussalam–Indonesia–Malaysia–Philippines EastASEAN Growth Area Road Map to Development 300.00 – – – – 300.00
Asia Regional Integration Center, Phase II 900.00 – – – – 900.00Institutional Development for Enhanced
Subregional Cooperation in the aSEA Region 3,800.00 – – – – 3,800.00Asian Bonds Online Website Project, Phase II – 900.00 – – – 900.00HIV Prevention and Infrastructure: Mitigating Risk
in the Greater Mekong Subregion – – – – 6,000.00 Australia 6,000.00Strengthening Southeast Asian Financial Markets – – 650.00 – – 650.00Enhancing Engagement with Pacific Developing
Member Countries 1,500.00 – – – – 1,500.00Second Northern Greater Mekong Subregion
Transport Network Improvement – 1,300.00 – – – 1,300.00Enhancing Social Protection Initiatives in
Developing Member Countries 1,000.00 – – – – 1,000.00Ban Sok–Pleiku Power Transmission Project in
the Greater Mekong Subregion – 1,000.00 – – – 1,000.00Mekong Water Supply and Sanitation – 400.00 500.00 – 300.00 NET-WFPF 1,200.00Improved Management of Water Resources in
Central Asia – – – – 998.00 MDTF-WFPF 998.00Central Asia Regional Economic Cooperation
Institute, 2009–2012 4,000.00 – 500.00 – 500.00 PRC RPRF 5,000.00Thirteenth Agriculture and Natural Resources
Research at International AgriculturalResearch Centers 3,000.00 – – – – 3,000.00
Assessing the Socioeconomic Effects of theGreater Mekong Subregion Projects 950.00 – – – – 950.00
Gender-Responsive Decentralized Governancein Asia 500.00 – – – – 500.00
Strengthening Evidence-Based Policy-Makingin the Pacific: Support for Development of
National Health Accounts – 1,000.00 – – – 1,000.00Regional Partnerships for Climate Change
Adaptation and Disaster Preparedness – – 1,000.00 – – 1,000.00Capacity Building for Regional Trade Integration
and Facilitation – 900.00 – – – 900.00
TASF JSF RCIF CCF Others Source Total
– = nil or data not applicable, aSEA = archipelagic Southeast Asia, ASEAN = Association of Souteast Asian Nations, CCF = Climate Change Fund, GCF = Governance Coperation Fund,GGEF = Global Environment Facility, HIV = human immunodeficiency virus, JSF = Japan Special Fund, MDTF-WFPF = Multidonor Trust Fund under the Water Financing PartnershipFacility, NET-WFPF = The Netherlands Trust Fund for the Water Financing Partnership Facility, PRC RPRF = People’s Republic of China Regional Cooperation and Poverty Reduction Fund,RCIF = Regional Cooperation and Integration Fund, TASF = Technical Assistance Special Fund.

7/30/2019 ADB Annual Report 2008 - Financial Report
http://slidepdf.com/reader/full/adb-annual-report-2008-financial-report 200/218
Asian Development Bank198
S T A T I S T I C
A L A N N E X E S
Knowledge and Innovation Support for ADB’s – – – – 2,000.00 NET-WFPF/ 2,000.00Water Financing Program MDTF-WFPF
Expanding the Implementation of the EnergyEfficiency Initiative in Developing Member
Countries – – – 3,000.00 – 3,000.00 Regional Knowledge and Partnership Networks
for Poverty Reduction and Inclusive Growth – – – – 1,000.00 EAKPF/ 1,000.00PRC RPRF
Capturing and Transferring Air QualityManagement Knowledge in Asia – 500.00 – – – 500.00
Improving Connectivity and DestinationManagement of Cultural and NaturalResources in the South Asia Subregion – – 2,000.00 – – 2,000.00
Enhancing Financial Disclosure Standardsin Armenia, Azerbaijan, and Georgia – – – – 600.00 ICFF 600.00
Strengthening Public Financial Managementin Pacific Developing Member Countries 1,500.00 – – – – 1,500.00
Regional Stocktaking and Mapping of DisasterRisk Reduction Interventions for Asia and
the Pacific 400.00 – – – – 400.00Rural Information and Communication
Technology Policy Advocacy, KnowledgeSharing, and Capacity Building – – – – 500.00 EAKPF 500.00
Impact of Maternal and Child Health PrivateExpenditure on Poverty and Inequity 300.00 – – – 326.00 Australia 626.00
Promoting Inclusive Growth through BusinessDevelopment at the Base of the Pyramid 650.00 – – – – 650.00
Accelerating the Implementation of the CoreAgriculture Support Program 1,500.00 – – – 500.00 PRC RPRF 2,000.00
Subtotal 25,598.97 8,000.00 6,650.00 3,000.00 37,765.63 81,014.60
TOTAL 42,641.97 13,700.00 8,920.00 3,000.00 48,517.63 116,779.60
– = nil or data not applicable, CCF = Climate Change Fund, EAKPF = Republic of Korea e-Asia and Knowledge Partnership Fund, ICFF = Investment Climate Facilitation Fund,JSF = Japan Special Fund, MDTF-WFPF = Multidonor Trust Fund under the Water Financing Partnership Facility, NET-WFPF = The Netherlands Trust Fund for the WaterFinancing Partnership Facility, PRC RPRF = People’s Republic of China Regional Cooperation and Poverty Reduction Fund, RCIF = Regional Cooperation and IntegrationFund, TASF = Technical Assistance Special Fund.
TASF JSF RCIF CCF Others Source Total
CONTINUED
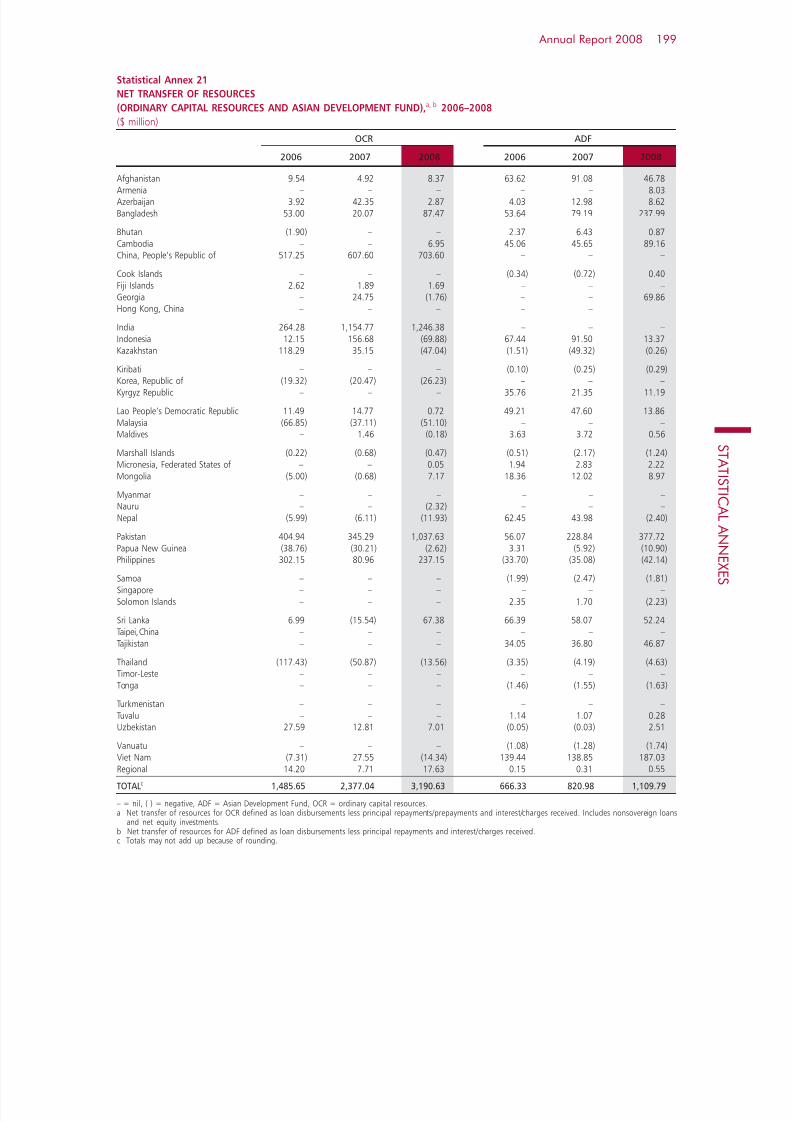
7/30/2019 ADB Annual Report 2008 - Financial Report
http://slidepdf.com/reader/full/adb-annual-report-2008-financial-report 201/218
199 Annual Report 2008
Statistical Annex 21
NET TRANSFER OF RESOURCES
(ORDINARY CAPITAL RESOURCES AND ASIAN DEVELOPMENT FUND),a, b 2006–2008
($ million)
OCR ADF
2006 2007 2008 2006 2007 2008
Afghanistan 9.54 4.92 8.37 63.62 91.08 46.78Armenia – – – – – 8.03Azerbaijan 3.92 42.35 2.87 4.03 12.98 8.62Bangladesh 53.00 20.07 87.47 53.64 79.19 237.99
Bhutan (1.90) – – 2.37 6.43 0.87Cambodia – – 6.95 45.06 45.65 89.16China, People’s Republic of 517.25 607.60 703.60 – – –
Cook Islands – – – (0.34) (0.72) 0.40Fiji Islands 2.62 1.89 1.69 – – –Georgia – 24.75 (1.76) – – 69.86Hong Kong, China – – – – – –
India 264.28 1,154.77 1,246.38 – – –Indonesia 12.15 156.68 (69.88) 67.44 91.50 13.37
Kazakhstan 118.29 35.15 (47.04) (1.51) (49.32) (0.26)Kiribati – – – (0.10) (0.25) (0.29)Korea, Republic of (19.32) (20.47) (26.23) – – –Kyrgyz Republic – – – 35.76 21.35 11.19
Lao People’s Democratic Republic 11.49 14.77 0.72 49.21 47.60 13.86Malaysia (66.85) (37.11) (51.10) – – –Maldives – 1.46 (0.18) 3.63 3.72 0.56
Marshall Islands (0.22) (0.68) (0.47) (0.51) (2.17) (1.24)Micronesia, Federated States of – – 0.05 1.94 2.83 2.22Mongolia (5.00) (0.68) 7.17 18.36 12.02 8.97
Myanmar – – – – – –Nauru – – (2.32) – – –Nepal (5.99) (6.11) (11.93) 62.45 43.98 (2.40)
Pakistan 404.94 345.29 1,037.63 56.07 228.84 377.72Papua New Guinea (38.76) (30.21) (2.62) 3.31 (5.92) (10.90)Philippines 302.15 80.96 237.15 (33.70) (35.08) (42.14)
Samoa – – – (1.99) (2.47) (1.81)Singapore – – – – – –Solomon Islands – – – 2.35 1.70 (2.23)
Sri Lanka 6.99 (15.54) 67.38 66.39 58.07 52.24Taipei,China – – – – – –Tajikistan – – – 34.05 36.80 46.87
Thailand (117.43) (50.87) (13.56) (3.35) (4.19) (4.63)Timor-Leste – – – – – –Tonga – – – (1.46) (1.55) (1.63)
Turkmenistan – – – – – –Tuvalu – – – 1.14 1.07 0.28Uzbekistan 27.59 12.81 7.01 (0.05) (0.03) 2.51
Vanuatu – – – (1.08) (1.28) (1.74)Viet Nam (7.31) 27.55 (14.34) 139.44 138.85 187.03Regional 14.20 7.71 17.63 0.15 0.31 0.55
TOTALc 1,485.65 2,377.04 3,190.63 666.33 820.98 1,109.79
– = nil, ( ) = negative, ADF = Asian Development Fund, OCR = ordinary capital resources.a Net transfer of resources for OCR defined as loan disbursements less principal repayments/prepayments and interest/charges received. Includes nonsovereign loans
and net equity investments.b Net transfer of resources for ADF defined as loan disbursements less principal repayments and interest/charges received.c Totals may not add up because of rounding.

7/30/2019 ADB Annual Report 2008 - Financial Report
http://slidepdf.com/reader/full/adb-annual-report-2008-financial-report 202/218
Asian Development Bank200
S T A T I S T I C
A L A N N E X E S
Statistical Annex 22
NET TRANSFER OF RESOURCES
(ORDINARY CAPITAL RESOURCES AND ASIAN DEVELOPMENT FUND),a 1999–2008
($ million)
1999–2003Average 2004 2005 2006 2007 2008
Afghanistan 27.51 42.13 54.17 73.16 96.00 55.15Armenia – – – – – 8.03Azerbaijan – – 0.50 7.95 55.33 11.49Bangladesh 117.84 19.54 81.17 106.64 99.26 325.46
Bhutan 5.79 5.28 10.34 0.47 6.43 0.87Cambodia 53.07 70.87 76.73 45.06 45.65 96.11China, People’s Republic of (164.87) 0.49 544.64 517.25 607.60 703.60
Cook Islands 0.10 1.14 0.53 (0.34) (0.72) 0.40Fiji Islands (2.62) 4.11 8.30 2.62 1.89 1.69Georgia – – – – 24.75 68.10Hong Kong, China – – – – – –
India (291.90) (1,036.01) 457.20 264.28 1,154.77 1,246.38Indonesia 75.35 (253.74) 142.80 79.59 248.18 (56.51)Kazakhstan (12.25) (85.45) (153.85) 116.78 (14.17) (47.30)
Kiribati 1.04 2.32 1.36 (0.10) (0.25) (0.29)Korea, Republic of (621.21) (66.84) (1,756.33) (19.32) (20.47) (26.23)Kyrgyz Republic 39.80 50.36 25.10 35.76 21.35 11.19
Lao People’s Democratic Republic 38.61 31.00 72.84 60.70 62.37 14.58Malaysia (47.15) (59.48) (52.99) (66.85) (37.11) (51.10)Maldives 2.47 0.94 3.66 3.63 5.18 0.38
Marshall Islands 6.55 0.40 (0.26) (0.73) (2.85) (1.71)Micronesia, Federated States of 2.93 0.63 1.24 1.94 2.83 2.27Mongolia 31.81 38.54 20.56 13.36 11.34 16.14
Myanmar (0.30) – – – – –Nauru 0.42 – – – – (2.32)Nepal 25.65 (23.35) (2.79) 56.46 37.87 (14.33)
Pakistan 43.79 (862.98) 242.91 461.01 574.13 1,415.35Papua New Guinea (6.66) (14.67) (9.52) (35.45) (36.13) (13.52)Philippines (160.89) (218.54) (118.94) 268.45 45.88 195.01
Samoa (0.91) (0.17) (0.35) (1.99) (2.47) (1.81)Singapore – – – – – –Solomon Islands (1.04) (0.71) 1.16 2.35 1.70 (2.23)
Sri Lanka 94.77 116.30 122.70 73.38 42.53 119.62Taipei,China – – – – – –Tajikistan 10.56 19.00 25.22 34.05 36.80 46.87
Thailand (426.45) (102.22) (394.42) (120.78) (55.06) (18.19)Timor-Leste – – – – – –Tonga 2.45 (1.26) (1.37) (1.46) (1.55) (1.63)
Turkmenistan – – – – – –
Tuvalu 0.79 0.01 0.06 1.14 1.07 0.28Uzbekistan 30.26 70.82 69.49 27.54 12.78 9.52
Vanuatu 3.37 (0.92) (0.93) (1.08) (1.28) (1.74)Viet Nam 216.88 167.59 181.62 132.13 166.40 172.69Regional 1.63 (6.32) (27.65) 14.35 8.02 18.18
TOTALb (902.80) (2,091.19) (375.08) 2,151.98 3,198.02 4,300.42
– = nil, ( ) = negative.a Net transfer of resources defined as loan disbursements less principal repayments/prepayments and interest/charges received. Includes private sector loans and net
equity investments.b Totals may not add up because of rounding.
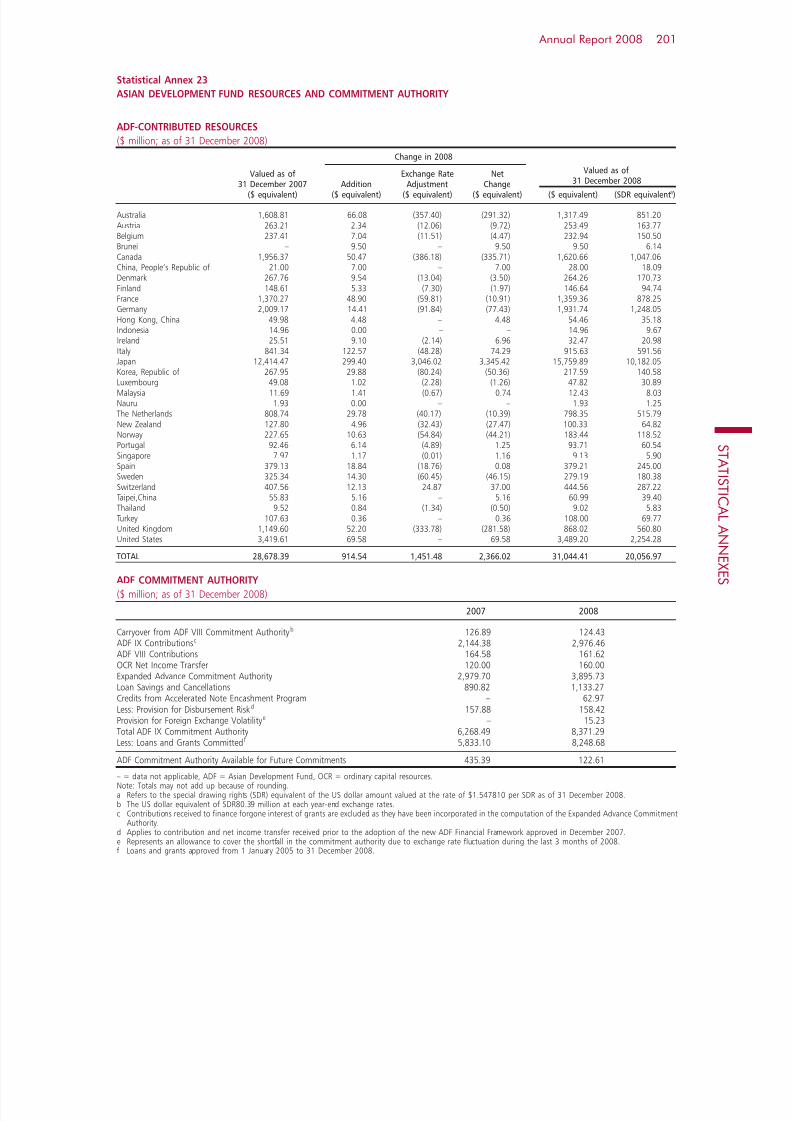
7/30/2019 ADB Annual Report 2008 - Financial Report
http://slidepdf.com/reader/full/adb-annual-report-2008-financial-report 203/218
201 Annual Report 2008
Statistical Annex 23
ASIAN DEVELOPMENT FUND RESOURCES AND COMMITMENT AUTHORITY
ADF-CONTRIBUTED RESOURCES
($ million; as of 31 December 2008)
Change in 2008
Valued as of Exchange Rate Net
Valued as of
31 December 2007 Addition Adjustment Change 31 December 2008 ($ equivalent) ($ equivalent) ($ equivalent) ($ equivalent) ($ equivalent) (SDR equivalenta)
Australia 1,608.81 66.08 (357.40) (291.32) 1,317.49 851.20Austria 263.21 2.34 (12.06) (9.72) 253.49 163.77Belgium 237.41 7.04 (11.51) (4.47) 232.94 150.50Brunei – 9.50 – 9.50 9.50 6.14Canada 1,956.37 50.47 (386.18) (335.71) 1,620.66 1,047.06China, People’s Republic of 21.00 7.00 – 7.00 28.00 18.09Denmark 267.76 9.54 (13.04) (3.50) 264.26 170.73Finland 148.61 5.33 (7.30) (1.97) 146.64 94.74France 1,370.27 48.90 (59.81) (10.91) 1,359.36 878.25Germany 2,009.17 14.41 (91.84) (77.43) 1,931.74 1,248.05Hong Kong, China 49.98 4.48 – 4.48 54.46 35.18Indonesia 14.96 0.00 – – 14.96 9.67Ireland 25.51 9.10 (2.14) 6.96 32.47 20.98
Italy 841.34 122.57 (48.28) 74.29 915.63 591.56Japan 12,414.47 299.40 3,046.02 3,345.42 15,759.89 10,182.05Korea, Republic of 267.95 29.88 (80.24) (50.36) 217.59 140.58Luxembourg 49.08 1.02 (2.28) (1.26) 47.82 30.89Malaysia 11.69 1.41 (0.67) 0.74 12.43 8.03Nauru 1.93 0.00 – – 1.93 1.25The Netherlands 808.74 29.78 (40.17) (10.39) 798.35 515.79New Zealand 127.80 4.96 (32.43) (27.47) 100.33 64.82Norway 227.65 10.63 (54.84) (44.21) 183.44 118.52Portugal 92.46 6.14 (4.89) 1.25 93.71 60.54Singapore 7.97 1.17 (0.01) 1.16 9.13 5.90Spain 379.13 18.84 (18.76) 0.08 379.21 245.00Sweden 325.34 14.30 (60.45) (46.15) 279.19 180.38Switzerland 407.56 12.13 24.87 37.00 444.56 287.22Taipei,China 55.83 5.16 – 5.16 60.99 39.40Thailand 9.52 0.84 (1.34) (0.50) 9.02 5.83Turkey 107.63 0.36 – 0.36 108.00 69.77
United Kingdom 1,149.60 52.20 (333.78) (281.58) 868.02 560.80United States 3,419.61 69.58 – 69.58 3,489.20 2,254.28
TOTAL 28,678.39 914.54 1,451.48 2,366.02 31,044.41 20,056.97
ADF COMMITMENT AUTHORITY
($ million; as of 31 December 2008)
2007 2008
Carryover from ADF VIII Commitment Authorityb 126.89 124.43ADF IX Contributionsc 2,144.38 2,976.46ADF VIII Contributions 164.58 161.62OCR Net Income Transfer 120.00 160.00Expanded Advance Commitment Authority 2,979.70 3,895.73Loan Savings and Cancellations 890.82 1,133.27Credits from Accelerated Note Encashment Program – 62.97
Less: Provision for Disbursement Risk d
157.88 158.42Provision for Foreign Exchange Volatilitye – 15.23Total ADF IX Commitment Authority 6,268.49 8,371.29Less: Loans and Grants Committedf 5,833.10 8,248.68
ADF Commitment Authority Available for Future Commitments 435.39 122.61
– = data not applicable, ADF = Asian Development Fund, OCR = ordinary capital resources.Note: Totals may not add up because of rounding.a Refers to the special drawing rights (SDR) equivalent of the US dollar amount valued at the rate of $1.547810 per SDR as of 31 December 2008.b The US dollar equivalent of SDR80.39 million at each year-end exchange rates.c Contributions received to finance forgone interest of grants are excluded as they have been incorporated in the computation of the Expanded Advance Commitment
Authority.d Applies to contribution and net income transfer received prior to the adoption of the new ADF Financial Framework approved in December 2007.e Represents an allowance to cover the shortfall in the commitment authority due to exchange rate fluctuation during the last 3 months of 2008.f Loans and grants approved from 1 January 2005 to 31 December 2008.

7/30/2019 ADB Annual Report 2008 - Financial Report
http://slidepdf.com/reader/full/adb-annual-report-2008-financial-report 204/218
Asian Development Bank202
S T A T I S T I C
A L A N N E X E S
Statistical Annex 24
TECHNICAL ASSISTANCE SPECIAL FUND
($ thousand; as of 31 December 2008)
Total AmountContributions Utilized
Direct Voluntary Contributions
Australia 2,484 2,484
Austria 159 159
Bangladesh 47 47
Belgium 1,394 1,394
Canada 3,346 3,346
China, People’s Republic of 1,600 1,600
Denmark 1,963 1,963
Finland 237 237
France 1,698 1,698
Germany 3,315 3,315
Hong Kong, China 100 100
India 3,310 3,310
Indonesia 250 250Italy 774 774
Japan 47,710 47,710
Korea, Republic of 1,900 1,900
Malaysia 909 909
The Netherlands 1,338 1,338
New Zealand 1,096 1,096
Norway 3,279 3,279
Pakistan 1,736 1,736
Singapore 1,100 1,100
Spain 190 190
Sri Lanka 6 6
Sweden 861 861
Switzerland 1,035 1,035
Taipei,China 200 200
United Kingdom 5,617 5,617
United States 1,500 1,500
Subtotal 89,154 89,154
Regularized Replenishment Contributionsa 432,617 415,934
Transfer to Asian Development Fund (3,472) (3,472)
Allocation from OCR Net Incomeb 884,257 798,234
Subtotal 1,313,402 1,210,696
TOTAL 1,402,556 1,299,850
( ) = negative, OCR = ordinary capital resources.a Represents Technical Assistance Special Fund (TASF) portion of contributions to the replenishment of the Asian Development Fund and the TASF authorized by
Board of Governors’ Resolutions 182, 214, and 300 at historical values.b Includes income, repayments, and reimbursements to the TASF since 1980, including investment holding gains (losses).

7/30/2019 ADB Annual Report 2008 - Financial Report
http://slidepdf.com/reader/full/adb-annual-report-2008-financial-report 205/218
203 Annual Report 2008
Statistical Annex 25
JAPAN SPECIAL FUND—Regular and Supplementary Contributions
Statement of Activities and Change in Net Assets
($ million)
1988–2002a 2003 2004 2005 2006 2007 2008 Total
Contributions Committed 836.0 16.6 24.2 27.3 24.5 27.7 17.4 973.7
Revenue 129.0 3.3 4.3 7.1 10.7 12.0 6.6 173.0
Total 965.0 19.9 28.5 34.4 35.2 39.7 24.0 1,146.7
Transfer to Cooperation Fund for
Regional Trade and Financial
Security Initiative – – (1.0) – – – – (1.0)
Expenses 767.2 39.6 19.7 35.9 51.1 33.7 55.1 1,002.3
Exchange Gain (Loss) (25.2) (0.3) 1.2 (0.8) (0.1) – 0.2 (25.0)
Translation Adjustments (12.5) – – – – – – (12.5)
Change in Net Assets 160.1 (20.0) 9.0 (2.3) (16.0) 6.0 (30.9) 105.9
– = nil, ( ) = negative.a Prior years’ amounts have been restated to conform with the 1995 presentation.
Statistical Annex 26
JAPAN SPECIAL FUND—Asian Currency Crisis Support Facility
Statement of Activities and Change in Net Assets
($ million)
1999–2003 2004 2005 2006 2007 2008 Total
Contributions Committed 241.0a – – – – – 241.0
Revenue 2.8 0.5 1.1 1.7 1.8 1.1 9.0
Total 243.8 0.5 1.1 1.7 1.8 1.1 250.0
Transfer to Japan Fund for Poverty Reduction (90.0) – – – – – (90.0)
Interest Payment Assistance Written Back 33.2 – – – – – 33.2
Expenses 131.5 (0.9) (0.8) (0.4) – (0.4) 129.0
Exchange Gain (Loss) (1.7) – – – – – (1.7)
Translation Adjustments (26.3) – – – – – (26.3)
Change in Net Assets 27.5 1.4 1.9 2.1 1.8 1.5 36.2
– = nil, ( ) = negative.a A guarantee facility is provided under the Asian Currency Crisis Support Facility for which the Government of Japan has made available noninterest-bearing, non-
negotiable notes in the amount of 360 billion yen, encashable by ADB at any time to meet a call on any guarantee. In the absence of any concluded guarantee,the note was returned to the Government of Japan on 25 March 2002.

7/30/2019 ADB Annual Report 2008 - Financial Report
http://slidepdf.com/reader/full/adb-annual-report-2008-financial-report 206/218
Asian Development Bank204
S T A T I S T I C
A L A N N E X E S
Statistical Annex 27
JAPAN FUND FOR POVERTY REDUCTION, 2008
AmountProject Name ($ thousand)
Afghanistan Development of Mini Hydropower Plants in Badakhshan and Bamyan Provinces 12,000
Lao People’s Democratic Republic Alternative Livelihood for Upland Ethnic Groups in Houaphanh Province 1,820
Micronesia, Federated States of
Weno Water Supply Well Remediation 980 Mongolia
Energy Conservation and Emissions Reduction from Poor Households 2,000Poverty Reduction through Community-Based Natural Resource Management 2,000Water Point and Extension Station Establishment for Poor Herding Families 2,000Community-Based Local Road Upgrading and Maintenance in the Western Region of Mongolia 2,000
Philippines
Developing Microinsurance 1,000
Sri Lanka Improvement of Rural Access Roads and Livelihood Development for the Poor 2,000
Tajikistan
Community Participatory Flood Management 3,000 Viet Nam
Demand–Driven Skills Training for Poverty Reduction in the Cuu Long (Mekong) River Delta 1,300Livelihood Improvement of Vulnerable Ethnic Minority Communities Affected by the Song Bung 4 Hydropower Project
in Quang Nam Province 2,000Community-Based Early Childhood Care and Development 1,900
TOTAL 34,000

7/30/2019 ADB Annual Report 2008 - Financial Report
http://slidepdf.com/reader/full/adb-annual-report-2008-financial-report 207/218
205 Annual Report 2008
Statistical Annex 28
PROJECTS WITH ADB-ADMINISTERED GRANT FINANCING, 2008 APPROVALS
Amount ($ thousand)
Project Name Technical Soft LoanAssistance Component
BILATERAL TRUST FUNDS
AustraliaCAM Road Asset Management 4,800.00LAO Sector-Wide Approach in Education Sector Development (Supplementary) 477.00SOL Road Improvement Sector (Supplementary) 469.88TUV Capacity Building for Taxation Reforms (Supplementary) 270.00TUV Capacity Building for Public Financial Management 57.75REG Enhancing Effective Regulation of Water and Energy Infrastructure and Utility Services (Supplementary) 700.00REG Enhancing Transport and Trade Facilitation in the Greater Mekong Subregion 250.00REG HIV Prevention and Infrastructure: Mitigating Risk in the Greater Mekong Subregion 6,000.00REG Impact of Maternal and Child Health Private Expenditure on Poverty and Inequity 326.00REG Strengthening Governance and Accountability in Pacific Island Countries (Phase 2) 400.00REG Strengthening Pro-Poor Policy in the Pacific (Supplementary) 232.00REG Private Sector Development Initiative (Supplementary) 300.00REG Strengthening Pacific Economic Analysis and Policy Development 400.00
Subtotal 9,412.75 5,269.88
CanadaBAN Emergency Disaster Damage Rehabilitation (Sector) 10,000.00
Subtotal 10,000.00
Second Danish Cooperation Fund for Renewable Energy and Energy Efficiency in Rural Areas IND Facilitating the Operations of the Energy Conservation Fund “Energy Smart” in Madhya Pradesh 1,700.00
Subtotal 1,700.00
FinlandREG Strengthening Coastal and Marine Resources Management in the Coral Triangle of the Pacific (Phase 1) 550.00REG Core Environment Program and Biodiversity Conservation Corridors Initiative in the Greater Mekong
Subregion (Supplementary) 4,900.00
Subtotal 5,450.00
FranceVIE Ho Chi Minh City Water Supply 1,500.00
Subtotal 1,500.00
Japan–Asian Clean Energy Fund under the Clean Energy Financing Partnership Facility BHU Green Power Development 1,000.00
1,000.00 Republic of Korea e-Asia and Knowledge Partnership Fund
LAO Piloting Community e-Centers for Better Health 500.00NEP Knowledge Transfer for Public Procurement 500.00PHI Capacity Building for Housing Microfinance (Supplementary) 500.00THA Capacity Building and School Networking for Educational Services (e-Learning) in Thailand 500.00VIE Geo-Information Technology for Hazard Risk Assessment 500.00REG Harmonization of Bond Standards in ASEAN+3 500.00REG Knowledge Sharing on Infrastructure Public–Private Partnerships in Asia 500.00REG Rural Information and Communication Technology Policy Advocacy, Knowledge Sharing, and Capacity Building 500.00REG Regional Knowledge and Partnership Networks for Poverty Reduction and Inclusive Growth 500.00
Subtotal 4,500.00
ASEAN+3 = Association of Southeast Asian Nations plus the People’s Republic of China, Japan, and Republic of Korea; BAN = Bangladesh; BHU = Bhutan;CAM = Cambodia; IND = India; LAO = Lao People’s Democratic Republic; NEP = Nepal; PHI = Philippines; REG = regional; SOL = Solomon Islands; THA = Thailand;TUV = Tuvalu; VIE = Viet Nam.

7/30/2019 ADB Annual Report 2008 - Financial Report
http://slidepdf.com/reader/full/adb-annual-report-2008-financial-report 208/218
Asian Development Bank206
S T A T I S T I C
A L A N N E X E S
Amount ($ thousand)
Project Name Technical Soft LoanAssistance Component
CONTINUED
The Netherlands
INO Instititutional Strengthening for Integrated Water Resources Management in the 6 Cis River Basin Territory 5,000.00VIE Viet Nam Water Sector Review 550.00REG Core Environment Program and Biodiversity Conservation Corridors Initiative in the Greater Mekong
Subregion (Supplementary) 800.00REG Energy for All Initiative 2,300.00
Subtotal 8,650.00
The Netherlands Trust Fund for the Water Financing Partnership Facility NEP Secondary Towns Integrated Urban Environmental Improvement 146.00SRI Dry Zone Urban Water and Sanitation 2,000.00VIE Hue Water Supply 1,500.00VIE Hai Phong Water Supply 1,000.00REG Mekong Water Supply and Sanitation 300.00REG Knowledge and Innovation Support for ADB’s Water Financing Program 800.00
Subtotal 3,746.00 2,000.00
New ZealandREG Greater Mekong Subregion Phnom Penh Plan for Development Management III (2nd Supplementary) 400.00
Subtotal 400.00
Norway REG Development Partnership Program for South Asia (Supplementary) 300.00
Subtotal 300.00
People’s Republic of China Regional Cooperation and Poverty Reduction Fund REG Developing a Computable General Equilibrium Modeling Framework for Analyzing the Impacts of
Power Trading between Mongolia and the People’s Republic of China 150.00REG Central Asia Regional Economic Cooperation Institute, 2009–2012 500.00
REG Development Study of GMS Economic Corridors (Supplementary) 400.00REG Enhancing Transport and Trade Facilitation in the Greater Mekong Subregion 500.00REG Capacity Building and Institutional Strengthening of the Free Trade Agreement Units of Selected
ASEAN Member Countries 500.00REG Greater Mekong Subregion Phnom Penh Plan for Development Management III (Supplementary) 500.00REG Supporting the Boao Forum for Asia 500.00REG Core Environment Program and Biodiversity Conservation Corridors Initiative in the Greater Mekong
Subregion (Supplementary) 500.00REG Regional Knowledge and Partnership Networks for Poverty Reduction and Inclusive Growth 500.00REG Accelerating the Implementation of the Core Agriculture Support Program 500.00
Subtotal 4,550.00
Spain PRC Dryland Sustainable Agriculture 350.00REG Managing the Cities in Asia (Supplementary) 2,000.00
Subtotal 2,000.00 350.00
ASEAN = Association of Southeast Asian Nations, GMS = Greater Mekong Subregion, INO = Indonesia, NEP = Nepal, PRC = People’s Republic of China, REG =regional, SRI = Sri Lanka, VIE = Viet Nam.

7/30/2019 ADB Annual Report 2008 - Financial Report
http://slidepdf.com/reader/full/adb-annual-report-2008-financial-report 209/218
207 Annual Report 2008
Amount ($ thousand)
Project Name Technical Soft LoanAssistance Component
Sweden
REG Development Partnership Program for South Asia (Supplementary) 288.00REG Rolling Out Air Quality Management in Asia (Supplementary) 484.63
Subtotal 772.63 Switzerland
BAN Post Literacy and Continuing Education (Supplementary) 2,500.00BAN Skills Development 6,000.00
Subtotal 8,500.00
United Kingdom CAM Health Sector Support (Supplementary) 1,800.00NEP Rural Reconstruction and Rehabilitation Sector Development Project (Supplementary) 20,000.00VIE Making Markets Work Better for the Poor (Phase 2) 8,000.00REG A Development Framework for Sustainable Urban Transport (Supplementary) 120.00
REG A Development Framework for Sustainable Urban Transport (2nd Supplementary) 100.00
Subtotal 8,220.00 21,800.00
MULTIDONOR COOPERATION FUNDS/PARTNERSHIPS
Clean Energy Fund PHI Pasuquin East Wind Farm Development 200.00PRC Railway Sector Energy Efficiency Strategy 800.00PRC Capacity Building for Energy Efficiency Implementation 800.00THA Mainstreaming Energy Efficiency Measures in Thai Municipalities 1,000.00REG Promoting Energy Efficiency in the Pacific 1,200.00
Subtotal 3,200.00 800.00 Cooperation Fund for Fighting HIV/AIDS in Asia and the Pacific
MON HIV/AIDS Prevention in ADB Infrastructure Projects and the Mining Sector 1,000.00REG Fighting HIV/AIDS in Asia and the Pacific (Supplementary) 1,000.00REG Fighting HIV/AIDS in Asia and the Pacific (2nd Supplementary) 300.00
Subtotal 2,300.00
Cooperation Fund for the Water Sector PAK Sindh Basic Urban Services (Supplementary) 80.00SRI Institutional Strengthening for Decentralized Service Delivery in the Water Sector 50.00REG Promoting Effective Water Management Policies and Practices – Phase 5 (Supplementary) 1,219.00
Subtotal 1,349.00
European Commission SOL Domestic Maritime Support (Sector) 5,250.00SOL Establishment of the Solomon Islands Maritime Safety Administration 600.00
Subtotal 600.00 5,250.00
Gender and Development Cooperation Fund PHI Supporting Governance in Justice Sector Reform in the Philippines 500.00REG Enhancing Gender and Development Capacity in Developing Member Countries – Phase 2 (Supplementary) 1,000.00REG Promoting Gender Equality and Women’s Empowerment (Supplementary) 1,000.00
Subtotal 2,500.00
BAN = Bangladesh, CAM = Cambodia, HIV/AIDS = human immunodeficiency virus/acquired immunodeficiency syndrome, MON = Mongolia, NEP = Nepal,PAK = Pakistan, PHI = Philippines, PRC = People’s Republic of China, REG = regional, SOL = Solomon Islands, SRI = Sri Lanka, THA = Thailand, VIE = Viet Nam.
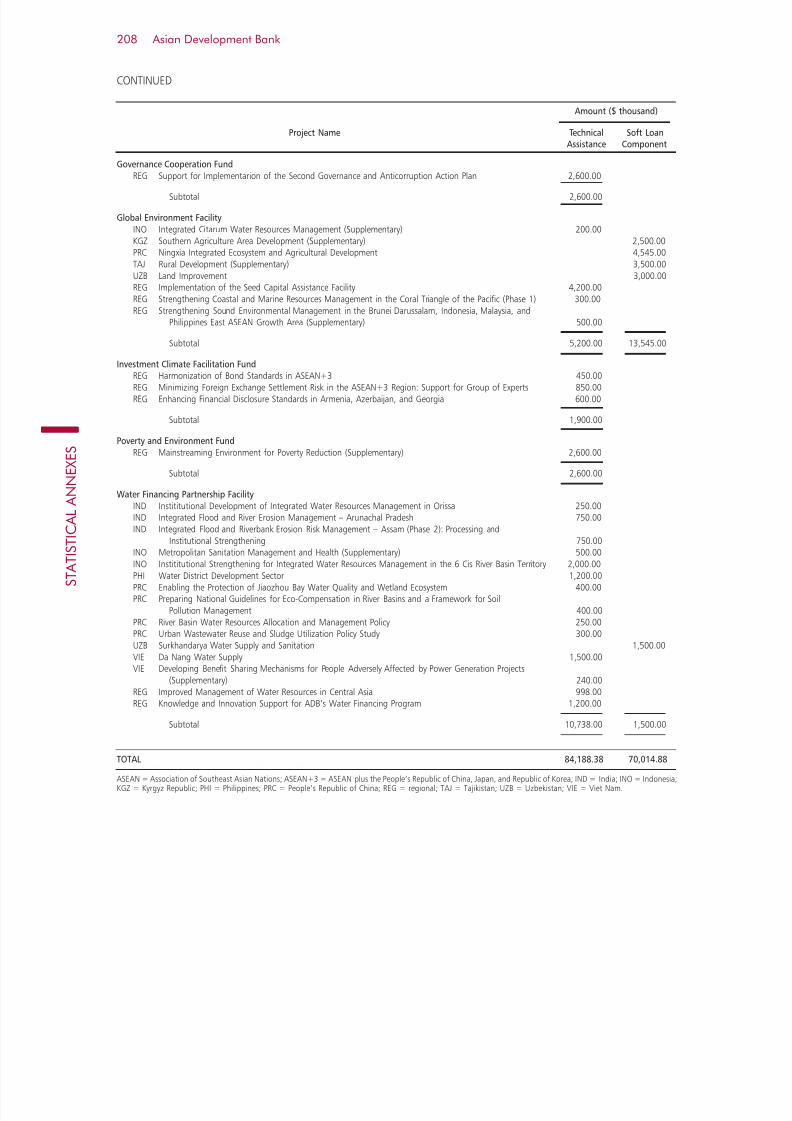
7/30/2019 ADB Annual Report 2008 - Financial Report
http://slidepdf.com/reader/full/adb-annual-report-2008-financial-report 210/218
Asian Development Bank208
S T A T I S T I C
A L A N N E X E S
Amount ($ thousand)
Project Name Technical Soft LoanAssistance Component
CONTINUED
Governance Cooperation Fund
REG Support for Implementarion of the Second Governance and Anticorruption Action Plan 2,600.00
Subtotal 2,600.00
Global Environment Facility INO Integrated Citarum Water Resources Management (Supplementary) 200.00KGZ Southern Agriculture Area Development (Supplementary) 2,500.00PRC Ningxia Integrated Ecosystem and Agricultural Development 4,545.00TAJ Rural Development (Supplementary) 3,500.00UZB Land Improvement 3,000.00REG Implementation of the Seed Capital Assistance Facility 4,200.00REG Strengthening Coastal and Marine Resources Management in the Coral Triangle of the Pacific (Phase 1) 300.00REG Strengthening Sound Environmental Management in the Brunei Darussalam, Indonesia, Malaysia, and
Philippines East ASEAN Growth Area (Supplementary) 500.00
Subtotal 5,200.00 13,545.00
Investment Climate Facilitation Fund
REG Harmonization of Bond Standards in ASEAN+3 450.00REG Minimizing Foreign Exchange Settlement Risk in the ASEAN+3 Region: Support for Group of Experts 850.00REG Enhancing Financial Disclosure Standards in Armenia, Azerbaijan, and Georgia 600.00
Subtotal 1,900.00
Poverty and Environment Fund REG Mainstreaming Environment for Poverty Reduction (Supplementary) 2,600.00
Subtotal 2,600.00
Water Financing Partnership Facility IND Instititutional Development of Integrated Water Resources Management in Orissa 250.00IND Integrated Flood and River Erosion Management – Arunachal Pradesh 750.00
IND Integrated Flood and Riverbank Erosion Risk Management – Assam (Phase 2): Processing andInstitutional Strengthening 750.00INO Metropolitan Sanitation Management and Health (Supplementary) 500.00INO Instititutional Strengthening for Integrated Water Resources Management in the 6 Cis River Basin Territory 2,000.00PHI Water District Development Sector 1,200.00PRC Enabling the Protection of Jiaozhou Bay Water Quality and Wetland Ecosystem 400.00PRC Preparing National Guidelines for Eco-Compensation in River Basins and a Framework for Soil
Pollution Management 400.00PRC River Basin Water Resources Allocation and Management Policy 250.00PRC Urban Wastewater Reuse and Sludge Utilization Policy Study 300.00UZB Surkhandarya Water Supply and Sanitation 1,500.00VIE Da Nang Water Supply 1,500.00VIE Developing Benefit Sharing Mechanisms for People Adversely Affected by Power Generation Projects
(Supplementary) 240.00REG Improved Management of Water Resources in Central Asia 998.00REG Knowledge and Innovation Support for ADB’s Water Financing Program 1,200.00
Subtotal 10,738.00 1,500.00
TOTAL 84,188.38 70,014.88
ASEAN = Association of Southeast Asian Nations; ASEAN+3 = ASEAN plus the People’s Republic of China, Japan, and Republic of Korea; IND = India; INO = Indonesia;KGZ = Kyrgyz Republic; PHI = Philippines; PRC = People’s Republic of China; REG = regional; TAJ = Tajikistan; UZB = Uzbekistan; VIE = Viet Nam.

7/30/2019 ADB Annual Report 2008 - Financial Report
http://slidepdf.com/reader/full/adb-annual-report-2008-financial-report 211/218
209 Annual Report 2008
Statistical Annex 29
CONTRACTS AWARDED BY COUNTRY OF ORIGIN,a 2008
PROJECT LOANS—ORDINARY CAPITAL RESOURCES (amounts in $ million)
Goods, Related Services,
and Civil Works Consulting Services Total Procurement
Amount % Distribution Amount % Distribution Amount % Distribution
Afghanistan – – – – – –
Armenia – – – – – –Australia 0.28 0.01 5.47 5.99 5.75 0.18Austria – – – – – –Azerbaijan 7.84 0.26 – – 7.84 0.25Bangladesh 7.24 0.24 – – 7.24 0.23Belgium 0.70 0.02 – – 0.70 0.02Bhutan – – – – – –Brunei Darussalam – – – – – –Cambodia – – – – – –Canada 1.95 0.06 1.64 1.79 3.58 0.12China, People’s Republic of 1,236.83 40.99 2.46 2.69 1,239.29 39.86Cook Islands – – – – – –Denmark 0.98 0.03 – – 0.98 0.03Fiji Islands 6.18 0.20 – – 6.18 0.20Finland 3.71 0.12 – – 3.71 0.12France 0.41 0.01 6.78 7.42 7.19 0.23Georgia – – – – – –Germany 122.20 4.05 1.36 1.49 123.56 3.97Hong Kong, China 1.20 0.04 1.67 1.83 2.87 0.09
India 695.93 23.06 28.03 30.68 723.96 23.29Indonesia 106.10 3.52 4.51 4.93 110.60 3.56Ireland – – – – – –Italy 2.75 0.09 – – 2.75 0.09Japan 64.67 2.14 0.68 0.74 65.35 2.10Kazakhstan 10.57 0.35 – – 10.57 0.34Kiribati – – – – – –Korea, Republic of 286.99 9.51 1.16 1.27 288.16 9.27Kyrgyz Republic – – 0.01 0.01 0.01 0.00Lao People’s Democratic Republic – – – – – –Luxembourg 0.37 0.01 – – 0.37 0.01Malaysia 28.80 0.95 1.06 1.16 29.86 0.96Maldives – – – – – –Marshall Islands – – – – – –Micronesia, Federated States of – – – – – –Mongolia – – – – – –Myanmar – – – – – –Nauru – – – – – –Nepal – – – – – –
The Netherlands 1.31 0.04 2.00 2.18 3.31 0.11New Zealand – – 0.06 0.06 0.06 0.00Norway 0.02 0.00 – – 0.02 0.00Pakistan 151.45 5.02 10.22 11.19 161.67 5.20Palau – – – – – –Papua New Guinea 10.87 0.36 – – 10.87 0.35Philippines 25.09 0.83 0.50 0.55 25.59 0.82Portugal – – – – – –Samoa – – – – – –Singapore 5.44 0.18 3.34 3.65 8.78 0.28Solomon Islands – – – – – –Spain – – – – – –Sri Lanka 124.39 4.12 6.11 6.69 130.50 4.20Sweden 0.75 0.02 – – 0.75 0.02Switzerland 0.32 0.01 – – 0.32 0.01Taipei,China 0.69 0.02 – – 0.69 0.02Tajikistan – – – – – –Thailand 11.98 0.40 – – 11.98 0.39Timor-Leste – – – – – –
Tonga – – – – – –Turkey 0.35 0.01 – – 0.35 0.01Turkmenistan – – – – – –Tuvalu – – – – – –United Kingdom 0.98 0.03 10.44 11.43 11.42 0.37United States 8.28 0.27 3.47 3.80 11.75 0.38Uzbekistan 16.14 0.53 0.39 0.43 16.53 0.53Vanuatu – – – – – –Viet Nam 74.03 2.45 – – 74.03 2.38Regional – – – – – –International – – – – – –
TOTALb 3,017.74 100.00 91.36 100.00 3,109.09 100.00
– = nil, 0.00 = % is less than 0.01.a Represents the country of origin where the goods are mined, produced, grown, and/or manufactured, based on US dollar value equivalent of contract.b Totals may not add up because of rounding.

7/30/2019 ADB Annual Report 2008 - Financial Report
http://slidepdf.com/reader/full/adb-annual-report-2008-financial-report 212/218
Asian Development Bank210
S T A T I S T I C
A L A N N E X E S
Statistical Annex 30
CONTRACTS AWARDED BY COUNTRY OF ORIGIN,a 2008
PROJECT LOANS—ASIAN DEVELOPMENT FUND (amounts in $ million)
Goods, Related Services,
and Civil Works Consulting Services Total Procurement
Amount % Distribution Amount % Distribution Amount % Distribution
Afghanistan 3.49 0.28 0.01 0.00 3.50 0.25
Armenia 19.45 1.57 2.02 1.47 21.47 1.56Australia 3.78 0.31 6.07 4.40 9.85 0.71Austria – – – – – –Azerbaijan 14.30 1.15 3.29 2.39 17.59 1.28Bangladesh 165.97 13.38 11.45 8.30 177.43 12.88Belgium 0.05 0.00 – – 0.05 0.00Bhutan 17.23 1.39 – – 17.23 1.25Brunei Darussalam – – – – – –Cambodia 13.35 1.08 4.28 3.11 17.64 1.28Canada 0.08 0.01 3.31 2.40 3.39 0.25China, People’s Republic of 80.60 6.50 1.11 0.80 81.71 5.93Cook Islands – – – – – –Denmark – – – – – –Fiji Islands – – – – – –Finland 0.11 0.01 – – 0.11 0.01France 15.46 1.25 1.40 1.01 16.86 1.22Georgia 69.86 5.63 – – 69.86 5.07Germany 1.50 0.12 0.43 0.31 1.93 0.14Hong Kong, China 0.98 0.08 – – 0.98 0.07
India 97.72 7.88 1.75 1.27 99.47 7.22Indonesia 40.79 3.29 23.41 16.97 64.20 4.66Ireland – – – – – –Italy 1.16 0.09 – – 1.16 0.08Japan 11.90 0.96 13.06 9.47 24.96 1.81Kazakhstan 0.06 0.00 – – 0.06 0.00Kiribati 0.07 0.01 – – 0.07 0.00Korea, Republic of 2.21 0.18 8.07 5.85 10.28 0.75Kyrgyz Republic 8.51 0.69 0.66 0.48 9.16 0.66Lao People’s Democratic Republic 18.74 1.51 0.82 0.59 19.56 1.42Luxembourg – – – – – –Malaysia 0.86 0.07 1.14 0.83 2.00 0.15Maldives 2.74 0.22 0.26 0.19 3.00 0.22Marshall Islands 0.02 0.00 – – 0.02 0.00Micronesia, Federated States of 0.98 0.08 – – 0.98 0.07Mongolia 5.72 0.46 0.13 0.09 5.84 0.42Myanmar 0.30 0.02 – – 0.30 0.02Nauru – – – – – –Nepal 37.39 3.02 2.34 1.69 39.73 2.88
The Netherlands 0.45 0.04 3.42 2.48 3.88 0.28New Zealand 2.53 0.20 0.74 0.53 3.26 0.24Norway – – – – – –Pakistan 196.79 15.87 4.54 3.29 201.33 14.61Palau – – – – – –Papua New Guinea 4.28 0.35 0.24 0.17 4.53 0.33Philippines 0.21 0.02 0.09 0.07 0.31 0.02Portugal 0.01 0.00 – – 0.01 0.00Samoa 3.54 0.29 0.61 0.44 4.15 0.30Singapore 9.09 0.73 – – 9.09 0.66Solomon Islands 0.02 0.00 – – 0.02 0.00Spain 0.02 0.00 – – 0.02 0.00Sri Lanka 89.59 7.23 1.35 0.98 90.95 6.60Sweden – – 2.30 1.67 2.30 0.17Switzerland 0.04 0.00 0.10 0.07 0.14 0.01Taipei,China 0.69 0.06 4.98 3.61 5.67 0.41Tajikistan 23.50 1.90 – – 23.50 1.71Thailand 34.83 2.81 – – 34.83 2.53Timor-Leste – – – – – –
Tonga – – – – – –Turkey – – – – – –Turkmenistan – – – – – –Tuvalu – – – – – –United Kingdom 0.50 0.04 8.57 6.21 9.07 0.66United States 5.89 0.48 22.80 16.53 28.69 2.08Uzbekistan 1.88 0.15 – – 1.88 0.14Vanuatu 0.05 0.00 – – 0.05 0.00Viet Nam 230.70 18.60 3.17 2.30 233.86 16.97Regional – – – – – –International – – – – – –
TOTALb 1,239.99 100.00 137.92 100.00 1,377.90 100.00
– = nil, 0.00 = % is less than 0.01.a Represents the country or origin where the goods are mined, produced, grown and/or manufactured, based on US dollar value equivalent of contract.b Totals may not add up because of rounding.

7/30/2019 ADB Annual Report 2008 - Financial Report
http://slidepdf.com/reader/full/adb-annual-report-2008-financial-report 213/218
211 Annual Report 2008
Statistical Annex 31
CONTRACTS AWARDED BY COUNTRY OF ORIGIN,a 2008
PROJECT LOANS—ORDINARY CAPITAL RESOURCES AND ASIAN DEVELOPMENT FUND COMBINED (amounts in $ million)
Goods, Related Services,
and Civil Works Consulting Services Total Procurement
Amount % Distribution Amount % Distribution Amount % Distribution
Afghanistan 3.49 0.08 0.01 0.00 3.50 0.08
Armenia 19.45 0.46 2.02 0.88 21.47 0.48Australia 4.06 0.10 11.54 5.03 15.60 0.35Austria – – – – – –Azerbaijan 22.13 0.52 3.29 1.44 25.43 0.57Bangladesh 173.21 4.07 11.45 5.00 184.66 4.12Belgium 0.76 0.02 – – 0.76 0.02Bhutan 17.23 0.40 – – 17.23 0.38Brunei Darussalam – – – – – –Cambodia 13.35 0.31 4.28 1.87 17.64 0.39Canada 2.03 0.05 4.95 2.16 6.98 0.16China, People’s Republic of 1,317.42 30.94 3.57 1.56 1,321.00 29.44Cook Islands – – – – – –Denmark 0.98 0.02 – – 0.98 0.02Fiji Islands 6.18 0.15 – – 6.18 0.14Finland 3.82 0.09 – – 3.82 0.09France 15.88 0.37 8.18 3.57 24.06 0.54Georgia 69.86 1.64 – – 69.86 1.56Germany 123.69 2.91 1.80 0.78 125.49 2.80Hong Kong, China 2.17 0.05 1.67 0.73 3.84 0.09
India 793.64 18.64 29.78 12.99 823.42 18.35Indonesia 146.89 3.45 27.92 12.18 174.81 3.90Ireland – – – – – –Italy 3.91 0.09 – – 3.91 0.09Japan 76.57 1.80 13.74 5.99 90.30 2.01Kazakhstan 10.62 0.25 – – 10.62 0.24Kiribati 0.07 0.00 – – 0.07 0.00Korea, Republic of 289.20 6.79 9.23 4.03 298.43 6.65Kyrgyz Republic 8.51 0.20 0.67 0.29 9.17 0.20Lao People’s Democratic Republic 18.74 0.44 0.82 0.36 19.56 0.44Luxembourg 0.37 0.01 – – 0.37 0.01Malaysia 29.66 0.70 2.20 0.96 31.87 0.71Maldives 2.74 0.06 0.26 0.11 3.00 0.07Marshall Islands 0.02 0.00 – – 0.02 0.00Micronesia, Federated States of 0.98 0.02 – – 0.98 0.02Mongolia 5.72 0.13 0.13 0.05 5.84 0.13Myanmar 0.30 0.01 – – 0.30 0.01Nauru – – – – – –Nepal 37.39 0.88 2.34 1.02 39.73 0.89
The Netherlands 1.77 0.04 5.42 2.36 7.19 0.16New Zealand 2.53 0.06 0.79 0.35 3.32 0.07Norway 0.02 0.00 – – 0.02 0.00Pakistan 348.24 8.18 14.76 6.44 363.00 8.09Palau – – – – – –Papua New Guinea 15.15 0.36 0.24 0.11 15.39 0.34Philippines 25.30 0.59 0.60 0.26 25.89 0.58Portugal 0.01 0.00 – – 0.01 0.00Samoa 3.54 0.08 0.61 0.27 4.15 0.09Singapore 14.53 0.34 3.34 1.46 17.87 0.40Solomon Islands 0.02 0.00 – – 0.02 0.00Spain 0.02 0.00 – – 0.02 0.00Sri Lanka 213.98 5.03 7.47 3.26 221.45 4.94Sweden 0.75 0.02 2.30 1.00 3.05 0.07Switzerland 0.36 0.01 0.10 0.04 0.45 0.01Taipei,China 1.37 0.03 4.98 2.17 6.35 0.14Tajikistan 23.50 0.55 – – 23.50 0.52Thailand 46.81 1.10 – – 46.81 1.04Timor-Leste – – – – – –
Tonga – – – – – –Turkey 0.35 0.01 – – 0.35 0.01Turkmenistan – – – – – –Tuvalu – – – – – –United Kingdom 1.48 0.03 19.01 8.29 20.49 0.46United States 14.17 0.33 26.28 11.46 40.45 0.90Uzbekistan 18.01 0.42 0.40 0.17 18.41 0.41Vanuatu 0.05 0.00 – – 0.05 0.00Viet Nam 304.72 7.16 3.17 1.38 307.89 6.86Regional – – – – – –International – – – – – –
TOTALb 4,257.72 100.00 229.28 100.00 4,487.00 100.00
– = nil, 0.00 = % is less than 0.01.a Represents the country or origin where the goods are mined, produced, grown and/or manufactured, based on US dollar value equivalent of contract.b Totals may not add up because of rounding.

7/30/2019 ADB Annual Report 2008 - Financial Report
http://slidepdf.com/reader/full/adb-annual-report-2008-financial-report 214/218
Asian Development Bank212
S T A T I S T I C
A L A N N E X E S
Statistical Annex 32
ESTIMATES OF PAYMENT TO SUPPLYING COUNTRIES FOR FOREIGN PROCUREMENT
UNDER PROGRAM LENDING,a 2008
Ordinary Capital Resources (OCR) Asian Development Fund (ADF) Combined OCR and ADF
$ million % Distribution $ million % Distribution $ million % Distribution
Afghanistan 2.68 0.10 1.01 0.16 3.70 0.11Armenia – – – – – –
Australia 90.04 3.28 5.88 0.91 95.92 2.83Austria 9.45 0.34 2.11 0.33 11.55 0.34Azerbaijan 0.66 0.02 – – 0.66 0.02Bangladesh 3.67 0.13 0.94 0.15 4.61 0.14Belgium 37.61 1.37 4.25 0.66 41.86 1.24Bhutan 0.24 0.01 0.10 0.02 0.35 0.01Brunei Darussalam 11.45 0.42 – – 11.45 0.34Cambodia 0.01 0.00 0.17 0.03 0.17 0.01Canada 53.69 1.96 22.65 3.52 76.34 2.25China, People’s Republic of 359.35 13.11 94.37 14.66 453.71 13.40Cook Islands – – – – – –Denmark 5.44 0.20 1.44 0.22 6.88 0.20Fiji Islands 0.01 0.00 – – 0.01 0.00Finland 12.27 0.45 2.03 0.31 14.30 0.42France 41.30 1.51 8.36 1.30 49.66 1.47Georgia 0.02 0.00 – – 0.02 0.00Germany 112.38 4.10 18.36 2.85 130.75 3.86Hong Kong, China 57.94 2.11 18.69 2.90 76.62 2.26India 50.90 1.86 38.56 5.99 89.45 2.64
Indonesia 101.55 3.70 50.86 7.90 152.41 4.50Ireland 11.82 0.43 0.59 0.09 12.41 0.37Italy 84.34 3.08 38.98 6.05 123.31 3.64Japan 417.28 15.22 105.23 16.34 522.51 15.43Kazakhstan 0.51 0.02 0.19 0.03 0.70 0.02Kiribati – – – – – –Korea, Republic of 131.52 4.80 20.99 3.26 152.51 4.50Kyrgyz Republic 0.01 0.00 – – 0.01 0.00Lao People’s Democratic Republic 0.01 0.00 0.18 0.03 0.18 0.01Luxembourg 0.28 0.01 0.16 0.02 0.44 0.01Malaysia 183.39 6.69 64.20 9.97 247.59 7.31Maldives 0.39 0.01 0.18 0.03 0.57 0.02Marshall Islands – – – – – –Micronesia, Federated States of – – – – – –Mongolia – – 0.05 0.01 0.05 0.00Myanmar 3.65 0.13 0.92 0.14 4.56 0.13Nauru – – – – – –Nepal 1.55 0.06 0.07 0.01 1.62 0.05The Netherlands 34.46 1.26 4.91 0.76 39.36 1.16
New Zealand 12.64 0.46 1.08 0.17 13.72 0.41Norway 4.14 0.15 1.29 0.20 5.43 0.16Pakistan 3.99 0.15 1.70 0.26 5.70 0.17Palau – – – – – –Papua New Guinea 3.25 0.12 0.01 0.00 3.25 0.10Philippines 8.65 0.32 2.35 0.36 11.00 0.32Portugal 1.15 0.04 0.68 0.11 1.83 0.05Samoa – – – – – –Singapore 326.81 11.92 27.07 4.20 353.88 10.45Solomon Islands 0.01 0.00 – – 0.01 0.00Spain 13.13 0.48 2.16 0.34 15.29 0.45Sri Lanka 4.57 0.17 0.86 0.13 5.43 0.16Sweden 22.16 0.81 6.68 1.04 28.84 0.85Switzerland 24.87 0.91 6.88 1.07 31.75 0.94Taipei,China – – – – – –Tajikistan 0.05 0.00 0.10 0.02 0.15 0.00Thailand 95.64 3.49 29.87 4.64 125.50 3.71Timor-Leste – – – – – –Tonga 0.01 0.00 – – 0.01 0.00
Turkey 17.44 0.64 9.26 1.44 26.70 0.79Turkmenistan 0.51 0.02 0.23 0.04 0.74 0.02Tuvalu – – – – – –United Kingdom 62.43 2.28 11.97 1.86 74.40 2.20United States 302.62 11.04 28.65 4.45 331.27 9.79Uzbekistan 0.47 0.02 2.03 0.31 2.49 0.07Vanuatu 0.10 0.00 – – 0.10 0.00Viet Nam 17.11 0.62 4.62 0.72 21.73 0.64Regional – – – – – –International – – – – – –
TOTALb 2,741.60 100.00 643.89 100.00 3,385.48 100.00
– = nil, 0.00 = % is less than 0.01.a Estimates are based on import data drawn from the latest information available on borrowers’ trade statistics compiled by the International Monetary Fund Direction
of Trade Statistics.b Totals may not add up because of rounding.

7/30/2019 ADB Annual Report 2008 - Financial Report
http://slidepdf.com/reader/full/adb-annual-report-2008-financial-report 215/218
213 Annual Report 2008
Statistical Annex 33
CUMULATIVE CONTRACTS AWARDED BY COUNTRY OF ORIGINa
TECHNICAL ASSISTANCE OPERATIONS (amounts in $ million, as of 31 December 2008)
ADB’s % Administered % Japan % Total %Own Distri- Trust Distri- Special Distri- Contracts Distri-
Resources bution Funds bution Fund bution Awarded bution
Afghanistan 1.25 0.09 1.63 0.31 0.02 0.00 2.91 0.11Armenia 0.66 0.05 – – – – 0.66 0.02
Australia 163.39 12.31 64.11 12.15 126.09 13.89 353.57 12.80Austria 1.35 0.10 – – 0.95 0.10 2.30 0.08Azerbaijan 0.47 0.04 0.25 0.05 0.02 0.00 0.74 0.03Bangladesh 15.81 1.19 5.13 0.97 6.36 0.70 27.30 0.99Belgium 4.48 0.34 1.10 0.21 2.26 0.25 7.84 0.28Bhutan 0.43 0.03 0.07 0.01 0.15 0.02 0.64 0.02Cambodia 1.90 0.14 3.17 0.60 0.48 0.05 5.55 0.20Canada 97.52 7.35 45.50 8.62 67.93 7.49 210.91 7.63China, People’s Republic of 20.15 1.52 4.98 0.94 7.95 0.88 33.09 1.20Cook Islands 0.09 0.01 0.16 0.03 – – 0.24 0.01Denmark 12.66 0.95 5.07 0.96 17.95 1.98 35.68 1.29Fiji Islands 1.27 0.10 0.72 0.14 0.23 0.03 2.22 0.08Finland 10.22 0.77 6.45 1.22 9.03 1.00 25.71 0.93France 29.76 2.24 17.88 3.39 23.32 2.57 70.95 2.57Georgia 0.01 0.00 – – – – 0.01 0.00Germany 25.46 1.92 16.24 3.08 35.76 3.94 77.45 2.80Hong Kong, China 30.58 2.30 6.15 1.17 22.02 2.43 58.75 2.13India 59.91 4.51 24.69 4.68 21.79 2.40 106.42 3.85
Indonesia 18.28 1.38 11.35 2.15 12.33 1.36 41.96 1.52Ireland 0.20 0.02 – – – – 0.20 0.01Italy 5.14 0.39 0.84 0.16 2.68 0.30 8.65 0.31Japan 30.32 2.28 12.06 2.29 28.48 3.14 70.87 2.57Kazakhstan 1.14 0.09 1.31 0.25 0.13 0.01 2.58 0.09Kiribati 0.01 0.00 0.05 0.01 0.01 0.00 0.06 0.00Korea, Republic of 5.03 0.38 1.56 0.30 4.03 0.44 10.61 0.38Kyrgyz Republic 1.45 0.11 0.48 0.09 0.23 0.02 2.14 0.08Lao People’s Democratic Republic 3.17 0.24 1.88 0.36 0.98 0.11 6.04 0.22Malaysia 12.77 0.96 1.37 0.26 4.21 0.46 18.34 0.66Maldives 0.11 0.01 0.05 0.01 0.03 0.00 0.18 0.01Marshall Islands 0.19 0.01 0.19 0.04 0.01 0.00 0.38 0.01Micronesia 0.01 0.00 – – 0.02 0.00 0.03 0.00Mongolia 1.51 0.11 0.59 0.11 0.75 0.08 2.85 0.10Myanmar 0.94 0.07 0.71 0.13 0.01 0.00 1.66 0.06Nauru 0.01 0.00 0.01 0.00 – – 0.02 0.00Nepal 10.94 0.82 5.04 0.95 2.46 0.27 18.38 0.67The Netherlands 23.24 1.75 20.34 3.86 28.38 3.13 71.96 2.60
New Zealand 68.19 5.14 20.00 3.79 64.07 7.06 152.26 5.51Norway 5.34 0.40 4.52 0.86 3.36 0.37 13.21 0.48Pakistan 27.17 2.05 11.62 2.20 3.81 0.42 42.57 1.54Palau 0.03 0.00 – – – – 0.03 0.00Papua New Guinea 1.22 0.09 0.40 0.08 1.51 0.17 3.13 0.11Philippines 96.42 7.26 24.93 4.72 33.85 3.73 155.28 5.62Portugal 0.10 0.01 – – 0.09 0.01 0.19 0.01Samoa 0.86 0.06 0.04 0.01 0.87 0.10 1.77 0.06Singapore 17.78 1.34 2.96 0.56 10.69 1.18 31.42 1.14Solomon Islands 0.50 0.04 0.19 0.04 0.22 0.02 0.91 0.03Spain 5.75 0.43 2.90 0.55 1.02 0.11 9.68 0.35Sri Lanka 13.17 0.99 3.51 0.66 3.86 0.43 20.50 0.74Sweden 7.53 0.57 5.77 1.09 9.29 1.02 22.59 0.82Switzerland 11.21 0.84 6.54 1.24 11.81 1.30 29.56 1.07Taipei,China 1.08 0.08 0.07 0.01 2.71 0.30 3.85 0.14Tajikistan 0.47 0.04 1.25 0.24 0.16 0.02 1.88 0.07Thailand 14.17 1.07 8.19 1.55 12.07 1.33 34.43 1.25Timor-Leste 0.74 0.06 0.18 0.03 0.10 0.01 1.03 0.04Tonga 0.32 0.02 0.03 0.01 0.14 0.02 0.49 0.02Turkey 0.42 0.03 0.27 0.05 0.05 0.01 0.73 0.03Turkmenistan 0.10 0.01 0.05 0.01 – – 0.15 0.01Tuvalu 0.06 0.00 – – – – 0.06 0.00United Kingdom 175.47 13.22 66.50 12.60 134.93 14.87 376.89 13.64United States 254.94 19.20 87.71 16.63 172.57 19.02 515.26 18.65Uzbekistan 0.95 0.07 0.33 0.06 0.83 0.09 2.12 0.08Vanuatu 0.75 0.06 0.01 0.00 1.20 0.13 1.96 0.07Viet Nam 4.23 0.32 6.21 1.18 3.21 0.35 13.63 0.49Regional 3.49 0.26 8.22 1.56 3.12 0.34 14.82 0.54International Organizations 23.21 1.75 4.07 0.77 4.90 0.54 32.17 1.16
TOTALb 1,327.48 100.00 527.54 100.00 907.49 100.00 2,762.46 100.00
– = nil, 0.00 = % is less than 0.01.a Represents the country of origin where the goods are mined, produced, grown and/or manufactured, based on US dollar value equivalent of contract.b Totals may not add up because of rounding.
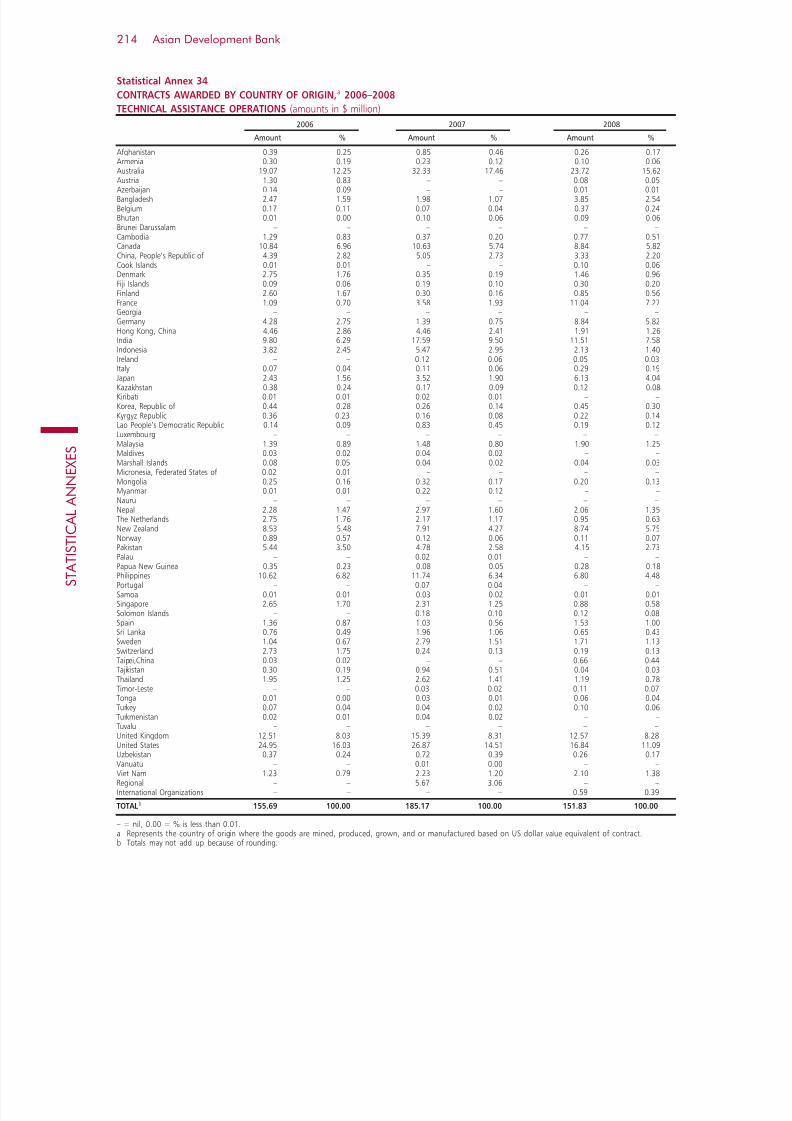
7/30/2019 ADB Annual Report 2008 - Financial Report
http://slidepdf.com/reader/full/adb-annual-report-2008-financial-report 216/218
Asian Development Bank214
S T A T I S T I C
A L A N N E X E S
Statistical Annex 34
CONTRACTS AWARDED BY COUNTRY OF ORIGIN,a 2006–2008
TECHNICAL ASSISTANCE OPERATIONS (amounts in $ million)
2006 2007 2008
Amount % Amount % Amount %
Afghanistan 0.39 0.25 0.85 0.46 0.26 0.17Armenia 0.30 0.19 0.23 0.12 0.10 0.06Australia 19.07 12.25 32.33 17.46 23.72 15.62Austria 1.30 0.83 – – 0.08 0.05Azerbaijan 0.14 0.09 – – 0.01 0.01Bangladesh 2.47 1.59 1.98 1.07 3.85 2.54Belgium 0.17 0.11 0.07 0.04 0.37 0.24Bhutan 0.01 0.00 0.10 0.06 0.09 0.06Brunei Darussalam – – – – – –Cambodia 1.29 0.83 0.37 0.20 0.77 0.51Canada 10.84 6.96 10.63 5.74 8.84 5.82China, People’s Republic of 4.39 2.82 5.05 2.73 3.33 2.20Cook Islands 0.01 0.01 – – 0.10 0.06Denmark 2.75 1.76 0.35 0.19 1.46 0.96Fiji Islands 0.09 0.06 0.19 0.10 0.30 0.20Finland 2.60 1.67 0.30 0.16 0.85 0.56France 1.09 0.70 3.58 1.93 11.04 7.27Georgia – – – – – –Germany 4.28 2.75 1.39 0.75 8.84 5.82Hong Kong, China 4.46 2.86 4.46 2.41 1.91 1.26India 9.80 6.29 17.59 9.50 11.51 7.58Indonesia 3.82 2.45 5.47 2.95 2.13 1.40Ireland – – 0.12 0.06 0.05 0.03Italy 0.07 0.04 0.11 0.06 0.29 0.19Japan 2.43 1.56 3.52 1.90 6.13 4.04Kazakhstan 0.38 0.24 0.17 0.09 0.12 0.08Kiribati 0.01 0.01 0.02 0.01 – –Korea, Republic of 0.44 0.28 0.26 0.14 0.45 0.30Kyrgyz Republic 0.36 0.23 0.16 0.08 0.22 0.14Lao People’s Democratic Republic 0.14 0.09 0.83 0.45 0.19 0.12Luxembourg – – – – – –Malaysia 1.39 0.89 1.48 0.80 1.90 1.25Maldives 0.03 0.02 0.04 0.02 – –Marshall Islands 0.08 0.05 0.04 0.02 0.04 0.03Micronesia, Federated States of 0.02 0.01 – – – –Mongolia 0.25 0.16 0.32 0.17 0.20 0.13Myanmar 0.01 0.01 0.22 0.12 – –Nauru – – – – – –Nepal 2.28 1.47 2.97 1.60 2.06 1.35The Netherlands 2.75 1 .76 2.17 1.17 0.95 0.63
New Zealand 8.53 5.48 7.91 4.27 8.74 5.75Norway 0.89 0.57 0.12 0.06 0.11 0.07Pakistan 5.44 3.50 4.78 2.58 4.15 2.73Palau – – 0.02 0.01 – –Papua New Guinea 0.35 0.23 0.08 0.05 0.28 0.18Philippines 10.62 6.82 11.74 6.34 6.80 4.48Portugal – – 0.07 0.04 – –Samoa 0.01 0.01 0.03 0.02 0.01 0.01Singapore 2.65 1.70 2.31 1.25 0.88 0.58Solomon Islands – – 0.18 0.10 0.12 0.08Spain 1.36 0.87 1.03 0.56 1.53 1.00Sri Lanka 0.76 0.49 1.96 1.06 0.65 0.43Sweden 1.04 0.67 2.79 1.51 1.71 1.13Switzerland 2.73 1.75 0.24 0.13 0.19 0.13Taipei,China 0.03 0.02 – – 0.66 0.44Tajikistan 0.30 0.19 0.94 0.51 0.04 0.03Thailand 1.95 1.25 2.62 1.41 1.19 0.78Timor-Leste – – 0.03 0.02 0.11 0.07Tonga 0.01 0.00 0.03 0.01 0.06 0.04
Turkey 0.07 0.04 0.04 0.02 0.10 0.06Turkmenistan 0.02 0.01 0.04 0.02 – –Tuvalu – – – – – –United Kingdom 12.51 8.03 15.39 8.31 12.57 8.28United States 24.95 16.03 26.87 14.51 16.84 11.09Uzbekistan 0.37 0.24 0.72 0.39 0.26 0.17Vanuatu – – 0.01 0.00 – –Viet Nam 1.23 0.79 2.23 1.20 2.10 1.38Regional – – 5.67 3.06 – –International Organizations – – – – 0.59 0.39
TOTALb 155.69 100.00 185.17 100.00 151.83 100.00
– = nil, 0.00 = % is less than 0.01.a Represents the country of origin where the goods are mined, produced, grown, and or manufactured based on US dollar value equivalent of contract.b Totals may not add up because of rounding.

7/30/2019 ADB Annual Report 2008 - Financial Report
http://slidepdf.com/reader/full/adb-annual-report-2008-financial-report 217/218
The Annual Report 2008 is printed using vegetable oil-based inks on recycled paper.
The paper is made using a totally chlorine-free process.
About the front cover
Residents of Kinjipi village in Papua New Guinea’s Western Highlands stop a basketball game to discuss how life will
change when they have a paved road. ADB has financed the upgrading of several roads in the area.
Photo Credits
Cover: Ian Gill; 6: Michael Hanson/Aurora Photos/Corbis; 158: Jonathan Blair/Corbis
7/30/2019 ADB Annual Report 2008 - Financial Report
http://slidepdf.com/reader/full/adb-annual-report-2008-financial-report 218/218