Embed Size (px)
Citation preview

POUR L'OBTENTION DU GRADE DE DOCTEUR ÈS SCIENCES
PAR
acceptée sur proposition du jury:
Suisse2009
Prof. S. Süsstrunk, présidente du juryProf. D. Floreano, directeur de thèse
Prof. J. d. R. Millán, rapporteur Prof. J. Príncipe, rapporteur Prof. R. Riener, rapporteur
Adaptive Wake and Sleep Detection for Wearable Systems
Walter KARLEN
THÈSE NO 4391 (2009)
ÉCOLE POLYTECHNIQUE FÉDÉRALE DE LAUSANNE
PRÉSENTÉE LE 27 AVRIL 2009
À LA FACULTÉ DES SCIENCES ET TECHNIQUES DE L'INGÉNIEUR
LABORATOIRE DE SYSTÈMES INTELLIGENTS
PROGRAMME DOCTORAL EN INFORMATIQUE, COMMUNICATIONS ET INFORMATION


Acknowledgements
I owe much to my supervisor Prof. Dario Floreano who introduced me to theexciting world of science. His lab, the Laboratory of Intelligent Systems, whichassembles a unique group of people with incredibly diversified knowledge andinterests, allowed me to feel comfortable and at home for four illuminated yearsof my life.
I would like to express my gratitude to the jury president Prof. Sabine Süss-trunk, and the members of my jury, Prof. José C. Príncipe, Prof. Robert Riener,and Prof. José del R. Millán, for taking their time to examine my thesis and fortheir constructive comments on my work.
Dr. med. Werner Karrer, Dr. med. Thomas Rote and Isabelle Arnold of theLuzerner Höhenklinik in Montana (VS) introduced me to clinical sleep moni-toring and scoring and awakened my interest for wearable sleep monitoring. Iwould like to thank them for having given me some of their valuable time.
I would also like to thank the management of the Solar Impulse project andall other Solar Impulse team members and partners, who believed in my workand made their equipment available for my research.
I am very grateful to all volunteers who participated in my sleep studies.Without their contribution, many of my findings and developments would nothave been possible.
Dr. Claudio Mattiussi and Dr. Jean-Christoph Zufferey coached me all theseyears. I would like to thank them for being available so often and for alwayshaving a good advice.
The feedback, comments and suggestions from Sara Mitri, Dr. Steffen Wisch-man and Dr. Markus Waibel enriched largely this thesis. I would like to thankthem for their valuable discussions and advice. I would like to thank SabineHauert and my brother Michael for having agreed to proof-read many parts of
i
ii ACKNOWLEDGEMENTS
this thesis and their patience. Thanks to Mirko Kovac and Daniel Marbach, whoenriched my days with their remarks and jokes when sharing the office with me.Thanks to James Roberts for verifying my electronic designs. Thanks also to allother LIS members for contributing to the friendly, scientific atmosphere in thelab. Special thanks go to Anouk Hein, our dynamic administrative assistant.
I am very grateful to my parents Stephanie and Franz, who always encour-aged me to follow an engineering and scientific career and continuously sup-ported me during my studies.
A big kiss to Johanneli, my love, for her passion, understanding and for cheer-ing me up in difficult periods. Without her, the difficult days of this thesis wouldhave been more difficult, the enjoyable days less enjoyable.
Lausanne, April 2009

Abstract
Sleep problems and disorders have a serious impact on human health and well-being. The rising costs for treating sleep-related chronic diseases in industrial-ized countries demands efficient prevention. Low-cost, wearable sleep / wakedetection systems which give feedback on the wearer’s "sleep performance" are apromising approach to reduce the risk of developing serious sleep disorders andfatigue.
Not all bio-medical signals that are useful for sleep / wake discriminationcan be easily recorded with wearable systems. Sensors often need to be placedin an obtrusive location on the body or cannot be efficiently embedded into awearable frame. Furthermore, wearable systems have limited computational andenergetic resources, which restrict the choice of sensors and algorithms for on-line processing and classification. Since wearable systems are used outside thelaboratory, the recorded signals tend to be corrupted with additional noise thatinfluences the precision of classification algorithms.
In this thesis we present the research on a wearable sleep / wake classifiersystem that relies on cardiorespiratory (ECG and respiratory effort) and activityrecordings and that works autonomously with minimal user interaction. Thisresearch included the selection of optimal signals and sensors, the developmentof a custom-tailored hardware demonstrator with embedded classification algo-rithms, and the realization of experiments in real-world environments for thecustomization and validation of the system. The processing and classification ofthe signals were based on Fourier transformations and artificial neural networksthat are efficiently implementable into digital signal controllers.
Literature analysis and empiric measurements revealed that cardiorespiratorysignals are more promising for a wearable sleep / wake classification than clin-ically used signals such as brain potentials. The experiments conducted during
iii

iv ABSTRACT
this thesis showed that inter-subject differences within the recorded physiologi-cal signals make it difficult to design a sleep / wake classification model that cangeneralize to a group of subjects.
This problem was addressed in two ways:First by adding features from another signal to the classifier, that is, measur-
ing the behavioral quiescence during sleep using accelerometers. Conducted re-search on different feature extraction methods from accelerometer data showedthat this data generalizes well for distinct subjects in the study group.
In addition, research on user-adaptation methods was conducted. Behavioralsleep and wake measures, notably the measurement of reactivity and activity,were developed to build up a priori knowledge that was used to adapt the clas-sification algorithm automatically to new situations.
This thesis demonstrates the design and development of a low-cost, wearablehardware and embedded software for on-line sleep / wake discrimination. Theproposed automatic user-adaptive classifier is advantageous compared to pre-viously suggested classification methods that generalize over multiple subjects,because it can take changes in the wearer’s physiology and sleep / wake behaviorinto account without adjustment from a human expert.
The results of this thesis contribute to the development of smart, wearable,bio-physiological monitoring systems which require a high degree of autonomyand have only low computational resources available. We believe that the pro-posed sleep / wake classification system is a first promising step toward a context-aware system for sleep management, sleep disorder prevention, and reduction offatigue.
Keywords: Sleep / wake classification; wearable devices; cardiorespiratory sig-nals; neural networks; adaptive systems; human centered systems; context aware-ness; sleep management.

Zusammenfassung
Schlafstörungen beeinträchtigen das menschliche Wohlbefinden und die Gesund-heit. Die steigenden Kosten zur Behandlung schlafabhängiger chronischer Er-krankungen in den Industrieländern erfordern eine effiziente Prävention. Gün-stige, tragbare Systeme zur Schlafüberwachung, welche den Benutzer über seinSchlafverhalten aufklären, könnten dem Auftreten von gesundheitsschädigen-den Schlaferkrankungen vorbeugen.
Leider ist es noch nicht möglich, alle wertvollen bio-medizinischen Parametermit tragbaren Systemen aufzuzeichnen und zu klassifizieren. Vielfach sind dieSensoren dem Träger hinderlich und die Prozessorleistung zu eingeschränkt. Aus-serhalb des Labors sind die Signale oft sehr verrauscht, was die Qualität vonKlassifikationsalgorithmen stark beeinträchtigen kann.
Diese Dissertation beschäftigt sich mit der Entwicklung eines tragbaren, au-tonomen Schlaf / Wach Detektors basierend auf der Messung von kardiorespi-ratorischen Signalen und Aktivität. Es werden die Auswahl und Integration vonSensoren und Elektronik, die Entwicklung eines angepassten Algorithmus zurKlassifikation und die nötigen Experimente zur Validierung des neuartigen Sys-tems beschrieben. Zur Klassifikation der EKG-, Atmungs- und Bewegungssig-nale wurden spektrale Merkmale mittels Fourier Transfomation ermittelt und an-schliessend mit Neuronalen Netzwerken klassifiziert.
Individuelle physiologische Differenzen zwischen verschiedenen Personen er-schwerten die Entwicklung eines generell anwendbaren Klassifizierungsalgorith-mus. Deshalb wurde zusätzlich zu den physiologischen Daten auch das Bewe-gungsmuster der Probanden verarbeitet.
Um den Algorithmus anpassungsfähiger zu gestalten, wurden zwei zusät-zliche Messungen eingeführt, welche zwei typische Schlaf / Wach Verhalten (Re-aktion und Aktivität) erfassen. Diese Messungen erlaubten in regelmässigen Ab-
v

vi ZUSAMMENFASSUNG
ständen, den Klassifikationsalgorithmus automatisch auf neue Benutzer oder an-dere Veränderungen anzupassen.
Die Resultate dieser Dissertation tragen zu neuen Entwicklungen im Bere-ich von intelligenten, tragbaren bio-medizinischen Geräten bei, welche auf einengeringen Stromverbrauch und Rechenleistung angewiesen sind.
Schlüsselwörter: Schlaf / Wach Klassifikation; anpassungsfähige Systeme; Men-schzentrierte Systeme; Künstliche Intelligenz; Neuronale Netzwerke; Schlafman-agement

vii
Für Frieda und Klemens,welche das Erscheinen dieser Arbeit nicht mehrmiterleben durften.

viii

Contents
Acknowledgements i
Abstract iii
Zusammenfassung v
Contents ix
Acronyms xvii
1 Introduction 11.1 Motivation . . . . . . . . . . . . . . . . . . . . . . . . . . . . . . . . . 11.2 Hypothesis . . . . . . . . . . . . . . . . . . . . . . . . . . . . . . . . . 31.3 Achievements and Contributions . . . . . . . . . . . . . . . . . . . . 41.4 Structure of the Thesis . . . . . . . . . . . . . . . . . . . . . . . . . . 4
2 Sleep, Wake and Fatigue 72.1 Definition of Sleep . . . . . . . . . . . . . . . . . . . . . . . . . . . . 7
2.1.1 Sleep Debt . . . . . . . . . . . . . . . . . . . . . . . . . . . . . 112.1.2 Sleep Inertia . . . . . . . . . . . . . . . . . . . . . . . . . . . . 11
2.2 Differentiation between Sleep and Wake . . . . . . . . . . . . . . . . 122.2.1 Physiological Methods . . . . . . . . . . . . . . . . . . . . . . 132.2.2 Cardiovascular Measurements . . . . . . . . . . . . . . . . . 152.2.3 Active and Passive Behavior Based Detection . . . . . . . . . 17
2.3 Sleepiness, Attention and Fatigue . . . . . . . . . . . . . . . . . . . . 202.4 Fatigue Management . . . . . . . . . . . . . . . . . . . . . . . . . . . 20
2.4.1 Readiness-to-perform Technologies . . . . . . . . . . . . . . 21
ix

x CONTENTS
2.4.2 Vehicle-based Performance Technologies . . . . . . . . . . . 222.4.3 In-vehicle, On-line, Operator Status Monitoring Technologies 222.4.4 Mathematical Models of Alertness Dynamics Joined with
Ambulatory Technologies . . . . . . . . . . . . . . . . . . . . 232.5 Related Projects and Products . . . . . . . . . . . . . . . . . . . . . . 24
2.5.1 Alertness Monitoring Helmet’s . . . . . . . . . . . . . . . . . 252.5.2 Optalert . . . . . . . . . . . . . . . . . . . . . . . . . . . . . . 252.5.3 Gentle Wake-Up Devices . . . . . . . . . . . . . . . . . . . . 262.5.4 US Army SleepWatch . . . . . . . . . . . . . . . . . . . . . . 272.5.5 European Project SENSATION . . . . . . . . . . . . . . . . . 28
2.6 Context Awareness and Personal Health . . . . . . . . . . . . . . . . 292.7 Wearable Fatigue Prediction Approach . . . . . . . . . . . . . . . . . 31
3 The Problem of Automated, Wearable Sleep and Wake Discrimination 333.1 Useful Signals for Wearable Sleep and Wake Classification . . . . . 34
3.1.1 Recording System . . . . . . . . . . . . . . . . . . . . . . . . . 353.1.2 Recordings . . . . . . . . . . . . . . . . . . . . . . . . . . . . . 363.1.3 Analysis . . . . . . . . . . . . . . . . . . . . . . . . . . . . . . 383.1.4 Results . . . . . . . . . . . . . . . . . . . . . . . . . . . . . . . 393.1.5 Conclusion . . . . . . . . . . . . . . . . . . . . . . . . . . . . 44
4 Automatic Sleep and Wake Classification 474.1 Algorithm . . . . . . . . . . . . . . . . . . . . . . . . . . . . . . . . . 48
4.1.1 Preprocessing and Feature Extraction . . . . . . . . . . . . . 484.1.2 Neural Classifier . . . . . . . . . . . . . . . . . . . . . . . . . 49
4.2 Performance Measures . . . . . . . . . . . . . . . . . . . . . . . . . . 524.3 Subject-specific Experiments . . . . . . . . . . . . . . . . . . . . . . . 53
4.3.1 Results and Discussion . . . . . . . . . . . . . . . . . . . . . . 534.3.2 Conclusion . . . . . . . . . . . . . . . . . . . . . . . . . . . . 58
4.4 Multiple Users or the Problem of Generalizing . . . . . . . . . . . . 584.4.1 Data Recordings . . . . . . . . . . . . . . . . . . . . . . . . . 604.4.2 Experiments . . . . . . . . . . . . . . . . . . . . . . . . . . . . 604.4.3 Results . . . . . . . . . . . . . . . . . . . . . . . . . . . . . . . 604.4.4 Conclusion . . . . . . . . . . . . . . . . . . . . . . . . . . . . 64
5 From Portable to Wearable 655.1 Requirements for a Wearable Sleep and Wake Discrimination System 665.2 Wearable Experiments . . . . . . . . . . . . . . . . . . . . . . . . . . 67

CONTENTS xi
5.2.1 SleePic System . . . . . . . . . . . . . . . . . . . . . . . . . . 675.2.2 Recording Sessions and Subjects . . . . . . . . . . . . . . . . 685.2.3 Data Analysis . . . . . . . . . . . . . . . . . . . . . . . . . . . 70
5.3 User Acceptance . . . . . . . . . . . . . . . . . . . . . . . . . . . . . . 715.4 Reducing Computational Load of Preprocessing . . . . . . . . . . . 715.5 Improving Network Topologies . . . . . . . . . . . . . . . . . . . . . 73
5.5.1 Network Layers . . . . . . . . . . . . . . . . . . . . . . . . . . 745.5.2 Network Inputs . . . . . . . . . . . . . . . . . . . . . . . . . . 75
5.6 Classification Results . . . . . . . . . . . . . . . . . . . . . . . . . . . 795.7 Conclusion . . . . . . . . . . . . . . . . . . . . . . . . . . . . . . . . . 83
6 Activity 876.1 Accelerometer Preprocessing and Classification Algorithms . . . . 88
6.1.1 Activity Counts . . . . . . . . . . . . . . . . . . . . . . . . . . 886.1.2 Body Position . . . . . . . . . . . . . . . . . . . . . . . . . . . 906.1.3 Spectral Analysis . . . . . . . . . . . . . . . . . . . . . . . . . 90
6.2 Experiments . . . . . . . . . . . . . . . . . . . . . . . . . . . . . . . . 926.3 Results and Discussion . . . . . . . . . . . . . . . . . . . . . . . . . . 926.4 Conclusion . . . . . . . . . . . . . . . . . . . . . . . . . . . . . . . . . 96
7 Adaptation 997.1 User Adaptation . . . . . . . . . . . . . . . . . . . . . . . . . . . . . 1007.2 Adaptation Strategies . . . . . . . . . . . . . . . . . . . . . . . . . . . 102
7.2.1 Modifying Classification Threshold . . . . . . . . . . . . . . 1027.2.2 Updating Neural Weights . . . . . . . . . . . . . . . . . . . . 102
7.3 Automatic Sleep and Wake Labeling . . . . . . . . . . . . . . . . . . 1037.3.1 Button Feedback . . . . . . . . . . . . . . . . . . . . . . . . . 1047.3.2 Activity Feedback . . . . . . . . . . . . . . . . . . . . . . . . 105
7.4 Recordings . . . . . . . . . . . . . . . . . . . . . . . . . . . . . . . . . 1057.5 Experiments . . . . . . . . . . . . . . . . . . . . . . . . . . . . . . . . 106
7.5.1 Threshold Experiments . . . . . . . . . . . . . . . . . . . . . 1077.5.2 Neural Weight Experiments . . . . . . . . . . . . . . . . . . . 107
7.6 Results and Discussion . . . . . . . . . . . . . . . . . . . . . . . . . . 1087.6.1 Threshold versus Adaptation . . . . . . . . . . . . . . . . . . 1087.6.2 Button versus Activity Feedback . . . . . . . . . . . . . . . . 1107.6.3 Subject-Specific versus Subject-Independent Systems . . . . 112
7.7 Conclusion . . . . . . . . . . . . . . . . . . . . . . . . . . . . . . . . . 117

xii CONTENTS
8 Concluding Remarks 1198.1 Main Achievements . . . . . . . . . . . . . . . . . . . . . . . . . . . . 1198.2 Outlook . . . . . . . . . . . . . . . . . . . . . . . . . . . . . . . . . . . 122
A Physiological Recording Devices 125A.1 Portable Recording Systems . . . . . . . . . . . . . . . . . . . . . . . 125A.2 Wearable Recording Systems . . . . . . . . . . . . . . . . . . . . . . 129
B SleePic Development 133B.1 The SleePic System . . . . . . . . . . . . . . . . . . . . . . . . . . . . 133
B.1.1 Wearable Sensor Module . . . . . . . . . . . . . . . . . . . . 134B.1.2 Core Processing Module . . . . . . . . . . . . . . . . . . . . . 135B.1.3 Watch Module . . . . . . . . . . . . . . . . . . . . . . . . . . . 139B.1.4 Energy Considerations . . . . . . . . . . . . . . . . . . . . . . 142
Bibliography 147
Curriculum vitæ 163

List of Figures
2.1 Sleep regulation processes and model of sleep regulation . . . . . . 92.2 Brain activity during sleep and normal sleep architecture . . . . . . 102.3 WatchPATTM-200 . . . . . . . . . . . . . . . . . . . . . . . . . . . . . 162.4 Vivago R© Active . . . . . . . . . . . . . . . . . . . . . . . . . . . . . . 192.5 Three Process Model of Alertness . . . . . . . . . . . . . . . . . . . . 242.6 Alertness monitoring helmet concepts . . . . . . . . . . . . . . . . . 252.7 OptalertTM alertness detection glasses . . . . . . . . . . . . . . . . . 262.8 Gentle wake-up devices . . . . . . . . . . . . . . . . . . . . . . . . . 272.9 SleepWatch R© . . . . . . . . . . . . . . . . . . . . . . . . . . . . . . . . 282.10 ENOBIO R© EEG sensor . . . . . . . . . . . . . . . . . . . . . . . . . . 29
3.1 Heally recording system mounted on a home-made shirt . . . . . . 373.2 Comparison of polysomnography with video/EMG/EOG analysis 393.3 ECG and RSP power spectral density . . . . . . . . . . . . . . . . . . 43
4.1 Overview of the sleep and wake classifier algorithm . . . . . . . . . 514.2 Sleep parameters (Total Sleep Time and Awakenings) . . . . . . . . 524.3 Example of a ROC curve . . . . . . . . . . . . . . . . . . . . . . . . . 544.4 Subject-specific portable experimental design . . . . . . . . . . . . . 554.5 Output of a subject-specific classifier using the ECG+RSP topology 564.6 ROC of the subject-specific portable experiments . . . . . . . . . . . 574.7 Output pattern of a classifier using portable RSP data . . . . . . . . 594.8 Subject-independent experimental design . . . . . . . . . . . . . . . 614.9 ROC of portable, subject-independent classifiers . . . . . . . . . . . 62
5.1 The SleePic System . . . . . . . . . . . . . . . . . . . . . . . . . . . . 69
xiii

xiv LIST OF FIGURES
5.2 Wearable subject-independent experimental design . . . . . . . . . 705.3 Effects of segment size on classification accuracy . . . . . . . . . . . 735.4 Automatic synthetization of ANN using AGE . . . . . . . . . . . . . 755.5 Accuracy of the evolved ANNs with AGE . . . . . . . . . . . . . . . 765.6 Distribution of the evolved input feature . . . . . . . . . . . . . . . 775.7 ANN input composition of the evolved networks . . . . . . . . . . 785.8 Evaluation of pruned input features . . . . . . . . . . . . . . . . . . 795.9 Comparison between the wearable and portable classifiers . . . . . 805.10 ROC for the subject-specific ANNs . . . . . . . . . . . . . . . . . . . 815.11 Comparison of subject-independent, wearable and portable ANNs 835.12 ROC for the wearable subject-independent experiments . . . . . . . 84
6.1 Activity calculation algorithms . . . . . . . . . . . . . . . . . . . . . 896.2 Three-axes position features example . . . . . . . . . . . . . . . . . . 916.3 Comparison of subject-specific and subject-independent, activity
based ANNs . . . . . . . . . . . . . . . . . . . . . . . . . . . . . . . . 946.4 ROC for the activity feature based ANNs . . . . . . . . . . . . . . . 956.5 ROC for the ECG+RSP+ACC ANN topology . . . . . . . . . . . . . 96
7.1 Comparison of generalized and adapted ANNs . . . . . . . . . . . 1097.2 Comparison of adaptation strategies . . . . . . . . . . . . . . . . . . 1107.3 Comparison of feedback methods for labeling the adaptation data . 1137.4 ROC of a classifier trained on low activity data . . . . . . . . . . . . 1147.5 ROC for comparison of generalized and adapted networks . . . . . 1157.6 Examples of the output patterns from the adapted ANNs . . . . . . 116
A.1 Portable ambulatory sleep screening device . . . . . . . . . . . . . . 126A.2 Examples of portable physiological recording systems . . . . . . . . 128A.3 Garment-based, wearable physiological recording systems. . . . . . 131A.4 Wearable, non-textile sensor systems. . . . . . . . . . . . . . . . . . 132
B.1 Communication between the SleePic modules . . . . . . . . . . . . 134B.2 Components of the EquivitalTM device . . . . . . . . . . . . . . . . . 136B.3 SleePic Core module . . . . . . . . . . . . . . . . . . . . . . . . . . . 137B.4 Operating modes of the SleePic Core . . . . . . . . . . . . . . . . . . 138B.5 SleePic Watch module . . . . . . . . . . . . . . . . . . . . . . . . . . 140B.6 SleePic Watch module components . . . . . . . . . . . . . . . . . . . 141B.7 Operating modes of the SleePic Watch . . . . . . . . . . . . . . . . . 142

List of Tables
3.1 Sampling frequencies for the portable experiments . . . . . . . . . . 363.2 Qualitative evaluation of physiological and behavioral signals . . . 41
4.1 Test classification accuracies . . . . . . . . . . . . . . . . . . . . . . . 554.2 Sleep parameters for the subject-specific portable experiments . . . 584.3 Subject-independent test accuracies of portable experiments . . . . 614.4 Subject-independent training accuracies using portable data . . . . 634.5 Sleep parameters for the 561 subject-independent experiments . . . 63
5.1 Configuration for the portable and wearable algorithm . . . . . . . 725.2 Input feature properties of physiological based ANNs . . . . . . . . 78
6.1 Input properties for the activity based ANNs . . . . . . . . . . . . . 926.2 Sleep parameters for the experiments based on activity features . . 97
7.1 Comparison of training and adaptation . . . . . . . . . . . . . . . . 1117.2 Performance of feedback methods . . . . . . . . . . . . . . . . . . . 1127.3 Performance of the ACC topology . . . . . . . . . . . . . . . . . . . 1147.4 Sleep parameters for the adaptation experiments . . . . . . . . . . . 1157.5 Performance of the ECG+RSP+ACC topology . . . . . . . . . . . . . 117
A.1 Comparison of portable physiological recording devices . . . . . . 127A.2 Comparison of wearable physiological recording devices . . . . . . 130
B.1 Instruction cycles for the sleep and wake algorithm . . . . . . . . . 139B.2 Current consumption of the SleePic Core . . . . . . . . . . . . . . . 144B.3 Current consumption of the SleePic Watch . . . . . . . . . . . . . . . 144
xv

xvi LIST OF TABLES

Acronyms
ACC Accelerometer (spectral feature extraction)
ACT Activity Count (feature extraction)
AGE Analog Genetic Encoding
ANN Artificial Neural Network
BAN Body Area Network
BP Blood Pressure
BT Bluetooth
DSP Digital Signal Processor
ECG Electrocardiogram (spectral feature extraction)
EEG Electroencephalogram
EMG Electromyogram
EOG Electrooculogram
FFT Fast Fourier Transform
HR Heart Rate
HRV Heart Rate Variability
MAC Multiply-accumulate
MIPS Million instructions per second
xvii

xviii ACRONYMS
NREM Non-Rapid Eye Movement Sleep
PAT Peripheral Arterial Tone
PCA Principal Component Analysis
PCB Printed Circuit Board
POS Position (feature extraction)
PSD Power Spectral Density
PSG Polysomnography
PVT Psychomotor Vigilance Test
PW Pulse Wave
RAM Random-access Memory
REM Rapid Eye Movement Sleep
ROC Receiver Operating Characteristic
RSP Respiration (spectral feature extraction)
RTC Real Time Clock
SC Skin Conductance
SEM Sensor Electronics Module
SpO2 Blood Oxygen Saturation
TST Total Sleep Time
VLSI Very-Large-Scale Integration

1 Introduction
"Snoring can endanger your health" (2009) public campaign of the Swiss Pulmonary League.
1.1 Motivation
Although humans show similar sleep behaviors, their sleep habits differ: Hu-mans go to bed at different times, they have preferences for different sleep envi-ronments and they need different amounts of sleep to be rested in the morning.But sleep habits do not only change between persons, they also change withina person’s lifetime. Newborns sleep 80% of the time. An average young adult
1

2 1. INTRODUCTION
however, sleeps between 7 and 9 hours a day and as he or she gets older, thistime is further reduced.
Whether sleep is important and necessary for life is for researchers still anopen question (Cirelli and Tononi, 2008 and Siegel, 2005). Sleep plays an impor-tant role in quality of life of humans (Edinger and Means, 2005). How relevantsleep really is to humans and their lifestyle becomes obvious after a sleeplessnight. One feels more fatigued, one has to fight to stay awake at certain times ofthe following day, the mood is changed1, the attention is reduced (Dinges, 2004),one lacks motivation, bigger risks and less objective decisions are taken (Venka-traman et al., 2007). Most people will not try to stay awake for multiple nights ina row, but if one does so, hallucination and daydreams start and one encountersthe so called ’microsleeps’.
Researchers link the involuntary lack of sleep and sleep disorders to manycommon diseases in industrialized countries like cardio-vascular diseases, di-abetes and obesity (Committee on Sleep Medicine and Research, 2006). Withthe assumption that 10 - 30 % of the US citizens have insomnia, the estimateddirect annual costs (medication and health care) are around 14 billion US Dol-lars (Walsh and Engelhardt, 1999) and the indirect costs (reduced productivity,increased work and traffic accidents, increase of other medical illnesses) couldeasily reach 100 billion US Dollars (Committee on Sleep Medicine and Research,2006). Whereas large efforts were put into discovering the effects of sleep lossand increased fatigue in the field of transportation and into the automatic screen-ing and detection of sleep disorders in hospitals, health care professionals onlyrecently become aware that a higher amount of prevention and surveillance inthe general population is required (Committee on Sleep Medicine and Research,2006).
With the recent success of mobile and wearable devices for training and well-ness (e.g. pulse or energy expenditure monitors), it becomes apparent that awearable, cheap and easy to use sleep monitoring or fatigue prediction devicecould contribute to public health. One can imagine a multitude of intelligent de-vices that could help to reach better and healthier sleep. For example a systemcould measure sleep onset times, sleep durations and sleep quality and informingthe user of sleep irregularities and trends. Recommending improvements in sleephabits can lead to a more restful sleep. Such a system has the potential to become
1The positive effects of sleep deprivation on depressed people are used in psychiatry to treata multitude of depression types without medication and are the most rapid antidepressant avail-able today (Wirz-Justice et al., 2005).

1.2. HYPOTHESIS 3
a lifestyle device. The device could also be a primary sleep disorder preventionsystem that would be more powerful than only passive prevention methods andless expensive than disorder treatments.
1.2 Hypothesis
Advances in building sensors for measuring bio-medical signals, the reducedpower consumption of sensors, the increased processing power of electronics andthe advances in artificial intelligence for medical applications make it possible todesign an intelligent sleep and wake discrimination system which can be acces-sible to the general public. By an intelligent system we mean a system that canadapt to its environment and does not simply apply some static rules. For exam-ple, a device that automatically detects typical physiological characteristics of itsuser and can associate unknown patterns without calibration to a characteristic.
We estimate that such a sleep / wake based wellness system can only be suc-cessful with a large public if it is low cost and easy to use. It also needs to conformto scientific and engineering standards by being safe, robust, reliable (works con-sistently in any situation), generalizable (works for everyone), sensitive (detectssleep as sleep) and specific (detects wake as wake). This thesis shows that a low-cost, wearable system for sleep / wake discrimination can be built with currentlyavailable sensor technology and well known machine learning techniques. As adesign paradigm we apply: Simpler, but smarter and more understandable. Such asystem could then serve as a framework for a multitude of applications that re-quire a comfortable device that combines artificial intelligence for sleep / wakedetection with embedded sensors and electronics in a single, wearable system,such as
• Prevention of fatigue of the wearer by detecting lack of core sleep.
• Early detection of sleep troubles and disorders in groups at risk.
• Coaching the wearer using sleep hygiene rules (Stepanski and Wyatt, 2003)to improve their lifestyle.
• Assistant to sportsmen and sportswomen for planning their sleep and re-generation schedules to increase training efficiency.

4 1. INTRODUCTION
1.3 Achievements and Contributions
One of the main challenges in this thesis was to render concepts and technol-ogy from the fields of biomedical engineering, artificial intelligence and humanphysiology into a wearable intelligent system.
The main contributions of this thesis are:
• An analysis of signals that are suitable for wearable biomedical applica-tions, in particular the sleep / wake discrimination.
• The research and development of an algorithm for sleep / wake classifica-tion relying on physiological signals, designed to fit a low-power system.
• The research and development of a hardware platform embedding the sen-sors and on-line algorithms for a wearable device. The device is relativelylow cost and shows an autonomy of multiple days.
• The research and development of a method for the automatic adaptation ofthe above system to different users and user situations.
• A comparison with existing wearable methods that rely on behavioral mea-sures of sleep only (actigraphy).
1.4 Structure of the Thesis
Chapter 2 Sleep, Wake and Fatigue: Because this thesis is focused on the detectionof sleep and wake, in this chapter we will introduce the definition of the sleepbehavior. We describe the physiology of sleep and how physiological and be-havioral changes in sleep and wake can be measured with available technology.Fatigue and sleepiness are important consequences of bad sleep and are there-fore also discussed. We give the state of the art of wearable fatigue detection andmanagement devices.Chapter 3 The Problem of Automated, Wearable Sleep and Wake Discrimination: In thischapter we elaborate the current problems of a wearable sleep / wake classifica-tion device. We empirically answer the first pertinent question "Which signalscan be measured and which sensors used for a reliable sleep / wake detectionwith a wearable system?". For this, a portable physiological recording system isused and a qualitative evaluation of the different recordings is made. The car-diorespiratory signals from the electrocardiogram (ECG) and a respiration effort

1.4. STRUCTURE OF THE THESIS 5
sensor were selected for further evaluation.Chapter 4 Automatic Sleep / Wake Classification: In this chapter we present an algo-rithm for low-power mobile sleep / wake classification. It is based on a FourierTransformation for preprocessing of the ECG and respiration signals. The pro-posed classifier is an Artificial Neural Network (ANN) with a single-layer, feed-forward topology. The performance of the algorithm is initially tested on real-world recordings from a single subject. Then we evaluated the performance ofthe algorithm when trained on different subjects.Chapter 5 From Portable to Wearable: Because the data used for the experimentsin Chapter 3 and 4 was recorded with a portable, and not a wearable device, wehad to validate the method also for a wearable system. However, no wearablesystems able to record and classify the required signals currently exist. Thereforewe had to develop a wearable prototype (SleePic). The development of the SleePicsystem is presented in Appendix B. We then optimized the algorithm for use onthe SleePic system. Experiments were conducted with young healthy subjectsin a realistic, real-world setting and the subject-specific and subject-independentperformance of the wearable classifier analyzed.Chapter 6 Activity: Because the classifiers based on cardiorespiratory featuresgeneralize badly for new users and because accelerometer measurements are verypractical for wearable applications, we introduce in this chapter three activitymeasurements. The first is based on the well established actigraphy method byCole et al. (1992). The second uses body position for the classification. The thirduses the spectral analysis of the accelerometer signal for the feature extraction(analog to the physiological signal preprocessing). We then give an in-depth com-parison of these methods with the physiological methods using the data from therecordings obtained in Chapter 5.Chapter 7 Adaptation: The introduction of the accelerometer signal could notcompletely resolve the problem of generalization of the classifier because thephysiological signals exhibited too large inter-subject differences. Therefore weintroduce in this chapter a new procedure for the automatic and on-line adap-tation to new subjects or physiological changes in the known subjects. The pre-sented methods are based on behavioral measures of sleep and wake (activityand reactivity) which are known to generalize well between subjects.Chapter 8 Concluding Remarks: In this chapter we conclude the findings of thisthesis and discuss the limitations. We also give an idea about future research andpossible applications of the sleep / wake discrimination system.Appendix A Physiological Recording Devices: In this chapter we give an overview

6 1. INTRODUCTION
of existing portable and wearable physiological recording devices that can poten-tially be useful for sleep / wake discrimination.Appendix B SleePic Development: This chapter describes the hardware and soft-ware developments for the wearable sleep / wake classification system called’SleePic’ that was used for the experiments in Chapters 5, 6 and 7.
Results that are described in Chapters 4 and 5 have been accepted for publicationin the IEEE Transactions on Biomedical Circuits and Systems (Karlen et al., 2009)and the Journal of Artificial Evolution and Applications (Dürr et al., 2009). Thecontent of Chapter 4 and 6 was also presented at peer-reviewed IEEE conferences(Karlen et al., 2007, 2008).
2 Sleep, Wake and Fatigue
Calvin and Hobbes (03.01.1995)(strip not available for the online version)
NO! NO! NO!I NEED MORE SLEEP!
I C CAN’T KEEPMMY EYES OPEN!
BED?! ALREADY?BUT I’M WIDE AWAKE!!
MY INTERNAL CLOCK IS ON TOKYO TIME.
Calvin and Hobbes c© 1995 Watterson. Used by permission of Universal Press Syndicate.All rights reserved.
2.1 Definition of Sleep
Sleep is primarily a behavior. This behavior is defined by (summarized by Flani-gan, 1972):
a) A species-specific body posture;
b) Maintained behavioral quiescence;
c) Elevated arousal threshold; and
d) State reversibility with stimulation.
As Ogilvie (2001) pointed out, this definition is still valid today and can be usefulfor the detection of sleep. In mammals the measuring of physiological param-eters that are correlated and derived from this behavioral differentiation are in
7

8 2. SLEEP, WAKE AND FATIGUE
general more convenient. Especially the possibility to continuously measure theelectro-physiological correlations make the measurements also more accurate. Adescription of the physiology of sleep will be given in the next sections.
Although sleep and the transition from wake to sleep were much studied inthe last decades, its exact function is not yet clear (Siegel, 2005). The opinions ofresearchers are split in two whether sleep is essential or not (Cirelli and Tononi,2008). The main reason for this discrepancy is the lack of having identified a corefunction of sleep. However, as Cirelli and Tononi (2008) pointed out, sleep isuniversal in all species and can’t be suppressed without consequences in the ani-mal’s behavior. Therefore, there might still be a core function of sleep which hasnot yet been found. Siegel (2005) has summarized the findings about the possiblefunctions of mammalian sleep into energy conservation, neural system recuper-ation, brain development, emotional regulation and memory actualization. Healso mentions that during sleep, brain activity is not much lower than duringwakefulness, and therefore sleep should not be seen as a "stand-by" mode of thebody solely.
In addition to nutrition, fitness and emotional states, sleep plays an importantrole for human wellness. Sleep seems to be a behavior complying with the regularneed of the human body to rest. This is also expressed by a decrease in the activityof most body parts. Whereas this is true for most body functions, this is not thecase for neural activity and should therefore not be generalized.
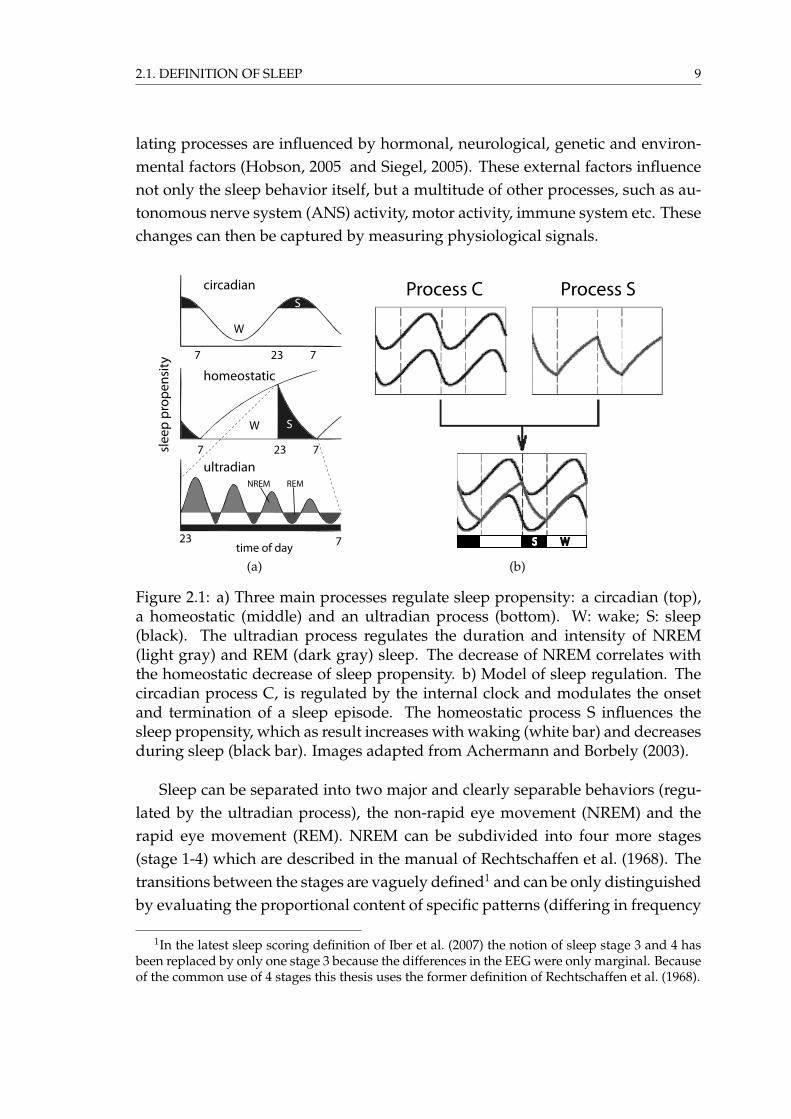
Achermann and Borbély (1990) and Borbély (1982) suggested that sleep isregulated in the brain by three main processes:
• A circadian rhythm determines the periods of the day with high and lowsleep propensity (Figure 2.1a top).
• A homeostatic process, which is defined by the prior amount of sleep, de-termines the need for sleep (sleep propensity; Figure 2.1a middle).
• An ultradian (cycles of less than 24 hours) process, which regulates thechronology of different sleep stages (Figure 2.1a bottom and Figure 2.2b;see also the explanations in the text below).
The corresponding mathematical models of sleep regulation (Achermann andBorbely, 2003) suggest that sleep pressure increases during waking and is re-duced during sleep. The independent circadian process modulates the upper andlower threshold for the homeostatic process (Figure 2.1b). This threshold marksthe beginning and ending of sleep pressure accumulation. The three sleep regu-
2.1. DEFINITION OF SLEEP 9
lating processes are influenced by hormonal, neurological, genetic and environ-mental factors (Hobson, 2005 and Siegel, 2005). These external factors influencenot only the sleep behavior itself, but a multitude of other processes, such as au-tonomous nerve system (ANS) activity, motor activity, immune system etc. Thesechanges can then be captured by measuring physiological signals.
NREM REM
23 7time of day
slee
p pr
open
sity
W S
23 77
homeostatic
23 77
W
Scircadian
ultradian
(a)
S W
Process C Process S
(b)
Figure 2.1: a) Three main processes regulate sleep propensity: a circadian (top),a homeostatic (middle) and an ultradian process (bottom). W: wake; S: sleep(black). The ultradian process regulates the duration and intensity of NREM(light gray) and REM (dark gray) sleep. The decrease of NREM correlates withthe homeostatic decrease of sleep propensity. b) Model of sleep regulation. Thecircadian process C, is regulated by the internal clock and modulates the onsetand termination of a sleep episode. The homeostatic process S influences thesleep propensity, which as result increases with waking (white bar) and decreasesduring sleep (black bar). Images adapted from Achermann and Borbely (2003).
Sleep can be separated into two major and clearly separable behaviors (regu-lated by the ultradian process), the non-rapid eye movement (NREM) and therapid eye movement (REM). NREM can be subdivided into four more stages(stage 1-4) which are described in the manual of Rechtschaffen et al. (1968). Thetransitions between the stages are vaguely defined1 and can be only distinguishedby evaluating the proportional content of specific patterns (differing in frequency
1In the latest sleep scoring definition of Iber et al. (2007) the notion of sleep stage 3 and 4 hasbeen replaced by only one stage 3 because the differences in the EEG were only marginal. Becauseof the common use of 4 stages this thesis uses the former definition of Rechtschaffen et al. (1968).

10 2. SLEEP, WAKE AND FATIGUE
and amplitude) in the brain wave measurements (electroencephalogram (EEG);Figure 2.2b left). Stage 1 and 2 are also often referred to "light sleep" and stage 3and 4 to "deep sleep" or "slow wave sleep" that is characterized by an increasedsynchronization of brain activity (see also Section 2.2.1). During overnight sleep,as part of the ultradian process, a person undergoes a repeated succession of thesestates (stages 1-4 and REM) as shown in the example hypnogram in Figure 2.2b.The duration of slow wave sleep is continuously reduced in each cycle and theduration of REM increased (Figure 2.1a and 2.2b). One cycle lasts about 60 min-utes in humans. The cycles can be interrupted with awakenings. After wake-up,the subject needs to go again through stages 1-2 to enter slow wave sleep. Fre-quent awakening (for a multitude of reasons, e.g. noise, obstructive sleep apnea)may limit the amount of deep sleep a person can get and results in poor sleepquality. Depending on the wake-up frequency, this anomaly can become a sleepdisorder with severe consequences (e.g. daytime sleepiness).
1
2
3
4
5 sec
200
uV
(a)
wake
REM
1
2
3
4
1 2 76543 8hours
NRE
M
(b)
Figure 2.2: a) Brain wave patterns (EEG) associated with the different NREMsleep stages 1-4. The amount of low frequency delta waves (0.5 to 4 Hz) increaseswith sleep stage (Stage 3 and 4 contain more than 50% of delta waves). A K-complex can be observed in the stage 2 as high amplitude impulse and sleepspindles as two high frequency bursts (squares). b) Hypnogram showing thesleep architecture of a typical night of a healthy subject caused by the ultradiansleep regulating process. An awakening during sleep requires the subject to passfirst the light sleep stages (stage 1+2) to fall into deep sleep (stage 3+4). Figuresadapted from scholarpedia.org (2009).

2.1. DEFINITION OF SLEEP 11
2.1.1 Sleep Debt
The human body requires a certain amount of sleep to function effectively. Whenfor whatever reason, the number of sleep hours are reduced, sleep debt is ac-cumulated. Sleep debt is defined as the difference between the hours of sleepa person needs (obligatory core sleep) and the hours of sleep a person actuallygets (exceeding the top threshold of the circadian component in Figure 2.1b). Itis the cumulative build-up of the sleep pressure (Van Dongen et al., 2003). Theselost hours of sleep need to be replaced. Under sleep debt, the sleep propensityis increased. The larger the sleep debt, the stronger the tendency to fall asleepand the more the probability for microsleep (short, involuntary attack of sleepwith complete loss of attention) increases (Dinges, 2004). The effects of sleep debtvary periodically with the circadian cycle, but do not disappear by themselves.Sleeping is the only way to reduce sleep debt (Van Dongen et al., 2003).
How much core sleep a person really needs, has not been clearly identifiedand may vary considerably between subjects (Naitoh, 1992). But it has beenhypothesized that it lies around 4-5 hours per day, which can also be taken inshort duration sleep segments equally distributed over the day (polyphasic sleep,Stampi (1992)).
The state of being under increased sleep debt is called sleep deprivation. Sleepdeprivation is either identified by measuring the time needed to fall asleep or byusing questionnaires. The Multiple Sleep Latency Tests (MSLT) are used to mea-sure the time needed to fall asleep in sleep-favorable conditions (in bed, dark-ness). The Maintenance of Wakefulness Test (MWT) measures the capacity tostay awake when placed in conditions theoretically ideal for falling asleep. Bothtechniques give indications about the severity of sleep deprivation and the prob-ability for microsleep occurrences.
2.1.2 Sleep Inertia
Sleep inertia is the feeling of sleepiness after awakening and is expressed by atemporary reduction in the ability to perform even simple tasks efficiently. Sleepinertia can last from 1 minute to 4 hours, but typically lasts 5-30 minutes (Tassiand Muzet, 2000). The severity of sleep inertia is dependent on how long theperson was asleep and the stage of sleep at awakening (most severe when wakingup from deep sleep). Effects can be even more severe if a person is very sleepdeprived. However, sleep inertia can usually be reversed within 15 minutes by

12 2. SLEEP, WAKE AND FATIGUE
activity and noise. Sleep inertia can cause impairment of motor and cognitivefunctions and can affect a person’s abilities, for example to drive safely. Sleepinertia can be very dangerous for people who have to perform risky tasks shortlyafter waking up from deep sleep or a nap, for example night call service.
Sleep inertia is determined with performance measurements: simple or com-plex reaction time, grip strength, steadiness and coordination, perception tasks,memory tasks, logical reasoning and a number of cognitive tasks, such as mentalarithmetic. It is also hypothesized by Kräuchi et al. (2004) and Tassi and Muzet(2000) that EEG shows a higher synchronization during sleep inertia than in nor-mal wakefulness (reduced alpha (high frequencies) and presence of theta brainwaves like in sleep stage 1).
2.2 Differentiation between Sleep and Wake
The transition between the wake and the different sleep stages is fuzzy and itsdetection not easy (Ogilvie, 2001). Human experts who analyze signal patternsvisually can have an inter-rater agreement lower than 80% (Danker-Hopfe et al.,2004). Davis et al. (1937) started to analyze electroencephalograms (EEG) to iden-tify the transitions of sleep. Since then, measurements of (electro-) physiologicalparameters for sleep discrimination have become more and more popular. Recht-schaffen et al. (1968) published a sleep scoring manual that was used in medicalsleep analysis until it was refreshed in Iber et al. (2007). The scoring is based onthe measure of brain waves called electroencephalography (EEG), the measureof eye movements called electrooculography (EOG) and the measure of electricalmuscle activity called electromyography (EMG) and is widely known as poly-somnography (PSG). PSG is the gold standard in medical sleep screening. Mostof the time, PSG also includes recordings of other physiological signals to identifysleep disorders.
Signals for sleep and wake discrimination typically have either origin in thecentral nervous system (EEG, EOG, EMG) or the autonomic nervous system ac-tivity (ECG, blood pressure, respiration, skin conductance, temperature). Someobservation methods rather rely on behavioral detection of sleep (motor activity,video, pressure systems) which cannot be associated clearly to one of the two ner-vous system activities. In the following sections we discuss in more detail eachsleep recording method and present state-of-the-art discrimination techniques foreach method.

2.2. DIFFERENTIATION BETWEEN SLEEP AND WAKE 13
2.2.1 Physiological Methods
Electroencephalogram (EEG)
The measurement and frequency analysis of brain waves is so far the most accu-rate and important sleep / wake discriminative method (Carskadon and Dement,1989). It has been introduced by Davis et al. (1937) for the human sleep/wakediscrimination and allows in combination with EOG and EMG the distinction ofwake and sleep stages (1-4 and REM, Rechtschaffen et al. (1968)). The basic differ-ence between wake and sleep stages is observed in the frequency spectrum andamplitude of the brain potentials. These differences are not always clear-cut andit is possible that the behaviorally perceived sleep-onset does not coincide withthe changes in the EEG patterns (Carskadon and Dement, 1989). Typical EEGpatterns that can be observed during NREM are (see also Figure 2.2a) theta (4 to 7Hz) and delta waves (high voltage slow waves, 0.5 to 4 Hz), sleep spindles (12 to16 Hz) and K-complexes (high voltage bursts). Normal wake and REM is mainlycharacterized by alpha waves (8 to 13 Hz).
However, EEG also displays some crucial difficulties in measuring the elec-trical activity of the brain. Due to the very low potentials (range of micro Volts)measured on the scalp, it is extremely vulnerable to technical and physiologicalartifacts. Common sources of artifacts are other and stronger electrical poten-tials across the body coming from eye movements, heart rate or muscle activity.Motion artifacts and electromagnetic fields are serious noise sources too. Auto-mated analysis of the EEG signals without complex filtering and signal rejectionbecomes therefore almost impossible. Besides the artifacts and noise, the appli-cation of the necessary gel-electrodes (minimum 5) on the scalp is cumbersomeand uncomfortable for the subject. As the placement of the electrodes is crucial(location and contact quality), it must be done by a trained professional. The du-ration of recordings without changing gel electrodes or loosing quality is limitedto approximatively 12 hours which makes long-term measurements nearly im-possible. All these factors are reasons for recording EEG mainly in controlledenvironments like hospitals and research laboratories.
EEG (and also EOG and EMG) analysis can be automatized with rule basedand machine learning algorithms. An automated analysis is typically composedof (Penzel and Conradt, 2000)
a) a removal of artifacts and noise (filtering step);
b) feature extraction and waveform recognition (preprocessing step); and

14 2. SLEEP, WAKE AND FATIGUE
c) a classification step.
The filtering step typically consists of removing wave patterns not belongingto the brain activity, such as heart rate, eye movements or electromagnetic noise.
Traditionally, the preprocessing step consists of a spectral analysis of the EEG,either with Fast Fourier Transformation (FFT) algorithms or with more advancedwavelet based transformations (Penzel and Conradt, 2000). Additional featuresare then extracted to reduce the dimension of data. Typical features can be am-plitudes or the power of specific frequencies.
For the classification of EEG signals, a vast number of algorithms have beensuggested2. A big success has been shown by Artificial Neural Networks (ANN)(review by Robert et al., 2002, 1998) and ANN derived methods, probably be-cause they are relatively easy to implement and theoretically they can solve anynonlinear classification problem.
Electrooculogram (EOG)
EOG is mainly used to detect eye movement patterns associated to the transitionof wake to sleep (such as the slow rolling of the eyes) and the REM stage (rapideye movements). There is no particular work that analyzes EOG signals of dif-ferent NREM sleep stages. Recordings of EOG show similar problems as EEG,whereas the EOG potentials are larger and therefore easier to measure. How-ever, as the electrodes have to be placed on the forehead and temple (with lessprecision than EEG), the sensors cannot be hidden and the measurement is moreintrusive than EEG for the subject.
Electromyogram (EMG)
In polysomnography, EMG is routinely measured from below the chin to detectthe REM sleep phase (low tonic level) and sleep onset (continuous reduction oftonus). However, EMG can theoretically also be measured from other muscles,which is less intrusive for the subject and the changes in the signal pattern maybe more pronounced at sleep onset at these locations. The problems of EMG aresimilar to those of EOG. An automatic analysis of EMG signals uses frequencyspectrum and the signal power features.
2At the time of writing, a search on the PubMed database (PubMed, 2009) gave over 100 pub-lications for the search terms {automated, EEG, sleep, analysis }.

2.2. DIFFERENTIATION BETWEEN SLEEP AND WAKE 15
2.2.2 Cardiovascular Measurements
Heart rate (HR) is derived from the electrocardiogram (ECG) and well known todecrease at sleep onset. Pivik and Busby (1996) have shown that HR decreaseswith adolescents 30 seconds before entering sleep stage 1. The heart rate vari-ability (HRV) is the change of inter-heartbeat intervals and its change duringsleep has been intensively studied by many research groups (Bonnet and Arand,1997 and Burr, 2007 and Scholz et al., 1997 and Shinar et al., 2006 and Telseret al., 2004). HRV is directly linked to the autonomic nervous function, which alsovaries over different sleep stages. It is common to analyze the power spectrumof a high frequency (0.15 - 0.5 Hz), low frequency (0.04 - 0.15 Hz) and a very lowfrequency (0.005 - 0.04 Hz) band. Redmond and Heneghan (2006) used similarfrequency bands for the automatic sleep stage classification with a probabilisticclassifier. However, due to differences in the methods used to calculate HRV, theresults are sometimes contradictory (Malik et al., 1996). A wearable applicationof this technique is difficult, but has been suggested by Bianchi et al. (2006).
Another cardiovascular derived measurement is the peripheral arterial tone(PAT). PAT reflects the sympathetic tone variations of the ANS and can be mea-sured by capturing the change of the pulsatile arterial volume at the finger (Schnallet al., 1999). Like the HRV, the PAT signal has potential to differentiate betweenREM and NREM sleep (Bresler et al., 2008) and deep and light sleep (Herscoviciet al., 2007). The WatchPATTM-200 (Itamar Medical, Israel; Figure 2.3) is the prod-uct integrating the sensor used in the mentioned PAT studies. This watch-likedevice connecting two finger sensors (PAT and blood oxygen saturation) can alsobe used to discriminate between sleep and wake (Hedner et al., 2004). However,sleep / wake discrimination is based solely on actigraphy (see Section 2.2.3). Themajor drawback of this system is that the finger sensors are intrusive and impairthe maneuverability of the wearer.
Respiration
An experiment by Naifeh and Kamiya (1981) has shown that the process under-lying sleep onset is also closely linked to the regulation of respiration. Trinderet al. (1997) have shown that when respiration was reduced at sleep onset, EEGpatterns also shifted from high to low frequency. Redmond and Heneghan (2006)used respiratory-derived features together with a multitude of ECG-derived fea-tures for the automatic classification of three sleep states (wake, REM, NREM)in subjects with obstructive sleep apnea. The advantage of using cardiorespira-

16 2. SLEEP, WAKE AND FATIGUE
Figure 2.3: The WatchPATTM-200 measures blood oxygen saturation, peripheralarterial tone and activity to discriminate sleep stages and respiratory sleep disor-ders. It is designed to be used in ambulatory sleep monitoring to detect obstruc-tive sleep apnea, the most frequent sleep disorder. From Itamar (2009).
tory signals lies in the potential use in a portable system, the usefulness of thesesignals for sleep disorder detection and that the sensors can be applied by inex-perienced users. Respiration is either measured by airflow detection or by chestand abdomen efforts. Respiratory measurements are commonly used in PSG todetect sleep disorders.
Temperature
Temperature regulation in humans follows a circadian characteristic. As sleep isalso initiated by a circadian process (Section 2.1), a correlated variation is con-sequently observed. Body core temperature follows a sinusoidal circadian cycleand sleep onset is located where core temperature is decreasing and the wake-up is initiated when the core temperature is increasing (Czeisler et al., 1980 andGilbert et al., 2004). It is however not clear whether sleep and temperature reg-ulation are two distinctive processes regulated by the same circadian clock or ifsleep is controlled by a thermo-regulatory process. Kräuchi et al. (2004) showedthat distal skin temperature increased at sleep onset and had a dramatic decreaseat wake up (2 degree Celsius).
The problem with these temperature measurement studies is always that rela-

2.2. DIFFERENTIATION BETWEEN SLEEP AND WAKE 17
tively low temperature variations are measured that only can be detected whenthe experiments are conducted under tight laboratory conditions, for examplewith a constant ambient temperature and a constant activity level of the subject.Outside the laboratory, the temperature variations induced from the environmentare similar to the variations detected under strict conditions and can hardly bedistinguished. Core temperature is difficult to measure and a reliable measure-ment is only possible with invasive methods (rectal or intravenous probes) sofar.
Skin Conductance (SC)
Hori (1982) showed that the sleep onset time was accompanied by a decrease inskin potential level measured on the palm. In the study of Shiihara et al. (1998)the changes in skin conductance have been associated with the sleep durationand the differentiation of sleep habits in 32 subjects. Despite these findings, it isunclear how specific this measure is to sleep, as similar changes were observedfor stress (Picard, 1998). For sleep / wake discrimination, no automated analysisof SC has been proposed for far.
2.2.3 Active and Passive Behavior Based Detection
Questions and Tests (Active)
Active behavioral sleep tests consist of simple tests, randomly distributed in time,which require a response from the subject. Ogilvie and Wilkinson (1984) wereasking the question "Are you awake?" and the subject had to respond with abutton. Failing to do so was considered as being asleep. It has also been shownthat reaction time correlates with the changes in EEG during the process of fallingasleep (Hori et al., 1994).
The disadvantage of these active techniques is that they cannot be conductedcontinuously and the detection resolution corresponds to the (random) samplinginterval. Further, the procedure of active behavioral tests may prevent the subjectfrom falling asleep or wake him/her up.
Activity (Passive)
In home environments, where PSG is typically not available, physicians rely onactigraphy for sleep monitoring (Sadeh and Acebo, 2002). In this method, the ac-

18 2. SLEEP, WAKE AND FATIGUE
celerations of the extremities (typically the wrist) are recorded over several dayswith a watch-like device using miniature accelerometers and a storage medium.Periods of low activity are later classified as sleep by off-line computer process-ing. Many different classification algorithms have been suggested (Cole et al.,1992 and de Souza et al., 2003 and Hedner et al., 2004 and Jean-Louis et al., 1996and Lotjonen et al., 2003 and Sadeh et al., 1994), but often they cannot cope withthe problem of misclassifying low activity tasks like reading and watching tele-vision or the case where the sensor band is not worn (de Souza et al., 2003 andSadeh and Acebo, 2002). In particular, sleep time is overestimated for subjectswith low daily activity patterns, which may lead to wrong diagnosis. Further,even if actigraphy gives a good estimation of global sleep patterns, it is not suf-ficiently accurate to detect and diagnose sleep related disorders (Ancoli-Israelet al., 2003 and Sadeh and Acebo, 2002). As activities other than sleeping areassociated to low activity, postprocessing of the data is needed (Cole et al., 1992and Hedner et al., 2004 and Jean-Louis et al., 1996 and Webster et al., 1982). Typ-ically, this induces discrepancies higher than 10 minutes which is not suitable foron-line applications where reactivity of the system is important.
Recently, alarm clocks using accelerometers have been commercialized (Axbo,2008 and Sleeptracker, 2007). Activity is used to detect the best sleep phase foreasy wake-up in a given time window (10 to 30 minutes). However, the devicesare only active at night and the clocks cannot calculate sleep duration (see alsoSection 2.5.3).
The most recent development in actigraphy for sleep detection is the Vivago R©
Active multi-functional watch shown in Figure 2.4. The watch detects if the useris active and displays activity histograms on the screen. A newly developed algo-rithm by Lotjonen et al. (2003) detects sleep on-line. Unfortunately, the algorithmhas not yet rigorously been tested and compared to previously presented acti-gaph algorithms.
Observation (Passive)
Direct observation, or more frequently video analysis, is part of every PSG andcomplementary to the physiological recordings. Many behavioral effects of sleepcan be observed on video like posture, movements, eye movements and musclerelaxation effects (twitching). However, the time resolution of this behavioralobservations is limited. The analysis of the video has to be done manually andis less accurate compared to the automated EEG methods (Closs, 1988 and Cole

2.2. DIFFERENTIATION BETWEEN SLEEP AND WAKE 19
Figure 2.4: Vivago R© Active. An actigraphy based wellness watch that displayspast activity, sleep histograms and statistics on the screen. Image from Vivago(2009).
et al., 1992 and Ogilvie, 2001). Automated video analysis has been suggested byOkada et al. (2008), but the proposed method has only been tested on one childso far.
Pressure Systems (Passive)
The effects of muscle relaxation at sleep onset have been identified in early studiesof sleep research (Blake et al., 1939). The inability to maintain body tension duringsleep has since been used as a passive indicator of sleep. The effect of relaxationis visible in the EMG and occurs a few seconds (1-25) after the EEG alpha waveshave disappeared. The most known application of this sleep behavior detectionis the "dead man pedal/switch". Such a pedal has to be maintained during themanipulation of a machine at half level. If the operator is, for whatever reason,loosening control of muscles, the pedal is either released or fully pressed and analarm goes off. As an example, dead man pedals are installed in every operatorstand of Swiss train cabins to detect if the train operator is conscious and alert. Inthis particular case, the pedal is combined with an active behavioral test, whichrandomly requires response to an auditory signal.
The main disadvantage of dead man pedal’s and similar is the incapability todistinguish sleep from other muscle relaxing/blocking behaviors such as cerebralattacks and show therefore low validity. Further, the continuous or very frequentrequirement of holding a pedal or a switch restricts the maneuverability of thesubject and limits time resolution.

20 2. SLEEP, WAKE AND FATIGUE
2.3 Sleepiness, Attention and Fatigue
Sleepiness (or drowsiness) can be defined as a precursor of sleep onset. It can beseen as a process of increasing loss of attention. Fatigue is a phenomenon of phys-ical and psychological tiredness which also includes sleepiness. But fatigue canalso have other sources than sleepiness, such as boredom, mental and physicalexhaustion, chronic or genetic diseases and others. For a more complete discus-sion of sleepiness and fatigue, the reader is referred to Lal and Craig (2001) andShen et al. (2006).
Fatigue and sleepiness have a big effect on people’s life style, wellness andhealth (Schmid et al., 2007 and Spiegel et al., 2005, 2002). They have also beenidentified as a major source for accidents in transportation and hazardous oper-ator settings (Akerstedt, 2000 and Dinges, 1995) (see also Chapter 1). The rea-son for fatigue detection technologies were precisely summarized in Dinges andMallis (1998). The subjective fatigue estimations are known to be unreliable andbecause the technology advances have made the detection of fatigue possible, theuse of technology is an alternative to the regulation of work and rest hours.
Sleepiness is measured with attention test such as the very well establishedPsychomotor Vigilance Test (PVT) developed by Dinges et al. (1985). Increasedsleepiness can also be observed in the presence of slow wave patterns in the EEG(similar to sleep stage 1), which is normally during wake dominated by alphawave patterns (review by Lal and Craig, 2001). Note that the subjects’ motivationhas an impact on the subjective estimation of sleepiness and fatigue and it alsoinfluences the outcome of sleepiness tests (Limor et al., 2009). Therefore, a sleepi-ness or fatigue evaluation device should also include sleep history, which couldqualify sleepiness more objectively.
2.4 Fatigue Management
As fatigue and the associated increased sleepiness level correlates with a higheraccident risk of persons, in many industrialized countries federal laws regulatethe work, rest and/or sleep times for workers in risk domains. This can be a pro-tection for them when operating in a hazardous environment (as it is typically thecase for shift workers) and also a protection of the persons in the operator’s envi-ronment. In transportation, they can be other road users or passengers of publictransport. However, regulating the hours of sleep and work does not necessarilyguarantee that the worker can maintain a high attention for the whole duration

2.4. FATIGUE MANAGEMENT 21
of his work. For example, alcohol intake or a severe sleep disorder can reducethe recovering power of sleep and the worker cannot reach the required attentionlevel for his task.
In the last two decades, federal safety boards, insurance institutions and theinvolved industries started to search for more effective ways to measure andmanage fatigue of workers. This lead to a significant amount of research andproduct developments in the fatigue management field. Dinges and Mallis (1998)classified the fatigue detection and prediction technologies into four classes:
a) Readiness-to-perform technologies (or fitness-for-duty);
b) Vehicle-based performance technologies;
c) In-vehicle, on-line, operator status monitoring technologies; and
d) Mathematical models of alertness dynamics, joined with ambulatory tech-nologies.
A short summary of these technologies is presented in the next sections. For anextended review of these technologies and existing systems we refer to Barr et al.(2005) and Hartley et al. (2000) and Williamson and Chamberlain (2005).
2.4.1 Readiness-to-perform Technologies
Fitness-for-duty or readiness-to-perform approaches consist of performance orphysiological tests, which evaluate the level of alertness and vigilance of a subjectat a given time and extrapolate this to an upcoming time frame. The tests seekto detect impairment due to a sleep loss or active substance intake and in caseof incapacity alert the subject or the supervisor before the work is performed.The tests can consist of psychomotor tests, eye tracking or combination of these(overview in Hartley et al., 2000).
The tests are relatively easy to conduct and can be done with portable devices.The detection of low attention due to a lack of sleep is quite good. However, theyshow a major drawback: The tests give only a snapshot of the subjects’ alertnessat a given time and the predictive capacity of the tests is very limited. They do notsufficiently account for the subjects’ increase of fatigue over time, which resultsfrom task complexity, a circadian low or increased sleep debt.
22 2. SLEEP, WAKE AND FATIGUE
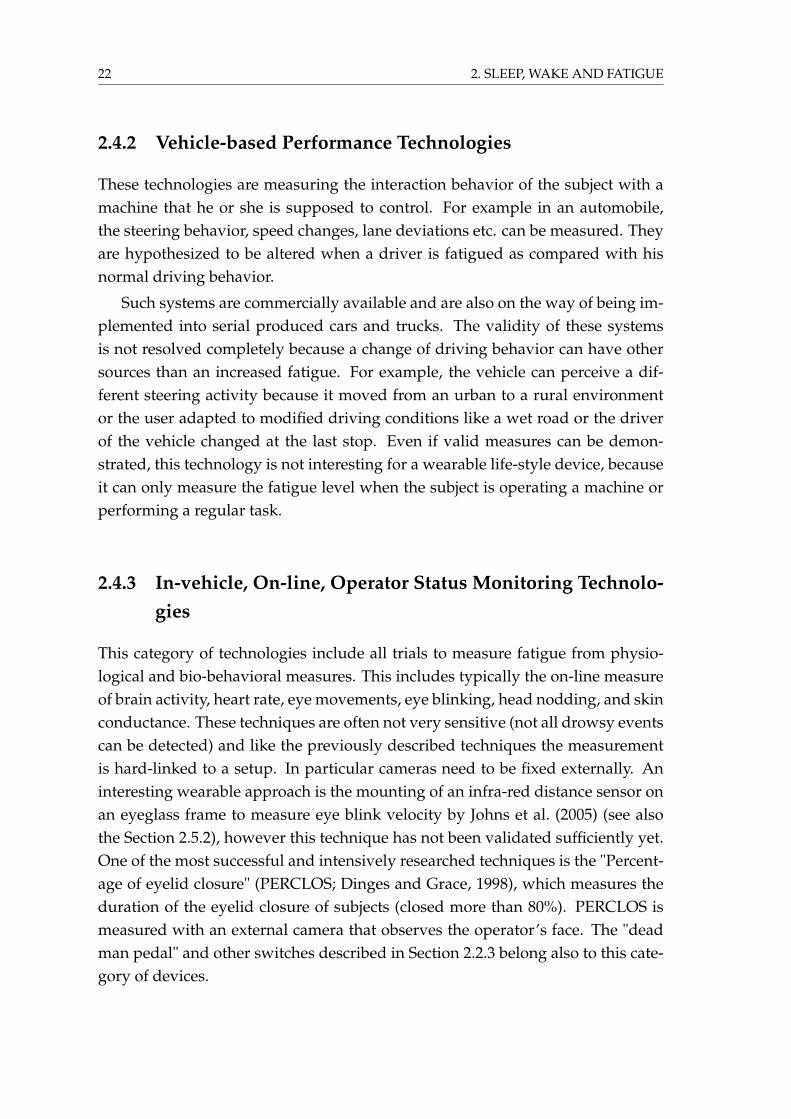
2.4.2 Vehicle-based Performance Technologies
These technologies are measuring the interaction behavior of the subject with amachine that he or she is supposed to control. For example in an automobile,the steering behavior, speed changes, lane deviations etc. can be measured. Theyare hypothesized to be altered when a driver is fatigued as compared with hisnormal driving behavior.
Such systems are commercially available and are also on the way of being im-plemented into serial produced cars and trucks. The validity of these systemsis not resolved completely because a change of driving behavior can have othersources than an increased fatigue. For example, the vehicle can perceive a dif-ferent steering activity because it moved from an urban to a rural environmentor the user adapted to modified driving conditions like a wet road or the driverof the vehicle changed at the last stop. Even if valid measures can be demon-strated, this technology is not interesting for a wearable life-style device, becauseit can only measure the fatigue level when the subject is operating a machine orperforming a regular task.
2.4.3 In-vehicle, On-line, Operator Status Monitoring Technolo-gies
This category of technologies include all trials to measure fatigue from physio-logical and bio-behavioral measures. This includes typically the on-line measureof brain activity, heart rate, eye movements, eye blinking, head nodding, and skinconductance. These techniques are often not very sensitive (not all drowsy eventscan be detected) and like the previously described techniques the measurementis hard-linked to a setup. In particular cameras need to be fixed externally. Aninteresting wearable approach is the mounting of an infra-red distance sensor onan eyeglass frame to measure eye blink velocity by Johns et al. (2005) (see alsothe Section 2.5.2), however this technique has not been validated sufficiently yet.One of the most successful and intensively researched techniques is the "Percent-age of eyelid closure" (PERCLOS; Dinges and Grace, 1998), which measures theduration of the eyelid closure of subjects (closed more than 80%). PERCLOS ismeasured with an external camera that observes the operator’s face. The "deadman pedal" and other switches described in Section 2.2.3 belong also to this cate-gory of devices.

2.4. FATIGUE MANAGEMENT 23
2.4.4 Mathematical Models of Alertness Dynamics Joined withAmbulatory Technologies
This approach involves the application of mathematical models that predict thesubject’s alertness at regular intervals based on sleep, circadian rhythm and otherfatigue related information. The relevant source information is either obtainedfrom devices that automatically monitor sleep or from log books. One can arguethat such systems represent a certain danger: A favorable output of such algo-rithms could mislead the subjects to increase their own work time. Like everymodel, it is only as good as the input values. Especially if the source informa-tion is imprecise and overestimates for example sleep duration, the error propa-gates through the model equations and the output may overestimate the subject’sreadiness to perform the given task.
The US Army Sleep Management System
The US Army Sleep Management System is a mathematical model based on the ef-fects of sleep deprivation periods and circadian cycles (Belenky et al., 1998). Itcalculates the degradation of performance by prolonged waking and the restora-tion of it by sleep. The model has been embedded into a wristwatch that measuresactivity. A sleep detection algorithm based on the detection of low activity pat-tern (Cole et al., 1992) calculates sleep times, which are used by the model for thealertness prediction. We discuss the device in Section 2.5.4. A major drawbackis the static model. A static model means that the watch does not distinguishbetween different users and will always indicate the same sleepiness level for agiven sleep history, independent of the user’s regular sleep durations and its cir-cadian phase shift. A successor of this model is called "Sleep, Activity, Fatigueand Task Effectiveness". It has been developed by the U.S. Department of De-fense (Balkin and McBride, 2005) and includes an additional model that allowsthe prediction of sleep inertia.
The Three-Process Model of Alertness
The Three-Process Model of Alertness has been developed by Akerstedt and Folkard(1995) and predicts alertness on a scale from 1 to 16. It is inspired by the model ofsleep regulation developed by Borbély and Achermann (1999) (see Section 2.1).A measure of sleep time is used as input to compute the effects of a homeostaticprocess and is then added up with a circadian process (Figure 2.5). Sleep inertia

24 2. SLEEP, WAKE AND FATIGUE
is added to the model as a third process. Besides alertness the model can also pre-dict the sleep latency (time to fall asleep). The model has been used by transportcompanies to analyze and plan shifts schedules for their drivers. With these ex-periences the model has continuously been updated (Åkerstedt et al., 2008), butso far it has not been used in a mobile device. The interest in this model lies in itsproximity to the real underlying processes of sleep and sleepiness. However, itdoes not take into account task dependent effects of fatigue (like monotony). Tocalibrate this model, a measure of the circadian component is needed. The com-ponent is heavily subject (and timezone) dependent and is difficult to measurenon-invasively with current sensor technologies.
sleepwake
Ale
rtne
ss le
vel
Time of day
S
CS+C
S’15
06 12 18 24 6 12
10
5
Figure 2.5: Sleep (S, S’) and circadian (C) components of the Three Process Modelof Alertness. The third process of sleep inertia is not shown. The arithmeticalsum S+C equals to the predicted alertness. Adapted from Åkerstedt et al. (2008).
2.5 Related Projects and Products
Only few existing wearable systems offer the functionality of detecting automat-ically the wearer’s fatigue or sleep over short or long term. In this section wepresent devices/projects which have a minimum degree of autonomous decisionmaking and are (potentially) wearable. An overview of portable and wearablesystems which are intended for recording physiological signals can be found inAppendix A.

2.5. RELATED PROJECTS AND PRODUCTS 25
2.5.1 Alertness Monitoring Helmet’s
A concept suggested by Kaefer et al. (2003) is to measure heart rate, head activity,eyelid closure and reaction time (by means of an auditory reaction test) with sen-sors mounted on a helmet. An "Alertness Monitoring and Control Unit" wouldintegrate the signals from the sensors, perform the measures and output alertnessinformation. Figure 2.6 shows an idea of a prototype. The project never exceededthe concept phase.
(a) (b)
Figure 2.6: Examples of alertness monitoring helmet concepts: a) Alertness mon-itoring helmet concept suggested by Kaefer et al. (2003); b) Alertness monitoringearphones concept suggested by Matsushita et al. (2006).
A similar approach is the head nodding detector from Matsushita et al. (2006).It is composed of a headset with an on-board 2-axis accelerometer and fatigue isestimated based on typical head nodding patterns when the user stands still for30 seconds. These regular tests seem to disturb the subject’s regular task seriously.An evaluation of the device by giving detection accuracy or other performanceparameters is missing.
2.5.2 Optalert
OptalertTM (Optalert, 2009) are glasses on which an infrared proximity sensor ismounted. The sensor measures eye blink amplitude and eye blink velocity. Theglasses connect over USB to a board computer that classifies the eye blink featuresinto a custom drowsiness scale. The system alerts the operator with auditory and

26 2. SLEEP, WAKE AND FATIGUE
visual alarms if the drowsiness increases above a certain threshold. So far, anin-depth validation and scientific analysis of the system is missing (Johns et al.,2005). This device is mentioned here, because the drowsiness classification couldbe easily embedded in a wearable device, which would make a general fatiguealarm device for a multitude of situations. However, glasses are a limited wear-able system because they are not worn during sleep.
Figure 2.7: OptalertTMalertness detection glasses. IR proximity sensors are mea-suring the velocity of the eyelid movements to estimate the alertness of thewearer. From Optalert (2009).
2.5.3 Gentle Wake-Up Devices
Two tiny, wrist worn devices called Axbo R© and Sleeptracker R© (Axbo, 2008 andSleeptracker, 2007) appeared recently on the market, which can be consideredas wearable sleep inertia reduction devices (Figure 2.8). They are designed towake up the wearer at the ’ideal time’ in the morning where he/she can get upeasily without being sleep drunken (see Section 2.1.2 sleep inertia). These ’gen-tle wake-up’ devices are functionally similar to actigraphs , which consist of awatch-like device that measures the acceleration of the wrist of the subject withtiny accelerometers (see also Section 2.2.3). They have a basic on-line processingcapability. In a user defined wake-up time window they check if the wearer is(almost) awake. If a limb movement event is detected with the accelerometer, thewearer is considered as awake. In such an event, the alarm goes off instantly tofacilitate the wake-up of the user. The accuracy and usefulness of such life-styledevices is controversial and does not work for all users equally. Most importantly,they are not able to detect whether a user is truly asleep.
We tested both devices inside the laboratory and users were unsatisfied. Com-

2.5. RELATED PROJECTS AND PRODUCTS 27
mon remarks were that the devices wake up too early (the Axbo has a fixed wakeup window of 30 minutes) and that the wake-up is not gentle at all.
Independent of the validity of both devices we can conclude that they haveonly limited interest for a wearable fatigue prediction system because they re-duce only a sub-phenomenon of fatigue which is the sleep inertia. Sleep inertiais very variable within persons and lasts under normal conditions between 5 and30 minutes after wake up.
(a) Axbo R© alarm clock (b) Sleeptracker R©
Figure 2.8: ’Gentle wake-up’ devices to increase alertness after wake-up based onaccelerometer recordings. From Axbo (2008) and Sleeptracker (2007).
2.5.4 US Army SleepWatch
The so far most interesting device that was described and tested in Dinges et al.(2005) is the SleepWatch R©. The SleepWatch R© is a wrist-worn actigraph that em-beds an algorithm for sleep management. This "Sleep Management Model" hasbeen developed by the Walter Reed Army Institute of Research (see Section 2.4.4).It estimates the users’ sleep in 1-minute intervals based on the actigraphy al-gorithm from Cole et al. (1992) that is described in more detail in Section 6.1.Based on the sleep / wake patterns collected over several days the Sleep Man-agement Model computed the total-sleep-time and the sleep-amount-per-day to

28 2. SLEEP, WAKE AND FATIGUE
output a performance index between 0 and 100%. The index is an estimationof the wearer’s performance (or performance-readiness) and displayed as a "fuelgauge" on the watch screen.
As this watch uses a model which is based on actigraphy inputs that areknown to overestimate the sleep duration (Section 2.2.3) and no other sensors areused to compensate this, it is suspected that the performance prediction mightbe largely influenced. Further, as the Sleep Management Model is dependent oncircadian parameters and these vary largely between subjects, it is not clear howthe watch can cope with these variations.
The only scientific study that was analyzing the SleepWatch R© (Dinges et al.,2005) tested the effects of the watch to the sleep behavior of truck drivers. Thestudy did not assess the validity and accuracy of the devices and also did notapply any of these criteria for the selection of the devices to study. The device isnot commercially available from the manufacturer.
Figure 2.9: SleepWatch R© device for the prediction of alertness indicated with a"fuel" gauge. From Dinges et al. (2005).
2.5.5 European Project SENSATION
SENSATION (Sensation-IST, 2009) is an European project that aimed to developnew sensor technologies for the real-time monitoring and prediction of wakeful-ness and fatigue. One of the main focuses was the development of nano- andmicro-sensors for brain and autonomic function monitoring. The resulting sen-sors for brain activity monitoring are based on carbon-nanotubes and can be usedwithout gel which is a great step toward wearable EEG electrodes (Ruffini et al.,

2.6. CONTEXT AWARENESS AND PERSONAL HEALTH 29
2007). A product called ENOBIO R© is using this technology and is in its launchingphase for commercialization (Starlab, 2009). However, it is far away from beingnano or micro sized (Figure 2.10, the price is estimated to 6000 CHF and the du-ration of use is limited to 6 hours. A rigorous scientific validation is missing sofar and the implementation of the complete sleepiness detection system requiresa PC and is therefore not wearable at all.
Figure 2.10: ENOBIO R© gel-less sensor system for EEG measurement and on-linesleepiness prediction developed during the European project SENSATION. FromStarlab (2009).
2.6 Context Awareness and Personal Health
Recently, research groups started to focus on human centered, context aware com-puter systems. So called pervasive systems are usually embedded into the user’senvironment and make assumptions about the user’s situation in real time andrespond appropriate and in an adaptive way to these situations. These conceptswere extended to wearable devices to facilitate the all-day life of the user in di-verse application fields such as communication (Biever, 2004 and Schmidt et al.,1999), education (Sung et al., 2005), manufacturing (Stiefmeier et al., 2008), navi-gation (Wilson et al., 2007), nutrition (Amft et al., 2004) and health care (Bonato,2005 and Lukowicz, 2008) by giving appropriate on-line feedback to the userwith a mobile device.
The application of context aware, personalized systems to health care andbiomedical applications is particularly interesting because it can potentially solve

30 2. SLEEP, WAKE AND FATIGUE
one of the main challenges of heath care in industrialized societies: Rapidly in-creasing costs of screening, prevention of chronic diseases and the assistance toelderly people (Korhonen and Saranummi, 2007 and Martin et al., 2000). Further,because of age, gender and physiological differences in patients, medical analysisand assistance often needs an adapted solution to the user and should not onlybe given in specialized centers, but everywhere. While an intelligent wearablesystem can provide a continuous motivation for the individual to recover3, it isclear that the contact with human experts and caregivers will still be necessaryand should not be underestimated. Several European projects (under the activityof e-health) took up the idea of continuous monitoring and personalized diag-nosis, therapy and feedback for a multitude of diseases such as cardiovascular(Amft and Habetha, 2007 and MyHeart-IST, 2009), stress and fatigue (Sensation-IST, 2009, see also Section 2.5.5) or just monitoring of vital signs (Wealthy-IST,2009). Another approach aims to assist caregivers with patient personalized tools(PIPS, 2009). All these projects have in common to rely on some kind of wear-able/portable system to sense and process localized information and to transmitit further to centralized databases where human experts can access it and takedecisions. This means that the personal profiles are not generated locally on thedevice, but with the help of professional support externally and are mostly trans-mitted over the Internet. This raises concerns for privacy and dependability ofservice providers, which have not been solved yet. A system with locally em-bedded intelligence may reduce these concerns and can involve the subject to thehealth process in a higher degree.
Two categories of electronic wearable devices were commercially successfulso far (Gerasimov, 2003): Personal electronic assistive devices (watches, photocameras, etc.) and personal electronic monitoring devices (pacemakers, holtersystems, etc.). A third emerging class of devices is in between these two cate-gories and usually has the look of a watch or a mobile phone, but can displayand collect some additional information for example pulse rate, geo-location ordirections. Extending this category of inexpensive consumer electronic devicesto personal health systems is probably the most promising way to reach user ac-ceptance.
Particularly interesting is the detection of sleep and wake states and related fa-tigue of the user with a personalized wearable system because of the pronounced
3It is considered that the chronic diseases like cardiovascular, stress, asthma, etc. are largelylinked to the person’s lifestyle. If lifestyle can be altered with education and coaching, the proba-bility of recovery is increased and the cases of recurrences reduced.

2.7. WEARABLE FATIGUE PREDICTION APPROACH 31
difference of sleep behavior and physiology (see Section 2.1). Hospitals and sleepcenters have high costs and have already long waiting lists. It is estimated that30% of the general population exhibit a sleep disorder but the majority are notaware of having such or do not seek help (Committee on Sleep Medicine and Re-search, 2006). With the current infrastructure and screening costs, it is not possibleto identify and take care of all the potential patients. The lack of sleep representsa serious health problem (Committee on Sleep Medicine and Research, 2006). Theincreased daytime sleepiness causes fatigue and has severe consequences on theroad safety (Akerstedt, 2000). A comfortable and lightweight wearable systemmay tackle parts of these problems. For example by detecting sleep troublesearly (prevention of causes) or by detecting lack of sleep and increased fatigue(prevention of effects).
2.7 Wearable Fatigue Prediction Approach
If we want to continuously assess a fatigue or sleep profile of persons for a health-ier lifestyle and risk reduction, a wearable solution which does not influence thepersons’ comfort is a favorable approach. From the analysis of the previous de-scribed fatigue management classes it becomes clear that only a model of sleepi-ness combined with an accurate measure of the model’s input (typically sleepand circadian parameters) can be integrated into an embedded wearable device.Whereas the use of such a technology might be a good solution for the predictionand prevention of fatigue, it is not recommended to use it as alertness system foremergency sleep detection in risky environments. For this, an on-line, machine-dependent operator sleepiness detection system such as the techniques describedin Section 2.4.2 and 2.4.3 would be more appropriate. However, it is not excludedthat signals measured for the wearable sleep and fatigue prediction can also beused for the alarm generating system.
To conclude, a system for an accurate sleepiness prediction requires accu-rate information about previous sleep times, sleep durations and sleep quality.Amongst others, in this thesis the problem of measuring accurately sleep dura-tion and time with a wearable system will be addressed.

32 2. SLEEP, WAKE AND FATIGUE

3 The Problem of Automated,Wearable Sleep and Wake
Discrimination
Big Top c© 2004 Rob Harrell. Used by permission of Universal Press Syndicate.All rights reserved.
The sleep discrimination methods based on physiological signal recording de-scribed in Section 2.2.1 are normally carried out in controlled hospital or labora-tory environments and need medical assistance for setting up sensors, monitor-ing and analysis. Although the analysis is typically computer-assisted (Penzeland Conradt, 2000), it still requires a sleep expert and is therefore expensive andtime consuming. It is difficult to integrate PSG sensors into a wearable device,as they are rather bulky, power-consuming and highly susceptible to noise. Fur-thermore, EEG, EOG and EMG recordings require many electrodes to be gluedto the scalp and face, which make them very cumbersome and uncomfortable forthe user.
Portable and wearable devices and sensors exist that allow the recording ofone or more physiological parameters and that are potentially useful for sleepdiscrimination (Appendix A).
33

34 3. THE PROBLEM OF AUTOMATED, WEARABLE SLEEP AND WAKE DISCRIMINATION
None of the algorithms for automatic sleep discrimination that were presentedin Section 2.2 have been tested on data obtained from wearable devices. Thisand the absence of devices for automatic sleep / wake discrimination based onphysiological signals arise the following research questions:
• Which signals can be measured with a wearable device and have enoughquality for sleep / wake discrimination?
• Can an algorithm be designed to discriminate on-line sleep / wake stateson a wearable device?
• Can the use of physiological signals overcome the limitations of the behav-ioral measures of actigraphy or dead-man switches/pedals?
• How do inter-individual differences in physiology influence the classifica-tion accuracy with respect to the wearable recordings?
• Can such a wearable device be used in general public applications?
These are the main research questions that will be addressed in this thesis.The wearability of the system will be the crucial, but also the limiting factor. Ifthe system is intended to be used in preventive health and wellness applicationsas has been suggested in the introduction, it has to be low cost, comfortable andcomprehensive for the general public. The drawback of wearable systems it thatthey cannot reach the performance of immobile biomedical clinical systems. Theyhave reduced processing power and the energy resources are limited. More im-portantly, the quality (signal-to-noise ratio, artifacts, sampling rate, etc.) is dra-matically reduced in wearable sensors or some signals cannot be measured at all.
The question if signals can be recorded with wearable systems in an ambula-tory setup without having dramatic consequences on the sleep / wake classifica-tion is discussed in the next sections.
3.1 Useful Signals for Wearable Sleep and Wake Clas-sification
It is not clear from the literature, which signals do contain enough accurate infor-mation about sleep and wake, when they are recorded with a non-clinical deviceand which signals are consequently suitable for a wearable sleep detection de-vice. To answer this question, we decided to record a multitude of signals during

3.1. USEFUL SIGNALS FOR WEARABLE SLEEP AND WAKE CLASSIFICATION 35
sleep and wake states of a human subject using a commercially available andcertified portable recording system.
In a first step, it was not possible to record all potentially interesting signalswith a portable device. Therefore, the most interesting signals were selectedaccording the criteria of wearability (sensor integration), clinical accuracy andpower consumption.
A literature and market based pre-study showed that the acceleration mea-surements are the most efficient solution for a wearable system. Accelerometersare small, highly integrated and low-power and can be worn by virtually every-body. As the use of actigraphy for sleep research is well established, there was noneed to investigate it further with our preliminary recordings.
EEG measurements are seen as the signal patterns with the most accuratesleep / wake prediction capabilities. However, the difficulty to render the EEGsensors wearable and low power make them not adapted for a wearable device(see Section 2.5.5). We therefore did not select the EEG for the empirical mea-surement tests. We also resigned the measurement of blood oxygen saturation(SpO2), because it had little association to sleep, the measurement of peripheralarterial tone (PAT) because it was used to discriminate only between sleep disor-ders so far and this type of sensor technology is difficult to obtain, and the mea-surement of blood pressure (BP), because it cannot be measured continuouslyand non-invasively at the same time.
We decided to empirically determine the signal quality (noise susceptibility)of the ECG, EOG, EMG, respiration effort (RSP), SC, and distal skin tempera-ture signals when measured with a mobile device in a real-world setup. We alsoanalyzed the correlation with the sleep/wake behavior determined by a humanexpert from simultaneous video, EMG and EOG recordings. The comfort of thesensors for recording the above mentioned signals was also evaluated.
3.1.1 Recording System
The portable recording system that was used is called "Heally" and is producedby Koralewski Industrie Elektronik, Celle, Germany (Koralewski.de, 2008). TheHeally system is a medical certified system that uses different recording modules.It has previously been used by the European Space Agency (in a long-term projecton the International Space Station (ISS) called Health Lab/Neurolab) and in otherstress assessment studies in the field (Johannes et al., 2008). The system that wasused for our recordings consisted of three modules (Figure 3.1):

36 3. THE PROBLEM OF AUTOMATED, WEARABLE SLEEP AND WAKE DISCRIMINATION
Signal Abbreviation Sampling Rate Resolution[Hz] [bits]
Electrocardiogram ECG 100 12Electromyogram EMG 200 12Electrooculogram EOG 200 12Respiration RSP 50 12Skin conductance SC 10 12Finger temperature Temp 2 12Pulse Wave PW 100 12
Table 3.1: Sampling frequencies of physiological signals with the Heally record-ing system.
a) A master module for the configuration of the slaves, storing the data to theinternal Flash memory (16 MB) or sending it to a PC via a Bluetooth wirelesslink.
b) A slave module that records a 2-lead ECG with electrodes, distal tempera-ture, pulse wave, and skin conductivity with a finger probe and that had amarker button.
c) A second slave module that records respiration effort with an inductive beltaround the chest, EMG and EOG with electrodes.
The recording frequencies and the sampling resolution for the signals aregiven in Table 3.1. The system was powered by a nickel-metal hydride (NiMH)2.4V 2000 mAh cell pack that allowed an autonomy of 16 hours with the selectedmodules and configurations (Table 3.1). We chose not to use an additional EEGmodule, as the EEG recordings were judged to be too invasive and too suscep-tible to noise (see Section 3.1). Also, an additional module would have reducedthe autonomy of the system to below 12 hours. All sensors and electrodes wereconnected to the modules with cables. The electrodes for ECG, EMG and EOGwere gel electrodes and had to be glued to the skin. To give a more "wearable"feeling to the subjects a washable shirt was designed, onto which Velcro strapsfor easy attaching and removal of the cables and modules (Figure 3.1) were sewn.
3.1.2 Recordings
The initial measurements that were conducted were on a single male subject ofage 26 (hereafter referred to as subject A). We chose sampling frequencies f ac-

3.1. USEFUL SIGNALS FOR WEARABLE SLEEP AND WAKE CLASSIFICATION 37
Figure 3.1: Heally recording system mounted on a home-made shirt. 1) ECG gelelectrodes; 2) inductive belt sensor; 3) electronics modules; 4) NiMH battery. TheEMG and EOG electrodes as well as the finger sensor for SC, temperature andPW are not shown.
cording to the requirements for digitalized PSG (Penzel and Conradt, 2000).
The EMG was recorded from the right shoulder muscle trapezius (fEMG=200Hz). The EOG, which was measured with electrodes glued on forehead and tem-ple, was also sampled at 200 Hz, but it was only measured during the night, inorder not to disturb the subject too much during daily activities. A video of theupper part of the body was recorded during night-time.
In order to obtain an equal amount of data for both sleep and wake, the subjectwore the recording system for 16 hours per session. This recording time corre-sponded to the double of the average sleep time for the studied age group (Step-toe et al., 2006). The recording started approximately 4 hours before the regularbedtime of the subject. A total of eight recording sessions were carried out. Eachsession contained a mean of 8.15 ± 1.26 hours of sleep and 8.06 ± 2.04 hours ofwake. A total of 65.23 hours of sleep and 64.51 hours of wake were analyzed. Inthe case of sensor failure or detachment, the corresponding data segments werediscarded.
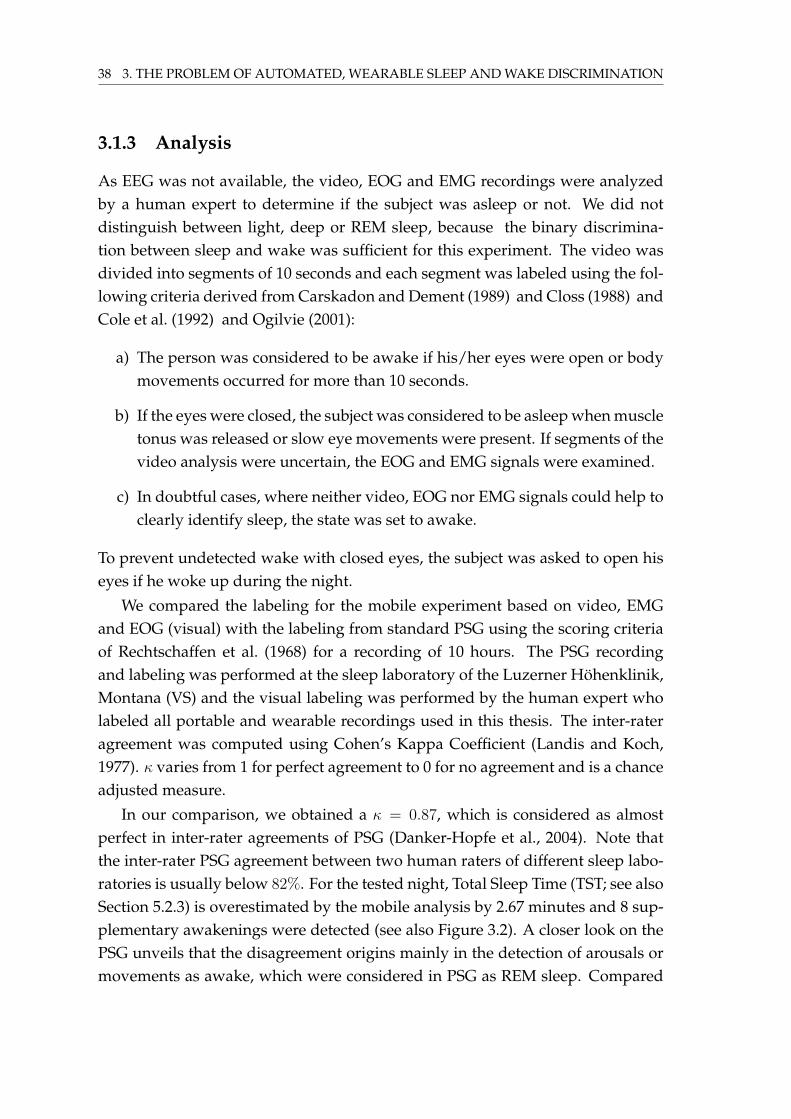
38 3. THE PROBLEM OF AUTOMATED, WEARABLE SLEEP AND WAKE DISCRIMINATION
3.1.3 Analysis
As EEG was not available, the video, EOG and EMG recordings were analyzedby a human expert to determine if the subject was asleep or not. We did notdistinguish between light, deep or REM sleep, because the binary discrimina-tion between sleep and wake was sufficient for this experiment. The video wasdivided into segments of 10 seconds and each segment was labeled using the fol-lowing criteria derived from Carskadon and Dement (1989) and Closs (1988) andCole et al. (1992) and Ogilvie (2001):
a) The person was considered to be awake if his/her eyes were open or bodymovements occurred for more than 10 seconds.
b) If the eyes were closed, the subject was considered to be asleep when muscletonus was released or slow eye movements were present. If segments of thevideo analysis were uncertain, the EOG and EMG signals were examined.
c) In doubtful cases, where neither video, EOG nor EMG signals could help toclearly identify sleep, the state was set to awake.
To prevent undetected wake with closed eyes, the subject was asked to open hiseyes if he woke up during the night.
We compared the labeling for the mobile experiment based on video, EMGand EOG (visual) with the labeling from standard PSG using the scoring criteriaof Rechtschaffen et al. (1968) for a recording of 10 hours. The PSG recordingand labeling was performed at the sleep laboratory of the Luzerner Höhenklinik,Montana (VS) and the visual labeling was performed by the human expert wholabeled all portable and wearable recordings used in this thesis. The inter-rateragreement was computed using Cohen’s Kappa Coefficient (Landis and Koch,1977). κ varies from 1 for perfect agreement to 0 for no agreement and is a chanceadjusted measure.
In our comparison, we obtained a κ = 0.87, which is considered as almostperfect in inter-rater agreements of PSG (Danker-Hopfe et al., 2004). Note thatthe inter-rater PSG agreement between two human raters of different sleep labo-ratories is usually below 82%. For the tested night, Total Sleep Time (TST; see alsoSection 5.2.3) is overestimated by the mobile analysis by 2.67 minutes and 8 sup-plementary awakenings were detected (see also Figure 3.2). A closer look on thePSG unveils that the disagreement origins mainly in the detection of arousals ormovements as awake, which were considered in PSG as REM sleep. Compared

3.1. USEFUL SIGNALS FOR WEARABLE SLEEP AND WAKE CLASSIFICATION 39
01:00 02:00 03:00 04:00 05:00 06:00 07:00 08:00
PSG
Visu
al
[hours]09:00
Figure 3.2: Comparison of polysomnography (PSG; dark gray) andvideo/EMG/EOG (visual; light gray) labeling of a sleep session. The PSGlabeling was performed by a professional sleep technician at the LuzernerHöhenklinik, Montana (VS) using the scoring criteria from Rechtschaffen et al.(1968). The visual labeling was done using the criteria for the mobile sleepexperiment that was used later for this study. The inter-rater agreement isconsidered as almost perfect (Cohen’s Kappa κ = 0.87).
to the obtrusiveness of EEG recordings, the differences in agreement seem to beminor and therefore the visual rating was solely used for our experiments.
3.1.4 Results
Table 3.2 shows an evaluation summary of the signals that were evaluated quali-tatively for this study. Each signal type was evaluated based on information fromthe literature and data sheets in a pre-study for theoretical accuracy in sleep dis-crimination, possibilities to integrate the necessary sensors in a mobile device andthe required energy consumption thereof. For each criterion, one of four qualita-tive measures was given:
• 3 points: best, gold standard (+++).
• 2 points: good, recommended/promising (++).
• 1 point: acceptable (+).
• -1 point: not appropriate (-).
If no information could be retrieved, no measure was given (?). When an al-ternative measurement technology was available (but not empirically tested), themeasure for the alternative was given in rounded brackets. The comfort of the

40 3. THE PROBLEM OF AUTOMATED, WEARABLE SLEEP AND WAKE DISCRIMINATION
sensors, the quality of the non-filtered signals (including noise and movementartifacts), and the correlation of features with sleep and wake were evaluated.The wearable comfort was determined from the direct feedback given by sub-ject A. The signal quality was evaluated by comparing the signal to theoreticaloutcomes and variations and on the content of artifacts. The correlation of fea-tures with sleep / wake was determined in the time and frequency domain. Forthis the time series were compared to the a priori sleep / wake labeling of thetechnician. To compare the signals in the frequency domain, the power spectraldensity (PSD) with a sliding window of 30 seconds equal to PSG was calculatedand displayed as spectrogram.

3.1. USEFUL SIGNALS FOR WEARABLE SLEEP AND WAKE CLASSIFICATION 41
pre-
stud
yex
peri
men
tals
tudy
clin
ical
(the
oret
ical
)se
nsor
pow
ersi
gnal
wea
rabl
efe
atur
es&
final
Test
ing
Sign
alac
cura
cyin
tegr
atio
nco
nsum
ptio
nqu
alit
yco
mfo
rtsl
eep
clue
sra
ting
RSP
+++
++++
++++
++
empi
rica
lEC
G++
+(++
)+
++(
++)
+++
(++)
EMG
+(++
)+
-+
+(-
)++
+
test
sEO
G+(
++)
++
+-
++
Tem
p+
++++
-+
-+
SC+
++++
--
--
PW?(
+)+
--
--
-
only
Acc
el+
+++
+++
++a
+++
+EE
G++
+-
--a
-a++
a
liter
atur
eSp
O2
-+
--(
+)a
+(-)
a?
BP
++
-+a
-a?
PAT
++
??
-a?
aTh
ese
valu
esha
vebe
enes
tim
ated
from
the
liter
atur
e.
Tabl
e3.
2:Q
ualit
ativ
eev
alua
tion
ofqu
alit
yan
dsu
itab
ility
ofdi
ffer
ent
phys
iolo
gica
lan
dbe
havi
oral
sig-
nals
for
wea
rabl
esl
eep
disc
rim
inat
ion.
[+++
]=be
st(g
old
stan
dard
);[+
+]=
good
[+]=
acce
ptab
le;
[-]=
not
appr
opri
ate;
[()]
=va
riat
ion
depe
ndin
gon
diff
eren
tim
plem
enta
tion
orse
nsor
tech
nolo
gy.

42 3. THE PROBLEM OF AUTOMATED, WEARABLE SLEEP AND WAKE DISCRIMINATION
According to Table 3.2, the most promising empirical results were obtainedwith the RSP and ECG signals. The spectrogram of both signals in Figure 3.3showed an interesting, visually detectable correlation with the a priori sleep /wake information. The changes of the PSD patterns did not exactly match in time.Whereas the ECG PSD seemed to anticipate the sleep onset and wake-up, the RSPPSD patterns are much more timely overlapping with the a priori knowledge.This suggests that ECG and RSP may show complementary frequency relatedfeatures for sleep / wake classification. During posture changes, both signalsshowed movement artifacts. Despite the presence of these artifacts, the respira-tion patterns were still detectable. To improve the comfort of ECG recordings,dry electrodes would be needed.
For the two other signals measured with gel electrodes (EMG and EOG) a cor-relation with the sleep times and the spectral patterns was also observed, but lesspronounced. Like the RSP and ECG signals, they showed the presence of noise,especially during posture changes. The EOG and EMG measures showed a ma-jor disadvantage: The muscle activity signals are relatively weak and were oftencorrupted with ECG signals. Further, they needed to be measured at a high sam-pling rate (200 Hz) which also increased power consumption. The EOG neededelectrodes glued on the face, which was not practical and not accepted by thesubject during the day. In fact, the use of gel largely improved the signal quality,but only until the gel started to dry out. Further, the gel reduced the capabil-ity of the skin to breath and induced uncomfortable itching and skin irritationsafter approximatively 12 hours of wearing the electrodes. In textile electrodes,sweat (which is conductive) can be used as natural conductor between skin andelectrodes. However, it cannot prevent the electrodes from moving during heavybody motion. This suggests that EOG and EMG are difficult to measure with awearable system using only textile electrodes and without gel that could improveskin contact.
The empirical measures showed that all the finger sensor data was stronglycorrupted with movement artifacts. This was expected, as the subject was sup-posed to follow regular activities during the day and used the finger often (e.g.type writing). The finger sensor itself was judged to be very uncomfortable, hurt-ing and disturbing during activities. Neither for skin temperature nor for skinconductance a trend or correlation with the sleep times were identified.

3.1. USEFUL SIGNALS FOR WEARABLE SLEEP AND WAKE CLASSIFICATION 43
Figu
re3.
3:Po
wer
spec
tral
dens
ity
(PSD
)of
the
ECG
(top
)an
dre
spir
ator
ysi
gnal
(mid
dle)
ofon
ere
cord
ing
sess
ion
of16
hour
sus
ing
the
port
able
Hea
llyre
cord
ing
syst
em.
Inth
em
iddl
eof
the
reco
rdin
gse
ssio
na
slee
pof
7.5
hour
sto
okpl
ace
(wit
hsh
ortw
ake
ups)
.Th
ebo
ttom
grap
hsh
ows
thes
esl
eep
tim
es(fi
lled
bloc
ks)o
btai
ned
from
labe
ling
the
vide
o,EM
Gan
dEO
Gby
ate
chni
cian
.C
hang
esin
the
spec
tral
patt
erns
can
beob
serv
edas
wel
lfor
the
ECG
asal
sofo
rth
eR
SPPS
Don
slee
pon
set
and
atw
ake-
up.
How
ever
,the
chan
ges
are
not
exac
tly
loca
ted
atth
esa
me
tim
es.
The
PSD
patt
erns
also
chan
gedu
ring
the
slee
ppe
riod
and
the
chan
ges
can
beas
soci
ated
toth
ew
ake-
up.

44 3. THE PROBLEM OF AUTOMATED, WEARABLE SLEEP AND WAKE DISCRIMINATION
3.1.5 Conclusion
From a wearable perspective, the use of accelerometers mounted on the body todetect movements is the most wearable and comfortable solution existing today.The sensors are low cost, low power and can be integrated into tiny devices ofthe size of a watch. However, with a wrist actigraph only one of the typical sleepbehaviors can be detected (maintained behavioral quiescence) which influencesthe validity (and specificity) of this technique because quiescence is not uniqueto sleep. The use of additional accelerometers mounted on the body might helpto measure body posture, a further behavioral expression of sleep.
If high sleep detection accuracy is desired, the measure and analysis of EEGsignals would be the gold standard approach. EEG frequency analysis shows ahigh sleep detection rate in a high time resolution. It is the state of the art fordetecting different sleep stages that might be valuable for sleep quality estima-tions, but which is not the primary goal. However, the very weak brain potentialsignals to measure and the high susceptibility to different noise sources makes italso one of the most difficult signals to measure outside the laboratory. The cur-rent sensor technology and the requirement for gluing multiple electrodes on theskin make EEG recordings not yet suitable for wearable applications. Recent ad-vances in sensor development (e.g. Enobio, Figure 2.10) show that in the future,wearable EEG recording might become practical.
Different research groups have shown the link between the changes of theautonomic nervous system at sleep onset, the different sleep stages and the regu-lation of heart and respiration activity. Cardiorespiratory signals have been suc-cessfully used for the automatic screening of sleep / wake and a reduced num-ber of sleep stages. So far, the only study (Redmond and Heneghan, 2006) thatcompared the automatic screening from cardiorespiratory signals with one usingEEG features, obtained a lower accuracy for the cardiorespiratory classifier. How-ever, the classifier had to discriminate between different sleep stages, which is amore difficult task that we aim for. Our qualitative tests with a portable record-ing system showed that cardiorespiratory signals can be measured easily in anevery-day environment and also show features for sleep discrimination outsidethe laboratory. The tests also showed that the recording of this signal has poten-tial to be comfortable enough and unobtrusive.
Other physiological recordings that might be usable for a sleep discriminativetask (skin temperature, skin conductance, EOG and EMG) were shown to be ei-ther too obtrusive, delicate to measure and/or are without consistent information
3.1. USEFUL SIGNALS FOR WEARABLE SLEEP AND WAKE CLASSIFICATION 45
about sleep and wake states.All these findings suggest that the most promising signals for non-behavioral
sleep / wake discrimination with a wearable system are ECG and respirationeffort signals using frequency features. Although the respiratory patterns can bederived partially from the ECG measurements and would reduce the number ofhardware components, the use of two distinctive sensors makes more sense for awearable device, because the use of a distinctive measurement technology mayoffer redundancy, especially when the required dry ECG electrodes recordingsare corrupted with noise. Further, the respiratory belt sensor is easy to integrateand does not consume much energy.
Therefore we will focus on cardiorespiratory features for the further develop-ment of a wearable sleep / wake classifier.

46 3. THE PROBLEM OF AUTOMATED, WEARABLE SLEEP AND WAKE DISCRIMINATION

4 Automatic Sleep and WakeClassification
Big Top c© 2003 Rob Harrell. Used by permission of Universal Press Syndicate.All rights reserved.
In the previous chapter we have identified and selected ECG and respirationeffort (RSP) as the most interesting physiological signals for automated and wear-able sleep/wake discrimination. On an embedded, low-power microcontrollerthat is used typically in wearable devices the computational resources are limited.In this chapter the design of a classification algorithm for sleep/wake is pre-sented.
The algorithm offers low computational needs for the preprocessing and theclassification and makes it suitable for use on a microcontroller. The preprocess-ing consists of calculating an estimation of the power spectral density (PSD) forthe raw ECG and RSP signals with the help of a discrete Fast Fourier Transform(FFT). The classification method was based on Artificial Neural Networks (ANN),a well established method for sleep discrimination. The designed ANN had asingle-layer, feed-forward topology with the signal spectral density as input and
47

48 4. AUTOMATIC SLEEP AND WAKE CLASSIFICATION
one neuron as sleep / wake output. The performance of the classifier was evalu-ated for subject-specific and subject-independent data.
4.1 Algorithm
The sleep / wake classification algorithm was designed to be fast and low incomputational complexity such that it could easily be embedded into a wearabledevice without stressing the tight power budget of a potential wearable device.
4.1.1 Preprocessing and Feature Extraction
The classification algorithm that was suggested by Redmond and Heneghan (2006)required 27 features from ECG and RSP, 18 of them being spectral functions of ei-ther signal. The preliminary analysis in Chapter 2 showed visual differences inthe spectrogram of RSP and ECG for sleep and wake. Given this, spectral featuresseem to be promising for an automatic classification and spectral transformationscan be done in many ways efficiently on microcontrollers. We therefore decidedto calculate the power spectral density (PSD) of raw ECG and respiratory signalsfor feature extraction. PSD estimation methods are widely used for the frequencyanalysis of biomedical signals (Cohen, 2006). The periodogram method that wechose partitioned the original sequence of samples into equally sized segmentss. Each segment s was windowed with a Hamming window function w to re-duce the effects of spectral leakage (border effects) (Harris, 1978). The Hammingfunction is defined as follows:
w(n) = 0.53836− 0.46161cos
(2πn
N − 1
)n = 0, 1, . . . , N − 1 (4.1)
where N is the number of samples that form a segment s. For each segment aperiodogram S was then calculated with an FFT, as follows
S = |FFT {s(n)w(n)}|2 (4.2)
The periodogram S gives an estimation of the frequency content in the giventime segment. Computationally efficient FFT calculation in a digital signal pro-cessing (DSP) microcontroller requires a number of samples N = 2l where l isa positive integer. For our measurements we used the values of NECG = 4096
and NRSP = 2048 according to this constraint and corresponded to a segment

4.1. ALGORITHM 49
length of 40.96 seconds. This was the next larger possible segment size comparedto the traditional segment length of 30 seconds of PSG. We analyzed the effectsof decreasing and increasing this segment size for a better frequency or time res-olution, which will also be discussed in Section 5.4. Since the performance ofthe classifier did not improve with larger segment sizes, there appears to be noreason to incur the additional computational cost entailed by the increased seg-ment size. As the input values are real numbers, the PSD output is symmetricalaround the DC component and it is sufficient to use half of the output points(N/2). The DC component was eliminated, because it mainly contained the offsetof the uncalibrated sensors. Further experiments that will be described in Section5.5 showed that the information in high frequency components of the ECG andrespiratory spectrogram are redundant and can be pruned without degrading theperformance of the classifier. For this algorithm development, the ECG spectro-gram was truncated at 10 Hz and the respiratory spectrogram was truncated at 8Hz and the lower frequency part was kept. Correspondingly, the input size of theANN was reduced from NECG/2 and NRSP/2 to mECG = 409 and mRSP = 327,respectively. The reduced input size did not only reduce the training time, butalso reduced the search space that avoided over-fitting on noisy data.
4.1.2 Neural Classifier
A feed-forward ANN with no hidden layers and one single output unit with atangent-sigmoid transfer function (see Figure 4.1, ANN classifier) was selected.Since the introduction of ANNs for sleep discrimination by Principe and Tome(1989), single and multilayer ANNs have shown to be suitable for sleep analysis.ANNs also display clear advantages over other classification algorithms, as theyare easier to implement, have very simple topologies where one hidden neuronlayer can theoretically solve all nonlinear problems and many efficient algorithmsare available for automated learning. Similar to Principe and Tome (1989), we ex-perimented with ANNs with no, one or more hidden layers, but according to our(Dürr et al. (2009), see Section 5.5) and Principe and Tome (1989) findings, theperformance was not better in the multilayer topologies. It seems that a linearseparation of the input vector is sufficient and the gradual increase of the hiddenlayers also increased the risk of over fitting. As the training time increased con-siderably (up to 10 times for 1 hidden layer), it was reasonable to keep the single-layered structure. For the classification into the classes, a symmetrical thresholdwas applied to the output neuron. That means that the output of the tangent-

50 4. AUTOMATIC SLEEP AND WAKE CLASSIFICATION
sigmoid transfer function ([-1 1]) was thresholded so that y(x) ≥ 0 was mappedto sleep and y(x) < 0 was mapped to wake.
Training
To train the ANN and update the synaptic weights we used the Levenberg - Mar-quardt back-propagation algorithm (Hagan and Menhaj, 1994). Using this algo-rithm, the weights xk are updated as follows1:
xk+1 = xk −[JTJ + µI
]−1JTe µ ≥ 0 (4.3)
where J is the Jacobian matrix with the first derivatives of the network errors e
and I, the identity. The network error was calculated with the mean square dif-ference between the actual and the desired ANN output. µ is a variable that is in-creased at each step by µincrease until the weights changes obtained by Equation4.3 result in a reduced network error. After this training iteration, the synapticweights are updated and µ is decreased by µdecrease. The algorithm begins anew training iteration by calculating J for the updated weights and calculatingEq. 4.3 again.
Initialization of the weights was done with the Nguyen-Widrow method (Ngu-yen and Widrow, 1990).
To train the networks, the physiological data obtained by the later describedexperiments were divided into three sets: training, validation and test. The train-ing set (TR) contained the data used to update the synaptic weights. The perfor-mance of the network was evaluated on the validation set (VA) after each trainingiteration and the training was stopped if the performance of VA did not increasefor more than 15 training iterations or the minimal gradient (10−10) was reached.The test set (TE) was used to measure the performance of the network with thebest validation performance after the entire training.
Topology
Three different ANN topologies, which differed in the type of input signal, werestudied. The input vector of the first topology ECG+RSP was composed of thelogarithm of the periodograms SECG and SRSP (Figure 4.1). The other two archi-
1The parameters were: µ: 0.001; µincrease: 10; µdecrease: 0.1; µ max: 1010; min gradient:10−10; max validation failures: 15.

4.1. ALGORITHM 51
Figu
re4.
1:O
verv
iew
ofth
esl
eep
/w
ake
clas
sific
atio
nsy
stem
:R
awEC
Gan
dre
spir
ator
yef
fort
sign
als
(A)
are
map
ped
toth
efr
eque
ncy
spac
ew
ith
the
help
ofa
Fast
Four
ier
Tran
sfor
m(B
).Th
ere
sult
ing
freq
uenc
yda
ta(r
epre
sent
edhe
reby
asp
ectr
ogra
m)
are
fed
toa
feed
-for
war
d,si
ngle
-lay
erA
rtifi
cial
Neu
ralN
etw
ork
(C)
wit
ha
tang
ent-
sigm
oid
tran
sfer
func
tion
and
asy
mm
etri
ccl
assi
ficat
ion
thre
shol
d.Th
eou
tput
ofth
ecl
assi
fier
issl
eep
orw
ake
(D).

52 4. AUTOMATIC SLEEP AND WAKE CLASSIFICATION
tectures ECG and RSP used only the logarithm of the periodogram of one of thetwo signals, ECG or RSP, respectively.
4.2 Performance Measures
We introduced a series of measures to determine the performance of our algo-rithm.
We calculated the accuracy by computing the percentage of correct classifica-tions of sleep (true sleep) and wake (true wake) of TE as described by
accuracy =true sleep+ true wake
all sleep+ all wake(4.4)
where all wake and all sleep are the number of classified wake (-1) or sleep(1) points, respectively. Between different methods and topologies, the accura-cies were compared using Student’s t-test. If not stated differently, the data wasfirst tested on its normal distribution using a Kolmogorov-Smirnov test at the 5%significance level.
To further quantify the performance of the system, we computed two addi-tional quantities (Figure 4.2): Total Sleep Time (TST), the total duration of segmentsclassified as sleep per session, which is an important parameter in the sleepinessestimation models described in Section 2.4, and Awakenings, the total number ofsleep-to-wake transitions during the period between the first and last segment la-beled as sleep in a session, which is an indicator of the sleep quality of the subject.Both sleep parameters are commonly calculated for PSG reports.
Figure 4.2: Sleep quality indicators; 1) Total Sleep Time (TST) is the duration ofthe epochs classified as sleep; 2) Awakenings is the sum of transitions from sleepto wake (arrows).
The comparison of the TST labeled according to the video data and estimatedby the classifier does not take into account whether the estimated sleep epochs are
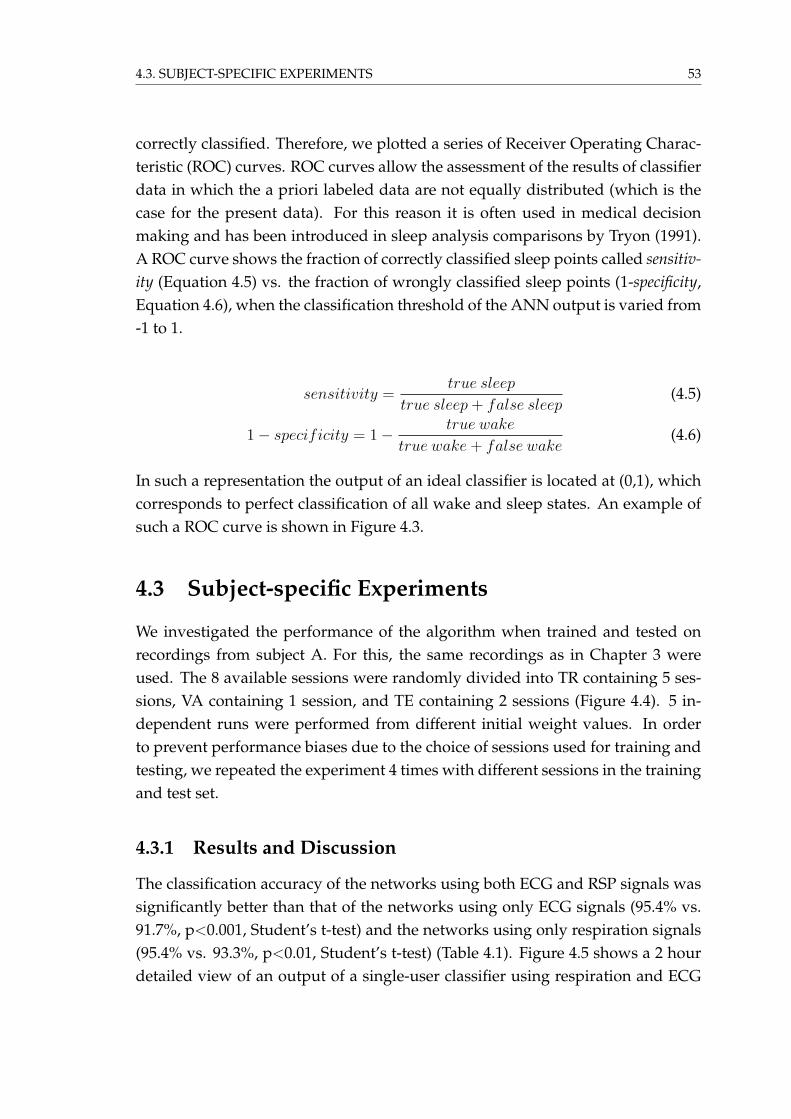
4.3. SUBJECT-SPECIFIC EXPERIMENTS 53
correctly classified. Therefore, we plotted a series of Receiver Operating Charac-teristic (ROC) curves. ROC curves allow the assessment of the results of classifierdata in which the a priori labeled data are not equally distributed (which is thecase for the present data). For this reason it is often used in medical decisionmaking and has been introduced in sleep analysis comparisons by Tryon (1991).A ROC curve shows the fraction of correctly classified sleep points called sensitiv-ity (Equation 4.5) vs. the fraction of wrongly classified sleep points (1-specificity,Equation 4.6), when the classification threshold of the ANN output is varied from-1 to 1.
sensitivity =true sleep
true sleep+ false sleep(4.5)
1− specificity = 1− true wake
true wake+ false wake(4.6)
In such a representation the output of an ideal classifier is located at (0,1), whichcorresponds to perfect classification of all wake and sleep states. An example ofsuch a ROC curve is shown in Figure 4.3.
4.3 Subject-specific Experiments
We investigated the performance of the algorithm when trained and tested onrecordings from subject A. For this, the same recordings as in Chapter 3 wereused. The 8 available sessions were randomly divided into TR containing 5 ses-sions, VA containing 1 session, and TE containing 2 sessions (Figure 4.4). 5 in-dependent runs were performed from different initial weight values. In orderto prevent performance biases due to the choice of sessions used for training andtesting, we repeated the experiment 4 times with different sessions in the trainingand test set.
4.3.1 Results and Discussion
The classification accuracy of the networks using both ECG and RSP signals wassignificantly better than that of the networks using only ECG signals (95.4% vs.91.7%, p<0.001, Student’s t-test) and the networks using only respiration signals(95.4% vs. 93.3%, p<0.01, Student’s t-test) (Table 4.1). Figure 4.5 shows a 2 hourdetailed view of an output of a single-user classifier using respiration and ECG

54 4. AUTOMATIC SLEEP AND WAKE CLASSIFICATION
1-speci�city
sens
itivi
ty
0 0.2 0.4 0.6 0.8 10
0.2
0.4
0.6
0.8
1
Figure 4.3: Receiver Operating Characteristics (ROC) curve example. The curve isobtained by varying the classification threshold from -1 to 1. The circle is the ROCpoint of the test set classification with the symmetrical threshold. The squarecorresponds to an optimal classifier that classifies all sleep as sleep and wake aswake. The dashed line corresponds to the ROC line of a random classifier. Thefull gray line corresponds to ROC points that have perfectly balanced sensitivityand specificity. The area below the ROC curve (AUC) is an estimation for thequality of the classifier and is highest when equal to one.
signals as input. In this example we can observe that the process of falling asleepis gradually detected by the classifier, although the labeling is binary (black linecomposed of triangles). From a physiological point of view this makes sense be-cause sleep onset is a gradual, rather than a discrete process. A more detailedprobabilistic classification taking into account the uncertainty of the classificationwould presumably reveal that the uncertainty is high in this transition phase, re-ducing the reliability of the classification. The same figure also shows that thefirst short awakening of the subject after 48 minutes could not be correctly classi-fied. This difficulty to detect short awakenings inside long sleep epochs has alsobeen reported by various actigraphy studies (de Souza et al., 2003 and Kushidaet al., 2001 and Pollak et al., 2001).
The circles in the top of the ROC graphs for the single-user experiments shown

4.3. SUBJECT-SPECIFIC EXPERIMENTS 55
0
1
2
3
4
5
no. o
f rec
ordi
ng s
essi
ons
TR VA TE
Figure 4.4: Experimental design for training the neural classifier. Four experi-ments were conducted by altering the sessions in the training (TR), validation(VA) and test (TE) set.
Experiment ECG Resp ECG+RSP
accuracy 91.67 ± 2.74 93.27 ± 1.48 95.42 ± 1.61
Table 4.1: Test classification accuracies ± SD in percent.
in the top of Figure 4.6 correspond to the output of the test set with a classifica-tion threshold set to 0. We observe equally balanced sensitivity and specificityin most cases of the RSP and the ECG+RSP topology, which means that the clas-sifier classifies sleep as accurately as wake. For the ECG topology, the solutionsare either biased to an increased sensitivity or specificity. For the same topologywe observe that a series of curves are shorter, which indicates that ECG may notclassify all situations equally good.
In comparison, the only other study in the literature where both ECG andrespiration signals from a single subject were combined, reported an accuracy of81% (Redmond and Heneghan, 2006). However, a direct comparison of the tworesults is difficult, because
a) the value reported in Redmond and Heneghan (2006) was measured in themore difficult task of classifying wake, NREM sleep and REM sleep;
b) it was obtained with data recorded in a controlled hospital environmentusing polysomnography equipment;
c) it only used data from night recordings;
d) it used data from patients with obstructive sleep apnea; and
e) it used a computationally more expensive pre-processing algorithm calcu-

56 4. AUTOMATIC SLEEP AND WAKE CLASSIFICATION
3.2 3.4 3.6 3.8 4 4.2 4.4 4.6 4.8 5
−1
Wak
e
0
Slee
p
1
experiment duration [hours]
Figure 4.5: Unthresholded output of a subject-specific classifier using theECG+RSP topology. The figure illustrates the transition from wake to sleep. Thecrosses represent correctly classified segments when a classifier threshold of 0 isapplied, the circles represent the wrong classifications. The black triangles are thelabeling values from the technician.
lating 27 features and a probabilistic classifier algorithm, which may be dif-ficult to implement in a low-power and wearable device.
Table 4.2 shows that on average the ECG and the ECG+RSP classifiers over-estimate the Total Sleep Time, whereas the classifier using only respiratory dataslightly underestimates the Total Sleep Time. Similar findings were reported inactigraphy studies (de Souza et al., 2003 and Kushida et al., 2001). A possibleexplanation of sleep overestimation when the ECG signal is used is that the ECGsignal might vary substantially between different sleep stages. This might be thecase for REM-sleep, for example, but further analysis with a more detailed label-ing of the sleep data would be needed to confirm this statement.
The statistics on Awakenings in Table 4.2 show that the mean number of awak-enings is overestimated by all classifiers. This can be explained by the relativelynoisy output of the classifier around the classification threshold, where consecu-tive epochs are classified alternatively as sleep and wake and therefore countedas several awakenings. An example of this phenomenon can be observed in Fig-

4.3. SUBJECT-SPECIFIC EXPERIMENTS 57
Figure 4.6: Receiver OperatingCharacteristics (ROC) curvesof the three subject-specificneural classifiers topology con-figurations. Each curve corre-sponds to a different run ob-tained by changing the train-ing set configuration or the ini-tial network weights. The cir-cles are the ROC points of theactual classification of the testset with the same classificationthreshold as in the training.

58 4. AUTOMATIC SLEEP AND WAKE CLASSIFICATION
Mean differenceSleep parametersa Mean ± SD from Video ± SD1. Total Sleep Time [hours]Video (label) 7.55 ± 1.7ECG 7.79 ± 2.11 -0.25 ± 1.22RSP 7.46 ± 1.54 0.09 ± 0.3ECG+RSP 7.77 ± 1.74 -0.22 ± 0.442. Awakenings [numbers]Video (label) 23.75 ± 8.81ECG 88.71 ± 86.96 -64.96 ± 85.24RSP 92.61 ± 39.67 -68.86 ± 36.52ECG+RSP 49.6 ± 24.37 -25.85 ± 20.61a The mean is calculated for each recording session individ-
ually (and not for the TE) and the SD is taken over all ses-sions in all TE.
Table 4.2: Comparison of calculated sleep parameters for the video labeling andthe three ANN topologies. Total Sleep Time (TST) is the total amount of sleep,and awakenings is the number of wake-up events per night.
ure 4.7. The occasional mis-labeling of the video data might also contribute to thisoverestimation. Another source of error could also be the difference in resolutionof the video labeling (10 seconds) and the FFT (40.96 seconds). A short wake-upof 10 seconds might be lost if it is located at the border of a recording segmentand therefore attenuated by the windowing function. Note that the combinationof ECG and respiration performs relatively better in terms of the estimate of thenumber of awakenings.
4.3.2 Conclusion
With this set of experiments we have shown that sleep / wake classification canbe done with a reasonable accuracy of more than 90% when training was carriedout on data recorded from a portable system that was worn by a single user. Thiscan be achieved by using only FFT preprocessing and a single-layer, feed-forwardANN.
4.4 Multiple Users or the Problem of Generalizing
On a wearable device for a general public, it is particularly interesting to havea subject-independent algorithm that is able to generalize for a large number of

4.4. MULTIPLE USERS OR THE PROBLEM OF GENERALIZING 59
11.2 11.4 11.6 11.8 12 12.2 12.4 12.6 12.8 13
−1
Wak
e
0
Slee
p1
experiment duration [hours]
Figure 4.7: Unthresholded output of a subject-specific classifier using the RSPtopology. The figure illustrates the transition from sleep to wake. The crossesrepresent correctly classified segments when a classifier threshold of 0 is applied,the circles represent the wrong classifications. The black triangles are the labelingvalues from the technician.
users, and can give accurate sleep predictions without the need for calibration.Calibration or retraining would need user interaction that can be disturbing. Forexample, only few people would accept to undergo the procedure of recordingvideo, EMG and EOG.
The spectral patterns of EEG were found to have significant inter-subject dif-ferences during deep sleep (Buckelmüller et al., 2006), whereas the patterns didnot show any intra-subject changes within weeks. Redmond and Heneghan (2006)remarked that the accuracy of their cardiorespiratory sleep stage classifier drop-ped by more than 10% when the classifier was tested on data from a different setof users than the one that contributed to the training. To analyze whether thisis also true for the described sleep / wake classifier in Section 4.1, a new set ofrecordings involving 5 more subjects were recorded. To investigate the capabilityto generalize to multiple users, all three previously tested topologies were trainedand tested using data from multiple users in different combinations.
60 4. AUTOMATIC SLEEP AND WAKE CLASSIFICATION
4.4.1 Data Recordings
We conducted home recordings with 5 healthy male subjects, aged between 23and 29 years (subjects B to F). As described in Chapter 2 ECG and RSP were againrecorded with the Heally system. However the finger sensor was removed, as itwas found disturbing and painful by subject A. The measurements of the EMGand EOG were kept, but only as an additional reference measure to the video.Similar to the initial test, a night-time video of the upper part of the body wasrecorded.
The duration of each recording session was again 16 hours. Each subject pre-sented himself for 2 sessions. Each session (including subject A) contained a meanof 7.19± 1.65 hours of sleep and 8.45± 3.19 hours of wake. A total of 130.47 hoursof sleep and 161.64 hours of wake were analyzed. The subjects reported no majordiscomfort because of the recording system during sleep. However, at the end ofthe recording, itching at the electrode sites was reported.
4.4.2 Experiments
The performance of the method when trained on a single person and tested onmultiple persons, and when trained on multiple persons and tested on multiplepersons was analyzed. Six experiments were carried out, each with an increasingnumber of persons in the training set (1 to 6) and all remaining persons in thetest set (Figure 4.8). In the experiment where all 6 persons were in the trainingset, we made sure that the two sets contained different recording sessions. In allexperiments, the validation set was composed of 2 hours of data from each user,randomly sampled over the available 2 sessions and containing an equal amountof sleep and wake labels. This data was neither used for training nor for testing.Five independent runs of each experiment were performed from different initialweight values.
4.4.3 Results
In all six subject-independent conditions, the accuracies in the test condition drop-ped compared to the initial subject-specific conditions in Section 4.3.1. The accu-racy drop was the largest for the networks using only ECG signals (Table 4.3,first column). Table 4.4 shows that, as expected, in all experiments the trainingperformance of the networks using both ECG and RSP is higher than the train-ing performance of the networks using only one of the two signals. However,

4.4. MULTIPLE USERS OR THE PROBLEM OF GENERALIZING 61
0
2
4
6
8
10no
. of r
ecor
ding
ses
sion
s
TR VA TE666 (6)
TR VA TE165 (6)
Subject
ABCDEF
TR VA TE264 (15)
TR VA TE363 (20)
TR VA TE462 (15)
TR VA TE561 (6)
Figure 4.8: Experimental design for training the neural classifier where the clas-sifier was trained and tested on multiple users (subject-independent). Numbersindicate users in the training set (TR), users in the validation set (VA), users in thetest set (TE) (no. of repetitions with different combinations of users/sessions intraining and test).
Experiments TopologiesECG RSP ECG+RSP
165 65.54 ± 7.76 83.09 ± 2.78 76.53 ± 5.39264 66.74 ± 5.88 85.69 ± 2.05 81.65 ± 3.82363 68.17 ± 5.98 86.64 ± 2.33 83.59 ± 3.21462 68.63 ± 8.99 87.34 ± 2.91 84.96 ± 3.52561 69.51 ± 14.96 87.31 ± 4.68 85.25 ± 5.25666 78.72 ± 1.66 89.77 ± 1.37 88.34 ± 2.30
Table 4.3: Subject-independent test classification accuracies ± SD in percent.
the networks using both ECG and RSP (Table 4.3, third column) displayed loweraccuracy in the test condition than the networks using only respiration signals(Table 4.3, second column). Also, the variability of the accuracy across multiplereplicates was higher when respiration was used in combination with ECG ascompared to the condition when respiration alone was used. These results maysuggest that ECG signals have unique features that are specific to each individual,so that networks trained on the data obtained from a small number of subjects donot generalize well to other individuals for the purpose of discriminating sleepand wake states. This points to the necessity of increasing the number of subjectscontributing to the formation of the training and validation datasets, when usingboth ECG and RSP signals, in order to prevent the classifier from over-fitting thepeculiarities of the training data obtained from a restricted sample of subjects.

62 4. AUTOMATIC SLEEP AND WAKE CLASSIFICATION
Figure 4.9: Receiver Oper-ating Characteristics (ROC)curves of the three neu-ral classifiers topologies(ECG, RSP, ECG+RSP) forthe subject-independent 561configuration. Each curvecorresponds to a differentrun obtained by changing thetraining set configuration orthe initial network weights.The circles are the ROC pointsof the actual classification ofthe test set. Top: The dashedline corresponds to the ROCline of a random classifier.Middle: The stars correspondto the ROC points obtained bythe two actigraphy algorithmsproposed by Cole et al. (1992)and Sadeh et al. (1994) thatwere used in de Souza et al.(2003).

4.4. MULTIPLE USERS OR THE PROBLEM OF GENERALIZING 63
Experiments TopologiesECG RSP ECG+RSP
165 96.63 ± 1.81 95.81 ± 1.45 99.53 ± 0.34264 92.62 ± 1.99 93.83 ± 1.25 97.62 ± 1.12363 90.31 ± 2.04 93.06 ± 0.84 96.02 ± 0.89462 88.46 ± 1.98 92.64 ± 0.60 95.05 ± 0.67561 86.92 ± 1.63 92.34 ± 0.34 94.63 ± 0.56666 88.35 ± 3.31 92.72 ± 1.07 95.84 ± 1.02
Table 4.4: Subject-independent mean training accuracies ± SD in percent.
Mean differenceSleep parametersa Mean ± SD from Video ± SD1. Total Sleep Time [hours]Video (label) 4.27 ± 1.14ECG 4.44 ± 3.07 -0.17 ± 2.6RSP 3.88 ± 1.12 0.38 ± 0.9ECG+RSP 4.17 ± 1.6 0.09 ± 0.92. Awakenings [numbers]Video (label) 31.38 ± 13.27ECG 118.5 ± 68.7 -86.79 ± 67.52RSP 106.08 ± 50.99 -74.7 ± 50.49ECG+RSP 98.82 ± 52.59 -67.82 ± 49.84a The mean is calculated on each session individually (and
not per user or TE) and the SD is calculated over all meansfrom each TE.
Table 4.5: Comparison of the sleep parameters Total Sleep Time and Awakenings forthe subject-independent 561 experiments.
Although one may notice a positive correlation between accuracy and number ofusers in the training set, our data sets are not sufficiently large to draw conclu-sions on the observed differences among the six subject-independent conditions.
The subject-independent experiment with a single subject in the TE and allother subjects in TR (561) is the most realistic setup for a general public use andsimilar setups to this were also used by Redmond and Heneghan (2006) and inactigraphy studies (de Souza et al., 2003 and Kushida et al., 2001). Therefore,we chose this experiment for further analysis. Table 4.5 shows that in the 561experiment, the ECG and the ECG+RSP classifiers produce a good mean estimateof the TST, whereas all classifiers overestimate the number of Awakenings, whichhas also been observed in the subject-specific experiments (Table 4.2). This means

64 4. AUTOMATIC SLEEP AND WAKE CLASSIFICATION
that the quality of sleep is constantly underestimated. If the measure of sleepquality is required, a post-processing to filter out unrealistic oscillations in thesleep / wake output is recommended.
The ROC data for the 561 experiment also reveals, as previously indicated,that the ECG signal alone does not generalize well to other users, and for somecases, does not find a solution that is better than random (Figure 4.9, circles closeto dashed line, top).
Although the accuracy of our subject-independent classifier with respirationsignals is comparable to the 91% accuracies obtained by de Souza et al. (2003),which used the algorithms of Cole et al. (1992) and Sadeh et al. (1994) using onlyaccelerometer signals, it produces a smaller fraction of wrongly classified wakepoints. As we mentioned in Chapter 6, actigraphy may often mis-classify wakeperiods of low activity (reading, watching television, lying in bed) as sleep peri-ods. Indeed, the specificity of the actigraphy methods in (de Souza et al., 2003)was only 44% (Sadeh) and 34% (Cole) during the wake periods (stars, Figure 4.9,middle), whereas in our case it was 88.12%± 9.6 when only the respiration signalwas used and 91.87% ± 5.23 when both ECG and respiratory effort were used.In general, we can say that our solution using the respiration signal as inputachieves a better balance between sensitivity and specificity than those obtainedusing actigraphy. The findings of Kushida et al. (2001), who compared actigra-phy with PSG data from a large group of sleep disordered patients, support thisstatement (accuracy = 78%, sensitivity = 92%, specificity= 48%). A comparisonbetween the cardiorespiratory and the actigraphy sleep / wake classification willbe presented in more detail in Chapter 6.
4.4.4 Conclusion
As expected and already described in similar cases in literature (Redmond andHeneghan, 2006), the cardiorespiratory sleep / wake classifier performed worsewhen generalizing to different users than it was trained for. Interestingly, the per-formance drop was more pronounced on the ECG topology (-20% of the mean)than the RSP (-6%) and ECG+RSP (-10%) topologies. The obtained generalizedaccuracies are still comparable to the existing actigraphy methods. Although, thespecificity of the classifier is higher than the actigraphy-based sleep detection inliterature. It is therefore reasonable to transfer the method to a more wearabletechnology, which is described in the next chapter.

5 From Portable to Wearable
Non Sequitur c© 1998 Rick Stromoski. Used by permission of Universal Press Syndicate.All rights reserved.
In the previous chapter, we showed that with frequency-domain features ofcardiorespiratory signals obtained from a portable medical recording device andan ANN, sleep / wake classification is possible and accurate. These findingsare not necessary valid for a wearable device, because the comfort of wearabilitycomes with constraints in sensors, processing power, size, energy consumptionand signal quality.
In wearable systems, typically the less power hungry microcontrollers (<0.1Watts) are preferred to the high-performance 32-bit application processors (1-2Watts) used in mobile devices. Even if more advanced wearable computing sys-tems are available1, the processing load for the classification should be kept low,
1Highly integrated wearable computing devices using mobile application processors havebeen developed with success. The showcase is the QBIC wearable belt described in Amft et al.(2004). The energy autonomy for these devices is still relatively short (3 hours in continuous workmode).
65

66 5. FROM PORTABLE TO WEARABLE
so that as much computing resources as possible are free for high level computing(e.g. context awareness algorithms or fatigue models). Microcontrollers cannotrun an operating system and the data format (8 or 16 bit) as well as the compu-tational resources are restricted (if the computing costs have to stay low). On theother hand, microcontrollers can offer specialized digital signal processing (DSP)architectures that reduces computational load on signal processing. Therefore,the design of wearable systems requires the reduction of the algorithm complex-ity to the absolute minimum and an adjustment to the capabilities of the specificmicrocontroller. In our case, beside the algorithm complexity, the power con-sumption of the system can be further reduced by lowering the sampling rate ofsensors and the reduction of the number of features for the classification.
In this chapter we use a wearable hardware system called SleePic2 that wasdeveloped for this thesis (Appendix B). The SleePic system is based on a com-mercially available, wearable sensor module and two custom electronic modulesfor processing and user interaction. We seek methods to minimize the workloadof the classification algorithm on the embedded microcontroller and therefore thepower consumption of the wearable system. For that, data from the portable ex-periments (Chapter 4) and newly recorded data from the SleePic system are used.The segment size for the preprocessing and the ANN search space are reducedwith evolutionary and statistical selection methods. With the data obtained fromthe wearable SleePic system, the findings of the wearable methods are then vali-dated and discussed.
5.1 Requirements for a Wearable Sleep and Wake Dis-crimination System
For the development of the wearable sleep / wake discrimination system, we setup a series of design criteria that were mainly based on the findings of the pre-vious chapters and the general requirements for a bio-medical wearable device(Martin et al., 2000 and Scheffler and Hirt, 2004). The system should:
• Be wearable: From sensors to user feedback, all elements of the device shouldbe integrated into a wearable system. This implies low size and low weight.A medical device is considered wearable if it is not perceived as a medicaldevice by an observer. The materials that are in contact with skin should be
2The name SleePic is derived from Sleep discrimination with a Programmable Interface Controller.
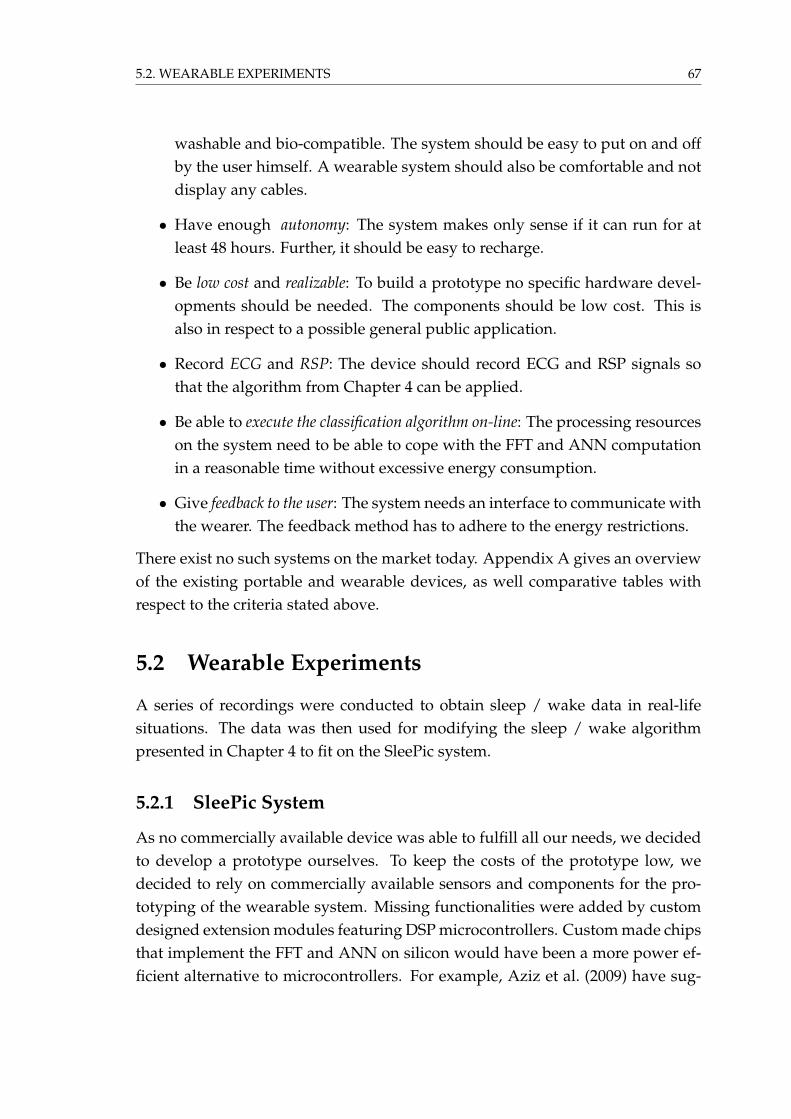
5.2. WEARABLE EXPERIMENTS 67
washable and bio-compatible. The system should be easy to put on and offby the user himself. A wearable system should also be comfortable and notdisplay any cables.
• Have enough autonomy: The system makes only sense if it can run for atleast 48 hours. Further, it should be easy to recharge.
• Be low cost and realizable: To build a prototype no specific hardware devel-opments should be needed. The components should be low cost. This isalso in respect to a possible general public application.
• Record ECG and RSP: The device should record ECG and RSP signals sothat the algorithm from Chapter 4 can be applied.
• Be able to execute the classification algorithm on-line: The processing resourceson the system need to be able to cope with the FFT and ANN computationin a reasonable time without excessive energy consumption.
• Give feedback to the user: The system needs an interface to communicate withthe wearer. The feedback method has to adhere to the energy restrictions.
There exist no such systems on the market today. Appendix A gives an overviewof the existing portable and wearable devices, as well comparative tables withrespect to the criteria stated above.
5.2 Wearable Experiments
A series of recordings were conducted to obtain sleep / wake data in real-lifesituations. The data was then used for modifying the sleep / wake algorithmpresented in Chapter 4 to fit on the SleePic system.
5.2.1 SleePic System
As no commercially available device was able to fulfill all our needs, we decidedto develop a prototype ourselves. To keep the costs of the prototype low, wedecided to rely on commercially available sensors and components for the pro-totyping of the wearable system. Missing functionalities were added by customdesigned extension modules featuring DSP microcontrollers. Custom made chipsthat implement the FFT and ANN on silicon would have been a more power ef-ficient alternative to microcontrollers. For example, Aziz et al. (2009) have sug-

68 5. FROM PORTABLE TO WEARABLE
gested a very-large-scale integration (VLSI) chip integrating a neural recordinginterface and a wavelet based ANN on a single chip for an automated epilepticseizure detection. However, these types of chips are very task specific and theirdevelopment expensive. Therefore we preferred the more flexible and cheapermicrocontroller solution for the prototyping.
The SleePic sleep / wake discrimination system (Figure 5.1) that was devel-oped during this thesis, is composed of three modules:
• The SleePic Sensor Module which is based on the commercially availablewearable sensor system EquivitalTM (Hidalgo Ltd, UK) and is worn aroundthe chest.
• The SleePic Core processing module that incorporates a digital signal micro-controller (dsPic33TM from MicrochipTM Technology Inc, USA). It is respon-sible for all signal preprocessing and classification. The module connectsdirectly to the SleePic Sensor Module.
• The SleePic Watch that is worn on the wrist. The SleePic Watch is responsiblefor remote sensing and user feedback with LEDs and a button. It commu-nicates wirelessly with the SleePic Core.
The design of the modules as well as the operating modes and power con-sumption of the SleePic system are described in Appendix B.
5.2.2 Recording Sessions and Subjects
The SleePic system was worn by nine (two female and seven male) volunteers inthe age between 24 and 30 years. The subjects were in good health and reportedno cardio-respiratory disease or any sleep disorders.
The subjects came to the laboratory in the evening after work, were then in-structed about the experiment procedure and how to wear the device. The sub-jects were asked to wear the SleePic device for 36 hours. They were allowed toremove the belt when doing heavy sport or when they wanted to take a shower.During the whole experiment, they had to fill out a logbook by indicating theirsleep times, system-off times and particular events related to the system that mayhappen during the experiment. During the two nights of the experiment, the sub-jects were asked to sleep at home. For both nights an infrared video camera wasinstalled in their bedroom to record the sleep behavior during bedtime. Duringthe whole experiment the subjects had to perform a reaction task using the button

5.2. WEARABLE EXPERIMENTS 69
1
2
3
Figure 5.1: A subject wearing the complete SleePic sleep / wake detection system.1) SleePic Core extension module; 2) EquivitalTM Sensor Belt; and 3) SleePic Watchfor user interaction.
on the Sleepic Watch. A detailed description of this task is given in Chapter 7. Af-ter 36 hours of recording, the participants brought back the complete recordingsystem to the lab for a debriefing and filled out a questionnaire with questions

70 5. FROM PORTABLE TO WEARABLE
Subjects
TR VA TE0
1
2
3
4
5
6
[Hou
rs]
36
72
108
144
180
Figure 5.2: Repartition of the sessions for the subject-independent experiment.One user contributes completely to the test data set (TE). The data from the otherusers are divided into 75% for the train data set (TR) and 25% for the validationdata set (VA).
about the usability and comfort of the system.
5.2.3 Data Analysis
A technician analyzed the video recordings and labeled the wake / sleep periodsin 10-second intervals in the same way as it was done in the previous study for theportable recordings (Section 3.1.3). The data from the periods where the SleePicwas not worn were discarded. When the recording device failed to give any data,the missing data epochs were discarded. However, signals with movement arti-facts or other task-dependent disturbances were not discarded, since they mightcontain useful information for the classification task. With one female subject, thesensor belt became too loose, which was not detected instantly. Therefore an ad-ditional 3.5 hours with bad data needed to be discarded. During the recording ofa male subject, a battery connection failed and we were not able to collect enoughdata from this subject. The data from this subject was dropped from the analysis.From the remaining eight subjects, a total of 250 hours of valid recordings wereobtained, thereof were 37% labeled with sleep.
With the obtained wearable data we conducted subject-specific and subject-independent experiments like in Chapter 4.
For the subject-specific experiments, the first 18 hours of recordings (that in-cluded the 1st night) were randomly divided into a train data set (75%) and val-idation data set (25%) the rest of the recordings from the same user were used as

5.3. USER ACCEPTANCE 71
test set.For the subject-independent experiments, all recording sessions but one were
combined and randomly divided into a train data set (75%) and validation dataset (25%). The recording session from the remaining subject was used as test dataset (Figure 5.2). This was repeated until each subject was once in the test data set(8 times).
The subject-specific data sets were also used for the adjustment of the compu-tational load of the preprocessing (Section 5.4) and the ANN processing (Section5.5).
5.3 User Acceptance
From the post-study questionnaire, we were able to evaluate the subjects’ accep-tance of the SleePic prototype. All subjects had no problem with the study. Inter-estingly, all female subjects felt the wearable device comfortable enough, whereasthe male subjects either could not decide (50%) or were not comfortable with it(50%). The men argued that they could not get used to the belt because of it wastoo tight or too big. The SleePic system was disturbing the subjects when theywere lying face down. All subjects found the light vibration that accompaniedthe reaction task helpful and not as disturbing. The subjects also agreed withthe frequency of the reaction time tasks. Wearing the device was influencing thedaily activities of the subjects only slightly (60%) or not at all (40%). However,only 50% would wear the device again for a private purpose. A possible reasonfor this could be that the users did not get any direct feedback from the deviceand did not know the real purpose of the experiments during this study. There-fore, compared to the perceived decrease in comfort, no visible advantage for theuser existed. Additional experiments with a fully working device are required toclarify this assumption. A point that was raised several times was the uneasinessof the subjects with the video recordings during the night. This has to be takeninto account for further developments.
5.4 Reducing Computational Load of Preprocessing
Although the dsPic33 microcontroller with the highest amount of RAM memoryavailable was embedded the SleePic Core, the RAM was not sufficient to calcu-late the FFT for ECG and RSP using the recording parameters used in Chapter
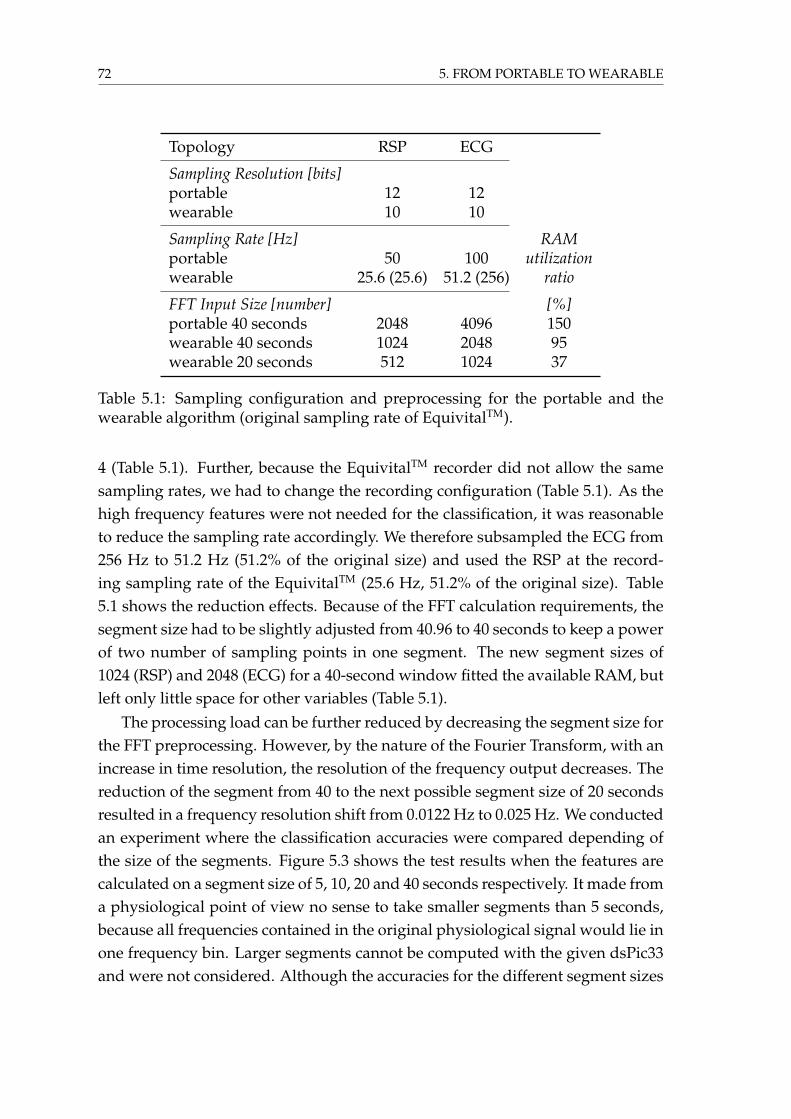
72 5. FROM PORTABLE TO WEARABLE
Topology RSP ECG
Sampling Resolution [bits]portable 12 12wearable 10 10
Sampling Rate [Hz] RAMportable 50 100 utilizationwearable 25.6 (25.6) 51.2 (256) ratio
FFT Input Size [number] [%]portable 40 seconds 2048 4096 150wearable 40 seconds 1024 2048 95wearable 20 seconds 512 1024 37
Table 5.1: Sampling configuration and preprocessing for the portable and thewearable algorithm (original sampling rate of EquivitalTM).
4 (Table 5.1). Further, because the EquivitalTM recorder did not allow the samesampling rates, we had to change the recording configuration (Table 5.1). As thehigh frequency features were not needed for the classification, it was reasonableto reduce the sampling rate accordingly. We therefore subsampled the ECG from256 Hz to 51.2 Hz (51.2% of the original size) and used the RSP at the record-ing sampling rate of the EquivitalTM (25.6 Hz, 51.2% of the original size). Table5.1 shows the reduction effects. Because of the FFT calculation requirements, thesegment size had to be slightly adjusted from 40.96 to 40 seconds to keep a powerof two number of sampling points in one segment. The new segment sizes of1024 (RSP) and 2048 (ECG) for a 40-second window fitted the available RAM, butleft only little space for other variables (Table 5.1).
The processing load can be further reduced by decreasing the segment size forthe FFT preprocessing. However, by the nature of the Fourier Transform, with anincrease in time resolution, the resolution of the frequency output decreases. Thereduction of the segment from 40 to the next possible segment size of 20 secondsresulted in a frequency resolution shift from 0.0122 Hz to 0.025 Hz. We conductedan experiment where the classification accuracies were compared depending ofthe size of the segments. Figure 5.3 shows the test results when the features arecalculated on a segment size of 5, 10, 20 and 40 seconds respectively. It made froma physiological point of view no sense to take smaller segments than 5 seconds,because all frequencies contained in the original physiological signal would lie inone frequency bin. Larger segments cannot be computed with the given dsPic33and were not considered. Although the accuracies for the different segment sizes

5.5. IMPROVING NETWORK TOPOLOGIES 73
5 10 20 40
RSP ECG ECG+RSP
65
70
75
80
85
90
95
5 10 20 40 5 10 20 40
Test
Acc
urac
y [%
]
segment size [seconds]
Figure 5.3: Performance analysis for different segment sizes (5, 10, 20 and 40seconds) used in the preprocessing. The dots are the mean over all trials and sub-jects, the whiskers the standard deviation. The means of the 20-second segmentsare better for all three analyzed topologies (ECG, RSP and ECG+RSP).
are not significantly different, we observe a positive trend toward the 20-secondsegments. This is expressed with the highest mean performance, minimal stan-dard deviation and the highest total accuracy in all three topologies (ECG, RSP,ECG+RSP).
We decided to use 20-second sized segments for the computation of the FFTpreprocessing on the wearable device because it was the closest possible segmentsize to the standard 30-second segment used in polysomnography that freed pre-cious RAM space (Table 5.1).
5.5 Improving Network Topologies
The topology of the ANN networks used in Chapter 4 was hand-coded and thechosen solution was selected for its simplicity and functionality. The single-layerfeed-forward neural network that was used gave a functional solution, but noinformation was obtained whether this topology is the optimal solution. Eventu-ally, a network topology with at least equal performance and less computationalneeds can be found in an automatic way.

74 5. FROM PORTABLE TO WEARABLE
For this optimization problem we used a method which is able to automati-cally synthesize ANN topologies and the search for the network weights in thecorresponding search space (Dürr et al., 2009). The selected network encodingmethod called Analog Genetic Encoding (AGE) uses evolutionary algorithms forexploring the search space. AGE was developed at the Laboratory of Intelli-gent Systems (LIS) by Mattiussi and Floreano (2007) and was improved by PeterDürr for the use with ANNs. AGE encodes artificial neurons and the interactionbetween them in one single artificial genome.
For our optimization problem the AGE representation was combined with astandard genetic algorithm. The evolved network could connect to an arbitrarysubset of the 409 inputs from the ECG data, the 327 inputs from the RSP dataand a constant bias unit (Figure 5.4). The deletion of a weight connection in theartificial genome resulted in the removal of the corresponding input from the net-work. Additionally, the evolutionary process was able to insert hidden neuronsinto the network in order to generate more complex network structures.
The measure of quality of the evolved classifier was the same as for the hand-coded, single-layer networks (mean square error between the actual and the de-sired classifier output, Section 4.1.2). The subject-independent 561 ECG+RSP ex-periment was repeated using the same data as for the hand-designed, fixed topol-ogy.
5.5.1 Network Layers
We compared the performance of the ANNs that were evolved with AGE with thenetworks trained in Chapter 4. Figure 5.5 shows that the evolved networks didnot display a significantly different classification accuracy (Wilcoxon rank sumtest p=0.48).
An analysis of the topology of the evolved networks showed that out of the30 evolved networks, 19 featured no hidden neurons, 7 featured one hidden neu-ron, and 4 featured two hidden neurons. There was no correlation between thenumber of hidden neurons and the classification accuracy (Spearman’s rank cor-relation coefficient ρ = -0.06, p = 0.74).
These findings showed that the minimalistic approach with no hidden layercan be used without performance drop and supports the previous choice (Chap-ter 4) of a less computational intensive single-layer ANN topology. A similarfinding of using a single layer network for the discrimination of wake and a com-bination of sleep stages (stage1/REM, stage 2, stage 3/4) based on EEG frequency

5.5. IMPROVING NETWORK TOPOLOGIES 75
Evolved Network
Output Neuron
ECG Inputs BiasRSP Inputs
Figure 5.4: Experimental setup for the automatic synthetization of ANN usingAnalog Genetic Encoding (AGE). An evolutionary algorithm was able to add hid-den neurons and to strengthen/weaken the synaptic weights and to add hiddenneurons (gray box). Theoretically, the synthetization was able to create recurrentconnections between the neurons, but this feature was not used for our experi-ments. Adapted from Dürr et al. (2009).
features was found by Principe and Tome (1989), where they compared zero, oneand two hidden layer networks.
5.5.2 Network Inputs
While the hand-designed fixed topology networks, as used in Chapter 4, em-ployed all of the 736 input features (ECG+RSP), many of the evolved networksused a drastically reduced set of inputs (see Figure 5.6, the median of the numberof inputs used is 244.5). There was no correlation between the number of inputsused by the evolved networks and their performance (Spearman’s rank correla-tion coefficient ρ = 0.02, p = 0.94). This indicates that many input features areindeed redundant and that it is possible to synthesize networks with a very smallnumber of inputs which perform as well as the hand-designed network using allinputs.

76 5. FROM PORTABLE TO WEARABLE
AGE hand-designed
74
78
82
86
90Cl
assi
�cat
ion
Acc
urac
y [%
]
ECG+RSP 561
Figure 5.5: Average classification accuracy of the evolved ANNs (AGE) and thesingle-layer, fixed ECG+RSP topology from Chapter 4 (hand-designed). The mid-line in each box is the median, the borders of the box represent the upper andthe lower quartile. The whiskers outside the box represent the minimum andmaximum values obtained, except when there are outliers which are shown assmall crosses. The outliers are data points which differ more than 1.5 times theinterquartile range from the border of the box. Adapted from Dürr et al. (2009).
Because artificial evolution always selected features from both ECG and RSP(Figure 5.7), the use of the combined ECG+RSP topology is reasonable.
The AGE experiments did not show a clear preference for a particular set offeatures. A possible reason for not consistently choosing smaller sets is that thegenetic algorithm was only evaluated on classification error but not network size.
We analyzed the input network weights of the single layer ANN obtainedfrom the SleePic experiments where the entire frequency spectrum served as in-put. We observed that the weights of the neural inputs with the higher frequen-cies of the ECG and RSP spectrum did show a very weak activation and variationcompared to the weights of the low frequencies. Based on physiological reasonsand because the simple structure of the ANN, we hypothesized that the low acti-vation and variation in the domain above 3 Hz is linked to a reduced importanceof these features for the classification. Therefore we designed a different networktopology that only uses the most relevant input weights. In our particular case(single-layered network), the input features were considered as relevant whenthe mean weight over all training runs was larger than the median standard de-
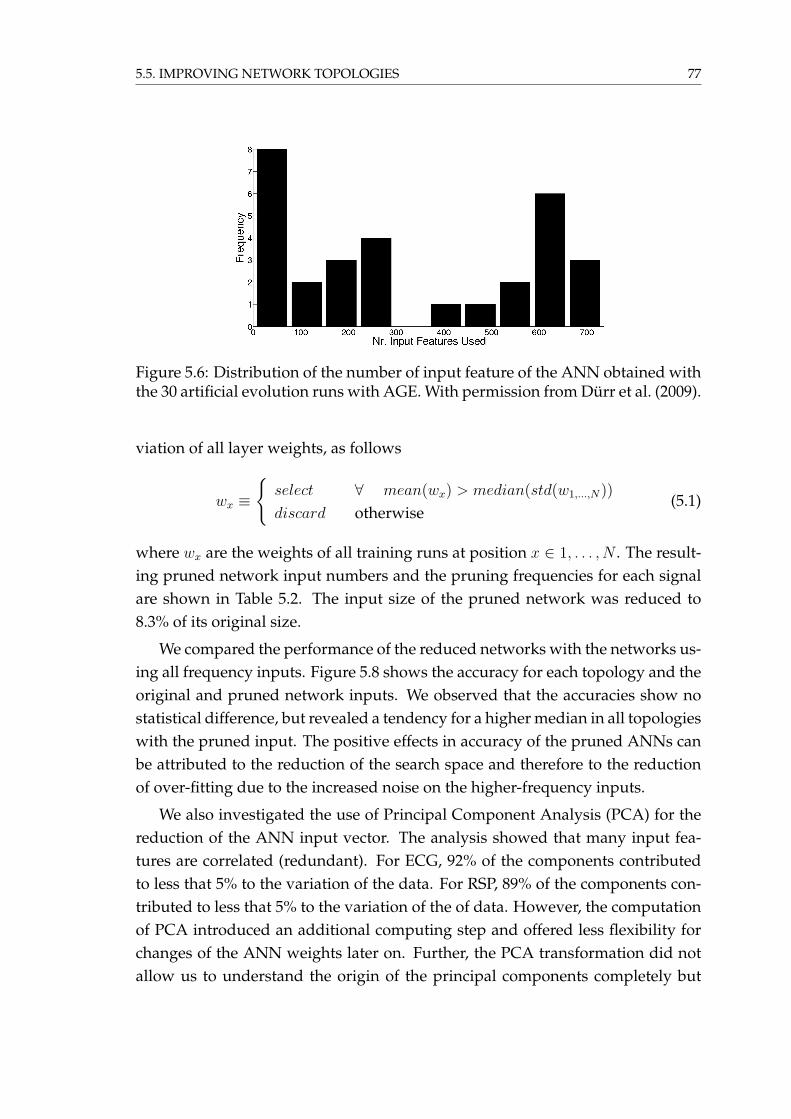
5.5. IMPROVING NETWORK TOPOLOGIES 77
Figure 5.6: Distribution of the number of input feature of the ANN obtained withthe 30 artificial evolution runs with AGE. With permission from Dürr et al. (2009).
viation of all layer weights, as follows
wx ≡
{select ∀ mean(wx) > median(std(w1,...,N))
discard otherwise(5.1)
where wx are the weights of all training runs at position x ∈ 1, . . . , N . The result-ing pruned network input numbers and the pruning frequencies for each signalare shown in Table 5.2. The input size of the pruned network was reduced to8.3% of its original size.
We compared the performance of the reduced networks with the networks us-ing all frequency inputs. Figure 5.8 shows the accuracy for each topology and theoriginal and pruned network inputs. We observed that the accuracies show nostatistical difference, but revealed a tendency for a higher median in all topologieswith the pruned input. The positive effects in accuracy of the pruned ANNs canbe attributed to the reduction of the search space and therefore to the reductionof over-fitting due to the increased noise on the higher-frequency inputs.
We also investigated the use of Principal Component Analysis (PCA) for thereduction of the ANN input vector. The analysis showed that many input fea-tures are correlated (redundant). For ECG, 92% of the components contributedto less that 5% to the variation of the data. For RSP, 89% of the components con-tributed to less that 5% to the variation of the of data. However, the computationof PCA introduced an additional computing step and offered less flexibility forchanges of the ANN weights later on. Further, the PCA transformation did notallow us to understand the origin of the principal components completely but

78 5. FROM PORTABLE TO WEARABLE
0
100
200
300
400
500
600
700
Evolved Networks
No.
Inpu
t Fea
ture
s U
sed
ECG
RSP
Figure 5.7: The evolved networks with AGE sorted by network input size. Arti-ficial evolution selected independent of input size always features from the ECGand RSP spectrum. With permission from Dürr et al. (2009).
showed that the low frequencies that were selected with Equation 5.1 were alsocontributing heavily to the principal components.
A smaller input feature set did accelerate the training and the network com-putation and also reduced the required amount of training input vectors (curseof dimensionality). It was therefore reasonable to use the pruned network forfurther studies.
Topology RSP ECG ECG+RSP
Frequencies [Hz]original 0-12.8 0-25.6pruned 0-1.4 0-2.25
ANN Input Size [number]original 257 513 770pruned 28 46 74
Table 5.2: Properties of the input feature space for the three ANN topologies RSP,ECG and ECG+RSP. The original features are all the features that are availablefrom the preprocessing. The pruned features correspond to the features obtainedby applying Equation 5.1.

5.6. CLASSIFICATION RESULTS 79
65
70
75
80
85
90
95
RSP ECG ECG+RSP
original pruned original pruned original pruned
Test
Acc
urac
y [%
]
Figure 5.8: Performance comparison when the entire feature set (original) or thereduced feature set (pruned) is used as input of the ANN (subject-specific ex-periments). Whereas a positive effects of the pruning can be observed on thecombined topology (ECG+RSP), no clear advantage for the single signal inputscan be found (ECG, RSP). The horizontal lines of each box are the lower quartile,median, and upper quartile values (from bottom to top). The whiskers representthe most extreme values within 1.5 times the interquartile range from the quar-tile. The outliers are data with values beyond the ends of the whiskers and arerepresented with crosses.
5.6 Classification Results
According the findings of the previous sections, a final preprocessing and classifi-cation configuration was selected for the wearable sleep / wake classifier: single-layer feed forward networks, FFT window size 20 seconds, pruning of the spec-trogram at 1.4 Hz (RSP) and 2.25 Hz (ECG). With this configuration we trainedand tested the classifier and compared the results with the results from the por-table system presented in Chapter 4. As described in Section 5.2 we tested asubject-specific and a subject-independent classifier.
Subject-Specific
Figure 5.9 compares the accuracy of the wearable classifier with the results ofthe portable classifier obtained in Chapter 4 for the subject-specific experiments.

80 5. FROM PORTABLE TO WEARABLE
RSP ECG ECG+RSP
Test
Acc
urac
y [%
]
wea
rabl
e
port
able
wea
rabl
e
port
able
wae
rabl
e
port
able
70
75
80
85
90
95
100
Figure 5.9: Accuracy comparison between the wearable and portable (Chapter 4)classifiers for a subject-specific classifier and the network topologies RSP, ECG,ECG+RSP.
We can observe a drop in the median accuracy for all wearable classifiers andtopologies (Student’s t-test, p<0.01). The most dramatical drop is for the ECGexperiments where the median accuracy drops by 10%. The median accuracies ofthe two other experiments are above 93%. Parts of these drops in accuracy can bedue to the reduction of the sampling resolution of the sensors and the reductionof the precision of the FFT calculation. Inter-individual differences might alsocontribute to this drop, as the wearable experiments were conducted on a highersubject number.
Additionally, the striking drop of performance when using the ECG topologymight suggest that the use of dry electrodes instead of gel electrodes has also anegative effect on the classification. If dry electrodes are used, the ECG signalquality depends on the humidification of the electrodes with sweat, which canvary largely also within a subjects recording. As the electrodes are not fixed tothe body with glue, movement artifacts become also more pronounced. Unfor-tunately it was not possible to quantify the individual contributions of the per-formed changes to the accuracy decrease with the SleePic system configurationand the conducted experiments.
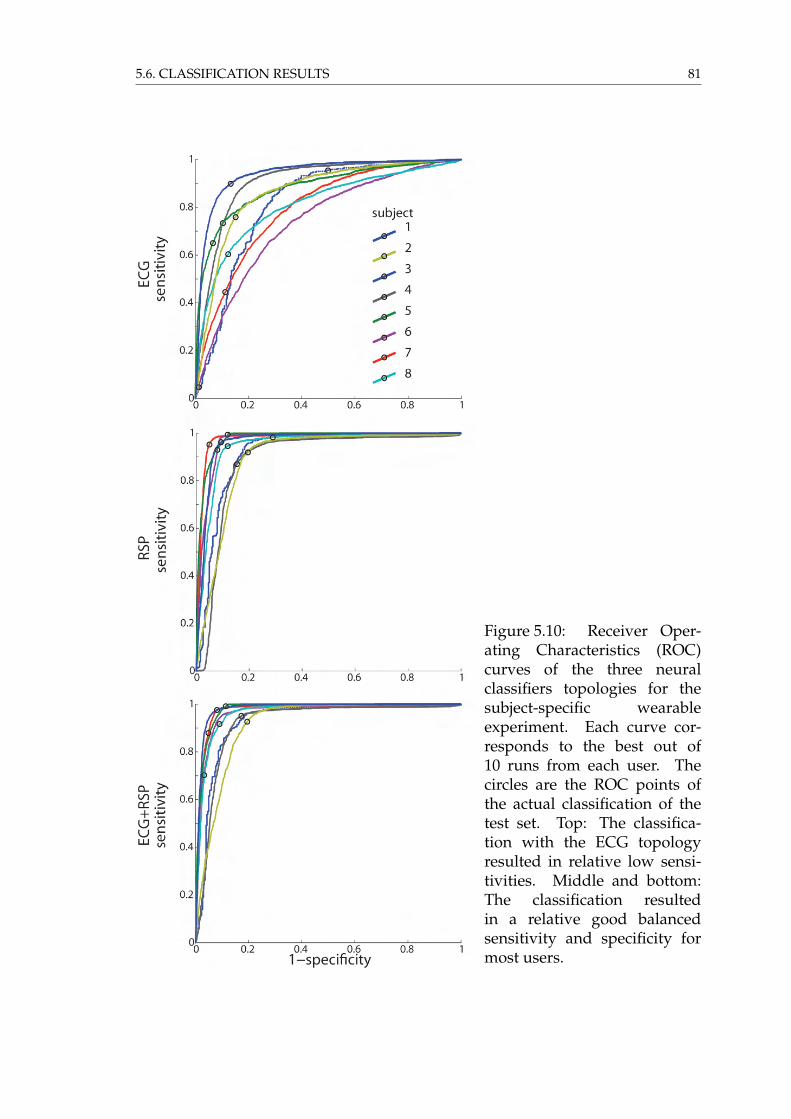
5.6. CLASSIFICATION RESULTS 81
Figure 5.10: Receiver Oper-ating Characteristics (ROC)curves of the three neuralclassifiers topologies for thesubject-specific wearableexperiment. Each curve cor-responds to the best out of10 runs from each user. Thecircles are the ROC points ofthe actual classification of thetest set. Top: The classifica-tion with the ECG topologyresulted in relative low sensi-tivities. Middle and bottom:The classification resultedin a relative good balancedsensitivity and specificity formost users.

82 5. FROM PORTABLE TO WEARABLE
The ROC curves in Figure 5.10 show that the radius of the curvature for theECG topology classifiers (top) are much larger than for the two other topologieswhose curves show a clear trend toward the (0,1) corner. The majority of the ROCpoints (circles) in the ECG experiment also show that the actual classifier tendsfor a low sensitivity while specificity stays in the same range (except subject 1).Compared to the ROC plots of the portable experiments (Figure 4.6) we observea higher dispersion of the ROC points for the wearable experiments.
Subject-Independent
The classification accuracy of the subject-independent experiments where the testdata comes from a new subject who was not present for the training is shown inFigure 5.11. As it was already observed in the portable experiments, the medianaccuracy for the ECG topology drops significantly compared to the two othertopologies (Student’s t-test, p<0.01) and also compared to the subject-specific ex-periment Student’s t-test, p<0.01). The increase of the curvature radius of theROC curves (Figure 5.12 top) and the low sensitivity (47.54%± 14.2) is even morepronounced than in the subject-specific experiment (Student’s t-test, p<0.01). Sur-prisingly, also the accuracy of the RSP and the ECG+RSP topologies dropped sig-nificantly from the subject-independent (Student’s t-test, p<0.01) and portableexperiments (Figure 5.11. The median accuracy drops for all topologies below75%, which cannot be considered as very accurate.
An analysis of the ROC curves of the RSP experiment in the middle of Fig-ure 5.12 unveils that subject 3 does show a complete different respiration patternduring sleep (S shaped ROC curve with very low sensitivity ROC point) whichcannot be separated from the wake class of the training data set. As the data ofthis user is used in the training of all other training runs, this has also a negativeeffect on the classification of the other subject data. This can be either observed inthe shift of the ROC points away from the center for all other subjects on the sameROC figure or by looking at the mean square error (mse) of the training. Whereasthe mse of the generalization training without the critical subject 3 reaches 48.06± 0.01 %, the other trainings including the subject perform worse 53.66 ± 1.61 %(Student’s t-test, p<0.01; note that the mse is calculated before the classificationthresholding). As this subject showed high accuracies and well balanced sensitiv-ity and specificity in the subject-specific experiments (Figure 5.10), the origin forthis performance drop is rather from physiological inter-subject differences thanfrom issues with the recording quality. One can argue similarly for the ECG+RSP

5.7. CONCLUSION 83
topology experiments where both data sources were combined (Figure 5.12 bot-tom).
40
50
60
70
80
90
100
wea
rabl
e
port
able
wea
rabl
e
port
able
wae
rabl
e
port
able
RSP ECG ECG+RSP
Test
Acc
urac
y [%
]
Figure 5.11: Accuracy comparison between the wearable and portable classifiersfor a subject-independent classifier.
5.7 Conclusion
The low median classification accuracies obtained from the subject-independentwearable classifier design (<75%) suggest not to use a generalized ANN classifierfor the sleep / wake classification with the physiological signals ECG and RSP.The use of such a classifier in a subject-specific setup seems to be more reason-able where the median accuracy for the RSP and ECG+RSP topologies are above91%. However, certain individuals show accuracy drops of up to 8% also for thesubject-specific experiments.
In general, a performance drop was observed with the transition from a por-table to a wearable system. Possible reasons might be the lower recording reso-lution given by the recording devices (12-bit to 10-bit) or the quality decrease of

84 5. FROM PORTABLE TO WEARABLE
Figure 5.12: Receiver Oper-ating Characteristics (ROC)curves of the three neuralclassifiers topologies for thesubject-independent exper-iment configuration. Eachcurve corresponds to the bestrun obtained by changing thetraining set configuration orthe initial network weightsand with a different subject inthe test set. The circles are theROC points of the actual classi-fication of the test set. Top: Theflattened ROC curves show thedegradation of performance.Middle: The S-shaped curve ofsubject 3 shows that the sub-ject had a different respirationpattern during sleep whichwas not present in the trainingpatterns. All classifiers showan unbalance of specificityand sensitivity opposite thesubject-independent case inFigure 5.10. Bottom : Thecombination of both signals inthe input does not improve theclassification compared to theRSP topology.

5.7. CONCLUSION 85
the ECG recordings because of the use of dry electrodes instead of glued gel elec-trodes. Additional filtering and signal reconstruction might improve the signalquality. The exact quantification of these influences was not possible and requiresfurther investigation.
We observed a performance drop due to physiological differences betweenthe subjects within the tested population. The sample size is not large enough todraw a direct conclusion on this, but with further increasing the population size,more distinct differences between users have to be expected.
These findings indicate that a physiological wearable sleep / wake classifica-tion system for an accurate classification requires a priori knowledge about theuser. The way how this knowledge was obtained so far (Video, EMG and/orEOG analysis) is not adequate for a wearable system. These procedures only fewpeople would accept to undergo. The labeling of the physiological data also re-quired a human expert. Further, the analysis was time consuming and thereforecostly.
To overcome these limitations of generalizability and obtrusiveness, we sug-gest exploring two paths:
a) The passive detection of sleep behavior patterns with accelerometers hasbeen identified in Chapter 3 as an interesting option for a wearable sleep /wake detection system. In Chapter 6 we are going to evaluate this approach.
b) Eventually, as subject-specific systems clearly performed better, an adaptivealgorithm that automatically adjusts the classifier to the user can bring thedesired accuracy improvement to a general public device. This aspect willbe discussed in Chapter 7.

86 5. FROM PORTABLE TO WEARABLE

6 Activity
Garfield c© 1991 Jim Davis. Used by permission of Universal Press Syndicate.All rights reserved.
The subject-independent classification accuracies of sleep and wake that wereobtained with the ECG and RSP features in Chapter 5 were relatively low. Thisraises the question if the behavioral based actigraphy sleep and wake detectionmethods (Section 2.2.3) would be a good alternative. The advantages of activitybased methods lies in its simplicity of recording and analysis. However, as actig-raphy is a passive method of measuring a single sleep behavior (Section 2.1), itdoes not only measure low activity periods related to sleep. To minimize classifi-cation errors, actigraphy algorithms have to detect movements in large segments(e.g. Cole et al. (1992)’s algorithm measures the activity on seven 1-minute seg-ments) and require some postprocessing. Still, activity methods do overestimatetotal sleep duration because of wake patterns with low activity periods that areeasily misclassified as sleep (de Souza et al., 2003). In this chapter, a commonlyused actigraphy sleep / wake algorithm from Cole et al. (1992) is tested on thedata from the SleePic device. Two other algorithms based on body position and
87
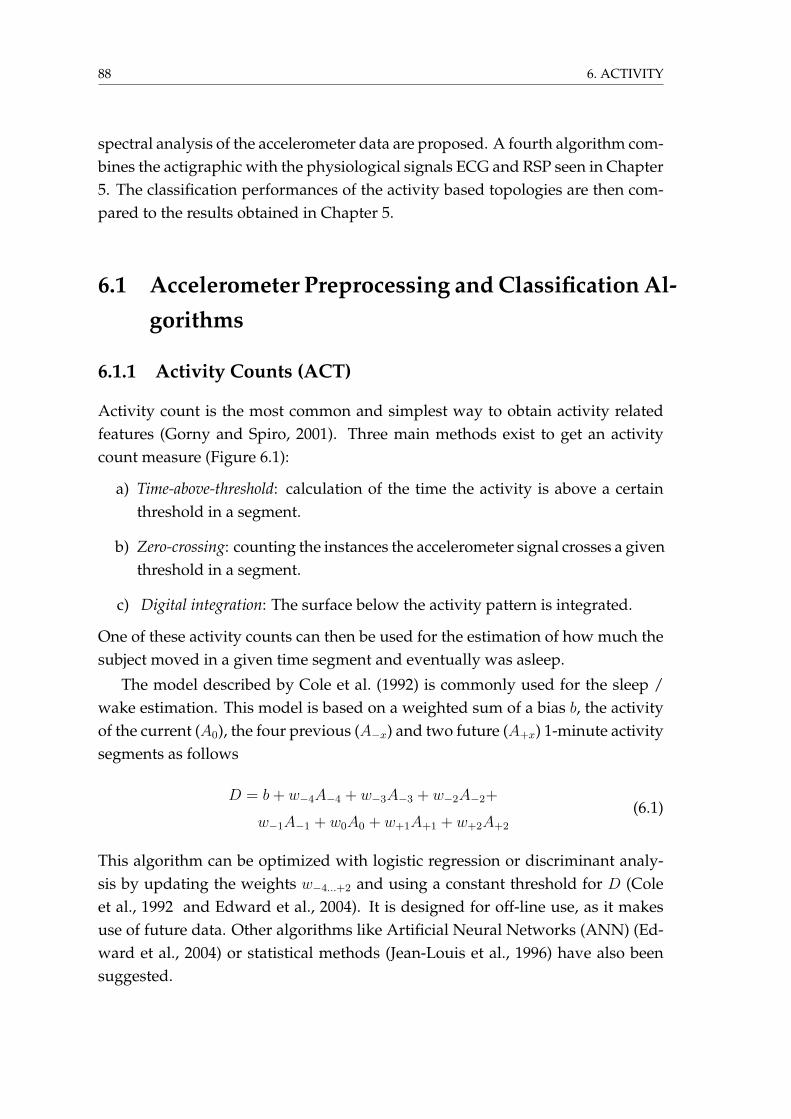
88 6. ACTIVITY
spectral analysis of the accelerometer data are proposed. A fourth algorithm com-bines the actigraphic with the physiological signals ECG and RSP seen in Chapter5. The classification performances of the activity based topologies are then com-pared to the results obtained in Chapter 5.
6.1 Accelerometer Preprocessing and Classification Al-gorithms
6.1.1 Activity Counts (ACT)
Activity count is the most common and simplest way to obtain activity relatedfeatures (Gorny and Spiro, 2001). Three main methods exist to get an activitycount measure (Figure 6.1):
a) Time-above-threshold: calculation of the time the activity is above a certainthreshold in a segment.
b) Zero-crossing: counting the instances the accelerometer signal crosses a giventhreshold in a segment.
c) Digital integration: The surface below the activity pattern is integrated.
One of these activity counts can then be used for the estimation of how much thesubject moved in a given time segment and eventually was asleep.
The model described by Cole et al. (1992) is commonly used for the sleep /wake estimation. This model is based on a weighted sum of a bias b, the activityof the current (A0), the four previous (A−x) and two future (A+x) 1-minute activitysegments as follows
D = b+ w−4A−4 + w−3A−3 + w−2A−2+
w−1A−1 + w0A0 + w+1A+1 + w+2A+2
(6.1)
This algorithm can be optimized with logistic regression or discriminant analy-sis by updating the weights w−4...+2 and using a constant threshold for D (Coleet al., 1992 and Edward et al., 2004). It is designed for off-line use, as it makesuse of future data. Other algorithms like Artificial Neural Networks (ANN) (Ed-ward et al., 2004) or statistical methods (Jean-Louis et al., 1996) have also beensuggested.

6.1. ACCELEROMETER PREPROCESSING AND CLASSIFICATION ALGORITHMS 89
0
t t+t
acce
lera
tion
[g]
0
t t+t
acce
lera
tion
[g]
0
t t+t
acce
lera
tion
[g]
1
2
3
Figure 6.1: Three most commonly used algorithms to calculate activity: 1) Time-above-threshold; 2) Zero-crossing; and 3) Digital integration. The sum of theblack units gives the activity count for a segment of length ∆t. The horizontalgray line is a threshold to which the signal is compared.
For our implementation of the activity count algorithm, we applied a 0.5-11 Hz bandpass filter on the raw accelerometer signal to remove slow (gravi-tational) movements and excessive accelerations that are not related to humanmovements. On the filtered signal we applied the zero-crossing algorithm (Fig-ure 6.1). Equation 6.1 can also be represented by a single-layer ANN having An
as inputs and one output neuron. This allowed us to keep the previously usedANN classifier design and to change only the input. However, we kept also thenon-linear tangent-sigmoid transfer function, which was more adapted for a clas-sification problem, but therefore had to alter slightly Cole’s model. We did notuse any postprocessing as it has been suggested by Cole et al. (1992) and Web-ster et al. (1982), because the suggested postprocessing rules (like "10 minutes orless scored as sleep surrounded by at least 20 minutes (before and after) scoredwake are re-scored wake" Webster et al. (1982)) added an additional delay of upto 20 minutes to the classifier. Further, in Cole et al. (1992) the postprocessingwas designed to improve only the bad specificity performance and had only lit-tle effect on the accuracy (+ 1%) because the tested data contained little wake. If

90 6. ACTIVITY
such empirically designed postprocessing rules are desired for a particular appli-cation, we suggest to use recurrent connections in the ANN network and to learnthe time related dependence based on the train data set. We did not investigatethis option in this thesis because the increase of complexity due to the recurrentANN. Recurrent networks in a microcontroller lead beside other problems to dif-ficulties in presenting the time-dependent data to the network for training and toa significant increase in training time.
6.1.2 Body Position (POS)
Sleep behavior is linked to typical positions (Section 2.1). Sleep should there-fore be detectable by recognizing typical sleep positions. Body position mea-surements are often used in context aware applications (e.g. Stiefmeier et al.(2008)), but usually accurate posture information is needed which requires themeasurement of position from different body parts. In a wearable system thisrequires multiple, distributed sensors that form a body area network (BAN). Be-cause BANs have limited energy autonomy, we focus here only on the detectionof the main body orientation. As the SleePic device measures the acceleration onall three body axes, the body orientation can easily be determined with the DCvalues of the accelerometer signals.
The proposed position algorithm (POS) calculates the mean acceleration for20-second segments for each axis as follows:
POSX,Y,Z(s) =
N−1∑n=0
aX,Y,Z(n)
N(6.2)
where aX,Y,Z is the raw accelerometer output and N is the number of samplesthat form a segment s. Figure 6.2 shows the outcome of this algorithm for onerecording session. A single-layer ANN was designed with the three POSX,Y,Z
values as inputs and one output neuron.
6.1.3 Spectral Analysis (ACC)
Analog to the ECG and RSP algorithms in Chapter 4, we introduced the powerspectral density calculation for the accelerometer signal (Equation 4.2). As theaccelerometer had the same recording configuration as the respiration signal (10bit, 25.6 Hz), the FFT preprocessing was calculated using the same procedure

6.1. ACCELEROMETER PREPROCESSING AND CLASSIFICATION ALGORITHMS 91
0 5 10 15 20 25 30
wake
sleep
200
400
600
800
A/D
labe
l
hours
X
Y
Z
Axis
Figure 6.2: Position features for the three accelerometer axes X,Y,Z for one subjectrecording session. The feature is calculated by taking the mean of each of thethree accelerometer outputs over a 20 second segment. Bottom: Correspondingvideo sleep / wake labeling of the recording session. The amplitude change ofthe Z axis shows that the subject went to a lying position for 4 hours before fallingasleep the second night (24 hours after the session started and with interrupts at26 hours).
(N = 512). The input feature vector was also pruned using the same statisticalmethod as described in Section 5.5.2. The resulting configuration (ACC) is shownin Table 6.1. The same single-layer ANN topology was used as in the RSP exper-iments in Section 5.6.
Combination of Physiological and Actigraphic Signals
To observe the possible effects of combining features of two distinctive type ofdata sources (physiological and behavioral), we combined the RSP, ECG and ACCspectral features to one set of ANN inputs (ECG+RSP+ACC).

92 6. ACTIVITY
Topology ACT POS ACC ECG+RSP+ACC
Frequencies [Hz]original 0-12.8pruned 0-1.4
Segment size [s]7*60 20 20 20
ANN Input Size [number]original 7 3 257 -pruned - - 11 85
Table 6.1: Properties of the input feature space for the four ANN topologies ACT,POS, ACC and ECG+RSP+ACC. The original features are all the features that areavailable from the preprocessing. The pruned features correspond to the featuresobtained by applying Equation 5.1.
6.2 Experiments
We repeated the subject-specific and subject-independent experiments using thedata recorded with the SleePic system as it was described in Section 5.2.3.
6.3 Results and Discussion
Figure 6.3 shows no significant difference between the subject-specific and thesubject-independent accuracies for each accelerometer topology. This shows, con-trary to the RSP and ECG features used in Chapter 5, that the sleep behavior mea-sured with the accelerometer signals, independent of preprocessing, generalizewell between users. Interestingly, the subject-independent ACT, POS and ACCexperiments show a narrower accuracy range (lower SD). This improvement ofthe minimal accuracy and decrease in maximal accuracy also suggest that theseexperiments tend toward a generalized solution.
The activity count algorithm topology (ACT) shows a median accuracy of 80%for the subject-independent experiments (Figure 6.3). The accuracy is better thanthe topologies based on cardiorespiratory features in Section 5.6 (Figure 5.11; Stu-dent’s t-test, p<0.01). However, the ACT topology shows a lower accuracy com-pared to the other actigraphic classification methods (Figure 6.3; Student’s t-test,p<0.01). The corresponding ROC curves (Figure 6.4 top) show the limitation inspecificity which were also reported in literature (de Souza et al., 2003). This ismanifested by the large steps in the ROC curves, in which no change in the speci-

6.3. RESULTS AND DISCUSSION 93
ficity appear. Note that the steps are initiated for each subject at the same speci-ficities in the subject-independent and the subject-specific experiments. For theseexperiments we observe a lower sensitivity than in literature (>90%, de Souzaet al. (2003) and Edward et al. (2004) and Sadeh and Acebo (2002)). A possiblereason might be the placement of the accelerometer on the chest, which differsfrom most studies where the placement on the wrist is preferred. Hilten et al.(1993) and Middelkoop et al. (1997) showed that the different placements of acti-graphs have an effect on the classifier accuracy. However, Edward et al. (2004)made a successful use of actigraphs on the chest of infants, arguing the advan-tage of being able to measure additionally the body position with the same sen-sor. Another reason might be the fact that the previous study results were basedon clinical data where the subjects’ movements did not correspond to real worldsettings.
Surprisingly, a high accuracy was obtained by only using the minimalisticposition information (POS) for the classification. This can be explained by thatthe subjects were sleeping mainly in a horizontal position. Only one tested sub-ject showed sleep in another position (and was not correctly classified), which ismanifested by the single ROC point with lower sensitivity in the middle left ofFigure 6.4. Interestingly, for the POS topology, many ROC points lie at the Sec-tion where the ROC curves start to leave the 100% sensitivity. The specificities ofthese points do correlate with the sleep efficiency (Table 6.2) of the correspondingsubjects (Spearman’s rank correlation coefficient ρ = 0.93, p = 0.007). This, thehigh sleep efficiency, and the very low number of awakenings in Table 6.2 sug-gest that the POS topologies are rather trained for detecting ’lying-in-bed’ than’sleep’. On the contrary, the other topologies show a lower correlation betweensleep efficiency and specificities (Spearman’s rank correlation coefficient ρ < 0.80,p>0.05) and a higher amount of awakenings which suggests that these classifiersdo not over-fit to a body position.
When the frequency spectrum of the accelerometer (ACC) is used, the increaseof ANN input features smoothen the ROC curves (Figure 6.4, bottom). Whereasthe accuracy does not decrease significantly from the POS topology experiments,this method allows obtaining classification results with higher specificity (withcosts in sensitivity). Comparing the ACC ROC curves with the ones from theACT and POS topologies, one could hypothesize that the ACC combines differ-ent features of both topologies. This is supported by the fact that the zero-crossingfeature extraction method used for the ACT preprocessing can be seen as a fre-quency measure which was also included in the spectral representation. Further,
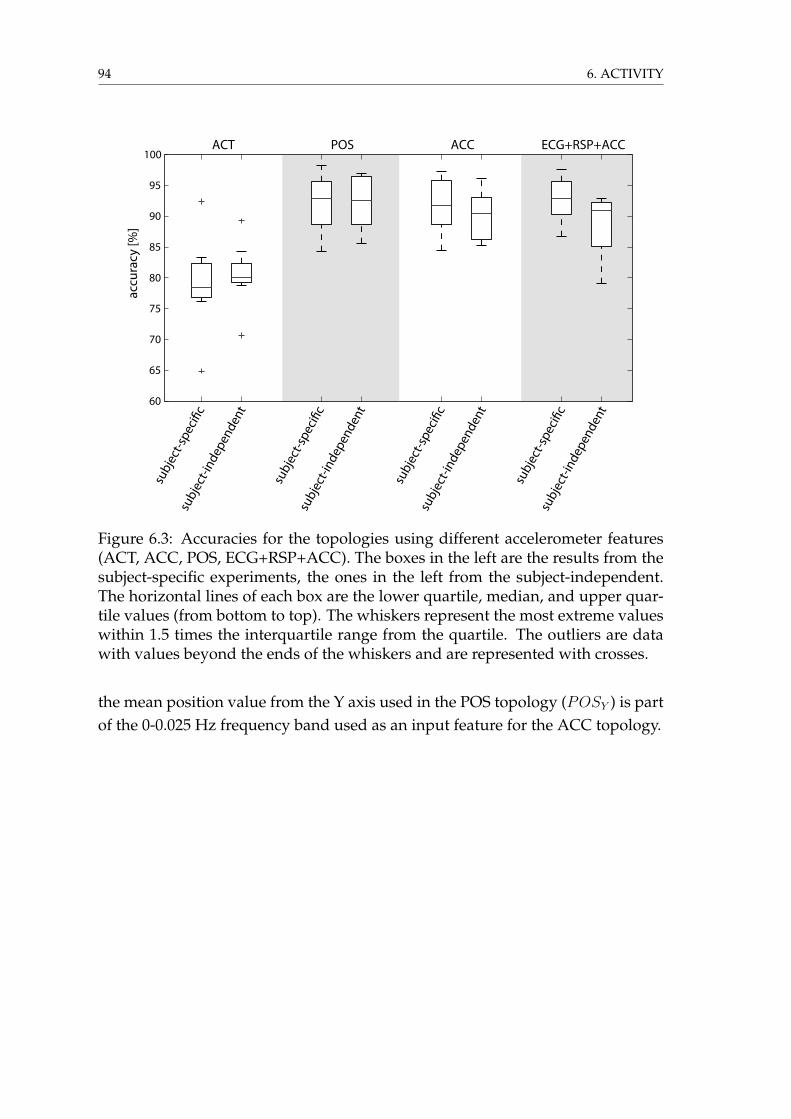
94 6. ACTIVITY
60
65
70
75
80
85
90
95
100
subj
ect-i
ndep
ende
nt
subj
ect-s
peci�
c
subj
ect-i
ndep
ende
nt
subj
ect-s
peci�
c
subj
ect-i
ndep
ende
nt
subj
ect-s
peci�
c
subj
ect-i
ndep
ende
nt
subj
ect-s
peci�
c
ACT POS ACCac
cura
cy [%
]ECG+RSP+ACC
Figure 6.3: Accuracies for the topologies using different accelerometer features(ACT, ACC, POS, ECG+RSP+ACC). The boxes in the left are the results from thesubject-specific experiments, the ones in the left from the subject-independent.The horizontal lines of each box are the lower quartile, median, and upper quar-tile values (from bottom to top). The whiskers represent the most extreme valueswithin 1.5 times the interquartile range from the quartile. The outliers are datawith values beyond the ends of the whiskers and are represented with crosses.
the mean position value from the Y axis used in the POS topology (POSY ) is partof the 0-0.025 Hz frequency band used as an input feature for the ACC topology.

6.3. RESULTS AND DISCUSSION 95
ACT
POS
ACC
subject-independent
sens
itivi
ty
1-specificity
sens
itivi
tyse
nsiti
vity
1-specificity
0 0.2 0.4 0.6 0.8 10
0.2
0.4
0.6
0.8
1
0 0.2 0.4 0.6 0.8 10
0.2
0.4
0.6
0.8
1
0 0.2 0.4 0.6 0.8 10
0.2
0.4
0.6
0.8
1
0 0.2 0.4 0.6 0.8 10
0.2
0.4
0.6
0.8
1
0 0.2 0.4 0.6 0.8 10
0.2
0.4
0.6
0.8
1
0 0.2 0.4 0.6 0.8 10
0.2
0.4
0.6
0.8
1
subject-specific
test subject1
2
3
4
5
6
7
8
Sadeh
Cole
Figure 6.4: ROC curves for the accelerometer preprocessing (ACT, POS and ACC)experiments. Top right: The stars correspond to the ROC points obtained byde Souza et al. (2003) using the two actigraphy algorithms proposed by Coleet al. (1992) and Sadeh et al. (1994).

96 6. ACTIVITY
Figure 6.5: ROC curves for the combined architecture ECG+RSP+ACC. Becauseof large inter-subject variations in the ECG and RSP features, the ROC curves areflatter and the ROC points are more scattered in the subject-independent experi-ments.
The combination of the physiological features ECG and RSP with the ACC(ECG+RSP+ACC) shows no significant difference in accuracy (Student’s t-test,p=0.7), although mean accuracy is slightly higher and the SD lower compared tothe ACC topology in the subject-specific experiments. For the subject-independentexperiments, the over-fitting due to the physiological signals shown in Section 5.6is still present (Student’s t-test, p=0.09). However, the use of the ACC make theclassification significantly better than when using only physiological signals (Stu-dent’s t-test, p<0.01). This improvement is also observable on the ROC plots inFigure 6.5.
6.4 Conclusion
Accelerometer based features have shown good classification results for subject-specific and subject-independent experiments. Because accelerometers measuresleep and wake behaviors, the sleep / wake classifier generalize well between thestudied users. However, because the measured behaviors are not unique to sleep,the classifiers show a tendency for low specificity, especially for subjects whichhave low activity during wake or show low sleep efficiency. These observationshave also been shown previously by many other research groups (de Souza et al.,

6.4. CONCLUSION 97
Mean differenceSleep parameters Mean ± SD from Video ± SD
1. Total Sleep Time (TST) [hours]Video (label) 6.06 ± 0.94ACT 6.99 ± 1.48 -0.93 ± 1.39POS 7.11 ± 1.46 -1.05 ± 1.21ACC 6.69 ± 1.09 -0.63 ± 0.85ECG+RSP+ACC 6.13 ± 1.62 -0.07 ± 1.622. Awakenings [numbers]Video (label) 28.07 ± 11.7ACT 30.07 ± 13.57 -2 ± 10.67POS 1.64 ± 1.70 26.42 ± 11.46ACC 114.61 ± 55.40 -86.53 ± 53.48ECG+RSP+ACC 176.71 ± 89.83 -148.64 ± 92.383. Sleep Efficiency [%]Video (label) 82.81 ± 10.01ACT 94.76 ± 16.31POS 94.9 ± 4.32ACC 89.38 ± 3.76ECG+RSP+ACC 82.16 ± 12.01
Table 6.2: Comparison of sleep parameters for the subject-independent experi-ments of the ACT, POS, ACC and the ECG+RSP+ACC topologies with the label-ing from the human expert (Video). The sleep efficiency is calculated by Time InBed over Total Sleep Time.
2003 and Edward et al., 2004 and Sadeh and Acebo, 2002).As the state of the art highlighted in Section 2.2.3, classifiers using only activity
related features do not have the potential to extract information about sleep dis-orders (Sadeh and Acebo, 2002) and overestimate Total Sleep Time. To make ad-vantage of the generalization properties of the actigraphy features and the speci-ficity of the physiological features we introduced a combined ANN architecturethat uses frequency features from ECG, RSP and ACC. Whereas this architectureshows very promising results for the subject-specific experiments, due to the poorgeneralization capabilities of the physiological signals, the subject-independentexperiments do not perform as good as when using accelerometer features only.However, the combined architecture still shows a significant improvement com-pared to the only physiological topologies seen in Chapter 5.

98 6. ACTIVITY
7 Adaptation
Cornered c© 2007 Mike Baldwin. Used by permission of Universal Press Syndicate.All rights reserved.
In Chapter 5 we have seen that when using RSP and ECG signals for a wear-able sleep / wake classifier, no accurate subject-independent ANN could be trained.Further, when using current labeling techniques (video and electrophysiologicalrecordings), the supervised training of a subject-specific network was not practi-cal and not welcomed by the users. To overcome these limitations and to design awearable system which can potentially classify sleep and wake in anybody with-out intrusive or inconvenient calibration methods, we present in this chapter twopossible adaptation strategies. The core innovation of these strategies concernsthe methods how to label the sleep / wake behavior of the subjects automaticallyand without being intrusive. We found two simple automatic labeling methodsusing a priori knowledge from sleep behaviors, which need little or no user inter-action, respectively. At the end of this chapter we will discuss the performance of
99

100 7. ADAPTATION
the adapted networks.
7.1 User Adaptation
In automated medical diagnosis, the physiological differences of human subjectsare normally taken into consideration by preliminarily classifying the subjectsinto different groups, e.g. groups for gender, age or pathologies. For each group,a different diagnosis or prediction model is then developed. Often the separationof these groups is diffuse and individuals may belong physiologically to anothergroup than the data used for the grouping might suggest. For example, a welltrained, healthy 60 year old man may, from a physiological point of view, ratherbelong to the age class of 35-45 instead 55-65. Therefore, as the physiologicaldifferences occur gradually and are subject-specific, the discrete separation intogroups leads to errors in the model selection and eventually also in the modeloutcome.
In mobile applications, user adaptation is limited to systems that adjust thehigh-level response to the user. For example, the training model of a personalassistant fitness trainer is adjusted according the average amount of training theuser performs (Buttussi and Chittaro, 2008) or the time and location for medica-tion intake reminders are carefully selected according to the user’s preferences(Kaushik et al., 2008). In principle, these approaches are not real adaptation pro-cesses, as they only select the predefined output of the applied model to thechanged context of the user, but not the static rules to obtain the desired out-put. These types of implementations have difficulties to give accurate output topreviously unseen situations.
In automated sleep scoring and sleep disorder classification from polysomno-graphy recordings, a common approach is the use of large databases containingsignal samples for different groups (Penzel et al., 2001). Then complex expertsystems classify the bio-medical signals by clustering them into specific groupsalready present in the database (Anderer et al., 2005 and Penzel and Conradt,2000). This approach requires a huge amount of processing and storage resources.Also, although the database is extended with each new scoring, it is never com-plete. Further, the need for large data sets with accurate pre-labeled data requiresconsiderable time investments and human intervention. A database look-up ap-proach is therefore not conceivable for an autonomous wearable system.
Hedner et al. (2004) suggested an adaptation method for off-line actigraphy

7.1. USER ADAPTATION 101
analysis of sleep and wake. The density of background movements of the sub-ject are used to adjust the activity count threshold on the digital integration (seeFigure 6.1) and a second threshold that discriminates the activity count betweensleep and wake for a 5-minute segment. However, there are two fundamentalproblems. First, the density of background movements is calculated for the en-tire night. This makes it impossible to determine the two thresholds before therecording ended. Second, the background movements need to be calculated overthe duration where the subject sleeps. But because this duration is defined by theclassifier whose threshold is not yet determined, an alternative measure mustbe used. Hedner et al. (2004) do not state explicitly over which duration thebackground movements were calculated ("throughout the night"). We suspect,as the recording system was only worn for one night per subject, that the back-ground movements were either computed for the whole recording duration orfor the sleep time determined from the polysomnography reference recording.Both ways of gathering this a priori knowledge are not practical or available inwearable applications.
An inspiring approach comes from the field of brain-computer interaction(BCI) where the typical EEG patterns reveal important intra-subject and inter-subject differences. The presence of error-related potentials (ErrP) in the EEGhas been used to improve the performance (bit rate and accuracy) of the brain-machine interface (Schalk et al., 2000). ErrP are negative potentials that can bedetected in the fronto-central EEG within half a second after the occurrence of anerror. The ErrP can be observed at the occurrence of either human related errors(response and feedback ErrP described by Blankertz et al., 2003 and Holroyd andColes, 2002 and Schalk et al., 2000) or machine related errors (interaction ErrP de-scribed by Ferrez and Millán, 2005). In a BCI problem, where intra-subject EEGdifferences within a recording session are detectable (Buttfield et al., 2006), the tobe performed action of a computer can be adapted according to the presence orabsence of the ErrP. For example, in Ferrez and Millán (2005) a brain-controlledvirtual robot is executing a previously classified direction command only if the vi-sual user-feedback did not generate an interaction ErrP in the users EEG. Anotherinteresting way to use ErrP in BCI is to use the presence of ErrP as reinforcementfeedback for adapting the classifier on-line (Chavarriaga et al., 2007).
Ideally, a change in the physiological signal similar to ErrP, but with respectto the sleep / wake detection, would lead to an automatic association of new pat-terns to sleep and wake of the user. Such an approach would be advantageousbecause the user would not need to enter personal data to select an appropri-
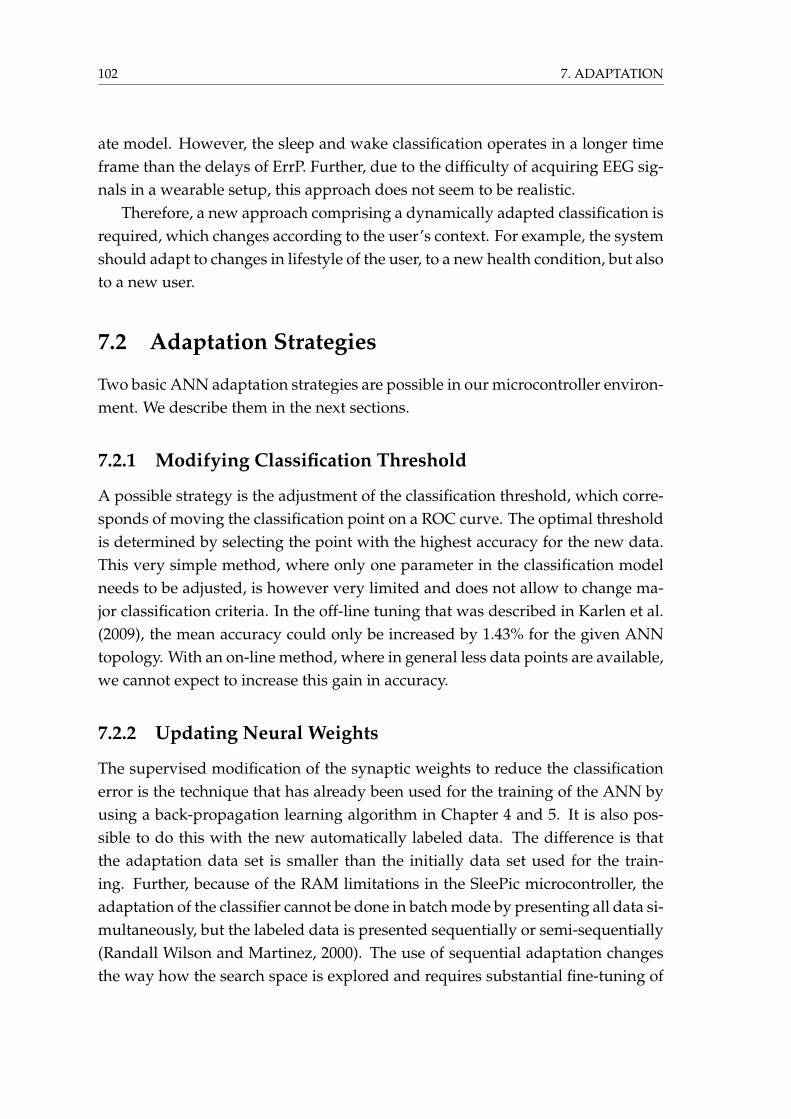
102 7. ADAPTATION
ate model. However, the sleep and wake classification operates in a longer timeframe than the delays of ErrP. Further, due to the difficulty of acquiring EEG sig-nals in a wearable setup, this approach does not seem to be realistic.
Therefore, a new approach comprising a dynamically adapted classification isrequired, which changes according to the user’s context. For example, the systemshould adapt to changes in lifestyle of the user, to a new health condition, but alsoto a new user.
7.2 Adaptation Strategies
Two basic ANN adaptation strategies are possible in our microcontroller environ-ment. We describe them in the next sections.
7.2.1 Modifying Classification Threshold
A possible strategy is the adjustment of the classification threshold, which corre-sponds of moving the classification point on a ROC curve. The optimal thresholdis determined by selecting the point with the highest accuracy for the new data.This very simple method, where only one parameter in the classification modelneeds to be adjusted, is however very limited and does not allow to change ma-jor classification criteria. In the off-line tuning that was described in Karlen et al.(2009), the mean accuracy could only be increased by 1.43% for the given ANNtopology. With an on-line method, where in general less data points are available,we cannot expect to increase this gain in accuracy.
7.2.2 Updating Neural Weights
The supervised modification of the synaptic weights to reduce the classificationerror is the technique that has already been used for the training of the ANN byusing a back-propagation learning algorithm in Chapter 4 and 5. It is also pos-sible to do this with the new automatically labeled data. The difference is thatthe adaptation data set is smaller than the initially data set used for the train-ing. Further, because of the RAM limitations in the SleePic microcontroller, theadaptation of the classifier cannot be done in batch mode by presenting all data si-multaneously, but the labeled data is presented sequentially or semi-sequentially(Randall Wilson and Martinez, 2000). The use of sequential adaptation changesthe way how the search space is explored and requires substantial fine-tuning of

7.3. AUTOMATIC SLEEP AND WAKE LABELING 103
the training parameters for the back-propagation algorithm. The unsupervisedupdate of neural weights (e.g. with clustering) is also possible. However, cluster-ing techniques are in general computational expensive and require a large dataset. Both conditions are not fulfilled with our wearable system.
Since it has been shown in Chapter 4 that the intra-subject differences of thesleep physiology are less important than the inter-subject differences (for inter-and intra-subject EEG pattern stability in deep sleep over several weeks see Buck-elmüller et al., 2006), it is reasonable to update the neural weights not continu-ously on-line, but at regular intervals using a semi-sequential method. In orderto compare the results of the adaptation experiments with the results from thesubject-independent experiments obtained in Chapter 5, we selected the adap-tation interval duration equal to the recording duration (approximatively 36 h).Experiments not described in this thesis showed that the accuracy of the ANNsthat were adapted on-line for the duration of the recording was not different com-pared to the accuracy of the ANNs trained with the suggested semi-sequentialmethod.
7.3 Automatic Sleep and Wake Labeling
To adjust the classification performance of an ANN in a supervised manner, priorinformation about the users’ sleep and wake states is needed. The video analysisused until now or any other known sleep / wake discrimination methods de-scribed in Chapter 2 (EEG, PSG, actigraphy) would need some off-line analysisby a human or machine expert and they are not suitable for an on-line, wearablesystem. Equally, unsupervised clustering methods like the one used in Huynhand Schiele (2006) and Krause et al. (2006) are too computationally intensive.Further, it is very unlikely that unsupervised training can find a more accurateclassifier than a supervised, subject-specific training as described in Chapter 4.
So far, nobody has found a unique change in physiological signals that canaccurately and automatically predict a difference between the sleep and wakebehavior. Therefore, we suggest creating a new way to gather on-line informa-tion, which can automatically label the recorded physiological data to adapt theclassifier. This new way of labeling the data should comply with the followingcriteria:
• High accuracy of the labeling: The trained classifier can only be as goodas the a priori knowledge used for training. Imprecise labeling will cause

104 7. ADAPTATION
training on wrong data patterns.
• Low power: The information gathering should be possible with equal com-putational and sensing resources than what are used for classification.
• Low user interaction: The less the subject is disturbed in her/his daily ac-tivities, the more the device is going to be accepted.
We present in the following two sections two new algorithms for the auto-mated, on-line labeling that can be used together with the previously presentedSleePic device (Chapter 5):
a) Button Feedback, which requires minimal user interaction with the system;and
b) Activity Feedback, which automatically labels the data based on activity dataof the user.
7.3.1 Button Feedback
The basic idea of this approach is to exploit a behavioral phenomenon of sleep(see Chapter 2), which is the elevated arousal threshold. Under the effect ofsleep, the user does not respond to external stimuli of weak or moderate intensity(Carskadon and Dement, 1989). The response to a stimulus is therefore evidencefor being awake. Possible stimuli can be auditory, visual or tactile. The difficultylies in finding the right stimuli and the corresponding intensity for not waking upthe person, especially if he or she is in the beginning of light sleep (sleep stage 1,Section 2.1) where the arousal threshold is lower (Carskadon and Dement, 1989).If the stimulus is meaningful to the subject, the arousal threshold is also expectedto be lower than normal (Oswald et al., 1960 and Williams et al., 1966).
We suggest stimulating the subject with a blinking LED on the SleePic Watchand simultaneously with a single, light vibration on the chest, neither of whichcan be perceived during sleep under normal circumstances. This stimulation israndomly generated by the SleePic Core module every 15 to 60 minutes. If thesubject reacts to this stimulation by pressing a button on the SleePic Watch withinone minute of blinking (button = 1), he/she is considered to be awake (l = −1).If a response is missing (button = 0), the subject is either asleep or he missedthe stimulus. In that case, the activity (act) within the stimulus period, as it wasintroduced in Section 6.1 is analyzed. If it is below a threshold of 0.1, the user isconsidered to be asleep (l = 1) and otherwise, no labeling is carried out (l = NaN )

7.4. RECORDINGS 105
because the subject probably missed the stimulus due to her/his activity. Thislabeling method can be summarized as:
l(button) =
−1 if button = 1
1 if button = 0 and act ≤ 0.1
NaN otherwise(7.1)
The physiological data from the 20 seconds segment previous to the stimuluswere labeled to avoid training on the button pressing movement patterns whichmay eventually arise in the signal patterns.
7.3.2 Activity Feedback
From our studies on actigraphy in Chapter 6 we know that certain movementpatterns of a user can reliably be associated to his/her sleep and wake states. Wetherefore propose to use typical movement patterns from actigraphy to obtain anumber of labeled physiological data segments without any user interaction. In-spired from the actigraphy algorithm of Cole et al. (1992), we decided to examinefour prior and two posterior activity data segments of 1-minute size (Equation6.1). If the activity of each of the segments in the resulting 7-minute windowis very low (≤0.1) or high (≥1), we consider the central 20 seconds as sleep orwake, respectively. Otherwise we do not label the data (l = NaN ). This can beformulated by:
l(actn) =
1 if actn−4,...,n+2 ≤ 0.1
−1 if actn−4,...,n+2 ≥ 1
NaN otherwise(7.2)
This labeling is more conservative than the algorithm of Cole et al. (1992) becauseit requires all seven segments to have low activity (and not only the sum of them)and it does not label uncertain segments.
7.4 Recordings
To generate an adaptation data set with the feedback methods presented in Sec-tion 7.3 the SleePic recordings described in Section 5.2 were used. To record But-ton Feedback data, we conducted a series of reaction tests during the recordings.

106 7. ADAPTATION
The subjects were instructed to press the button as soon as they saw the blink-ing LEDs on the SleePic Watch. A light vibration on the chest coming from theSleePic Sensor Module reminded them to look at their watch, but the vibrationwas not perceived when the subject was very active or when she/he was sleep-ing. To motivate the button pressing, an award for the study participant with theleast missed blinking was promised.
For the Activity Feedback we reused the accelerometer recordings obtainedfrom the SleePic experiments directly.
The SleePic Core recorded the reaction test response times and the corre-sponding physiological signal segments to the Flash card. It was found that theSleePic Core encountered a writing failure for two subjects during the first night.The missing "no answer" messages for these nights were substituted. The ActivityFeedback data and the physiological data were still available for the concernednights because it was recorded to another Flash card.
On average, 1.83 labeled segments per hour were obtained from the ButtonFeedback. Thereof contained 36% sleep labels. This corresponds to the samesleep / wake proportion as for the entire recording. Using the labeling rule inEquation 7.1, neither false positive nor false negative labels were generated. Thelabeling from the Activity Feedback contained in average 14 labeled segmentsper sleep hour and 8.9 per wake hour. Using the labeling rule from Equation 7.2,we generated a total of 27 false sleep and 6 false wake labels, which correspondsto an error rate of 1.3%. The wrong labels were not discarded for the adaptationprocess.
7.5 Experiments
To evaluate the adaptation strategies presented in Section 7.2 and to qualify theobtained feedback data described in Section 7.4 we conducted a series of exper-iments using the new data to adapt five different network topologies that weredesigned in Chapter 5 and 6. The topologies differed in the input signal vector.The networks topologies consisted either of each individual signal (ECG, RSP,ACC), or a combination thereof (ECG+RSP, ECG+RSP+ACC). The labeled datafrom the Button and Activity Feedback were randomly split into an adaptationdata set (80%) and a validation data set (20%). For each user 10 different adapta-tion and validation data sets were generated.

7.5. EXPERIMENTS 107
7.5.1 Threshold Experiments
In this set of experiments, we modified the classifiers obtained with the subject-independent experiments in Chapter 5 and 6 by changing the classification thresh-old. The adaptation data set composed of the Button Feedback and the ActivityFeedback data of the user that was not present for the training, was used to findthe optimal threshold with an iterative process. The classification threshold wasincremented in steps of 0.05 from -1 to 1 and the classification performance onthe adaptation set calculated. The threshold giving the highest accuracy was se-lected. As test data set, the same set as in the subject-independent experiments(Section 5.2.3) was used. For each generated adaptation and validation data setone run was performed. This was repeated for each user (8 times) and each topol-ogy, making a total of 400 runs.
7.5.2 Neural Weight Experiments
In a second set of experiments, the adaptation, the validation and the test datasets remained the same as in the Threshold experiments (Section 7.5.1). The bestnetwork obtained from the subject-independent experiments in Chapter 5 and6 for each topology was used as a start network for the adaptation procedure.10 independent runs for each adaptation and validation data set were generated.Again, this was repeated for each user (8 times) and topology. The classifiers weretested on the same test data sets as used in the subject-independent experimentsand the threshold experiments.
We conducted two additional set of experiments, which were based on theNeural Weight experiments:
Feedback Experiments
To analyze the contributions from the individual feedback strategies to the per-formance of the networks obtained from the Neural Weight experiments, theseexperiments were repeated with only the labeled data from the Button Feedbackor the Activity Feedback in the adaptation and validation data set, respectively.
Training Experiments
To compare the Neural Weight adaptation experiments, where the neural weightsof a generalized ANN were adapted, to a subject-specific ANN (as it was intro-

108 7. ADAPTATION
duced in Section 4.3), we repeated the Neural Weight experiments with initializ-ing the ANN weights randomly at each run. This type of training corresponds tothe subject-specific training in Section 5.6, but by using the limited-size adapta-tion data set instead of the training data set. Again, the test data set stayed thesame and the experiments were repeated 10 times for each subject and topology.
7.6 Results and Discussion
In Figure 7.1, the accuracy obtained from the subject-independent experiments inChapter 5 (generalized) and from the adaptation experiments described in Sec-tion 7.5.2 (adapted) are shown. As mentioned before in Chapter 6, the resultsof the generalization experiments show that topologies containing the frequencyfeatures of the accelerometer data (ACC) as input perform statistically better thanthe topologies without the ACC (Student’s t-test, p<0.05, for all cases). Whereasthe adaptation did not significantly increase the accuracy of the ACC topology,the adaptation improved the accuracy of all topologies containing cardiorespira-tory signals as inputs (Student’s t-test, p<0.01). Although the adaptation methodsimproved the accuracy of the ECG features based topology significantly, the ac-curacy did not reach the ones of the RSP or ECG+RSP topologies (Student’s t-test,p<0.01). This suggests that ECG features have a too important intra-subject vari-ation and are not recommended to be used as only features in a wearable sleep /wake classifier.
7.6.1 Threshold versus Adaptation
To evaluate the different adaptation strategies we conducted experiments usingthe automatically labeled adaptation data set. Figure 7.2 shows the accuracies ofthe classifiers for the adaptation experiments described in Section 7.5.1 and 7.5.2.The threshold modification strategy (Threshold; boxes in the left columns) cannotimprove the generalized network and results in a lower accuracy range (medianaccuracy ≤ 81% for the physiological signal based topologies) than the other twomethods. The accuracies of the training experiments (Training; boxes in the centercolumns) and adaptation experiments (Adaptation; boxes in the right columns)are significantly better (Student’s t-test, p<0.01) than the threshold accuracies (ex-cept for the ACC topology), but there was no significant difference between themfor all topologies (Student’s t-test, p>0.95). This may suggest that there is no ad-vantage in initially training a general classifier. However, several aspects are in

7.6. RESULTS AND DISCUSSION 109
40
50
60
70
80
90
100
Acc
urac
y [%
]
gene
raliz
ed
adap
ted
ACC RSP ECG ECG+RSP ECG+RSP+ACC
gene
raliz
ed
adap
ted
gene
raliz
ed
adap
ted
gene
raliz
ed
adap
ted
gene
raliz
ed
adap
ted
Figure 7.1: Accuracy of the five different ANN input topologies (ACC, RSP,ECG, ECG+RSP, ECG+RSP+ACC). Left boxes: Results of subject-independentnetworks obtained in Chapter 5 (generalized). Right boxes: Results when adapt-ing the generalized networks with the adaptation data sets. The horizontal linesof each box are the lower quartile, median, and upper quartile values (from bot-tom to top). The whiskers represent the most extreme values within 1.5 times theinterquartile range from the quartile. The outliers are data with values beyondthe ends of the whiskers and are represented with crosses.
favor of adapting a generalized network to a new user. As can be seen in Table7.1, the adaptation experiments need fewer training cycles before the adaptationprocess can be stopped. This is because the exploration of the search space waslimited by local minima. This is not a disadvantage because in our case,
a) the adapted networks do generalize statistically better (Student’s t-test, p<0.05)for other users (Table 7.1, 2nd row);
b) the obtained accuracy is not lower for the adapt experiments;
c) the adaptation method escapes potential local minima when the input fea-tures display elementary differences for the new subject (outliers of RSP orECG topologies in Figure 7.1); and
d) when training an initialized networks, it can neither be excluded that the

110 7. ADAPTATION
Acc
urac
y [%
]
ACC RSP ECG ECG+RSP ECG+RSP+ACC
Thresh
old
Train
ing
Adapta
tion
Thresh
old
Train
ing
Adapta
tion
Thresh
old
Train
ing
Adapta
tion
Thresh
old
Train
ing
Adapta
tion
Thresh
old
Train
ing
Adapta
tion
40
50
60
70
80
90
100
Figure 7.2: Accuracy for the two different adaptation strategies and thesubject-specific training of the five different ANN input topologies (ACC, RSP,ECG,ECG+RSP, ECG+RSP+ACC). Left: Result using the Threshold adaptationstrategy (Threshold). Middle: Result from the Training strategy (initializing thenetworks and training with the adaptation data). Right: Result when using ageneralized network and adapting the neural weights (Adaptation).
training becomes stuck in a local minimum.
Finally, during the adaptation recording process, the generalized networks willalready give reasonable classification results, whereas when using a freshly ini-tialized network, the system will not be able to output a meaningful sleep / wakeclassification.
7.6.2 Button versus Activity Feedback
To qualify the data obtained from the different feedback methods for the auto-matic labeling we repeated the adaptation experiment with each labeling sourceor a combination thereof. Figure 7.3 shows a boxplot for the accuracy when usingthe Button Feedback, Activity Feedback or the combination of both (used previ-ously for the analysis) in the adaptation data set and the neural weight adaptationstrategy. A positive trend in accuracy toward the larger data sets (Button < Ac-tivity < Button+Activity) can be observed. It seems that the Button Feedback

7.6. RESULTS AND DISCUSSION 111
Training Adaptation
Training cycles [number]Mean 6.85 4.9Standard error 0.14 0.10Maximal cycles 24 8
Accuracy of generalization training set [%]Mean 74.76 86.13Standard error 0.61 1.04Highest accuracy 86.57 94.99
Table 7.1: Comparison of the Training and Adaptation of Neural Weight Strategyfor ECG+RSP+ACC. The training cycles correspond to the number of cycles thealgorithm has to modify the synaptic weights of the networks until a stop con-dition (Section 4.1.2) of the training is reached. The accuracy of generalization ismeasured by presenting the data set of the subjects not present in the adaptationdata set to the adapted networks.
did not provide enough data points for efficient training. This is supported bythe fact that the adaptation with the Button data only was not able to reach theaccuracy obtained in the subject-specific experiments shown in Figure 5.9. Forthe combined topology ECG+RSP+ACC, neither of the three feedback methodsinfluenced accuracy, sensitivity or specificity (Student’s t-test, p>0.75; Table 7.2).
The sleep and wake behaviors of subjects that displayed a low sleep efficiency(Chapter 6) were particularly difficult to detect with only accelerometer data be-cause the subjects did not move much and were almost in an sleeping position.One subject watched TV before going to sleep in his bed for a total of 135 min-utes and was therefore the most difficult subject in our data set. Figure 7.4 showsthe ROC curves of the three best adaptation experiments for this particular userand each feedback method. Interestingly, the specificity of the combined case(diamond) was higher than the one of the single Button Feedback (5-point star)and of the Activity Feedback (6-point star). This is also the case for the accu-racy (Combined Feedback 91.01%, Button Feedback 86.42%, Activity Feedback87.64%). This finding indicates that not only does the increasing number of seg-ments in the adaptation data set improve the performance of the classification,but that the different sources for the adaptation data sets are complementary. Thiscan be explained by the nature of the adaptation data. Whereas data from the Ac-tivity Feedback came only from clearly classifiable segments of sleep and wakeusing accelerometer data, the randomly sampled Button Feedback data contained

112 7. ADAPTATION
more segments from periods that were more difficult to classify. However, as theButton Feedback required some attention of the user, it would not be wise in-creasing this feedback frequency since the users rated the actual frequency asacceptable (Section 5.3).
For an improvement of the method of gathering the adaptation data we sug-gest to use a combined solution using the Equation 7.2 and a modified Equation7.1, where the button pressing task is not activated randomly, but by using priorknowledge. A possible source of prior knowledge could be for example the useof the unthresholded output of the ANN. If the output is close to the classificationthreshold where the classification uncertainty is increased, an additional buttonpressing request could be useful.
Feedback Button (B) Activity (A) B&A
accuracy [%] 91.59 ± 4.33 92.67 ± 2.83 92.94 ± 3.37sensitivity 92.64 ± 6.92 96.25 ± 3.04 96.09 ± 3.63specificity 90.57 ± 4.52 89.62 ± 4.72 90.42 ± 4.72
Table 7.2: Mean ± SD of accuracy, sensitivity and specificity for different adapta-tion data sets using the ECG+RSP+ACC topology.
7.6.3 Subject-Specific versus Subject-Independent Systems
As it can be observed in Figure 7.1, 7.2 and 7.3, the accuracy of any adaptationmethod shows no significant difference to the subject-independent experimentsfor the simple ACC topology. Table 7.3 shows the mean and standard deviationfor the accuracy, sensitivity and specificity for the ACC topology. We observeno statistical difference in accuracy between the three experiments (Student’s t-test, p>0.40). Indeed, the training and adaptation to a particular user even hasa slight negative effect on the median specificity. This results in an overestima-tion of the actual sleep time shown in Table 7.4 (Student’s t-test, p<0.1). Thesetwo observations suggest that the ACC data is able to generalize well betweendifferent users and adaptation or retraining for a new user is not necessary. How-ever, as observed in various previous studies, only accelerometer data does notaccurately classify wake states with low activity which can be observed in thelower specificity for all topologies in Table 7.3 (89 ± 6.68 % for the generalizationexperiment).
In Figure 7.5 we show the ROC curve of the ACC and the ECG+RSP+ACC

7.6. RESULTS AND DISCUSSION 113
Button
Activit
yButto
n+Activit
y
Acc
urac
y [%
]ACC RSP ECG ECG+RSP ECG+RSP+ACC
Button
Activit
yButto
n+Activit
y
Button
Activit
yButto
n+Activit
y
Button
Activit
yButto
n+Activit
y
Button
Activit
yButto
n+Activit
y
40
50
60
70
80
90
100
Figure 7.3: Accuracy for the adapted ANN when using different methods forgenerating the adaptation data set for five different input topologies (ACC, RSP,ECG, ECG+RSP, ECG+RSP+ACC) . Left boxes: Results obtained when using onlydata collected with the Button Feedback method. Middle: Results obtained whenusing data from the Activity Feedback method. Right: Results when using com-bined data.
topologies for the generalized and the adapted networks obtained from the samesubject as previously described in Section 7.6.2. The generalized ACC networkperformance (square) shows very high sensitivity and low specificity. Adaptingthe network improves the specificity at the cost of sensitivity (circle). The general-ized ECG+RSP+ACC network has a low (but symmetric) performance (triangle).The adaptation process also improves sensitivity and specificity (diamond) con-siderably and leads to the highest accuracy of all cases (91.01%) .
The ECG+RSP+ACC topology is interesting because it was the network withthe highest adapted accuracy (96.93%) and it had the highest mean accuracy ofall experiments (93.18%). Table 7.5 shows the mean and standard deviation forthe accuracy, sensitivity and specificity for this topology. We observe a statisticalimprovement of accuracy (Student’s t-test, p<0.05) and sensitivity (Student’s t-test, p<0.03) for both the adapted and the trained networks.
The output of the adapted ECG+RSP+ACC classifier is illustrated for two sub-jects in Figure 7.6. The classification pattern in Figure 7.6a originated from the

114 7. ADAPTATION
0 0.05 0.1 0.15 0.2 0.25 0.30.70
0.75
0.80
0.85
0.90
0.95
1
1−speci�city
sens
itivi
ty
Button Feedback
Activity Feedback
Button & Activity Feedback
Figure 7.4: Receiver Operating Characteristic (ROC) curves for one particularsubject that had many low activity wake events during the study. These eventsare difficult to classify with traditional actigraphy. Note that the ROC figure is azoom-in.
[%] generalized trained adapted
accuracy 92.54 ± 3.90 92.78 ± 3.00 92.76 ± 2.82sensitivity 96.06 ± 3.00 97.17 ± 2.65 97.08 ± 2.38specificity 89.30 ± 6.68 88.99 ± 4.95 88.29 ± 6.47
Table 7.3: Mean ± SD of accuracy, sensitivity and specificity for different trainingmethods using the ACC topology.
subject with the highest classification accuracy obtained. The errors were mainlylocated before sleep onset and during sleep. The classifier tends to anticipatesleep onset as it already has been observed in Chapter 4. Many of the errorsduring sleep were due the non-overlapping of detected and labeled awakenings,which generated a false positive and a false negative error each. The sleep / wakepatterns in Figure 7.6b belong to the same subject that was already presented inFigure 7.4 and 7.5 and which was the most difficult case for the classifier. Mosterrors were still generated in the period where the subject was lying calmly inbed. However, the classifier did not respond uniquely to the position of the sub-ject (due to the use of the cardiorespiratory features). Further, in the misclassifiedwake regions, due to the calm lying, the density of correctly classified wake wasvery high. This suggests that the specificity of the presented classifier could beincreased with some post-processing filtering technique.

7.6. RESULTS AND DISCUSSION 115
Mean differenceSleep parameters Mean ± SD from Video ± SD
1. Total Sleep Time (TST) [hours]Video (label) 6.06 ± 0.94ACC 6.79 ± 0.99 -0.73 ± 0.67ECG+RSP+ACC 6.73 ± 0.92 -0.67 ± 0.532. Awakenings [numbers]Video (label) 28.07 ± 11.70ACC 61.85 ± 37.34 -33.79 ± 33.17ECG+RSP+ACC 51.17 ± 26.95 -23.10 ± 24.153. Sleep Efficiency [%]Video (label) 82.81 ± 10.01ACC 90.64 ± 6.44ECG+RSP+ACC 90.09 ± 7.05
Table 7.4: Comparison of sleep parameters for the adaptation experiments of theACC and the ECG+RSP+ACC topologies.
0 0.2 0.4 0.6 0.8 10
0.2
0.4
0.6
0.8
1
1−speci�city
sens
itivi
ty
general adapt
ACC
ECG+RSP+ACC
Figure 7.5: Receiver Operating Characteristic (ROC) curve for one particular sub-ject (same as in Figure 7.4) that had many low activity wake events during thestudy.
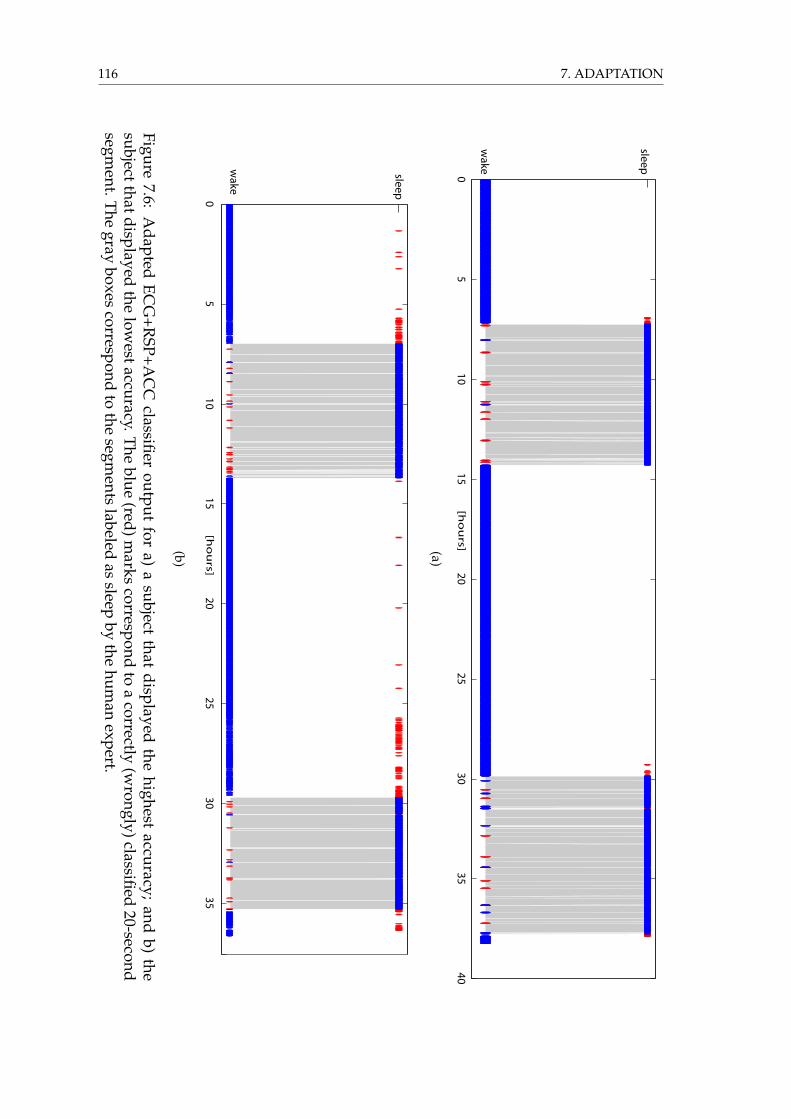
116 7. ADAPTATION
05
1015
2025
3035
40
wake
sleep
ac
cu
rac
y9
7.0
72
3
[ho
urs](a)
05
1015
2025
3035
wake
sleepa
cc
ura
cy
91
.79
94
[ho
urs]
(b)
Figure7.6:
Adapted
ECG
+RSP+A
CC
classifieroutput
fora)
asubject
thatdisplayed
thehighest
accuracy;and
b)the
subjectthatdisplayedthe
lowestaccuracy.The
blue(red)m
arkscorrespond
toa
correctly(w
rongly)classified20-second
segment.T
hegray
boxescorrespond
tothe
segments
labeledas
sleepby
thehum
anexpert.

7.7. CONCLUSION 117
[%] generalized trained adapted
accuracy 90.22 ± 4.28 92.99 ± 3.00 92.94 ± 3.37sensitivity 89.57 ± 8.54 96.78 ± 2.47 96.09 ± 3.63specificity 90.48 ± 5.56 89.38 ± 5.25 90.42 ± 4.72
Table 7.5: Mean ± SD of accuracy, sensitivity and specificity for different trainingmethods using the ECG+RSP+ACC topology.
7.7 Conclusion
We have shown that the maximal accuracy for the ACC topology can be reachedwhen it is trained for a subject-independent application and an adaptation to anew user has only minimal effects on the performance of such a classifier. In thesame way, we have shown that the ANN classifiers that were based on a phys-iological signal topology can be improved significantly when adapting neuralweights. Although the accuracy of the adapted networks did not significantly ex-ceed the ones from the ACC networks, the use of cardiorespiratory signals for theclassification displayed an advantage in the particular case when subjects showedlow activities during wake, which was impossible to classify when relying onaccelerometer data only.
Despite the improvements given by the adaptation methods, the sleep param-eters (Total Sleep Time and Awakenings) were overestimated.
However, the main achievement was the description and evaluation of twomethods for power and computational efficient gathering of labeled data aboutthe subjects’ sleep / wake states in an automatic way. Both methods made useof measurements of typical behaviors that are associated with normal sleep andwake, notably the measuring of an increased arousal threshold and of a main-tained behavioral quiescence during sleep. The suggested methodology is basedonly on occasional button pressing of the subject and the measurement of theuser’s activity. Because of the simplicity and the low requirements of this method,it is not limited to the cardiorespiratory sleep / wake classification presentedhere, but could also be used for automatic adaptation of other sleep discrimi-nation algorithms.

118 7. ADAPTATION

8 Concluding Remarks
Calvin and Hobbes are lying relaxed and satisfied on a tree branch(strip not available for the online version)
Calvin and Hobbes c© 1995 Watterson. Universal Press Syndicate. All rights reserved.
8.1 Main Achievements
This thesis aimed at developing methods and technologies toward personalized,context-aware health information systems. The integration of signal processingand classification methods into low-power microcontrollers, as well as the analy-sis and selection of relevant physiological and non-physiological signals for sleep/ wake classification carried out in this thesis have made the development of aself-contained wearable hardware platform possible. The automatic and simpleuser-adaptation proposed here renders the system user friendly and affordablefor a large public.
The challenges of wearable devices that were identified in Chapter 3, such aslimited energy, low computational power, increased susceptibility to noise andartifacts, and the need for comfort and unobtrusiveness, led to the use of spectral
119

120 8. CONCLUDING REMARKS
features of cardiorespiratory (ECG and respiration effort) and activity signals.Single-layer, feed-forward Artificial Neural Networks have proved to be an effi-cient classifier solution for the classification of these features on a microcontroller(Chapter 4). The sleep and wake classification accuracy of the proposed methodwas above 90% when data from the same subject was used for training, validationand testing.
Our experiments described in Chapter 4 and 5 have shown that the physiolog-ical differences between subjects make it difficult to build a single classifier basedonly on cardiorespiratory features. However, in order for the wearable system tobe used by the general public without expensive calibration or intervention froma human expert, it would be desirable to build a generalized classifier system. Ageneralized classifier could accurately discriminate sleep and wake for a generalpopulation.
Additional features obtained from activity measurements developed in Chap-ter 6 showed to be more robust to inter-subject variations. When training theartificial neural network (ANN) classifiers with these kind of features the classifi-cation accuracy improved for subject-specific, as well as for subject-independentexperimental setups. Activity measures have previously been used for long-termambulatory observations of sleep and wake behavior (Ancoli-Israel et al., 2003).Because low activity is a behavior that is not unique to sleep, the classifiers thatused only activity based features showed a higher error rate in detecting wakecorrectly (low specificity; Chapter 6). However, when computing the newly sug-gested frequency features of the accelerometer data we have shown an improve-ment of the wake detection rate compared to the known actigraphy methods.Our new method had a higher specificity because it combines body positionand activity information. With the same series of experiments we showed thatthe ANNs based on accelerometer features generalize well for the studied agegroup. Furthermore, the inability of traditional actigraphy algorithms to distin-guish low-activity wake from sleep was partially eliminated by the combinationof the spectral features of activity with cardiorespiratory features. This topologysetup showed a better generalization to new users than when only cardiorespira-tory topologies were used. However, due to an over-fitting on the physiologicalsignals during the training procedure of the ANNs, this network topology stillhad lower generalization properties than when only an activity topology wasused.
Additional research conducted on adaptation methods in Chapter 7 revealednew methods to automatically adapt the classifiers to individual subjects and to
8.1. MAIN ACHIEVEMENTS 121
improve the performance. These methods are based on the principle of activelyand passively measuring sleep and wake behaviors such as the measurement ofreactivity and activity that show only low variation for distinct subjects in thestudy group. This a priori information is used to automatically label the cor-responding physiological data and to adapt the subject-independent classifiersaccordingly. This led to performances of the ANN classifier comparable to thesubject-specific experiments. Using such an adaptation approach offers the pos-sibility to distribute the same wearable system to different customers which in-corporates the same generalized sleep / wake classifier. After a few days of wear-ing, the system will then automatically specialize to the wearer without need forcumbersome off-line data collection or classifier training. Such a methodologyfor user-adaptation may be suitable not only for sleep / wake applications, butalso for other domains where subject-specific physiological signals are used, suchas evaluation of stress and emotion (Picard, 1998), vegetative state control (Awa-Con, 2009) or assessing the depth of anesthesia (Sartori et al., 2006). Additionaldevelopment might be necessary to include closed loop control of the adaptationprocess to ensure long term stability and validity of the classifier.
Although the presented methods are conceptual and the test population of theexperiments was limited to young and healthy subjects, the proposed adaptationmethod has potential to adapt the ANN classifier on-line to any user.
The conducted experiments were focused on real-world, long-term ambula-tory measurements. Using realistic data has several advantages. For example theANNs could be trained on data from environments where the networks actuallywill be used. This reduced the risk of over-fitting to irrelevant data. Further, theinfluence of noisy signals and the persons’ behavior were integrated into the clas-sifier training, which reduced the required filtering of the signals to a minimum.However, the use of ambulatory data made the validation of the method moredifficult. It was not possible to obtain simultaneous, qualitatively good electroen-cephalographic (EEG) recordings that is used in clinical sleep research and wouldhave allowed for more accurate a priori sleep / wake knowledge for labeling ofdata. The video, eye movement, and muscle activity recordings that were used inthis thesis for the labeling of data correlates with clinical polysomnography label-ing (Section 3.1.3), but is not considered as the gold standard for sleep analysis.
The studied group, which was limited in sample size, showed a high sleep effi-ciency (sleep duration divided by time in bed) and almost no observed sleep in anupright position. Although sleep efficiency does not correlate with the specificityof the physiological classifiers, we could not show that the proposed method can

122 8. CONCLUDING REMARKS
detect sleep independently of body position. To demonstrate this, a series of ex-periments would be needed where subjects cannot leave a fixed position differentfrom lying for the whole duration of the experiments.
Another limitation of this work is that we have only shown sleep and wakediscrimination in ’normal’ situations where the subjects were healthy and notsleep-deprived. For example, our experiments give no indication of the detectionof microsleep. Therefore, without further analysis, the method should not beused on an alarm system where the detection of short, involuntary sleep episodesmust be detected.
The SleePic hardware prototype developed for this thesis (Appendix B) canbe considered as a proof-of-concept for a new generation of health and wellnessdevices. It shows the feasibility of a wearable, on-line sleep/wake classifier us-ing low-cost components. The minimal processing power requirements of thepresented system opens new doors for the use of high-level algorithms like fa-tigue prediction models. Although cardiorespiratory signals can be measurednon-invasively with a wearable belt, it is still more cumbersome to use than awrist worn actigraphy device. It is therefore application-dependent whether asingle actigraph device or a combined physiological system as presented in thisthesis should be adopted. If, for example, the application is oriented toward sleepdisorder diagnosis, the system with additional cardiorespiratory recordings offera clear advantage, because current sleep disorder diagnosis requires these signals(Patel and Davidson, 2007).
8.2 Outlook
The applications of a wearable sleep / wake discrimination system are manifold.Although we have shown the feasibility of a wearable sleep / wake discrimina-tion device, in order to become commercially successful, some aspects, such asthe level of integration, still need to be improved.
One aspect already in investigation by material scientists is the integration ofsensors and electronics into garments (Amft and Habetha, 2007 and Wealthy-IST, 2009). This will lead to higher wearability and therefore acceptance by users.The improvement of wearable sensors and especially the increase of the signal tonoise ratio may lead to new features becoming available for classification, whichcould revolutionize the performance of physiology-based health systems. Themain interest certainly lies in the wearable EEG recording, which could eventu-

8.2. OUTLOOK 123
ally extend the reliable detection of binary sleep / wake to more detailed sleep orsleepiness stages. The demand for wearable and robust EEG has also increasedin different other emerging research fields such as non-invasive brain-controlledrobots or prosthetics (Millán, 2008 and Sanchez et al., 2008). Beside EEG, the useof more advanced cardiovascular features (which could be extracted from heartrate variability or peripheral arterial tone) may also contribute to the classifica-tion of light, deep and REM sleep, which has not been covered in this thesis. Theprocessing, classification and adaptation methods developed and presented inthis thesis may be applied to these new approaches. How much the performancecan be improved with a more diverse set of features remains to be seen.
With the increase of the number of features from different signal sources, moreadvanced classification methods might be considered. For example a mixture ofANN experts where behavioral and physiological features are used in individualnetworks and which are evaluated by a superior classifier could be used. Withthe continuous improvement of embedded microcontrollers, the implementationof such more advanced classification methods is becoming realistic.
The embedding of fatigue prediction models into wearable devices, as wasdescribed in Chapter 2, requires further research. Although preliminary resultsfrom different research groups are promising (Akerstedt et al., 2004 and Balkinand McBride, 2005), the models have not yet been evaluated for their robustness.As this thesis has also shown (Chapter 7), imprecision in the calculation of sleepparameters such as sleep onset time, total sleep time and number of awakenings,might not be removed completely with a wearable classifier. These sleep param-eters are used by most fatigue prediction models. The impact of these impreciseinput values on the models’ output has not yet been analyzed. Future pilots ofthe Solar Impulse plane (SolarImpulse, 2008) have to withstand duties of 48 hoursand more. They will operate in a narrow cockpit giving space to only a single pi-lot and in extreme environments such as altitudes up to 12’000 meters or hightemperature variations (-40◦ to 20◦ C). To stay alert over the full duty-time theywill need to rest regularly, but the mission will allow only short breaks. To get themaximum rest in a minimal time it will be important to plan ahead and coordi-nate the resting periods with the actual fatigue of the pilot. For this, a polyphasicsleep schedule (Section 2.1.1) combined with an alertness model (Section 2.4.4)can be useful. In a preliminary study (data not shown), we have conducted aseries of tests in a flight-simulator using our wearable sleep / wake detectiondevice in combination with a modified alertness model of Akerstedt et al. (2004)(described in Section 2.4.4). In the 48-hour tests, our model planned on-line the

124 8. CONCLUDING REMARKS
polyphasic sleep schedule of the pilot and adapted the schedule to the increasedfatigue over night. The calculated sleep schedules are promising. However, ad-ditional experiments are required to obtain conclusive results.
Considering the large impact of low quality sleep on human health and thehigh ratio of undiagnosed sleep disorders, a deeper research focus on the detec-tion of sleep disorders with low-cost wearable devices is desirable. This wouldrequire the screening of larger populations, including people with disorders, us-ing wearable devices. The direct and indirect reduction of cost in health carewith automated prevention and screening methods justifies the large amount ofinvestment into research and development that is still needed. We believe thatthe studied sleep / wake classification system proposed in this thesis is a first,promising step toward a context-aware system for wearable devices that couldprevent sleep-related disorders.

A Wearable PhysiologicalRecorders
In the last decade the recording of physiological signals outside the laboratorybecame possible because of the miniaturization and power consumption reduc-tion of electronics, the parallel increase of computing power of microcontrollers,increased storage media capacity, advances in embedding sensors, and the im-provements in battery technology. With this, a multitude of portable bio-medicaland wellness devices appeared on the market or are still in development. In thischapter, the most important developments are presented. Two principal classesare distinguished: Portable and wearable systems.
A.1 Portable Recording Systems
Portable physiological recording systems are so called "holter systems" that aredesigned for medical applications, where practitioners rely on high quality phys-iological signals with high sampling rates and low noise levels. They are usedwhere no stationary instrumentation can be used. The basic design is very simi-lar in all holter systems. They are
a) battery powered
b) multi-functional
c) can record a multitude of signals
d) saving the recorded signals to some storage media
e) expensive (because of the medical application)
f) have no or only limited user interface
125

126 A. PHYSIOLOGICAL RECORDING DEVICES
Figure A.1: Portable physiological recording system used for ambulatory sleepscreening. The sensors have to be applied by a technician and the cables andsensors need to be glued to the skin. Picture from Somnomedics (2008).
g) rather bulky
h) connect to the sensors with cables.
Because of the later two issues the holter systems are considered as portable andnot wearable. An exception is the group of systems that forms a wireless sensornetwork on the body (so called "body area networks", BANs) as shown in FigureA.2f. Because of the general lack of cables in this group, they are often consideredas wearable.
Figure A.1 shows a holter system used in sleep screening and illustrates nicelythe invasiveness of such systems. Patel and Davidson (2007) have reviewed por-table home sleep monitoring devices for the detection of sleep disorders that arefunctionally similar to the device shown in Figure A.1 and concluded that porta-ble recorders are useful for early sleep disorder diagnosis but cannot replace thesleep laboratory procedures.
Table A.1 shows an evaluation of portable systems that are potentially usefulfor sleep / wake classification. The list is not exhaustive, many more holter sys-tems exist, but their technology does not substantially differ from the presentedsystems. Figure A.2 show examples of holter systems.

A.1. PORTABLE RECORDING SYSTEMS 127
Sign
als
Pow
erA
uton
omy
Ava
ilabi
lity
Dev
ice
Dev
elop
erTy
peEC
GR
SPA
ccEE
GO
ther
[mA
h][H
ours
][C
HF]
Hea
llyK
oral
ewsk
iho
lter
mod
ular
oo
oo
o63
016
x10
’000
Life
shir
tV
ivom
etri
csho
lter
shir
to
xo
oo
??
x8’
000
Som
now
atch
Som
nom
edic
holt
erw
atch
oo
xo
o63
018
x?
Proc
omp
Thou
ghtT
echo
lter
oo
-o
o50
0-
x2’
000
Life
guar
dN
ASA
holt
erx
xx
-o
??
-?
Embl
etta
Embl
aho
lter
oo
x-
o50
012
x7’
000
Dat
aPr
oces
sing
Use
rFe
edba
ckM
edic
alFi
gure
Dev
ice
Dev
elop
erTy
peA
cces
sPo
wer
Acc
ess
Dis
play
Oth
erC
erti
ficat
ion
Hea
llyK
oral
ewsk
iho
lter
mod
ular
e-
-LE
Dx
A.2
cLi
fesh
irt
Viv
omet
rics
holt
ersh
irt
e-
xx
A.2
bSo
mno
wat
chSo
mno
med
icho
lter
wat
che
--
LED
?A
.2e
Proc
omp
Thou
ghtT
echo
lter
e-
-LE
D?
A.2
dLi
fegu
ard
NA
SAho
lter
e-
x?
A.2
aEm
blet
taEm
bla
holt
ere
--
LED
x
Tabl
eA
.1:
Com
pari
son
ofa
sele
ctio
nof
port
able
phys
iolo
gica
lrec
ordi
ngde
vice
s.(o
)op
tion
,(x)
yes,
(-)
no,(
e)on
lyPC
expo
rt,(
?)no
tkno
wn.

128 A. PHYSIOLOGICAL RECORDING DEVICES
(a) Lifeguard (b) Lifeshirt
(c) Heally (d) Procomp
(e) Somnowatch (f) Sensation BAN Concept
Figure A.2: Examples of portable physiological recording (Holter) systems.

A.2. WEARABLE RECORDING SYSTEMS 129
A.2 Wearable Recording Systems
We can classify the existing wearable physiological recording systems into twofurther categories. First, the category that integrates sensors and electrodes intothe garment which is worn on the body (Figure A.3). Second, the category ofsystems which are watch-like and worn on the wrist (Figure A.4.
Compared to the portable systems, the wearable systems are less expensiveand less intrusive. The garment-based systems are mainly still in developmentalstage. The already existing products are either wellness driven heart beat mon-itors (Figure A.3a) or chest belts for first responders (Figure A.3e and A.3f withtextile ECG electrodes and integrated respiratory effort sensors. Both producttypes have detachable electronics modules. The non-textile systems are more au-tonomous as they combine sensors and electronics on the same device. Often theyalso feature a display for feedback to the user. An exception is the VitasenseTM
device which has independent sensors (temperature pill, ECG patch) which re-port wirelessly to a master module (Figure A.4e). It can be considered as one ofthe first BAN in medical use.
Table A.2 compares the different types of wearable systems. For this category,no devices exist that completely fit our needs for a wearable, physiological signalbased sleep / wake classification device (Section 5.1). However, we selected theEquivitalTM as sensor module for the development of the SleePic device which isdescribed in Appendix B.

130 A. PHYSIOLOGICAL RECORDING DEVICES
SignalsPow
erA
utonomy
Availability
Device
Developer
TypeEC
GR
SPA
ccEEG
Other
[mA
h][H
ours][C
HF]
EquivitalH
idalgobelt
xx
x-
x630
48x
2’000H
ealthyEU
-ISTshirt
xx
o-
o?
?-
5’000V
-tamTam
-télésantévest
xx
?-
??
?-
?A
mon
EU-IST
watch
vx
x-
x1000
24-
?Sm
artshirtshirt
--
--
x?
?-
?V
ivagoV
TT
watch
--
x-
-?
3000x
400A
ctiwatch
Respironics
watch
--
x-
2500x
1’000Bodysense
Bodymedia
armband
ox
x-
x?
?x
700W
atchPAT-200
Itamar
watch+finger
v-
x-
x?
?x
5’000Polar
Polarw
atch+beltx
v-
--
?1500
x100-400
Data
ProcessingU
serFeedback
Medical
FigureD
eviceD
eveloperType
Access
Power
Access
Display
Other
Certification
EquivitalH
idalgobelt
x-
-vibration
xA
.3eH
ealthyEU
-ISTshirt
e-
--
-A
.3cV
-tamTam
-télésantévest
e-
--
-A
mon
EU-IST
watch
ex
x-
-A
.4cSm
artshirtshirt
?-
?-
-A
.3bV
ivagoV
TT
watch
e-
x-
xA
.4aA
ctiwatch
Respironics
watch
e-
o-
xA
.4bBodysense
Bodymedia
armband
e-
--
xA
.4dW
atchPAT-200
Itamar
watch+finger
--
x-
xA
.4fPolar
Polarw
atch+beltx
-x
-x
A.3a
TableA
.2:C
omparison
ofa
selectionof
wearable
physiologicalrecordingdevices.
(o)optional,(v)
variation,(x)yes,(-)
no,(e)onlyPC
export,(?)notknow
n.

A.2. WEARABLE RECORDING SYSTEMS 131
(a) Addidas / Polar (b) Smartshirt
(c) Wealthy (d) Vitaljacket
(e) Equivital (f) Vivometrics
Figure A.3: Garment-based, wearable physiological recording systems.

132 A. PHYSIOLOGICAL RECORDING DEVICES
(a) Vivago (b) Actiwatch
(c) AMON (d) BodySense
(e) Vitasense (f) WatchPaT
Figure A.4: Wearable, non-textile sensor systems.

B SleePic: A Wearable Sleep andWake Discrimination System
There exist no systems on the market (Appendix B) that comply with all the re-quirements stated in Section 5.1. To embed the classification algorithm developedin Chapter 4 into a wearable demonstrator, we have to build our own proto-type. If costs of the new wearable system should be kept small, the wearablesensors cannot be built from scratch. We therefore decided to rely on commer-cially available sensors and components for prototyping the wearable system.Missing functionalities were added by custom designed extension modules. Ahigher integrated product with custom build components and dedicated chipsmight be more power efficient for our application. However, the development ofdedicated chips causes also an increase in costs and consequently also in the finaldevice. Further, it does not allow an as high flexibility as microcontrollers do.
B.1 The SleePic System
The SleePic sleep / wake discrimination system that was developed during thisthesis, is composed of three modules:
• The SleePic Core processing module (Figure B.1 B) that connects to the
• SleePic Sensor Module which is the commercially available wearable sensorsystem EquivitalTM (Figure B.1 C).
• The Sleepic Core also communicates wirelessly with a wrist worn sensorand display / feedback module, called SleePic Watch (Figure B.1 A).
133

134 B. SLEEPIC DEVELOPMENT
Figure B.1: Communication scheme for the three principal components of theSleePic system: A) SleePic Watch with the user interface communicates wirelessly(RF) with the SleePic Core processing module (B). The SleePic Core connects phys-ically to the EquivitalTM Sensor Electronics Module (C) and receives sensor dataover UART.
B.1.1 Wearable Sensor Module
Sensors integrated into textiles appeared only in the last years on the market andthe technology is not yet established and still expensive. The EquivitalTM phys-iological monitoring system (from Hidalgo Ltd, UK, Equivital (2008)) is by farthe most advanced wearable recoding device with the highest sensor integration(Appendix B). It complies with five of our seven design criteria (Section 5.1). Thelack of user feedback possibilities and the missing access to the processing unit ofthe EquivitalTM that prevents to execute the classification algorithm on-line werecompensated by the development of two custom made extension modules. Thedesign and construction of the two SleePic extension modules will be describedin Section B.1.2 and 2.5.4. The EquivitalTM device has been chosen as sensor mod-ule for this system development because of the high integration of sensors andtextile electrodes in a single belt worn across the upper chest area, which facil-itates the correct wearing and use of the system by inexperienced users. It isalso light weight, and can continuously work up to 48 hours with the integrated,rechargeable Lithium-Ion battery (760 mAh).
The EquivitalTM is composed of two units (Figure B.2a):
a) a washable sensor belt which integrates 3 textile dry electrodes for 2-leadECG recordings and a piezoresistive strain gauge to measure RSP; and
b) a Sensor Electronics Module (SEM) that can be attached to the sensor beltwith five connective clips.

B.1. THE SLEEPIC SYSTEM 135
In addition to the ECG and the RSP, the SEM measures 3-axis acceleration (ACC),temperature and also features a real time clock (RTC). To communicate with a PC,the SEM uses a Bluetooth (BT) chip, which can be disabled to save energy. TheSEM has a universal serial connector on the top side (Figure B.2a) and offers thepossibility to record the sensor data to a removable Flash micro-SD card (up to 2GB). The SEM also features a vibrating actuator.
The ECG channels are sampled at 256 Hz in a 10-bit resolution and the respi-ration and acceleration channels at 25.6 Hz in 10-bit resolution. The system usesan open serial UART (57.6 kbaud) communication protocol that facilitates datahandling and the interface design. The binary sensor data stream is broadcastedover all communication channels (BT and UART) simultaneously. The drawbackof this communication scheme is that the data is only available in the order itis sampled. This form of communication is relatively slow and not energy effi-cient. The SEM weights 75 grams including the battery. The sensor belt weights94 grams (size M).
B.1.2 SleePic Core Processing Module
The ’SleePic Core’ (Figure B.3) is a printed circuit board (PCB) that plugs to theuniversal serial connector of the SEM. It was designed for receiving the raw sen-sor data from the SEM, the processing of the sensor signals and the classificationtask and the coordination of the tasks between all three modules.
The SleePic Core is composed of a processing unit, a power unit, storage unitand a communication unit. The processing unit is the central element on theSleePic Core and contains the 40 MIPS dsPIC33256GP710 microcontroller fromMicrochipTM Technology Inc., USA. This programmable interface controller has a16-bit architecture, 32 KB RAM, 256 KB program memory and digital signal pro-cessing (DSP) functionalities. It is the largest available microcontroller from thedsPIC33 series and it has been chosen because of the presence of multiply-and-accumulate (MAC) and a barrel shifter functionality which simplifies the FFTand ANN calculation (see Table B.1 for details on the gained processing time),the high amount of RAM that is also required for the FFT preprocessing and thepresence of a multitude of hardware interfaces (2x UART, 2x SPI). Calculus onthe dsPic33 can be done in the fractional format (1.15 format, 1 sign-bit and 15mantissa-bits). The power unit is composed of a step-up/down 3.3 V DC-DCconverter which allows to use one single-cell Lithium battery over its full capac-ity range (2.9 - 4.2 V) or the 3 V power supply from the SEM. Additionally, the

136 B. SLEEPIC DEVELOPMENT
(a)
5
4
Textile Electrodes
Shoulder Strap
(b)
Figure B.2: (a) A subject wearing the EquivitalTM device. (1) washable belt thatintegrates textile electrodes for ECG (5) and a strain gauge for respiration ef-fort measurements. (2) Sensor Electronics Module (SEM) which does the record-ing, processing and broadcasting of the signals through the Universal serial andrecharging connector of the SEM (3). (b) Inside view of the sensor belt showingthe three textile electrodes (5).

B.1. THE SLEEPIC SYSTEM 137
NRF Antenna
On/Off Switch
Power Source Switch
MicroSD Card
Universal Serial Connector
dsPICMicrocontroller
NRF Wireless Chip
MicroUSB Connector
3V DC-DC Regulator
Figure B.3: Bottom view of the SleepPic Core processing module. The batterymanagement and the USB converter circuits are not mounted on this version.
unit contains a battery protection circuit that prevent the battery from discharg-ing below 2.9 V and a battery charging circuit. The battery charging circuit ispowered over the USB port. The USB port can also power the charging circuit forthe battery on the SEM via the universal serial connector.
The communication unit contains a UART port for the communication withthe SEM, another UART port to communicate with a PC over a USB converterand an SPI port for the NRF02L wireless chip from NordicTM to communicatewith the SleePic Watch module.
For saving energy, each of the units can be disabled when not needed by themicrocontroller, including itself. The dimensions of the SleePic Core module are65 mm×35 mm×8 mm. Its weight is 8 grams without battery.
The SleePic Core tasks are 1) requesting and receiving over UART RTC times-tamps and sensor data from the SEM and the SleePic Watch; 2) computing thepre-processing and classification algorithm; 3) saving the results using the SPIprotocol to the storage unit containing a removable Flash 1 GB micro-SD card;and 4) sending user interaction task commands to the SleePic Watch.
Operation Modes
The SleePic Core operates in three main modes (Figure B.4):

138 B. SLEEPIC DEVELOPMENT
Idle Mode Recording Mode
Processing Mode
Task ?yes
no
Figure B.4: Operating modes of the SleePic Core module. If no computing task isto be performed, the device stays in a power-saving Idle Mode. If a physiologi-cal measure for sleep / wake prediction is required, the module enters into a 20second Recording Mode. Has all the required data been obtained, the module ex-changes data with the SleePic Watch, enters the Processing Mode and computesall algorithms for the sleep / wake classification.
a) The Idle Mode is used when no processing or action is needed and all unitsexcept the power unit are put into a power-saving mode. A watchdog timerwakes up the microcontroller every 20 seconds. The microcontroller reen-ters the Idle Mode if no task is on hold. Otherwise it enters the RecordingMode.
b) In the Recording Mode, the microcontroller enables the communication unitand starts receiving sensor values from the SEM and stores them in a bufferin RAM. If the buffer is full, the system activates the wireless chip and re-quests the sensor data from the SleePic Watch. At this point, it can alsoinitiate a user interaction task on the SleePic Watch.
c) In the Processing Mode the ECG, RSP and ACC signals are pre-processedand classified according the algorithm described in Section 4.1. The rawdata and the results are then stored on the micro-SD card. Afterward, thesystem returns to the Idle Mode.

B.1. THE SLEEPIC SYSTEM 139
Topology RSP ECG ECG+RSP+ACC ECG+RSP+ACCC Code
preparea 10763 21515 43041 43041window 2085 4133 8303 55320FFT 51285 112223 214790 40607313power 148 220 368 3786ANN 159 213 330 2358
total 64439 138303 266912 40711818a The preparing steps can be computed during the Recording .
Table B.1: This table illustrates the instruction cycles measurements necessary forthe sleep / wake classification algorithm.
B.1.3 SleePic Watch Module
The SleePic Watch module is used for the SleePic user interaction and option-ally for sensing. The reason to place this interaction module on the wrist is that itbecomes highly visible for the user. The SleePic Watch is build out of 7 PCB’s (Fig-ure B.5). The PCB’s are on top of each other and 5 PCB rings (Figure B.6B build acavity to place a Lithium-Polymer battery (145mAh) and electronic componentsinside it. Only the top and the bottom PCB ( incorporate electronic components.The bottom PCB Figure B.6A contains the power unit and the USB-UART con-verter from the communication unit.
The power unit is composed of the Lithium-Polymer battery, a battery charg-ing circuit and a step-up/down switching 3.3V DC-DC regulator. The rechargingof the battery is done over the micro USB connection to a PC, which can deliverup to 100 mA recharge current.
The top PCB contains the control unit, the interaction unit, and the commu-nication unit. The unit is composed of an 8-bit microcontroller from Microchiprunning at 4 MHz. It features power saving functions, Analog-to-Digital (A/D)conversion and a multitude of communication ports.
The user interaction unit is composed of 5 LED’s in the colors of green, orange,red and a button. For this prototype we used no liquid crystal display. To renderthe feedback more meaningful to the user, it might be advantageous to integratea liquid crystal display in a next step into the SleePic Watch.
The sensor unit contains a 3-axis accelerometer from FreescaleTM and a pho-todiode to measure ambient light. The data from these sensors were not used forthis thesis. However, the measure of the ambient light could form an interesting

140 B. SLEEPIC DEVELOPMENT
On/Off Switch
ButtonProgramming Connector
LED’s
Connection Pads
Photodiode
Figure B.5: Top view of the SleePic Watch module prototype.
feature for calibrating the circadian components of alertness models in humanssuch as described in Section 2.4.4.
The communication unit is composed of a USB-UART converter which allowsdata exchange between the devices via a microUSB connected PC. A NordicTM
NRF02L wireless chip and PCB antenna are used for the data exchange and syn-chronization with the SleePic Core module.
The diameter of the Watch module is 41 mm and the height 10 mm. This sizecan be compared to a smaller outdoor watch. A fully assembled SleePic Watch,as shown in Figure B.5, weights 28g.
Operation mode
The SleePic Watch mainly executes the commands received from the SleePic Core.Figure B.7 illustrates the operating flow of the SleePic Watch:
a) Normally the device stays in Idle Mode, with all units in battery saving modeand it is woken up regularly by the watchdog timer.
b) After leaving the Idle Mode, the microcontroller enters the Measure Modeand powers on the sensor and communication units, samples the A/D portsof the photodiode and accelerometer sensors and saves the values into abuffer in RAM. Then it checks if a message from the SleePic Core has been

B.1. THE SLEEPIC SYSTEM 141
A
B
Figure B.6: Top view of the SleePic Watch bottom PCB (left) and intermediate PCBlayer ring (right). Five of such rings form a cavity for the insertion of the battery.The PCB layers are connected by nine connection soldering pads.
received. Was no message received, the system goes back to Idle Mode.
c) If a "send sensor values" message was received, the SleePic Watch entersthe Answer Mode where it sends back to the SleePic Core the sensor valuesin RAM, empties the buffer and goes back to Idle mode.
d) If a "reaction time" command was received, the watch enters Reaction Modeand starts to blink 30 seconds with the green LED, then another 30 secondswith the green and orange LED’s. If no user action has been taken (no but-ton pressing), it sends back a "no answer" message. Did the user react, thereaction time that was measured with a timer is send back to the SleePicCore and the SleePic Watch system goes back to Idle Mode. The reasons forperforming these reaction time measurements are explained later in Chap-ter 7. In principle, they can be replaced by any other interaction operations,e.g. displaying fatigue level or generation of warnings.

142 B. SLEEPIC DEVELOPMENT
Reaction Mode
Measure Mode
Idle Mode
Answer Mode
RF ?yes
no
yessensor
reaction
Figure B.7: Operating flow modes of the SleePic Watch module. The moduleperiodically leaves the Idle Mode to perform sensor measures. If the moduledetects in this time a message from the SleePic Core (RF?), it either enters theReaction Mode or it sends directly back the requested sensor values (AnswerMode).
B.1.4 Energy Considerations
For a wearable device it is important to keep energy consumption minimal. Bothenergetically independent systems on chest and wrist achieve an energetic au-tonomy of 36 hours in the presented configuration, tough they have relative shortduty cycles. Both systems can also be easily recharged when connected to a PCvia USB.
SleePic Core and Sensor Module
The current consumption of the different modes of the SleePic Core is given inTable B.2. The indicated durations and power values are average values mea-sured at room temperature in a laboratory environment. The total average powerconsumption of 18.06 mW (6.02 mA @ 3 V) leads to a total autonomy of 36 hourswhen the 760 mAh battery is shared with the SEM (reduction of 12 hours).
We observe that the major energy resources go to the dsPic and the wirelesschip (NRF) in rx (receiving) mode. Compared to a standard microcontroller, thedsPic is relatively power hungry, because of the high clocking and the large RAMsize. The power consumption was reduced by putting the dsPic into a very effi-

B.1. THE SLEEPIC SYSTEM 143
cient idle mode (0.1 mA) at 93 % of the time. A significant decrease in energy con-sumption (50%) could be achieved when the Recording Mode can be substitutedby a single request for the 20-second data packet instead of the continuous record-ing of the data stream. This can only be realized when the EquivitalTM stores thisdata internally and the dsPic can communicate with the EquivitalTM using a fasterprotocol (e.g. SPI), which was not possible without changing the Hardware ofthe SEM. The power dissipation of the dsPic can be further decreased by slowingdown the system clock.
The total consumption can be decreased by 20% if the consumption of thewireless chip is decreased by reducing the time the chip has to wait from an an-swer from the SleePic Watch. This can be achieved by implementing a communi-cation protocol that does not require a continuous powering of the wireless chipwhile waiting for a response.
A more radical, but surely very energy efficient and power saving optionwould be the replacement of the dsPic with a dedicated silicon chip for the record-ing, FFT and ANN calculation. For example, a time-frequency wavelet transformcombined with an ANN implemented on a very-large-scale integration (VLSI)chip implementation uses less than 100 µW (Aziz et al., 2009), which would cor-respond to a power saving factor of 1000 when applied to our problem. However,these types of chips are very task dependent and their development expensive.Therefore we preferred the more flexible microcontroller solution for the proto-typing.
SleePic Watch
The power consumption of the different modes of the SleePic Watch is given inTable B.3. The indicated durations and power values are average values mea-sured at room temperature in the laboratory environment. The total averagepower consumption of 10.36 mW (2.8 mA @ 3.7 V) leads to an autonomy of 51hours when using the 145 mAh Lithium-Polymer battery. The energy autonomyof the SleePic Watch can be increased in a next step by selecting a smaller andmore energy efficient microcontroller that also offers a lower stand-by power con-sumption and by replacing the power hungry LED’s with a low power LCD.

144 B. SLEEPIC DEVELOPMENT
Mode Idle Recording Processing AVGDuration [s] 200 20 30a
(80%) (8%) (12%)
@3 V mA % mA % mA % mA
dsPIC 0.1 100 54 70 54 7NRF rx - - 18 1 18 95NRF tx - - 10 11 - -NRF sleep 0.1 100 0.1 88 0.1 5micro-SD 0.01 100 0.01 100 25 3Otherb 0.1 100 0.2 100 0.2 100
Total 0.31 39.39 21.83 6.02
a 30 seconds is a relative conservative assumption. Itmeans the user does not respond to a blinking half ofthe time.
b E.g. battery and power management IC’s.
Table B.2: The empirically measured current consumption of the SleePic Coremodule at 3V which corresponds to the supply voltage from the Sensor module.
Mode Idle Measure & Reaction AVGAnswer
Duration [s] 825 15 60(91.5%) (2%) (6.5%)
@3.7 V mA % mA % mA % mA
uC 2 100 4 100 4 100NRF rx - - 18 7 - -NRF tx - - 11 11 - -NRF sleep 0.1 100 0.1 82 0.1 100LED1 0 - - - 8 50LED2 0 - - - 8 25Other 0.1 100 0.1 100 0.1 100
Total 2.2 6.6 10.2 2.8
Table B.3: The empirically measured current consumption of the SleePic Watch at3.7 V.


Bibliography
Achermann, P. and Borbely, A. A. (2003). Mathematical models of sleep regula-tion. Frontiers in Bioscience, 8:683–93.
Achermann, P. and Borbély, A. A. (1990). Simulation of human sleep: ultradiandynamics of electroencephalographic slow-wave activity. Journal of BiologicalRhythms, 5(2):141–157.
Akerstedt, T. (2000). Consensus statement: fatigue and accidents in transportoperations. Journal of Sleep Research, 9(4):395.
Akerstedt, T. and Folkard, S. (1995). Validation of the s and c components of thethree-process model of alertness regulation. Sleep, 18(1):1–6.
Akerstedt, T., Folkard, S., and Portin, C. (2004). Predictions from the three-processmodel of alertness. Aviation, Space and Environmental Medicine, 75(3 Suppl):A75–83. Journal Article.
Amft, O. and Habetha, J. (2007). The myheart project. In van Langenhove, L.,editor, Book chapter in: Smart textiles for medicine and healthcare, chapter 14, pages275–297. Woodhead Publishing Ltd, Cambridge, England.
Amft, O., Lauffer, M., Ossevoort, S., Macaluso, F., Lukowicz, P., and Troster, G.(2004). Design of the qbic wearable computing platform. In Proc. 15th IEEE In-ternational Conference on Application-Specific Systems, Architectures and Processors,pages 398–410.
Ancoli-Israel, S., Cole, R., Alessi, C., Chambers, M., Moorcroft, W., and Pollak,C. P. (2003). The role of actigraphy in the study of sleep and circadian rhythms.Sleep, 26(3):342–392.
147

Anderer, P., Gruber, G., Parapatics, S., Woertz, M., Miazhynskaia, T., Klosch, G.,Saletu, B., Zeitlhofer, J., Barbanoj, M. J., Danker-Hopfe, H., Himanen, S.-L.,Kemp, B., Penzel, T., Grozinger, M., Kunz, D., Rappelsberger, P., Schlogl, A.,and Dorffner, G. (2005). An e-health solution for automatic sleep classificationaccording to rechtschaffen and kales: validation study of the somnolyzer 24 x7 utilizing the siesta database. Neuropsychobiology, 51(3):115–133.
AwaCon (2009). http://www.sms.mavt.ethz.ch/research/projects/awacon. (lastaccess: 12.1.2009).
Axbo (2008). http://www.axbo.com. (last access: 26.12.2008).
Aziz, J. N. Y., Karakiewicz, R., Genov, R., Chiu, A. W. L., Bardakjian, B. L., Der-chansky, M., and Carlen, P. L. (2009). On-silicon neural activity monitoring andtime-frequency analysis for early detection of epileptic seizures. IEEE Transac-tions on Neural Systems and Rehabilitation Engineering. (in press).
Balkin, T. and McBride, S. (2005). Managing sleep and alertness to sustain perfor-mance in the operational environment. Strategies to Maintain Combat Readi-ness during Extended Deployments U A Human Systems Approach 29-1 U29-10, RTO-MP-HFM-124, Neuilly-sur-Seine, France: RTO. Meeting Proceed-ings.
Barr, L., Howarth, H., Popkin, S., and Carroll, R. J. (2005). A review and evalua-tion of emerging driver fatigue detection measures and technologies. In Inter-national Conference on Fatigue Management in Transportation, Seattle, USA.
Belenky, G., Balkin, T., Redmond, D., Sing, H., Thomas, M., Thorne, D., and We-sensten, N. (1998). Sustained performance during continuous operations: Theus army s sleep management system. In Hartley, L., editor, Managing Fatiguein Transportation. Proceedings of the Third International Conference on Fatigue andTransportation, Fremantle, Western Australia. Elsevier Science Ltd., Oxford UK.
Bianchi, A., Villantieri, O., Mendez, M., and Cerutti, S. (2006). Signal processingand feature extraction for sleep evaluation in wearable devices. In Proc. 28thAnnual International Conference of the IEEE Engineering in Medicine and BiologySociety EMBS ’06, pages 3517–3520.
Biever, C. (2004). Cellphones turn into smart personal assistants. New ScientistMagazine, 2475:21.

Blake, H., Gerard, R. W., and Kleitman, N. (1939). Factors influencing brain po-tentials during sleep. Journal of Neurophysiology, 2(1):48–60.
Blankertz, B., Dornhege, G., Schafer, C., Krepki, R., Kohlmorgen, J., Muller, K. R.,Kunzmann, V., Losch, F., and Curio, G. (2003). Boosting bit rates and errordetection for the classification of fast-paced motor commands based on single-trial eeg analysis. IEEE Transactions on Neural Systems and Rehabilitation Engi-neering, 11(2):127–131.
Bonato, P. (2005). Advances in wearable technology and applications in physi-cal medicine and rehabilitation. Journal of NeuroEngineering and Rehabilitation,2(1):2.
Bonnet, M. H. and Arand, D. L. (1997). Heart rate variability: sleep stage, time ofnight, and arousal influences. Electroencephalography and Clinical Neurophysiol-ogy, 102(5):390–396.
Borbély, A. A. (1982). A two process model of sleep regulation. Human Neurobiol-ogy, 1(3):195–204.
Borbély, A. A. and Achermann, P. (1999). Sleep homeostasis and models of sleepregulation. Journal of Biological Rhythms, 14(6):557–568.
Bresler, M., Sheffy, K., Pillar, G., Preiszler, M., and Herscovici, S. (2008). Differen-tiating between light and deep sleep stages using an ambulatory device basedon peripheral arterial tonometry. Physiological Measurement, 29(5):571–584.
Buckelmüller, J., Landolt, H.-P., Stassen, H. H., and Achermann, P. (2006). Trait-like individual differences in the human sleep electroencephalogram. Neuro-science, 138(1):351–356.
Burr, R. L. (2007). Interpretation of normalized spectral heart rate variability in-dices in sleep research: a critical review. Sleep, 30(7):913–919.
Buttfield, A., Ferrez, P. W., and Millán, J. d. R. (2006). Towards a robust BCI:Error potentials and online learning. IEEE Transactions on Neural Systems andRehabilitation Engineering, 14(2):164–168.
Buttussi, F. and Chittaro, L. (2008). Mopet: A context-aware and user-adaptivewearable system for fitness training. Artificial Intelligence in Medcine, 42(2):153–163.

Carskadon, M. and Dement, W. (1989). Principles and Practice of Sleep Medicine,chapter Normal human sleep: an overview, pages 3–13. W.B. Saunders,Philadelphia.
Chavarriaga, R., Ferrez, P. W., and Millán, J. d. R. (2007). To err is human: Learn-ing from error potentials in brain-computer interfaces. In Shen, R. W. E. andGu, F., editors, Advances in Cognitive Neurodynamics ICCN 2007 Proceedings of theInternational Conference on Cognitive Neurodynamics., number IV, pages 777–782.Springer Netherlands.
Cirelli, C. and Tononi, G. (2008). Is sleep essential? PLoS Biology, 6(8):e216.
Closs, S. J. (1988). Assessment of sleep in hospital patients: a review of methods.Journal of Advanced Nursing, 13(4):501–510.
Cohen, A. (2006). Biomedical Engineering Handbook, volume 2 of The electrical engi-neering handbook series, chapter Biomedical Signal Analysis, pages I1–I22. BocaRaton : CRC Taylor & Francis, 3rd edition.
Cole, R. J., Kripke, D. F., Gruen, W., Mullaney, D. J., and Gillin, J. C. (1992). Auto-matic sleep/wake identification from wrist activity. Sleep, 15(5):461–9.
Committee on Sleep Medicine and Research, B. o. H. S. P. (2006). Sleep Disordersand Sleep Deprivation: An Unmet Public Health Problem. The National Academiespress, Washington, DC.
Czeisler, C. A., Zimmerman, J. C., Ronda, J. M., Moore-Ede, M. C., and Weitzman,E. D. (1980). Timing of rem sleep is coupled to the circadian rhythm of bodytemperature in man. Sleep, 2(3):329–46.
Danker-Hopfe, H., Kunz, D., Gruber, G., Klösch, G., Lorenzo, J. L., Himanen,S. L., Kemp, B., Penzel, T., Röschke, J., Dorn, H., Schlögl, A., Trenker, E., andDorffner, G. (2004). Interrater reliability between scorers from eight europeansleep laboratories in subjects with different sleep disorders. Journal of SleepResearch, 13(1):63–69.
Davis, H., Davis, P. A., Loomis, A. L., Harvey, E. N., and Hobart, G. (1937).Changes in human brain potentials during the onset of sleep. Science,86(2237):448–450.

de Souza, L., Benedito-Silva, A. A., Pires, M. L., Poyares, D., Tufik, S., and Calil,H. M. (2003). Further validation of actigraphy for sleep studies. Sleep, 26(1):81–5.
Dinges, D. F. (1995). An overview of sleepiness and accidents. Journal of SleepResearch, 4(S2):4–14.
Dinges, D. F. (2004). Sleep debt and scientific evidence. Sleep, 27(6):1050–1052.
Dinges, D. F. and Grace, R. (1998). Perclos: A valid psychophysiological measureof alertness as assessed by psychomotor vigilance. Technical Report FHWA-MCRT-98-006, Federal Highway Administration, Office of Motor Carrier Re-search and Standards, Washington, DC.
Dinges, D. F., Maislin, G., Krueger, G. P., Brewster, R., and Carroll, R. J. (2005).Pilot test of fatigue management technologies. Technical Report FMCSA-RT-05-002, American Transportation Research Institute, Smyrna, GA.
Dinges, D. F. and Mallis, M. M. (1998). Managing fatigue in transportation, chapterManaging Fatigue by Drowsiness Detection: Can Technological Promises beRealized?, pages 209–223. Oxford: Elsevier Science Ltd.
Dinges, D. F., Orne, M. T., and Orne, E. C. (1985). Assessing performance uponabrupt awakening from naps during quasi-continuous operations. Behavior Re-search Methods, Instruments, & Computers, 17:37–45.
Dürr, P., Karlen, W., Guignard, J., Mattiussi, C., and Floreano, D. (2009). Evolu-tionary Selection of Features for Sleep/Wake Discrimination. Journal of ArtificialEvolution and Applications. (in press).
Edinger, J. and Means, M. (2005). Principles and Practice of Sleep Medicine, chapterOverview of insomnia: Definitions, epidemiology, differential diagnosis, andassessment, pages 702 – 713. Philadelphia: Elsevier/Saunders, 4th edition.
Edward, S., Nadezhda, S., Stephanie, S., Michael, N., and Group, C. S. (2004).Activity-based sleep/wake identification in infants. Physiological Measurement,25(5):1291. 0967-3334.
Equivital (2008). http://www.equivital.co.uk. (last access: 10.4.2008).

Ferrez, P. and Millán, J. (2005). You are wrong!—automatic detection of interac-tion errors from brain waves. In Proceedings of the 19th International Joint Confer-ence on Artificial Intelligence, Edinburgh, UK.
Flanigan, W. F. (1972). The Sleeping Brain: Perspectives in the Brain Sciences, vol-ume 1 of Perspectives in the Brain Sciences, chapter Behavioral states and elec-troencephalograms of reptiles, pages 14–18. Brain Information Service/BrainResearch Institute (UCLA), Los Angeles, CA.
Gerasimov, V. (2003). EVERY SIGN OF LIFE. PhD thesis, Program in Media Artsand Sciences, School of Architecture and Planning, Massachusetts Institute ofTechnology.
Gilbert, S. S., van den Heuvel, C. J., Ferguson, S. A., and Dawson, D. (2004).Thermoregulation as a sleep signalling system. Sleep Medicine Reviews, 8(2):81–93.
Gorny, S. and Spiro, J. (2001). Comparing different methodologies used in wristactigraphy. Sleep Review, Summer:40–42.
Hagan, M. and Menhaj, M. (1994). Training feedforward networks with the mar-quardt algorithm. IEEE Transactions on Neural Networks, 5(6):989–993.
Harris, F. (1978). On the use of windows for harmonic analysis with the discretefourier transform. Proceedings of the IEEE, 66(1):51–83.
Hartley, L., Horberry, T., Mabbott, N., and Krueger, G. (2000). Review of fatiguedetection and prediction technologies. Working paper, National Road Trans-port Commission, Level 5/326 William Street Melbourne VIC 3000.
Hedner, J., Pillar, G., Pittman, S. D., Zou, D., Grote, L., and White, D. P. (2004). Anovel adaptive wrist actigraphy algorithm for sleep-wake assessment in sleepapnea patients. Sleep, 27(8):1560–1566.
Herscovici, S., Pe’er, A., Papyan, S., and Lavie, P. (2007). Detecting rem sleep fromthe finger: an automatic rem sleep algorithm based on peripheral arterial tone(pat) and actigraphy. Physiological Measurement, 28(2):129–140.
Hilten, J. J. V., Middelkoop, H. A., Kuiper, S. I., Kramer, C. G., and Roos, R. A.(1993). Where to record motor activity: an evaluation of commonly used sitesof placement for activity monitors. Electroencephalography and Clinical Neuro-physiology, 89(5):359–362.
Hobson, J. A. (2005). Sleep is of the brain, by the brain and for the brain. Nature,437(7063):1254–1256.
Holroyd, C. B. and Coles, M. G. H. (2002). The neural basis of human error pro-cessing: reinforcement learning, dopamine, and the error-related negativity.Psychology Revue, 109(4):679–709.
Hori, T. (1982). Electrodermal and electro-oculographic activity in a hypnagogicstate. Psychophysiology, 19(6):668–672.
Hori, T., Hayashi, M., and Morikawa, T. (1994). Sleep onset: Normal and abnormalprocesses, chapter Topographical EEG changes and the hypnagogic experience,pages 237–253. American Psychological Association,Washington, DC.
Huynh, T. and Schiele, B. (2006). Unsupervised discovery of structure in activitydata using multiple eigenspaces. In Location- and Context-Awareness, volume3987/2006 of Lecture Notes in Computer Science, pages 151–167. Springer Berlin/ Heidelberg.
Iber, C., Chesson, A., and Quan, S. (2007). The AASM manual for the scoring of sleepand associated events : rules, terminology and technical specifications. AmericanAcademy of Sleep Medicine, c, 2nd edition.
Itamar (2009). http://www.itamar-medical.com/product.asp?pid=3006. (last ac-cess: 26.12.2008).
Jean-Louis, G., von Gizycki, H., Zizi, F., Fookson, J., Spielman, A., Nunes, J.,Fullilove, R., and Taub, H. (1996). Determination of sleep and wakefulnesswith the actigraph data analysis software (adas). Sleep, 19(9):739–43.
Johannes, B., Salnitski, V., Soll, H., Rauch, M., and Hoermann, H.-J. (2008). De-individualized psychophysiological strain assessment during a flight simula-tion test–validation of a space methodology. Acta Astronautica, 63(7-10):791 –799. From Dream to Reality: Living, Working and Creating for Humans inSpace - A selection of papers presented at the 16th IAA Humans in Space Sym-posium, Beijing, China, 2007.
Johns, M., Tucker, A., and Chapman, R. (2005). Monitoring the drowsiness ofdrivers: A new method based on the velocity of eyelid movements. In Interna-tional ITS Conference, San Francisco.

Kaefer, G., Prochart, G., and Weiss, R. (2003). Wearable alertness monitoringfor industrial applications. In Proc. Seventh IEEE International Symposium onWearable Computers, pages 254–255.
Karlen, W., Mattiussi, C., and Floreano, D. (2007). Adaptive sleep/wake classi-fication based on cardiorespiratory signals for wearable devices. In Proc. IEEEBiomedical Circuits and Systems Conference BIOCAS 2007, pages 203–206, Mon-treal, Quebec.
Karlen, W., Mattiussi, C., and Floreano, D. (2008). Improving actigraphsleep/wake classification with cardio-respiratory signals. In 30th Annual Inter-national Conference of the IEEE Engineering in Medicine and Biology Society, pages5262–5265.
Karlen, W., Mattiussi, C., and Floreano, D. (2009). Sleep and wake classificationwith ecg and respiratory effort signals. IEEE Transactions on Biomedical Circuitsand Systems. (in press).
Kaushik, P., Intille, S. S., and Larson, K. (2008). User-adaptive reminders forhome-based medical tasks. a case study. Methods of Information in Medicine,47(3):203–207.
Åkerstedt, T., Connor, J., Gray, A., and Kecklund, G. (2008). Predicting roadcrashes from a mathematical model of alertness regulation–the sleep/wakepredictor. Accident Analysis & Prevention, 40(4):1480 – 1485.
Koralewski.de (2008). http://www.koralewski.de/html/entwicklung _health-lab.html. (last access: 12.2.2009).
Korhonen, I. and Saranummi, N. (2007). Personal health systems - need, marketplace and challenges to their wide scale adoption. In Proc. 29th Annual Inter-national Conference of the IEEE Engineering in Medicine and Biology Society EMBS2007, pages 6152–6153.
Krause, A., Smailagic, A., and Siewiorek, D. P. (2006). Context-aware mobilecomputing: learning context- dependent personal preferences from a wearablesensor array. Mobile Computing, IEEE Transactions on, 5(2):113–127.
Kräuchi, K., Cajochen, C., and Wirz-Justice, A. (2004). Waking up properly: isthere a role of thermoregulation in sleep inertia? Journal of Sleep Research,13(2):121–127.

Kushida, C. A., Chang, A., Gadkary, C., Guilleminault, C., Carrillo, O., andDement, W. C. (2001). Comparison of actigraphic, polysomnographic, andsubjective assessment of sleep parameters in sleep-disordered patients. SleepMedicine, 2(5):389–396.
Lal, S. K. L. and Craig, A. (2001). A critical review of the psychophysiology ofdriver fatigue. Biological Psychology, 55(3):173–194.
Landis, J. R. and Koch, G. G. (1977). The measurement of observer agreement forcategorical data. Biometrics, 33(1):159–174.
Limor, A., Roni, S., Baruch, E.-A., Ron, P., and Giora, P. (2009). Forty- versus 20-minute trials of the maintenance of wakefulness test regimen for licensing ofdrivers. Journal of Clinical Sleep Medicine, 5(1):57–62.
Lotjonen, J., Korhonen, I., Hirvonen, K., Eskelinen, S., Myllymaki, M., and Parti-nen, M. (2003). Automatic sleep-wake and nap analysis with a new wrist wornonline activity monitoring device vivago wristcare. Sleep, 26(1):86–90.
Lukowicz, P. (2008). Wearable computing and artificial intellegence for healthcareapplications. Artificial Intelligence in Medcine, 42(2):95–98.
Malik, M., of the European Society of Cardiology, T. F., and the North Ameri-can Society of Pacing Electrophysiology (1996). Heart rate variability : Stan-dards of measurement, physiological interpretation, and clinical use. Circula-tion, 93(5):1043–1065.
Martin, T., Jovanov, E., and Raskovic, D. (2000). Issues in wearable computing formedical monitoring applications: a case study of a wearable ecg monitoringdevice. In Proc. Fourth International Symposium on Wearable Computers, pages43–49.
Matsushita, S., Shiba, A., and Nagashima, K. (2006). A wearable fatigue monitor-ing system: application of human-computer interaction evaluation. In AUIC’06: Proceedings of the 7th Australasian User interface conference, pages 161–164,Darlinghurst, Australia, Australia. Australian Computer Society, Inc.
Mattiussi, C. and Floreano, D. (2007). Analog Genetic Encoding for the Evolu-tion of Circuits and Networks. IEEE Transactions on Evolutionary Computation,11(5):596–607.

Middelkoop, H. A. M., Dam, E. M., Smilde-Van den Doel, D. A., and Dijk, G.(1997). 45-hour continuous quintuple-site actimetry: Relations between trunkand limb movements and effects of circadian sleep-wake rhythmicity. Psy-chophysiology, 34(2):199–203.
Millán, J. d. R. (2008). Brain-controlled robots. IEEE Intelligent Systems, 23(3):74–76.
MyHeart-IST (2009). http://www.hitech-projects.com/euprojects /my-heart/objectives.html. (last access: 26.12.2008).
Naifeh, K. H. and Kamiya, J. (1981). The nature of respiratory changes associatedwith sleep onset. Sleep, 4(1):49–59.
Naitoh, P. (1992). Why We Nap: Evolution, Chronobiology, and Functions of Polypha-sic and Ultrashort Sleep, chapter Minimal Sleep to Maintain Performance: TheSearch fo Sleep Quantum in Sustained Operations, pages 199–217. Birkhäuser,Boston.
Nguyen, D. and Widrow, B. (1990). Improving the learning speed of 2-layer neu-ral networks by choosing initial values of the adaptive weights. In Proceedingsof the International Joint Conference on Neural Networks IJCNN, volume 3, pages21–26.
Ogilvie, R. D. (2001). The process of falling asleep. Sleep Medicine Reviews,5(3):247–270.
Ogilvie, R. D. and Wilkinson, R. T. (1984). The detection of sleep onset: behavioraland physiological convergence. Psychophysiology, 21(5):510–520.
Okada, S., Ohno, Y., Goyahan, Kato-Nishimura, K., Mohri, I., and Taniike, M.(2008). Examination of non-restrictive and non-invasive sleep evaluation tech-nique for children using difference images. In Proc. 30th Annual InternationalConference of the IEEE Engineering in Medicine and Biology Society EMBS 2008,pages 3483–3487.
Optalert (2009). http://www.optalert.com/. (last access: 13.1.2009).
Oswald, I., Taylor, A. M., and Treisman, M. (1960). Discriminative responses tostimulation during human sleep. Brain, 83:440–453.

Patel, M. R. and Davidson, T. M. (2007). Home sleep testing in the diagnosisand treatment of sleep disordered breathing. Otolaryngologic Clinics of NorthAmerica, 40(4):761–784.
Penzel, T. and Conradt, R. (2000). Computer based sleep recording and analysis.Sleep Med Rev, 4(2):131–148.
Penzel, T., Kemp, B., Klosch, G., Schlogl, A., Hasan, J., Varri, A., and Korhonen,I. (2001). Acquisition of biomedical signals databases. IEEE Magazine on Engi-neering in Medicine and Biology, 20(3):25–32.
Picard, R. W. (1998). Affective computing. The MIT Press, Cambridge, MA, 2ndprinting edition.
PIPS (2009). http://www.pips.eu.org/. (last access: 13.1.2009).
Pivik, R. T. and Busby, K. (1996). Heart rate associated with sleep onset in pread-olescents. Journal of Sleep Research, 5(1):33–36.
Pollak, C. P., Tryon, W. W., Nagaraja, H., and Dzwonczyk, R. (2001). How accu-rately does wrist actigraphy identify the states of sleep and wakefulness? Sleep,24(8):957–965.
Principe, J. and Tome, A. (1989). Performance and training strategies in feedfor-ward neural networks: an application to sleep scoring. Neural Networks, 1989.IJCNN., International Joint Conference on, pages 341–346 vol.1.
PubMed (2009). http://www.ncbi.nlm.nih.gov/pubmed/. (last access:20.2.2009).
Randall Wilson, D. and Martinez, T. R. (2000). The inefficiency of batch trainingfor large training sets. In Proc. IEEE-INNS-ENNS International Joint Conferenceon Neural Networks IJCNN 2000, volume 2, pages 113–117.
Rechtschaffen, A., Kales, A., Berger, R., and Dement, W. (1968). A manual ofstandardized terminology, techniques and scoring system for sleep stages ofhuman subjects. Public Health Service, US Government Printing Office.
Redmond, S. and Heneghan, C. (2006). Cardiorespiratory-based sleep staging insubjects with obstructive sleep apnea. IEEE Transactions on Biomedical Engineer-ing, 53(3):485–496.

Robert, C., Gaudy, J.-F., and Limoge, A. (2002). Electroencephalogram processingusing neural networks. Clinical Neurophysiology, 113(5):694–701.
Robert, C., Guilpin, C., and Limoge, A. (1998). Review of neural network appli-cations in sleep research. Journal of Neuroscience Methods, 79(2):187–193.
Ruffini, G., Dunne, S., Farres, E., Cester, I., Watts, P. C. P., Ravi, S., Silva, P., Grau,C., Fuentemilla, L., Marco-Pallares, J., and Vandecasteele, B. (2007). Enobio dryelectrophysiology electrode; first human trial plus wireless electrode system.In Proc. 29th Annual International Conference of the IEEE Engineering in Medicineand Biology Society EMBS 2007, pages 6689–6693.
Sadeh, A. and Acebo, C. (2002). The role of actigraphy in sleep medicine. SleepMedicine Reviews, 6(2):113–124.
Sadeh, A., Sharkey, K. M., and Carskadon, M. A. (1994). Activity-basedsleep-wake identification: an empirical test of methodological issues. Sleep,17(3):201–207.
Sanchez, J. C., Principe, J. C., Nishida, T., Bashirullah, R., Harris, J. G., and Fortes,J. A. B. (2008). Technology and signal processing for brain-machine interfaces.IEEE Signal Processing Magazine, 25(1):29–40.
Sartori, V., Schumacher, P. M., Bouillon, T., Luginbuehl, M., and Morari, M. (2006).On-line estimation of propofol pharmacodynamic parameters. In Proc. 27thAnnual International Conference of the Engineering in Medicine and Biology SocietyIEEE-EMBS 2005, pages 74–77.
Schalk, G., Wolpaw, J. R., McFarland, D. J., and Pfurtscheller, G. (2000). Eeg-based communication: presence of an error potential. Clinical Neurophysiology,111(12):2138–2144.
Scheffler, M. and Hirt, E. (2004). Wearable devices for emerging healthcare appli-cations. In Proc. 26th Annual International Conference of the IEEE Engineering inMedicine and Biology Society IEMBS ’04, volume 2, pages 3301–3304.
Schmid, S. M., Hallschmid, M., Jauch-Chara, K., Bandorf, N., Born, J., andSchultes, B. (2007). Sleep loss alters basal metabolic hormone secretion andmodulates the dynamic counterregulatory response to hypoglycemia. Journalof Clinical Endocrinology & Metabolism, 92(8):3044–3051.

Schmidt, A., Aidoo, K., Takaluoma, A., Tuomela, U., Van Laerhoven, K., andVan de Velde, W. (1999). Advanced interaction in context. In Handheld andUbiquitous Computing, number 1707/1999 in Lecture Notes in Computer Sci-ence, pages 89–101. Springer Berlin / Heidelberg.
Schnall, R. P., Shlitner, A., Sheffy, J., Kedar, R., and Lavie, P. (1999). Periodic, pro-found peripheral vasoconstriction–a new marker of obstructive sleep apnea.Sleep, 22(7):939–946.
scholarpedia.org (2009). http://www.scholarpedia.org/article /neurobiology_-of_sleep_and_wakefulness. (last access: 26.12.2008).
Scholz, U. J., Bianchi, A. M., Cerutti, S., and Kubicki, S. (1997). Vegetative back-ground of sleep: Spectral analysis of the heart rate variability. Physiology &Behavior, 62(5):1037 – 1043.
Sensation-IST (2009). http://www.sensation-eu.org/. (last access: 26.12.2008).
Shen, J., Barbera, J., and Shapiro, C. M. (2006). Distinguishing sleepiness andfatigue: focus on definition and measurement. Sleep Medicine Reviews, 10(1):63–76.
Shiihara, Y., Nakajima, M., Miyazaki, Y., Nakamiya, T., Miyamoto, M., Takahashi,S., and Kodama, M. (1998). Evaluation of sleep using ambulatory skin poten-tial recording: differences between morning and evening type. Psychiatry andClinical Neurosciences, 52(2):167–8.
Shinar, Z., Akselrod, S., Dagan, Y., and Baharav, A. (2006). Autonomic changesduring wake-sleep transition: A heart rate variability based approach. Auto-nomic Neuroscience, 130(1-2):17–23.
Siegel, J. M. (2005). Clues to the functions of mammalian sleep. Nature,437(7063):1264–1271.
Sleeptracker (2007). http://www.sleeptracker.com. (last access: 26.12.2008).
SolarImpulse (2008). http://www.solarimpulse.com. (last access: 26.12.2008).
Somnomedics (2008). http://www.somnomedics.de/international/products/somnowatch/long-term-eeg.htm. (last access: 26.12.2008).
Spiegel, K., Knutson, K., Leproult, R., Tasali, E., and Cauter, E. V. (2005). Sleeploss: a novel risk factor for insulin resistance and type 2 diabetes. Journal ofApplied Physiology, 99(5):2008–2019.
Spiegel, K., Sheridan, J. F., and Cauter, E. V. (2002). Effect of sleep deprivation onresponse to immunization. JAMA, 288(12):1471–1472.
Stampi, C. (1992). Why We Nap: Evolution, Chronobiology, and Functions of Polypha-sic and Ultrashort Sleep, chapter The Effects of Polyphasic und Ultrashort SleepSchedules, pages 137–180. Birkhäuser, Boston.
Starlab, E. (2009). http://starlab.es/products/enobio. (last access: 13.1.2009).
Stepanski, E. J. and Wyatt, J. K. (2003). Use of sleep hygiene in the treatment ofinsomnia. Sleep Medicine Reviews, 7(3):215 – 225.
Steptoe, A., Peacey, V., and Wardle, J. (2006). Sleep duration and health in youngadults. Archives of Internal Medicine, 166(16):1689–1692.
Stiefmeier, T., Roggen, D., Troster, G., Ogris, G., and Lukowicz, P. (2008). Wear-able activity tracking in car manufacturing. IEEE Pervasive Computing, 7(2):42–50.
Sung, M., Gips, J., Eagle, N., Madan, A., Caneel, R., DeVaul, R., Bonsen, J., andPentland, A. (2005). Mobile-it education (mit. edu): m-learning applications forclassroom settings. Journal of Computer Assisted Learning, 21(3):229–237.
Tassi, P. and Muzet, A. (2000). Sleep inertia. Sleep Medicine Reviews, 4(4):341–353.
Telser, S., Staudacher, M., Ploner, Y., Amann, A., Hinterhuber, H., and Ritsch-Marte, M. (2004). Can one detect sleep stage transitions for on-line sleep scoringby monitoring the heart rate variability? Somnologie, 8(2):33–41.
Trinder, J., Beveren, J. A. V., Smith, P., Kleiman, J., and Kay, A. (1997). Correla-tion between ventilation and eeg-defined arousal during sleep onset in youngsubjects. Journal of Applied Physiology, 83(6):2005–2011.
Tryon, W. W. (1991). Activity Measurement in Psychology and Medicine, chapter 6.Activity and sleep, pages 149–195. Applied Clinical Psychology. Plenum Press,New York.

Van Dongen, H. P. A., Rogers, N. L., and Dinges, D. F. (2003). Sleep debt: Theo-retical and empirical issues. Sleep and Biological Rhythms, 1(1):5–13.
Venkatraman, V., Chuah, Y. M. L., Huettel, S. A., and Chee, M. W. L. (2007). Sleepdeprivation elevates expectation of gains and attenuates response to losses fol-lowing risky decisions. Sleep, 30(5):603–609.
Vivago (2009). http://www.vivago.fi/. (last access: 10.2.2009).
Walsh, J. K. and Engelhardt, C. L. (1999). The direct economic costs of insomniain the united states for 1995. Sleep, 22 Suppl 2:S386–S393.
Wealthy-IST (2009). http://www.wealthy-ist.com/. (last access: 1.1.2009).
Webster, J. B., Kripke, D. F., Messin, S., Mullaney, D. J., and Wyborney, G. (1982).An activity-based sleep monitor system for ambulatory use. Sleep, 5(4):389–399.
Williams, H. L., Morlock, H. C., and Morlock, J. V. (1966). Instrumental behaviorduring sleep. Psychophysiology, 2(3):208–216.
Williamson, A. and Chamberlain, T. (2005). Review of on-road driver fatiguemonitoring devices. Technical report, NSW Injury Risk Management ResearchCentre University of New South Wales, Australia.
Wilson, J., Walker, B., Lindsay, J., Cambias, C., and Dellaert, F. (2007). Swan: Sys-tem for wearable audio navigation. In Proc. 11th IEEE International Symposiumon Wearable Computers, pages 91–98.
Wirz-Justice, A., Benedetti, F., Berger, M., Lam, R. W., Martiny, K., Terman, M.,and Wu, J. C. (2005). Chronotherapeutics (light and wake therapy) in affectivedisorders. Psychological Medicine, 35(7):939–944.

Curriculum vitæ
WALTER CH. KARLEN
I was born in St-Gallen (SG), Switzerland onNovember 8th 1979 as the son of Stephanie andFranz Karlen-Blatter. I grew up in Arbon (SG), Uh-wiesen (ZH), Le-Mont-sur-Lausanne (VD) and Brig-Glis (VS). In Brig-Glis I graduated from the Kol-legium Spiritus Sanctus (Type C) in 1999.
In the same year I started my studies in micro-engineering at the Ecole Poly-technique Fédérale de Lausanne (EPFL) from which I received a Master of Sciencein Micro-engineering in April 2005. I wrote my master thesis at the UniversitéLibre de Bruxelles (ULB), Belgium under the supervision of Prof. Jean-Louis De-neubourg at the Unité d’Ecologie Sociale (ULB) and Prof. Roland Siegwart at theAutonomous Systems Lab (EPFL). The master thesis was focused on the percep-tion of miniaturized robots for the interaction with insects.
Since April 2005, I am a Ph.D. student under the supervision of Prof. DarioFloreano at the Laboratory of Intelligent Systems (LIS) at EPFL. In collaborationwith Prof. Floreano I launched within the LIS the research branch of body sensingfor the assessment of human wellness. The focus lied in the detection of fatigueand sleep with wearable and intelligent systems. Amongst the work presentedin this thesis I also developed a software tool to predict sleepiness of humansperforming in extreme environments. The software was used and tested in theRace Across America 2007 by the medical supervisor of the Swiss extreme cyclistDaniel Wyss. The software helped to reduce the cycler’s total sleep time to 12
163

hours while he was en-route for 9 days, 4 hours and 29 minutes and left 3’040miles behind him.
During my time at the LIS, I proposed and supervised several student projectsrelated to sleep, fatigue and wellness detection. I also prepared and instructedpractical exercises for the lectures "Mobile Robots" taught by Dr. Jean-ChristophZufferey, and "Bio-inspired Adaptive Machines" taught by Prof. Dario Floreano.
From 2005 to 2009 I was a scientific adviser for pilot health monitoring in theSolar Impulse project. During this work I co-supervised several bio-medical ex-periments for the performance evaluation of pilots in extreme environments. Idesigned and developed a low-power automatic monitoring system for the oxy-gen reserve in the cockpit and the surveillance of the blood oxygen saturation(SpO2) of the pilot at high altitudes.
My current research interests lie in the fields of bio-medical signal processing,human physiology, embedded and wearable systems, bio-medical and roboticsensors and actuators, and human-machine interaction.
I am a member of the IEEE Engineering in Medicine and Biology Society, theSociété Académique Lémania and the student associations Brigensis and D’OBRU.