Embed Size (px)
Citation preview

Adaptive policy for urban planning:Adaptive policy for urban planning: operational models in support of
planning policy.
Venue: Hardy Building Rm 101. Time: 1-2pm
Dr. Elisabete A. [email protected]@
Department of Land EconomyUniversity of CambridgeUniversity of Cambridge
Geography, Dep. Cambridge, UK5th November, 2015

OUTLINE
1. The argument in favor of adaptive policy2 Complexity theory: The right moment in time to link2. Complexity theory: The right moment in time to link
planning decision and urban modelsM t hi th k tt ib t f PPS DSS ith D i-Matching the key attributes of PPS -DSS with Dynamic Simulation and Planning Decisions (Policy Support)
3. ‘Wicked problems’ and the wrong “decision makers model4 Key areas to address: Calibration Validation4. Key areas to address: Calibration, Validation,
Randomness , uncertainty, data-mining5. The examples of models: The SLEUTH model; The
CVCA model; CCID model; The DG-ABC model6. Concluding remarks
Geography, Dep. Cambridge, UK5th November, 2015

1. The argument in favor of adaptive policypolicy
Geography, Dep. Cambridge, UK5th November, 2015

Cities and landscapes evolve in time and spaceCities and landscapes evolve - in time and space (across scales and along the same scale)
The rational models of the 50-70s - systems theory orThe rational models of the 50 70s systems theory or participative theory they are both based on the ‘presumption of certainty’ they provide one answerpresumption of certainty - they provide one answer to the decision maker (static snapshot of time)
Historical evolution is due to theory practiceHistorical evolution is due to theory, practice, professional qualifications/numbers, computation, data constraintsconstraints
Geography, Dep. Cambridge, UK5th November, 2015

The simplified reality of static world resulting from p y goverlays of data is not enough
Today is a result of complex physical and social interactions that have in account past events and future expectationsexpectations
Pure causation is not enough and cumulative effects, ‘carrying capacity’ , self-organization, etc. play important y g p y g p y proles
Complexity theoryGeography, Dep. Cambridge, UK5th November, 2015

Element/variable
What is complexity?
Element/variable attribute (i.e. temperature)
In terms of representing various phenomenaA – yes/noA yes/noB – only complexity(i.e. water convection cells– at the edge of “chaos”)C – yes/no (non complex phenomena)time
A and C can be dealt with other models, but CM can be very importantB can only be understood by using Complexity modelsWhy: because B represents a “transient reality” something that will become different(the trajector is not “linear” 1+2 might not be eq al to a same realit (e en if more/less(the trajectory is not “linear” 1+2=might not be equal to a same reality (even if more/less
intense))
Geography, Dep. Cambridge, UK5th November, 2015

Identification of complex behaviour for an element or phenomena through timeIdentification of complex behaviour for an element or phenomena through time
Identification of complex behaviour for multiple elements or variables through time and space
Geography, Dep. Cambridge, UK5th November, 2015
p p g p

How a particular phase transition is deployed – the vortex of time
Geography, Dep. Cambridge, UK5th November, 2015

2- ‘Wicked problems’ and the wrong “decision makers model”
Rittel and Webber’s 1973 conception of “wicked problems” to explain why conventional scientific approaches failed to solveexplain why conventional scientific approaches failed to solve problems of pluralistic urban societies. Try to confront (urban) social problems with the wrong toolsTry to confront (urban) social problems with the wrong tools
because we have misunderstood the very nature of the problems“wicked problems have no stopping rule ” and “wicked problems wicked problems have no stopping rule, and wicked problems
do not have an enumerable (or an exhaustively describable) set of potential solutionspotential solutions
The concept of certainly in an uncertain world The timing of Lee’s requiem and Rittel and Webber’s Wicked problems
Geography, Dep. Cambridge, UK5th November, 2015

3. Complexity theory: The right moment in time to link l i d i i d b d lplanning decision and urban models
Mismatch between technology, theory, data of the 70s gy, y,resulted in Lees’ “Requiem for large scale models”XXI century of Big Data high computation capabilityXXI century of Big Data, high computation capability,
vast numbers of experts, more data-aware policy Key contributions: Von Neumann and Morgenstern (1944, 1966), Ulam (1960, 1974), Prigogine (1977,(1944, 1966), Ulam (1960, 1974), Prigogine (1977, 1999, 1984), Tobler and Burks (1979), Kauffman (1984, 1993) Wolfram (1994) Holland (1995 1999) and1993),Wolfram (1994), Holland (1995, 1999), and Crutchfield (1995); John Nash exploring research
lt b M ill Fl d d M l i D h t RANDresults by Merrill Flood and Melvin Dresher at RAND corporation (1950s);
Geography, Dep. Cambridge, UK5th November, 2015

Theory Processes Modelsffocus
time50s
Deterministic
Systems theory Rational Planning
Physical/regions
Beyond modernity
Advocacy of Planning
People/
Participative PlanningIncremental Planning
Mix Scanning
People/social
Mix-Scanning (Zoom in-out, Top/down-b/up)
Stochastic
Complexity Theory
Top/down b/up)
Feedback loopsf l / d t/ i h k l dof learn/adapt/enrich_knowledge
Geography, Dep. Cambridge, UK5th November, 2015

CAs(i) A grid or raster space – organised by cells which are the smallest units in that(i) A grid or raster space organised by cells which are the smallest units in thatgrid/space;(ii) (ii) Cell States – cells must manifest adjacency or proximity. The state of a
ll h di l t t iti l hi h d fi d i t fcell can change accordingly to transition rules, which are defined in terms ofneighbourhood functions;(iii) (iii) The neighbourhood and dependency of the state of any cell on the state( ) g p y yand configuration of other cells in the neighbourhood of that cell;(iv) (iv) Transition rules that are decision rules or transition functions of the CAmodel and can be deterministic or stochastic;model and can be deterministic or stochastic;(v) (v) Sequences of time steps. When activated, the CA proceeds through aseries of iterations
study of random complex CA came an understanding of its basic patterns: as they appear to fall into four qualitativebasic patterns: as they appear to fall into four qualitative classes, in what concerns one-dimension (1-D) CA evolution leads to: (i) a homogenous state; (ii) a set of separated
( ) ( )simple stable or periodic structures; (iii) a chaotic pattern; (iv)complex localised structures, sometimes long-lived (Wolfram, 1984:5)
Geography, Dep. Cambridge, UK5th November, 2015
1984:5)

ABM-GAs are constituted of:
(i) agents that do not have the constraints of neighbourhoodeffects,
(ii) b h i l l t d th i t it lf (iii) (ii) behavioural roles among agents and the environment itself, (iii)independence from central command/control, but able to act if actionat a distance is required,q , (iv) states of agents tend to represent behavioural forms.
The most basic model environment of an ABM-GA will have a setof attributes per agent (or group of agents), (one)a set of decision treesand trigger points that will allow to set the context for a new movementand trigger points that will allow to set the context for a new movement(upgrade of the spatial/temporal environment) in time/space .
Geography, Dep. Cambridge, UK5th November, 2015

Starting the study of complex systems in Spatial Analysis ….
Waldo Tobler in contact with Arthur Burks was exposed to Von Neumann’s ‘C G ’ (19 9)works, and published ‘Cellular Geography’ (1979).
At NCGIA S t B b H l C l li d K ith Cl k bli h dAt NCGIA-Santa Barbara, Helen Couclelis and Keith Clarke, published respectively ’Cellular Worlds’ (Couclelis, 1985) and develop the first fully operational and implementable CA (Clarke and Gaydos, 1998). While et. ope at o a a d p e e tab e C (C a e a d Gaydos, 998) e etsince the 1990’s focus in the ‘adaptive’ CA as a basis basis of integrated dynamic regional analysis (1997 )
Michael Batty initially at NCGIA-Buffalo and afterwards at CASA-UCL, developed the theory and practice that culminated in the publication of thedeveloped the theory and practice that culminated in the publication of the seminal books ’Fractal Cities’ (1994) and ‘Cities and complexity’ (2005). Recently, Wolfram’s book ‘A New Kind of Science’ (2002) y, ( )
ES = 3rd Generation (consolidation, reassemble, expansion, validation)
Geography, Dep. Cambridge, UK5th November, 2015

Operational Dynamic Urban Models
Geography, Dep. Cambridge, UK5th November, 2015

urban19751976 urban
roadsslope
excludedhilshade
1976...
test mode
coarse
hilshade1997 calibratefine
finaldata
i iti
SLEUTH Urban Model
forecastDNAacquisition
metricsimages
19981999
.
.
reclass excluded
calculate LA metrics
apply LA strategies
1998
1999SLEUTH resultsCVCA
?CVCA
.
.2025
results
workshop’s morning
Keep existent DNA?
yes?
no?forecastEnvironmentalModel
images metrics
morning
urbanroadsslope
new DNA
E I l iworkshop’s afternoon
SWOT analysis
Map SWOT &
reclassify SLEUTH’s input data
slopeexcludedhilshade
Expert Inclusion‘people’s model’
Geography, Dep. Cambridge, UK5th November, 2015
-Map-SWOT & analysis-critic

2. SLEUTH
Geography, Dep. Cambridge, UK5th November, 2015

100120
cells
20406080
umbe
r of u
rban
Identification/Quantificationof the metrics that control
0D
iffus
ion
Bre
ed
Spr
ead
Slo
pe
Roa
ds
Diff
usio
n
Bre
ed
Spr
ead
Slo
pe
Roa
ds
nu of the metrics that control the behavior of the system
AML
D D
AML AMP
final fine coarse
future
AMLAMP
Identification futureIdentification/Quantificationof phase
pastof phase
transitionsConfirmation of fractal
Urban growthof fractal dimension
Geography, Dep. Cambridge, UK5th November, 2015

urban roads slope
1975 1976
. test mode slope
excluded hilshade
.
.
1997 calibrate
coarse
fine
f t
final
DNA
data aquisition
t ii forecastDNA
1998
metrics images
199819981999
.
.
reclass excluded
calculate LA metrics
apply LA strategies
1998
1999
.
. 2025
CVCA - CA - Environmental Model
3. CVCA Model
images metrics
Geography, Dep. Cambridge, UK5th November, 2015

Transition Rules:
Number of pixels (pixels with a probability of change to urban)
Action stepA. Protective
Desired network elements are identified and protected through planning policy and land change to urban)
1 Protective 0 but NN > than add protective pixels B. Defensive
use control in advance of negative landscape matrix changes.
Isolated core area in ‘non-supportive 1. Protective 0 but NN > MNND
than add protective pixels around all outer patch and add protective pixels until arriving at closest neighbor
landscape matrix’ is subject to isolation from disturbance to corridors and to incremental reduction in size of the core area that can be protected through a new buffer zone.neighbor
2.Defensive <=50% *,** than add defensive pixels to all outer patch cell where transition cell exists
C. OffensiveIsolated core area is protected with a buffer zone and linked into a greenway network with corridors that are newly developed within a non-supportive landscape matrix
3.Offensive >50% add offensive pixel to all outer patch cells and add offensive cells until nearest neighbor D Opportunisti
within a non supportive landscape matrix context. The offensive strategy employs a range of tactics, including nature development, to achieve a desired landscape configuration.
nearest neighbor
4.Opportunistic 0 but NN = NNI (and no transition cell nearby) than link to nearest neighbor
D.Opportunistic
Isolated core area is linked with an existing corridor, buffered, and anew supporting landscape matrix is developed. The opportunistic strategy takes advantage of unique circumstances that may only support nearest neighbor
5. Grow Goal or Result
some greenway uses, e.g. recreation.
Existing Landscape
Core AreaBuffer Zone
Corridor
Supporting Landscape MatrixNon-Supporting Landscape Matrix
Geography, Dep. Cambridge, UK5th November, 2015

Metric - AMP ValueMetric - AML Value Metric AMP Value
Edges 14964
Area 24204
Metric AML Value
Edges 35171
Area 106460
Num Clusters 708
MCS 34
MPS 275
Num Clusters 1134
MCS 93
MPS 577 MPS 275
LSI 7.7
MNND 1.5
MPS 577
LSI 9.9
MNND 1.6
Geography, Dep. Cambridge, UK5th November, 2015

CVCA SimulationCVCA Simulation
Geography, Dep. Cambridge, UK5th November, 2015

Protective cells
Defensive corridor
Promoting big patches, by avoiding divide on big patch in t t
Geography, Dep. Cambridge, UK5th November, 2015
to two

urban19751976 urban
roadsslope
excludedhilshade
1976...
test mode
coarse
hilshade1997 calibratefine
finaldata
i itiforecastDNA
acquisitionmetricsimages
19981999
.
.
reclass excluded
calculate LA metrics
apply LA strategies
1998
1999SLEUTH resultsCVCA
?..
2025
results
workshop’s morning
Keep existent DNA?
yes?
no?forecast
h l d limages metrics
morning
urbanroadsslope
new DNA 4. The People’s model
workshop’s afternoon
SWOT analysis
Map SWOT &
reclassify SLEUTH’s input data
slopeexcludedhilshade
Geography, Dep. Cambridge, UK5th November, 2015
-Map-SWOT & analysis-critic

TWO MAP DRAWINGS RESULTING FROM THE WORKSHOP’S AFTERNOON
Geography, Dep. Cambridge, UK5th November, 2015

SWOT RESULTSStrengths Votes
%Weakness votes
%Opportunities Votes
%Threats votes
SWOT RESULTS
Transport system (road
19.5 Mobility, accessibility
32.6 Improve transportation
17.6 Uncontrolled urban sprawl
29.9y (
network, airport, harbor)
yand transport
psystem
p
Tourism and world heritage (Lisbon and Porto)
17.8 Lack of urban quality
17.0 Urban renewal 15.7 Natural risks (e.g. coastal, flooding, earthquake)
16.4
Porto) earthquake)
Capital city 13.0 Uncontrolled 11.3 Cultural 11.8 Urban violence 14.2p yurban sprawl tourism/
eventsand drugs
Geography, Dep. Cambridge, UK5th November, 2015

Geography, Dep. Cambridge, UK5th November, 2015

1. The image of the city
The image of a city-regionIdentification/quantificationU b f ( i t t / ibl )Urban forms (existent /possible)
“same future” – different simulations same future – different simulations
Geography, Dep. Cambridge, UK5th November, 2015 28

7. DG-ABC MODEL
Concept model of DG-ABC model
Intelligent agents Cellular automata TPB model Genetic algorithmIntelligent agents Cellular automata TPB model Genetic algorithm
Dynamics capturing
a-spatial dynamics spatial dynamics behavioural regulations
behavioural optimizations
Factors social-economic infrastructures/ behaviours of agents behaviours of agentsFactors oriented
social-economic influences
infrastructures/ecosystems
behaviours of agents behaviours of agents
Level individual individual individual level high level
h lt b h i b i hb h d N/A l ti bchanges alter behaviours by GA and themselves
neighbourhoods navigation
N/A evolution by themselves
Data requirement
social-economics /policies quantifying
GIS data agent’s beliefs/ profile information
strategies/optionsg
Integrated model
Geography, Dep. Cambridge, UK5th November, 2015

DG-ABC MODEL
3.2 DG-ABC model
1. Model Environment2. Heterogeneous agents3 CA (SLEUTH)3. CA (SLEUTH)4. Decision behaviors5. Interactions6. Synchronization
h k d blThe key decision tables:
• The Resident agents’ utility table.• The developer agents’ development
spatial�data
application table. • The government agent’s approving table. • Synchronization decision table.
Source: Ning Wu and Elisabete A. Silva 2010a
Geography, Dep. Cambridge, UK5th November, 2015

DG-ABC MODEL
3.3 Theory of Planned Behavior
a i ia Ap AW WA Behavioral Beliefs
Attitude toward the Attitude toward the
i p Ctd ctAp AW WA
1( ) /
na a ii ij ji neighbor
jSN M Inf N
m
I
Normative Beliefs
Subjective Norm Intention
behavior
Behavior
behavior
Subjective Norm Intention Behavior
atraffic environment convenience tijEI a E b E c E
1
ma a ai ik ki
kPBC Cb P
Perceived Behavioral Control
Control Beliefs
Actual Behavioral Control
Perceived Behavioral Control
Actual Behavioral Control ff j
Be W I W AbC W I W EI • A: the degree to which the performance of the behaviour is
TpB model (Icek Ajzen 2006) 2 311 2 3( )highway citycenterroad B D B DB Dt t t
trafficE w A e w A e w A e
1 2 3( ) max{ , , .......... }nD f B Be Be Be Be
1 2 1 2Be W I W AbC W I W EI g ppositively or negatively valued.
• SN: an agent’s perception of social normative pressures, orrelevant others’ beliefs that the agent should (not) performsuch behaviour.
• PBC: an individual’s perceived ease or difficulty of performing p y p gthe particular behaviour.
• I: an indication of a agent’s readiness to perform a givenbehaviour.
Geography, Dep. Cambridge, UK5th November, 2015

Properties of government developer agentsp g p g
Properties of resident agents
Properties of property developer agents
Geography, Dep. Cambridge, UK5th November, 2015
p p p y p g

Spatial synchronization in the model
Temporal synchronization in the model
Geography, Dep. Cambridge, UK5th November, 2015

(a) run CA standby (b) run agents standby
(a) run CA standby (b) run agents standby
(c) run integrated model(d) real urban data
Geography, Dep. Cambridge, UK5th November, 2015
(c) run integrated model

Geography, Dep. Cambridge, UK5th November, 2015

An Integrated Spatial Analysis Environment for Urban-Building Energy Analysis in Cities (I-UBEA)
• To track energy changeE h f L d
RESEARCH OBJECTIVES
Analysis in Cities (I-UBEA)
Energy change of London Energy change per local authority / buildings
• To estimate and analyze Energy Usagey gy gIntensities (EUI) EUI of Local Authorities
EUI of sub categories of buildings EUI of sub-categories of buildings• To explain energy consumption
Explain how the distribution of land use influences energy consumption in local authorities and the entire city of London
Explain how the distribution of floor area pinfluences energy consumption
• To evaluate energy performanceEvaluate energy performance of London while Evaluate energy performance of London while adapting different energy change policies.
Interactive Simulation Model for predicting of energy performance in the future on the basis of
Geography, Dep. Cambridge, UK5th November, 2015HIT / ### Conference /
Sep 25 2013
energy performance in the future on the basis of population change.

Department of Engineering Department of Land Economy
FUNCTION OVERVIEW OF I-UBEA
GIS Data Visualization & Data query in different spatial scales, for both polygon and point data
Policy impact simulation and energy
GIS Boundary Data
I-UBEAI-UBEA
point data prediction (with population dynamic using statistics model)
Data
GIS Boundary I UBEAI UBEA
Attribute Data
yData
Energy & EUI
Attribute Data
Explain energy ti ith tt ib tconsumption with attribute
data by using Statistics AnalysisAttribute
Data
Geography, Dep. Cambridge, UK5th November, 2015The integrated model assembles functions from GIS, R, EnergyPlus and Netlogo

Energy scenario analysis (what‐if analysis)
tion
Baseline scenario
This method is more flexible compared to regression analysis because it is suitable for the situation where energy consumption data are unavailable in some spatial scales or some areas of a city.
Elec
trifi
cat
This scenario is to explore how the total energy or carbon emissions would change if building sector would use electricity instead of gas for heating
• Baseline scenarioThe baseline scenario is based on prior knowledge on
(1
) Eer
sion
electricity instead of gas for heating. energy use intensity in terms of building types. Three methods are provided:
ype
conv
e Three methods are provided: benchmark values median values
This Scenario investigates the change of building types on the energy consumption in cities
uild
ing
ty
Monte Carlo methodAnalysts may choose one or all these three methods based
consumption in cities.
(2
) Bic
ient
all these three methods based on data availability.
This scenario allows analysts studying the influences of change of energy use
nerg
y ef
fi the influences of change of energy use intensities for different building types.
Geography, Dep. Cambridge, UK5th November, 2015 (3
) En
Note: The benchmark values are based on low,
typical, and high values (EUI) from previous literature.

Model function: Energy optimization
Data: UKMap, floor area of London, Gas Energy consumption for each MSOA in London.p
Calculate EUI for MSOA and find polygon with best Calculate EUI for MSOA and find polygon with best EUI.
calculate area percentage for all polygons.II--UBEAUBEAII--UBEAUBEA pick best performing ratio and calculate mean
ratio.
calculate difference to best performing ratio and p gdifference to mean ratio, respectively, for compositional data.
Part 1. display overall Part 2. display
calculate overall difference to best performing ratio and to mean ratio, respectively.
p ydifference to best performing ratio with scaled color
p yoverall difference to mean ratio with scaled color
Geography, Dep. Cambridge, UK5th November, 2015
Note: Each part of step 6 can be executed independently.

Result: Energy optimization based on building types at MSOA level in London
• To compute the overall difference of floor area percentage to best‐performing area in terms of gas use intensity at London MSOA level.terms of gas use intensity at London MSOA level.
• The overall differences of floor area percentage based on gas use intensity still presents the characteristics of spatial distribution to some extent, though not clustered as large area.
• Spatial distribution demonstrates that energy consumptions in an area are to some extent influenced by where the area is located in a city.
best-performing MSOA
MSOA ith tMSOA without gas consumption data
MSOAs with similar overall difference are likely to clusterlikely to cluster together.
small difference
Geography, Dep. Cambridge, UK5th November, 2015 large difference
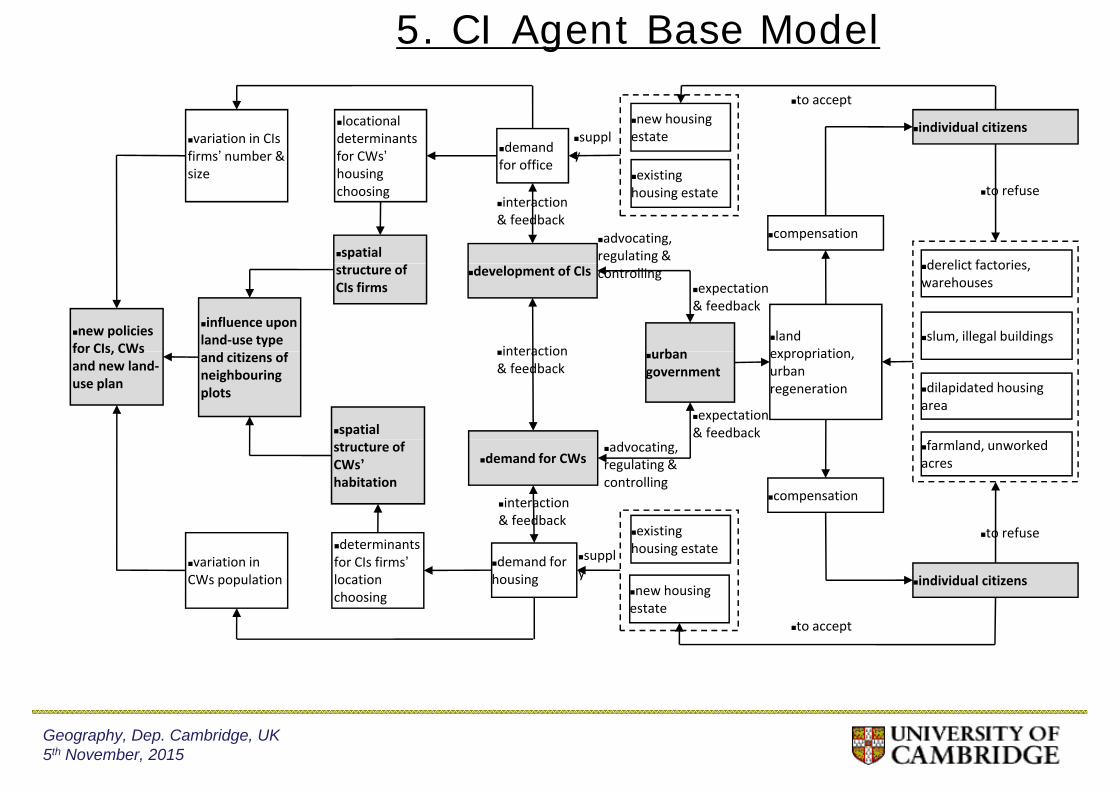
5. CI Agent Base Model
demand for office
individual citizens
existing
new housing estate
locational determinants for CWs’housing
to accept
variation in CIs firms’ number & size
supply
derelict factories
existing housing estate
spatial
housing choosing
compensationadvocating, regulating &
to refusesize
interaction & feedback
land expropriation
development of CIs derelict factories, warehouses
slum, illegal buildingsb
structure of CIs firms
influence upon land‐use type
controlling
new policies for CIs, CWs interaction
expectation & feedback
expropriation, urban regeneration dilapidated housing
area
urban government
spatial
and citizens of neighbouring plots
for CIs, CWs and new land‐use plan
interaction & feedback
expectation & feedback
demand for CWsfarmland, unworked acres
structure of CWs’habitation
i ti
compensation
advocating, regulating & controlling
interaction & feedback
demand for housing
determinants for CIs firms’location choosing
existing housing estate
new housing estate
individual citizens
to refuse
variation in CWs population
supply
to accept
Geography, Dep. Cambridge, UK5th November, 2015

Geography, Dep. Cambridge, UK5th November, 2015

Geography, Dep. Cambridge, UK5th November, 2015

Agents and terms forAgents and terms for negotiationnegotiation
• Agents:196 countries– Annex1 (42)
No Annex1 (149)– No Annex1 (149)– Others (5)
• Terms for negotiation– Technology trade– Carbon trade– GDP growth supportg pp
• Negotiation rules
Geography, Dep. Cambridge, UK5th November, 201505/11/2014

Condition-action rulesCondition action rules
Not included in the Negotiation process, Focusing on GDP growth
Negotiation, aiming to lift GDP th tGDP growth rate
Negotiation, to lift GDPNegotiation, to lift GDP growth, consider carbon reduction
Negotiation, following current agreements andcurrent agreements and strategies
Negotiation, aiming to carbon reduction
Geography, Dep. Cambridge, UK5th November, 201505/11/2014

Geography, Dep. Cambridge, UK5th November, 2015

Geography, Dep. Cambridge, UK5th November, 2015

Some Papers
2013 Simulating the dynamics between the development of creative industries and urban spatial g y p pstructure: an agent-based model (with H. Liu). S. Geertman et al. (eds.), Planning Support Systems for Sustainable Urban Development, Lecture Notes in Geoinformation and Cartography, DOI: 10.1007/978-3-642-37533-0_4, Springer-Verlag Berlin Heidelberg pp. 51-72_ p g g g pp2013 Selecting artificial intelligence urban models using waves of complexity. Urban Design and Planning. 166 (1): 1-22012 Surveying Models in Urban Land Studies (with N Wu) Journal of Planning Literature 27 (2012 Surveying Models in Urban Land Studies. (with N. Wu) Journal of Planning Literature.27 ( ): 1-142010 Artificial intelligence solutions for Urban Land Dynamics: A Review (with N. Wu). Journal of Planning Literature 2010 24: 246-265Planning Literature. 2010 24: 246-265.2008 Strategies for Landscape Ecology in Metropolitan Planning: Applications Using Cellular Automata Models. (with J. Wileden, J. and J. Ahern), Progress in Planning, 70(4):133-177 - ISSN: 0305 90060305-90062005 Complexity, Emergence and Cellular Urban Models: Lessons Learned from Appling SLEUTH to two Portuguese Cities. (with K. Clarke) European Planning Studies, 13 (1): 93-115 –ISSN: 0965 4313ISSN: 0965-43132004 The DNA of our Regions: artificial intelligence in regional planning. Futures, 36(10):1077-1094. – ISSN: 0016-32872002 Calibration of the SLEUTH Urban Growth Model for Lisbon and Porto, Portugal. (with K. Clarke) Computers, Environment and Urban Systems, 26 (6): 525-552 - ISSN: 0198-97150965-4313
Geography, Dep. Cambridge, UK5th November, 2015

Some book chapters
2014 Measuring space: a review of spatial metrics for urban growth and shrinkage (with J. Reis). In: The Routledge Handbook of Planning Research Methods. (Eds. Patsy Healey, Neil Harris and Pieter van den Broeck), RoutlegePieter van den Broeck), Routlege2014 DG-ABC: An Integrated multi-agent and cellular automata urban growth model (with N. Wu). Technologies in Urban and Spatial Planning: Virtual Cities and Territories? (Eds. Nuno Norte Pinto, José António Tenedório António Pais Antunes and Josep Roca ) IGI-Global pp 57-92José António Tenedório, António Pais Antunes and Josep Roca ), IGI Global, pp.57 922013 Simulating the dynamics between the development of creative industries and urban spatial structure: an agent-based model (with H. Liu). S. Geertman et al. (eds.), Planning Support Systems for Sustainable Urban Development Lecture Notes in Geoinformation and Cartography DOI:for Sustainable Urban Development, Lecture Notes in Geoinformation and Cartography, DOI: 10.1007/978-3-642-37533-0_4, _ Springer-Verlag Berlin Heidelberg, pp. 51-722011 Cellular Automata Models and Agent Base Models for urban studies: from pixels, to cells, to Hexa Dpi’s In: Urban Remote Sensing: Monitoring Synthesis and Modeling in the UrbanHexa-Dpi s. In: Urban Remote Sensing: Monitoring, Synthesis and Modeling in the Urban Environment. Edited by: Dr. XiaojunYang. Wiley-Blackwell. pp. 323-345. ISBN: 978-0-470-74958-62010 Waves of complexity. Theory, models, and practice. In: Roo, Gert de, and Elisabete A. Silva (2010) A Planner’s Encounter with Complexity Ashgate Publishers Ltd Aldershot (UK) pp 309(2010), A Planner s Encounter with Complexity, Ashgate Publishers Ltd, Aldershot (UK). pp. 309-331.. ISBN: 978-1-4094-0265-72010 Complexity and CA, and application to metropolitan areas. In: Roo, Gert de, and ElisabeteA Silva (2010) A Planner’s Encounter with Complexity Ashgate Publishers Ltd AldershotA. Silva (2010), A Planner’s Encounter with Complexity, Ashgate Publishers Ltd, Aldershot (UK). pp..187-207. ISBN: 978-1-4094-0265-7
Geography, Dep. Cambridge, UK5th November, 2015

Elisabete (es424@cam ac uk)Elisabete ([email protected])www.landecon.cam.ac.uk/directory/esilva
LISA Labwww.landecon.cam.ac.uk/research/lisa
New Book: "The Routledge Handbook of Planning Research Methods"Methods http://www.routledge.com/books/details/9780415727952/
Geography, Dep. Cambridge, UK5th November, 2015