Embed Size (px)
Citation preview
31
Adaptive Planning, Understanding Organizational Workloadto Capability/Capacity Through Modeling and Simulation
Chris Hase, Ph.D.Whitney, Bradley & Brown Consulting
Abstract. In August 2003, the Secretary of Defense (SECDEF) established the Adaptive Planning(AP) initiative [1] with an objective of reducing the time necessary to develop and revise CombatantCommander (COCOM) contingency plans and increase SECDEF plan visibility. In addition to reducingthe traditional plan development timeline from twenty-four months to less than twelve months (with agoal of six months)[2], AP increased plan visibility to Department of Defense (DoD) leadership throughIn-Progress Reviews (IPRs). The IPR process, as well as the increased number of campaign andcontingency plans COCOMs had to develop, increased the workload while the number of plannersremained fixed. Several efforts from collaborative planning tools to streamlined processes wereinitiated to compensate for the increased workload enabling COCOMS to better meet shorter planningtimelines. This paper examines the Joint Strategic Capabilities Plan (JSCP) directed contingencyplanning and staffing requirements assigned to a combatant commander staff through the lens ofmodeling and simulation. The dynamics of developing a COCOM plan are captured with anExtendSim® [3] simulation. The resulting analysis provides a quantifiable means by which to measurea combatant commander staffs workload associated with development and staffing JSCP [4] directedcontingency plans with COCOM capability/capacity. Modeling and simulation bring significantopportunities in measuring the sensitivity of key variables in the assessment of workload tocapability/capacity analysis. Gaining an understanding of the relationship between plan complexity,number of plans, planning processes, and number of planners with time required for plan developmentprovides valuable information to DoD leadership. Through modeling and simulation AP leadership cangain greater insight in making key decisions on knowing where to best allocate scarce resources in aneffort to meet DoD planning objectives.
1. INTRODUCTION
Secretary of Defense Donald Rumsfeldoriginated the Adaptive Planning initiative inAugust 2003 to improve the joint operationplanning system. Secretary Rumsfeld believedthat the joint operation planning process was toolengthy, existing plans were out dated in the newstrategic environment, existing contingencyplans could not quickly transition to execution,and the planning system was unable tocoordinate military operations within the contextof a whole of government response to acontingency or crisis situation [5].
Overcoming the shortcomings of the legacy jointoperation planning system, the AP initiativeincluded the following objectives [2]:
• Produce plans on demand in 1 year or lesswith plan revisions as needed,
• Shape plans throughout development throughperiodic dialogue among DoD leaders andplanners,
• Perform planning in parallel and concurrent atstrategic and operational levels,
• Link planning, readiness and forcemanagement processes and data in a virtualenvironment,
• Provide a full range and menu of militaryoptions to meet changing circumstances,
• Prioritize plans and planning effort to enableseamless transition to execution
• Determine force, logistic, transportation andoperational feasibility throughout the planningprocess.
The AP initiative increased the workload in theplanning community by reducing planning time,increasing planning visibility, increasing thenumber of plans and increasing the level ofdetail desired in the planning process.
Leadership in the AP community was sensitiveto the increased workload with shorter planningtimelines. However, they lacked tools necessaryto quantify the increased workload and measureits impact on the existing planning capacity.
This paper addresses the adaptive planningworkload to capacity study from a modeling andsimulation perspective. Study details are initiallypresented. The value of modeling and simulation
https://ntrs.nasa.gov/search.jsp?R=20100012850 2018-06-17T06:57:57+00:00Z
32
(i.e. Level 1, 2, 3, 3T, 4). Contingency planningincludes the preparation of four levels ofplanning detail. Planning levels are furtherdefined as follows:
Level 1 planning (Strategic Concept) requiresthe least amount of planning detail and isnormally completed in the shortest amount oftime. Generally, COCOMs complete Level 1planning in 10-12 weeks. From a COCOMperspective, completion of level 1 planning,documents an initial concept of operations.
Level 2 planning (Base Plan) require completionof strategic concept planning. A level 2 plancontains paragraphs one through five of thestandard Operation Plan (OPLAN) format withannexes.
Level 3 planning (Concept Plan) requirecompletion of strategic concept and completionof the base plan planning. A Level 3 plan is anabbreviated OPLAN that would requireconsiderable expansion to be considered anOPLAN or Operation Order (OPORD). ACOncept Plan (CONPLAN) contains the baseplan, the commander's CONOPS with theappropriate annexes (A, B, C, D, J, K, S, V, Yand Z) and appendixes. If directed by theJSCP, planners do not calculate detailedsupport requirements or prepare detailedsupport requirements or prepare Time PhasedForce Deployment Data (TPFDD) files. A level 3plan that contains a TPFDD typically requiresmore detailed planning for the phaseddeployment of forces.
Level 4 planning (Operational Plan or OPLAN)contain the base plan, all required annexes withassociated appendixes and a TPFDD. TheOPLAN identifies planning assumptions and thespecific forces, functional support, deploymentsequence, and resources to execute the plan.The combatant commander may initiatecontingency plans not directed by the JSCP.The format and content for a contingency plan isprescribed in Joint Operation Planning andExecution System [6].
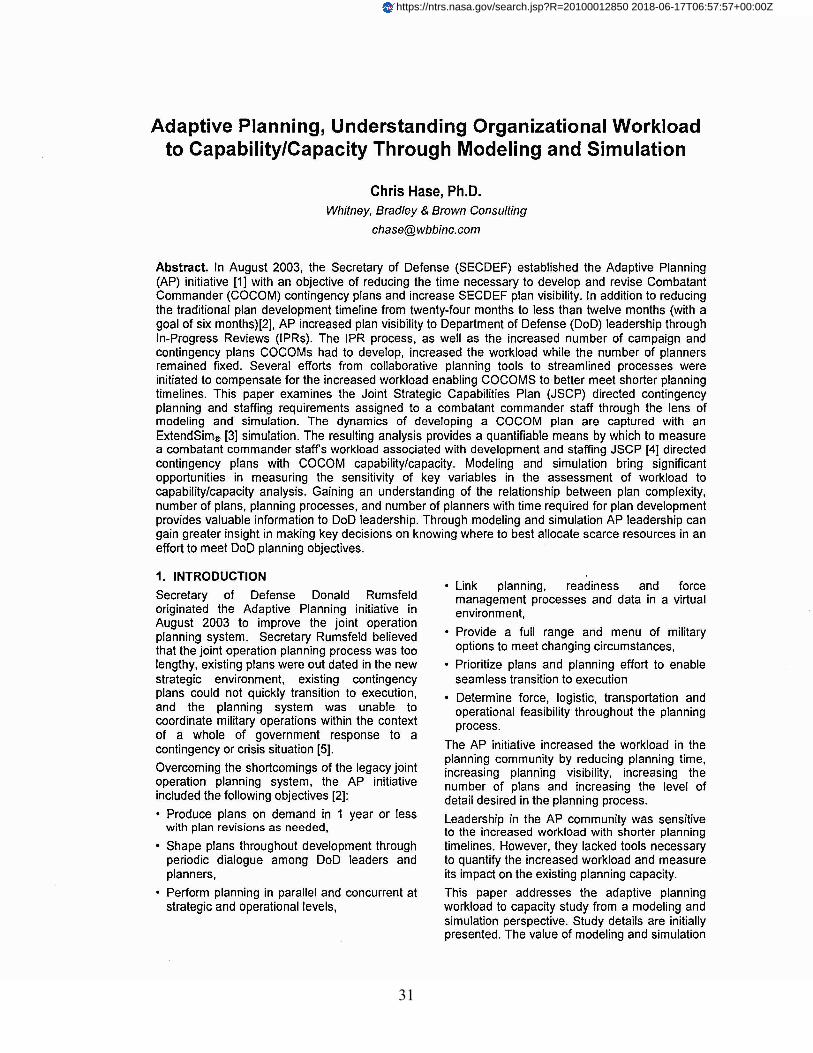
The number of planners was the thirdindependent variable defined as the quantity ofplanners and subjective quality of plannersassigned to a COCOM staff developing andreviewing plans.
The last independent variable is defined aswhite space. White space was a measurementof the calendar time that it took for a planningfunction to be completed. More detail definingwhite space is presented in the next section ofthis paper.
The AP Workload to Capacity Model had onedependent variable called planning time.Planning time was defined as the calendar time
Dependent Variable
'--------)
Independent Van abies
2. ADAPTIVE PLANNING WORKLOAD TOCAPACITY MODEL
AP leadership initiated an adaptive planningworkload study to assess the capacity ofCOCOM planners to develop contingency planswithin the guidelines of the AP objectives.
Establishing a common framework from which tolook at challenges brought on by AP initiativeswas an important first step of this study.Defining metrics, variables and the relationshipof those variables to each other was essential inproviding a quantitative assessment of workloadto capacity. AP documentation discussedtimelines for plan development. Additionally,legacy plan development has also beeninterested in planning timelines. For thesereasons, planning timelines was selected as theunderlying metric to measure goodness withinthis study. Planning timelines was selected tobecome the dependent variable. There weremany issues that affected planning timelines.These issues were divided into four themes orindependent variables; number of plans, level ofplans, number of planners, and white space.Figure 1 provides a graphical representationbetween independent variables, the work atCOCOMs and the dependent variable in the APWorkload Model.
Figure 1: AP Workload to Capacity Model
as it supports complex process analysis issummarized at the conclusion of this paper.
2.1 Variables
Number of Plans was the first independentvariable defined as the quantity of JSCP,Chairman of the Joint Chiefs of Staff (CJCS) andCOCOM directed plans assigned to a combatantcommander. This includes both the number ofplans requiring development and those underreview.
Level (Types) of Contingency Plans was thesecond independent variable defined by theJSCP, CJCS or COCOM directed planning level
33
that it took to complete a planning cycle for theJSCP, CJCS and COCOM self directed plans. Inreality, the planning cycle never ends since assoon as a plan has been approved, it goes intoupkeep and refinement stage to remain relevantin the changing global environment.
2.2 Adaptive Planning Processes and WhiteSpace
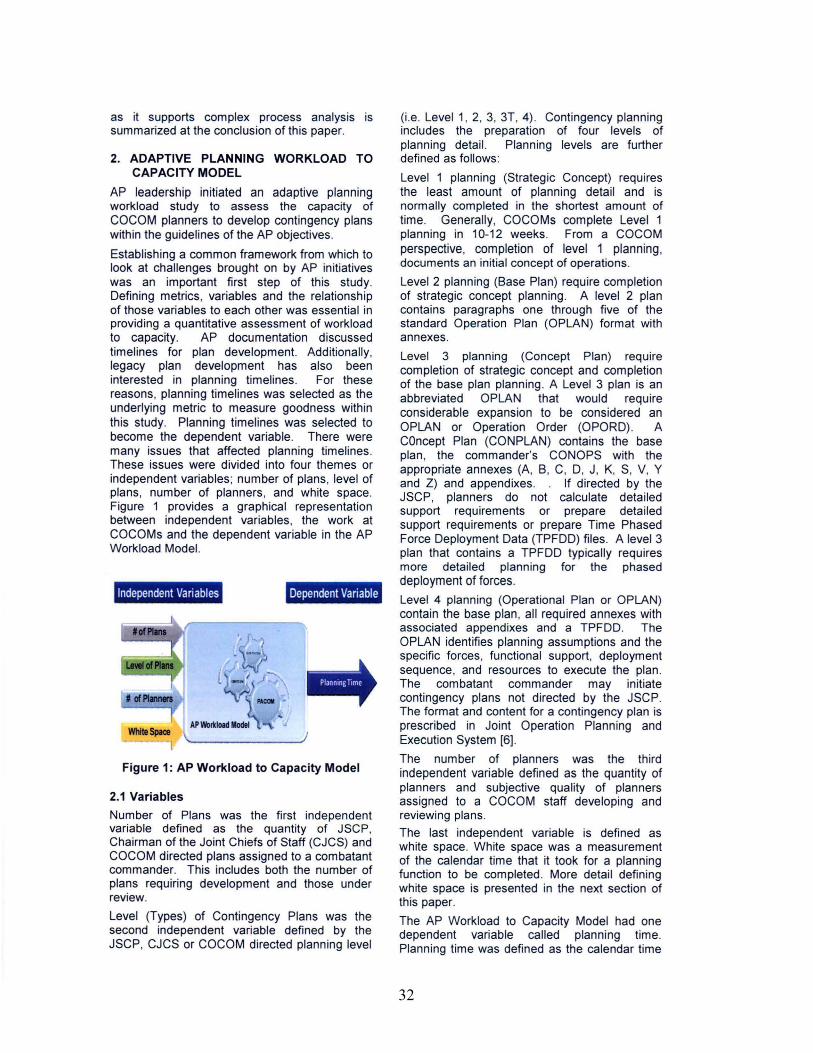
In its simplest form white space is a gauge ofplanning process inefficiencies measured incalendar time. Figure 2 presents a graphicalrepresentation of the numerous plandevelopment and review processes andfunctions that occur and the organizations thatparticipate in those events.
W..ks 0 4 8 12 16 20 24 28 32 36 40 44 48
( )
Figure 2: Planning Processes and White Space
Examples of white space occur when plandevelopment or review is halted waiting on adecision brief, additional analysis, or a planningconference where aligning schedules becomesthe overriding factor. White space occurs in thetime involved in collaboration betweenorganizations. White space occurs in vettingand agreeing to assumptions, enemy threat andforce allocation.
Many of the same contingency planning stepsand processes employed by planners occur incrisis action planning. Contingency planning ismeasured in weeks to months; crisis actionplanning is measured in days. This timedifference can be attributed to several factors.During crises action planning there is a clearerview of the threat, a greater sense of urgency indecision making, and priority alignment amongstthe stakeholders. This difference in time is aform of white space, where additional layers inthe planning process are often added to serveother interests.
2.3 Adaptive Planning Workload Simulation
Using a mathematical formula to conductanalysis is not always the most effective way to
gather data. Oftentimes simulations are moreeffective tools in analysis. Understanding therelationship between the dependent andindependent variables and the large volume ofcalculations necessary to evaluate the range ofissues lent itself to a simulation approach in thisstudy. The simulation language, ExtendSim~,
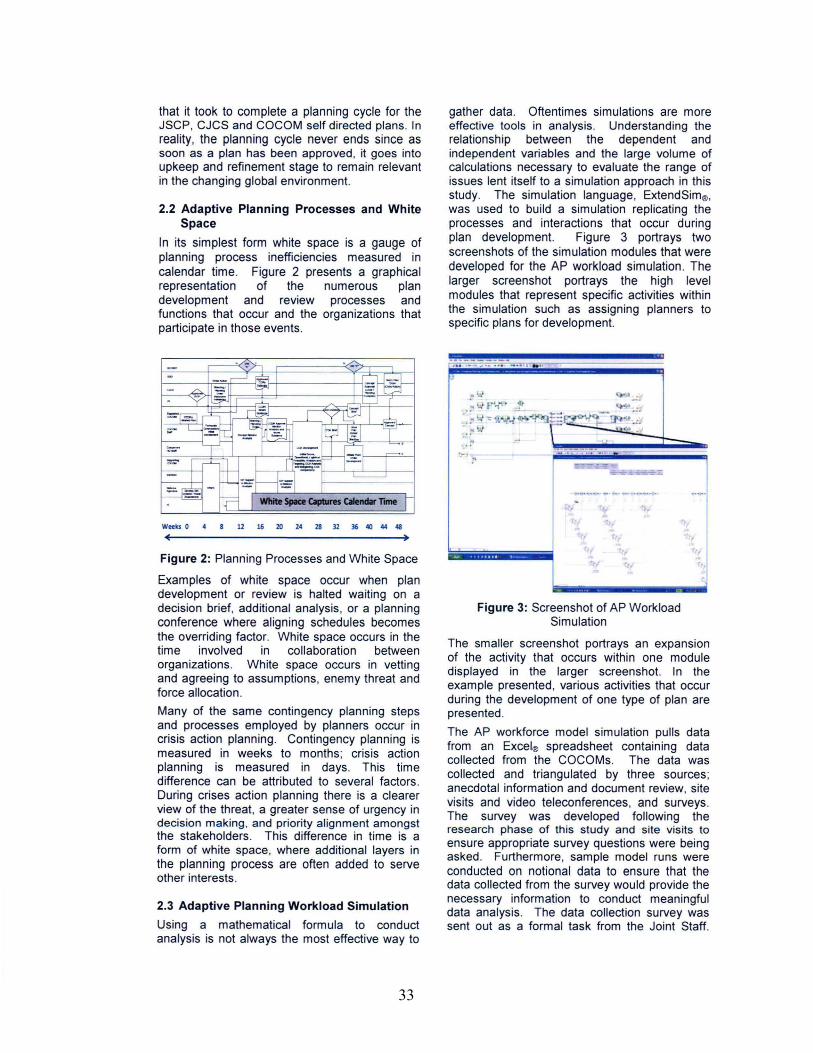
was used to build a simulation replicating theprocesses and interactions that occur duringplan development. Figure 3 portrays twoscreenshots of the simulation modules that weredeveloped for the AP workload simulation. Thelarger screenshot portrays the high levelmodules that represent specific activities withinthe simulation such as assigning planners tospecific plans for development.
Figure 3: Screenshot of AP WorkloadSimulation
The smaller screenshot portrays an expansionof the activity that occurs within one moduledisplayed in the larger screenshot. In theexample presented, various activities that occurduring the development of one type of plan arepresented.
The AP workforce model simulation pulls datafrom an ExcelQll spreadsheet containing datacollected from the COCOMs. The data wascollected and triangulated by three sources;anecdotal information and document review, sitevisits and video teleconferences, and surveys.The survey was developed following theresearch phase of this study and site visits toensure appropriate survey questions were beingasked. Furthermore, sample model runs wereconducted on notional data to ensure that thedata collected from the survey would provide thenecessary information to conduct meaningfuldata analysis. The data collection survey wassent out as a formal task from the Joint Staff.
34
Most COCOMs had their lead planner sign offon the data submission.
The purpose of this model and the underlyinganalysis is not to be predictive on the amount oftime it takes COCOMs to develop their plans butto show the relative impact of changes inplanner workload, policies and resources. Thenumber of plans and plan level determinesworkload. Planning inefficiencies and resourcesaffect the planning timelines. And the number ofplanners, their availability and trainingdetermines resources.
plan approval (for a new plan) or plan review (foran eXisting plan) allows for a baseline fromwhich to conduct analysis.
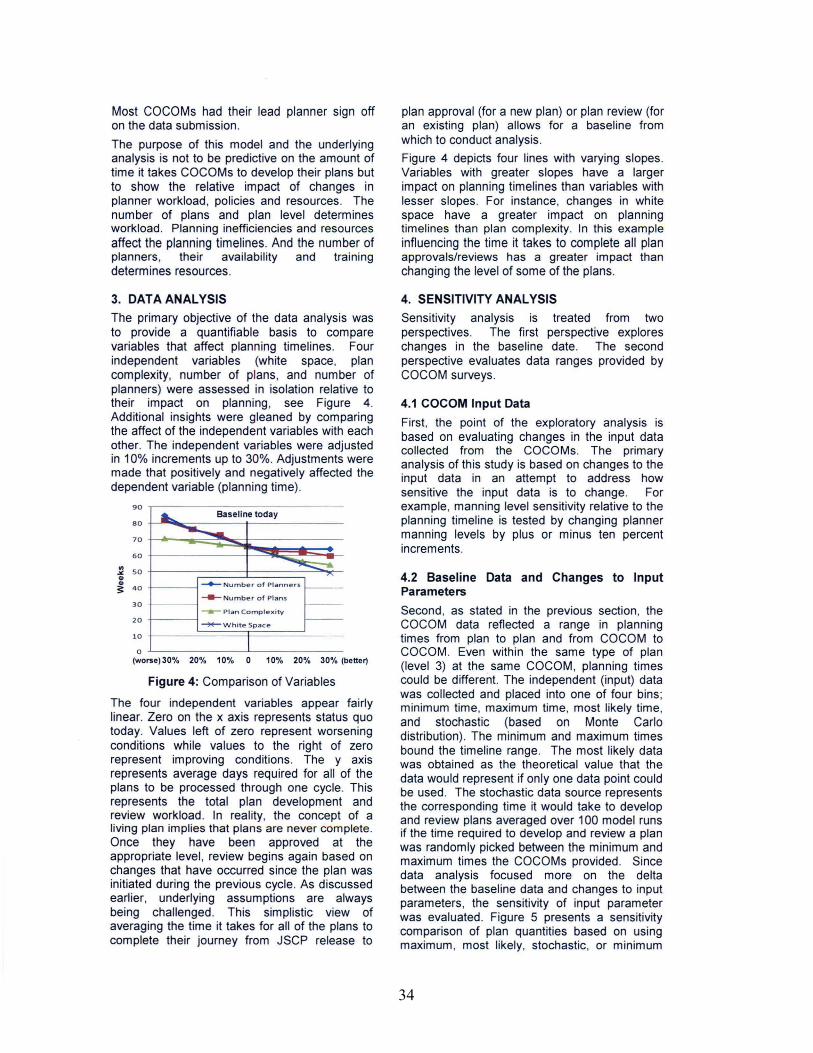
Figure 4 depicts four lines with varying slopes.Variables with greater slopes have a largerimpact on planning timelines than variables withlesser slopes. For instance, changes in whitespace have a greater impact on planningtimelines than plan complexity. In this exampleinfluencing the time it takes to complete all planapprovals/reviews has a greater impact thanchanging the level of some of the plans.
10
o(worse)30% 20% 10% 0 10% 20% 30% (better)
3. DATA ANALYSIS
The primary objective of the data analysis wasto provide a quantifiable basis to comparevariables that affect planning timelines. Fourindependent variables (white space, plancomplexity, number of plans, and number ofplanners) were assessed in isolation relative totheir impact on planning, see Figure 4.Additional insights were gleaned by comparingthe affect of the independent variables with eachother. The independent variables were adjustedin 10% increments up to 30%. Adjustments weremade that positively and negatively affected thedependent variable (planning time).
Figure 4: Comparison of Variables
The four independent variables appear fairlylinear. Zero on the x axis represents status quotoday. Values left of zero represent worseningconditions while values to the right of zerorepresent improving conditions. The y axisrepresents average days required for all of theplans to be processed through one cycle. Thisrepresents the total plan development andreview workload. In reality, the concept of aliving plan implies that plans are never complete.Once they have been approved at theappropriate level, review begins again based onchanges that have occurred since the plan wasinitiated during the previous cycle. As discussedearlier, underlying assumptions are alwaysbeing challenged. This simplistic view ofaveraging the time it takes for all of the plans tocomplete their journey from JSCP release to
4.1 COCOM Input Data
First, the point of the exploratory analysis isbased on evaluating changes in the input datacollected from the COCOMs. The primaryanalysis of this study is based on changes to theinput data in an attempt to address howsensitive the input data is to change. Forexample, manning level sensitivity relative to theplanning timeline is tested by changing plannermanning levels by plus or minus ten percentincrements.
4. SENSITIVITY ANALYSIS
Sensitivity analysis is treated from twoperspectives. The first perspective exploreschanges in the baseline date. The secondperspective evaluates data ranges provided byCOCOM surveys.
4.2 Baseline Data and Changes to InputParameters
Second, as stated in the previous section, theCOCOM data reflected a range in planningtimes from plan to plan and from COCOM toCOCOM. Even within the same type of plan(level 3) at the same COCOM, planning timescould be different. The independent (input) datawas collected and placed into one of four bins;minimum time, maximum time, most likely time,and stochastic (based on Monte Carlodistribution). The minimum and maximum timesbound the timeline range. The most likely datawas obtained as the theoretical value that thedata would represent if only one data point couldbe used. The stochastic data source representsthe corresponding time it would take to developand review plans averaged over 100 model runsif the time required to develop and review a planwas randomly picked between the minimum andmaximum times the COCOMs provided. Sincedata analysis focused more on the deltabetween the baseline data and changes to inputparameters, the sensitivity of input parameterwas evaluated. Figure 5 presents a sensitivitycomparison of plan quantities based on usingmaximum, most likely, stochastic, or minimum
&... Baseline today
----~
~ ....--.- Number- of Planners
~ Number of PlansI-----
-.- Plan ComplexityI-----
~WhiteSpace20
30
80
90
60
~ SO....~ 40
70
35
25.0% ,-------------
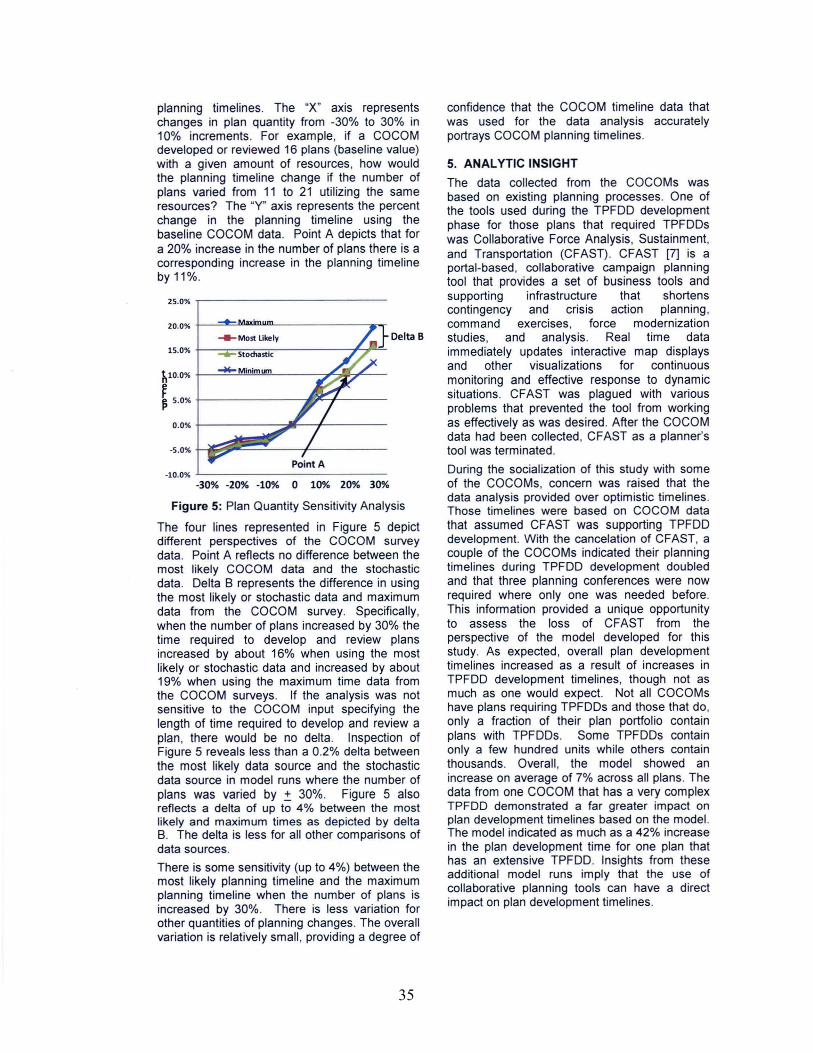
planning timelines. The "X" axis representschanges in plan quantity from -30% to 30% in10% increments. For example, if a COCOMdeveloped or reviewed 16 plans (baseline value)with a given amount of resources, how wouldthe planning timeline change if the number ofplans varied from 11 to 21 utilizing the sameresources? The "Y" axis represents the percentchange in the planning timeline using thebaseline COCOM data. Point A depicts that fora 20% increase in the number of plans there is acorresponding increase in the planning timelineby 11%.
-30% -20% -10% 0 10% 20% 30%
Figure 5: Plan Quantity Sensitivity Analysis
The four lines represented in Figure 5 depictdifferent perspectives of the COCOM surveydata. Point A reflects no difference between themost likely COCOM data and the stochasticdata. Delta B represents the difference in usingthe most likely or stochastic data and maximumdata from the COCOM survey. Specifically,when the number of plans increased by 30% thetime required to develop and review plansincreased by about 16% when using the mostlikely or stochastic data and increased by about19% when using the maximum time data fromthe COCOM surveys. If the analysis was notsensitive to the COCOM input specifying thelength of time required to develop and review aplan, there would be no delta. Inspection ofFigure 5 reveals less than a 0.2% delta betweenthe most likely data source and the stochasticdata source in model runs where the number ofplans was varied by ~ 30%. Figure 5 alsoreflects a delta of up to 4% between the mostlikely and maximum times as depicted by deltaB. The delta is less for all other comparisons ofdata sources.
There is some sensitivity (up to 4%) between themost likely planning timeline and the maximumplanning timeline when the number of plans isincreased by 30%. There is less variation forother quantities of planning changes. The overallvariation is relatively small, providing a degree of
5. ANALYTIC INSIGHT
The data collected from the COCOMs wasbased on existing planning processes. One ofthe tools used during the TPFDD developmentphase for those plans that required TPFDDswas Collaborative Force Analysis, Sustainment,and Transportation (CFAST). CFAST [7] is aportal-based, collaborative campaign planningtool that provides a set of business tools andsupporting infrastructure that shortenscontingency and crisis action planning,command exercises, force modernizationstudies, and analysis. Real time dataimmediately updates interactive map displaysand other visualizations for continuousmonitoring and effective response to dynamicsituations. CFAST was plagued with variousproblems that prevented the tool from workingas effectively as was desired. After the COCOMdata had been collected, CFAST as a planner'stool was terminated.
During the socialization of this study with someof the COCOMs, concern was raised that thedata analysis provided over optimistic timelines.Those timelines were based on COCOM datathat assumed CFAST was supporting TPFDDdevelopment. With the cancelation of CFAST, acouple of the COCOMs indicated their planningtimelines during TPFDD development doubledand that three planning conferences were nowrequired where only one was needed before.This information provided a unique opportunityto assess the loss of CFAST from theperspective of the model developed for thisstudy. As expected, overall plan developmenttimelines increased as a result of increases inTPFDD development timelines, though not asmuch as one would expect. Not all COCOMshave plans requiring TPFDDs and those that do,only a fraction of their plan portfolio containplans with TPFDDs. Some TPFDDs containonly a few hundred units while others containthousands. Overall, the model showed anincrease on average of 7% across all plans. Thedata from one COCOM that has a very complexTPFDD demonstrated a far greater impact onplan development timelines based on the model.The model indicated as much as a 42% increasein the plan development time for one plan thathas an extensive TPFDD. Insights from theseadditional model runs imply that the use ofcollaborative planning tools can have a directimpact on plan development timelines.
confidence that the COCOM timeline data thatwas used for the data analysis accuratelyportrays COCOM planning timelines.
Delta B
0.0% t------4:....---/-----
20.0% -I---='*=.Max.il:nuJ"'--------,..__
Point A
·5.0% l~~~~~--/.~----
-10.0% "--------------
""'Most Ukely
15.0% t--.,....-s""to-cha,........,st:-IC-----....,......,.."'-
t ~Minlmumn10.0% t----::=-='-!.!.!!!.!.!.----.,~g.,fIC--
~p 5.0%
36
6. ANALYTIC CONCLUSIONS
The results of numerous model runs haveprovided useful information to AP leadership onwhere to focus limited resources. The value oftrained planners was reinforced. The impact ofcollaborative planning tools and the loss ofCFAST was quantified. The importance ofstreamlining planning processes and eliminatingwhite space was validated.
More importantly, decisions by senior leaders inchanging the requirement for the number ofplans or planning detail can now be quantified.Together, this analysis supports the APcommunity as they continue to update theirstrategic roadmap with various initiatives inassisting the planning community in the yearsahead.
7. SUMMARY
Military planning has been ongoing for centuries.Changes in the geo-political landscape, themobility of modern forces, and collaborationtechnologies have brought about changes in thespeed of government within the 000 as it relatesto military planning. AP initiatives have codifiedobjectives in changing the visibility, quantity, andfrequency of plan development within thehighest levels of government.
The AP Workload to Capacity study hasprovided a tool to assist decision makers on thebest use of limited resources in meeting theDepartments planning objectives. Reaching themost efficient balance of trained planners,collaboration technologies and policy decisionsthat affect planning processes forms thecornerstone in meeting planning timelineobjectives.
The field of modeling and simulation wasinstrumental in providing AP decision makersthe analysis and tools necessary to assist theJoint Planning and Execution Community.Future work by the Adaptive PlanningImplementation Team will leverage thefoundation of analysis brought about throughcomputer simulation.
REFERENCES
1. Rumsfeld, D. (2003) "Implementation ofAdaptive Planning", Secretary of DefenseMemorandum, Washington, DC.
2. Gates, R. (2008) "Implementation of APRoadmap II", Secretary of DefenseMemorandum, Washington, DC.
3. ExtendSim® (2008) Developed by ImagineThat, http://www.extendsim.com/.
4. Mullen, M. (2008) "CJCSI 3110.01G, JointStrategic Capabilities Plan FY208-2010 (S)",Washington DC.
5. Klein, R. (2007) "Adaptive Planning, NotYour Great Grandfather's Schlieffen Plan",JFQ, Issue 45, 2nd Quarter, 2007 pp. 84-88.
6. Sharp, W. (2007), "CJCSM 3122.03C, JointOperation Planning and Execution SystemVolume II", Washington, DC.
7. Collaborative Force Analysis, Sustainment,and Transportation (n.d.) Developed byDPRA,http://www.dpra.com/index.cfm/m/269.