Embed Size (px)
Citation preview
Adaptive Intelligent Combustion Control Based on Data-Driven Low-Order Models
Tongxun YiDomenic Santavicca
Penn State University
Presented at the 2009 NASA Propulsion Control and Diagnostics WorkshopCleveland Airport Marriott Hotel, Cleveland, Ohio
December 8 – 10, 2009
*NASA Award No: NNX07C98A
PENN STATE
Content
4. Flame Transfer Functions and Control Design Perspective
2. Fuel Modulation Techniques
1. Why Data-Driven Model-Based Combustion Control
NASA Award No: NNX07C98A
PENN STATE
3. Combustion Sensing Techniques
5. Conclusions and Suggested Future Work
6. Reference
1. Why Data-Driven Model-Based Combustion Control
NASA Award No: NNX07C98A
PENN STATE
Necessity of Advanced Combustion Control
NASA Award No: NNX07C98A
PENN STATE
For gas turbine combustors, the design strategies favoring different performance indices are usually not compatible. Combustion control adds extra freedom to improve and optimize overall performance. A typical example is developing control systems to enhance lean combustion stability so that the engines can operate in clean, safe, and stable manner.
Mixed control performance has been reported, including insufficient suppression of slightly-damped modes. These are the intrinsic deficiencies of phase-shift control principles.
Three adaptive phase-shift controllers (Gatech, UTRC, and Yi&Gutmark). The last one is capable of identifying the dominant frequency within one pressure cycle and a half, with an estimation error within 5 Hz, and is free of stability concerns
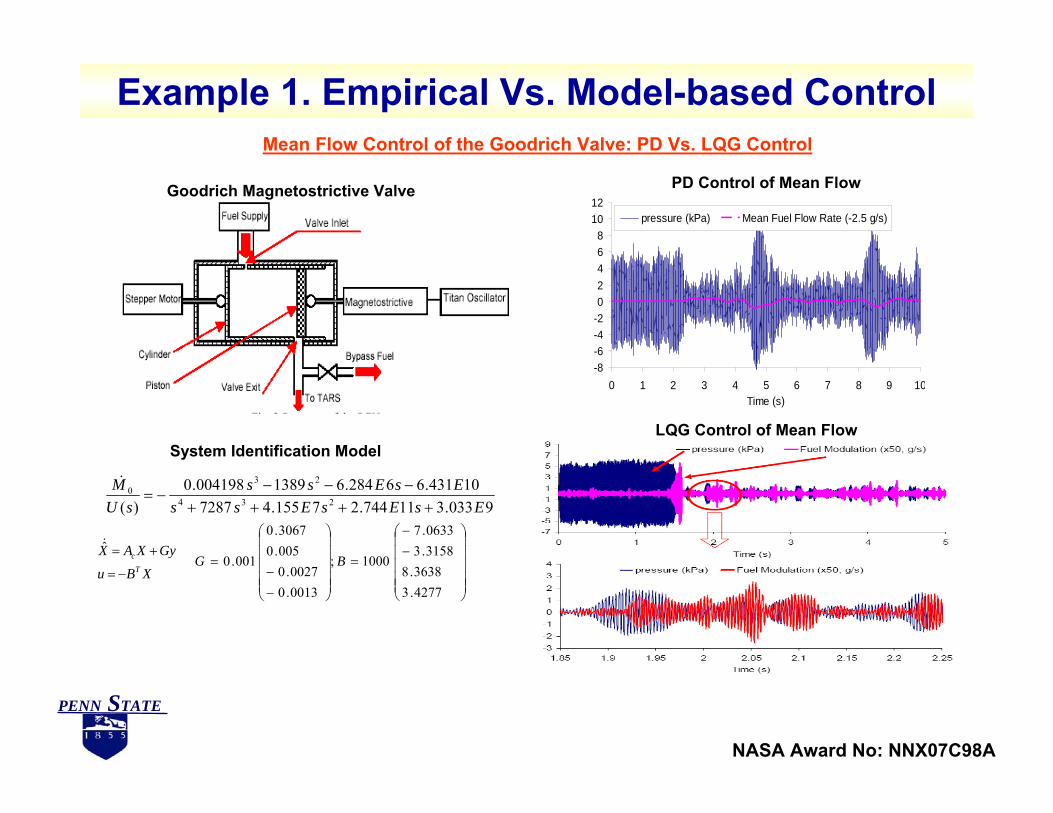
Model-based control design is a standard routine for control engineers and theorists. Data-driven models are in particular attractive and practical.
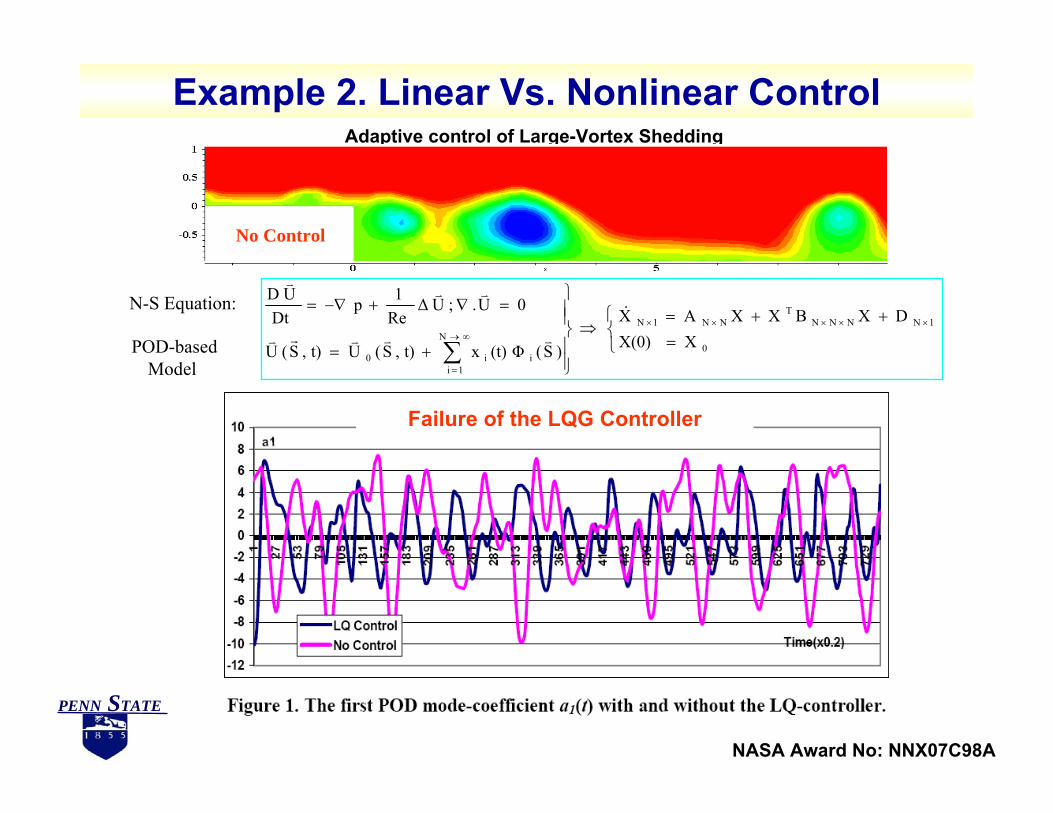
Enough evidence suggests that model-based controllers can easily outperform the empirical ones, and for highly nonlinear systems, a simple nonlinear controller can well outperform linear ones.
No knowledge can be certain if it is not based on mathematicsNo knowledge can be certain if it is not based on mathematics.(Leonardo da Vinci)
Example 1. Empirical Vs. Model-based Control
NASA Award No: NNX07C98A
PENN STATE
Mean Flow Control of the Goodrich Valve: PD Vs. LQG Control
Goodrich Magnetostrictive Valve
-8-6-4-202468
1012
0 1 2 3 4 5 6 7 8 9 10Time (s)
pressure (kPa) Mean Fuel Flow Rate (-2.5 g/s)
PD Control of Mean Flow
LQG Control of Mean Flow
9033.311744.27155.4728710431.66284.61389004198.0
)( 234
230
EsEsEssEsEss
sUM
++++−−−
−=&
XBu
GyXAXT
c
−=
+=&
⎟⎟⎟⎟⎟
⎠
⎞
⎜⎜⎜⎜⎜
⎝
⎛−−
=
⎟⎟⎟⎟⎟
⎠
⎞
⎜⎜⎜⎜⎜
⎝
⎛
−−
=
4277.33638.8
3158.30633.7
1000;
0013.00027.0
005.03067.0
001.0 BG
System Identification Model
Example 2. Linear Vs. Nonlinear Control
NASA Award No: NNX07C98A
PENN STATE
Adaptive control of Large-Vortex Shedding
No Control
N-S Equation:
POD-basedModel
⎩⎨⎧
=++=
⇒
⎪⎪⎭
⎪⎪⎬
⎫
+=
=∇+−∇=×××××
∞→
=∑ 0
1NNNNT
NN1NN
1iii0
XX(0)DXBXXAX
)S((t) Φxt),S(Ut),S(U
0U.;UΔRe1p
DtUD
&
vvvrv
vvv
Failure of the LQG Controller
Example 2. Linear Vs. Nonlinear Control (cont.)
NASA Award No: NNX07C98A
PENN STATE
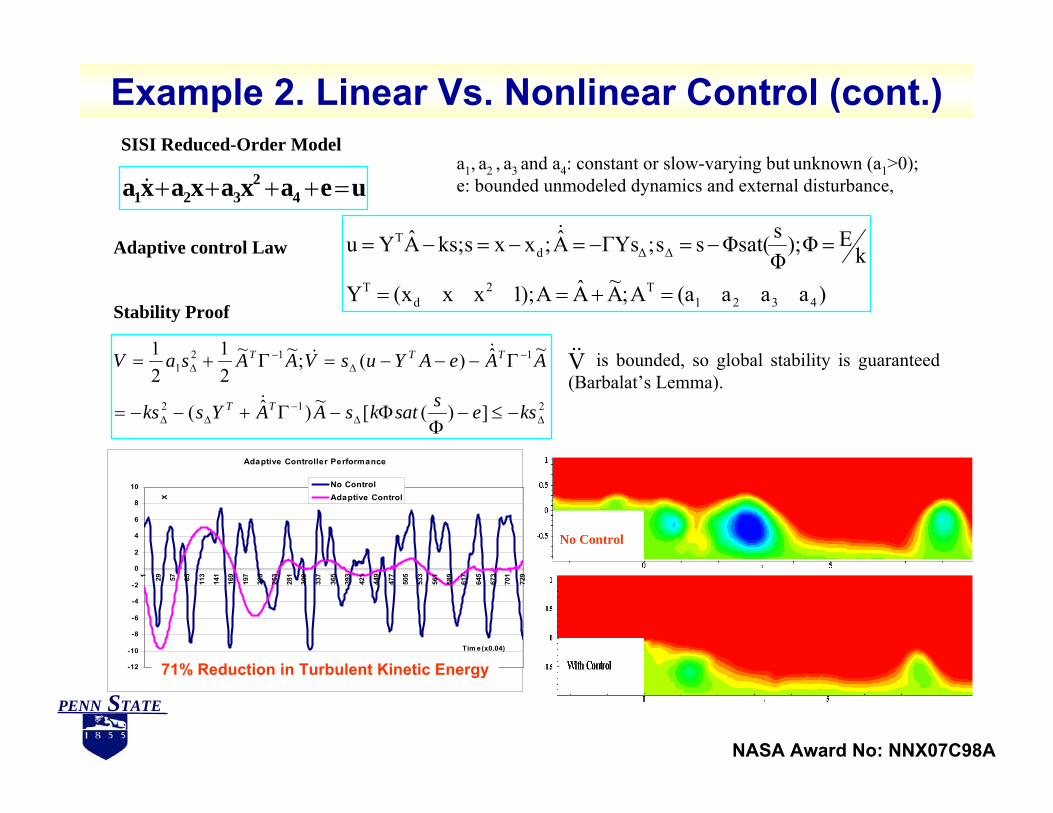
ueaxaxaxa 42
321 =++++&a1, a2 , a3 and a4: constant or slow-varying but unknown (a1>0); e: bounded unmodeled dynamics and external disturbance,
SISI Reduced-Order Model
Adaptive control Law
)aaaa(A;A~AA);1xxx(Y
kEΦ);
ΦsΦsat(ss;ΓYsA;xxsks;AYu
4321T2
dT
ΔΔdT
=+==
=−=−=−=−= &
212
1121
])([~)ˆ(
~ˆ)(;~~21
21
ΔΔ−
ΔΔ
−Δ
−Δ
−≤−Φ
Φ−Γ+−−=
Γ−−−=Γ+=
ksessatksAAYsks
AAeAYusVAAsaV
TT
TTT
&
&& is bounded, so global stability is guaranteed (Barbalat’s Lemma). V&&
Stability Proof
No Control
Adaptive Controller Performance
-12
-10
-8
-6
-4
-2
0
2
4
6
8
10
1 29 57 85 113
141
169
197
225
253
281
309
337
365
393
421
449
477
505
533
561
589
617
645
673
701
729
Tim e(x0.04)
X
No ControlAdaptive Control
71% Reduction in Turbulent Kinetic Energy
2. Fuel Modulation Techniques
NASA Award No: NNX07C98A
PENN STATE
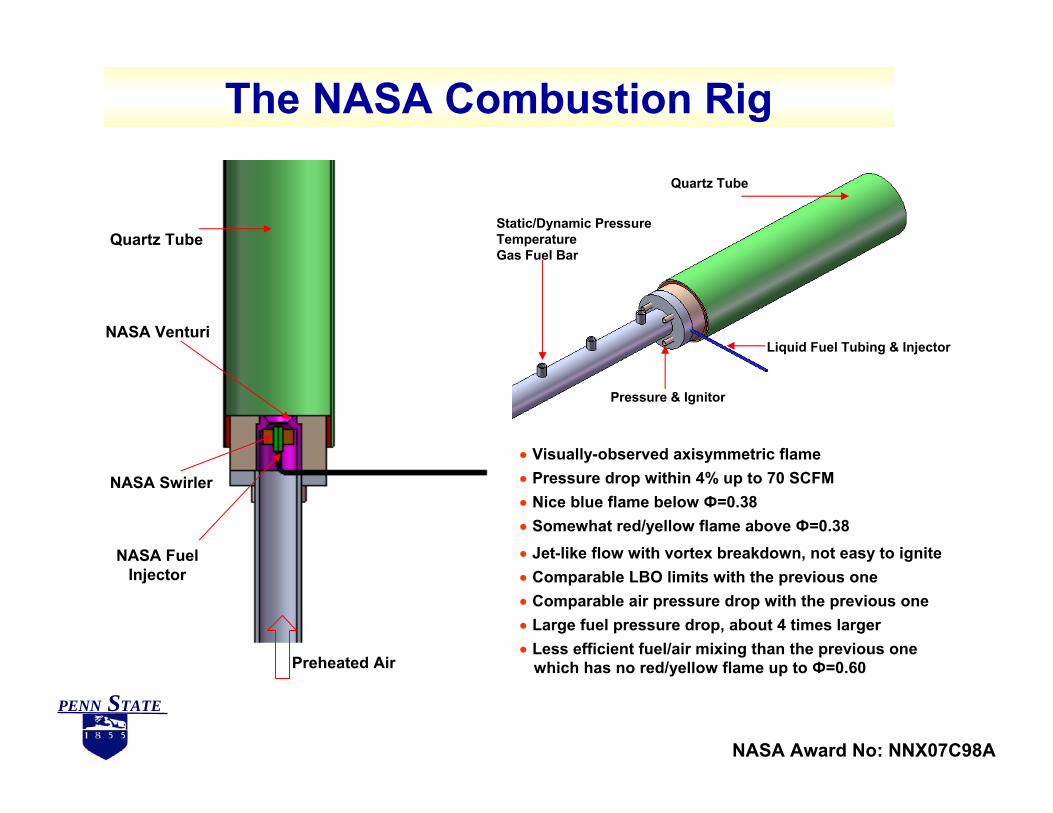
The NASA Combustion Rig
Static/Dynamic PressureTemperatureGas Fuel Bar
Quartz Tube
Liquid Fuel Tubing & Injector
Pressure & Ignitor
Preheated Air
NASA Venturi
NASA Swirler
NASA FuelInjector
Quartz Tube
• Visually-observed axisymmetric flame• Pressure drop within 4% up to 70 SCFM• Nice blue flame below Ф=0.38• Somewhat red/yellow flame above Ф=0.38
• Large fuel pressure drop, about 4 times larger
• Jet-like flow with vortex breakdown, not easy to ignite• Comparable LBO limits with the previous one• Comparable air pressure drop with the previous one
• Less efficient fuel/air mixing than the previous one which has no red/yellow flame up to Ф=0.60
NASA Award No: NNX07C98A
PENN STATE
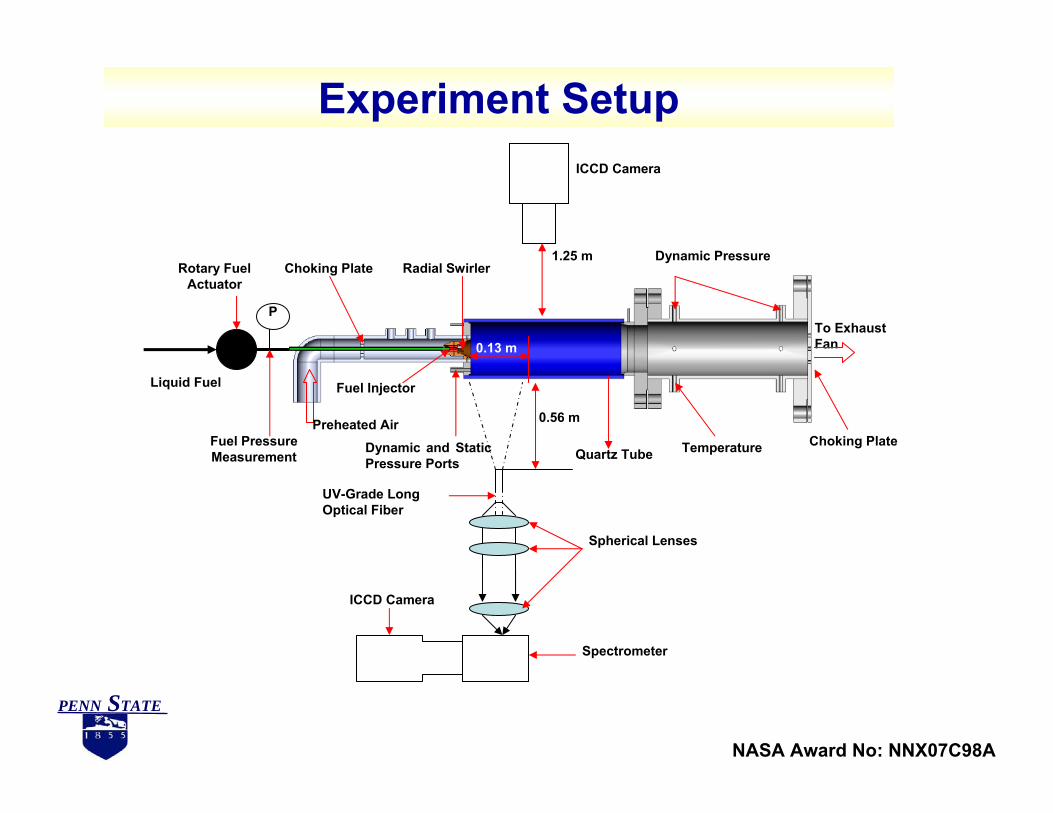
Experiment Setup
NASA Award No: NNX07C98A
PENN STATE
To Exhaust Fan
0.36 m
0.15 m
Dynamic and Static Pressure Ports
ICCD Camera
1.25 m
Choking PlateTemperature
0.46 m
Radial Swirler
Fuel Injector
Choking PlateDynamic Pressure
0.13 m
Preheated Air
Liquid Fuel
Rotary Fuel Actuator
P
Fuel Pressure Measurement
ICCD Camera
Spectrometer
UV-Grade Long Optical Fiber
Spherical Lenses
Quartz Tube
0.56 m
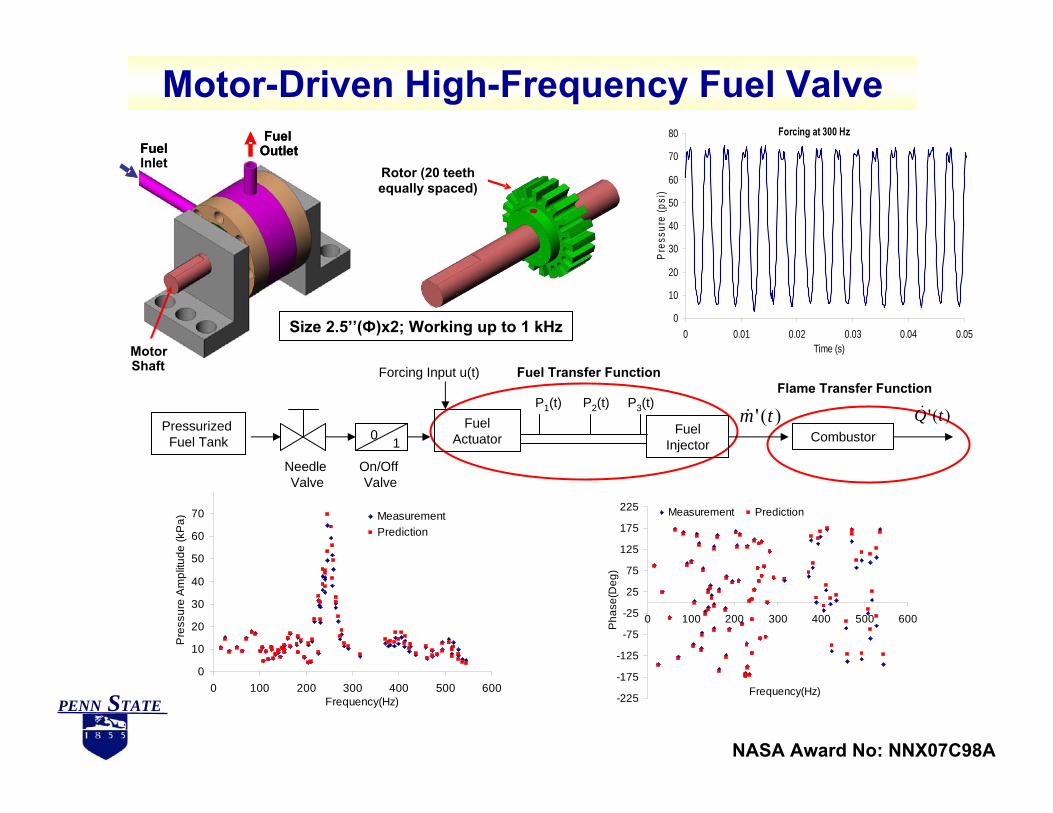
Motor-Driven High-Frequency Fuel ValveFuel
OutletFuel Inlet
Motor Shaft
Fuel OutletFuel
Inlet
Motor Shaft
Rotor (20 teeth equally spaced)Rotor (20 teeth equally spaced)
Forcing at 300 Hz
0
10
20
30
40
50
60
70
80
0 0.01 0.02 0.03 0.04 0.05Time (s)
Pre
ssur
e (p
si)
NASA Award No: NNX07C98A
PENN STATE
Fuel Transfer FunctionFlame Transfer Function
Pressurized Fuel Tank 0 1
Fuel Actuator
P1(t) P2(t)
Fuel Injector Combustor
Forcing Input u(t)
)(' tm& )(' tQ&P3(t)
Needle Valve
On/Off Valve
0
10
20
30
40
50
60
70
0 100 200 300 400 500 600Frequency(Hz)
Pre
ssur
e A
mpl
itude
(kP
a) MeasurementPrediction
-225
-175
-125
-75
-25
25
75
125
175
225
0 100 200 300 400 500 600
Frequency(Hz)
Pha
se(D
eg)
Measurement Prediction
Size 2.5’’(Ф)x2; Working up to 1 kHz
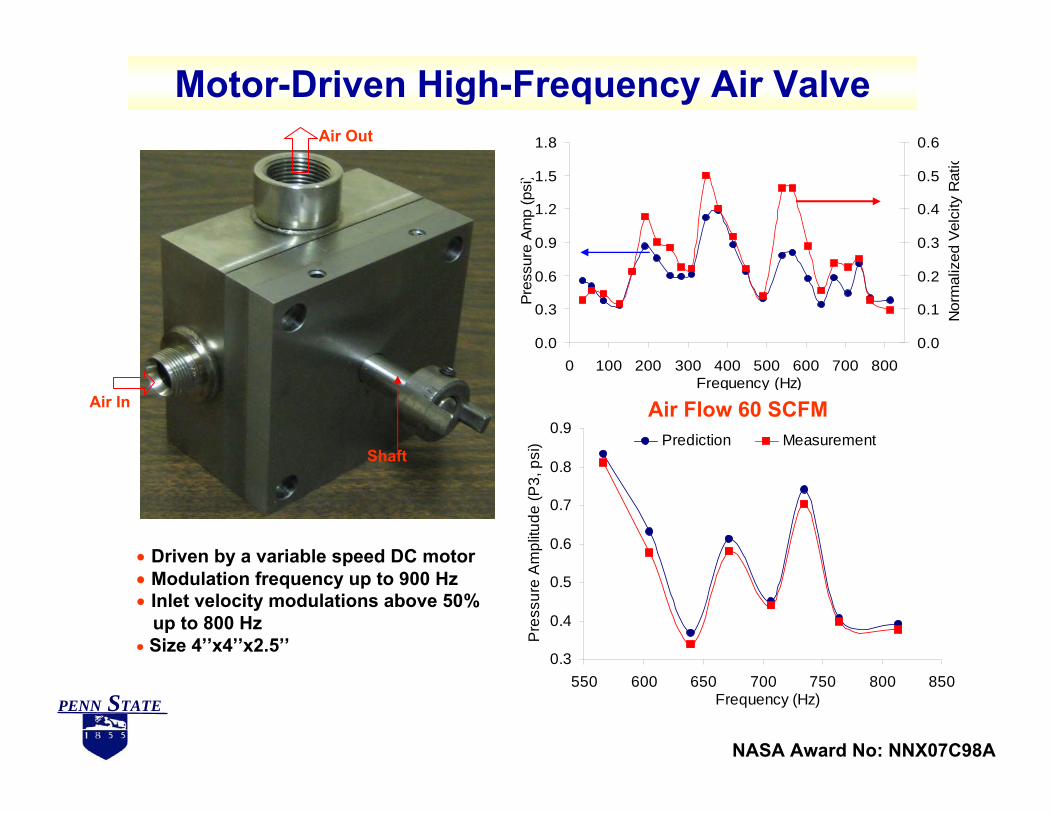
Motor-Driven High-Frequency Air Valve
NASA Award No: NNX07C98A
PENN STATE
Shaft
Air In
Air Out
• Driven by a variable speed DC motor• Modulation frequency up to 900 Hz• Inlet velocity modulations above 50%
up to 800 Hz• Size 4’’x4’’x2.5’’
0.0
0.3
0.6
0.9
1.2
1.5
1.8
0 100 200 300 400 500 600 700 800Frequency (Hz)
Pre
ssur
e A
mp
(psi
)
0.0
0.1
0.2
0.3
0.4
0.5
0.6
Nor
mal
ized
Vel
city
Rat
io
0.3
0.4
0.5
0.6
0.7
0.8
0.9
550 600 650 700 750 800 850Frequency (Hz)
Pre
ssur
e A
mpl
itude
(P3,
psi
) Prediction Measurement
Air Flow 60 SCFM
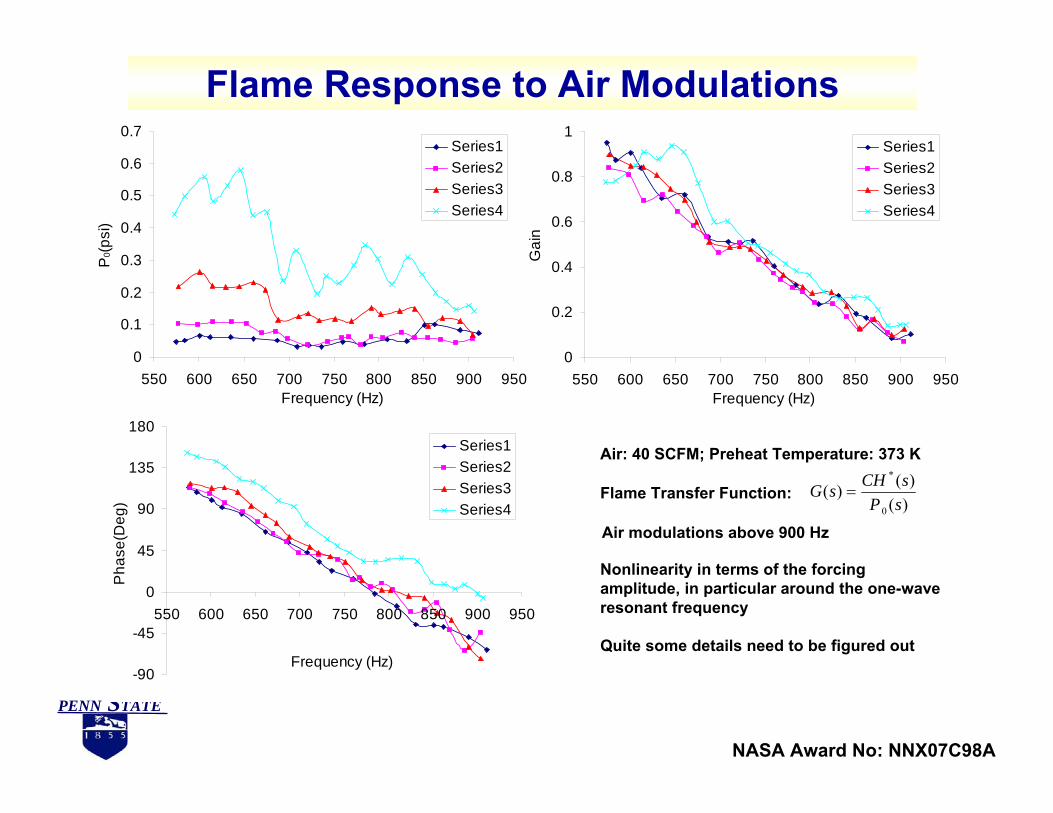
Flame Response to Air Modulations
NASA Award No: NNX07C98A
PENN STATE
0
0.2
0.4
0.6
0.8
1
550 600 650 700 750 800 850 900 950Frequency (Hz)
Gai
n
Series1Series2Series3Series4
0
0.1
0.2
0.3
0.4
0.5
0.6
0.7
550 600 650 700 750 800 850 900 950Frequency (Hz)
P0(p
si)
Series1Series2Series3Series4
-90
-45
0
45
90
135
180
550 600 650 700 750 800 850 900 950
Frequency (Hz)
Pha
se(D
eg)
Series1Series2Series3Series4
Air: 40 SCFM; Preheat Temperature: 373 K
)()()(
0
*
sPsCHsG =Flame Transfer Function:
Air modulations above 900 Hz
Nonlinearity in terms of the forcing amplitude, in particular around the one-wave resonant frequency
Quite some details need to be figured out
3. Combustion Sensing Techniques
NASA Award No: NNX07C98A
PENN STATE
Background of Combustion Sensing
• The instantaneous heat release rate and equivalence ratios are two key parameters for combustion analysis and control. Chemiluminescence-based sensors are practical solutions.
• For premixed gas-fueled combustion, linearity between chemiluminescence yield and heat release is valid for slightly turbulent or wrinkled flamelet region. But in the corrugated and broken flameletregion, nonlinearity cannot be ignored.
• In combustion instability analysis, it is usually assumed that chemilumienscence is proportional to the instantaneous heat release rate, which in fact, suffers from several major deficiencies.
NASA Award No: NNX07C98A
PENN STATE
• Reported is an accurate correlation-function-based method for real-time combustion sensing, based on chemiluminescence measurements using PMTs. For the first time in combustion literature, the nonlinearity among heat release, chemiluminescence, equivalence ratios, and acoustics effects is taken into account
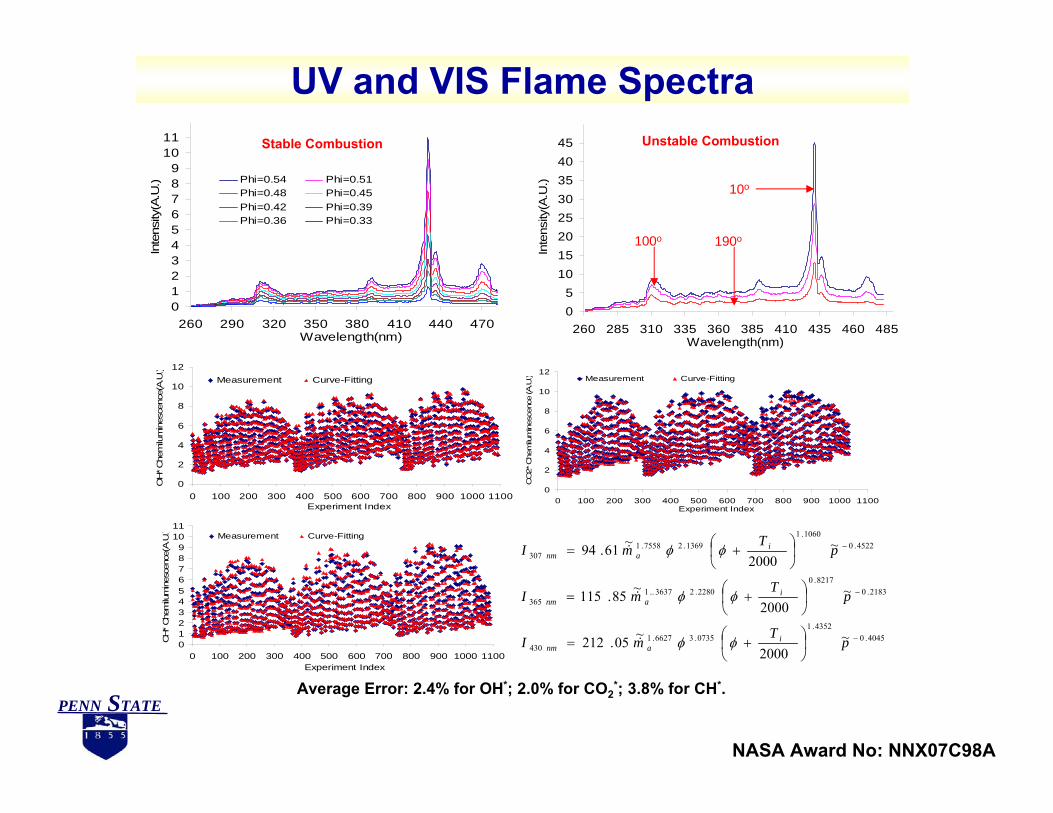
UV and VIS Flame Spectra
0123456789
1011
260 290 320 350 380 410 440 470Wavelength(nm)
Inte
nsity
(A.U
.) Phi=0.54 Phi=0.51Phi=0.48 Phi=0.45Phi=0.42 Phi=0.39Phi=0.36 Phi=0.33
05
1015202530354045
260 285 310 335 360 385 410 435 460 485Wavelength(nm)
Inte
nsity
(A.U
.)
Stable Combustion Unstable Combustion
10o
100o 190o
NASA Award No: NNX07C98A
PENN STATE
0
2
4
6
8
10
12
0 100 200 300 400 500 600 700 800 900 1000 1100Experiment Index
OH
* Che
milu
min
esce
nce(
A.U
.)
Measurement Curve-Fitting
0
2
4
6
8
10
12
0 100 200 300 400 500 600 700 800 900 1000 1100Experiment Index
CO
2* C
hem
ilum
ines
cenc
e (A
.U.) Measurement Curve-Fitting
0123456789
1011
0 100 200 300 400 500 600 700 800 900 1000 1100Experiment Index
CH* Che
milu
min
esce
nce(
A.U.) Measurement Curve-Fitting
4045.04352.1
0735.36627.1430
2183.08217.0
2280.23637..1365
4522.01060.1
1369.27558.1307
~2000
~05.212
~2000
~85.115
~2000
~61.94
−
−
−
⎟⎠⎞
⎜⎝⎛ +=
⎟⎠⎞
⎜⎝⎛ +=
⎟⎠⎞
⎜⎝⎛ +=
pT
mI
pT
mI
pT
mI
ianm
ianm
ianm
φφ
φφ
φφ
&
&
&
Average Error: 2.4% for OH*; 2.0% for CO2*; 3.8% for CH*.
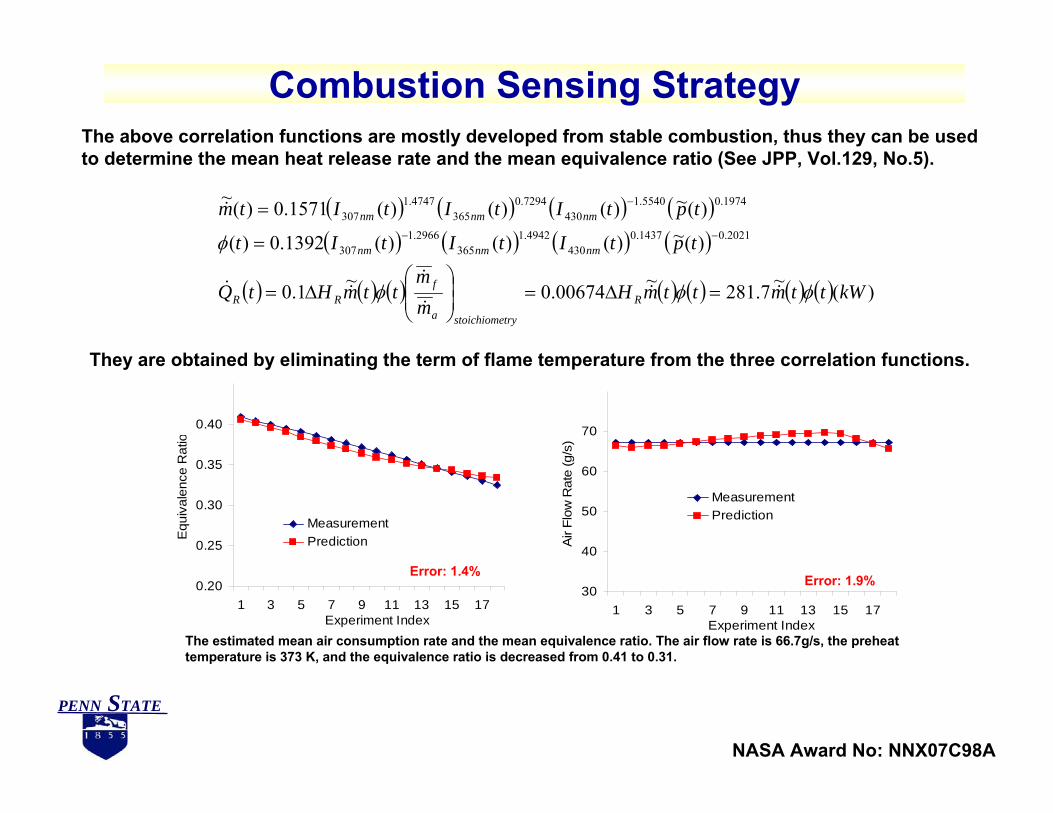
Combustion Sensing StrategyThe above correlation functions are mostly developed from stable combustion, thus they can be used to determine the mean heat release rate and the mean equivalence ratio (See JPP, Vol.129, No.5).
( ) ( ) ( ) ( )( ) ( ) ( ) ( )
( ) ( ) ( ) ( ) ( ) ( ) ( ) )(~7.281~00674.0~1.0
)(~)()()(1392.0)(
)(~)()()(1571.0)(~
2021.01437.0430
4942.1365
2966.1307
1974.05540.1430
7294.0365
4747.1307
kWttmttmHmm
ttmHtQ
tptItItIt
tptItItItm
R
trystoichiomea
fRR
nmnmnm
nmnmnm
φφφ
φ
&&&
&&&
&
=Δ=⎟⎟⎠
⎞⎜⎜⎝
⎛Δ=
=
=−−
−
They are obtained by eliminating the term of flame temperature from the three correlation functions.
NASA Award No: NNX07C98A
PENN STATE
The estimated mean air consumption rate and the mean equivalence ratio. The air flow rate is 66.7g/s, the preheat temperature is 373 K, and the equivalence ratio is decreased from 0.41 to 0.31.
0.20
0.25
0.30
0.35
0.40
1 3 5 7 9 11 13 15 17Experiment Index
Equ
ival
ence
Rat
io
MeasurementPrediction
Error: 1.4%30
40
50
60
70
1 3 5 7 9 11 13 15 17Experiment Index
Air
Flow
Rat
e (g
/s)
MeasurementPrediction
Error: 1.9%
Combustion Sensing Strategy (Cont.)
NASA Award No: NNX07C98A
PENN STATE
0
1
2
3
4
5
6
7
8
0 0.005 0.01 0.015 0.02 0.025Time(s)
CO2*(A.U.) CH*(A.U.)OH*(A.U.) Combustor Pressure(x0.1, kPa)
(a)0
1
2
3
4
5
6
7
0 0.005 0.01 0.015 0.02 0.025Time(s)
CH*(A.U.) Combustor Pressure(x0.1, kPa)Estimated Air Consumptiion Rate(x0.05,g/s) Estimated Equivalence Ratio(x10)Estimated Heat Release(x0.05, kW)
(b)
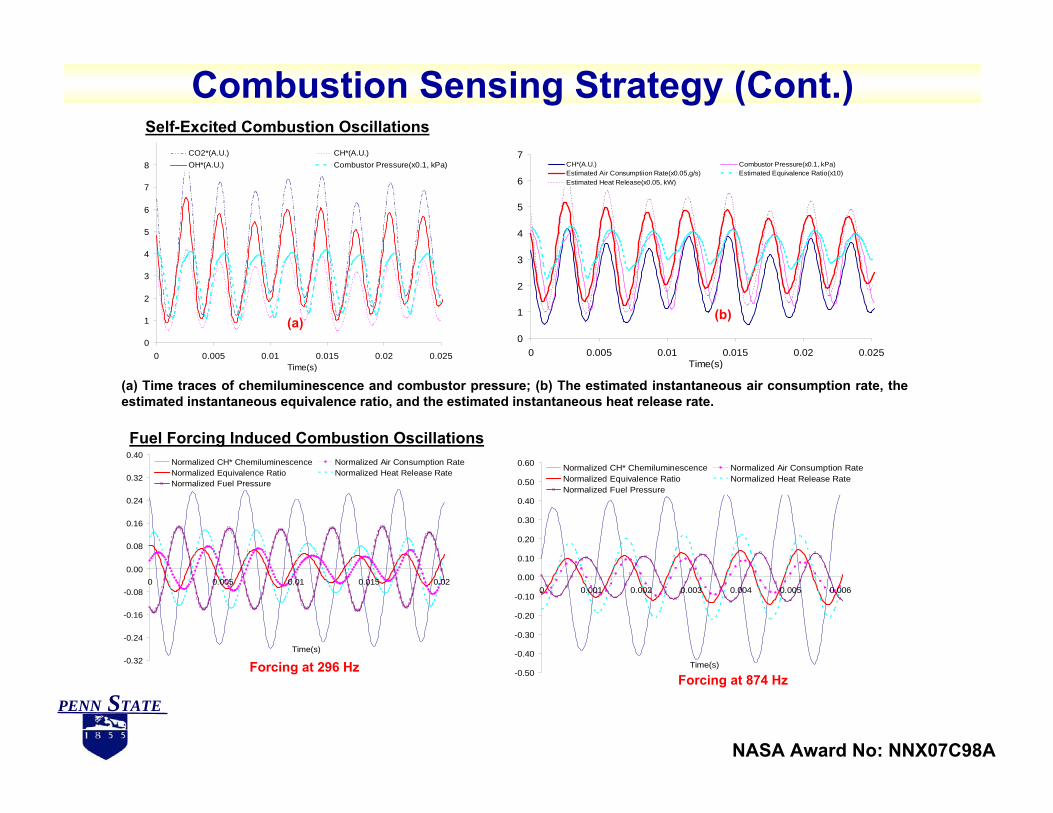
(a) Time traces of chemiluminescence and combustor pressure; (b) The estimated instantaneous air consumption rate, the estimated instantaneous equivalence ratio, and the estimated instantaneous heat release rate.
Self-Excited Combustion Oscillations
-0.32
-0.24
-0.16
-0.08
0.00
0.08
0.16
0.24
0.32
0.40
0 0.005 0.01 0.015 0.02
Time(s)
Normalized CH* Chemiluminescence Normalized Air Consumption RateNormalized Equivalence Ratio Normalized Heat Release RateNormalized Fuel Pressure
Forcing at 296 Hz -0.50
-0.40
-0.30
-0.20
-0.10
0.00
0.10
0.20
0.30
0.40
0.50
0.60
0 0.001 0.002 0.003 0.004 0.005 0.006
Time(s)
Normalized CH* Chemiluminescence Normalized Air Consumption RateNormalized Equivalence Ratio Normalized Heat Release RateNormalized Fuel Pressure
Forcing at 874 Hz
Fuel Forcing Induced Combustion Oscillations
4. Flame Transfer Functions and Control Design Perspective
NASA Award No: NNX07C98A
PENN STATE
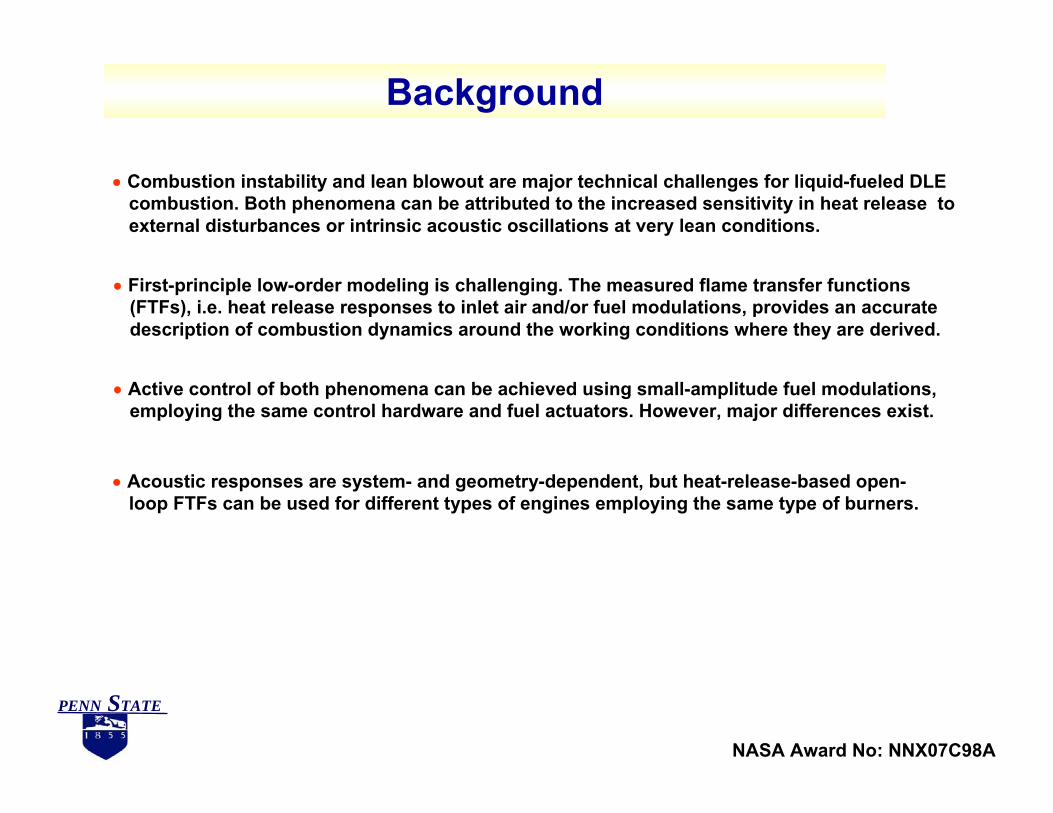
Background
• Combustion instability and lean blowout are major technical challenges for liquid-fueled DLE combustion. Both phenomena can be attributed to the increased sensitivity in heat release to external disturbances or intrinsic acoustic oscillations at very lean conditions.
• Active control of both phenomena can be achieved using small-amplitude fuel modulations, employing the same control hardware and fuel actuators. However, major differences exist.
• First-principle low-order modeling is challenging. The measured flame transfer functions (FTFs), i.e. heat release responses to inlet air and/or fuel modulations, provides an accurate description of combustion dynamics around the working conditions where they are derived.
• Acoustic responses are system- and geometry-dependent, but heat-release-based open-loop FTFs can be used for different types of engines employing the same type of burners.
NASA Award No: NNX07C98A
PENN STATE
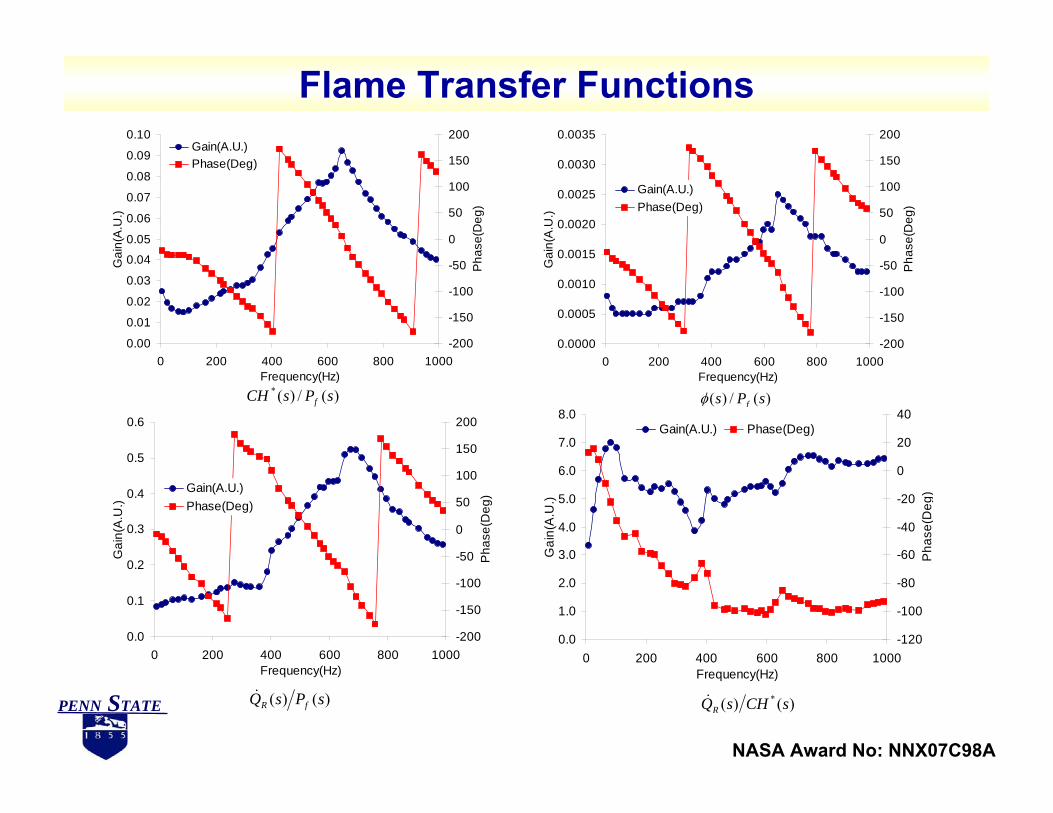
Flame Transfer Functions
0.00
0.01
0.02
0.03
0.04
0.05
0.06
0.07
0.08
0.09
0.10
0 200 400 600 800 1000Frequency(Hz)
Gai
n(A
.U.)
-200
-150
-100
-50
0
50
100
150
200
Pha
se(D
eg)
Gain(A.U.)Phase(Deg)
)(/)(* sPsCH f
0.0000
0.0005
0.0010
0.0015
0.0020
0.0025
0.0030
0.0035
0 200 400 600 800 1000Frequency(Hz)
Gai
n(A
.U.)
-200
-150
-100
-50
0
50
100
150
200
Pha
se(D
eg)
Gain(A.U.)Phase(Deg)
)(/)( sPs fφ
0.0
0.1
0.2
0.3
0.4
0.5
0.6
0 200 400 600 800 1000Frequency(Hz)
Gai
n(A
.U.)
-200
-150
-100
-50
0
50
100
150
200
Pha
se(D
eg)Gain(A.U.)
Phase(Deg)
)()( sPsQ fR&
0.0
1.0
2.0
3.0
4.0
5.0
6.0
7.0
8.0
0 200 400 600 800 1000Frequency(Hz)
Gai
n(A
.U.)
-120
-100
-80
-60
-40
-20
0
20
40
Pha
se(D
eg)
Gain(A.U.) Phase(Deg)
)()( * sCHsQR&
NASA Award No: NNX07C98A
PENN STATE
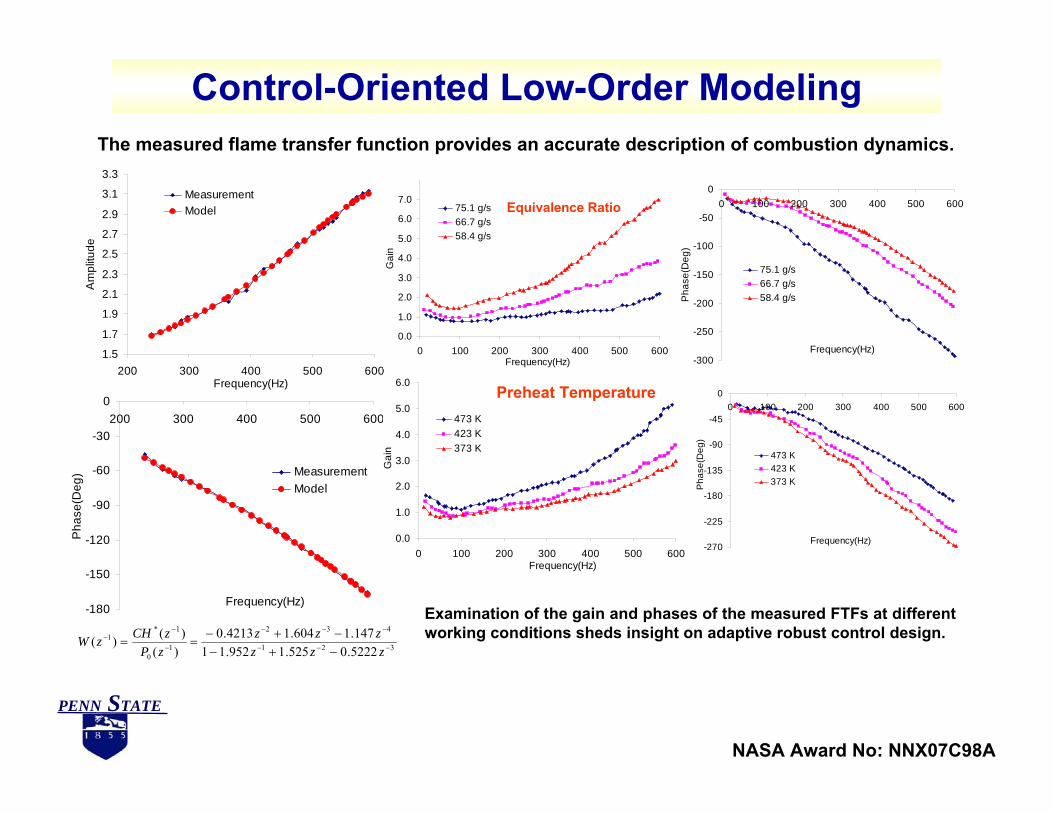
Control-Oriented Low-Order ModelingThe measured flame transfer function provides an accurate description of combustion dynamics.
1.5
1.7
1.9
2.1
2.3
2.5
2.7
2.9
3.1
3.3
200 300 400 500 600Frequency(Hz)
Am
plitu
de
MeasurementModel
-180
-150
-120
-90
-60
-30
0200 300 400 500 600
Frequency(Hz)
Pha
se(D
eg) Measurement
Model
321
432
10
1*1
5222.0525.1952.11147.1604.14213.0
)()()( −−−
−−−
−
−−
−+−−+−
==zzzzzz
zPzCHzW
0.0
1.0
2.0
3.0
4.0
5.0
6.0
7.0
0 100 200 300 400 500 600Frequency(Hz)
Gai
n
75.1 g/s66.7 g/s58.4 g/s
-300
-250
-200
-150
-100
-50
00 100 200 300 400 500 600
Frequency(Hz)
Pha
se(D
eg)
75.1 g/s66.7 g/s58.4 g/s
Equivalence Ratio
0.0
1.0
2.0
3.0
4.0
5.0
6.0
0 100 200 300 400 500 600Frequency(Hz)
Gai
n
473 K423 K373 K
-270
-225
-180
-135
-90
-45
00 100 200 300 400 500 600
Frequency(Hz)
Pha
se(D
eg)
473 K423 K373 K
Preheat Temperature
Examination of the gain and phases of the measured FTFs at different working conditions sheds insight on adaptive robust control design.
NASA Award No: NNX07C98A
PENN STATE
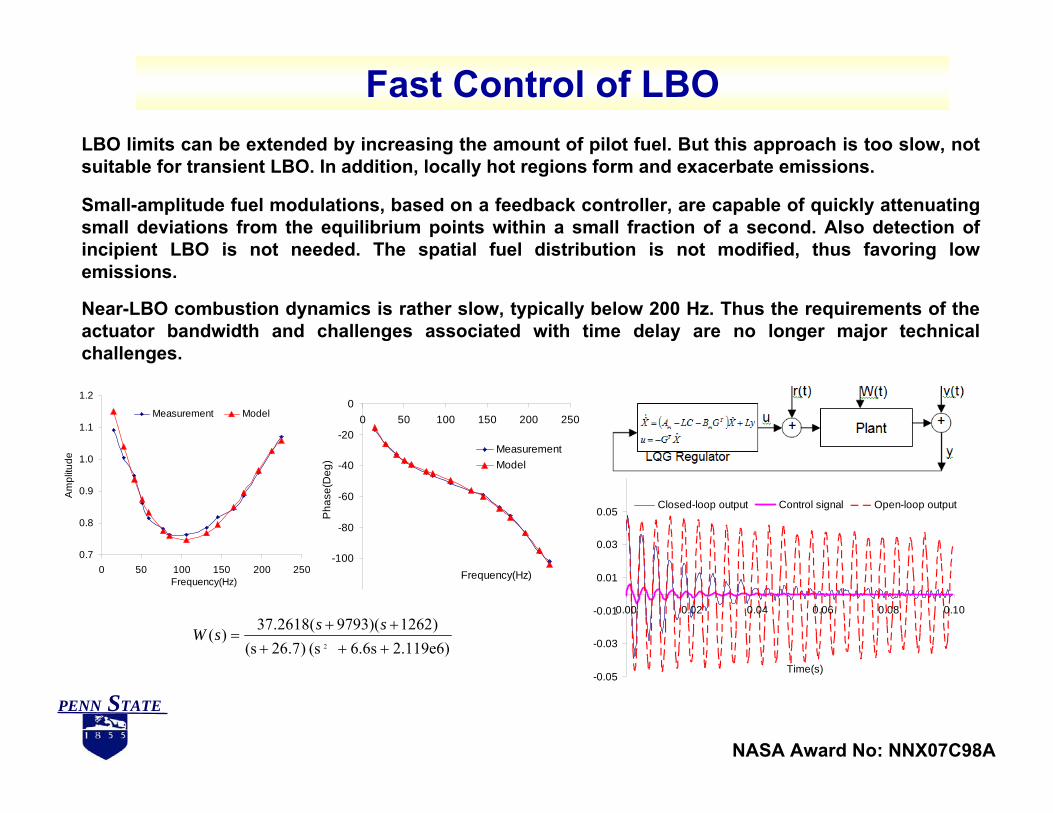
Fast Control of LBOLBO limits can be extended by increasing the amount of pilot fuel. But this approach is too slow, not suitable for transient LBO. In addition, locally hot regions form and exacerbate emissions.
Small-amplitude fuel modulations, based on a feedback controller, are capable of quickly attenuating small deviations from the equilibrium points within a small fraction of a second. Also detection of incipient LBO is not needed. The spatial fuel distribution is not modified, thus favoring low emissions.
Near-LBO combustion dynamics is rather slow, typically below 200 Hz. Thus the requirements of the actuator bandwidth and challenges associated with time delay are no longer major technical challenges.
0.7
0.8
0.9
1.0
1.1
1.2
0 50 100 150 200 250Frequency(Hz)
Am
plitu
de
Measurement Model
-100
-80
-60
-40
-20
00 50 100 150 200 250
Frequency(Hz)
Pha
se(D
eg)
MeasurementModel
2.119e6) 6.6s (s )7.26(s)1262)(9793(2618.37)(
2 +++++
=sssW
-0.05
-0.03
-0.01
0.01
0.03
0.05
0.00 0.02 0.04 0.06 0.08 0.10
Time(s)
Closed-loop output Control signal Open-loop output
NASA Award No: NNX07C98A
PENN STATE
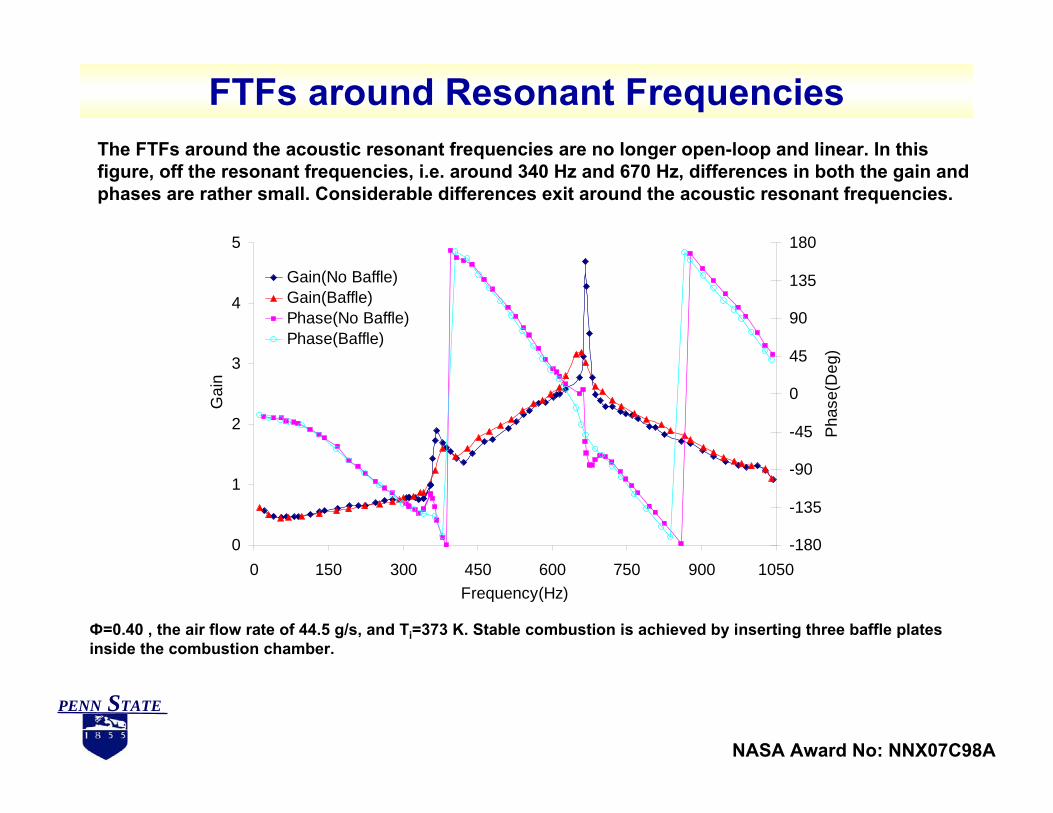
FTFs around Resonant Frequencies
0
1
2
3
4
5
0 150 300 450 600 750 900 1050Frequency(Hz)
Gai
n
-180
-135
-90
-45
0
45
90
135
180
Phas
e(D
eg)
Gain(No Baffle)Gain(Baffle)Phase(No Baffle)Phase(Baffle)
Ф=0.40 , the air flow rate of 44.5 g/s, and Ti=373 K. Stable combustion is achieved by inserting three baffle plates inside the combustion chamber.
The FTFs around the acoustic resonant frequencies are no longer open-loop and linear. In this figure, off the resonant frequencies, i.e. around 340 Hz and 670 Hz, differences in both the gain and phases are rather small. Considerable differences exit around the acoustic resonant frequencies.
NASA Award No: NNX07C98A
PENN STATE
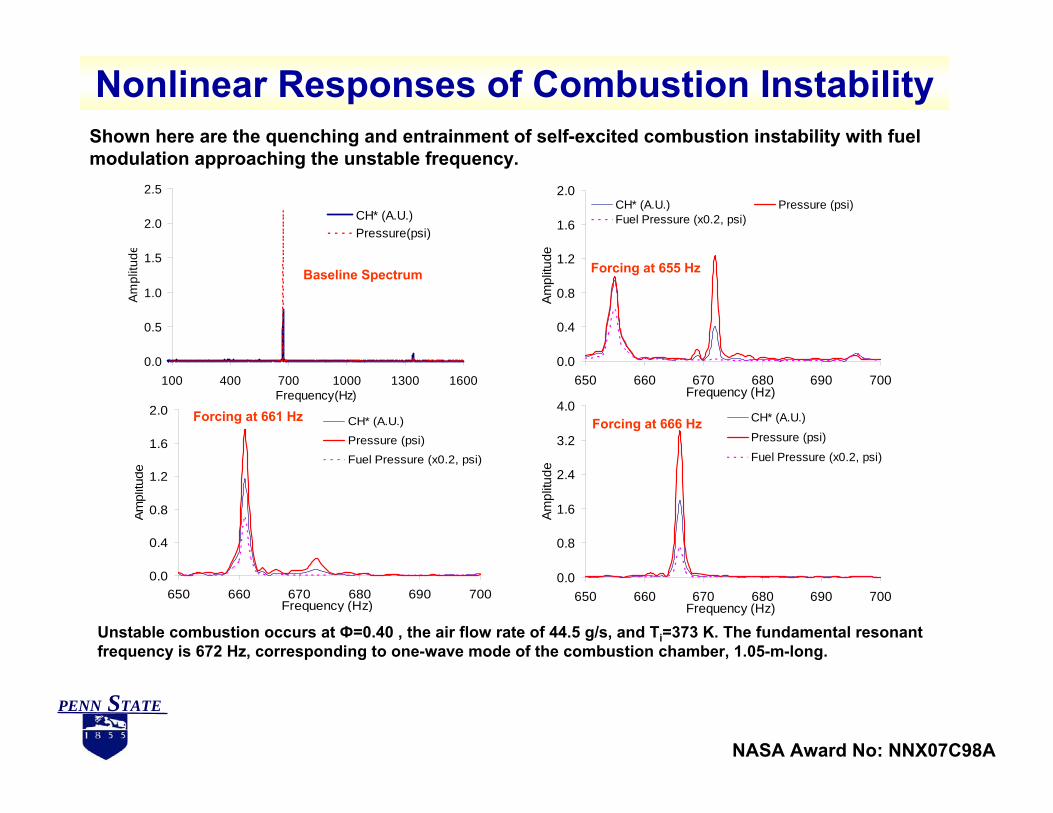
Nonlinear Responses of Combustion InstabilityShown here are the quenching and entrainment of self-excited combustion instability with fuel modulation approaching the unstable frequency.
Unstable combustion occurs at Ф=0.40 , the air flow rate of 44.5 g/s, and Ti=373 K. The fundamental resonant frequency is 672 Hz, corresponding to one-wave mode of the combustion chamber, 1.05-m-long.
0.0
0.4
0.8
1.2
1.6
2.0
650 660 670 680 690 700Frequency (Hz)
Ampl
itude
CH* (A.U.) Pressure (psi)Fuel Pressure (x0.2, psi)
Forcing at 655 Hz
0.0
0.4
0.8
1.2
1.6
2.0
650 660 670 680 690 700Frequency (Hz)
Ampl
itude
CH* (A.U.)
Pressure (psi)
Fuel Pressure (x0.2, psi)
Forcing at 661 Hz
0.0
0.8
1.6
2.4
3.2
4.0
650 660 670 680 690 700Frequency (Hz)
Ampl
itude
CH* (A.U.)
Pressure (psi)
Fuel Pressure (x0.2, psi)
Forcing at 666 Hz
0.0
0.5
1.0
1.5
2.0
2.5
100 400 700 1000 1300 1600Frequency(Hz)
Am
plitu
de
CH* (A.U.)Pressure(psi)
Baseline Spectrum
NASA Award No: NNX07C98A
PENN STATE
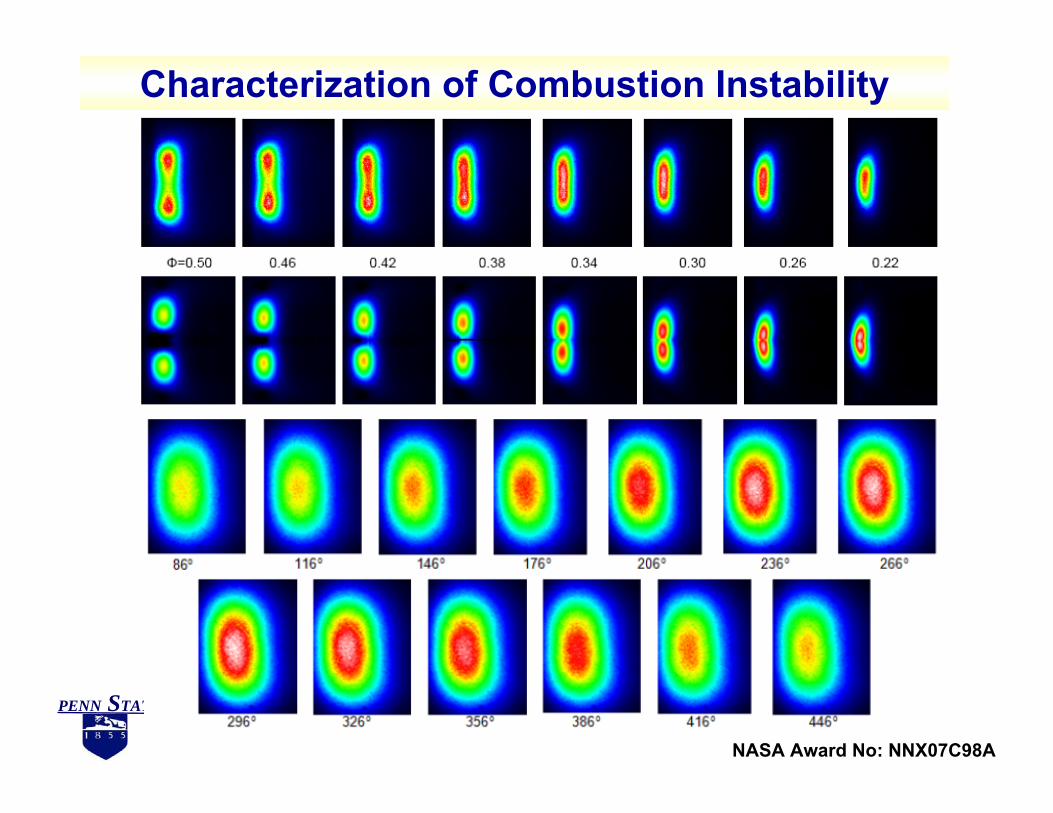
Characterization of Combustion Instability
NASA Award No: NNX07C98A
PENN STATE
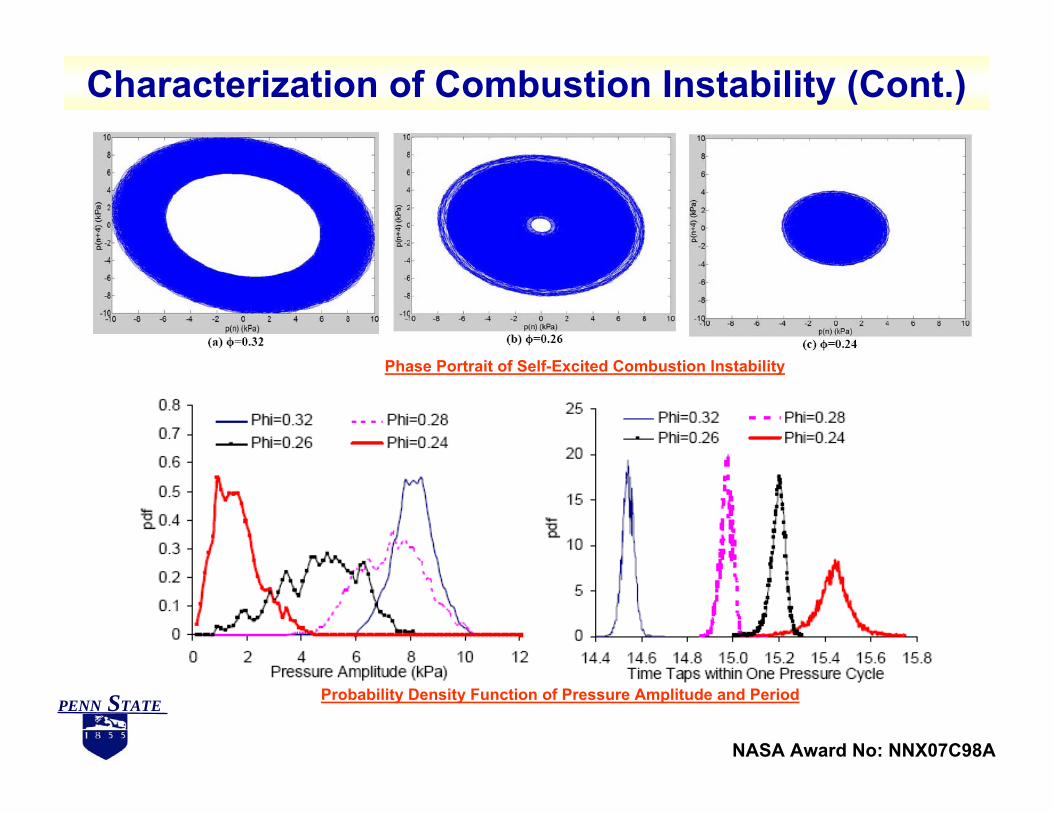
Characterization of Combustion Instability (Cont.)
NASA Award No: NNX07C98A
PENN STATE
Phase Portrait of Self-Excited Combustion Instability
Probability Density Function of Pressure Amplitude and Period
5. Conclusions and Suggested Future Work
NASA Award No: NNX07C98A
PENN STATE
Conclusions
NASA Award No: NNX07C98A
PENN STATE
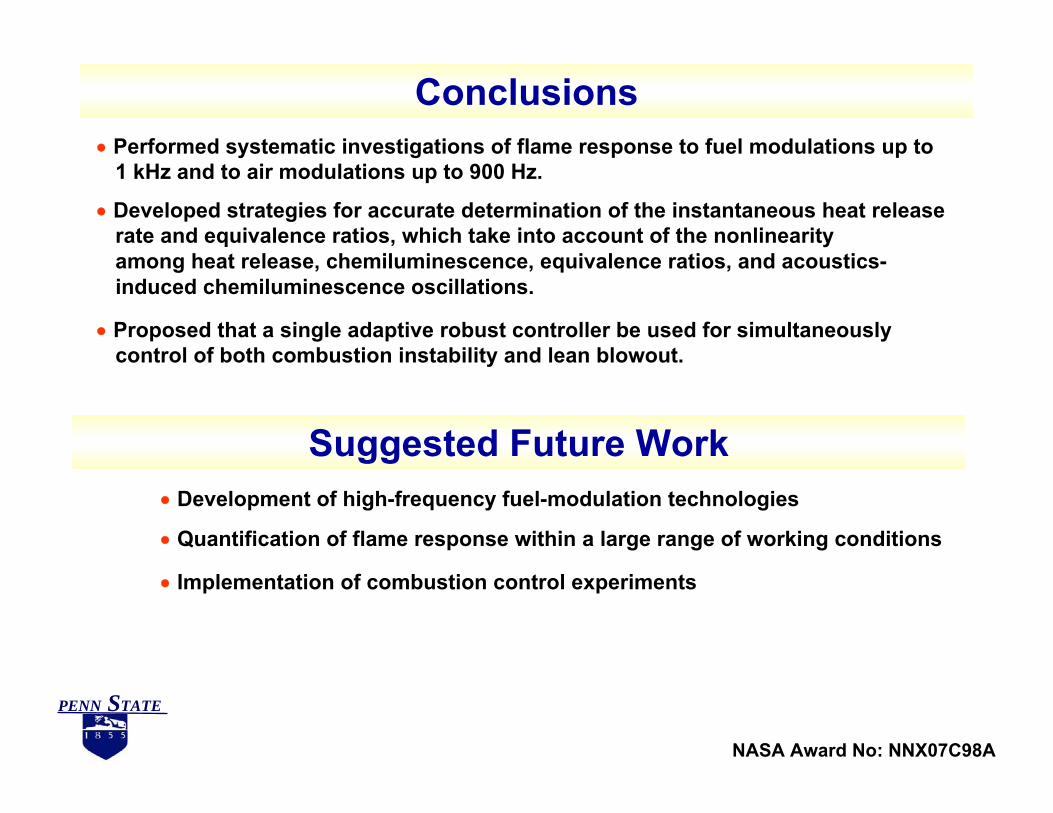
• Performed systematic investigations of flame response to fuel modulations up to 1 kHz and to air modulations up to 900 Hz.
• Developed strategies for accurate determination of the instantaneous heat release rate and equivalence ratios, which take into account of the nonlinearity among heat release, chemiluminescence, equivalence ratios, and acoustics-induced chemiluminescence oscillations.
• Proposed that a single adaptive robust controller be used for simultaneously control of both combustion instability and lean blowout.
Suggested Future Work• Development of high-frequency fuel-modulation technologies
• Quantification of flame response within a large range of working conditions
• Implementation of combustion control experiments
Reference
NASA Award No: NNX07C98A
PENN STATE
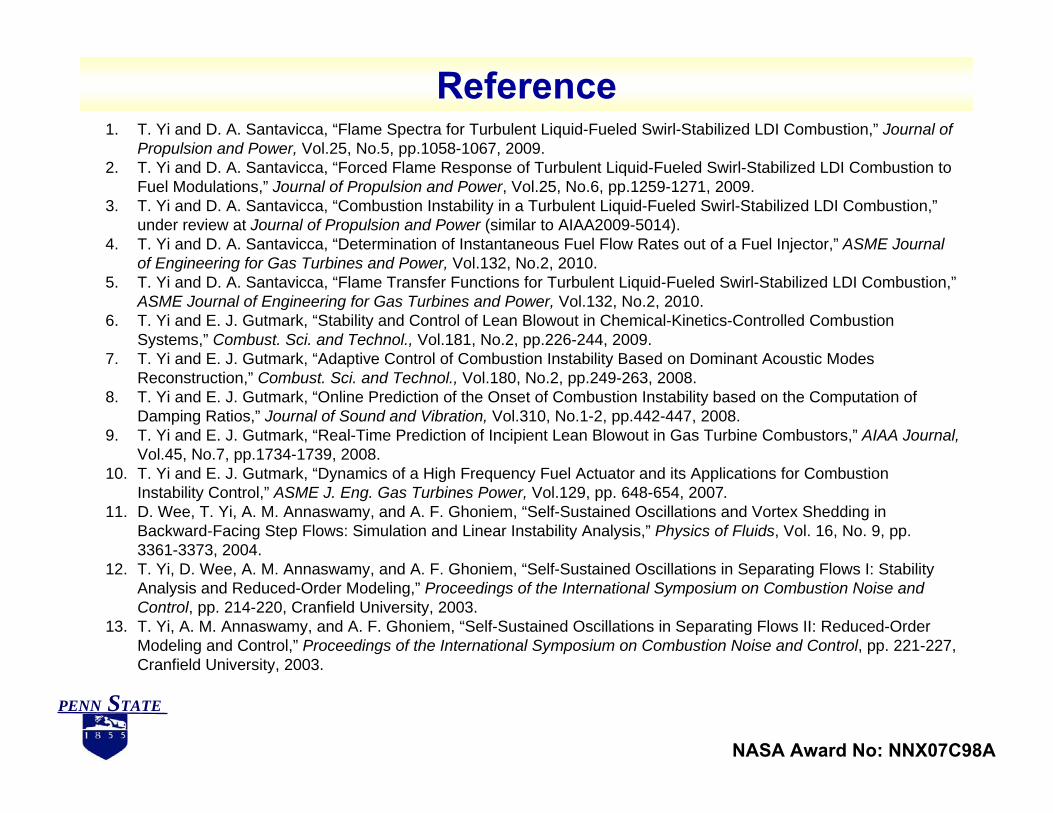
1. T. Yi and D. A. Santavicca, “Flame Spectra for Turbulent Liquid-Fueled Swirl-Stabilized LDI Combustion,” Journal of Propulsion and Power, Vol.25, No.5, pp.1058-1067, 2009.
2. T. Yi and D. A. Santavicca, “Forced Flame Response of Turbulent Liquid-Fueled Swirl-Stabilized LDI Combustion to Fuel Modulations,” Journal of Propulsion and Power, Vol.25, No.6, pp.1259-1271, 2009.
3. T. Yi and D. A. Santavicca, “Combustion Instability in a Turbulent Liquid-Fueled Swirl-Stabilized LDI Combustion,”under review at Journal of Propulsion and Power (similar to AIAA2009-5014).
4. T. Yi and D. A. Santavicca, “Determination of Instantaneous Fuel Flow Rates out of a Fuel Injector,” ASME Journal of Engineering for Gas Turbines and Power, Vol.132, No.2, 2010.
5. T. Yi and D. A. Santavicca, “Flame Transfer Functions for Turbulent Liquid-Fueled Swirl-Stabilized LDI Combustion,”ASME Journal of Engineering for Gas Turbines and Power, Vol.132, No.2, 2010.
6. T. Yi and E. J. Gutmark, “Stability and Control of Lean Blowout in Chemical-Kinetics-Controlled Combustion Systems,” Combust. Sci. and Technol., Vol.181, No.2, pp.226-244, 2009.
7. T. Yi and E. J. Gutmark, “Adaptive Control of Combustion Instability Based on Dominant Acoustic Modes Reconstruction,” Combust. Sci. and Technol., Vol.180, No.2, pp.249-263, 2008.
8. T. Yi and E. J. Gutmark, “Online Prediction of the Onset of Combustion Instability based on the Computation of Damping Ratios,” Journal of Sound and Vibration, Vol.310, No.1-2, pp.442-447, 2008.
9. T. Yi and E. J. Gutmark, “Real-Time Prediction of Incipient Lean Blowout in Gas Turbine Combustors,” AIAA Journal, Vol.45, No.7, pp.1734-1739, 2008.
10. T. Yi and E. J. Gutmark, “Dynamics of a High Frequency Fuel Actuator and its Applications for Combustion Instability Control,” ASME J. Eng. Gas Turbines Power, Vol.129, pp. 648-654, 2007.
11. D. Wee, T. Yi, A. M. Annaswamy, and A. F. Ghoniem, “Self-Sustained Oscillations and Vortex Shedding in Backward-Facing Step Flows: Simulation and Linear Instability Analysis,” Physics of Fluids, Vol. 16, No. 9, pp. 3361-3373, 2004.
12. T. Yi, D. Wee, A. M. Annaswamy, and A. F. Ghoniem, “Self-Sustained Oscillations in Separating Flows I: Stability Analysis and Reduced-Order Modeling,” Proceedings of the International Symposium on Combustion Noise and Control, pp. 214-220, Cranfield University, 2003.
13. T. Yi, A. M. Annaswamy, and A. F. Ghoniem, “Self-Sustained Oscillations in Separating Flows II: Reduced-Order Modeling and Control,” Proceedings of the International Symposium on Combustion Noise and Control, pp. 221-227, Cranfield University, 2003.

Thanks !
NASA Award No: NNX07C98A
PENN STATE


![[Ang Yang, Yin Shan] Intelligent Complex Adaptive (BookFi.org)](https://img.pdfslide.us/doc/110x75/546152e7b1af9fba388b470a/ang-yang-yin-shan-intelligent-complex-adaptive-bookfiorg.jpg)