Embed Size (px)
Citation preview
Adaptive Finite Element Simulation of Sheet Forming Operations Using
Continuum Elements
Mohd. Ahmed
Civil Engineering Department
King Khalid University
Gregar, Abha-61411
KSA
Abstract: - Presented in this study is the recovery techniques based adaptive finite element analysis of sheet
forming operations. An adaptive finite element code AdSheet2 considering continuum elements has been
developed. The code allows the analysis of sheet forming operations and gives the distribution of adaptively
refined mesh, effective strain, and punch load, stress and strain rate tensor in the domain. The recovery scheme
for determining more accurate velocity field is based on the least squares fitting of the computed velocities in
element patches. The solution error is estimated on the basis of an energy norm. The code is used to simulate an
axi-symmetric stretching of a metal blank by a hemispherical punch. The numerical results of the adaptive
analysis are presented and compared with non-adaptive analysis. The results presented show that the
performance of the adaptive analysis in predicting the deformation behaviour i.e. the seats of large
deformations, instability and effect of contact conditions is much superior.
Key-Words: - Stress Recovery, Velocity Recovery, Adaptive Mesh Refinement, Sheet Forming Operations,
Finite Element Analysis, Error Estimators
1 Introduction The finite element method is an effective tool for
simulating metal forming processes. However, the
accuracy of finite element results depends upon the
approximation of the mathematical model, manner
of domain discretization, choice of scheme for
solution of system equations and method employed
for computing derivatives of the state variable.
Significant errors can creep in the computed
solution unless special care is taken. Moreover, in
metal forming processes, material undergoes large
deformation and some of the elements may suffer
severe distortion. This could also lead to
inaccuracies in the computed results. The reliability
of the simulation can be enhanced through error
estimation and adaptive mesh refinement. The
enough advances are made in the field of finite
element error estimators and adaptive mesh
refinement techniques. Among the different types of
error estimators, the post processing or recovery
type of error estimators [1] are perhaps most
popular. Most recovery techniques are based on the
least square fitting of velocity (or the displacement)
field or their derivatives (stress field) by a higher
order polynomial over an elemental or nodal patch.
Zienkiewicz et al. [2] discussed error estimation
procedures based on recovery techniques and their
effectiveness in linear problems. They also
discussed the super convergent patch recovery
(SPR) technique and an alternative so-called
recovery-by-equilibrium-in-patches (REP)
technique. A recovery technique to extract
derivatives and stresses based upon the least squares
fitting of velocity field over an element patch has
been presented by Singh et al. [3]. The optimization
study of adaptive mesh refinement during finite
element simulation of sheet forming operations has
been carried out by Ahmed et al. [4]. Selmen et al.
[5] has predicted wrinkling in Sheet Metal Forming
using error indicators. The errors estimation
procedure adopted by them is based on proposed
combination of element thickness and geometrical
error. An adaptive numerical analysis for deep
drawing process has been carried out by Cherouat et
al. [6]. An adaptive refinement procedure for metal
forming process with ductile damage is presented by
Giraud et al. [7] for 3D adaptive simulation and by
Labergère [8] for 2D adaptive simulation. Ahmed
and Singh [9] carried out the adaptive parametric
study on Mesh Refinement during Adaptive Finite
Element Simulation of Sheet Forming Operations.
Chung et al. [10] has presented 3D- Finite element
analysis of sheet metal forming process employing
solid element remeshing procedures and effect of
single and double layer of mesh on deformed shape
and thickness variation of cold sheet forming
process is studied.
WSEAS TRANSACTIONS on APPLIED and THEORETICAL MECHANICS Mohd. Ahmed
E-ISSN: 2224-3429 83 Volume 10, 2015
Discretization of a sheet metal blank can be done
on the basis of continuum elements or else by shell
elements. Continuum elements discretize the sheet
not only along its mid-surface but also across it i.e.
along the direction of its thickness. Contact
conditions are modelled independently on both sides
of the metal blank. More than one layer of elements
is used for considering variation of strains through
the sheet thickness caused by bending and shear.
Continuum elements were employed for analysis of
sheet forming operation by Makinouch [11] using
an elasto-plastic formulation, and by Oh and
Kobayashi [12] using an elasto-plastic formulation
and as well as using rigid-plastic analysis. The
developments in the simulation of sheet metal
forming using continuum elements have been
presented by Ahmed, Sekhon, and Singh [13]. An
extended version of the solid–shell finite element
SHB8PS has been implemented into the implicit
finite element code ABAQUS by Salahouelhadj et
al. [14] and they applied it to sheet metal forming
simulations. The aim of the present study is to
compare the numerical results on axi-symmetric
stretching of a metal blank using velocity recovery
techniques and continuum element based adaptive
procedures [3] with numerical results obtained from
non-adaptive analysis.
2 Finite Element Formulation During sheet forming operations, the material is
subjected to larger strains. Hence the material is
assumed to behave as a rigid plastic or rigid visco-
plastic material. The flow formulation may be
adopted to arrive at the finite element equations. It
requires that among admissible velocities ui that
satisfies the conditions of compatibility and
incompressibility, as well as the velocity boundary
conditions, the actual solution gives the following
functional (function of functions) a stationary value
[11].
fdi
u i
F
f
+ d ij
ij
GòG
W¢òW
= esp & (1)
fd
i
ui
F
f
- d v
v
K + d i
GòG
WòW
WòW
= dedeedsdp &&&
(2)
where K is a large positive constant. Discretizing
the domain and minimizing the functional gives the
following relation.
j
V
VVj
Vi
V
iVVi
V0
0
2
=D
=úúú
û
ù
êêê
ë
é
¶¶
¶+
=úúú
û
ù
êêê
ë
é
¶ pp (3)
On simplifying the above, we obtain the
following matrix equation
(4) where K is called the stiffness matrix and f is the
residual of the nodal point force vector.
The boundary at time t can be assumed to be
divided into three parts, namely S1 on which
velocity is prescribed, S2, which is free and S3 where
frictional contact occurs. The following conditions
apply on each type of boundary.
On S1: (v - vo). n = 0 (5)
On S2: s . n = 0 (6)
On S3: Dvt = (v - vo).t (7) where v ,vo are the material and the die velocity, n
& t are unit vectors in the normal and tangential
directions with respect to the die surface, and s is
the stress tensor. The magnitude of the frictional stress on the
material is dependent on the magnitude of the
relative sliding velocity us between the material and
the die. Their directions of the frictional stress fs and
relative sliding velocity us are opposite to each
other. Mathematically, the relationship between fs
and us may be expressed as follows.
÷÷
ø
ö
çç
è
æ
úú
û
ù
êê
ë
é-@-= -
00
1
tan2
u
ukm
u
ukmf
ss
s p (8)
where u0 is a small threshold velocity, of the order
of 10-3
to 10-4
us.
A two-point reduced integration is employed for
the penalty terms. The non-linear system equation is
solved by Newton-Raphson algorithm. To achieve
convergence linear line search technique has been
used in the code.
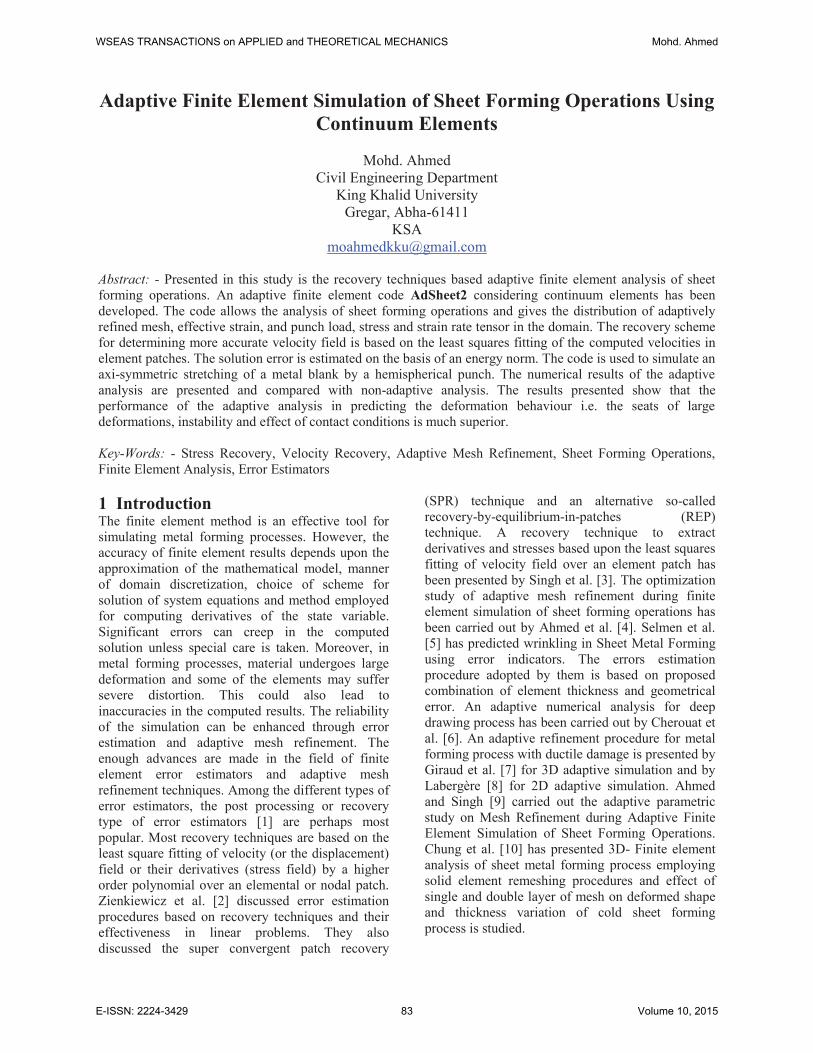
3 Proposed Model Fig. 1 shows a schematic of typical axi-symmetric
sheet metal forming operation. The blank material is
assumed as rigid-visco plastic or rigid-plastic. The
elastic components of strain and strain rates are
neglected as small. The punch and die are
considered as rigid. The downward velocity of the
punch can be arbitrarily specified. The flow rule for
the blank material is given by the following
Equation [15].
úû
ùêë
é
+-==
ijkkij
NL
ijij
Gds
n
nsee
12
1&& (9)
K v fD =
WSEAS TRANSACTIONS on APPLIED and THEORETICAL MECHANICS Mohd. Ahmed
E-ISSN: 2224-3429 84 Volume 10, 2015
where`G = m = non-linear viscosity of the material.
The stress-strain relation of the material of the blank
is as follows. m
)( ees & a + 1 = (10)
Quantitative assessment of the quality of the
proposed model and adaptive mesh improvement to
achieve target accuracy is carried out by simulating
the sheet stretching operations. The recovery
scheme for determining more accurate velocity field
[3] is based on the least squares fitting of the
computed velocities in elemental patches. The
energy norm of the error is adopted for assessing of
the quality of the solution and for adaptive mesh
refinement. For adaptive mesh refinement, the error
was equally distributed over the elements of the
domain [16].
4 Illustrative Example
The two-dimensional computer code Adsheet2
developed on the basis of the adaptive finite element
procedures has been applied to the case of sheet
stretching operation (Figure 1). Owing to symmetry,
only one half of the blank was modelled. The input
parameters were as follows.
Blank Material = Mild Steel
Sheet thickness h = 2mm
Clamping Radius of Blank (Rb) = 59.18mm
Radius Ratio (Rb / Rp) = 1.20
Velocity of Punch V = 1mm/sec
K (Mesh size reduction factor) =1.2
Target error = 8%
Stress-strain relation 216.0
)0001.0(589 es + =
where s is effective stress and e is effective strain
The displacement of punch was modelled in
incremental steps. The displacement in each
increment was limited such that it caused a
maximum strain increment of 1% and the nominal
duration of each increment was taken as 0.25sec.
The domain was discretized using six noded
triangular elements. For discussion purpose, the
blank is divided into three regions. Region I is the
portion between the centre of the blank and a point
up to which the punch is in contact with the blank.
Region II corresponds to the portion of the blank
neither in contact with punch nor with the die or
blank holder and region III refers to the portion of
the blank, which is in contact with the die and the
blank holder. The following paragraphs present the
results using the non-adaptive and adaptive analysis.
5 Adaptive Analyses The adaptive analysis was carried out using velocity
recovery techniques. A polynomial of degree 2 was
taken for least squares fitting of the velocity since
discretization of the domain had been carried out
using quadratic elements. The fitting of velocity was
done on a patch of elements surrounding the
element under consideration while the fitting of
stress was done on a patch of nodes surrounding the
given node. The error was estimated in the energy
norm. For adaptive mesh refinement, the error was
equally distributed over the elements of the domain.
The accuracy limit was taken as 8% of the global
error. The computer memory requirement for
storage of numerical result was about 150 MB. CPU
time required for the analysis was approximately 7
hours. The average number of iterations per step
required for convergence was 22. The average
global error was 7.41%. Although the analysis
provides detailed computational results for each
time step, the results of only two stages of the
deformation process are presented. Mesh and
deformed shape and contours of components of
strain tensor have been plotted at punch
displacements of 2.5mm and 25.0mm.
5.1 Mesh Density A user defined uniform mesh consisting of 828
elements and 3770 degrees of freedom was created
at the beginning of the analysis (Figure 2). The
computed solution was evaluated. As the error
percentage in energy norm of the solution was more
than the predefined error limit, the mesh was
automatically regenerated. Two remeshings were
required to bring the error below the predefined
error limit. In the first remeshing, the number of
elements and degrees of freedom were found to
increase to 1239 and 5484 respectively. In the next
remeshing, the number of elements and degrees of
freedom decreased somewhat to 1031 and 4524
Fig. 1 Schematic Diagram of Sheet
Stretching Operation
WSEAS TRANSACTIONS on APPLIED and THEORETICAL MECHANICS Mohd. Ahmed
E-ISSN: 2224-3429 85 Volume 10, 2015

respectively. The global error of the solution after
the second remeshing was found to be well below
the prescribed limit in all subsequent steps. The
element size reduces to approximately one fourth of
the original size after remeshing in finer mesh
zones. The computed mesh and deformed shapes at
punch displacement of 2.5mm and 25.0mm are
shown in Figure 3.
Referring to Figure 3 (a), which shows the
deformed mesh at punch displacement of 2.5mm, it
is observed that the region I and region III have
finer elements. In region I, the maximum element
density is at the punch-blank interface i.e. at the top
surface of the sheet and it goes on decreasing
towards the bottom of the sheet. The element
density decreases along the radius too. The mesh in
region II is more or less uniform but its density is
smaller. The region III has a band of finer elements
throughout its thickness.
The deformed mesh at punch travel of 25.0mm is
given in Figure 3 (b). Though regions I and region
III, continue to have greater number of fine
elements but their distribution is significantly
altered. Region I, which is localized at punch travel
of 2.5 mm, becomes dispersed and the element
density tends to decrease towards the region II. In
region III also, two distinct bands of fine elements
develop. The mesh in region II becomes coarser
with increase of punch travel. As will become
apparent from results presented later on, sites of
highly dense elements correspond to seats of large
deformation. In other words, the mesh refinement at
a given location is proportional to the local gradients
of velocity.
5.2 Effective Strain Figure 4 shows the variation of effective strain at a
punch displacement of 2.5 mm and 25.0 mm
respectively. The magnitude of effective strain
increases with increase of punch displacement. It is
evident from the Figure 4 (a) that concentration of
effective strain is predicted in two regions namely
region I and region III. It is also observed that the
maximum effective strain (equal to 0.0493) is
predicted to occur at three locations, two in region I
and one in region III. The location of maximum
contour line is found near the top surface of blank.
At the bottom of the sheet, maximum value contour
has a value of 0.0389.
The distribution of effective strain at 25.0mm
punch displacement is shown in Figure 4 (b). The
magnitude of effective strain is found to increase in
each region with increase of punch displacement. At
locations around the centre of the blank, value of the
effective strain is greater than 0.3216 across the
sheet thickness. In region II, the effective strain
varies from 0.0568 to 0.1561. In region III, two
zones of high strain gradient are predicted. The
bottom of the sheet in region III contains effective
strain contour of maximum of value 0.1892.
Contours of effective strain adjoining the top
surface of sheet in region III, show that predicted
effective strain is varies from 0.0237 to 0.3216.
The peak values and radial locations of effective
strain at different punch displacements are listed in
Tab. 1. The peaks increase in height with increase of
punch displacement. Whereas the magnitude of the
peak effective strain is 0.426031 at punch
displacement of 2.5mm, it is as high as 3.016345 at
25.0mm of punch displacement. The radial location
of the peak is also different at different punch
displacement. Whilst the peak effective strain at
2.5mm and 25.0mm punch displacement is located
Fig. 2 Model and Initial Mesh
(a) 2.5 mm punch displacement
(b) 25.0 mm punch displacement
Fig. 3 Deformed mesh using Adaptive
Analysis
WSEAS TRANSACTIONS on APPLIED and THEORETICAL MECHANICS Mohd. Ahmed
E-ISSN: 2224-3429 86 Volume 10, 2015

at the centre of the blank, it is located at the die
corner radius during certain intermediate stages.
Table 1: Peak ε and P Using Adaptive Analysis
5.3 Effective Strain Rate The distribution of effective strain rate at different
values of punch displacement is depicted in Fig. 5
(a) and (b). It is found that there is only a marginal
effect of punch displacement on the effective strain
rate. It is observed from the Fig. 5 (a) that in region
I, the maximum value contour (0.019/sec) extends
throughout the sheet thickness. Region II has
smallest values of the effective strain rate. In region
III, highest value of the effective strain rate equals
0.19/sec.
From Fig. 5 (b), corresponding to punch
displacement of 25.0mm, highest effective strain
rate is found in region I. In region II, the value of
the effective strain rate uniformly decreases towards
the region III. The bottom of sheet, in region III,
experiences lowest strain rate.
Punch
travel
(mm)
Effective
Strain
( ε )
Location
(mm)
Punch
Load
(P, kN)
2.5 0.426031 0.020 2.36
7.5 1.996043 55.80 12.96
12.5 2.001042 55.80 28.55
17.5 2.006001 55.70 47.78
25.0 3.016345 0.050 85.53
(a) 2.5 mm punch displacement
2
10
9
8
6
7
5
4
3
1
10
10
8 8
9
7
6
6
5
55
4 4
4
4
43
3 3
3
33
3
2
2
2
2
2
33
3
6
2
2
2
10
2
(b) 25 mm punch displacement
Fig. 4 Contours of effective strain e
using Adaptive Analysis
9
98
8
8
88
88
7
7
7
7
7
66
5
4
4
3
2
2
10
10
9
9
8
8
10
9
8
7
6
5
5
5
6
44
4
43
33
2
222
2 2
3
33
2
3
10
8
9
4
5
7
6
2
1
10
10
2
23
3
4
4
56
6
78
9
3210
23
4
9
10
8
7
6
4
5
3
2
1
(a) 2.5 mm punch displacement
Fig. 5 Contours of effective strain rate e&
using Adaptive Analysis
2
2
3
4
5
55
6
10
10 101010
999
9
2
3
4
5
6
7
2
7
10
9
8
6
5
4
3
1
1010
10
10
10
10
10
10
10
9
9
99
99
99
10
8
8
8
8
8
8
8
9
9
8
86
7
79
(b) 25 mm punch displacement
WSEAS TRANSACTIONS on APPLIED and THEORETICAL MECHANICS Mohd. Ahmed
E-ISSN: 2224-3429 87 Volume 10, 2015

5.4 Effective Stress The contour plots of predicted values of effective
stress corresponding to punch travel of 2.5mm and
25.0mm are given in Fig. 6. The values of effective
stress increase with the increase of punch travel.
Fig. 6 (a) containing contours of effective stress at a
punch travel of 2.5mm indicates that stress
concentration is pronounced in regions I and III, and
the level of effective stress is higher than 174.0
N/mm2. In region I, the effective stress in the
vicinity of the top surface varies from 234.0 to
270.0 N/mm2. Region II experiences more or less
uniform level of effective stress. The predicted
maximum magnitude of effective stress, in region
III, is 270.0 N/mm2.
Fig. 6 (b) corresponds to punch displacement of
25.0mm. It shows two zones of stress concentration,
one each in region II and III just near the junction.
Region I experience a uniform effective stress of
magnitude 430.0 N/mm2 except near the centre of
the blank where highest level of stress occurs across
the whole thickness of the blank.
When including a sub-subsection you must use, for
its heading, small letters, 11pt, left justified, bold,
Times New Roman as here.
5.5 Components of Strain Rate Tensor The predicted iso-value plots of components of
strain rate are shown in Fig. (7) through (10).
Predicted variations of radial strain rate
component r
e& at punch displacement of 2.5mm are
shown in Fig. 7 (a). It is found that largest values of
this component (both tensile and compressive) occur
in regions I and III. In region I, it varies from 0.01
/sec (compressive) at the top surface to 0.0197 /sec
(tensile) at the bottom surface. In region II, r
e& varies
from 0.0001(compressive) to 0.00320(tensile). The
variation in region III is from 0.0001 /sec
(compressive) at the bottom surface to 0.0197 /sec
(tensile) at the top surface. Fig. 7 (b) pertains to
contours at punch displacement of 25.0mm. The
nature of distribution is more or less similar in
different regions of the sheet. The contours of
highest magnitude appear in region I where the
bottom surface experiences greater values of r
e&
than the top surface. The variation in region II is
from 0.00002/sec to 0.00178/sec. In region III, the
tensile magnitude varies from 0.00002 /sec to
0.01058 /sec.
(a) 2.5 mm punch displacement
(b) 25 mm punch displacement
10
10
4
44
4
5
5
5
9 8
7
6
2
7
10
9
8
6
5
4
3
1
104
4
5
56
(a) 2.5 mm punch displacement
10
9
9
8 8
8 8
7 7
77
77
7
666
66
6
6
5
5
55
5
4
444
4
4
3
3
3
33
2
2
1
8 7
77
6
54
3
3
2
3
22
2
10
9
9
9
99
9
8
8
88
88
8
77
7
77
7
7
6
67
7
10
9
8
6
5
3
4
2
1
10
10
10
99
9
99
8
8
8
8
7
7
7
7
7
7
7
6
6
6
66
66
6
6
6
6
6
6
6
5
5
5
5
55
5
5
55
8
44
4
4
4
3
3
8
10
9
6
7
5
4
3
2
1
103
2
109
9
8 8 8
4
8
8
88
8
7
6
5
2
3
6
10
7
8
9
3
4
5
1
24
33 4
8
7
7
7
6
6
10
5
55
5
2
2
2 3
33
4
4
4
4
4
Fig. 6 Contours of effective stress s using
Adaptive Analysis
Fig. 7 Contours of strain rate component r
e&
using Adaptive Analysis
WSEAS TRANSACTIONS on APPLIED and THEORETICAL MECHANICS Mohd. Ahmed
E-ISSN: 2224-3429 88 Volume 10, 2015
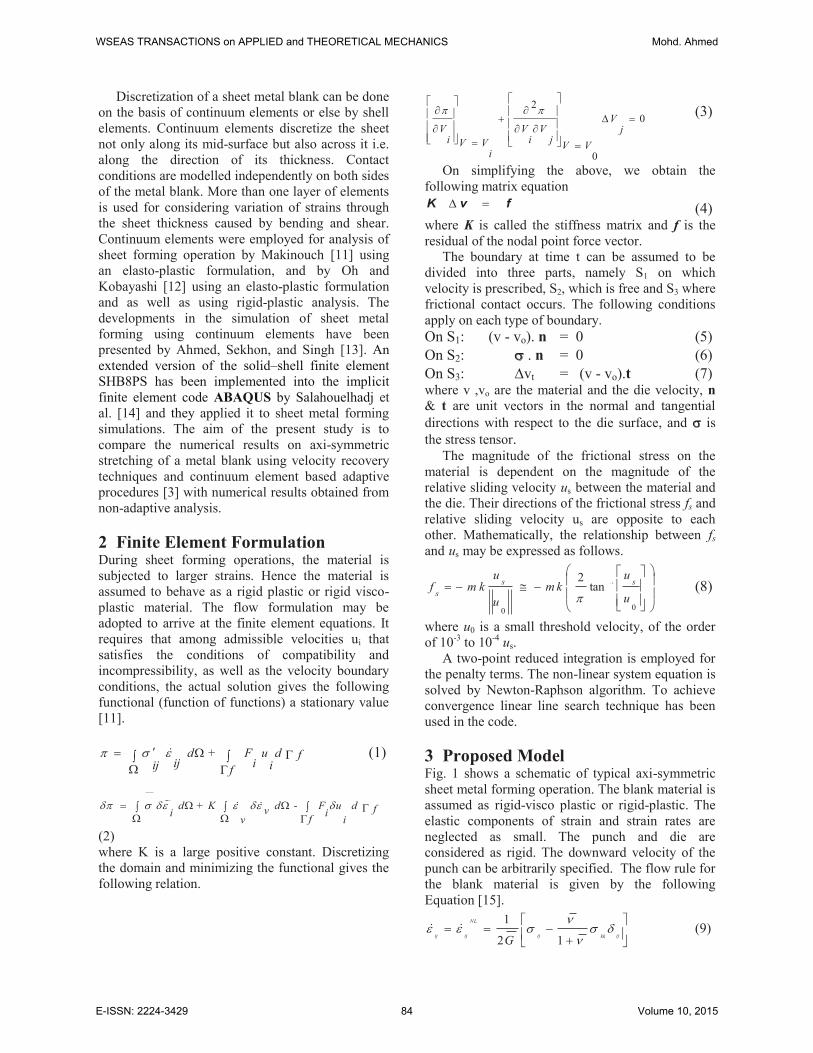
The distribution of the axial strain rate
component z
e& at different values of punch
displacement is shown in Fig. 8 (a) and (b). The
Former figure shows that z
e& at the top surface of
region I and bottom surface of region III are in
tension. Region II is in compression and the
variation is from 0.00017/sec to 0.0064/sec. It is
clear from Fig. 8 (b) depicting variation of z
e& at
punch displacement of 25.0 mm that nature of this
strain component throughout the sheet thickness is
compressive. Region I is subjected to higher values
of z
e& as compared to regions II and III. The lowest
value contour of strain component has a magnitude
of 0.00678 /sec, which stays constant throughout
region II. In region III, z
e& varies from 0.00678/sec
to 0.01014/sec.
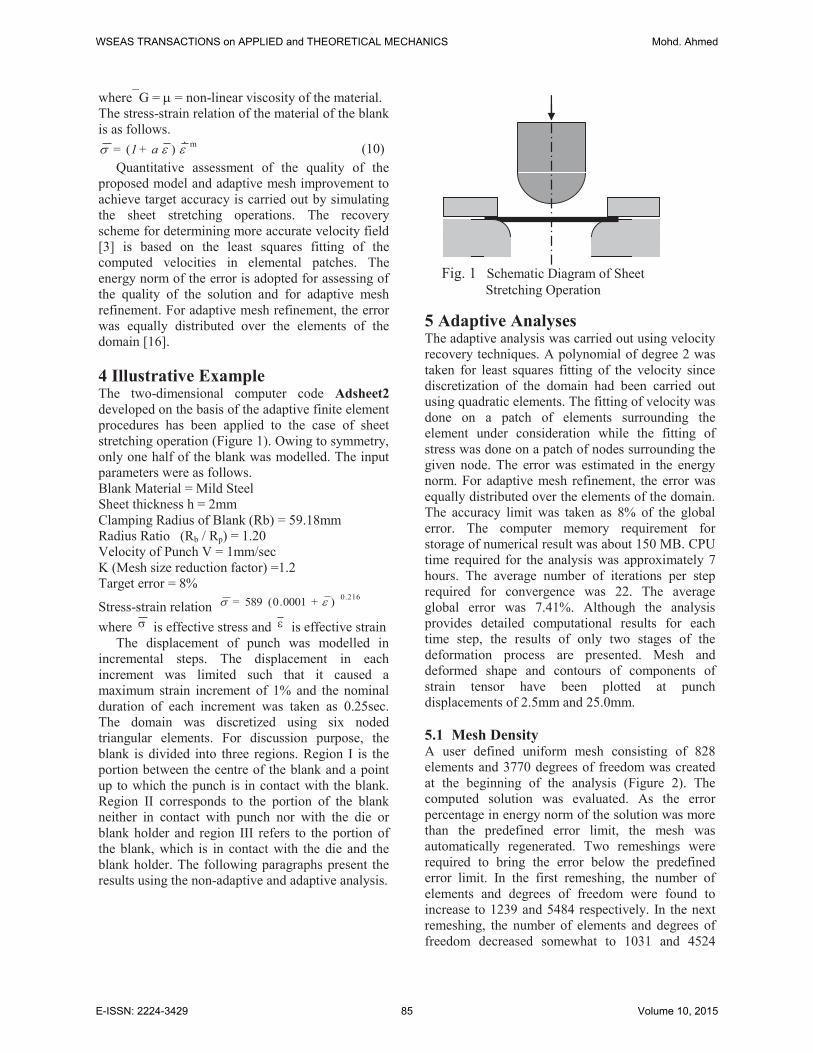
The contour plots of the rate of hoop strain q
e& at
2.5mm and 25.0mm punch displacements are shown
in Fig. 9. At a punch travel of 2.5m, highest
magnitude of q
e& in region I is predicted to be
0.02002/sec. Region II has more or less a constant
magnitude of q
e& throughout the region. The
analysis predicts a compressive nature of this strain
component at the interface between the blank holder
and the sheet. The contours of q
e& at punch
displacement of 25.0mm, given in Fig. 9 (b) indicate
that in region I, compressive q
e& occur at the bottom
surface and tensile q
e& develops at the top surface.
The distribution of compressiveq
e& , in region II,
varies from 0.00615/sec to 0.01716/sec. The
variation of q
e& in region III is 0.00486/sec
(compressive) to 0.00982/sec (tensile).
Fig. 10 (a) and (b) depict the variation of the
shear strain rate component qe r& at different stages
of deformation. It is clear from the contour plots that
at a punch displacement of 2.5mm, part of the top
surface and entire bottom surface of sheet of region
I and region II are positive. Shear strain rate qe r& is
positive throughout regions III. The contour plots
Fig. 9 Contours of strain rate component
qe&
using Adaptive Analysis
(a) 2.5 mm punch displacement
Fig. 8 Contours of strain rate component z
e&
using Adaptive Analysis
10
10
10
9
9
95
5
6
6
8
8
88
8
4
4
3
3
2
2
1
1
7
10
10
9
8
7
77
6
7
3
1
10
8
9
7
4
6
5
2
3
910
5 67
8 8 8
1
10
9
5
6
8
7
78
9
4 32 1
10
10
9
8
6
7
5
3
4
2
1
10
9
8
8
8
8
7
7
7
7
6
6
6
6
6
6
5
5 5
55
5
5
4
44
44
3
33
2
22
1
10
99
98
5
4
4
3
3
333
3
3
2 2
2
2
2
22
2
1
11
11
1
(b) 25 mm punch displacement
1
7
6
44
5
3
32
3
1
1
1
10
9
8 77
6
6
6
5
5
4
4
4
4
5 3 3
3
3
3
3
2
2
2
1
43
3
3
5
10
8
9
7
5
6
4
2
3
1
(a) 2.5 mm punch displacement
(b) 25 mm punch displacement
10
10
10
1010
10
9
99
9
9
9
9
7
7
7
7
77
7
7
6
6
6
88
8
8
8
88
8
8
3
334
4
5
6
7
5
4
64
9
1 2
3
3
44
4
45
66
8
7
6
6
10
4
5
1
7
10
9
8
4
6
5
3
2
WSEAS TRANSACTIONS on APPLIED and THEORETICAL MECHANICS Mohd. Ahmed
E-ISSN: 2224-3429 89 Volume 10, 2015
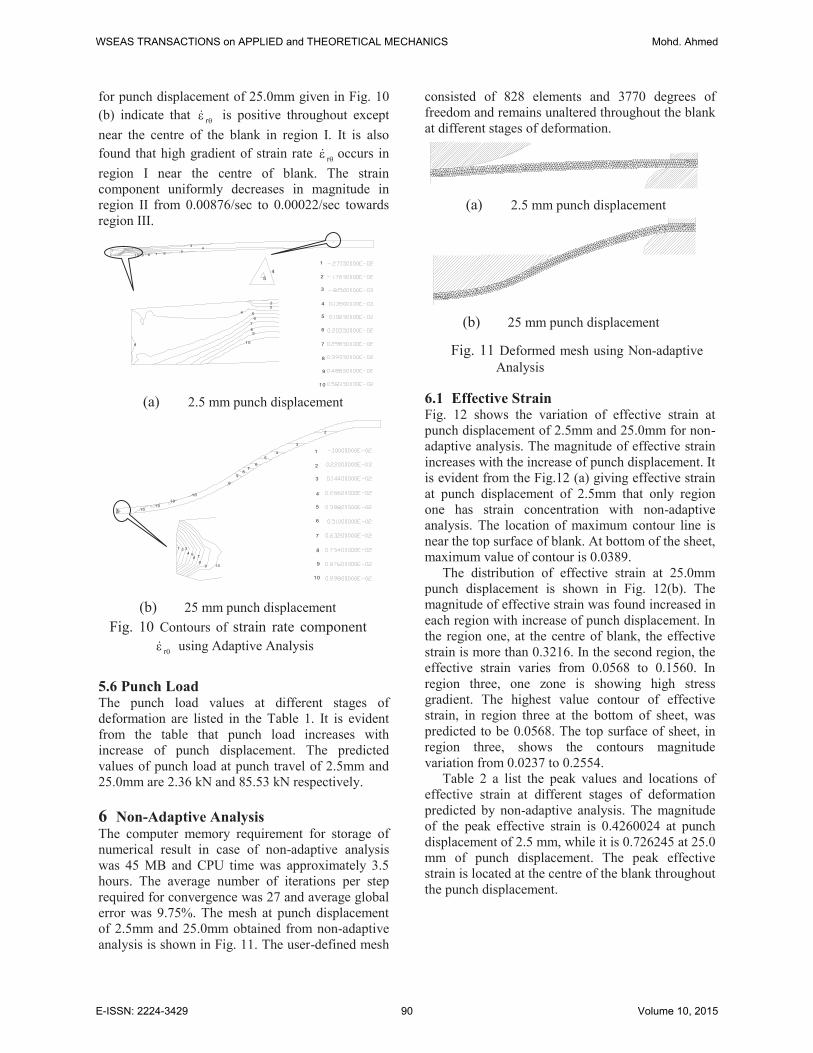
for punch displacement of 25.0mm given in Fig. 10
(b) indicate that qe r& is positive throughout except
near the centre of the blank in region I. It is also
found that high gradient of strain rate qe r& occurs in
region I near the centre of blank. The strain
component uniformly decreases in magnitude in
region II from 0.00876/sec to 0.00022/sec towards
region III.
5.6 Punch Load The punch load values at different stages of
deformation are listed in the Table 1. It is evident
from the table that punch load increases with
increase of punch displacement. The predicted
values of punch load at punch travel of 2.5mm and
25.0mm are 2.36 kN and 85.53 kN respectively.
6 Non-Adaptive Analysis The computer memory requirement for storage of
numerical result in case of non-adaptive analysis
was 45 MB and CPU time was approximately 3.5
hours. The average number of iterations per step
required for convergence was 27 and average global
error was 9.75%. The mesh at punch displacement
of 2.5mm and 25.0mm obtained from non-adaptive
analysis is shown in Fig. 11. The user-defined mesh
consisted of 828 elements and 3770 degrees of
freedom and remains unaltered throughout the blank
at different stages of deformation.
6.1 Effective Strain Fig. 12 shows the variation of effective strain at
punch displacement of 2.5mm and 25.0mm for non-
adaptive analysis. The magnitude of effective strain
increases with the increase of punch displacement. It
is evident from the Fig.12 (a) giving effective strain
at punch displacement of 2.5mm that only region
one has strain concentration with non-adaptive
analysis. The location of maximum contour line is
near the top surface of blank. At bottom of the sheet,
maximum value of contour is 0.0389.
The distribution of effective strain at 25.0mm
punch displacement is shown in Fig. 12(b). The
magnitude of effective strain was found increased in
each region with increase of punch displacement. In
the region one, at the centre of blank, the effective
strain is more than 0.3216. In the second region, the
effective strain varies from 0.0568 to 0.1560. In
region three, one zone is showing high stress
gradient. The highest value contour of effective
strain, in region three at the bottom of sheet, was
predicted to be 0.0568. The top surface of sheet, in
region three, shows the contours magnitude
variation from 0.0237 to 0.2554.
Table 2 a list the peak values and locations of
effective strain at different stages of deformation
predicted by non-adaptive analysis. The magnitude
of the peak effective strain is 0.4260024 at punch
displacement of 2.5 mm, while it is 0.726245 at 25.0
mm of punch displacement. The peak effective
strain is located at the centre of the blank throughout
the punch displacement.
5
4
10
9
8
7
5
6
4
4
3
2
710 9 8
56
43
2
7
10
9
8
6
5
4
3
1
(a) 2.5 mm punch displacement
Fig. 10 Contours of strain rate component
qe r&
using Adaptive Analysis
6
5
4
3
2
10
10
10
10
9
9
87
2
7
10
9
8
6
5
4
3
1
54
321
10
8
9
76
(b) 25 mm punch displacement
(a) 2.5 mm punch displacement
(b) 25 mm punch displacement
Fig. 11 Deformed mesh using Non-adaptive
Analysis
WSEAS TRANSACTIONS on APPLIED and THEORETICAL MECHANICS Mohd. Ahmed
E-ISSN: 2224-3429 90 Volume 10, 2015
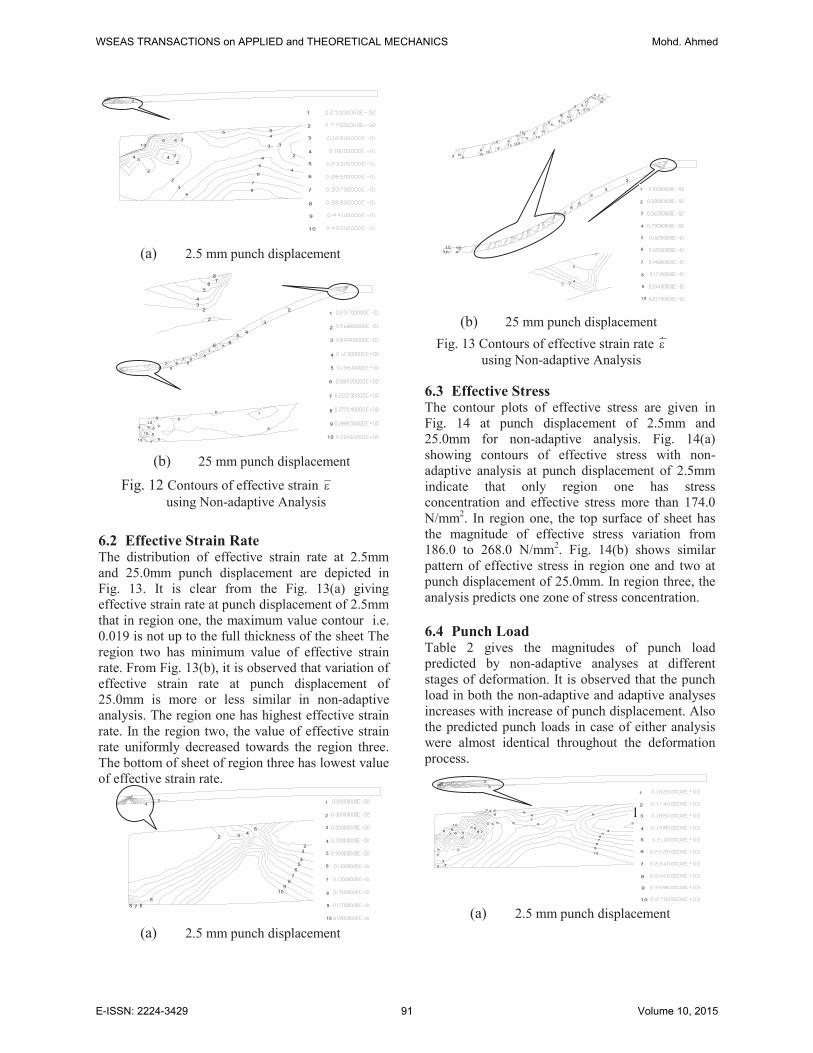
6.2 Effective Strain Rate The distribution of effective strain rate at 2.5mm
and 25.0mm punch displacement are depicted in
Fig. 13. It is clear from the Fig. 13(a) giving
effective strain rate at punch displacement of 2.5mm
that in region one, the maximum value contour i.e.
0.019 is not up to the full thickness of the sheet The
region two has minimum value of effective strain
rate. From Fig. 13(b), it is observed that variation of
effective strain rate at punch displacement of
25.0mm is more or less similar in non-adaptive
analysis. The region one has highest effective strain
rate. In the region two, the value of effective strain
rate uniformly decreased towards the region three.
The bottom of sheet of region three has lowest value
of effective strain rate.
6.3 Effective Stress The contour plots of effective stress are given in
Fig. 14 at punch displacement of 2.5mm and
25.0mm for non-adaptive analysis. Fig. 14(a)
showing contours of effective stress with non-
adaptive analysis at punch displacement of 2.5mm
indicate that only region one has stress
concentration and effective stress more than 174.0
N/mm2. In region one, the top surface of sheet has
the magnitude of effective stress variation from
186.0 to 268.0 N/mm2. Fig. 14(b) shows similar
pattern of effective stress in region one and two at
punch displacement of 25.0mm. In region three, the
analysis predicts one zone of stress concentration.
6.4 Punch Load Table 2 gives the magnitudes of punch load
predicted by non-adaptive analyses at different
stages of deformation. It is observed that the punch
load in both the non-adaptive and adaptive analyses
increases with increase of punch displacement. Also
the predicted punch loads in case of either analysis
were almost identical throughout the deformation
process.
2
2
2
2
33
3
3
3
3
4
4
4
4
4
5
55
5
4
4
10
6
7
8
2
10
9
8
6
7
5
3
4
2
1
(b) 25 mm punch displacement
(a) 2.5 mm punch displacement
10
10
10
9
9
9
9
98
8
8
8
8
7
7
66
2
3
45
7
7
7
7
7
88
8
8
9
9
2
10
9
8
6
7
5
4
3
1
2
2
3
4
5
67
8
Fig. 12 Contours of effective strain e
using Non-adaptive Analysis
(a) 2.5 mm punch displacement 2
34
10
9
8
8
7
7
6
6
5
5
6
4
43
3
2
2
9
10
7
8
6
2
5
4
3
1
(a) 2.5 mm punch displacement
10
10
9
9
99
8
8
8
7
7
7 6
6
66
6
6
6
7855
5
4
4
5
5 3
3
3
3
3 4
4
5
6
2
2
2
3
3
10
9
8
7
6
4
5
2
1
(a) 2.5 mm punch displacement
(b) 25 mm punch displacement
Fig. 13 Contours of effective strain rate e&
using Non-adaptive Analysis
10 1010
1010
10
10
10
10
10
10
10
99
9
9 99
99
99 9
9
9
8
8
8
8
8
8
8
7
7
7
6
5
5
432
10
10
10
9
7
65
4
3
2
2
7
10
9
8
6
5
4
3
1
WSEAS TRANSACTIONS on APPLIED and THEORETICAL MECHANICS Mohd. Ahmed
E-ISSN: 2224-3429 91 Volume 10, 2015
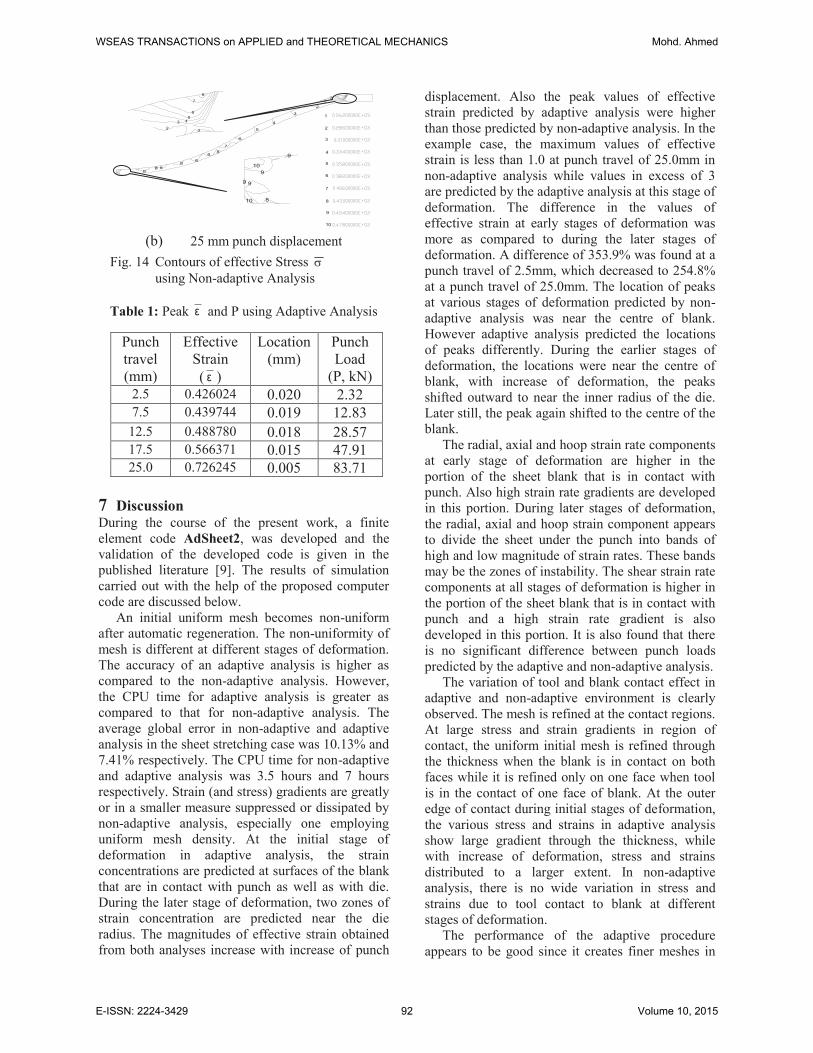
Table 1: Peak ε and P using Adaptive Analysis
7 Discussion During the course of the present work, a finite
element code AdSheet2, was developed and the
validation of the developed code is given in the
published literature [9]. The results of simulation
carried out with the help of the proposed computer
code are discussed below.
An initial uniform mesh becomes non-uniform
after automatic regeneration. The non-uniformity of
mesh is different at different stages of deformation.
The accuracy of an adaptive analysis is higher as
compared to the non-adaptive analysis. However,
the CPU time for adaptive analysis is greater as
compared to that for non-adaptive analysis. The
average global error in non-adaptive and adaptive
analysis in the sheet stretching case was 10.13% and
7.41% respectively. The CPU time for non-adaptive
and adaptive analysis was 3.5 hours and 7 hours
respectively. Strain (and stress) gradients are greatly
or in a smaller measure suppressed or dissipated by
non-adaptive analysis, especially one employing
uniform mesh density. At the initial stage of
deformation in adaptive analysis, the strain
concentrations are predicted at surfaces of the blank
that are in contact with punch as well as with die.
During the later stage of deformation, two zones of
strain concentration are predicted near the die
radius. The magnitudes of effective strain obtained
from both analyses increase with increase of punch
displacement. Also the peak values of effective
strain predicted by adaptive analysis were higher
than those predicted by non-adaptive analysis. In the
example case, the maximum values of effective
strain is less than 1.0 at punch travel of 25.0mm in
non-adaptive analysis while values in excess of 3
are predicted by the adaptive analysis at this stage of
deformation. The difference in the values of
effective strain at early stages of deformation was
more as compared to during the later stages of
deformation. A difference of 353.9% was found at a
punch travel of 2.5mm, which decreased to 254.8%
at a punch travel of 25.0mm. The location of peaks
at various stages of deformation predicted by non-
adaptive analysis was near the centre of blank.
However adaptive analysis predicted the locations
of peaks differently. During the earlier stages of
deformation, the locations were near the centre of
blank, with increase of deformation, the peaks
shifted outward to near the inner radius of the die.
Later still, the peak again shifted to the centre of the
blank.
The radial, axial and hoop strain rate components
at early stage of deformation are higher in the
portion of the sheet blank that is in contact with
punch. Also high strain rate gradients are developed
in this portion. During later stages of deformation,
the radial, axial and hoop strain component appears
to divide the sheet under the punch into bands of
high and low magnitude of strain rates. These bands
may be the zones of instability. The shear strain rate
components at all stages of deformation is higher in
the portion of the sheet blank that is in contact with
punch and a high strain rate gradient is also
developed in this portion. It is also found that there
is no significant difference between punch loads
predicted by the adaptive and non-adaptive analysis.
The variation of tool and blank contact effect in
adaptive and non-adaptive environment is clearly
observed. The mesh is refined at the contact regions.
At large stress and strain gradients in region of
contact, the uniform initial mesh is refined through
the thickness when the blank is in contact on both
faces while it is refined only on one face when tool
is in the contact of one face of blank. At the outer
edge of contact during initial stages of deformation,
the various stress and strains in adaptive analysis
show large gradient through the thickness, while
with increase of deformation, stress and strains
distributed to a larger extent. In non-adaptive
analysis, there is no wide variation in stress and
strains due to tool contact to blank at different
stages of deformation.
The performance of the adaptive procedure
appears to be good since it creates finer meshes in
Punch
travel
(mm)
Effective
Strain
( ε )
Location
(mm)
Punch
Load
(P, kN)
2.5 0.426024 0.020 2.32 7.5 0.439744 0.019 12.83
12.5 0.488780 0.018 28.57 17.5 0.566371 0.015 47.91 25.0 0.726245 0.005 83.71
(b) 25 mm punch displacement
Fig. 14 Contours of effective Stress s
using Non-adaptive Analysis
8
8
88
88
7
6
5
4
3
3
2
2
8
8
7
6
5
4
3
3
2
10
9
8
5
7
6
4
3
1
2
10
10
99
9
9
8
WSEAS TRANSACTIONS on APPLIED and THEORETICAL MECHANICS Mohd. Ahmed
E-ISSN: 2224-3429 92 Volume 10, 2015
regions of high strain (or stress gradient) on the side
of the tool contact with the blank and the coarse
meshes in regions of low strain (or stress gradient).
The contours of maximum magnitude of effective
strain, effective strain rate and effective stress are
found to occur at more than one location with
adaptive analysis but only at one location in non-
adaptive analysis. Highest value of effective strain
contours covers whole sheet thickness with adaptive
analysis while it is in some portion of the sheet
thickness with non- adaptive analysis. It can be
infers from the above discussion that the adaptive
analysis seems to exhibit a true picture of
deformation behaviour and adaptive analysis may be
usefully employed to predict the seats of large
deformations , locations of possible instability and
effect of continuously changing tool contact
conditions on the sheet forming operations.
4 Conclusion In this study, two-dimensional computer code
Adsheet2 based on recovery based adaptive finite
element procedures to simulate metal forming
operation has been developed. A post-processing
type of error estimator has been employed for
finding elemental and global error. The recovery
scheme for determining more accurate velocity field
is based on the least squares fitting of the computed
velocities in elemental patches. Significant
conclusions of the study are summarized below.
· The prediction of the two-dimensional code
AdSheet2 showed good agreement with results
available in the published literature.
· Results of simulations of adaptive analysis show
that the mesh becomes finer only in regions of
high strain gradients and it become coarser in
regions of low strain gradient. The seat of high
strain gradients corresponds to tool- blank
interfaces. The uniform initial mesh is refined
through the thickness when the blank is in
contact on both faces while it is refined only on
one face when tool is in the contact of one face
of blank. The mesh size reduces to
approximately one fourth of the original size
after remeshing in finer mesh zones.
· The comparison of adaptive analysis with non-
adaptive analysis indicates that the adaptive
analysis predicts higher values of effective
strain as compared to the non- adaptive analysis.
Also, the locations of peaks of effective strain
are different at different stages of deformation.
This is because strain gradients can get
suppressed or dissipated in non-adaptive
analysis, especially one employing uniform
mesh density.
· The variation of effective stress and strain
predicted by two analyses is also different. The
adaptively reduced mesh size show a true
picture of state variables variation through the
thickness. The non-adaptive analysis shows the
maximum value of to a part of thickness while
adaptive analysis predicted it to be throughout
the thickness or up to a greater thickness.
· The study of components of the strain rate
tensor during the axisymmetric sheet stretching
operation predicted by the velocity recovery
based analysis indicates that the radial, axial and
hoop strain rate components at earlier stage of
deformation is higher in the portion of the sheet
blank that is in contact with punch. During later
stages of deformation also, high radial, axial and
hoop strain rate components are developed in
the same portion of blank. But high strain rates
also happen in the portion of the blank that is in
contact with the die. The cumulative axial and
hoop strain components at this stage, appears to
divide the sheet under the punch into bands of
high to low magnitude of strain rates. The shear
strain rate components at all stages of
deformation are higher in the portion of the
sheet blank that is in contact with punch.
References:
[1] Zienkiewicz, O. C. and Zhu, J. Z., “A simple
error estimator and adaptive procedure for
practical engineering analysis”, Int. J. Num.
Meth. Engg.,Vol. 24, 1987, pp. 335-357.
[2] Zienkiewicz, O. C., Boroomand, B. and Zhu, J.
Z., “Recovery Procedures in Error Estimation
and Adaptivity, Part I, Adaptivity in Linear
Problems”, Comm. App. Num. Meth., Vol. 176,
1999, pp. 111-125.
[3] Singh, D., Sekhon, G. S. and Shishodia, K. S.,
“Finite Element Analysis of Metal Forming
Processes With Error Estimation and Adaptive
Mesh Generation”, Proc. of 11th ISME Conf.,
1999, pp. 616-621.
[4] Ahmed, M., Sekhon, G. S. and Singh, D.,
“Optimization of Adaptive Mesh Refinement
During Finite Element Simulation of Sheet
Forming Operations”, Proc. IMPLAST'03, 8Th
International Symposium on Plasticity and
Impact Mechanics, Gupta, N.K., eds., Delhi,
2003, pp 1065-1074.
[5] Selman, A., Meinders, T., Boogaard van den,
A.H. and Huétink, J., “Adaptive Numerical
Analysis of Wrinkling in Sheet Metal
WSEAS TRANSACTIONS on APPLIED and THEORETICAL MECHANICS Mohd. Ahmed
E-ISSN: 2224-3429 93 Volume 10, 2015
Forming”, International journal of forming
processes, 6 (1)., 2003, pp. 87-102.
[6] Cherouat, A., Giraud, M. L., Borouchaki, H.,
Adaptive Refinement procedure For Sheet
metal Forming, Proceedings 9th International
Conference NUMIFORM '07, AIP Conference
Proceedings, Volume 908, 2007, pp. 937-942.
[7] Giraud, M. L., Borouchaki, H., Cherouat, A.,
“Adaptive remeshing for sheet metal forming
in large plastic deformations with damage”, Int.
J. Material Processing (suppl.), 1, 2008, pp.
129-132.
[8] Labergère, C., Rassineux, A. A., Saanouni K.
K., “2D adaptive mesh methodology for the
Simulation of Metal Forming Processes with
Damage”, International Journal of Material
Forming, 4(3), 2011, pp. 317-328.
[9] Ahmed, M., Singh, D., An Adaptive Parametric
Study on Mesh Refinement during Adaptive
Finite Element Simulation of Sheet Forming
Operations, Turkish J. Eng. Env. Sci., 32, 2008,
163-175.
[10] Chung, W., Kim, B., Lee, S., Ryu, H. and Joun,
M. (2014), Finite element simulation of plate or
sheet metal forming process using tetrahedron
MINI-element, J. Mech. Science and
Technology, 28 (1), 2014, pp. 237-243.
[11] Makinouchi, A., "Elastic-Plastic Stress
Analysis of Bending an Hemming of Sheet
Metal Forming Process", Metallurgical Society
Inc., N.M. Wang & S.C. Tang (eds.), 1985, pp.
161-176.\
[12] Oh, S. I. and Kobayashi, S. “Finite Element
Analysis of Plane-strain Sheet Bending”, Int. J.
Mech. Sci., Vol. 22, 1980, pp. 583-594.
[13] Ahmed, M., Sekhon, G. S. and Singh, D.
“Developments in The Finite Element
Simulation of Sheet Metal Forming Processes”,
Defence Science journal, Vol. 55, No. 4, 2005,
pp. 29-42.
[14] Salahouelhadj, A., Abed-Meraim F., Chalal, H.
and T. Balan, (2012) “Application of the
continuum shell finite element SHB8PS to
sheet forming simulation using an extended
large strain anisotropic elastic–plastic
formulation”, Archive of Appl. Mech., Vol. 82,
9, 2012, pp 1269-1290.
[15] Honer, M. E.; Wood, R. D., Finite Element
Analysis of Axisymmetric Deep Drawing
Using A Simple Two-Noded Mindlin in Shell
Element. Numerical Methods for Non-linear
Problems, Pinridge Press, 1987, pp. 440-449.
[16] Li, X. D. and Wiberg, N. E., “A Posteriori
Error Estimate by Element Patch Post-
processing, Adaptive Analysis in energy and
L2 Norms”, Comp. Struct., 53, 4, 1994, pp.
907-919.
WSEAS TRANSACTIONS on APPLIED and THEORETICAL MECHANICS Mohd. Ahmed
E-ISSN: 2224-3429 94 Volume 10, 2015
![2006 [Alves] Development of a General Purpose Nonlinear Solid-shell Element and Its Application to Ani So Tropic Sheet Forming Simulation](https://img.pdfslide.us/doc/110x75/577d1de81a28ab4e1e8d3ec1/2006-alves-development-of-a-general-purpose-nonlinear-solid-shell-element.jpg)