Embed Size (px)
Citation preview

Adaptive extremum-seeking control applied tobioreactorsCitation for published version (APA):Steen, van der, R. (2004). Adaptive extremum-seeking control applied to bioreactors. (DCT rapporten; Vol.2004.049). Eindhoven: Technische Universiteit Eindhoven.
Document status and date:Published: 01/01/2004
Document Version:Publisher’s PDF, also known as Version of Record (includes final page, issue and volume numbers)
Please check the document version of this publication:
• A submitted manuscript is the version of the article upon submission and before peer-review. There can beimportant differences between the submitted version and the official published version of record. Peopleinterested in the research are advised to contact the author for the final version of the publication, or visit theDOI to the publisher's website.• The final author version and the galley proof are versions of the publication after peer review.• The final published version features the final layout of the paper including the volume, issue and pagenumbers.Link to publication
General rightsCopyright and moral rights for the publications made accessible in the public portal are retained by the authors and/or other copyright ownersand it is a condition of accessing publications that users recognise and abide by the legal requirements associated with these rights.
• Users may download and print one copy of any publication from the public portal for the purpose of private study or research. • You may not further distribute the material or use it for any profit-making activity or commercial gain • You may freely distribute the URL identifying the publication in the public portal.
If the publication is distributed under the terms of Article 25fa of the Dutch Copyright Act, indicated by the “Taverne” license above, pleasefollow below link for the End User Agreement:
www.tue.nl/taverne
Take down policyIf you believe that this document breaches copyright please contact us at:
providing details and we will investigate your claim.
Download date: 15. Jan. 2020
Adaptive extremum-seeking control applied to bioreactors
R. van der Steen
DCT 2004.49
Traineeship report
Coach(es): dr. M. Guay
Supervisor: prof. dr. H. Nijmeijer
Technische Universiteit Eindhoven Department Mechanical Engineering Dynamics and Control Group
Eindhoven, April, zoo4
Abstract
Adaptive extremum-seeking controllers are used to handle uncertainties in the modelling of in- dustrial processes. Although these controllers are capable to handle uncertain parameters, an additional persistence of excitation condition is necessary to prove the convergence of these un- known parameters to their true values. If complex non-linear models are used it is not dear how this condition can be fulfilled. In this report the persistence of excitation condition for non-linear models is investigated further. The excitation condition is transformed to a rank condition. The rank condition can be used to compute an input signal that guarantees the fulfillment of the excitation condition. This new strategy is applied to an adaptive extremum-seeking controller for a bioreactor with Haldane ki- netics. Simulation results are provided to show the effectiveness of the proposed approach. In the second part initial results of the application of an adaptive extremum-seeking controller to a fed-batch bioreactor are given and discussed.

Contents
1 Introduction
2 Preliminaries 2.1 Adaptive extremum-seeking control 2.2 Continuous stirred tank bioreac'rors
. . . . 2.3 Different growth models . . . . . . 2.4 Haldane kinetics . . . . . . 2.5 Parametrization
. . . . 2.6 Control and update laws
. . . . 2.7 Parameter convergence . . . . . 2.8 Problem formulation
3 Input signal design 3.1 Matrix representation . . . . . . . . . . . . . .
. . . . . . . . . . . . 3.2 Design of the input signal 3.3 Results . . . . . . . . . . . . . . . . . . 3.4 Different biological processes with Haldane kinetics . . . .
. . . . . . . . . 3.5 Conclusions and recommendations
4 Experiments 4.1 Modified adaptive extremum-seeking controller . . . . . 4.2 Fermentation principle . . . . . . . . . . . . . 4.3 Pseudomonas Putida . . . . . . . . . . . . . . 4.4 Experimental setup . . . . . . . . . . . . . .
. . . . . . . . . . . . . . . . . . . 4.5 Goals . . . . . . . . . . . . . . . . . . 4.6 Results
4.7 Conclusions and recommendations . . . . . . . . .
5 Conclusions and recommendations
A Results for different biological processes with Haldane kinetics A.1 Variation of KI . . . . . . . . . . . . . . . . A.2 Variation of Ks . . . . . . . . . . . . . . . . A.3 Variation of po . . . . . . . . . . . . . . . .
Chapter I
Introduction
In the pharmaceutical and food industry a lot of biological processes are used to produce (parts of) their final products. Fed-batch bioreactors represent a large class of these bioprocesses. One of the issues in the operating of fed-batch bioreactors is to optimize the production of synthesis product or biomass. This results in higher production rates and is therefore economical attrac- tive. However in practice there is still a large uncertainty in the modelling of these processes and therefore the performance can still be further improved. A lot of attention has been paid to de- velop methods which can handle these uncertainties. One of them is adaptive extremum-seeking control. Although this method is capable to handle uncertain parameters in the modelling of the process, an additional persistence of excitation (PE) condition is necessary to prove the conver- gence of these unknown parameters to their true values. For linear systems a lot of literature is available to solve this condition. But when non-linear models are used, it is still poorly under- stood how this condition can be fulfilled. Recent studies [3], [8], with adaptive extremum-seeking controllers for fed-batch bioreactors show promising results once a PE condition is met. The main problem with the PE criteria is that it does guarantee the existence of a suitable input signal. Input signal design remains a vastly unex- plored area in the study of adaptive non-linear systems. In this study, conditions are obtained that guarantee the fulfillment of the PE condition for an adaptive extremum-seeking control system. The conditions are amenable to the design of suitable input signals. In the second part of this study, we review initial results on the application of an extremum- seeking controller to a fed-batch bioreactor.
This report is organized as follows. Chapter 2 provides an introduction to the application of adaptive control to bioreactors. We focus on an adaptive extremum-seeking controller for a biore- actor with Haldane kinetics. The problem of designing an input signal that is sufficiently rich is illustrated by means of an example. We end the chapter with a problem formulation. In Chapter 3 conditions for the design of input signals are derived, which guarantee the fulfillment of the PE criteria. This strategy is implemented in the adaptive extremum-seeking control algorithm. Sim- ulation results are presented to demonstrate the effectiveness of the proposed method. Chapter 4 explains the fermentation principle and a description of the experimental setup is given. The ini- tial results of a fermentation with the extremum-seeking controller are presented and discussed. Finally we end with conclusions and recommendations in chapter 5.
Chapter 2
Preliminaries
2.1 Adaptive extremum-seeking control
The objective of adaptive control is to develop a controller that incorporates a simultaneous esti- mation of the unknown parameters. A wealth of design techniques currently exist for the design of adaptive controllers for the regulation of known setpoints or prespecified reference trajectories. In some applications, the control objective could be to optimize a known objective function, which can be a function of the state variables and some unknown model parameters. Adaptive extremum-seeking techniques have been proposed in the literature to solve this class of problems.
2.2 Continuous stirred tank bioreactors
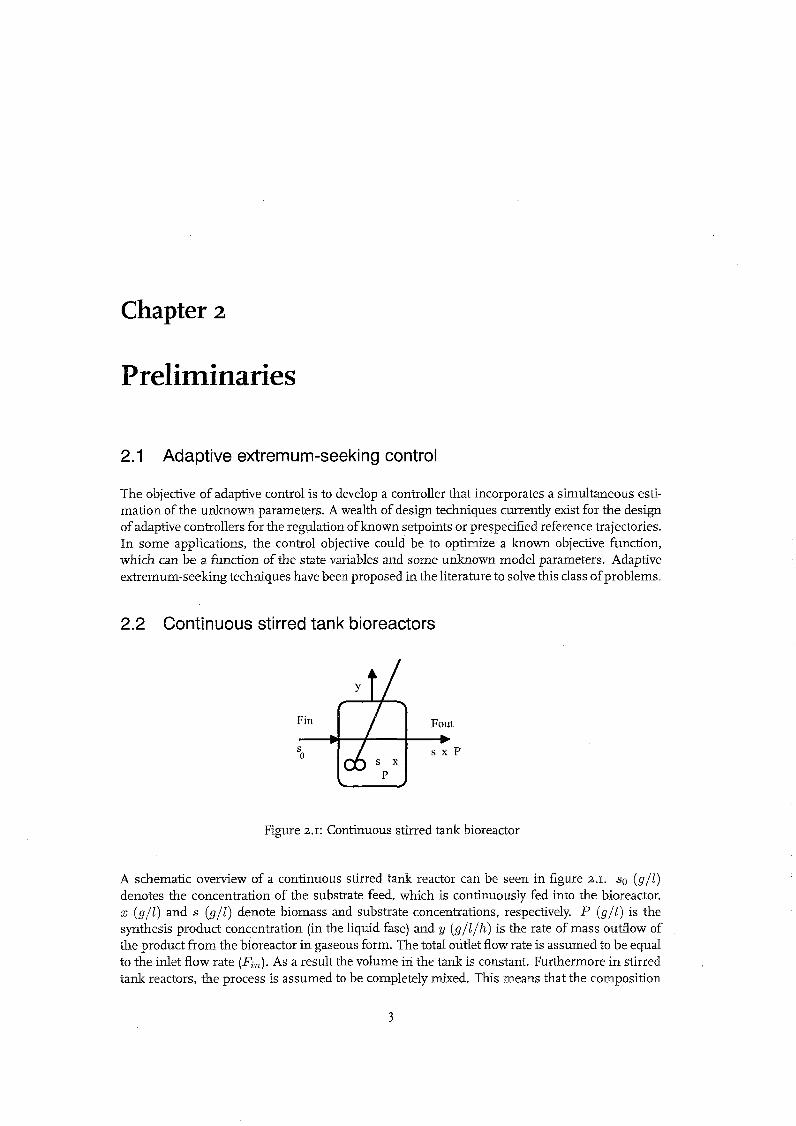
Figure 2.1: Continuous stirred tank bioreactor
A schematic overview of a continuous stirred tank reactor can be seen in figure 2.1. so ( g l l ) denotes the concentration of the substrate feed, which is continuously fed into the bioreactor. x ( g l l ) and s (911) denote biomass and substrate concentrations, respectively. P (911) is the synthesis product concentration (in the liquid fase) and y ( g l l l h ) is the rate of mass outflow of the product from the bioreactor in gaseous form. The total outlet flow rate is assumed to be equal to the inlet flow rate (Fin). As a result the volume in the tank is constant. Furthermore in stirred tank reactors, the process is assumed to be completely mixed. This means that the composition
technische universiteit eindhoven
n -
of the medium is homogeneous in the reactor. The dynamical behavior of the growth of a single population of micro-organisms on one limiting substrate is obtained from mass balances [I] and is given by
where ~ ( x , s ) ( h - l ) is the specific growth rate and u (h - l ) is the dilution rate which represents the ratio between the flow rate and the constant volume in the bioreactor. k l , kz are yield coeffi- cients. In some bioreactor systems, the product concentration in the liquid fase is negligible (P z 0) due to the low solubility of the gas in the liquid. For these systems, the mass balance related to the product in the reactor can be simplified as
and the gaseous outflow rate is then considered to be equal to the production rate. In this report, it is assumed that the production rate is described by equation (2.4).
2.3 Different growth models
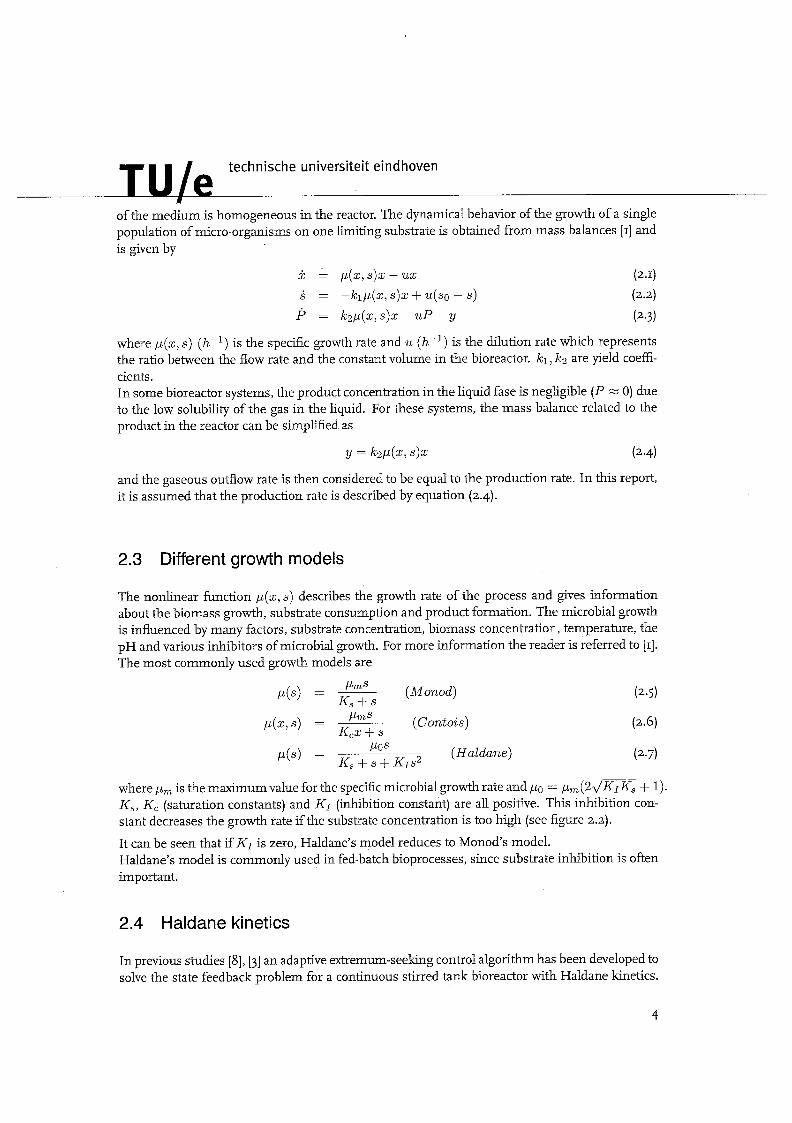
The nonlinear function p(x, s ) describes the growth rate of the process and gives information about the biomass growth, substrate consumption and product formation. The microbial growth is influenced by many factors, substrate concentration, biomass concentration, temperature, the pH and various inhibitors of microbial growth. For more information the reader is referred to [I]. The most commonly used growth models are
PmS ' ( 5 ) = KB+S (Monod)
Po s ' ( ' ) = K, + s + Krs2
(Haldane)
where pm is the maximum value for the specific microbial growth rate and PO = pm ( 2 d m + 1). K,, Kc (saturation constants) and K I (inhibition constant) are all positive. This inhibition con- stant decreases the growth rate if the substrate concentration is too high (see figure 2.2).
It can be seen that if K I is zero, Haldane's model reduces to Monod's modei. Haldane's model is commonly used in fed-batch bioprocesses, since substrate inhibition is often important.
2.4 Haldane kinetics
In previous studies [8], [3] an adaptive extremum-seeking control algorithm has been developed to solve the state feedback problem for a continuous stirred tank bioreactor with Haldane kinetics.
tech.nische universiteit eindhoven
1
Figure 2.2: Specific growth rates according to Monod and Haldane
The problem is solved for the case where only s and y are measurable, the biomass concentration x is not available for feedback control. Basically the procedure of an adaptive extremum-seeking controller involves three steps. First a parametrization of the dynamical model has to be cho- sen. Then a stabilizing controller, which steers the system to the extremum value of the objective function, has to be designed. And the last step involves the updating law to update the parame- ter estimates. This update law should be designed in such a way that the estimated parameters converge to their "true" values. The necessary equations, which will be used in this report, will be given here.
The control objective is to design a controller, u, such that the production rate y achieves its maximum. The dilution rate (u) acts as the input of the system. First the system's equilibria are calculated corresponding to a constant dilution rate u,. There are two equilibria in this case. The first is x, = 0 and s, = so which is called the wash-out equilibrium because the concentration of the micro-organisms is reduced to zero. The second is
The assumption is made that there exists a range of values of the dilution rate u, that yield a positive real value of se < so. At the steady-state, the production rate can be expressed by
and
Solving for se in 8 = 0 yields the optimal steady-state values

technische universiteit eindhoven
1
It is straightforward to show that - < 0. Hence, the system equilibrium, y,(s,), has a global maximum
at s, = s*. Fro-m the above analysis, it is known that if the substrate concentration s can be stabilized at the set-point s*, then the production rate y is maximized.
2.5 Parametrization
K The vector of unknown parameters is Q = [Qi 8, Q,IT with Qi = $, 0, = k, Q,, = e. The
parameter Qk = 2 is assumed to be known. With this parametrization (2.1) and (2.4) can be re-written as
The predicted state i j is generated by
From the definitions of 8, and Qi, the desired set-point (2.10) can be re-expressed as
Since the parameters 8, and Qi are unknown, the controller is designed to drive the substrate concentration s to
8, + eiso (2.17)
that is an estimate of the unknown optimum s*. An excitation signal is injected into the adaptive system such that the estimated parameters 8, and & converge to their true values.
2.6 Control and update laws
The following control and update laws are used 1
U = SO - S
[-kzzs + Oky + a(t) - kdd(t)]
yi (r3u + r4) , if 8, > ci or 8, = E , and (F3u + r4) > 0 8, = otherwise (2.19)
7, (r5u + rs) , if 8, > 6 , or 8, = e, and ( r5u + r6) 2 0 & = { O otherwise (2.20)
if 8, > E@ or 8,, = ep and Q,, > 0 otherwise
technische universiteit eindhoven
#
with
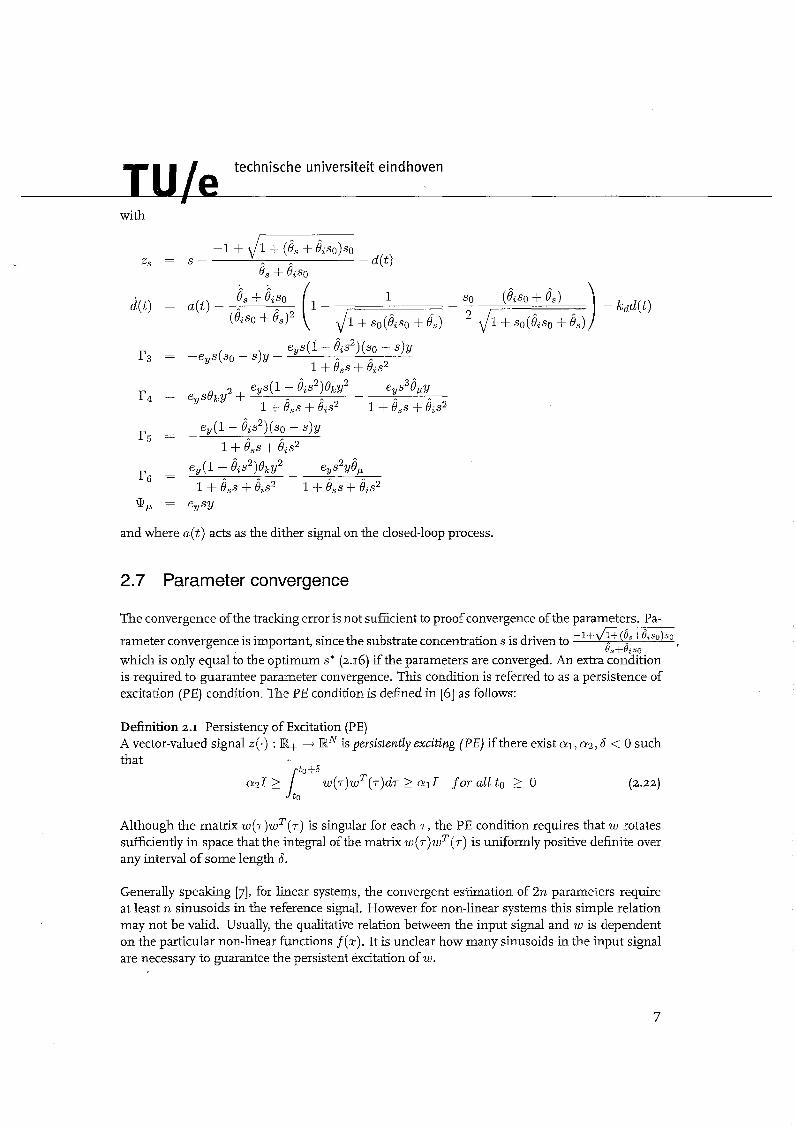
and where a ( t ) acts as the dither signal on the closed-loop process.
2.7 Parameter convergence
The convergence of the tracking error is not sufficient to proof convergence of the parameters. Pa-
rameter convergence is important, since the substrate concentration s is driven to -1+1/1+(8,+8,so)so 8s+8zs0
which is only equal to the optimum s* (2.16) if the parameters are converged. An extra condition is required to guarantee parameter convergence. This condition is referred to as a persistence of excitation (PE) condition. The PE condition is defined in [6] as follows:
Definition 2.1 Persistency of Excitation (PE) A vector-valued signal z( .) : JR+ + JRN is persistently exciting ( P E ) if there exist al, a2,6 < 0 such that
to+ 6
w(r)wT(r)dr > alI for all to 2 0
Although the matrix w(7)wT(r) is singular for each r , the PE condition requires that w rotates sufficiently in space that the integral of the matrix w ( r ) w T ( r ) is unifo-mly positive definite over any interval of some length 6.
Generally speaking [7], for linear systems, the convergent estimation of 2n parameters require at least n sinusoids in the reference signal. However for non-linear systems this simple relation may not be valid. Usually, the qualitative relation between the input signal and w is dependent on the particular non-linear fimctions f (z). It is unclear how many sinusoids in the input signal are necessary to guarantee the persistent excitation of w.
technische universiteit eindhoven
#
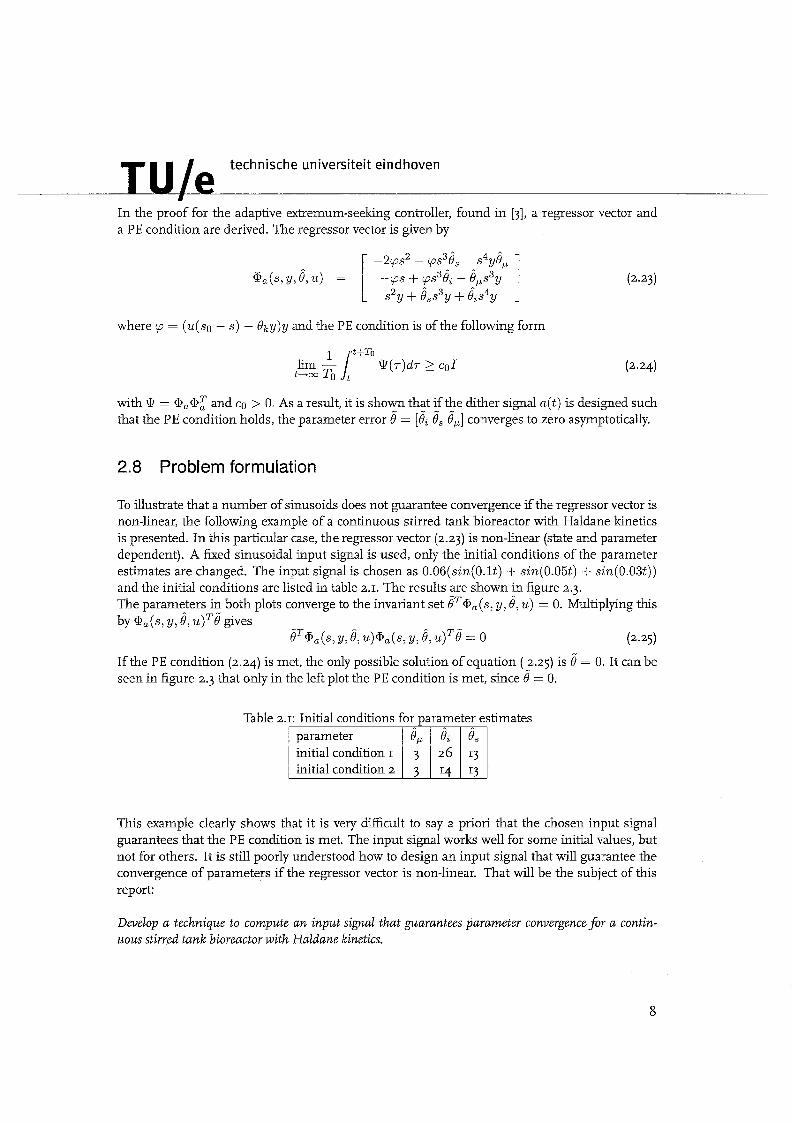
In the proof for the adaptive extremum-seeking controller, found in [3], a regressor vector and a PE condition are derived. The regressor vector is given by
where p = (u (so - s ) - &y)y and the PE condition is of the following form
with Q = a,@; and co > 0. As a result, it is shown that if the dither signal a ( t ) is designed such - - - that the PE condition holds, the parameter error 8 = [Bi 0, 0,] converges to zero asymptotically.
2.8 Problem formulation
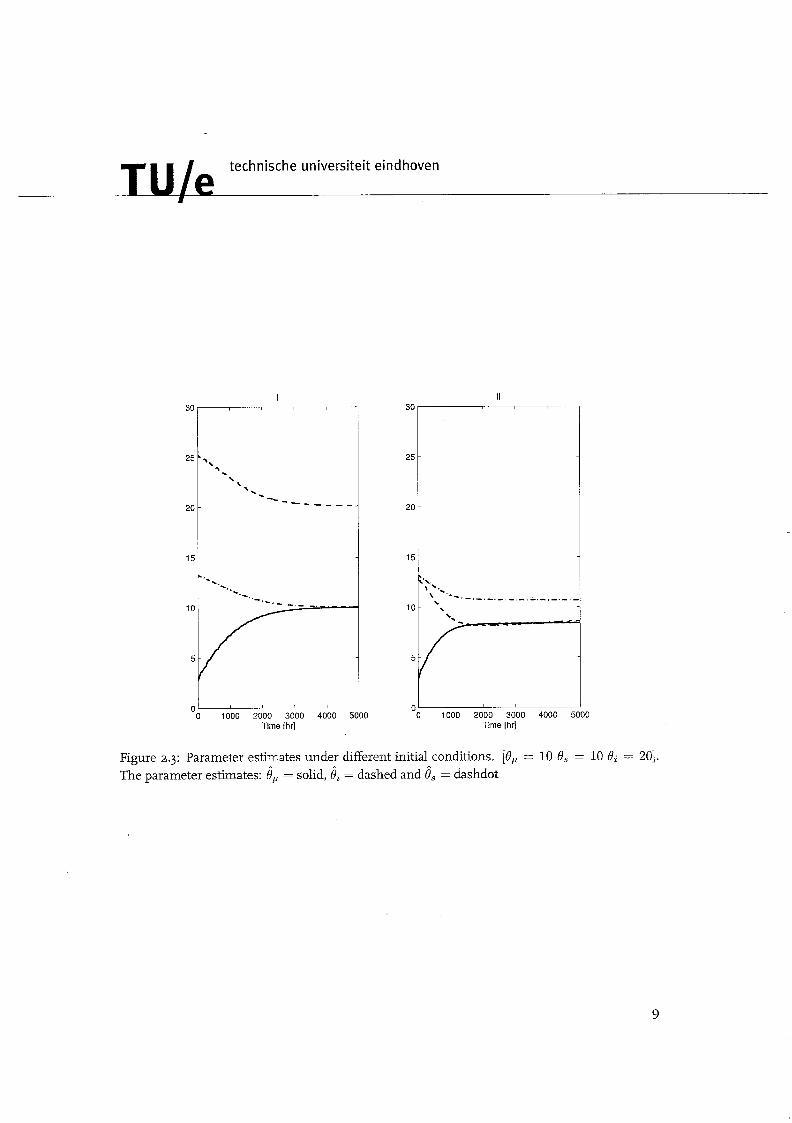
To illustrate that a number of sinusoids does not guarantee convergence if the regressor vector is non-linear, the following example of a continuous stirred tank bioreactor with Haldane linetics is presented. In this particular case, the regressor vector (2.23) is non-linear (state and parameter dependent). A fixed sinusoidal input signal is used, only the initial conditions of the parameter estimates are changed. The input signal is chosen as O.OG(sin(O.lt) + sin(0.05t) -t sin(0.03t)) and the initial conditions are listed in table 2.1. The results are shown in figure 2.3. The parameters in both plots converge to the invariant set gT@,(s, y , 8, u) = 0. Multiplying this by @,(s, y , 8, u ) ~ B " gives
GTaa(s, y, 8, u )a , ( s , y, 8, ~ ) ~ 8 " = o (2.25)
If the PE condition (2.24) is met, the only possible solution of equation ( 2.25) is 8" = 0. It can be seen in figure 2.3 that only in the left plot the PE condition is met, since 8" = 0.
Table 2.1: Initiai conditions for parameter estimates parameter / 0, / Qi I Qs I 1 / initial condition 2 1 3 I 14 1 13 1
This example dearly shows that it is very difficult to say a priori that the chosen input signal guarantees that the PE condition is met. The input signal works well for some initial values, but not for others. It is still poorly understood how to design an input signal that will guarantee the convergence of parameters if the regressor vector is noii-hear. That will be t?se subject of this report:
Develop a technique to compute a n input signal that guarantees parameter convergence for a contin- uous stirred tank bioreactor with Haldane kinetics.
technische universiteit eindhoven
1
0- C 0 1000 2000 3000 4000 5000
Time [hr] 1000 2000 3000 4000 5000
Time [hr]
Figure 2.3: Parameter estimates under different initial conditions. [O/, = 10 0, = 10 Oi = 201. The parameter estimates: 8, = solid, = dashed and 8, = dashdot
Chapter 3
Input signal design
The following idea is proposed to solve the PE criteria. The non-linear regressor vector @ will be differentiated with respect of time, n - 1 times, where n is the number of unknown parameters. With these n vectors the following matrix can be constructed
If this matrix (3.1) has full rank then the regressor vector rotates sufficiently in space. This property means that the integral of @aT d l be positive definite over an interval as required for the PE condition. So the PE condition can be replaced with a rank condition. This rank condition provides a condition for the input signal. It has to be computed in such a way that T has full rank. a s approach, which is different then in [z], [5], will be used to solve the parameter convergence of the continuous stirred tank bioreactor with Haldane kinetics.
3.1 Matrix representation
For the adaptive extremum seeking control with Haldane kinetics, the PE condition is such that it is evaluated at t -+ co (2.24). The regressor vector (2.23) can also be evaluated at t + co [8]. As shown in [3], the parameters converge to a constant value, and therefore the derivatives of the estimated parameters are zero. Based on Lyapunov theory it is also shown that
lim z, = lim ey = 0. t-rn t+m (3.2)
This means that asymptotically, the derivative of the substrate concentration S (2.13) converges to d = a ( t ) - kdd(t) . Define a = a ( t ) - kdd(t) and p = a y . Then the regressor vector can be written as:
technische universiteit eindhoven
1
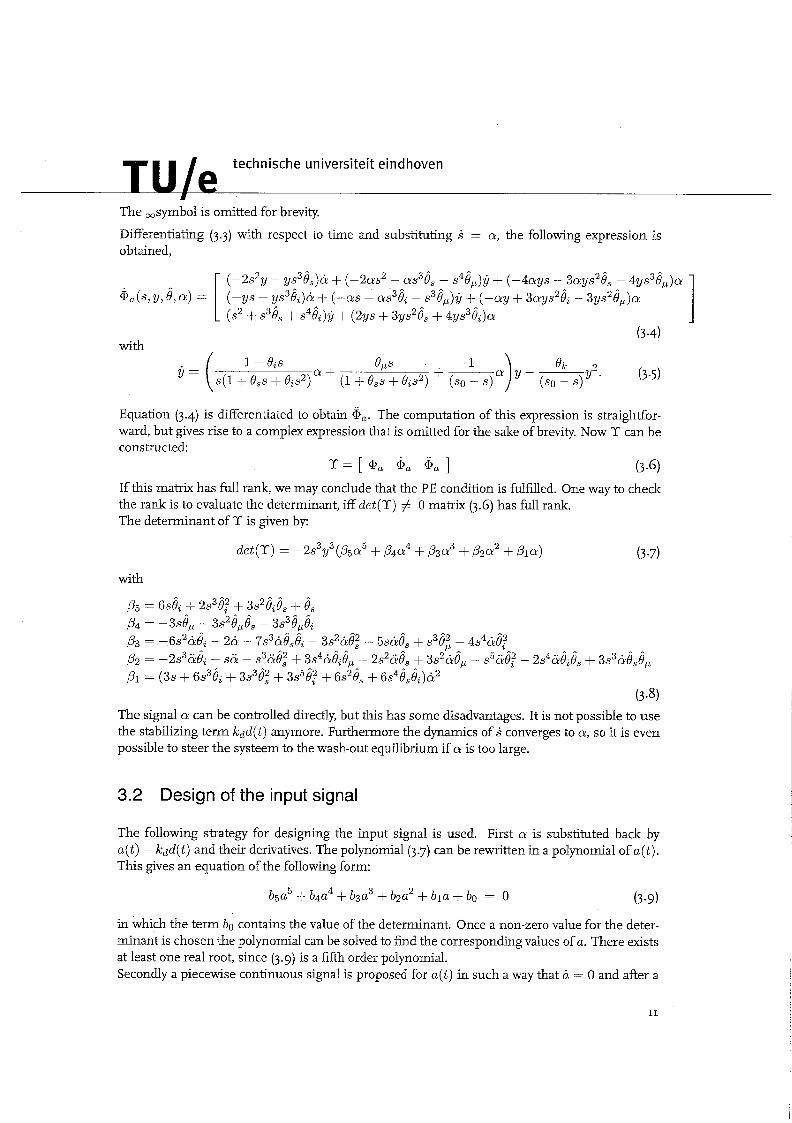
The ,symbol is omitted for brevity.
Differentiating (3.3) with respect to time and substituting S = a, the following expression is obtained,
Equation (3.4) is differentiated to obtain &,. The computation of this expression is straightfor- ward, but gives rise to a complex expression that is omitted for the sake of brevity. Now Y can be constructed:
Y = [ @, 6, 6, ] (3.6)
If this matrix has full rank, we may conclude that the PE condition is fulfilled. One way to check the rank is to evaluate the determinant, iff det(Y) # 0 matrix (3.6) has full rank. The determinant of Y is given by:
with
BE, = 6.4 + 2s3@ + 3s2&eS + 8, A A
pq = - 3 4 - 3 ~ ~ 9 ~ 8 , - 3s38& p3 = -6s2&ei - 2& - 7s3&8,& - 3s2&@ - 5s&gs + s38z - 4s4&@ ,. ,. P2 = -2s36Bi - ~6 - s368,2 + 3s4&%.% - 2 .~~68 , + 3s2&Bp - s5ii.ij: - 2s4&iiB, + 3.$&8 8 8 P
= (3s + 6s3ei + 3.~~852 + 3s58p + 6s2OS + 6s48s6i)&2
(3.8) The signal a can be controlled directly, but this has some disadvantages. It is not possible to use the stabilizing term kdd(t) anymore. Furthermore the dynamics of S converges to a, so it is even possible to steer the systeem to the wash-out equilibrium if a is too large.
3.2 Design of the input signal
The following strategy for designing the input signal is used. First a is substituted back by a(t) - kdd(t) and their derivatives. The polynomial (3.7) can be rewritten in a polynomial of a(t). This gives an equation of the following form:
in which the term bo contains the value of the determinant. Once a non-zero value for the deter- minant is chosen the polynomial can be solved to find the corresponding values of a. There exists at least one real root, since (3.9) is a fifth order polynomial. Secondly a piecewise continuous signal is proposed for a(t) in such a way that a = 0 and after a

technische universiteit eindhoven
H
timestep d t , the sign of a ( t ) is changed for the next timestep. This guarantees that the net change a( t ) of d ( t ) is zero for every two timesteps. Note that d ( t ) will converge to at t + m.
The value of a ( t ) will be bounded, since it still can steer the system to the wash-out equilibrium.
3.3 Results
In table 3.1 all used parameters for the simulations are listed. The Haldane parameter values and yield coefficients are based on experimental conditions determined in [g]. Further there are three
.I: Model, design par Model parameters Value
Ks 0.1
neters and initial sta Design parameters Value
k,o 2 0
k , 0.01
72 I 0 0
7s 5 0 ?'P 2 0
E 0.2
s used in simulations
variables ( k d , d t and the value of the determinant (D) ) that have to be chosen. The value kd is set to 10 and D to -75. The value of a ( t ) is bounded inside the interval [-I, 11. With the specific value of D the calculated signal a ( t ) is essentially bounded in this interval. In the simulation study the timestep d t is changed to verify the influence of different timesteps. It can be seen in
Figure 3.1: Parameter convergence with dt = 16 hours. [Q, = 10 Qi = 20 8, = 101, e, = solid, ii = dashed and 8, = dashdot

technische universiteit eindhoven
D Parameter estimates
Figure 3.2: Parameter convergence with dt = 4 hours. [Q, = 10 Qi = 20 0, = 101, 8, = solid, bi = dashed and 8, = dashdot
Tme [hr]
Figure 3.3: Parameter convergence with dt = 0.5 hours. 10, = 10 Oi = 20 8, = 101, 8, = solid, ii = dashed and 8, = dashdot
figures 3.1, 3.2 and 3.3 that the larger tirnestep reduces the speed of the respons of gi, while the responses of 8, and 8, are not really influenced. The value of kd determines the steady state value of d ( t ) and thus the actual fluctuation of the desired set-point that has to be tracked. If kd is large then the system will not feel much of the excitation. This is confirmed by taking a very large value of kd (see figure 3.4). It can be seen that the parameters do not converge. In general, we set kd to 5 to improve the convergence rate in

technische universiteit eindhoven
1
further simulations.
Figure 3.4: Parameter convergence with kd = 100, dt = 4 hours. [0, = 10 Qi = 20 0, = 101, 8, = solid, gi = dashed and 8, = dashdot
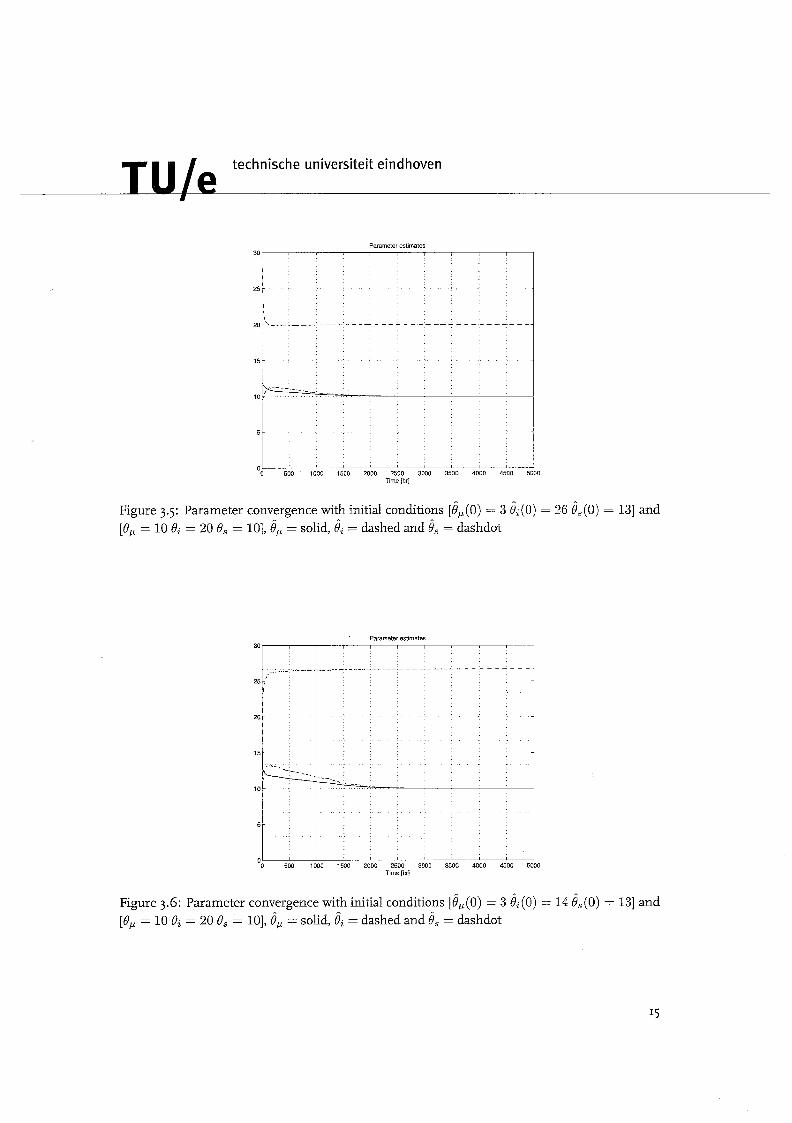
Next, random values for dt and D are used. The value of D is generated by a random distribution in the interval [-IS -101 and dt is generated by a random distribution in the interval 10.3 1.31 hours. This interval is chosen slightly larger than the time constant and the settling time of the differen- tial equation for d ( t ) . The signal a ( t ) is set to zero if the lower or upper bound is hit. This causes that a(t) remains inside the bound. The initial conditions are talcen as in table 2.1 to compare the results with the sinusoidal input (figures 3.5.3.6). It can be seen that the parameters converge for both initial conditions.
3.4 Different biological processes with Haldane kinetics
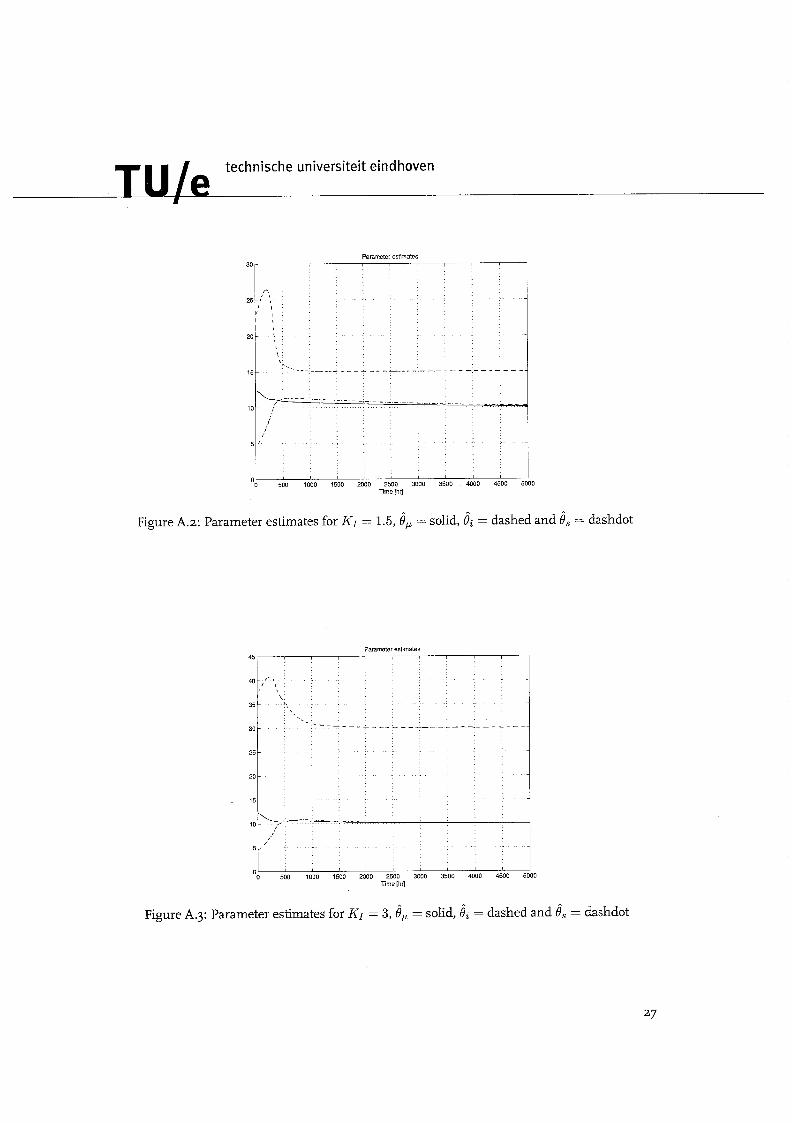
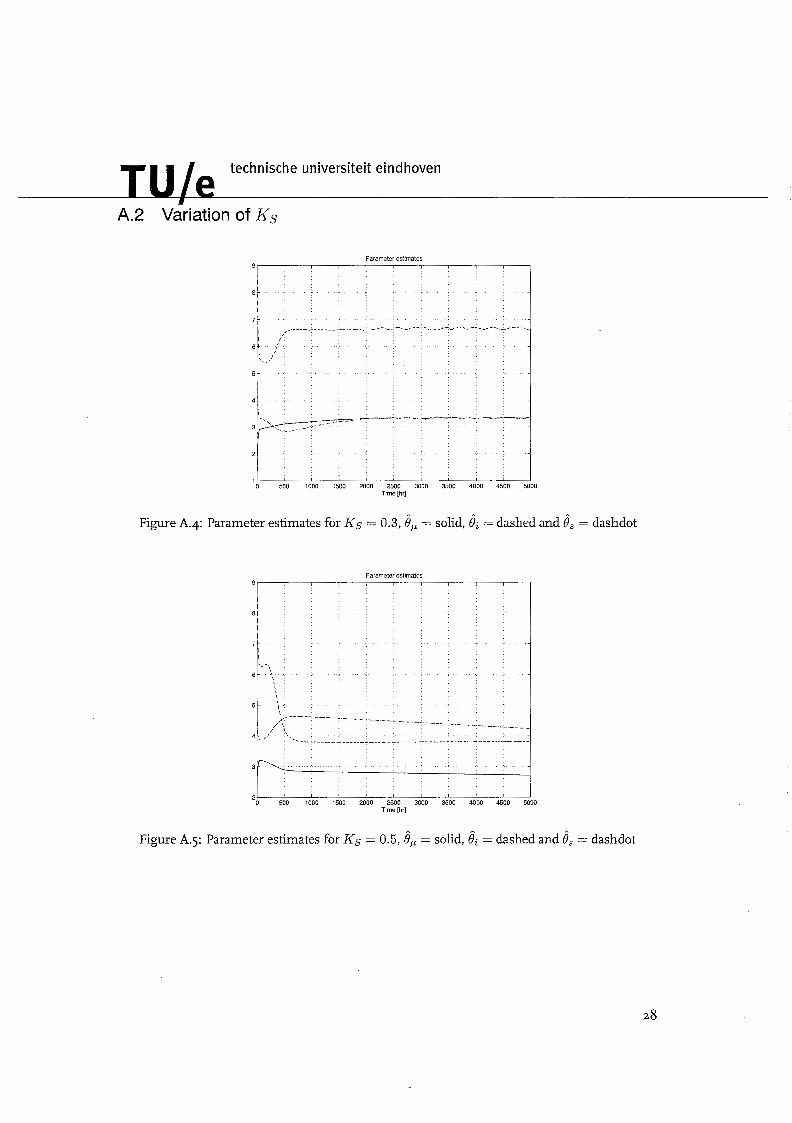
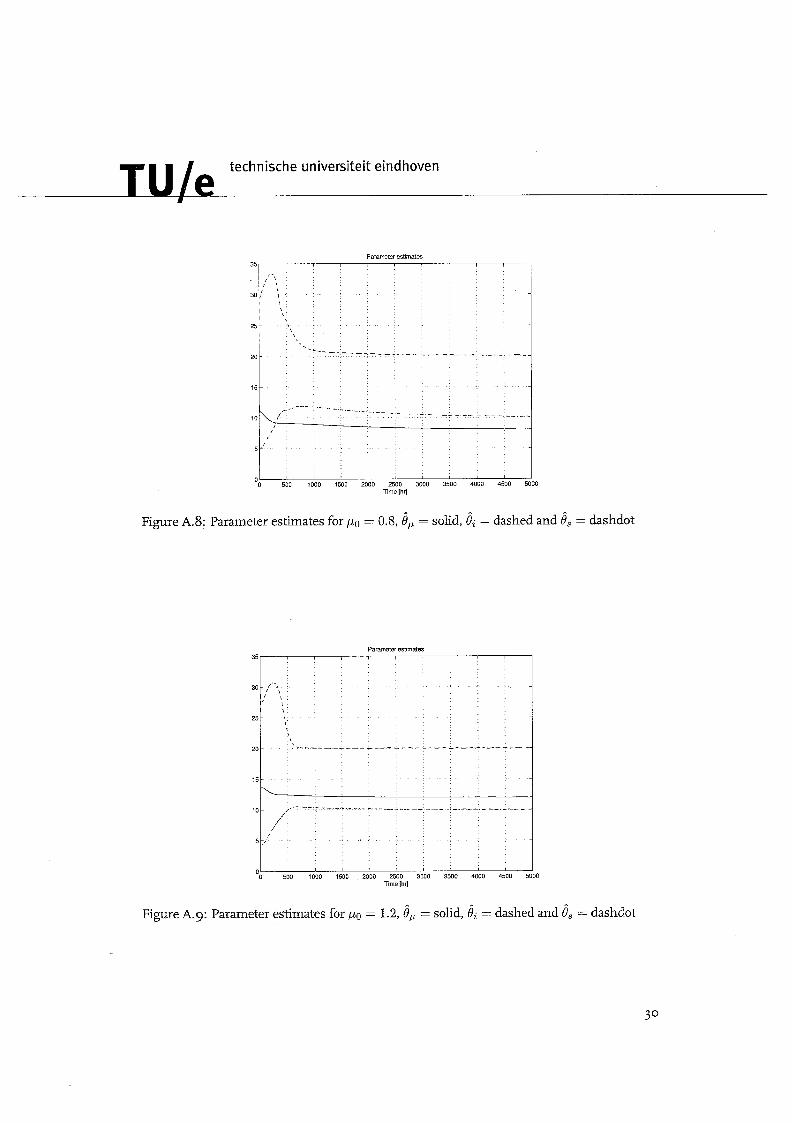
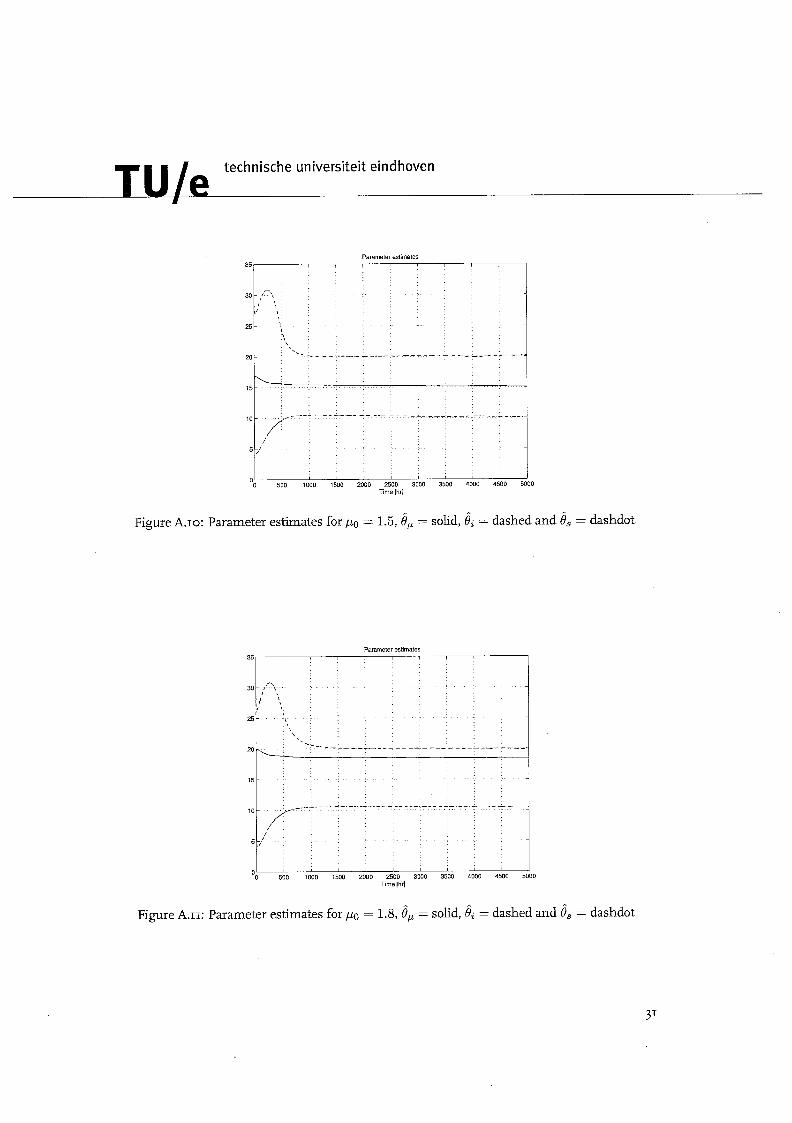
The next step is to apply this technique to other systems, without changing the algorithm, to see if it can be applied if there is no knowledge of the parameter values at all. First the inhibition constant KI is changed. The value of KI is varied in the interval [13]. In all cases the parameters converge to their true values. However, the convergence rate is faster for larger values of KI , see appendix A. Secondly the saturation constant Ks is changed to 0.3 and 0.5. This has the most influence on the parameter convergence. The parameters only converge when the variation of Ks is small. At last po is changed in the interval [o.j 1.81. The variation on p has less influence on the convergence than Ks.
technische universiteit eindhoven
1
Parameter estimates
Figure 3.5: Parameter convergence with initial conditions [8, (0) = 3 8i (0) = 26 8, (0) = 131 and [Q, = 10 Oi = 20 8, = 10],8, = solid, & = dashed and 8, = dashdot
Parameter estimates
Figure 3.6: Parameter convergence with initial conditions [8,(0) = 3 &(0) = 14 8,(0) = 131 and [O, = 10 Qi = 20 6, = 10],8, = solid, ii = dashed and 8, = dashdot

technische universiteit eindhoven
#
3.5 ~6nclusions and recommendations
Simulation results show that the developed technique gives promising results. The parameters converge from different initial conditions. The rate of convergence of the parameters can be influenced by the different variables. It provides better results then an arbitrary chosen sinusoidal input. The relationship between the convergence of the parameters and the value of the variables is not yet fully understood. When the system parameters change, it is uncertain wether the parameter estimates converge or not. This is probably due to the fact that there exist optimal values of D and dt for every different system depending on the time constant of that specific system. These variables can be used in an optimization process, to introduce minimal, but sufficient, disruption in the system. Further the ratio of the eigenvalues, as discussed in [g], of 'Y' (3.6) may play a role in the convergence rate as well. This problem remains to be investigated further.
Chapter 4
Experiments
To validate theoretical results an experimental setup is available. With this setup it is possible to control a fermentation process. An adaptive extremum-seeking controller is used to maximize the biomass concentration in the fermenter. However due to limitations on the setup some modifications are necessary.
4.1 Modified adaptive extremum-seeking controller
The developed strategy in chapter 3 is not yet implemented on the experimental setup. The con- troller needs both states, gas outflow and substrate concentration, to compute the control input u (2.18). With the current setup it is not possible to measure the substrate concentration on- line. The measurement ofthe ( 2 0 2 % (Zlmin) outflow, converted to a Carbon dioxide Production Rate (CPR (gl lh)) , is the only on-line measurement y. To overcome this problem an output feed- back adaptive extremum-seeking controller, presented in [4], is implemented on the experimental setup. This controller is based on Monod kinetics (2.5) instead of Haldane kinetics. As a result inhibition by the substrate concentration is not modelled. The vector of unknown parameters for this case is given by 0 = [0, 9,IT with 0, = &, 0, = g. Equation (2.13) remains the same, while equation (2.14) reduces to
y = o P s 2 ~ - 0ky2 + ( S O - S)UY
s ( l+ e , ~ ) - uY
A reduced order observer ? = -oky f u(so - 2 )
is used to estimate the substrate concentration in the bioreactor. The output feedback dynamics k,, 8, and 8, are written in the following matrix form
where
technische universiteit eindhoven
I
Based on Lyapunov theory it is proved that Z + 0 when t -+ cm. When Z = 0, the dynamics reduce to the state feedback dynamics
where
I @ s ( ~ ) Y 4!'( 'J4~
-5y (I+o,s)(~+~^,s) ( I + Q ~ S ) ( ~ + ~ , S ) ~ S @ S ( W Y A(t)= --
l+%ss 0 0 I (4.6)
~ ! ' @ L ' ~ Y
l+Oss 0 0
This means that the performance achieved under output feedback recovers the performance un- der state feedback as t + a. Further the persistence of excitation condition has to be satisfied at t -+ cm to e n s u e that the parameters converge to their true values asymptotically.
4.2 Fermentation principle
A fermentation is based on the principle of growing micro-organisms in order to produce a stable product. The fermentation can be decomposed into three different steps.
0 The lag phase: The beginning of the fermentation. There is no net change of the cells concentration. The cells are adjusting to the new environment in the ferrnenter.
Exponential phase: The cells are growing at an exponential rate.
0 The stationary phase: No change of the cells concentration, the lysis product can no longer support new cell growth.
The adaptive extremum-seeking controller will be activated after the lag phase. When the ex- ponential phase starts, the controller will attempt to steer the system to the highest possible production rate for this specific batch.
4.3 Pseudomonas Putida
The micro-organism used in the experiments is Pseudomonas Putida. This micro-organism is able to produce medium-chain-length poly(3-hydroxyalkanoate) (MCL-PHA). MCL-PHA is a com- mercially available biodegradable polymer. P.Putida is usually grown on a cheap carbon source such as glucose. Once the population enters the stationary phase, the carbon source is repiaced by nonanoic acid, as well as limited nutrients (i.e. ammonium as nitrogen source or phosphate). Nonanoic acid has a long carbon chain, neces- sary for the production of PHA. In this situation, the micro-organism which are nutrient deprived will actively convert the carbon source to PHA as storage. Then the PHA can be extracted from the micro-organism.
technische universiteit eindhoven
E
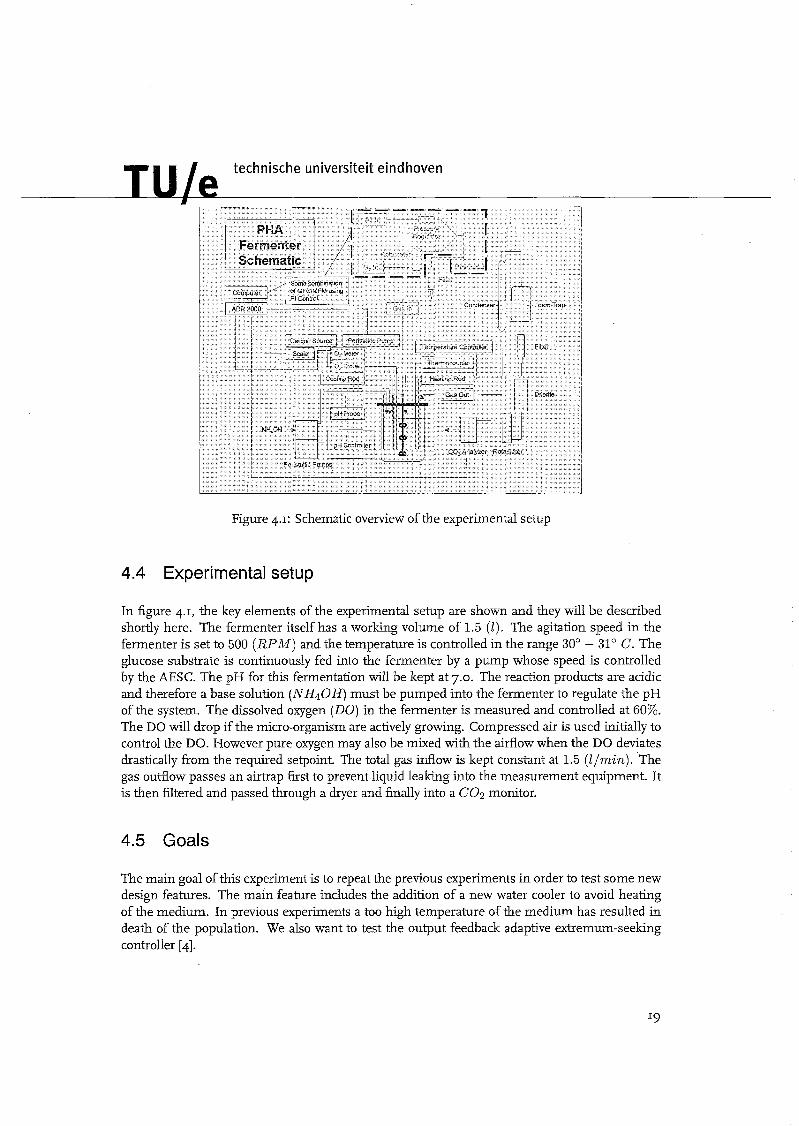
Figure 4.1: Schematic overview of the experimental setup
4.4 Experimental setup
In figure 4.1, the key elements of the experimental setup are shown and they d l be described shortly here. The ferrnenter itself has a working volume of 1.5 (1). The agitation speed in the ferrnenter is set to 500 (RPM) and the temperature is controlled in the range 30" - 31" C. The glucose substrate is continuously fed into the fermenter by a pump whose speed is controlled by the AESC. The pH for this fermentation will be kept at 7.0. The reaction products are acidic and therefore a base solution (NH40H) must be pumped into the fermenter to regulate the pH of the system. The dissolved oxygen (DO) in the fermenter is measured and controlled at 60%. The DO will drop if the micro-organism are actively growing. Compressed air is used initially to control the DO. However pure oxygen may also be mixed with the airflow when the DO deviates drastically from the required setpoint. The total gas inflow is kept constant at 1.5 (llmin). The gas outflow passes an airtrap first to prevent liquid leaking into the measurement equipment. It is then filtered and passed through a dryer and finally into a COz monitor.
4.5 Goals
The main goai of this experiment is to repeat the previous experiments in order to test some new design features. The main feature includes the addition of a new water cooler to avoid heating of the medium. In previous experiments a too high temperature of the medium has resulted in death of the population. We also want to test the output feedback adaptive extremum-seeking controller [4].
technische universiteit eindhoven
n
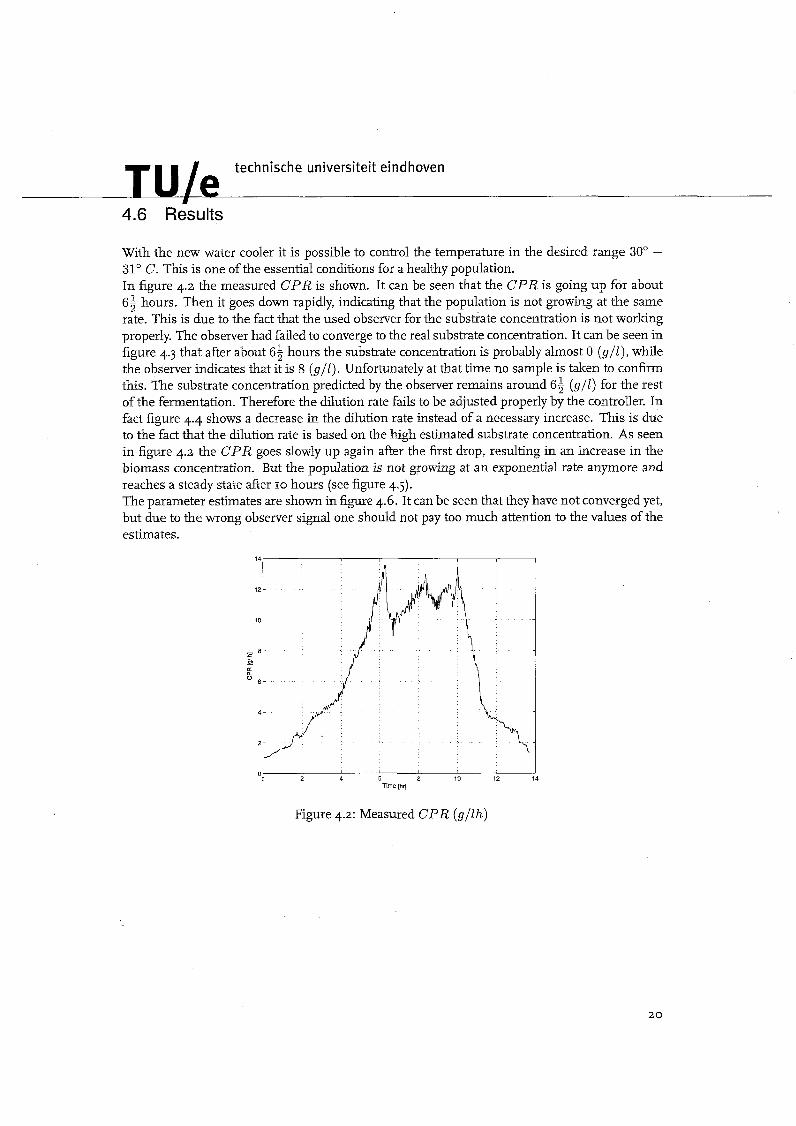
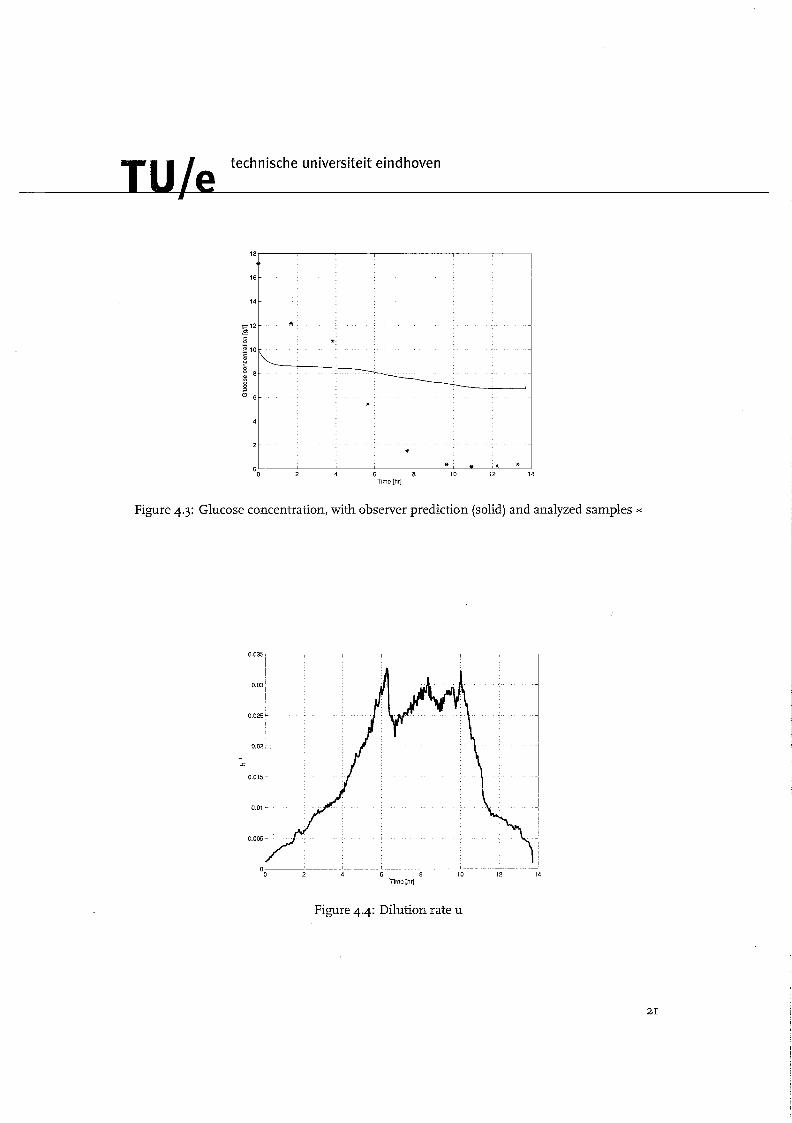
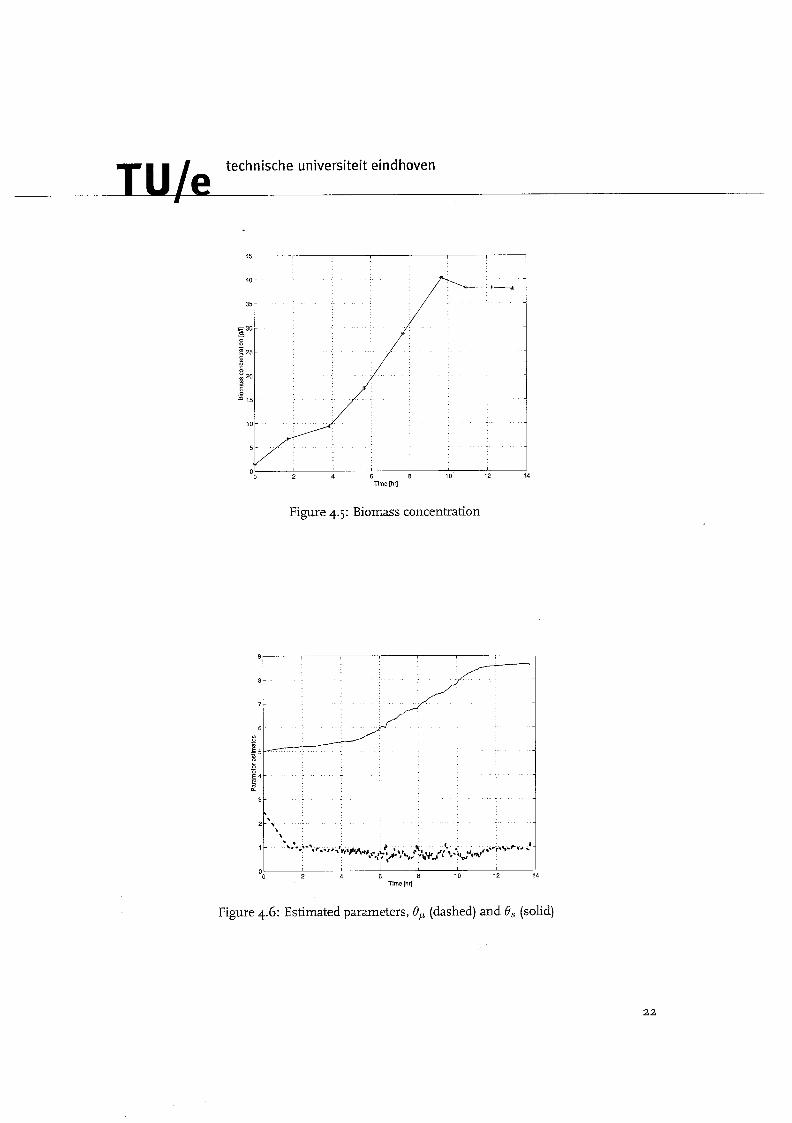
With the new water cooler it is possible to control the temperature in the desired range 30" - 31" C. This is one of the essential conditions for a healthy population. In figure 4.2 the measured CPR is shown. It can be seen that the CPR is going up for about 6 i hours. Then it goes down rapidly, indicating that the population is not growing at the same rate. This is due to the fact that the used observer for the substrate concentration is not working properly. The observer had failed to converge to the real substrate concentration. It can be seen in figure 4.3 that after about 6; hours the substrate concentration is probably almost 0 ( g l l ) , while the observer indicates that it is 8 ( g l l ) . Unfortunately at that time no sample is taken to confirm this. The substrate concentration predicted by the observer remains around 6; ( g l l ) for the rest of the fermentation. Therefore the dilution rate fails to be adjusted properly by the controller. In fact figure 4.4 shows a decrease in the dilution rate instead of a necessary increase. This is due to the fact that the dilution rate is based on the high estimated substrate concentration. As seen in figure 4.2 the CPR goes slowly up again after the first drop, resulting in an increase in the biomass concentration. But the population is not growing at an exponential rate anymore and reaches a steady state after 10 hours (see figure 4.5). The parameter estimates are shown in figure 4.6. It can be seen that they have not converged yet, but due to the wrong observer signal one should not pay too much attention to the values of the estimates.
1 2 14: +
L 8
ime [hr]
Figure 4.2: Measured CPR ( g / l h )
Glu
cose
con
cent
ratio
n l~
lll
technische universiteit eindhoven
1
4 6 8 Time [hr]
Figure 4.5: Biomass concentration
Figure 4.6: Estimated parameters, 0, (dashed) and 8, (solid)
technische universiteit eindhoven
rn
4.7 ~onclusions and recommendations
Based on the data of the experiment it can be concluded that overheating of the medium did not occur during this experiment. The beginning of the fermentation shows the behavior as seen in simulation results. However this is due to the fact that there are enough nutrients for a small population, problems occur when the population grows exponentially for a period of time. The substrate concentration becomes too low and the 'dilution rate is not increased properly due to the poor choice of observer. As a result the microbial population, which starves, cannot grow sub- stantially Little can be said about the adaptation of the parameters, since the updates are based on wrong information.
For future experiments a modification of the observer is necessary. The convergence rate has to increase. Based on figure 4.3 the observer has to converge after about G hours before the sub- strate concentration drops near zero. The developed method in chapter 3 for the input signal can easily transformed for Monod kinetics which may improve the parameter convergence. Finally an output feedback adaptive extremum-seeking controller for Haldane kinetics has to be designed and implemented on the experimental setup.
Chapter 5
Conclusions and recommendations
In adaptive control problems a PE condition has to be fulfilled before parameter convergence is guaranteed. When non-linear models are used no general method is available that guarantees the satisfaction of the PE condition. In the first part the PE condition for an adaptive extremum- seeking controller, applied to a continuous stirred tank bioreactor with Haldane kinetics, is in- vestigated. Parameter convergence is important in this case, since the optimal setpoint depends on the unknown parameters. A new method to compute an input signal that guarantees fulfill- ment of the PE condition is developed. This is done by transforming the PE condition into a rank condition. This rank condition is used to compute the input signal. The input signal is based on information from the current states and parameter estimates instead of a fixed a priori chosen input signal. Simulation results show the performance of the proposed method. This method is capable of handling different initial conditions for the parameter estimates and small variations of the Haldane lunetics as well. The rate of convergence of the parameters can be influenced. Overall it provides better results then an arbitrary chosen sinusoidal input.
The relationship between the convergence of the parameters and the value of the variables, used in the new method, is not yet fully understood. When the system parameters change, it is uncer- tain wether the parameter estimates converge or not. This is probably due to the fact that there exist optimal values for the variables for every different system depending on the time constant of that specific system. These variables can be used in an optimization process, to introduce minimal, but sufficient, disruption in the system. Further the ratio of the eigenvalues of T (3.6) may play a role in the convergence rate as well. This problem remains to be investigated further.
The second part describes the initial results obtained by an experiment with a continuous stirred tank bioreactor. An output feedback adaptive extremum-seeking controller is used for the exper- iment. The goal of the experiment is to test the controller and a new water cooler. Based on the data of the experiment it can be concluded &at overheating of the medium did not occur anymore during this experiment. The beginning of the fermentation shows the behavior as seen in simulation results. However, problems occur when the population grows exponentially for a period of time. The substrate concentration becomes too low and the dilution rate is not increased properly due to the poor performance of the observer for the substrate concentration. As a result the microbial population cannot grow substantially. Little can be said about the adaptation of the parameters, since the
technische universiteit eindhoven
1
updates are based on wrong information.
For future experiments a modification of the reduced order observer is necessary. The conver- gence rate has to increase. The new developed method for computing the input signal can easiiy transformed for Monod kinetics which may improve the parameter convergence. Finally an output feedback adaptive extremum-seeking controller for Haldane kinetics has to be designed and implemented on the experimental setup..
Appendix A
Results for different biological processes with Haldane kinetics
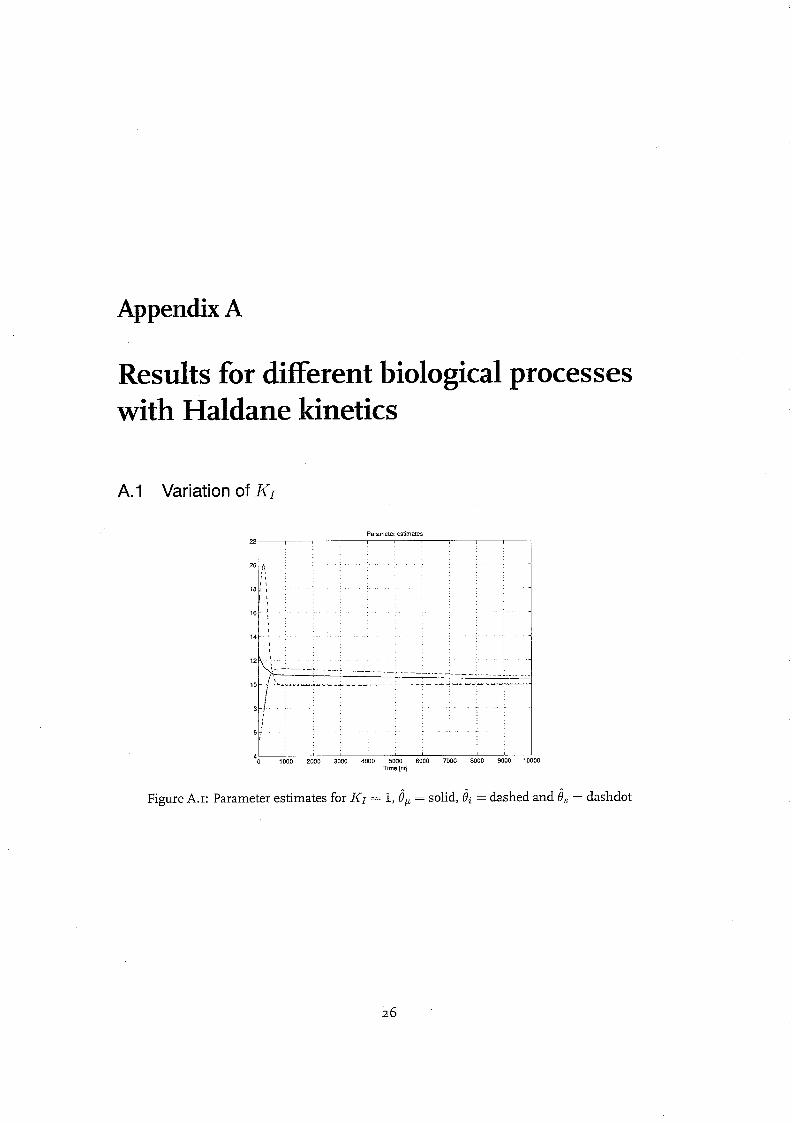
A.1 Variation of KI
Figure A.1: Parameter estimates for KI = 1,8, = solid, ii = dashed and 8, = dashdot
technische universiteit eindhoven
J
Parameter estimates
Figure A.2: Parameter estimates for KI = 1.5, 8, = solid, 8, = dashed and 8, = dashdot
Figure A.3: Parameter estimates for KI = 3,8, = solid, gi = dashed and 8, = dashdot
technische universiteit eindhoven
m
A.2 variation of Ks
Figure A 4 Parameter estimates for Ks = 0.3, 8, = solid, 8, = dashed and 8, = dashdot
Parameter estimates
Figure A.5: Parameter estimates for Ks = @ . 5 , 6 , = solid, 8, = dashed and 6, = dashdot

technische universiteit eindhoven
1
A.3 variation of po
Figure A.G: Parameter estimates for po = 0.3,8, = solid, bi = dashed and 8, = dashdot
-
L 'OOC
Figure A.7: Parameter estimates for po = 0.5,8, = solid, 8, = dashed and 8, = dashdot
technische universiteit eindhoven
1
Figure A.8: Parameter estimates for po = 0.8, 0, = solid, Qi = dashed and 8, = dashdot
Parameter estimates
Figure
Tme [hr]
Parameter estimates for po = 1.2,8, = solid, & = dashed and dashdot
technische universiteit eindhoven
1
Parameter estimates
- - - - -
- - - - - - - - - --- -. - -.- --
I 1500 2000 2500 3000 : Time [hrl
Figure A.10: Parameter estimates for ,LQ = 1.5, ijP = solid, Bi = dashed and 8, = dashdot
Figure A.rr: Parameter estimates for po = 1.8,8, = solid, Gi = dashed and 6, = dashdot

Bibliography
[I] G. Bastin and D. Dochain. On-line Estimation and Adaptive Control of Bioreactors. Elsevier, Amsterdam, 1990.
[2] A. Loria, E. Panteley, D. Popovic, and A. Teel. Persistency of excitation for uniform conver- gence in nonlinear control systems.
[3] N.I. Marcos. Applications of the adaptive extremum seeking control techniques to bioreactor systems. MSc thesis, Queen's University, zoo).
[4] N.I. Marcos, M. Guay, and D. Dochain. Output feedback adaptive extremum seeking con- trol of a continuous stirred tank bioreactor with monod's kinetics. Joumal $Process Control, (accepted), 20 04.
[s] E. Panteley, A. Loria, and A. Teel. Relaxed persistency of excitation for uniform asymptotic stability. IEEE Trans. on Automat. Contr., 46 (12):1874-1886,2001.
[GI S. Sastry. Nonlinear Systems, Analysis, Stability, and Control. Springer-Verlag, New York, 1999.
[7] J. J.E. Slotine and W. Li. Applied non-linear control. Prentice Hd, Englewood Cliffs, New Jersey,
1991.
[8] M. Titica, D. Dochain, and M. Guay. Adaptive extremum-seeking control of fed-batch biore- actors. EuropeanJoumal of control, 9614-627, zoo).
[g] H. Wang, M. Krstic, and G. Bastin. Optimizing bioreactors by extremum seeking. Int. Journal Adaptive Control and Signal Processing, 13:651-669,1999.


![Extremum Seeking Control: Convergence Analysis · extremum seeking as one of the most promising adaptive control methods [1, Section 13.3]. There are two main approaches to extremum](https://img.pdfslide.us/doc/110x75/5e1ecc5cc0fc09187723051d/extremum-seeking-control-convergence-analysis-extremum-seeking-as-one-of-the-most.jpg)