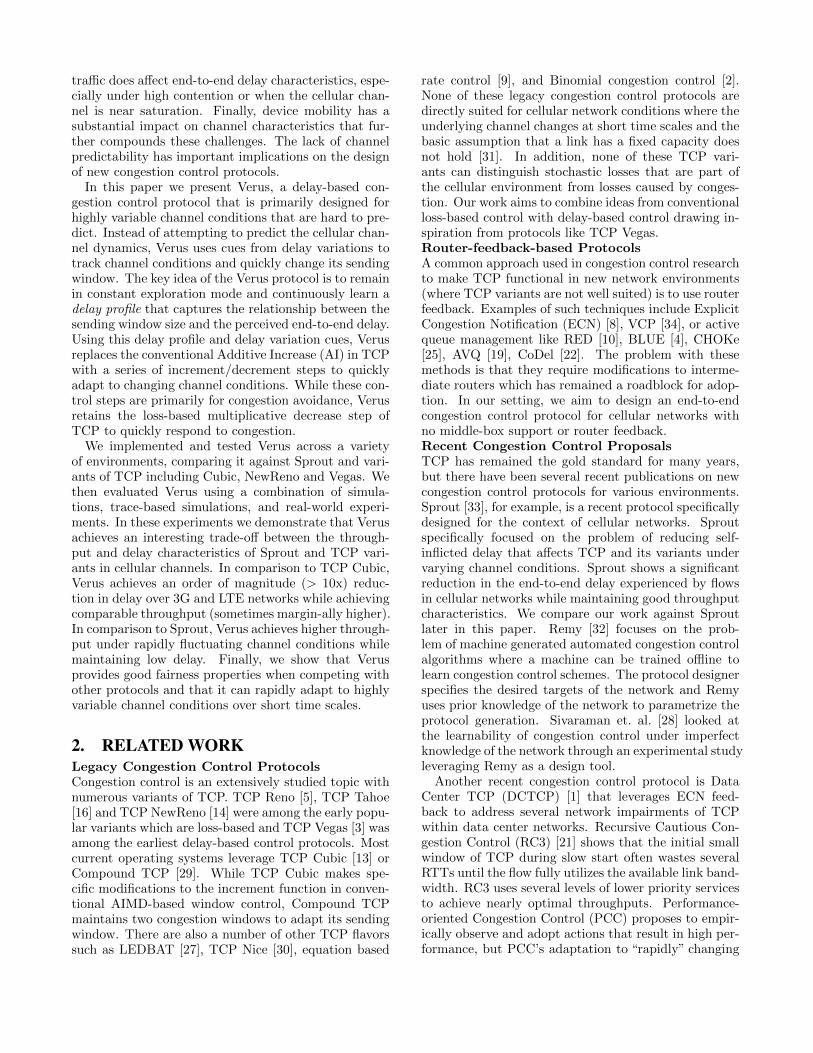
Embed Size (px)
Citation preview
Adaptive Congestion Control for UnpredictableCellular Networks
Yasir ZakiNYU Abu DhabiAbu Dhabi, UAE
Thomas PötschUniversity of BremenBremen, Germany
Jay ChenNYU Abu DhabiAbu Dhabi, UAE
SubramanianNYU and CTEDNew York, USA
Carmelita GörgUniversity of BremenBremen, [email protected]
bremen.de
ABSTRACTLegacy congestion controls including TCP and its vari-ants are known to perform poorly over cellular net-works due to highly variable capacities over short timescales, self-inflicted packet delays, and packet losses un-related to congestion. To cope with these challenges, wepresent Verus, an end-to-end congestion control proto-col that uses delay measurements to react quickly tothe capacity changes in cellular networks without ex-plicitly attempting to predict the cellular channel dy-namics. The key idea of Verus is to continuously learna delay profile that captures the relationship betweenend-to-end packet delay and outstanding window sizeover short epochs and uses this relationship to incre-ment or decrement the window size based on the ob-served short-term packet delay variations. While thedelay-based control is primarily for congestion avoid-ance, Verus uses standard TCP features including mul-tiplicative decrease upon packet loss and slow start.
Through a combination of simulations, empirical eval-uations using cellular network traces, and real-worldevaluations against standard TCP flavors and state ofthe art protocols like Sprout, we show that Verus out-performs these protocols in cellular channels. In com-parison to TCP Cubic, Verus achieves an order of mag-nitude (> 10x) reduction in delay over 3G and LTE net-works while achieving comparable throughput (some-
Permission to make digital or hard copies of all or part of this work for personalor classroom use is granted without fee provided that copies are not made ordistributed for profit or commercial advantage and that copies bear this noticeand the full citation on the first page. Copyrights for components of this workowned by others than ACM must be honored. Abstracting with credit is per-mitted. To copy otherwise, or republish, to post on servers or to redistribute tolists, requires prior specific permission and/or a fee. Request permissions [email protected].
SIGCOMM ’15, August 17 - 21, 2015, London, United Kingdomc© 2015 ACM. ISBN 978-1-4503-3542-3/15/08. . . $15.00
DOI: http://dx.doi.org/10.1145/2785956.2787498
times marginally higher). In comparison to Sprout,Verus achieves up to 30% higher throughput in rapidlychanging cellular networks.
CCS Concepts•Networks → Network protocol design; Trans-port protocols; Network performance analysis;
KeywordsCongestion control, Cellular network, Transport proto-col, Delay-based
1. INTRODUCTIONCellular network channels are highly variable and users
often experience fluctuations in their radio link ratesover short time scales due to scarce radio resources mak-ing these channels hard to predict [26, 20, 7]. TCP andits variants are known to perform poorly over cellularnetworks due to high capacity variability, self-inflictedqueuing delays, stochastic packet losses that are notlinked to congestion, and large bandwidth-delay prod-ucts [15, 32, 33].
Three specific characteristics directly impact the un-predictability of cellular channels. First, the state ofa cellular channel between a mobile device and a basestation undergoes several complex state transitions thataffect channel availability in short time scales [15]; thisintroduces variability in the underlying channel. Sec-ond, the frame scheduling algorithms used in cellularnetworks cause burstiness in the cellular channel. Basedon real-world cellular measurements, we observe thatthe typical traffic characteristics at a receiver are bursty(even for smooth sending patterns) with variable burstsizes and burst inter-arrival periods. Third, while priorwork has considered only self-inflicted queuing delay asa cause for high delays [33], we find that competing
traffic does affect end-to-end delay characteristics, espe-cially under high contention or when the cellular chan-nel is near saturation. Finally, device mobility has asubstantial impact on channel characteristics that fur-ther compounds these challenges. The lack of channelpredictability has important implications on the designof new congestion control protocols.
In this paper we present Verus, a delay-based con-gestion control protocol that is primarily designed forhighly variable channel conditions that are hard to pre-dict. Instead of attempting to predict the cellular chan-nel dynamics, Verus uses cues from delay variations totrack channel conditions and quickly change its sendingwindow. The key idea of the Verus protocol is to remainin constant exploration mode and continuously learn adelay profile that captures the relationship between thesending window size and the perceived end-to-end delay.Using this delay profile and delay variation cues, Verusreplaces the conventional Additive Increase (AI) in TCPwith a series of increment/decrement steps to quicklyadapt to changing channel conditions. While these con-trol steps are primarily for congestion avoidance, Verusretains the loss-based multiplicative decrease step ofTCP to quickly respond to congestion.
We implemented and tested Verus across a varietyof environments, comparing it against Sprout and vari-ants of TCP including Cubic, NewReno and Vegas. Wethen evaluated Verus using a combination of simula-tions, trace-based simulations, and real-world experi-ments. In these experiments we demonstrate that Verusachieves an interesting trade-off between the through-put and delay characteristics of Sprout and TCP vari-ants in cellular channels. In comparison to TCP Cubic,Verus achieves an order of magnitude (> 10x) reduc-tion in delay over 3G and LTE networks while achievingcomparable throughput (sometimes margin-ally higher).In comparison to Sprout, Verus achieves higher through-put under rapidly fluctuating channel conditions whilemaintaining low delay. Finally, we show that Verusprovides good fairness properties when competing withother protocols and that it can rapidly adapt to highlyvariable channel conditions over short time scales.
2. RELATED WORKLegacy Congestion Control ProtocolsCongestion control is an extensively studied topic withnumerous variants of TCP. TCP Reno [5], TCP Tahoe[16] and TCP NewReno [14] were among the early popu-lar variants which are loss-based and TCP Vegas [3] wasamong the earliest delay-based control protocols. Mostcurrent operating systems leverage TCP Cubic [13] orCompound TCP [29]. While TCP Cubic makes spe-cific modifications to the increment function in conven-tional AIMD-based window control, Compound TCPmaintains two congestion windows to adapt its sendingwindow. There are also a number of other TCP flavorssuch as LEDBAT [27], TCP Nice [30], equation based
rate control [9], and Binomial congestion control [2].None of these legacy congestion control protocols aredirectly suited for cellular network conditions where theunderlying channel changes at short time scales and thebasic assumption that a link has a fixed capacity doesnot hold [31]. In addition, none of these TCP vari-ants can distinguish stochastic losses that are part ofthe cellular environment from losses caused by conges-tion. Our work aims to combine ideas from conventionalloss-based control with delay-based control drawing in-spiration from protocols like TCP Vegas.Router-feedback-based ProtocolsA common approach used in congestion control researchto make TCP functional in new network environments(where TCP variants are not well suited) is to use routerfeedback. Examples of such techniques include ExplicitCongestion Notification (ECN) [8], VCP [34], or activequeue management like RED [10], BLUE [4], CHOKe[25], AVQ [19], CoDel [22]. The problem with thesemethods is that they require modifications to interme-diate routers which has remained a roadblock for adop-tion. In our setting, we aim to design an end-to-endcongestion control protocol for cellular networks withno middle-box support or router feedback.Recent Congestion Control ProposalsTCP has remained the gold standard for many years,but there have been several recent publications on newcongestion control protocols for various environments.Sprout [33], for example, is a recent protocol specificallydesigned for the context of cellular networks. Sproutspecifically focused on the problem of reducing self-inflicted delay that affects TCP and its variants undervarying channel conditions. Sprout shows a significantreduction in the end-to-end delay experienced by flowsin cellular networks while maintaining good throughputcharacteristics. We compare our work against Sproutlater in this paper. Remy [32] focuses on the prob-lem of machine generated automated congestion controlalgorithms where a machine can be trained offline tolearn congestion control schemes. The protocol designerspecifies the desired targets of the network and Remyuses prior knowledge of the network to parametrize theprotocol generation. Sivaraman et. al. [28] looked atthe learnability of congestion control under imperfectknowledge of the network through an experimental studyleveraging Remy as a design tool.
Another recent congestion control protocol is DataCenter TCP (DCTCP) [1] that leverages ECN feed-back to address several network impairments of TCPwithin data center networks. Recursive Cautious Con-gestion Control (RC3) [21] shows that the initial smallwindow of TCP during slow start often wastes severalRTTs until the flow fully utilizes the available link band-width. RC3 uses several levels of lower priority servicesto achieve nearly optimal throughputs. Performance-oriented Congestion Control (PCC) proposes to empir-ically observe and adopt actions that result in high per-formance, but PCC’s adaptation to “rapidly” changing
networks is on the order of seconds and does not con-sider unpredictable fluctuations on the order of millisec-onds that occur in cellular networks [6].Cellular PerformanceSeveral measurement studies have examined TCP per-formance problems in cellular networks. Cellular net-works tend to over-dimension their buffers by using largebuffers at base stations to smooth the overall flow oftraffic. As a result, conventional congestion controlprotocols result in “buffer-bloats” [12] and multi-seconddelays. Jiang et. al. [18] have shown the severity ofbufferbloats through extensive measurements done on3G and LTE commercial networks. The authors of [23]run long-term measurements to investigate the end-to-end performance of mobile devices within and across awide range of carriers (i.e., 100), using 11 cellular net-work access technologies. Their results show that thereare significant performance differences across carriers,access technologies, geographic regions and time. Zakiet. al. [35] conclude similar observations on cellular net-works in developing regions as well as developed regions.Huang et. al. [15] studied the effect of network protocolson 3G and LTE networks by means of active and passivemeasurements. They discovered that TCP connectionsover LTE have various inefficiencies such as slow start.In comparison to 3G networks, LTE shows lower delayswhile many TCP connections (∼52%) under-utilize theavailable bandwidth of LTE.
3. CHANNEL UNPREDICTABILITYThe physical properties of radio propagation such as
path-loss and slow-fading eventually cause changes inlink performance despite mitigation techniques. As a re-sult, cellular channels fluctuate rapidly over short timescales (milliseconds) and change more dramatically overslightly longer time scales (seconds). The inherent un-predictability of radio propagation along with the com-plex interactions between cellular networking compo-nents makes it difficult for simple channel predictionmodels to track channel variations and thus they moti-vate adaptive exploration protocols like Verus.
We present results from several experiments on com-mercial 3G/UMTS and LTE networks to highlight theseissues. We make three specific observations:• Burst scheduling: Typical traffic characteris-
tics observed at a receiver are highly bursty withvariable burst sizes and burst inter-arrival periods.Mobility further amplifies these characteristics.• Competing traffic: When two or more flows con-
tend for radio resources and their sending ratesapproach network capacity, we observe cross-flowdependencies.• Channel unpredictability: Standard prediction
mechanisms even using the most recent samplesare far from capturing the bursty behavior of thechannel.
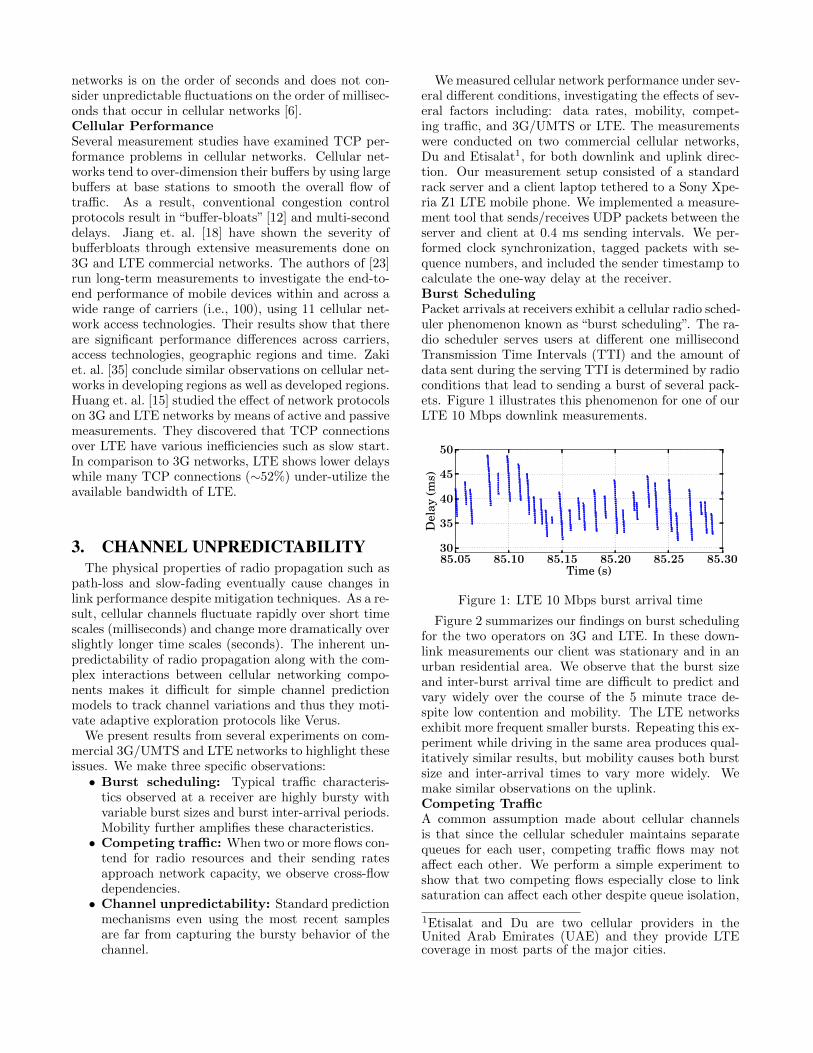
We measured cellular network performance under sev-eral different conditions, investigating the effects of sev-eral factors including: data rates, mobility, compet-ing traffic, and 3G/UMTS or LTE. The measurementswere conducted on two commercial cellular networks,Du and Etisalat1, for both downlink and uplink direc-tion. Our measurement setup consisted of a standardrack server and a client laptop tethered to a Sony Xpe-ria Z1 LTE mobile phone. We implemented a measure-ment tool that sends/receives UDP packets between theserver and client at 0.4 ms sending intervals. We per-formed clock synchronization, tagged packets with se-quence numbers, and included the sender timestamp tocalculate the one-way delay at the receiver.Burst SchedulingPacket arrivals at receivers exhibit a cellular radio sched-uler phenomenon known as “burst scheduling”. The ra-dio scheduler serves users at different one millisecondTransmission Time Intervals (TTI) and the amount ofdata sent during the serving TTI is determined by radioconditions that lead to sending a burst of several pack-ets. Figure 1 illustrates this phenomenon for one of ourLTE 10 Mbps downlink measurements.
85.05 85.10 85.15 85.20 85.25 85.30Time (s)
30
35
40
45
50
Del
ay(m
s)
Figure 1: LTE 10 Mbps burst arrival time
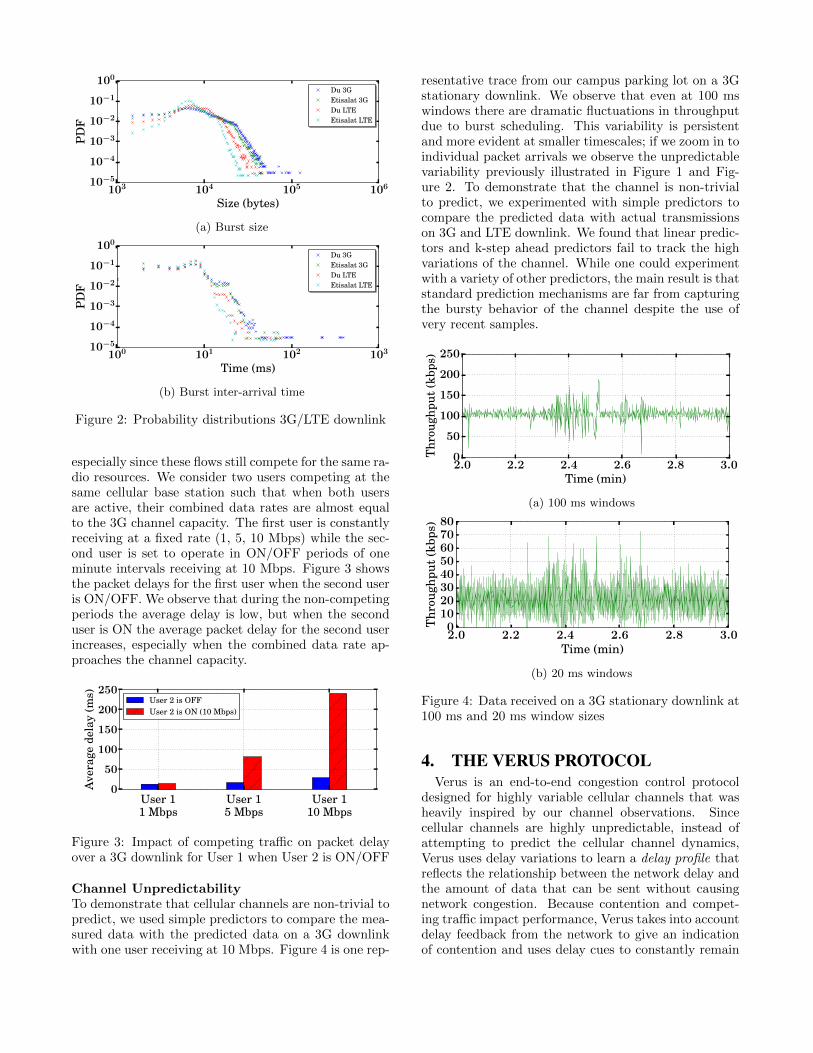
Figure 2 summarizes our findings on burst schedulingfor the two operators on 3G and LTE. In these down-link measurements our client was stationary and in anurban residential area. We observe that the burst sizeand inter-burst arrival time are difficult to predict andvary widely over the course of the 5 minute trace de-spite low contention and mobility. The LTE networksexhibit more frequent smaller bursts. Repeating this ex-periment while driving in the same area produces qual-itatively similar results, but mobility causes both burstsize and inter-arrival times to vary more widely. Wemake similar observations on the uplink.Competing TrafficA common assumption made about cellular channelsis that since the cellular scheduler maintains separatequeues for each user, competing traffic flows may notaffect each other. We perform a simple experiment toshow that two competing flows especially close to linksaturation can affect each other despite queue isolation,
1Etisalat and Du are two cellular providers in theUnited Arab Emirates (UAE) and they provide LTEcoverage in most parts of the major cities.
103 104 105 106
Size (bytes)
10−5
10−4
10−3
10−2
10−1
100P
DF
Du 3GEtisalat 3GDu LTEEtisalat LTE
(a) Burst size
100 101 102 103
Time (ms)
10−5
10−4
10−3
10−2
10−1
100
PD
F
Du 3GEtisalat 3GDu LTEEtisalat LTE
(b) Burst inter-arrival time
Figure 2: Probability distributions 3G/LTE downlink
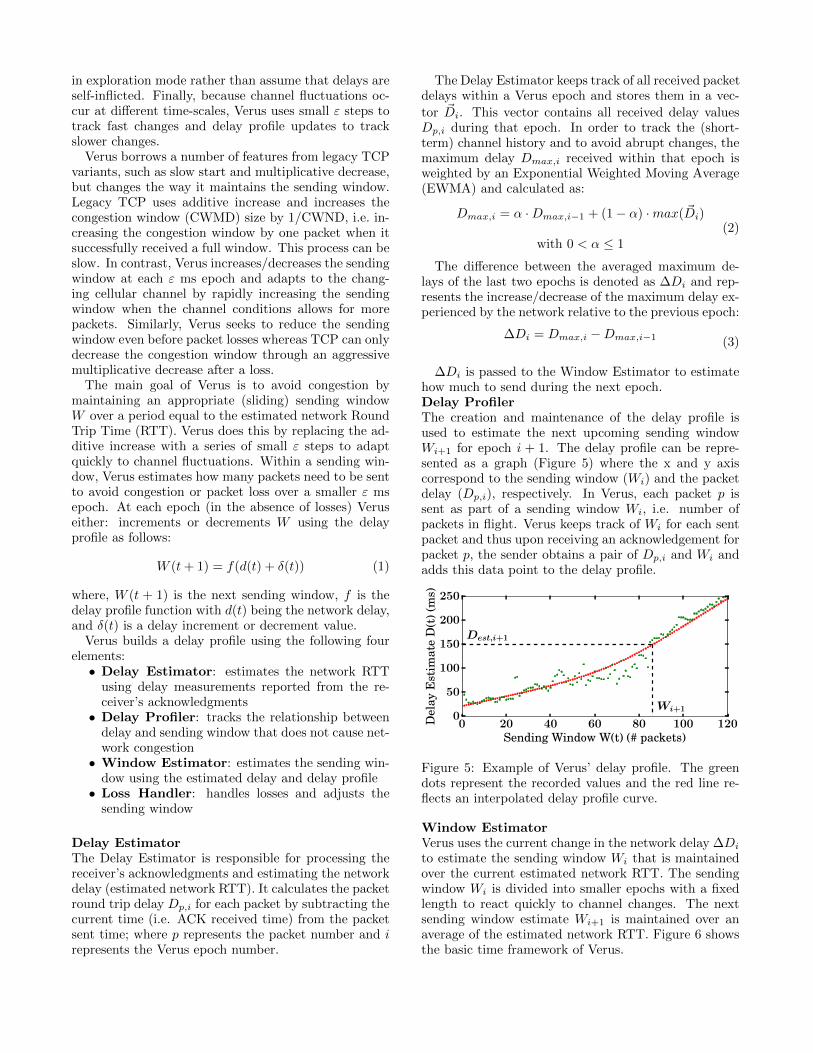
especially since these flows still compete for the same ra-dio resources. We consider two users competing at thesame cellular base station such that when both usersare active, their combined data rates are almost equalto the 3G channel capacity. The first user is constantlyreceiving at a fixed rate (1, 5, 10 Mbps) while the sec-ond user is set to operate in ON/OFF periods of oneminute intervals receiving at 10 Mbps. Figure 3 showsthe packet delays for the first user when the second useris ON/OFF. We observe that during the non-competingperiods the average delay is low, but when the seconduser is ON the average packet delay for the second userincreases, especially when the combined data rate ap-proaches the channel capacity.
User 11 Mbps
User 15 Mbps
User 110 Mbps
0
50
100
150
200
250
Ave
rage
dela
y(m
s) User 2 is OFFUser 2 is ON (10 Mbps)
Figure 3: Impact of competing traffic on packet delayover a 3G downlink for User 1 when User 2 is ON/OFF
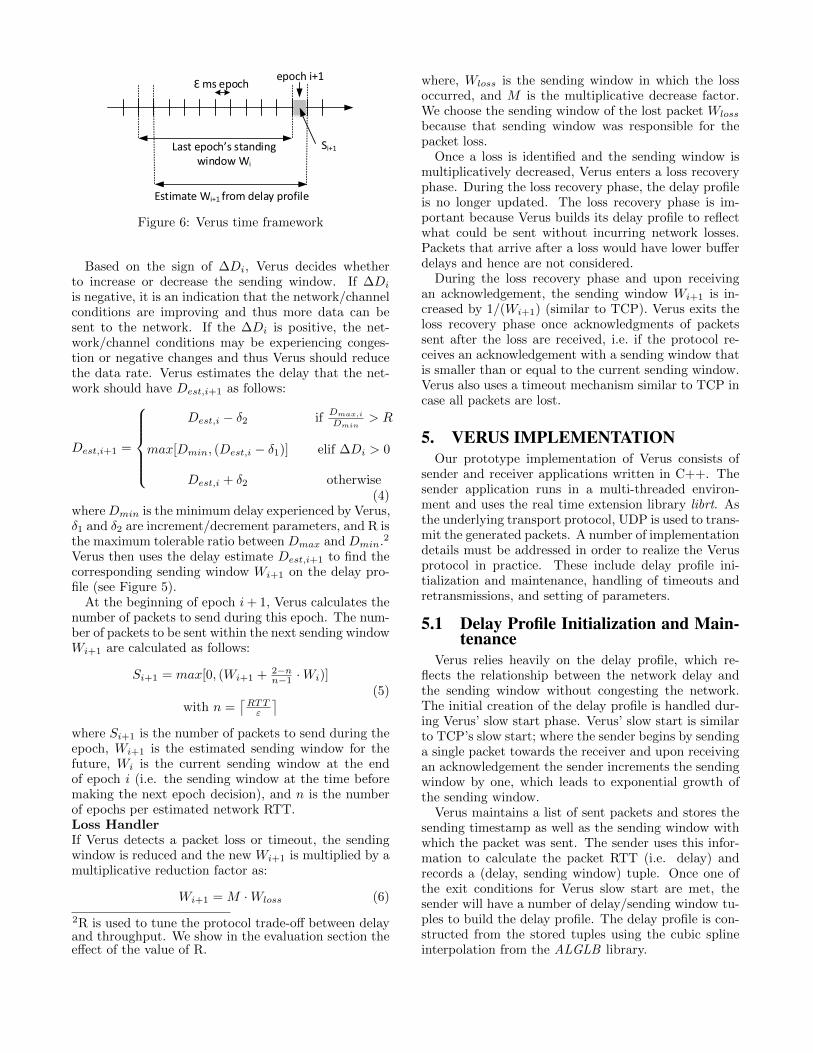
Channel UnpredictabilityTo demonstrate that cellular channels are non-trivial topredict, we used simple predictors to compare the mea-sured data with the predicted data on a 3G downlinkwith one user receiving at 10 Mbps. Figure 4 is one rep-
resentative trace from our campus parking lot on a 3Gstationary downlink. We observe that even at 100 mswindows there are dramatic fluctuations in throughputdue to burst scheduling. This variability is persistentand more evident at smaller timescales; if we zoom in toindividual packet arrivals we observe the unpredictablevariability previously illustrated in Figure 1 and Fig-ure 2. To demonstrate that the channel is non-trivialto predict, we experimented with simple predictors tocompare the predicted data with actual transmissionson 3G and LTE downlink. We found that linear predic-tors and k-step ahead predictors fail to track the highvariations of the channel. While one could experimentwith a variety of other predictors, the main result is thatstandard prediction mechanisms are far from capturingthe bursty behavior of the channel despite the use ofvery recent samples.
2.0 2.2 2.4 2.6 2.8 3.0Time (min)
0
50
100
150
200
250
Thr
ough
put
(kbp
s)
(a) 100 ms windows
2.0 2.2 2.4 2.6 2.8 3.0Time (min)
01020304050607080
Thr
ough
put
(kbp
s)
(b) 20 ms windows
Figure 4: Data received on a 3G stationary downlink at100 ms and 20 ms window sizes
4. THE VERUS PROTOCOLVerus is an end-to-end congestion control protocol
designed for highly variable cellular channels that washeavily inspired by our channel observations. Sincecellular channels are highly unpredictable, instead ofattempting to predict the cellular channel dynamics,Verus uses delay variations to learn a delay profile thatreflects the relationship between the network delay andthe amount of data that can be sent without causingnetwork congestion. Because contention and compet-ing traffic impact performance, Verus takes into accountdelay feedback from the network to give an indicationof contention and uses delay cues to constantly remain
in exploration mode rather than assume that delays areself-inflicted. Finally, because channel fluctuations oc-cur at different time-scales, Verus uses small ε steps totrack fast changes and delay profile updates to trackslower changes.
Verus borrows a number of features from legacy TCPvariants, such as slow start and multiplicative decrease,but changes the way it maintains the sending window.Legacy TCP uses additive increase and increases thecongestion window (CWMD) size by 1/CWND, i.e. in-creasing the congestion window by one packet when itsuccessfully received a full window. This process can beslow. In contrast, Verus increases/decreases the sendingwindow at each ε ms epoch and adapts to the chang-ing cellular channel by rapidly increasing the sendingwindow when the channel conditions allows for morepackets. Similarly, Verus seeks to reduce the sendingwindow even before packet losses whereas TCP can onlydecrease the congestion window through an aggressivemultiplicative decrease after a loss.
The main goal of Verus is to avoid congestion bymaintaining an appropriate (sliding) sending windowW over a period equal to the estimated network RoundTrip Time (RTT). Verus does this by replacing the ad-ditive increase with a series of small ε steps to adaptquickly to channel fluctuations. Within a sending win-dow, Verus estimates how many packets need to be sentto avoid congestion or packet loss over a smaller ε msepoch. At each epoch (in the absence of losses) Veruseither: increments or decrements W using the delayprofile as follows:
W (t+ 1) = f(d(t) + δ(t)) (1)
where, W (t + 1) is the next sending window, f is thedelay profile function with d(t) being the network delay,and δ(t) is a delay increment or decrement value.
Verus builds a delay profile using the following fourelements:• Delay Estimator: estimates the network RTT
using delay measurements reported from the re-ceiver’s acknowledgments• Delay Profiler: tracks the relationship between
delay and sending window that does not cause net-work congestion• Window Estimator: estimates the sending win-
dow using the estimated delay and delay profile• Loss Handler: handles losses and adjusts the
sending window
Delay EstimatorThe Delay Estimator is responsible for processing thereceiver’s acknowledgments and estimating the networkdelay (estimated network RTT). It calculates the packetround trip delay Dp,i for each packet by subtracting thecurrent time (i.e. ACK received time) from the packetsent time; where p represents the packet number and irepresents the Verus epoch number.
The Delay Estimator keeps track of all received packetdelays within a Verus epoch and stores them in a vec-
tor ~Di. This vector contains all received delay valuesDp,i during that epoch. In order to track the (short-term) channel history and to avoid abrupt changes, themaximum delay Dmax,i received within that epoch isweighted by an Exponential Weighted Moving Average(EWMA) and calculated as:
Dmax,i = α ·Dmax,i−1 + (1− α) ·max( ~Di)
with 0 < α ≤ 1(2)
The difference between the averaged maximum de-lays of the last two epochs is denoted as ∆Di and rep-resents the increase/decrease of the maximum delay ex-perienced by the network relative to the previous epoch:
∆Di = Dmax,i −Dmax,i−1 (3)
∆Di is passed to the Window Estimator to estimatehow much to send during the next epoch.Delay ProfilerThe creation and maintenance of the delay profile isused to estimate the next upcoming sending windowWi+1 for epoch i + 1. The delay profile can be repre-sented as a graph (Figure 5) where the x and y axiscorrespond to the sending window (Wi) and the packetdelay (Dp,i), respectively. In Verus, each packet p issent as part of a sending window Wi, i.e. number ofpackets in flight. Verus keeps track of Wi for each sentpacket and thus upon receiving an acknowledgement forpacket p, the sender obtains a pair of Dp,i and Wi andadds this data point to the delay profile.
0 20 40 60 80 100 120Sending Window W(t) (# packets)
0
50
100
150
200
250
Del
ayE
stim
ate
D(t
)(m
s)
Dest,i+1
Wi+1
Figure 5: Example of Verus’ delay profile. The greendots represent the recorded values and the red line re-flects an interpolated delay profile curve.
Window EstimatorVerus uses the current change in the network delay ∆Di
to estimate the sending window Wi that is maintainedover the current estimated network RTT. The sendingwindow Wi is divided into smaller epochs with a fixedlength to react quickly to channel changes. The nextsending window estimate Wi+1 is maintained over anaverage of the estimated network RTT. Figure 6 showsthe basic time framework of Verus.
epoch i+1
Last epoch’s standing window Wi
Estimate Wi+1 from delay profile
Ɛ ms epoch
Si+1
Figure 6: Verus time framework
Based on the sign of ∆Di, Verus decides whetherto increase or decrease the sending window. If ∆Di
is negative, it is an indication that the network/channelconditions are improving and thus more data can besent to the network. If the ∆Di is positive, the net-work/channel conditions may be experiencing conges-tion or negative changes and thus Verus should reducethe data rate. Verus estimates the delay that the net-work should have Dest,i+1 as follows:
Dest,i+1 =
Dest,i − δ2 if
Dmax,i
Dmin> R
max[Dmin, (Dest,i − δ1)] elif ∆Di > 0
Dest,i + δ2 otherwise(4)
whereDmin is the minimum delay experienced by Verus,δ1 and δ2 are increment/decrement parameters, and R isthe maximum tolerable ratio between Dmax and Dmin.2
Verus then uses the delay estimate Dest,i+1 to find thecorresponding sending window Wi+1 on the delay pro-file (see Figure 5).
At the beginning of epoch i+ 1, Verus calculates thenumber of packets to send during this epoch. The num-ber of packets to be sent within the next sending windowWi+1 are calculated as follows:
Si+1 = max[0, (Wi+1 + 2−nn−1 ·Wi)]
with n =⌈RTTε
⌉ (5)
where Si+1 is the number of packets to send during theepoch, Wi+1 is the estimated sending window for thefuture, Wi is the current sending window at the endof epoch i (i.e. the sending window at the time beforemaking the next epoch decision), and n is the numberof epochs per estimated network RTT.Loss HandlerIf Verus detects a packet loss or timeout, the sendingwindow is reduced and the new Wi+1 is multiplied by amultiplicative reduction factor as:
Wi+1 = M ·Wloss (6)
2R is used to tune the protocol trade-off between delayand throughput. We show in the evaluation section theeffect of the value of R.
where, Wloss is the sending window in which the lossoccurred, and M is the multiplicative decrease factor.We choose the sending window of the lost packet Wloss
because that sending window was responsible for thepacket loss.
Once a loss is identified and the sending window ismultiplicatively decreased, Verus enters a loss recoveryphase. During the loss recovery phase, the delay profileis no longer updated. The loss recovery phase is im-portant because Verus builds its delay profile to reflectwhat could be sent without incurring network losses.Packets that arrive after a loss would have lower bufferdelays and hence are not considered.
During the loss recovery phase and upon receivingan acknowledgement, the sending window Wi+1 is in-creased by 1/(Wi+1) (similar to TCP). Verus exits theloss recovery phase once acknowledgments of packetssent after the loss are received, i.e. if the protocol re-ceives an acknowledgement with a sending window thatis smaller than or equal to the current sending window.Verus also uses a timeout mechanism similar to TCP incase all packets are lost.
5. VERUS IMPLEMENTATIONOur prototype implementation of Verus consists of
sender and receiver applications written in C++. Thesender application runs in a multi-threaded environ-ment and uses the real time extension library librt. Asthe underlying transport protocol, UDP is used to trans-mit the generated packets. A number of implementationdetails must be addressed in order to realize the Verusprotocol in practice. These include delay profile ini-tialization and maintenance, handling of timeouts andretransmissions, and setting of parameters.
5.1 Delay Profile Initialization and Main-tenance
Verus relies heavily on the delay profile, which re-flects the relationship between the network delay andthe sending window without congesting the network.The initial creation of the delay profile is handled dur-ing Verus’ slow start phase. Verus’ slow start is similarto TCP’s slow start; where the sender begins by sendinga single packet towards the receiver and upon receivingan acknowledgement the sender increments the sendingwindow by one, which leads to exponential growth ofthe sending window.
Verus maintains a list of sent packets and stores thesending timestamp as well as the sending window withwhich the packet was sent. The sender uses this infor-mation to calculate the packet RTT (i.e. delay) andrecords a (delay, sending window) tuple. Once one ofthe exit conditions for Verus slow start are met, thesender will have a number of delay/sending window tu-ples to build the delay profile. The delay profile is con-structed from the stored tuples using the cubic splineinterpolation from the ALGLB library.
Verus’ slow start phase has two exit conditions:
• encountering a packet loss: this can be deducedfrom acknowledgement sequence numbers
• the RTT delay exceeds the predefined threshold:this threshold is set as N x minimum delay (e.g.,N=15)
During the course of operation, the delay profile needsto be updated and maintained over time to capturechannel changes. The delay profile is updated as follows:for every received acknowledgement at the sender, thedelay value of the point that corresponds to the send-ing window of the acknowledged packet is updated withthe new RTT delay. This update is performed using anExponentially Weighted Moving Averaging (EWMA)function to allow the delay profile to evolve. Due tothe high computational effort of the cubic spline inter-polation, this calculation is not performed after everyacknowledgement, but instead at certain intervals. InSection 5.3 we discuss reasonable update intervals inmore detail.
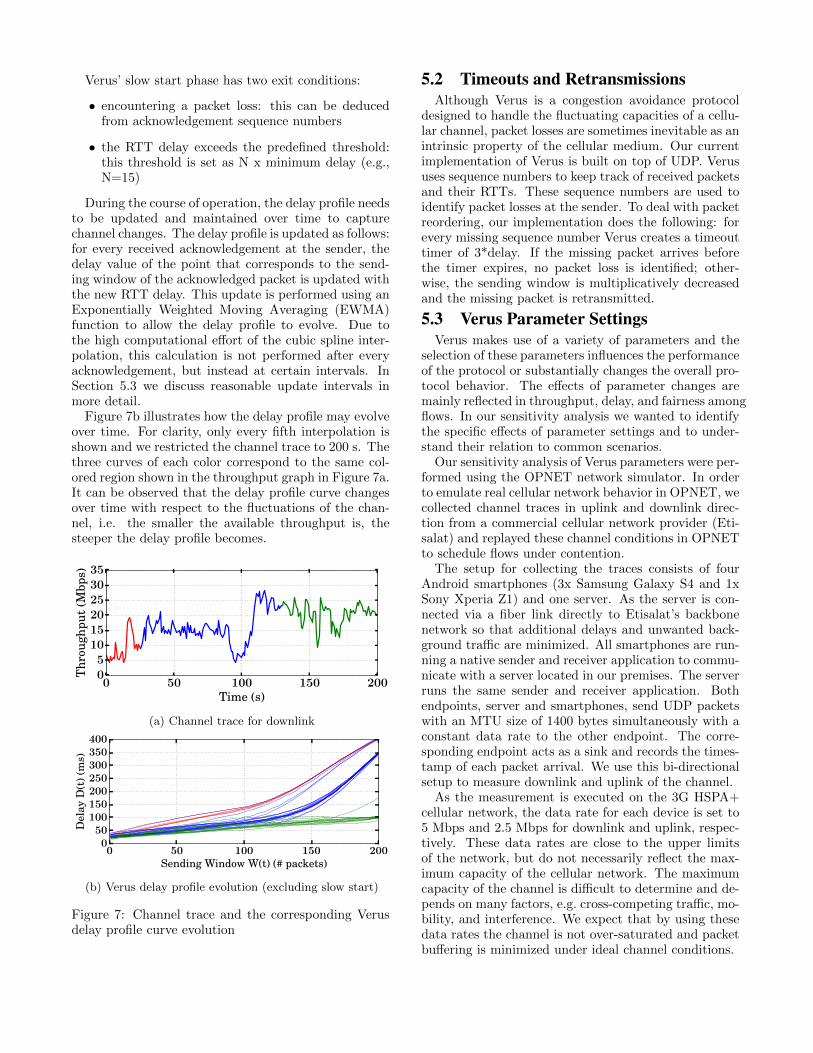
Figure 7b illustrates how the delay profile may evolveover time. For clarity, only every fifth interpolation isshown and we restricted the channel trace to 200 s. Thethree curves of each color correspond to the same col-ored region shown in the throughput graph in Figure 7a.It can be observed that the delay profile curve changesover time with respect to the fluctuations of the chan-nel, i.e. the smaller the available throughput is, thesteeper the delay profile becomes.
0 50 100 150 200Time (s)
05
101520253035
Thr
ough
put
(Mbp
s)
(a) Channel trace for downlink
0 50 100 150 200Sending Window W(t) (# packets)
050
100150200250300350400
Del
ayD
(t)(
ms)
(b) Verus delay profile evolution (excluding slow start)
Figure 7: Channel trace and the corresponding Verusdelay profile curve evolution
5.2 Timeouts and RetransmissionsAlthough Verus is a congestion avoidance protocol
designed to handle the fluctuating capacities of a cellu-lar channel, packet losses are sometimes inevitable as anintrinsic property of the cellular medium. Our currentimplementation of Verus is built on top of UDP. Verususes sequence numbers to keep track of received packetsand their RTTs. These sequence numbers are used toidentify packet losses at the sender. To deal with packetreordering, our implementation does the following: forevery missing sequence number Verus creates a timeouttimer of 3*delay. If the missing packet arrives beforethe timer expires, no packet loss is identified; other-wise, the sending window is multiplicatively decreasedand the missing packet is retransmitted.
5.3 Verus Parameter SettingsVerus makes use of a variety of parameters and the
selection of these parameters influences the performanceof the protocol or substantially changes the overall pro-tocol behavior. The effects of parameter changes aremainly reflected in throughput, delay, and fairness amongflows. In our sensitivity analysis we wanted to identifythe specific effects of parameter settings and to under-stand their relation to common scenarios.
Our sensitivity analysis of Verus parameters were per-formed using the OPNET network simulator. In orderto emulate real cellular network behavior in OPNET, wecollected channel traces in uplink and downlink direc-tion from a commercial cellular network provider (Eti-salat) and replayed these channel conditions in OPNETto schedule flows under contention.
The setup for collecting the traces consists of fourAndroid smartphones (3x Samsung Galaxy S4 and 1xSony Xperia Z1) and one server. As the server is con-nected via a fiber link directly to Etisalat’s backbonenetwork so that additional delays and unwanted back-ground traffic are minimized. All smartphones are run-ning a native sender and receiver application to commu-nicate with a server located in our premises. The serverruns the same sender and receiver application. Bothendpoints, server and smartphones, send UDP packetswith an MTU size of 1400 bytes simultaneously with aconstant data rate to the other endpoint. The corre-sponding endpoint acts as a sink and records the times-tamp of each packet arrival. We use this bi-directionalsetup to measure downlink and uplink of the channel.
As the measurement is executed on the 3G HSPA+cellular network, the data rate for each device is set to5 Mbps and 2.5 Mbps for downlink and uplink, respec-tively. These data rates are close to the upper limitsof the network, but do not necessarily reflect the max-imum capacity of the cellular network. The maximumcapacity of the channel is difficult to determine and de-pends on many factors, e.g. cross-competing traffic, mo-bility, and interference. We expect that by using thesedata rates the channel is not over-saturated and packetbuffering is minimized under ideal channel conditions.
In total, we ran the measurements for seven differentscenarios to capture a variety of conditions with differ-ent mobility properties. Each measurement was con-ducted over five minutes and all devices were started atthe same time and in the same location. The seven sce-narios are the following: Campus stationary, Campuspedestrian, City stationary, City driving, Highway driv-ing, Shopping Mall and City waterfront. The channeltraces were generated from the packet arrival timetampsat the receiver and contain inter-arrival times betweenconsecutive packet arrivals. Using these channel traces,our parameter sensitivity analysis in OPNET focusedmainly on the following parameters: epoch time (ε), thedelay profile update interval, and the delta decrement(δ1) and delta increment (δ2).Epoch εIn general, cellular channels have three different effectsgoverning the changes, some are short-term (e.g., fast-fading) and others are more long-term (path-loss andslow-fading). The epoch ε determines in which inter-vals Verus calculates the amount of packets to sendSi+1. The smaller the epoch, the faster Verus reacts tofast-fading or other sudden channel changes. Throughextensive simulation we found that an epoch of 5 ms isa good value. This value causes Verus to quickly ad-just the operating point on the delay profile and adaptto sudden short-term fluctuations. Larger values of εcause Verus to adjust the sending window too slowly torespond to such fluctuations. Within a 5 ms epoch, thecellular channel does not experience larger long-termchannel changes caused by path-loss or slow-fading ef-fects. Instead, these effects are handled by the delayprofile update rate as described below.Delay Profile UpdatesPath-loss and slow-fading dramatically change channelconditions, and Verus must adapt the delay profile tomatch these new conditions. Feedback about channelconditions continuously update the data in the delayprofile. Verus re-interpolates the delay profile at fixedtime intervals. Our sensitivity analysis indicates thatan update interval of 1 s shows reasonable results andis being used in this work. Re-interpolation intervalsat higher than 1 s values start causing Verus to misschannel changes and react slowly to slow-fading channelchanges. A much smaller update interval than 1 s is tooaggressive since path-loss and slow-fading do not occurat such high frequency.Delta δ1 and δ2The deltas determine how restrictive (δ1) or aggressive(δ2) the protocol reacts to delay changes during eachepoch. The larger the values, the stronger the effects.We find through simulation that their range should be-tween 1 ms ≤ δ ≤ 2 ms with the condition that δ1 ≤ δ2.Beyond these guidelines for good Verus performance,these parameters allow Verus behavior to be tuned tothe level of desired fairness when competing with otherprotocols. For the evaluations in this paper we use val-ues of 1 ms for δ1 and 2 ms for δ2.
6. VERUS MACRO-EVALUATIONIn this section, we evaluate the two main macro-level
properties of the performance of the Verus protocol,namely throughput and delay characteristics. We com-pare Verus against Sprout [33], TCP Cubic, TCP NewReno, and TCP Vegas. We take a two-pronged ap-proach to evaluate Verus against these flavors of TCPand Sprout: real-world and trace-driven evaluation.
In the real-world evaluation, we use mobile devices(Samsung Galaxy S4 and Sony Experia Z1 phones) torun the protocols on 3G and LTE networks. In thisevaluation, we are constrained by the number of devicesthat we are able to simultaneously use; we also restrictthe number of flows per device.
In the trace-driven evaluation, we use multiple mo-bile devices simultaneously connecting to 3G or LTEnetworks where each device is coupled with traffic gen-erators to generate realistic network traces of the chan-nel under different conditions. Using the procedure de-scribed in 5.3, we specifically generate an additional setof traces that capture network contention and mobilityscenarios. Then we use the OPNET network simulatorto compare Verus with other TCP variants [24].3
6.1 Real-world 3G and LTE NetworksWe performed this evaluation on the Etisalat net-
work, the largest cellular network operator in the UAE,which provides both 3G and LTE cellular network ser-vice. While Verus was running natively on the mobiledevices, TCP Verus, TCP Cubic, and Sprout were ex-ecuted on tethered laptops. We switched the mode ofeach phone to connect to the appropriate network totest both 3G and LTE. We consider multiple flows be-tween the devices and a server with a public IP addressat our university campus with high bandwidth and lownetwork delays. To emulate contention, we simultane-ously trigger competing flows between the different de-vices and the server. To avoid device contention issues,we limit the number of flows per device to three. Specif-ically, we consider the following scenarios:
1. Three phones each running three Verus flows2. Three phones each running three Sprout flows3. Three phones each running three Cubic flows (se-
cure copy (scp) download)4. Three phones each running three Vegas flows (scp
download)All experiments were performed on Etisalat’s 3G and
LTE network at fixed locations without mobility andat the same time (late evening in a residential area).The duration of each run was two minutes and eachexperiment was repeated five times. All tests were done
3The Sprout codebase is not compatible with the OP-NET simulator, thus we compare against Sprout onlyin the real-world evaluations. Furthermore, we use the“sendonly” implementation of Sprout to get a fair com-parison to Verus and other protocols.
10−1 100
Delay (s)
012345678
Thr
ough
put
(Mbp
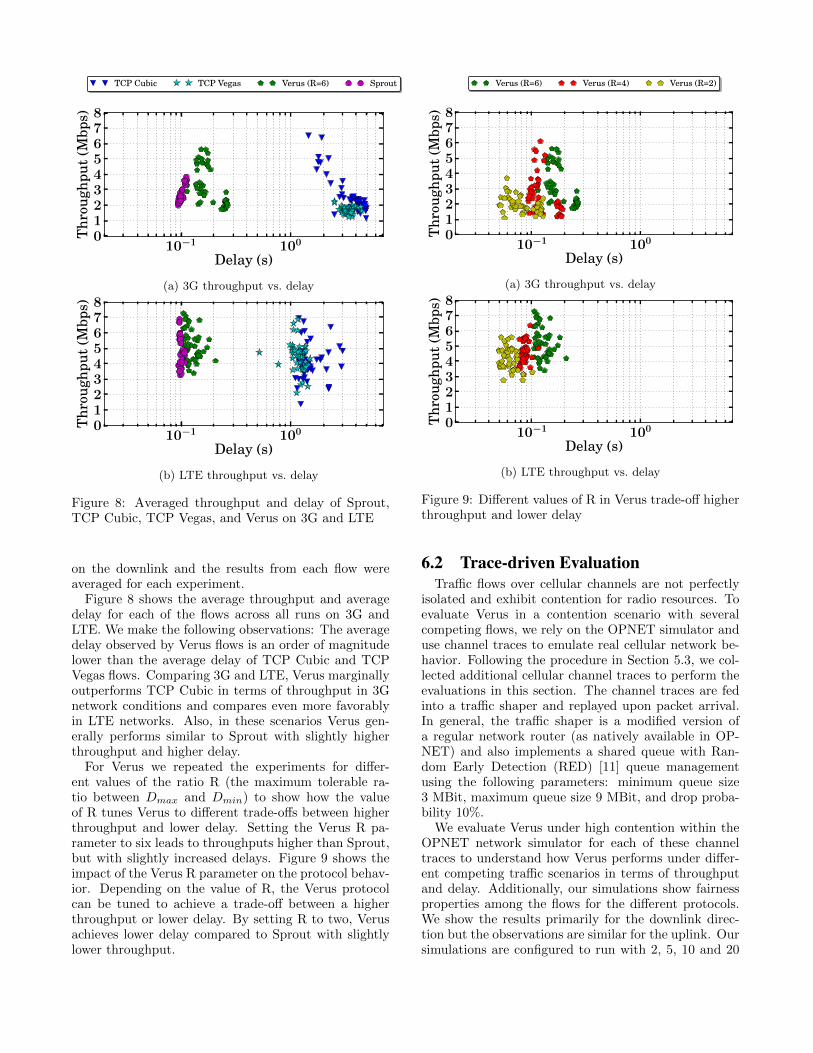
s)TCP Cubic TCP Vegas Verus (R=6) Sprout
(a) 3G throughput vs. delay
10−1 100
Delay (s)
012345678
Thr
ough
put
(Mbp
s)
TCP Cubic TCP Vegas Verus (R=6) Sprout
(b) LTE throughput vs. delay
Figure 8: Averaged throughput and delay of Sprout,TCP Cubic, TCP Vegas, and Verus on 3G and LTE
on the downlink and the results from each flow wereaveraged for each experiment.
Figure 8 shows the average throughput and averagedelay for each of the flows across all runs on 3G andLTE. We make the following observations: The averagedelay observed by Verus flows is an order of magnitudelower than the average delay of TCP Cubic and TCPVegas flows. Comparing 3G and LTE, Verus marginallyoutperforms TCP Cubic in terms of throughput in 3Gnetwork conditions and compares even more favorablyin LTE networks. Also, in these scenarios Verus gen-erally performs similar to Sprout with slightly higherthroughput and higher delay.
For Verus we repeated the experiments for differ-ent values of the ratio R (the maximum tolerable ra-tio between Dmax and Dmin) to show how the valueof R tunes Verus to different trade-offs between higherthroughput and lower delay. Setting the Verus R pa-rameter to six leads to throughputs higher than Sprout,but with slightly increased delays. Figure 9 shows theimpact of the Verus R parameter on the protocol behav-ior. Depending on the value of R, the Verus protocolcan be tuned to achieve a trade-off between a higherthroughput or lower delay. By setting R to two, Verusachieves lower delay compared to Sprout with slightlylower throughput.
10−1 100
Delay (s)
012345678
Thr
ough
put
(Mbp
s)
Verus (R=6) Verus (R=4) Verus (R=2)
(a) 3G throughput vs. delay
10−1 100
Delay (s)
012345678
Thr
ough
put
(Mbp
s)
Verus (R=6) Verus (R=4) Verus (R=2)
(b) LTE throughput vs. delay
Figure 9: Different values of R in Verus trade-off higherthroughput and lower delay
6.2 Trace-driven EvaluationTraffic flows over cellular channels are not perfectly
isolated and exhibit contention for radio resources. Toevaluate Verus in a contention scenario with severalcompeting flows, we rely on the OPNET simulator anduse channel traces to emulate real cellular network be-havior. Following the procedure in Section 5.3, we col-lected additional cellular channel traces to perform theevaluations in this section. The channel traces are fedinto a traffic shaper and replayed upon packet arrival.In general, the traffic shaper is a modified version ofa regular network router (as natively available in OP-NET) and also implements a shared queue with Ran-dom Early Detection (RED) [11] queue managementusing the following parameters: minimum queue size3 MBit, maximum queue size 9 MBit, and drop proba-bility 10%.
We evaluate Verus under high contention within theOPNET network simulator for each of these channeltraces to understand how Verus performs under differ-ent competing traffic scenarios in terms of throughputand delay. Additionally, our simulations show fairnessproperties among the flows for the different protocols.We show the results primarily for the downlink direc-tion but the observations are similar for the uplink. Oursimulations are configured to run with 2, 5, 10 and 20
10−2 10−1
Delay (s)
0
1
2
3
4
5T
hrou
ghpu
t(M
bps) TCP Cubic
TCP NewRenoVerus (R=2)Verus (R=4)Verus (R=6)
(a) Campus pedestrian
10−2 10−1
Delay (s)
0
1
2
3
4
5
Thr
ough
put
(Mbp
s) TCP CubicTCP NewRenoVerus (R=2)Verus (R=4)Verus (R=6)
(b) Slow driving within the city with signals
10−2 10−1
Delay (s)
0
1
2
3
4
5
Thr
ough
put
(Mbp
s) TCP CubicTCP NewRenoVerus (R=2)Verus (R=4)Verus (R=6)
(c) Fast driving on highway
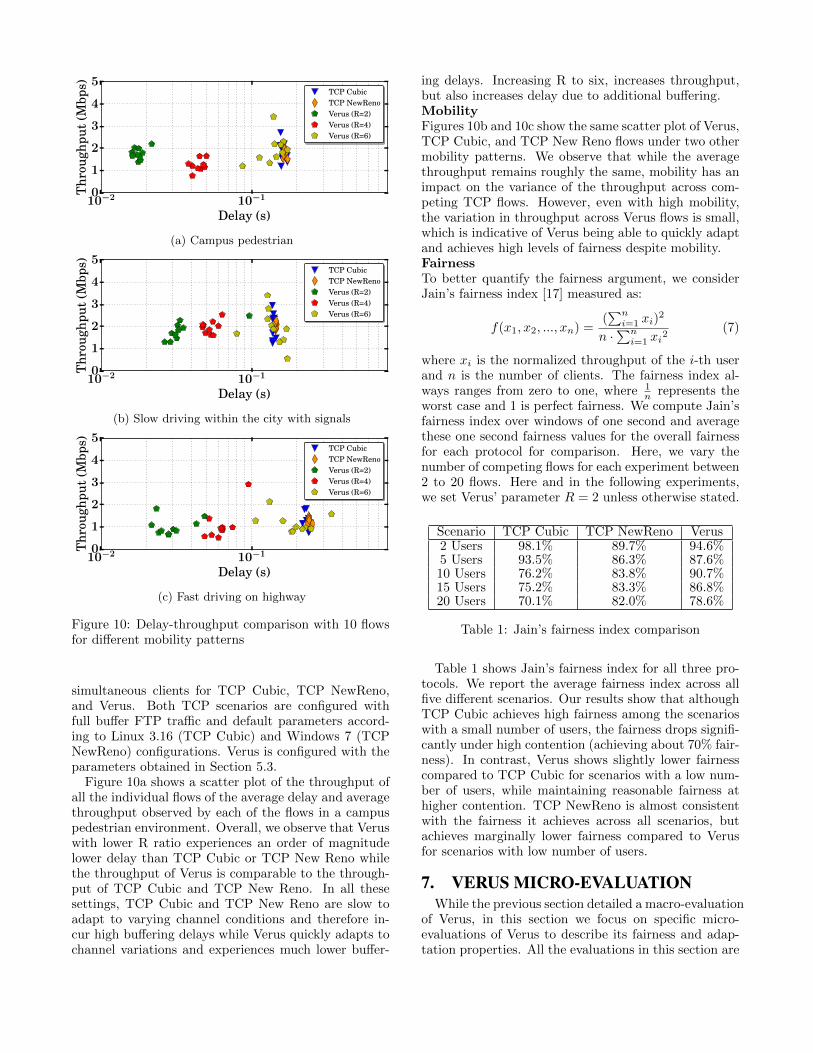
Figure 10: Delay-throughput comparison with 10 flowsfor different mobility patterns
simultaneous clients for TCP Cubic, TCP NewReno,and Verus. Both TCP scenarios are configured withfull buffer FTP traffic and default parameters accord-ing to Linux 3.16 (TCP Cubic) and Windows 7 (TCPNewReno) configurations. Verus is configured with theparameters obtained in Section 5.3.
Figure 10a shows a scatter plot of the throughput ofall the individual flows of the average delay and averagethroughput observed by each of the flows in a campuspedestrian environment. Overall, we observe that Veruswith lower R ratio experiences an order of magnitudelower delay than TCP Cubic or TCP New Reno whilethe throughput of Verus is comparable to the through-put of TCP Cubic and TCP New Reno. In all thesesettings, TCP Cubic and TCP New Reno are slow toadapt to varying channel conditions and therefore in-cur high buffering delays while Verus quickly adapts tochannel variations and experiences much lower buffer-
ing delays. Increasing R to six, increases throughput,but also increases delay due to additional buffering.MobilityFigures 10b and 10c show the same scatter plot of Verus,TCP Cubic, and TCP New Reno flows under two othermobility patterns. We observe that while the averagethroughput remains roughly the same, mobility has animpact on the variance of the throughput across com-peting TCP flows. However, even with high mobility,the variation in throughput across Verus flows is small,which is indicative of Verus being able to quickly adaptand achieves high levels of fairness despite mobility.FairnessTo better quantify the fairness argument, we considerJain’s fairness index [17] measured as:
f(x1, x2, ..., xn) =(∑n
i=1 xi)2
n ·∑n
i=1 xi2
(7)
where xi is the normalized throughput of the i-th userand n is the number of clients. The fairness index al-ways ranges from zero to one, where 1
n represents theworst case and 1 is perfect fairness. We compute Jain’sfairness index over windows of one second and averagethese one second fairness values for the overall fairnessfor each protocol for comparison. Here, we vary thenumber of competing flows for each experiment between2 to 20 flows. Here and in the following experiments,we set Verus’ parameter R = 2 unless otherwise stated.
Scenario TCP Cubic TCP NewReno Verus2 Users 98.1% 89.7% 94.6%5 Users 93.5% 86.3% 87.6%10 Users 76.2% 83.8% 90.7%15 Users 75.2% 83.3% 86.8%20 Users 70.1% 82.0% 78.6%
Table 1: Jain’s fairness index comparison
Table 1 shows Jain’s fairness index for all three pro-tocols. We report the average fairness index across allfive different scenarios. Our results show that althoughTCP Cubic achieves high fairness among the scenarioswith a small number of users, the fairness drops signifi-cantly under high contention (achieving about 70% fair-ness). In contrast, Verus shows slightly lower fairnesscompared to TCP Cubic for scenarios with a low num-ber of users, while maintaining reasonable fairness athigher contention. TCP NewReno is almost consistentwith the fairness it achieves across all scenarios, butachieves marginally lower fairness compared to Verusfor scenarios with low number of users.
7. VERUS MICRO-EVALUATIONWhile the previous section detailed a macro-evaluation
of Verus, in this section we focus on specific micro-evaluations of Verus to describe its fairness and adap-tation properties. All the evaluations in this section are
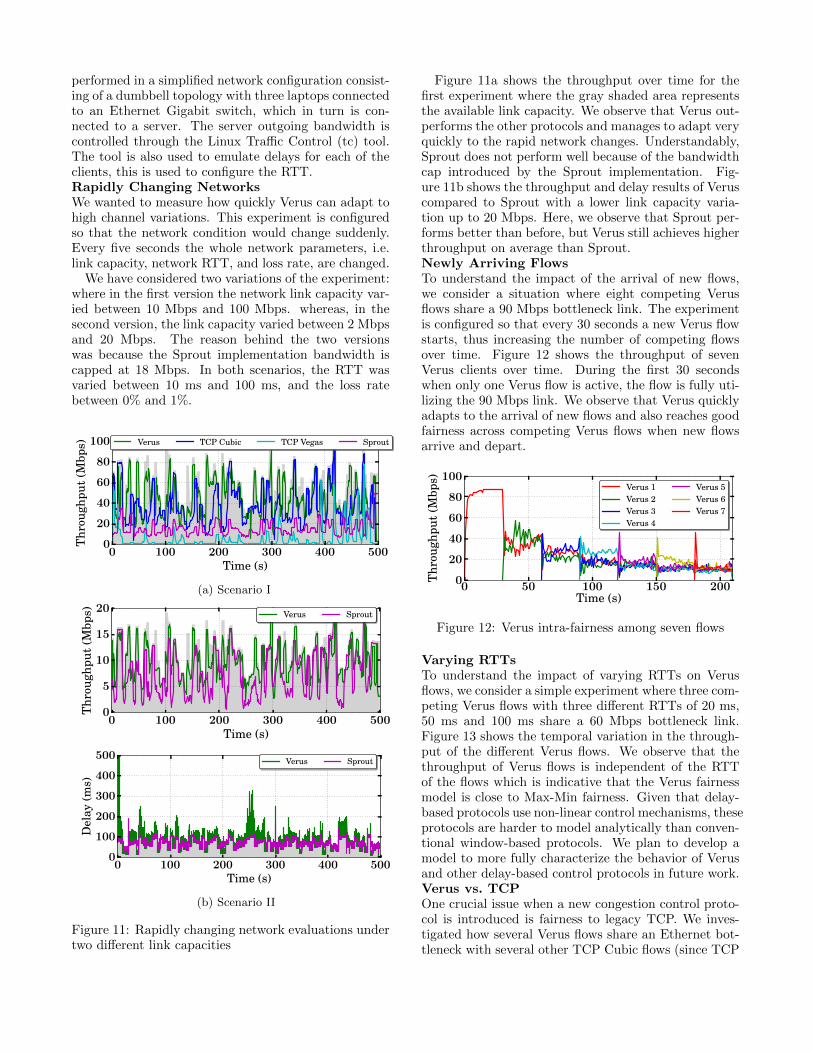
performed in a simplified network configuration consist-ing of a dumbbell topology with three laptops connectedto an Ethernet Gigabit switch, which in turn is con-nected to a server. The server outgoing bandwidth iscontrolled through the Linux Traffic Control (tc) tool.The tool is also used to emulate delays for each of theclients, this is used to configure the RTT.Rapidly Changing NetworksWe wanted to measure how quickly Verus can adapt tohigh channel variations. This experiment is configuredso that the network condition would change suddenly.Every five seconds the whole network parameters, i.e.link capacity, network RTT, and loss rate, are changed.
We have considered two variations of the experiment:where in the first version the network link capacity var-ied between 10 Mbps and 100 Mbps. whereas, in thesecond version, the link capacity varied between 2 Mbpsand 20 Mbps. The reason behind the two versionswas because the Sprout implementation bandwidth iscapped at 18 Mbps. In both scenarios, the RTT wasvaried between 10 ms and 100 ms, and the loss ratebetween 0% and 1%.
0 100 200 300 400 500Time (s)
0
20
40
60
80
100
Thr
ough
put
(Mbp
s) Verus TCP Cubic TCP Vegas Sprout
(a) Scenario I
0 100 200 300 400 500Time (s)
0
5
10
15
20
Thr
ough
put
(Mbp
s) Verus Sprout
0 100 200 300 400 500Time (s)
0
100
200
300
400
500
Del
ay(m
s)
Verus Sprout
(b) Scenario II
Figure 11: Rapidly changing network evaluations undertwo different link capacities
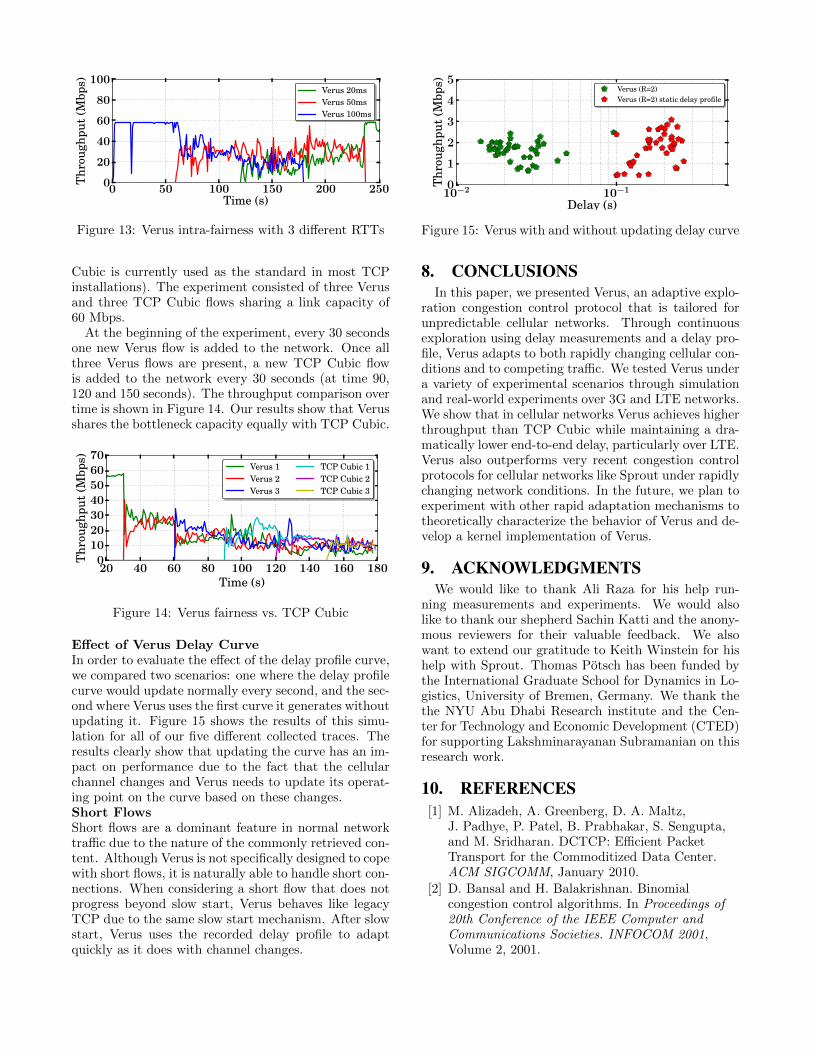
Figure 11a shows the throughput over time for thefirst experiment where the gray shaded area representsthe available link capacity. We observe that Verus out-performs the other protocols and manages to adapt veryquickly to the rapid network changes. Understandably,Sprout does not perform well because of the bandwidthcap introduced by the Sprout implementation. Fig-ure 11b shows the throughput and delay results of Veruscompared to Sprout with a lower link capacity varia-tion up to 20 Mbps. Here, we observe that Sprout per-forms better than before, but Verus still achieves higherthroughput on average than Sprout.Newly Arriving FlowsTo understand the impact of the arrival of new flows,we consider a situation where eight competing Verusflows share a 90 Mbps bottleneck link. The experimentis configured so that every 30 seconds a new Verus flowstarts, thus increasing the number of competing flowsover time. Figure 12 shows the throughput of sevenVerus clients over time. During the first 30 secondswhen only one Verus flow is active, the flow is fully uti-lizing the 90 Mbps link. We observe that Verus quicklyadapts to the arrival of new flows and also reaches goodfairness across competing Verus flows when new flowsarrive and depart.
0 50 100 150 200Time (s)
0
20
40
60
80
100
Thr
ough
put
(Mbp
s)
Verus 1Verus 2Verus 3Verus 4
Verus 5Verus 6Verus 7
Figure 12: Verus intra-fairness among seven flows
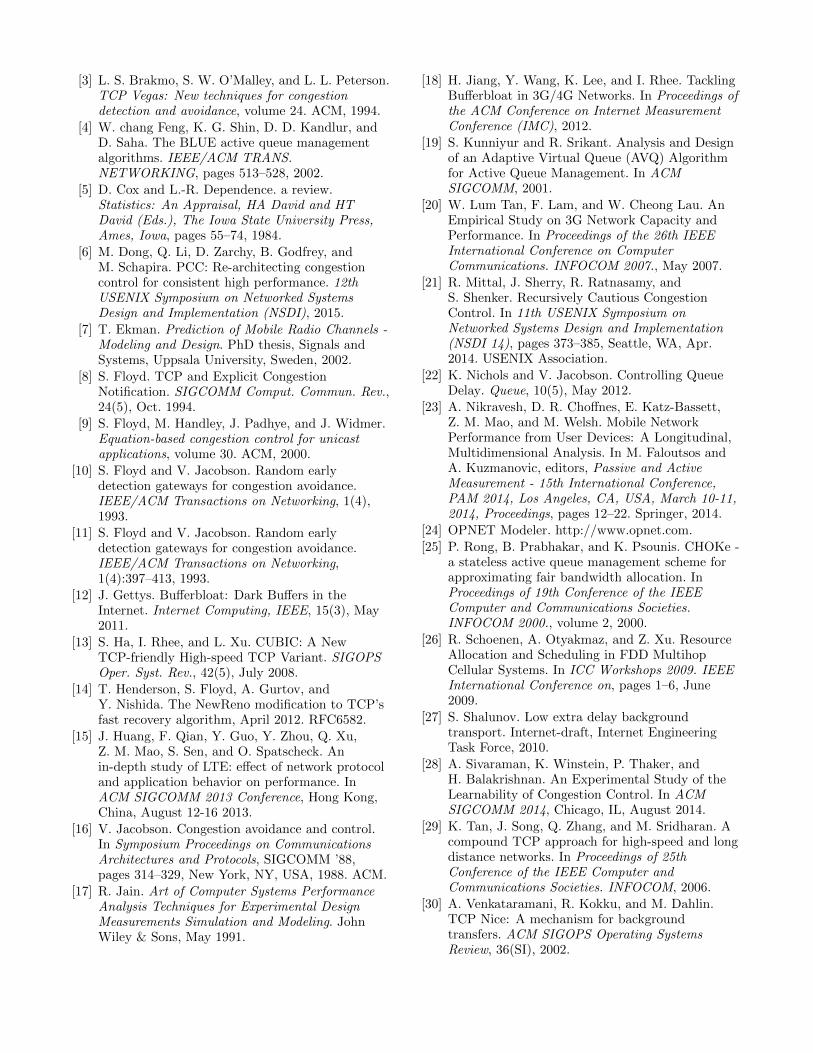
Varying RTTsTo understand the impact of varying RTTs on Verusflows, we consider a simple experiment where three com-peting Verus flows with three different RTTs of 20 ms,50 ms and 100 ms share a 60 Mbps bottleneck link.Figure 13 shows the temporal variation in the through-put of the different Verus flows. We observe that thethroughput of Verus flows is independent of the RTTof the flows which is indicative that the Verus fairnessmodel is close to Max-Min fairness. Given that delay-based protocols use non-linear control mechanisms, theseprotocols are harder to model analytically than conven-tional window-based protocols. We plan to develop amodel to more fully characterize the behavior of Verusand other delay-based control protocols in future work.Verus vs. TCPOne crucial issue when a new congestion control proto-col is introduced is fairness to legacy TCP. We inves-tigated how several Verus flows share an Ethernet bot-tleneck with several other TCP Cubic flows (since TCP
0 50 100 150 200 250Time (s)
0
20
40
60
80
100T
hrou
ghpu
t(M
bps)
Verus 20msVerus 50msVerus 100ms
Figure 13: Verus intra-fairness with 3 different RTTs
Cubic is currently used as the standard in most TCPinstallations). The experiment consisted of three Verusand three TCP Cubic flows sharing a link capacity of60 Mbps.
At the beginning of the experiment, every 30 secondsone new Verus flow is added to the network. Once allthree Verus flows are present, a new TCP Cubic flowis added to the network every 30 seconds (at time 90,120 and 150 seconds). The throughput comparison overtime is shown in Figure 14. Our results show that Verusshares the bottleneck capacity equally with TCP Cubic.
20 40 60 80 100 120 140 160 180Time (s)
010203040506070
Thr
ough
put
(Mbp
s)
Verus 1Verus 2Verus 3
TCP Cubic 1TCP Cubic 2TCP Cubic 3
Figure 14: Verus fairness vs. TCP Cubic
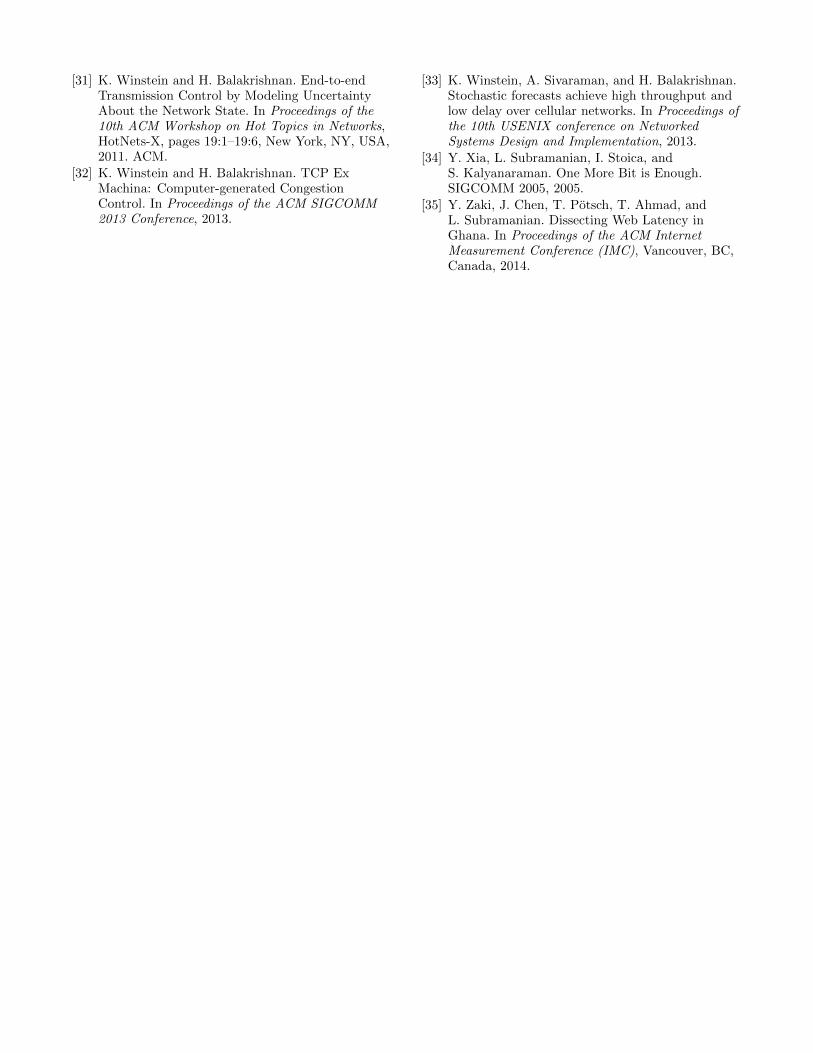
Effect of Verus Delay CurveIn order to evaluate the effect of the delay profile curve,we compared two scenarios: one where the delay profilecurve would update normally every second, and the sec-ond where Verus uses the first curve it generates withoutupdating it. Figure 15 shows the results of this simu-lation for all of our five different collected traces. Theresults clearly show that updating the curve has an im-pact on performance due to the fact that the cellularchannel changes and Verus needs to update its operat-ing point on the curve based on these changes.Short FlowsShort flows are a dominant feature in normal networktraffic due to the nature of the commonly retrieved con-tent. Although Verus is not specifically designed to copewith short flows, it is naturally able to handle short con-nections. When considering a short flow that does notprogress beyond slow start, Verus behaves like legacyTCP due to the same slow start mechanism. After slowstart, Verus uses the recorded delay profile to adaptquickly as it does with channel changes.
10−2 10−1
Delay (s)
0
1
2
3
4
5
Thr
ough
put
(Mbp
s) Verus (R=2)Verus (R=2) static delay profile
Figure 15: Verus with and without updating delay curve
8. CONCLUSIONSIn this paper, we presented Verus, an adaptive explo-
ration congestion control protocol that is tailored forunpredictable cellular networks. Through continuousexploration using delay measurements and a delay pro-file, Verus adapts to both rapidly changing cellular con-ditions and to competing traffic. We tested Verus undera variety of experimental scenarios through simulationand real-world experiments over 3G and LTE networks.We show that in cellular networks Verus achieves higherthroughput than TCP Cubic while maintaining a dra-matically lower end-to-end delay, particularly over LTE.Verus also outperforms very recent congestion controlprotocols for cellular networks like Sprout under rapidlychanging network conditions. In the future, we plan toexperiment with other rapid adaptation mechanisms totheoretically characterize the behavior of Verus and de-velop a kernel implementation of Verus.
9. ACKNOWLEDGMENTSWe would like to thank Ali Raza for his help run-
ning measurements and experiments. We would alsolike to thank our shepherd Sachin Katti and the anony-mous reviewers for their valuable feedback. We alsowant to extend our gratitude to Keith Winstein for hishelp with Sprout. Thomas Potsch has been funded bythe International Graduate School for Dynamics in Lo-gistics, University of Bremen, Germany. We thank thethe NYU Abu Dhabi Research institute and the Cen-ter for Technology and Economic Development (CTED)for supporting Lakshminarayanan Subramanian on thisresearch work.
10. REFERENCES[1] M. Alizadeh, A. Greenberg, D. A. Maltz,
J. Padhye, P. Patel, B. Prabhakar, S. Sengupta,and M. Sridharan. DCTCP: Efficient PacketTransport for the Commoditized Data Center.ACM SIGCOMM, January 2010.
[2] D. Bansal and H. Balakrishnan. Binomialcongestion control algorithms. In Proceedings of20th Conference of the IEEE Computer andCommunications Societies. INFOCOM 2001,Volume 2, 2001.
[3] L. S. Brakmo, S. W. O’Malley, and L. L. Peterson.TCP Vegas: New techniques for congestiondetection and avoidance, volume 24. ACM, 1994.
[4] W. chang Feng, K. G. Shin, D. D. Kandlur, andD. Saha. The BLUE active queue managementalgorithms. IEEE/ACM TRANS.NETWORKING, pages 513–528, 2002.
[5] D. Cox and L.-R. Dependence. a review.Statistics: An Appraisal, HA David and HTDavid (Eds.), The Iowa State University Press,Ames, Iowa, pages 55–74, 1984.
[6] M. Dong, Q. Li, D. Zarchy, B. Godfrey, andM. Schapira. PCC: Re-architecting congestioncontrol for consistent high performance. 12thUSENIX Symposium on Networked SystemsDesign and Implementation (NSDI), 2015.
[7] T. Ekman. Prediction of Mobile Radio Channels -Modeling and Design. PhD thesis, Signals andSystems, Uppsala University, Sweden, 2002.
[8] S. Floyd. TCP and Explicit CongestionNotification. SIGCOMM Comput. Commun. Rev.,24(5), Oct. 1994.
[9] S. Floyd, M. Handley, J. Padhye, and J. Widmer.Equation-based congestion control for unicastapplications, volume 30. ACM, 2000.
[10] S. Floyd and V. Jacobson. Random earlydetection gateways for congestion avoidance.IEEE/ACM Transactions on Networking, 1(4),1993.
[11] S. Floyd and V. Jacobson. Random earlydetection gateways for congestion avoidance.IEEE/ACM Transactions on Networking,1(4):397–413, 1993.
[12] J. Gettys. Bufferbloat: Dark Buffers in theInternet. Internet Computing, IEEE, 15(3), May2011.
[13] S. Ha, I. Rhee, and L. Xu. CUBIC: A NewTCP-friendly High-speed TCP Variant. SIGOPSOper. Syst. Rev., 42(5), July 2008.
[14] T. Henderson, S. Floyd, A. Gurtov, andY. Nishida. The NewReno modification to TCP’sfast recovery algorithm, April 2012. RFC6582.
[15] J. Huang, F. Qian, Y. Guo, Y. Zhou, Q. Xu,Z. M. Mao, S. Sen, and O. Spatscheck. Anin-depth study of LTE: effect of network protocoland application behavior on performance. InACM SIGCOMM 2013 Conference, Hong Kong,China, August 12-16 2013.
[16] V. Jacobson. Congestion avoidance and control.In Symposium Proceedings on CommunicationsArchitectures and Protocols, SIGCOMM ’88,pages 314–329, New York, NY, USA, 1988. ACM.
[17] R. Jain. Art of Computer Systems PerformanceAnalysis Techniques for Experimental DesignMeasurements Simulation and Modeling. JohnWiley & Sons, May 1991.
[18] H. Jiang, Y. Wang, K. Lee, and I. Rhee. TacklingBufferbloat in 3G/4G Networks. In Proceedings ofthe ACM Conference on Internet MeasurementConference (IMC), 2012.
[19] S. Kunniyur and R. Srikant. Analysis and Designof an Adaptive Virtual Queue (AVQ) Algorithmfor Active Queue Management. In ACMSIGCOMM, 2001.
[20] W. Lum Tan, F. Lam, and W. Cheong Lau. AnEmpirical Study on 3G Network Capacity andPerformance. In Proceedings of the 26th IEEEInternational Conference on ComputerCommunications. INFOCOM 2007., May 2007.
[21] R. Mittal, J. Sherry, R. Ratnasamy, andS. Shenker. Recursively Cautious CongestionControl. In 11th USENIX Symposium onNetworked Systems Design and Implementation(NSDI 14), pages 373–385, Seattle, WA, Apr.2014. USENIX Association.
[22] K. Nichols and V. Jacobson. Controlling QueueDelay. Queue, 10(5), May 2012.
[23] A. Nikravesh, D. R. Choffnes, E. Katz-Bassett,Z. M. Mao, and M. Welsh. Mobile NetworkPerformance from User Devices: A Longitudinal,Multidimensional Analysis. In M. Faloutsos andA. Kuzmanovic, editors, Passive and ActiveMeasurement - 15th International Conference,PAM 2014, Los Angeles, CA, USA, March 10-11,2014, Proceedings, pages 12–22. Springer, 2014.
[24] OPNET Modeler. http://www.opnet.com.
[25] P. Rong, B. Prabhakar, and K. Psounis. CHOKe -a stateless active queue management scheme forapproximating fair bandwidth allocation. InProceedings of 19th Conference of the IEEEComputer and Communications Societies.INFOCOM 2000., volume 2, 2000.
[26] R. Schoenen, A. Otyakmaz, and Z. Xu. ResourceAllocation and Scheduling in FDD MultihopCellular Systems. In ICC Workshops 2009. IEEEInternational Conference on, pages 1–6, June2009.
[27] S. Shalunov. Low extra delay backgroundtransport. Internet-draft, Internet EngineeringTask Force, 2010.
[28] A. Sivaraman, K. Winstein, P. Thaker, andH. Balakrishnan. An Experimental Study of theLearnability of Congestion Control. In ACMSIGCOMM 2014, Chicago, IL, August 2014.
[29] K. Tan, J. Song, Q. Zhang, and M. Sridharan. Acompound TCP approach for high-speed and longdistance networks. In Proceedings of 25thConference of the IEEE Computer andCommunications Societies. INFOCOM, 2006.
[30] A. Venkataramani, R. Kokku, and M. Dahlin.TCP Nice: A mechanism for backgroundtransfers. ACM SIGOPS Operating SystemsReview, 36(SI), 2002.
[31] K. Winstein and H. Balakrishnan. End-to-endTransmission Control by Modeling UncertaintyAbout the Network State. In Proceedings of the10th ACM Workshop on Hot Topics in Networks,HotNets-X, pages 19:1–19:6, New York, NY, USA,2011. ACM.
[32] K. Winstein and H. Balakrishnan. TCP ExMachina: Computer-generated CongestionControl. In Proceedings of the ACM SIGCOMM2013 Conference, 2013.
[33] K. Winstein, A. Sivaraman, and H. Balakrishnan.Stochastic forecasts achieve high throughput andlow delay over cellular networks. In Proceedings ofthe 10th USENIX conference on NetworkedSystems Design and Implementation, 2013.
[34] Y. Xia, L. Subramanian, I. Stoica, andS. Kalyanaraman. One More Bit is Enough.SIGCOMM 2005, 2005.
[35] Y. Zaki, J. Chen, T. Potsch, T. Ahmad, andL. Subramanian. Dissecting Web Latency inGhana. In Proceedings of the ACM InternetMeasurement Conference (IMC), Vancouver, BC,Canada, 2014.