Embed Size (px)
Citation preview
1
Adapting reward strategies to millennials’ pay preferences1
Professor Lovorka Galetić, PhD
Ivana Načinović Braje, PhD [email protected]
Maja Klindžić, PhD
University of Zagreb, Faculty of Economics & Business
Zagreb, Croatia
Abstract
Millennials (Generation Y) are known for their different views, work values and motivational
needs compared to generations before them. The paper analyses reward preferences of
millennials in Croatia. Empirical findings, using data for 249 members of generation Y,
revealed that respondents generally assign more importance to non-material rewards.
Furthermore, we show that Generation Y is not necessarily a homogenous group. It was
shown that women assign greater importance than men to recognition, job security, high-
quality leadership, work-life balance and feedback information. Therefore, HRM managers
should adapt reward strategies not only with respect to generational preferences, but
individual characteristics as well.
Key words: generation Y, reward strategy, transactional reward, relational reward,
motivation
1. Introduction
The important question for HRM professionals is to construct a reward strategy that would
motivate employees and secure good organisational performance. The present workforce is
diversified in terms of generation, culture and values so literature indicates that motivational
factors vary across employees and over time (Smola & Sutton, 2002). Generational affiliation
has been recognized as a relevant factor linked to employees' motivation (Kultalahti &
Viitala, 2014). This affiliation is said to influence both what an individual wants on the job
and his satisfaction with his level of compensation (Qenani-Petrela, Schlosser & Pompa,
2007).
A generation is usually defined as an identifiable group, which shares years of birth, age,
location and hence significant life events at critical stages of development (Kupperschmidt,
1 The publication of this paper has been supported by the grant from the Croatian Science
Foundation, project “Closing the gap in compensation strategy and practice between Croatia and
EU“ – managed by professor Lovorka Galetić
2
2000 after Wong et al., 2008). Despite some variations in the way the literature names these
generations and classifies start and end dates, there is general descriptive consensus among
academics and practitioners regarding the four generations: Veterans (1925-1944), Baby
Boomers (1945-1964), Gen X (1965-1981), and Generation Y (1982-2000) (Dries, Pepermans
& De Kerpel, 2008; Eisner, 2005). There is also the fifth or youngest generation, Generation
Z or post-millennials, encompassing all those born after the year 2000. The presence of
differences between generations has been reinforced by social constructionist views (Berger
& Luckmann, 1966 after Kultalahti & Viitala, 2014) stating that wars, discoveries, cultural,
political, technological and economic context is fundamental to the creation of a generation
(Meier & Crocker, 2010, Mannheim, 1952 after Guillot-Soulez & Soulez, 2014).
Furthermore, factors such as age, cultural heritage, upbringing, and societal values at the time
employees enter the workforce play a crucial role in shaping employee behavior in the
workplace (Moorhead & Griffin 2004). Generation hence develops a unique pattern of
behavior based on these common events experienced during their upbringing (Kupperschmidt,
2000 after Guillot-Soulez & Soulez, 2014).
In order to attract, motivate, and retain young employees, which becomes increasingly
important as the “Baby Boomer” generation retires, organizations must understand and
strategically adapt to the work expectations of Generation Y. Experts have called this
youngest workforce generation also Millennials, Nexters, Generation Me, Generation www,
Internet Generation, the Digital Generation, Generation E, Echo Boomers, N-Gens, Net
Generation, digital natives, Generation Next, dot.com., but most often, Generation Y (Martin,
2005, Luscombe, Lewis & Biggs, 2013, Guillot-Soulez & Soulez, 2014). While there has
been debate in the literature regarding the range of dates to define Generation Y (e.g. Martin,
2005), this paper, similar to others defines Generation Y as those individuals born between
1980 and 2000 (e.g. Meier & Crocker, 2010).
Practitioners and consultants state that the different generations need to be managed
differently (Parry & Urwin, 2011 after Guillot-Soulez & Soulez, 2014). There is some
evidence that Generation Y is different from other generations (e.g. Dries, Pepermans & De
Kerpel, 2008), although we acknowledge that there are also differing views stating that
considerable generational differences in the workplace do not exist (Pološki Vokić & Vidović,
2015). Divergence between Generation Y from others is a result of an accelerated speed of
live surrounding us, multiplicity of communication devices, access to growing technology,
increased traveling opportunities and the greater amount of parental nurturing (Holt, Marques
& Way, 2012). Generation Y is the most technically literate, educated, and ethnically diverse
generation in the history. It tends to want intellectual challenge, needs to succeed, seeks those
who will further its professional development, strives to make a difference, and measures its
own success. Meeting personal goals is likely to matter to Generation Y, as is performing
meaningful work that betters the world and working with committed co-workers with shared
values (Eisner, 2005).
Being able to understand new generations as they move into the work force will be crucial in
attracting, motivating and retaining them with the organisation. Generation Y was raised in a
3
time of economic expansion and prosperity but it is coming of age in an era of economic
uncertainty and violence. In this paper we empirically examine how the research findings
concerning Generation Y work-related expectations and motivation, which originate mainly
in the USA or developed EU countries, manifest themselves in Croatia, representing one of
the South-Eastern countries in Europe.
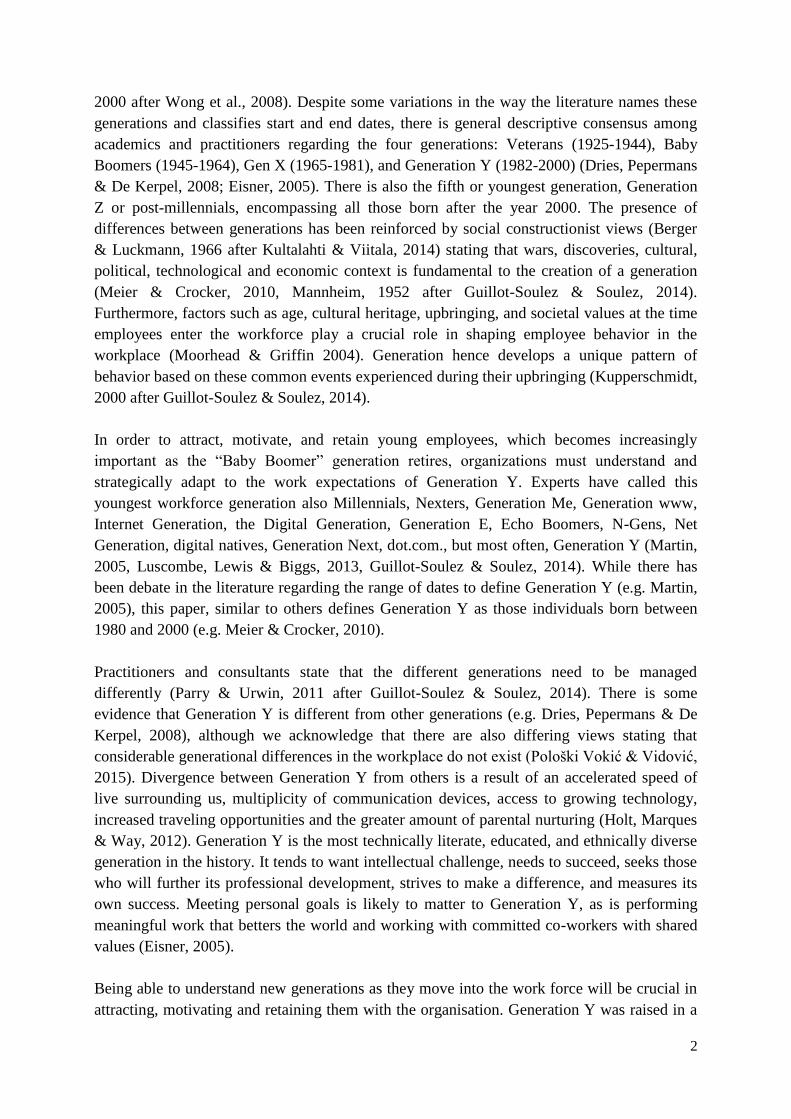
Table 1: Croatian population according to 2011 census
Generation Birth
years*
Total
population
Percentage of total
population
Veterans and
older
1946 and
older
758 633 17,70%
Baby
Boomers
1947-1962 1 212 621 28,30%
Generation X 1963-1980 866 306 20,22%
Generation Y 1981-2001 1 030 303 24,05%
Generation Z 2002 and
younger
417 026 9,73%
Total 4 284 889 100%
*Adapted according to census data
Source: Croatian Bureau of Statistics (2014) Statistical Yearbook of the Republic of Croatia,
http://www.dzs.hr/Hrv_Eng/ljetopis/2014/sljh2014.pdf
The first millennial university graduates entered the workforce in Croatia in the summer of
2003. They will continue to do so, in large numbers, until around 2022. As shown in Table 1,
Generation Y represents 24,05% of total population in Croatia, and is the second largest
generation after Baby Boomers. Thus, it is important for organisations in Croatia, as it is in
any other country, to understand Generation Y and develop HRM practices and processes
appropriate for them (Kultalahti, Viitala, 2015).
2. Generation Y work values and motivation
2.1.Work values and behaviour
Previous research has examined differences in work values across generations with the
general conclusion being that generation Y has different work values compared to other
generations (Solnet, Kralj & Kandampully, 2012). To be more precise, generational studies
point out to the fact that this generation is being raised with great amount of parental
nurturing and support that created a climate that emphasizes the importance of high self-
esteem (Holt, Marques & Way, 2012). Millennials believe enough in their own value and self
worth that they are not shy about pursuing it (Howe & Strauss 2000 after Qenani-Petrela,
Schlosser & Pompa, 2007).
Generation Y traits include high self-esteem, self centeredness, propensity to multitask, team
orientation, preference for working within a collaborative environment, a reasonable level of
autonomy and self-direction as well as hyper-connectivity (Holt, Marques & Way, 2012).
Generation Y employees tend to search for intellectual challenges, aspire for success, strive to
4
make a difference and seek employers who can advance their professional development
(Kong, Wang & Fu, 2015).
Members of Generation Y thrive on challenging work and creative expression, love freedom
and flexibility, and openly dislike micromanagement. Generation Y is self-reliant,
independent and has a strong desire for increasing responsibility (Martin, 2005). They tend to
be more ambitious and career centred and have a tendency to enjoy working with demanding
roles and targets (Wong et al., 2008) and prefer a job that recognizes performance and not
tenure (Meier & Crocker, 2010). Leaders need to make work challenging to take advantage of
their high achievement mentality (Hewitt & Ukpere, 2012).
Working within collaborative environments is important to Generation Y (Martin, 2005,
Filipczak, 1994 after Josiam et al., 2009, Luscombe, Lewis, Biggs & 2013). Wherever and
whenever possible, invitations should be extended for the inclusion of Generation Y
employees in decision making but also collaboration in regards to individually related aspects,
such as determination of one’s salary and the identification of the tasks to be undertaken
within a particular position (Luscombe, Lewis & Biggs, 2013).
Millennials were indoctrinated from their earliest moment to seek approval and affirmation. In
the workplace, this has led to a sometimes excessive propensity to continuously seek guidance
and direction from their managers (Hershatter & Epstein, 2010). They prefer a guiding hand
to a micromanager (Meier & Crocker, 2010). Furthermore, they demand immediate feedback,
and expect a sense of accomplishment hourly (Martin, 2005) possibly because it provides
assurance that they are continuing to move along a linear, progressive path (Hershatter &
Epstein, 2010).
Millennial focus their energy more on their private lives and moving from organisation to
organisation is not a problem for them. As such, they see a work-life balance as being
important and tend to be very wary of sacrificing large parts of their private lives for the sake
of work (Hershatter & Epstein, 2010, Crumpacker & Crumpacker, 2007 after Luscombe,
Lewis & Biggs, 2013, Kultalahti & Viitala, 2015). While employees of all generations desire
this work–life balance, Generation Y may have the confidence and conviction to demand it
from their employers (Hershatter & Epstein, 2010). Martin (2005) showed that Millennial
view one year of employment as long term. However, Millennials do have the capacity to be
loyal, particularly in organizations that continue to provide individual attention and a
supportive, family-like environment (Hershatter & Epstein, 2010).
Interestingly, in spite of generation Y’s birth span of 20 years, it is still in most cases regarded
as a homogenous group. Only a few (e.g. Josiam et al., 2009, Luscombe, Lewis & Biggs,
2013, Guillot-Soulez & Soulez, 2014) have argued that Generation Y does not necessarily
form a homogeneous group in relation to their work preferences. Work values do change as
workers grow older (Smola & Sutton, 2002) and given the numerous changes experienced in
the period of 20 years, we also find that it is possible that all members of this generation do
not form a homogenous group.
5
2.2. Motivation
Most research on Generation Y motivation follows Herzberg et al.’s (1959) motivation
theory, looking for factors of motivation but hygiene factors as well (e.g. Qenani-Petrela,
Schlosser & Pompa, 2007, Kultalahti & Viitala, 2014). However, empirical evidence on
generational differences in motivational drivers in the workplace is limited and inconclusive
(Kultalahti & Viitala, 2014).
Most often the starting point when analyzing Millennials is the presumption that they
appreciate more intrinsic than extrinsic motivators (Kultalahti & Viitala, 2014). According to
this view, money is a lesser motivator, whereas opportunities for career growth and
advancement, as well as a fulfilled balanced life, are greater motivators for Generation Y
employees (Crumpacker & Crumpacker, 2007 after Kong, Wang & Fu, 2015).
Varying and flexible job that includes good relationships with colleagues and supervisor has
been recognized as an important motivating factor (Kultalahti & Viitala, 2014). Motivating
tasks should be interesting, clear and specific, challenging and varied, include multitasking and
job enrichment (Qenani-Petrela, Schlosser & Pompa, 2007, Meier & Crocker, 2010,
Kultalahti & Viitala, 2015, Kong, Wang & Fu, 2015). There is however some evidence that
this cohort would be willing to accept a less interesting job in order to obtain a permanent job
or work in a relaxed atmosphere (Guillot-Soulez & Soulez, 2014). Work atmosphere has been
found among top motivating factors by Meier & Crocker (2010) research, although it had a
high position on the top demotivating factors’ list as a part of the same research. We find very
interesting that permanent job and job security have been found to be motivators in French
setting (Guillot-Soulez & Soulez, 2014), as well as the fact that Generation Y placed greater
importance to organizational security than generation X (Dries, Pepermans & De Kerpel,
2008). Both findings contradict general presumption that Millennials easily change job
positions (Luscombe, Lewis & Biggs, 2013). There is also some evidence from other research
that job stability was largely neglected (Qenani-Petrela, Schlosser & Pompa, 2007, Kultalahti &
Viitala, 2015), although authors argue that this might indicate that Millennials have already
become used to the idea that short-term contracts and job insecurity are the new norm,
especially in the early career stages.
Career growth and advancement, as well as a fulfilled balanced life, are greater motivators for
Generation Y employees than money (Crumpacker & Crumpacker, 2007 after Kong, Wang &
Fu, 2015, Wong et al., 2008, Qenani-Petrela, Schlosser & Pompa, 2007). The “Leadership”
category that captures management style, supervisory practices, and supervisor/employee
relationships has also been found to be important motivational factor (Meier & Crocker,
2010). Besides good relationships with colleagues and supervisor (Kultalahti & Viitala,
2014), there can also be some emphasis on the coaching form of leadership (Kultalahti &
Viitala, 2015). Leaders should not expect from this generation something they cannot do
themselves, they must explain the “why factor” and what is in it for them; and let them know
what they do matters (Hewitt & Ukpere, 2012).
6
Although motivating Generation Y emphasizes the importance of intrinsic factors, the role of
salary cannot be neglected (Meier & Crocker, 2010). In earlier studies, some researchers
asserted that salary is as important for Generation Y as for other generations (Dries,
Pepermans & De Kerpel, 2008) or even that money might be more important for Millennials
(e.g. Smola & Sutton, 2002) than for other generations. Economic factors of work motivation
were given higher average grades than social work motivation factors by several research (e.g.
Josiam et al. 2009). Aside from providing high compensation, employers should also provide
career growth opportunities and challenging job to their employees, as they are important
motivational factors (Kong, Wang, Fu & 2015). Customised benefits and tailored career paths
is something managers should be considering (Hewitt & Ukpere, 2012, Kultalahti & Viitala,
2015). Millennials expect to receive medical insurance, paid holidays, ample paid vacation,
and other perks from their employers (Meier & Crocker, 2010).
Empirical evidence on the issue of Generation Y motivation is however ambiguous. With
respect to salary, some have found that salary and bonuses are not as important motivators
(e.g. Guillot-Soulez & Soulez, 2014, Kultalahti & Viitala, 2015), whilst others noted salary
issues such as low pay and no benefits as top demotivators for this generation (Meier &
Crocker, 2010). Poor communication, poor workplace climate, a boring job and feelings of
stagnation also additionally fuel demotivation (Kultalahti & Viitala, 2014)
There is some evidence that motivation factors depend upon some independent
characteristics: women are more interested than men in an interesting job (Guillot-Soulez,
Soulez, 2014). Pay preferences can be can be modified by gender and work experience
(Sallop, Kirby, 2007). Luscombe, Lewis, Biggs (2013) distinguishes among generation Y
based on number of years working, although no significant difference was found.
More research is still needed on the topic, especially among working Millennials, because
many of the empirical studies have focused on students only (e.g. Laird, Harvey, Lancaster,
2015, De Hauw and De Vos, 2010, Josiam et al. 2009, Qenani-Petrela, Schlosser, Pompa,
2007 etc.).
3. Methodology of research
In order to analyse the Generation Y preferences towards different aspects of motivation
strategies, an empirical research was undertaken during the months of October and
November. In the introductory part of this section, we briefly describe information about
related research methods and sampling procedure, after which we describe the results
generated by the primary data.
3.1. Research methods and sampling
The first step in designing our research was to select participants for the empirical research.
As this empirical research is part of a larger project that aims at covering entire period
7
ascribed to Generation Y individuals (namely, individuals born from 1980 till 2000), as well
as comparing Generation Y pay preferences to their predecessors (generation X), the first step
of data collection included gathering data from the second year students that attended a course
“Organization” at University of Zagreb – Faculty of Economics and Business Zagreb at the
undergraduate level of Bachelor of Business program in autumn semester. Furthermore, as
some assign pay preferences to national culture setting and value patterns (e.g. Chiang &
Birch, 2007) so this research reveals reward preferences among Croatian students who share
specific cultural characteristics.
A questionnaire was designed for that purpose and consisted of several closed-ended
questions about different pay modalities (e.g., base pay, variable pay, perks and benefits etc.)
as well as various nonmaterial motivation strategies (e.g. flexible working hours, recognition,
participation in decision making etc.), for which respondents were asked to assign importance
using Likert 5-point scale (1 = not important at all, 5 = most important). Other questions
included different background questions that were used to describe independent
characteristics of respondents and were either closed-ended (e.g., sex, students status,
previous knowledge on motivation management, etc.) or open ended (e.g. year of birth, years
of working experience, etc.). Before the questionnaires were distributed to students they were
tested by several student assistants that were asked to read the draft of the questionnaire and
give their suggestions to make the final version more understandable to second year students.
The estimated time for fulfilling the questionnaire was approximately 5 to 10 minutes.
As for the following phase of empirical research, students were asked to voluntarily fulfill the
questionnaire in written form as a part of the topic that was discussed during the lectures.
Questionnaires were distributed to students in 10 out of 20 groups of seminars at the second
year of Bachelor of Business program. At the end of the collection phase a total of 249
students fulfilled the questionnaires, which makes a proportion of 31,80% of all second year
students. As the data collection phase was concluded a statistical analysis of the primary data
with SPSS 18.0 followed. The independent characteristics of the respondents are given in a
summary table below.
8
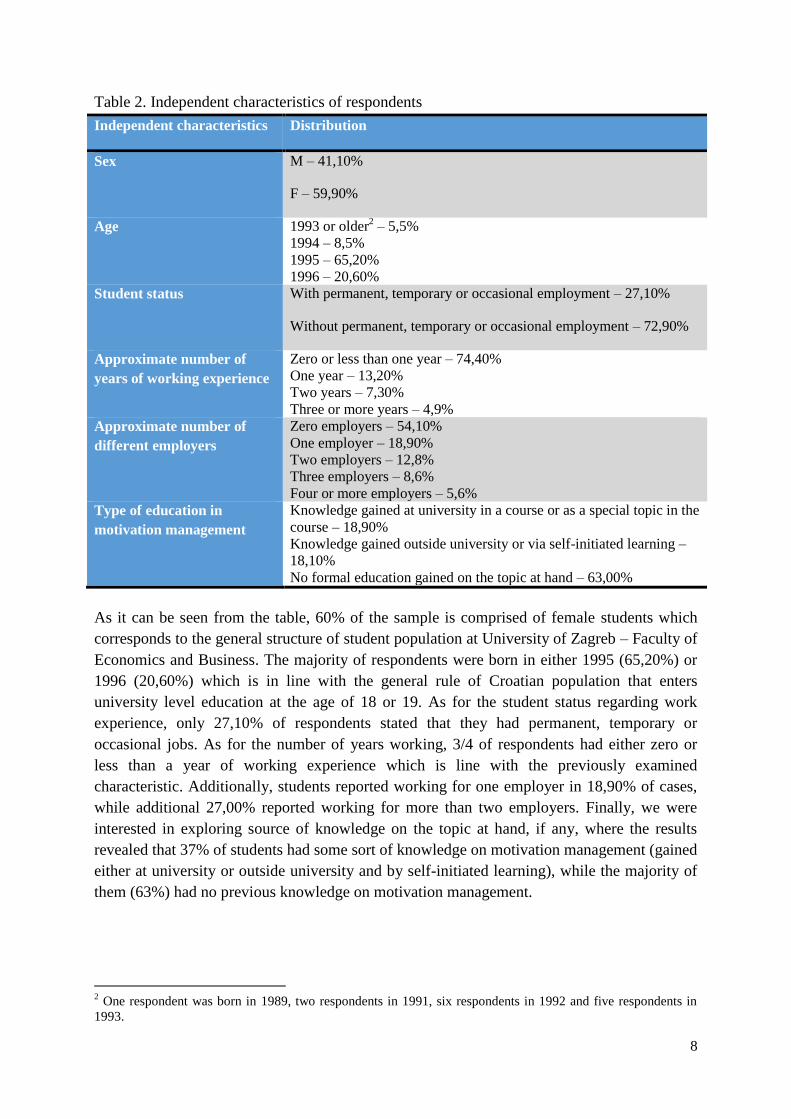
Table 2. Independent characteristics of respondents
Independent characteristics Distribution
Sex M – 41,10%
F – 59,90%
Age 1993 or older2 – 5,5%
1994 – 8,5%
1995 – 65,20%
1996 – 20,60%
Student status With permanent, temporary or occasional employment – 27,10%
Without permanent, temporary or occasional employment – 72,90%
Approximate number of
years of working experience
Zero or less than one year – 74,40%
One year – 13,20%
Two years – 7,30%
Three or more years – 4,9%
Approximate number of
different employers
Zero employers – 54,10%
One employer – 18,90%
Two employers – 12,8%
Three employers – 8,6%
Four or more employers – 5,6% Type of education in
motivation management
Knowledge gained at university in a course or as a special topic in the
course – 18,90%
Knowledge gained outside university or via self-initiated learning –
18,10%
No formal education gained on the topic at hand – 63,00%
As it can be seen from the table, 60% of the sample is comprised of female students which
corresponds to the general structure of student population at University of Zagreb – Faculty of
Economics and Business. The majority of respondents were born in either 1995 (65,20%) or
1996 (20,60%) which is in line with the general rule of Croatian population that enters
university level education at the age of 18 or 19. As for the student status regarding work
experience, only 27,10% of respondents stated that they had permanent, temporary or
occasional jobs. As for the number of years working, 3/4 of respondents had either zero or
less than a year of working experience which is line with the previously examined
characteristic. Additionally, students reported working for one employer in 18,90% of cases,
while additional 27,00% reported working for more than two employers. Finally, we were
interested in exploring source of knowledge on the topic at hand, if any, where the results
revealed that 37% of students had some sort of knowledge on motivation management (gained
either at university or outside university and by self-initiated learning), while the majority of
them (63%) had no previous knowledge on motivation management.
2 One respondent was born in 1989, two respondents in 1991, six respondents in 1992 and five respondents in
1993.
9
After analyzing students’ independent characteristics we were interested in exploring their
perception of importance of different pay structure elements, as well as different nonmaterial
motivation strategies. Additionally, we aimed at investigating differences in assigning
importance to aforementioned motivation strategies with regard to respondents’ independent
characteristics, such as sex, student status and previous knowledge on motivation
management. The results are shown in the next section.
3.1. Research results
In the theoretical part of the paper we presented different motivation strategies that can be
applied in the attempt to attract, encourage and retain employees. Since the contemporary
approach to motivating human resources is increasingly presented in the form of total reward
model (TRM) we decided to apply the same model to our research design. Accordingly,
respondents were asked to assign importance to different transactional and relational aspects
of rewards. Results are shown separately for the previously mentioned types of rewards.
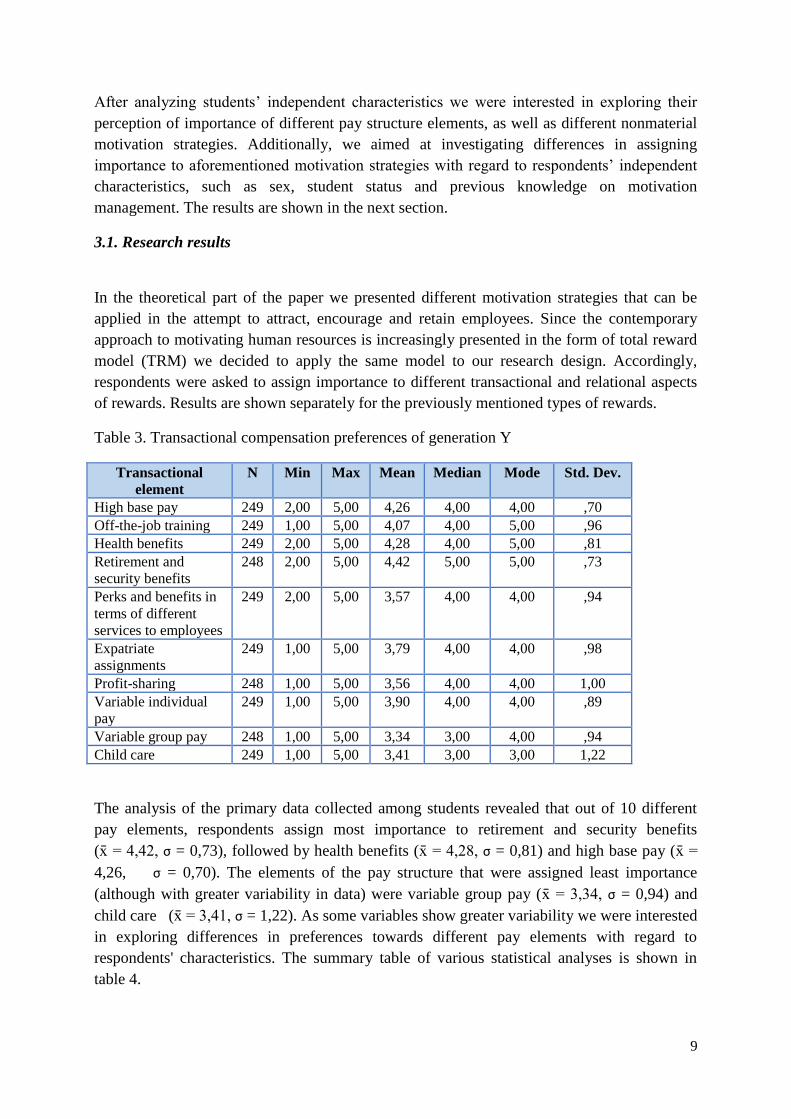
Table 3. Transactional compensation preferences of generation Y
Transactional
element
N Min Max Mean Median Mode Std. Dev.
High base pay 249 2,00 5,00 4,26 4,00 4,00 ,70
Off-the-job training 249 1,00 5,00 4,07 4,00 5,00 ,96
Health benefits 249 2,00 5,00 4,28 4,00 5,00 ,81
Retirement and
security benefits
248 2,00 5,00 4,42 5,00 5,00 ,73
Perks and benefits in
terms of different
services to employees
249 2,00 5,00 3,57
4,00 4,00 ,94
Expatriate
assignments
249 1,00 5,00 3,79 4,00 4,00 ,98
Profit-sharing 248 1,00 5,00 3,56 4,00 4,00 1,00
Variable individual
pay
249 1,00 5,00 3,90 4,00 4,00 ,89
Variable group pay 248 1,00 5,00 3,34 3,00 4,00 ,94
Child care 249 1,00 5,00 3,41 3,00 3,00 1,22
The analysis of the primary data collected among students revealed that out of 10 different
pay elements, respondents assign most importance to retirement and security benefits
(x̄ = 4,42, σ = 0,73), followed by health benefits (x̄ = 4,28, σ = 0,81) and high base pay (x̄ =
4,26, σ = 0,70). The elements of the pay structure that were assigned least importance
(although with greater variability in data) were variable group pay (x̄ = 3,34, σ = 0,94) and
child care (x̄ = 3,41, σ = 1,22). As some variables show greater variability we were interested
in exploring differences in preferences towards different pay elements with regard to
respondents' characteristics. The summary table of various statistical analyses is shown in
table 4.
10
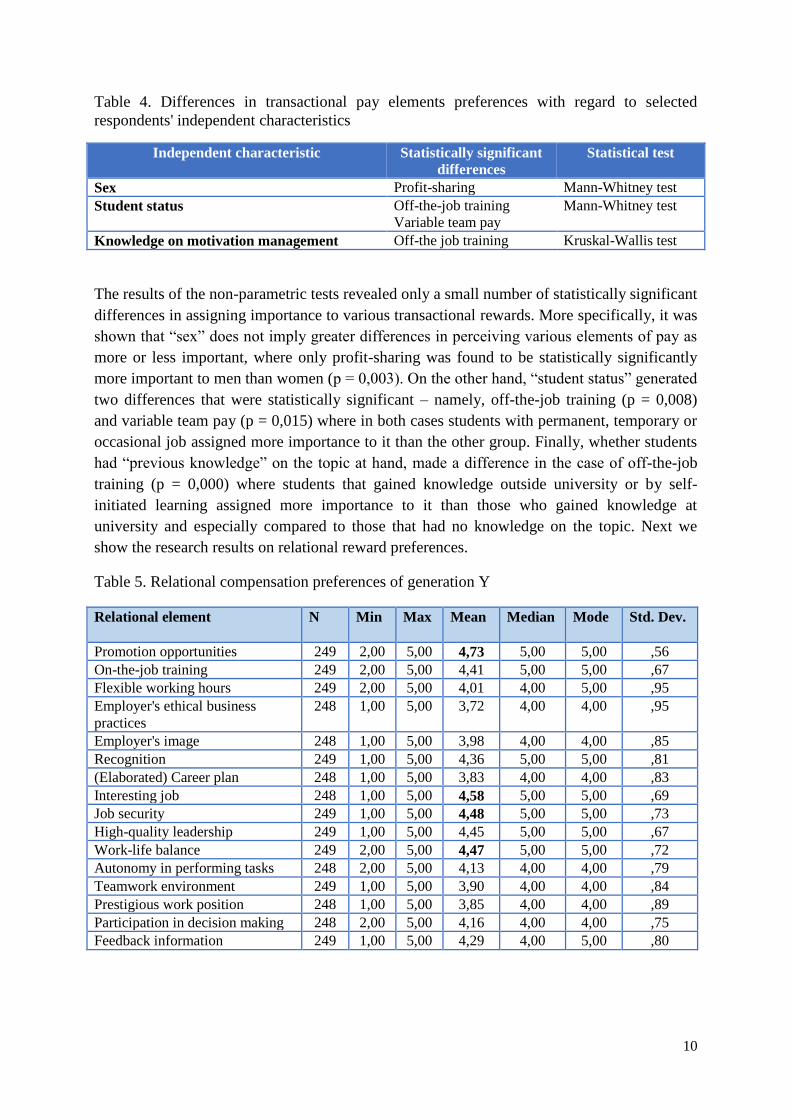
Table 4. Differences in transactional pay elements preferences with regard to selected
respondents' independent characteristics
Independent characteristic Statistically significant
differences
Statistical test
Sex Profit-sharing Mann-Whitney test
Student status Off-the-job training
Variable team pay
Mann-Whitney test
Knowledge on motivation management Off-the job training Kruskal-Wallis test
The results of the non-parametric tests revealed only a small number of statistically significant
differences in assigning importance to various transactional rewards. More specifically, it was
shown that “sex” does not imply greater differences in perceiving various elements of pay as
more or less important, where only profit-sharing was found to be statistically significantly
more important to men than women (p = 0,003). On the other hand, “student status” generated
two differences that were statistically significant – namely, off-the-job training (p = 0,008)
and variable team pay (p = 0,015) where in both cases students with permanent, temporary or
occasional job assigned more importance to it than the other group. Finally, whether students
had “previous knowledge” on the topic at hand, made a difference in the case of off-the-job
training (p = 0,000) where students that gained knowledge outside university or by self-
initiated learning assigned more importance to it than those who gained knowledge at
university and especially compared to those that had no knowledge on the topic. Next we
show the research results on relational reward preferences.
Table 5. Relational compensation preferences of generation Y
Relational element
N Min Max Mean Median Mode Std. Dev.
Promotion opportunities 249 2,00 5,00 4,73 5,00 5,00 ,56
On-the-job training 249 2,00 5,00 4,41 5,00 5,00 ,67
Flexible working hours 249 2,00 5,00 4,01 4,00 5,00 ,95
Employer's ethical business
practices
248 1,00 5,00 3,72 4,00 4,00 ,95
Employer's image 248 1,00 5,00 3,98 4,00 4,00 ,85
Recognition 249 1,00 5,00 4,36 5,00 5,00 ,81
(Elaborated) Career plan 248 1,00 5,00 3,83 4,00 4,00 ,83
Interesting job 248 1,00 5,00 4,58 5,00 5,00 ,69
Job security 249 1,00 5,00 4,48 5,00 5,00 ,73
High-quality leadership 249 1,00 5,00 4,45 5,00 5,00 ,67
Work-life balance 249 2,00 5,00 4,47 5,00 5,00 ,72
Autonomy in performing tasks 248 2,00 5,00 4,13 4,00 4,00 ,79
Teamwork environment 249 1,00 5,00 3,90 4,00 4,00 ,84
Prestigious work position 248 1,00 5,00 3,85 4,00 4,00 ,89
Participation in decision making 248 2,00 5,00 4,16 4,00 4,00 ,75
Feedback information 249 1,00 5,00 4,29 4,00 5,00 ,80
11
Several conclusions can be drawn from table 5. First of all, in comparison with the
transactional rewards presented in table 2, it is evident that respondents generally assign more
importance to non-material rewards. Additionally, less variability is present in the
respondents' preferences as all standard deviations are below 1, and are evidently lower than
in the case of material rewards. As for the more specific conclusions, the highest graded
relational rewards (mean value approximately 4,5 or higher) are as follows: promotion
opportunities (x̄ = 4,73, σ = 0,56), interesting job (x̄ = 4,58, σ = 0,69), job security (x̄ = 4,48, σ
= 0,73) and work-life balance (x̄ = 4,47, σ = 0,71). On the other hand, none of the examined
relational elements had mean value less than 3,5 (as was the case in transactional rewards),
with employer's ethical work practices being assigned least importance (x̄ = 3,72, σ = 0,95).
Again, as for the more detailed analysis of different subgroups we performed several tests, for
which summary is given in the next table.
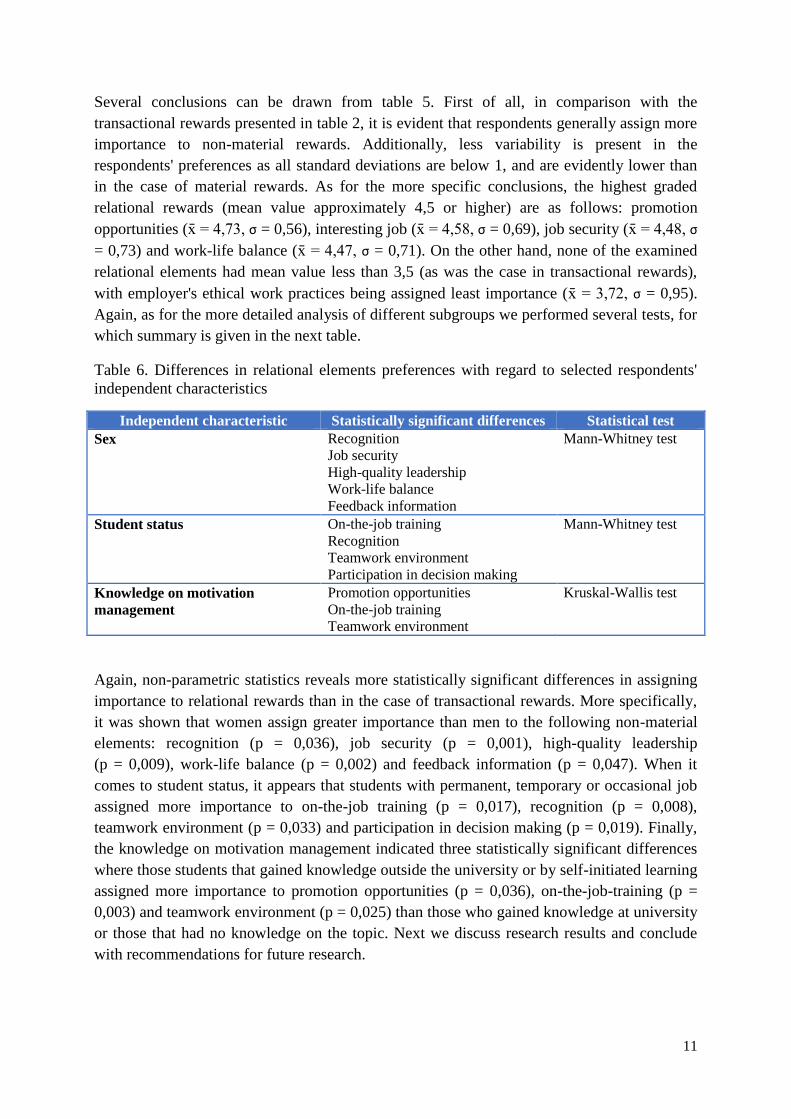
Table 6. Differences in relational elements preferences with regard to selected respondents'
independent characteristics
Independent characteristic Statistically significant differences Statistical test
Sex Recognition
Job security
High-quality leadership
Work-life balance
Feedback information
Mann-Whitney test
Student status On-the-job training
Recognition
Teamwork environment
Participation in decision making
Mann-Whitney test
Knowledge on motivation
management
Promotion opportunities
On-the-job training
Teamwork environment
Kruskal-Wallis test
Again, non-parametric statistics reveals more statistically significant differences in assigning
importance to relational rewards than in the case of transactional rewards. More specifically,
it was shown that women assign greater importance than men to the following non-material
elements: recognition (p = 0,036), job security (p = 0,001), high-quality leadership
(p = 0,009), work-life balance (p = 0,002) and feedback information (p = 0,047). When it
comes to student status, it appears that students with permanent, temporary or occasional job
assigned more importance to on-the-job training (p = 0,017), recognition (p = 0,008),
teamwork environment (p = 0,033) and participation in decision making (p = 0,019). Finally,
the knowledge on motivation management indicated three statistically significant differences
where those students that gained knowledge outside the university or by self-initiated learning
assigned more importance to promotion opportunities (p = 0,036), on-the-job-training (p =
0,003) and teamwork environment (p = 0,025) than those who gained knowledge at university
or those that had no knowledge on the topic. Next we discuss research results and conclude
with recommendations for future research.
12
4. Discussion and conclusions
Research implications
Generation Y in Croatia grew in quite unique circumstances. It witnessed the breakup of
Yugoslavia and formation of Croatia as an independent state (1990), war of independence
(1991-1995) all accompanied by transition to market economy and country’s westernization.
By the time millennialls started to enter the workforce (end of 1990) Croatia was an
independent state, preparing for EU membership (candidate since June 2004) and a growing
European economy. Since 1990 the Croatian economy has undergone several expansion and
contraction periods. In terms of business cycles, the beginning of 1990s can be characterized
as a recession period. The first recession ended in mid-1994. The second recession began in
1999, and the third in the last quarter of 2008 (Cerovac, 2005, Krznar, 2011) and has just
ended in 2015. Croatia is currently faced with an unemployment rate of 17,2% (Croatian
Bureau of Statistics, 2015) and Generation Y comprising 41,57% of the total number of
unemployed persons.
Current research indicates that Generation Y prefers intrinsic over extrinsic compensation.
The data drawn from the sample of Generation Y in Croatia confirms this finding. However,
we must emphasize that the economic conditions in Croatia are very different from the
economic context experienced by other nations that participated in such research and that this
finding is almost surprising. Furthermore, Generation Y in Croatia grew up in the context that
is significantly different than in these countries. Interestingly, in the set of transactional
rewards, benefits (health and retirement and security) are even more attractive than the salary.
This finding would not be as interesting, if the benefits preferred were not those that are
usually more attractive to older employees. Additionally, although theory usually considers
variable pay as an important motivational factor, for Generation Y in Croatia it is the least
preferred transactional reward.
Within the set of relational rewards we explored as a part of this research, we confirmed the
importance of promotion opportunities, interesting job and work-life balance. Besides
aforementioned, another relational reward that was given very high rating is job security.
Although job security has been found to be important motivational factor by previous research
(e.g. Dries, Pepermans & De Kerpel, 2008) this finding can be assigned to current economic
situation in Croatia (high unemployment rate).
Generation Y is not necessarily a homogenous group. Our research has shown that there are
some statistically significant differences in reward preferences depending upon respondents’
independent characteristics, namely sex, current student status and previous
knowledge/education on motivation. Women assign greater importance than men to several
relational rewards: recognition, job security, high-quality leadership, work-life balance and
feedback information. Only profit-sharing was found to be statistically significantly more
important to men than woman.
13
Practical implications
Recommendations for HR managers. Several conclusions and recommendations for HR
managers stem from the research results explained in section 3. As for the general perception
of importance of different transactional pay elements, it is recommendable to HR managers
to put special emphasis on perks and benefits while designing pay strategy for the younger
generation that is about to enter workforce. Additionally, as generation Y is obviously
concerned about security, it is advisable to tailor-make perks and benefits in terms of
retirement and health as these were the highest graded material elements in our research.
Although variable and group pay that depends on either team or organizational success was
not perceived as highly important by our respondents, the research does imply that men favor
more profit-sharing than woman. As the results also indicated that students with job assign
more importance to variable team pay it seems that there is a strong relationship between
experience and practice in the business world and the perception of importance of individual
and team contribution to organizational performance. It is therefore advisable to HR managers
to create sense of awareness between potential and new employees that performance pay is of
crucial importance for organizational success and therefore individual success as well.
Finally, among experienced individuals and among those respondents with self-initiative need
for learning, off-the-job training is among the most important indirect transactional rewards.
Since we are living in the knowledge age, and especially for the organizations that build their
competitive advantage on knowledge technologies, it is recommended to design different
modalities of education and training outside the organization.
The relational aspects of motivation and reward management indicate that Generation Y is
dominantly interested in promotion opportunities so careful career planning for those
individuals is a must in HR activities. Additionally, although promotion is a prerequisite for
motivation and consequently job satisfaction, work-life balance is a factor that has become
central and very specific for Generation Y individuals. In that sense, HR directors are advised
to delicately plan and execute work activities in order to allow employees to maintain the
balance between the work obligations and private life, especially in case of women who have
assigned more importance to that relational element than man. Besides work-life balance,
women have generally indicated more inclination towards recognition, feedback information
and high-quality leadership. All these factors should be taken into account while designing
specific HR policies and activities, especially given the fact that women are increasingly
entering the workforce as highly-educated individuals. It is necessary to emphasize that young
Generation Y individuals with working experience highly favor on-the-job training, teamwork
and participation in decision making so recommendation for HR managers would be to
investigate different forms of training that this generation would prefer more over other forms
(perhaps, more e-learning), and to implement more teamwork design to their work tasks.
Finally, as leadership quality is probably crucial in all previously mentioned activities, it
should be noted that this generation expects from their leaders to able to apply a more
“coaching” style of leadership as well to be able themselves to demonstrate the knowledge
and skills they ask from Generation Y individuals.
14
References
1. Cerovac, S. (2005) Novi kompozitni indikatori za hrvatsko gospodarstvo: prilog razvoju
domaćeg sustava cikličkih indikatora, Croatian National Bank, Istraživanja, 1(16)
2. Chiang, F. F. T., Birch, T. (2007) The Transferability of Management Practices: Examining
Cross-National Differences, Human Relations, 24(1): 80-96
3. Croatian Bureau of Statistics (2014) Statistical Yearbook of the Republic of Croatia,
http://www.dzs.hr/Hrv_Eng/ljetopis/2014/sljh2014.pdf
4. Dries, N., Pepermans, R., De Kerpel, (2008) Exploring four generations' beliefs about career,
Journal of Managerial Psychology, 23(8): 907-928
5. Eisner, S. P. (2005) Managing Generation Y, SAM Advanced Management Journal, 70(4): 4-15
6. Griffin, R. W., Moorhead, G. (2004) Organizational Behavior, Cengage Learning
7. Guillot-Soulez, C., Soulez, S. (2014) On the heterogeneity of Generation Y job preferences,
Employee Relations, 36(4): 319–332
8. Hershatter, A., Epstein, M. (2010) Millennials and the World of Work: An Organization and
Management Perspective, Journal of Business Psychology, 25:211–223
9. Hewitt, M. L. M., Ukpere, W. I. (2012) Leadership challenges associated with the management
of Generation Y employees: A proposed theoretical model, African Journal of Business
Management, 6(19): 5999-6004.
10. Holt, S., Marques, J., Way, D. (2012) Bracing for the Millennial Workforce: Looking for Ways
to Inspire Generation Y, Journal of Leadership, Accountability and Ethics, 9(6): 81-93
11. Josiam, B. M., Crutsinger, C., Reynolds, J. S., Crutsinger, C. D., Dotter, T., Ramakrishnan, S.,
Baum, T. & Devine, F. G. (2009) An Empirical Study of the Work Attitudes of Generation Y
College Students in the USA: the Case of Hospitality and Merchandising Undergraduate
Majors, Journal of Services Research, 9(1): 5-30
12. Kong, H., Wang, S., Fu, X. (2015) Meeting career expectation: can it enhance job satisfaction
of Generation Y?, International Journal of Contemporary Hospitality Management, 27(1):
147–168
13. Krznar, I. (2011) Identifying Recession and Expansion Periods in Croatia, Working paper
series W-29, Croatian National Bank, http://www.hnb.hr/publikac/istrazivanja/w-029.pdf
14. Kultalahti, S., Viitala, R. L. (2014) Sufficient challenges and a weekend ahead – Generation Y
describing motivation at work, Journal of Organizational Change Management, 27(4): 569-
582
15. Kultalahti, S., Viitala, R. L. (2015) Generation Y – challenging clients for HRM?, Journal of
Managerial Psychology, 30(1): 101-114
16. Laird, M. D., Harvey, P., Lancaster, J. (2015) Accountability, entitlement, tenure, and
satisfaction in Generation Y", Journal of Managerial Psychology, 30(1): 87–100
17. Luscombe, J., Lewis, I., Biggs, H. C. (2013) Essential elements for recruitment and retention:
Generation Y, Education & Training, 55(3): 272-290
18. Martin, C. A. (2005) From high maintenance to high productivity: What managers need to
know about Generation Y, Industrial and Commercial Training, 37(1): 39-44
19. Meier, J., Crocker, S. F. (2010) Generation Y in the Workforce: Managerial Challenges,
Journal of Human Resource and Adult Learning, 6(1): 68-78
20. Pološki Vokić, N., Vidović, M. (2015) Managing internal digital publics: What matters is
digital age and not digital nativity, Public Relations Review, 41, 232-241.
21. Sallop, L. J., Kirby, S. L. (2007) The Role of Gender and Work Experience on Career and
Work Force Diversity Expectations, Journal of Behavioral and Applied Management, 122-140
22. Smola, K. W., Sutton, C. D. (2002) Generational differences: revisiting generational work
values for the new millennium, Journal of Organizational Behavior, 23 (4): 363-382
23. Solnet, D., Kralj, A., Kandampully, J. (2012) Generation Y Employees: An Examination of
Work Attitude Differences, Journal of Applied Management and Entrepreneurship; 17(3): 36-
54
15
24. Wong, M., Gardiner, E., Lang, W., Coulon, L. (2008) Generational differences in personality
and motivation: Do they exist and what are the implications for the workplace?, Journal of
Managerial Psychology, 23(8): 878-890