Embed Size (px)
Citation preview
NDT in Canada 2017 Conference | June 6-8 Quebec City, Quebec Pg 1 of 19
Adapting CSA W59 ultrasonic inspections for use with distance-amplitude techniques
Paul Holloway1, Andrew Crawford2, Sean Keay3, Viwek Vaidya4
1 Holloway NDT & Engineering Inc., Georgetown, ON (905) 703-0201, [email protected]
2 Buffalo Inspection Services, Edmonton, AB (587) 760-0872, [email protected]
3 SNC-Lavalin, St. John’s, NL (709) 758-4950, [email protected]
4 Techno Vogue Inc., Beaconsfield, QC (514) 712-2801, [email protected]
Abstract Ultrasonic testing (UT) of welds to CSA W59 is based on techniques dating back the late 1960’s with the original inception of UT into AWS D1.0. Since the original development, there has been significant progress in UT technologies, yet North American codes have failed to keep pace. The foundation of the W59/D1.1 approach is to manually or programmatically calculate attenuation using a linear approximation of 2 dB per inch. This approach places restrictions on equipment, incurs calibrations indicative of the analog era, and uses prescriptive procedure tables and angle-specific acceptance criteria. The protocols associated with these procedures have outlived their usefulness, and unnecessarily inhibit progress in adapting to more suitable transducers and newer technologies such as phased array. An overview of the proposed changes to W59 currently under review are presented. The differences between the 2 dB factor and actual attenuation are determined through simulation and experiment, providing the basis of the corrections applied to the existing acceptance tables, adapted for use with distance amplitude techniques. The new technique is shown to improve repeatability, and allows for a broader range of transducers while still maintaining equivalent quality levels. It also offers schedule advantages when correctly applied.
We are at a point in our civilization where the rate of change of technology is fast heading vertical; to stay with the status quo will ultimately render us uncompetitive and compromise our national supply chain. Adoption and advancement are the future that we must pursue.
Keywords: time-corrected gain (TCG), distance-amplitude curve (DAC), phased array ultrasonic testing (PAUT), weld inspection
NDT in Canada 2017 Conference | June 6-8 Quebec City, Quebec Pg 2 of 19
Executive Summary This paper documents the development of an alternative ultrasonic testing (UT) technique for examination of structural welds as per CSA W59.
The purpose of developing a new technique is to bring CSA W59 into the 21st century, allowing for modern techniques, equipment, and to provide a pathway for future development not permitted by the current 1960’s-era practices.
The existing techniques were part of the 1969 edition of AWS D1.0. They were not developed from scientific principles or empirical evidence, yet have remained the “line in the sand” for structural UT in North America for nearly 50 years. Since then, exponential changes have taken place in technology and in the general UT world, yet Canadian and U.S codes have failed to keep pace. This has resulted in awkward techniques that many technicians misunderstand and circumvent. Ultimately, these outdated techniques fail to serve the purposes of repeatable and accurate inspections they propose to facilitate.
The existing fixed attenuation, or “FA” technique is shown to be based on assumptions of sound attenuation and inspection angles which do not hold up under scientific scrutiny. There is a philosophy of “one probe to rule them all” and angle-specific procedure tables which were installed to achieve consistent inspection results. However, the practices involved in limiting one’s options does not produce the consistencies intended.
A new technique is presented which is similar to those used elsewhere in the UT industry. This is written as a true alternative to the existing technique, offering adapted acceptance criteria that retain the existing quality levels. Mathematical models and experimental data are presented which were used to generate the new criteria. Equivalence is also demonstrated through modeling. Variation in results is also significantly reduced.
The proposed alternative technique is under public review for inclusion in CSA W59-2018. The techniques developed in 1969 have served industry well for a very long time, but change is inevitable. To progress in a world of rapidly advancing technologies, it is important to adopt less regressive, more forward-thinking practices that can adapt and suit the needs of today.
NDT in Canada 2017 Conference | June 6-8 Quebec City, Quebec Pg 3 of 19
1. Introduction The ultrasonic testing techniques in W59 Clause 8.2 [1] have served the industry well for nearly 50 years. These techniques were developed in the late 1960s and first appeared as part of AWS D1.0 (1969) Appendix C[2]. At the time, this represented a major shift forward in providing an alternative to industrial radiography for volumetric weld inspection. However, these techniques have remained largely unchanged while ultrasonic technology and other codes have advanced significantly. The existing techniques are based on outdated equipment and approximations , making it impossible to conform to modern practices. CSA W59, AWS D1.1[3] and AWS D1.5[4] all use a “one size fits all” large, low frequency transducer and 2 dB/inch estimate of attenuation. They remain only major codes worldwide to assume this “one-size-fits-all” approach to transducers and attenuation. The equipment limitations, prescriptive procedures, and sizing calculations make inspection time consuming and confusing for the inspector, often times resulting in shortcuts and use of improper transducers. The existing technique has reached the end-of-life, and has for many years been restrictive towards progress.
This paper attempts to address many of the technical limitations associated with the existing technique related to the use of the 2 dB per inch model for attenuation. It describes the adoption of the Time Corrected Gain (TCG) technique for sensitivity calibration, common in most other weld inspection codes. The advantages of using a TCG, and how the existing acceptance criteria were adapted for its use, are discussed. Other changes to the code under review including flaw length sizing [5], calibration schemes, and updated terminologies are not addressed in this paper.
Because of the international nature of these techniques, metric and U.S. units are used interchangeably throughout.
2. Need for Change The question prior to any change to a long-standing practice is: “why fix what ain’t broke?”. Whilst workmanship acceptance criteria are conservative and have a successful history, modern fabrication methods require a more flexible approach that does not repair what are essentially harmless defects that have been sentenced through subjective engineering assessment rather than empirical evaluation. The system is indeed broke(n) as it pertains to practicality and repeatability, resulting in numerous shortcuts taken in the field and a lack of understanding by the common inspector.
Many inspectors shy away from structural work due in large part to the archaic fixed attenuation estimates requiring the “D = A – B - C” calculation for indication rating. Many do not understand the correlation between the large probe and the 2 dB/inch attenuation estimate, hence different probes are substituted in the field. The 2 dB/inch estimate has its shortcomings (Section 4.1), and substitution with a different probe only makes things worse. There are many idiosyncrasies in W59 that can simply be replaced by modern, sensible processes that are easier to understand and to practice.
Advancements in ultrasonic testing now enable us to size things three-dimensionally rather than simply in one dimension. The proposed advances in the code pave the way for adoption of these newer technologies.
It is stressed that the changes presented do not adversely affect the conservative practices and acceptance levels of the code as practiced for decades. The revisions proposed herein are intended to provide a more practical approach to the test procedure, which is intended to result in more precise and accurate examinations.
3. Elements of the Existing Technique The existing techniques in CSA W59 are based on a workmanship approach in which indications are graded based primarily on their amplitudes. It is known that the amplitude of defects has little correlation to their size due to their anisotropic and fractal nature. Misconceptions regarding workmanship based criteria have been presented before, and as a reminder it should be stressed that its actual function is to assess weld quality, not integrity [6]. Workmanship inspections are fundamentally conservative, often times calling for the removal of innocuous slag or porosity colonies posing little or no threat to weld integrity. Ironically, the act of repairing of such defects could be more detrimental than the defects themselves. However, a workmanship approach is much easier to apply than a fracture mechanics approach where defect characterization and height measurements are required.
The existing technique (herein referred to as the “fixed attenuation” or “FA” technique) utilizes a relatively large, low frequency transducer coupled to a correspondingly large wedge. The size, shape and frequency ranges are restricted to keep attenuation close to an assumed rate of 2 dB/inch. The reference level is then conveniently set at a single point:
NDT in Canada 2017 Conference | June 6-8 Quebec City, Quebec Pg 4 of 19
the 1.5 mm (0.06 inch) hole in the IIW-Type block. For examination, the user must adhere to procedure tables dictating the refracted angle(s) used based on the weld thickness category, and refer to tables for scanning gains according to sound path. During evaluation of indications, the indication rating is calculated by subtracting the indication level from the reference level, then subtracting 2 dB/inch (after the first inch of sound path). The resulting severity rating is then compared to a table for classification as “Large”, “Minor” or “Small” for disposition.
Regardless of weld geometry, the code assumes 70° as the “most desirable” angle [2] and enlists it as the primary angle for thicknesses up to 90 mm (3 ½ inches).
4. Drawbacks In the past 50 years since the FA technique was developed, digital equipment has replaced analog, and ultrasonic inspection is now commonplace in industry. The main advantage of the technique is a one-point calibration for sensitivity. But this simplification comes at a cost: bulky search units, prescriptive procedure tables and angle-specific acceptance criteria.
The drawbacks of the FA technique can be placed in two general categories (Table 1) and are detailed in the sections that follow.
4.1. Error incurred by the 2 dB per inch approximation Attenuation of ultrasonic waves is not a linear function. It is presumed that the authors of the original FA technique were aware of this, and decided upon a constant value of 2 dB/inch based on empirical results. Computer simulation shows that attenuation from the standard 5/8 inch square, 2.25 MHz transducer is indeed about 2 dB/inch if taken over very long sound path distances [10]. However, over the distances typically used during inspection, using 2 dB/inch will underestimate actual attenuation. Using the rearview mirror analogy: “Objects in mirror are bigger than they appear”.
4.2. Large search units inhibit inspection access At present, the FA technique prescribes a relatively narrow range for allowable transducer sizes and frequencies. Often, the typical selection is the square 5/8” or ¾” transducer mated to a “big red brick” or “snail” wedge. These wedges are difficult to maneuver in tight quarters, and the large surface areas may make coupling difficult.
Table 1: Main drawbacks of the existing FA technique
CATEGORY REASON REQUIREMENT DRAWBACK RESULT SEC.
Attenuation = 2 dB/inch
Simplified sensitivity calibration
Fixed transducer size & frequency
Inaccurate for typical sound paths used
Underestimates attenuation
4.1
“One size fits all” search unit is impractical, especially on thin welds
Wedge size too large to accommodate suitable approach distance
4.2
Large beam makes geometric discrimination very difficult
Missed defects or false positives
4.3
Angle-specific procedures and acceptance criteria
“To attain consistent results in ultrasonic weld testing it is necessary that a consistent procedure be used.” [2]
Assumes 70° is the “most desirable angle”, producing maximum reflection from a vertically oriented flaw (e.g. crack)
Max indication from a crack is typically the corner trap (surface breaking), maximum at angles less than 70°
Preference given to 70° ignores advantages of other angles and fails to consider weld geometry
4.4
Many procedures require scanning from the top side (with ground profile) for detection of top side flaws - vice versa for bottom side
Low probability of detection for surface breaking flaws such as cracks
4.5
NDT in Canada 2017 Conference | June 6-8 Quebec City, Quebec Pg 5 of 19
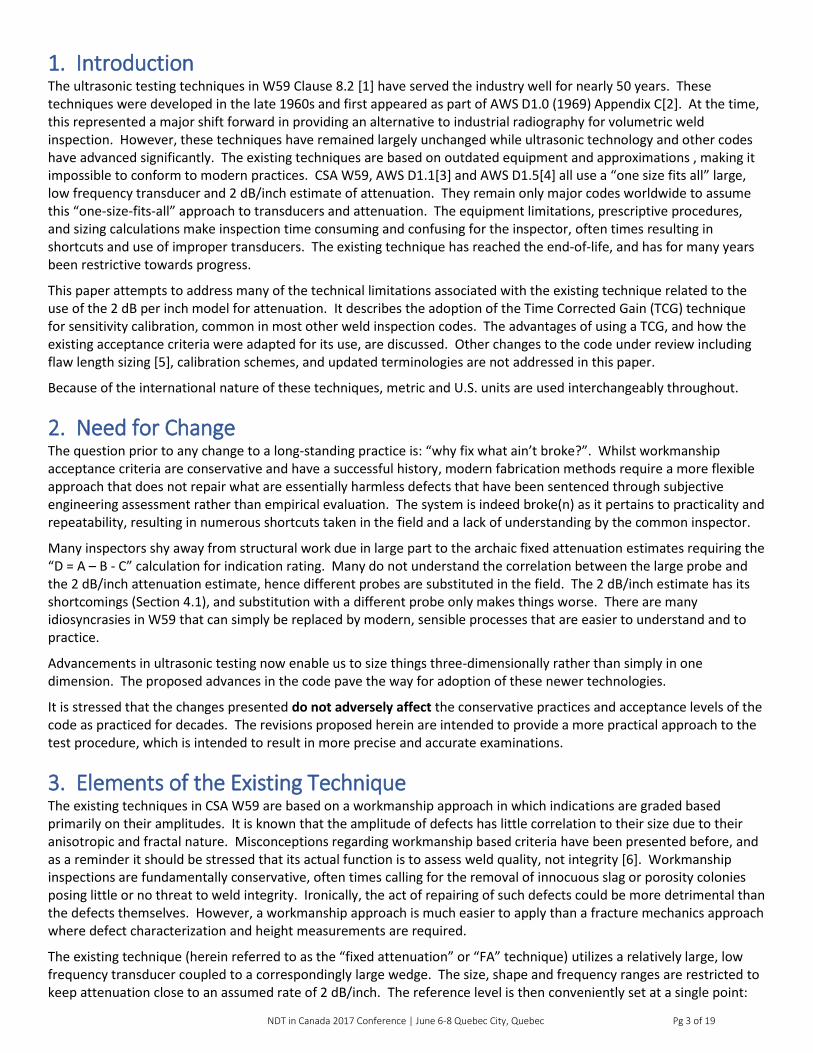
Besides their cumbersome nature, they are simply unsuitable for the full range of thicknesses required (8 to 200 mm) as shown in Figure 1. The weld shown has a 30° bevel on one side; fairly typical for thin plate. As can be seen, the root of the weld cannot be inspected on the first leg using either the brick or the snail. This forces the inspector to move back to the end of the 3rd leg, which is something generally avoided in ultrasonic testing.
By comparison, a short approach wedge would be better suited for the task. However, these can be fitted only to smaller transducers, and are thus not permitted by the code.
“Big red brick” – style AWS 70° wedge “Snail” – style AWS 70° wedge
Short approach 70 deg. wedge
Figure 1: Access of various wedges on a thin weld
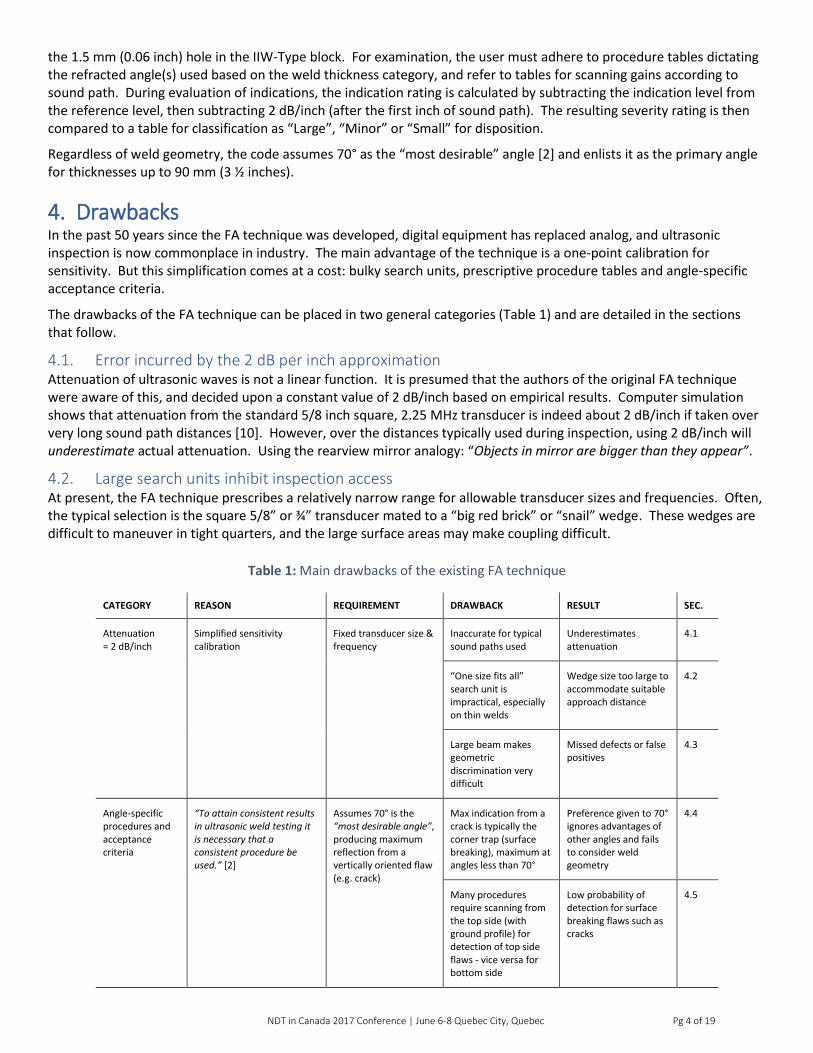
4.3. Difficulty in resolving flaws from geometric indications on thin welds The large size of the transducer produces a beam that is in multiple stages of reflection when dealing with thin plate. This produces overlapping signals from beams travelling in different directions.
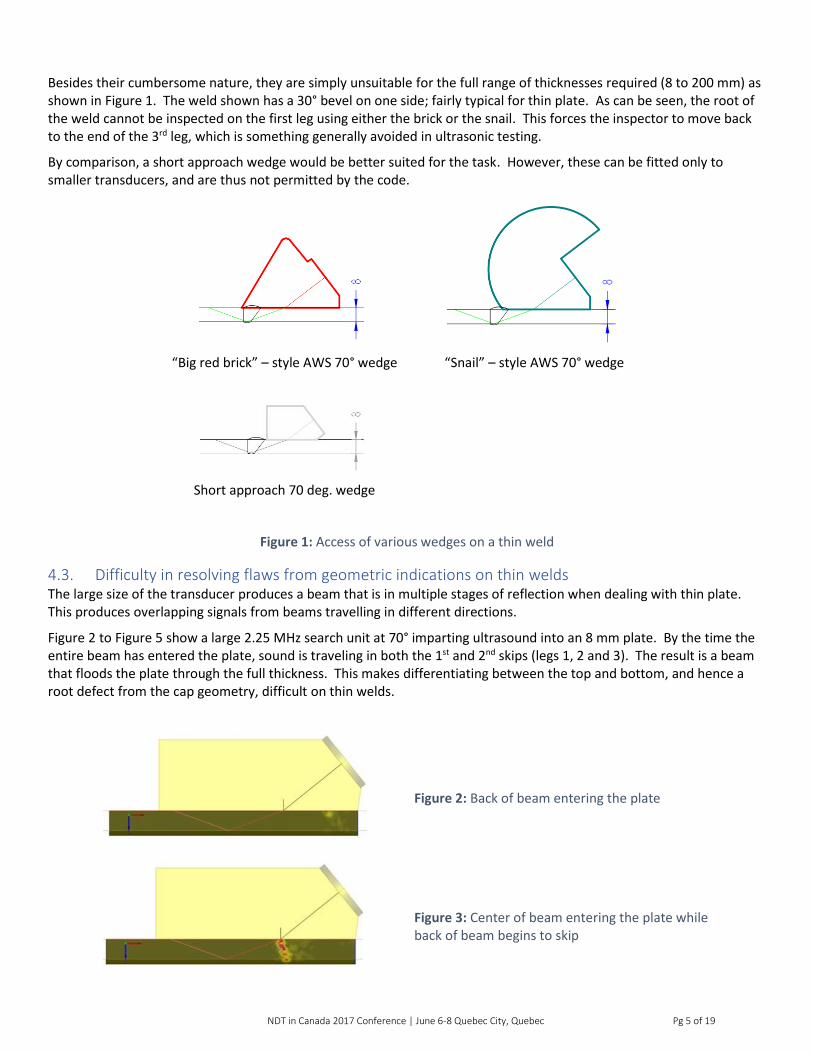
Figure 2 to Figure 5 show a large 2.25 MHz search unit at 70° imparting ultrasound into an 8 mm plate. By the time the entire beam has entered the plate, sound is traveling in both the 1st and 2nd skips (legs 1, 2 and 3). The result is a beam that floods the plate through the full thickness. This makes differentiating between the top and bottom, and hence a root defect from the cap geometry, difficult on thin welds.
Figure 2: Back of beam entering the plate
Figure 3: Center of beam entering the plate while back of beam begins to skip
NDT in Canada 2017 Conference | June 6-8 Quebec City, Quebec Pg 6 of 19
Figure 4: Center of beam has reached the backwall just as back of beam is completing a full skip
Figure 5: Top of beam just entering the plate while bottom of beam is now into the 2nd skip (3rd leg)
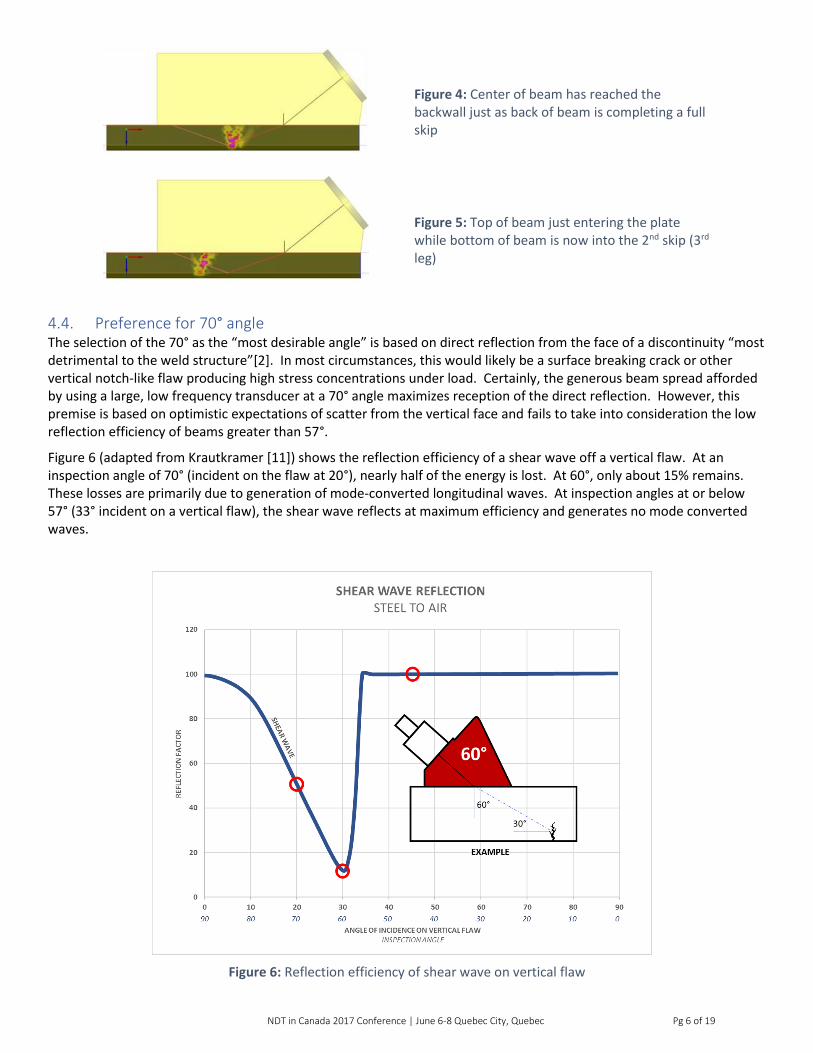
4.4. Preference for 70° angle The selection of the 70° as the “most desirable angle” is based on direct reflection from the face of a discontinuity “most detrimental to the weld structure”[2]. In most circumstances, this would likely be a surface breaking crack or other vertical notch-like flaw producing high stress concentrations under load. Certainly, the generous beam spread afforded by using a large, low frequency transducer at a 70° angle maximizes reception of the direct reflection. However, this premise is based on optimistic expectations of scatter from the vertical face and fails to take into consideration the low reflection efficiency of beams greater than 57°.
Figure 6 (adapted from Krautkramer [11]) shows the reflection efficiency of a shear wave off a vertical flaw. At an inspection angle of 70° (incident on the flaw at 20°), nearly half of the energy is lost. At 60°, only about 15% remains. These losses are primarily due to generation of mode-converted longitudinal waves. At inspection angles at or below 57° (33° incident on a vertical flaw), the shear wave reflects at maximum efficiency and generates no mode converted waves.
Figure 6: Reflection efficiency of shear wave on vertical flaw
NDT in Canada 2017 Conference | June 6-8 Quebec City, Quebec Pg 7 of 19
This is not to say that 45° is a more desirable angle, nor that 60° is a poor choice. Inspection angles should be selected based on weld geometry, including bevel angle and thickness, to achieve full coverage and ensure a good POD.
Placing narrow restrictions on equipment and forcing use of prescriptive techniques, not based on science or attributable to weld geometry, is counter-productive. It harms POD and restricts inspection to a short, ineffective menu of compromises.
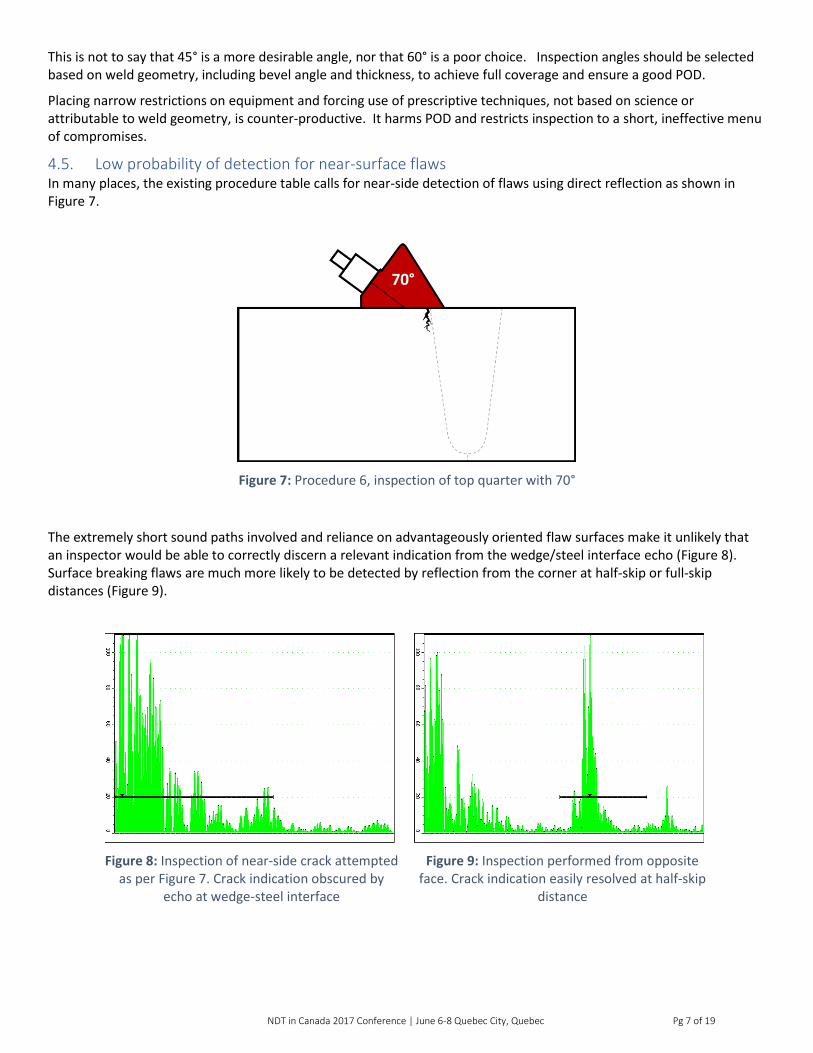
4.5. Low probability of detection for near-surface flaws In many places, the existing procedure table calls for near-side detection of flaws using direct reflection as shown in Figure 7.
Figure 7: Procedure 6, inspection of top quarter with 70°
The extremely short sound paths involved and reliance on advantageously oriented flaw surfaces make it unlikely that an inspector would be able to correctly discern a relevant indication from the wedge/steel interface echo (Figure 8). Surface breaking flaws are much more likely to be detected by reflection from the corner at half-skip or full-skip distances (Figure 9).
Figure 8: Inspection of near-side crack attempted as per Figure 7. Crack indication obscured by
echo at wedge-steel interface
Figure 9: Inspection performed from opposite face. Crack indication easily resolved at half-skip
distance
NDT in Canada 2017 Conference | June 6-8 Quebec City, Quebec Pg 8 of 19
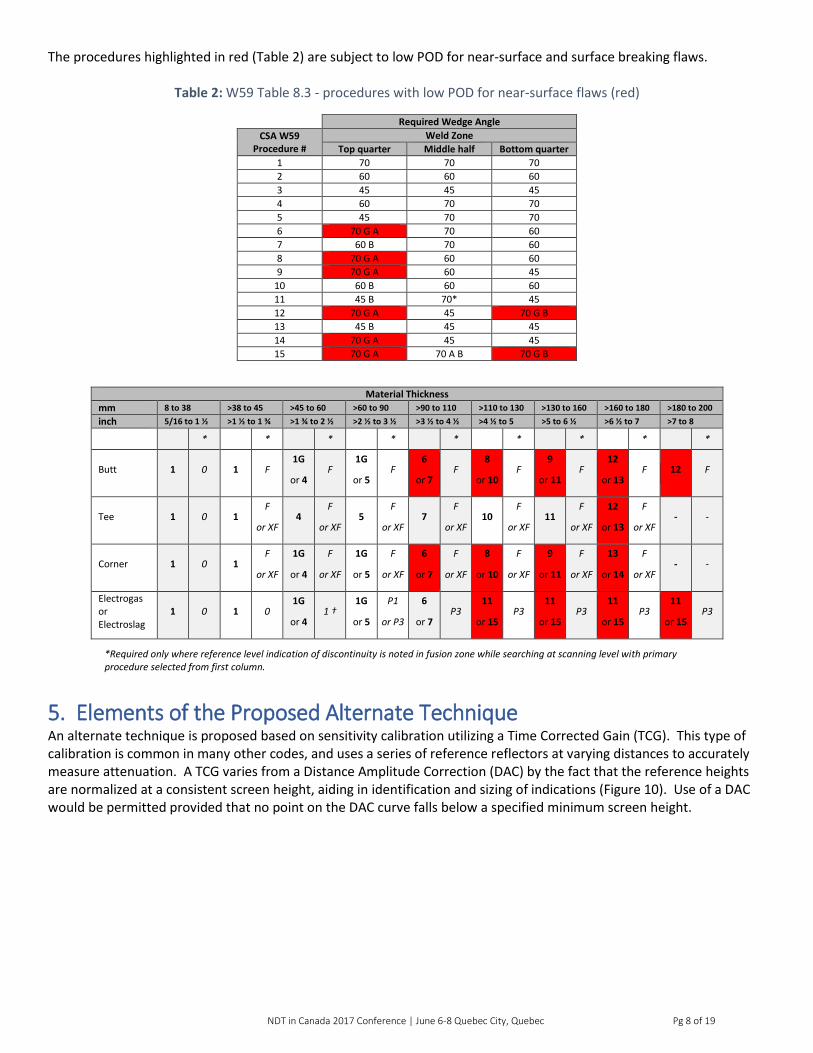
The procedures highlighted in red (Table 2) are subject to low POD for near-surface and surface breaking flaws.
Table 2: W59 Table 8.3 - procedures with low POD for near-surface flaws (red)
Required Wedge Angle
CSA W59 Procedure #
Weld Zone
Top quarter Middle half Bottom quarter
1 70 70 70
2 60 60 60
3 45 45 45
4 60 70 70
5 45 70 70
6 70 G A 70 60
7 60 B 70 60
8 70 G A 60 60
9 70 G A 60 45
10 60 B 60 60
11 45 B 70* 45
12 70 G A 45 70 G B
13 45 B 45 45
14 70 G A 45 45
15 70 G A 70 A B 70 G B
Material Thickness
mm 8 to 38 >38 to 45 >45 to 60 >60 to 90 >90 to 110 >110 to 130 >130 to 160 >160 to 180 >180 to 200
inch 5/16 to 1 ½ >1 ½ to 1 ¾ >1 ¾ to 2 ½ >2 ½ to 3 ½ >3 ½ to 4 ½ >4 ½ to 5 >5 to 6 ½ >6 ½ to 7 >7 to 8
* * * * * * * * *
Butt 1 0 1 F 1G
or 4 F
1G
or 5 F
6
or 7 F
8
or 10 F
9
or 11 F
12
or 13 F 12 F
Tee 1 0 1 F
or XF 4
F
or XF 5
F
or XF 7
F
or XF 10
F
or XF 11
F
or XF
12
or 13
F
or XF - -
Corner 1 0 1 F
or XF
1G
or 4
F
or XF
1G
or 5
F
or XF
6
or 7
F
or XF
8
or 10
F
or XF
9
or 11
F
or XF
13
or 14
F
or XF - -
Electrogas or Electroslag
1 0 1 0 1G
or 4 1 †
1G
or 5
P1
or P3
6
or 7 P3
11
or 15 P3
11
or 15 P3
11
or 15 P3
11
or 15 P3
*Required only where reference level indication of discontinuity is noted in fusion zone while searching at scanning level with primary procedure selected from first column.
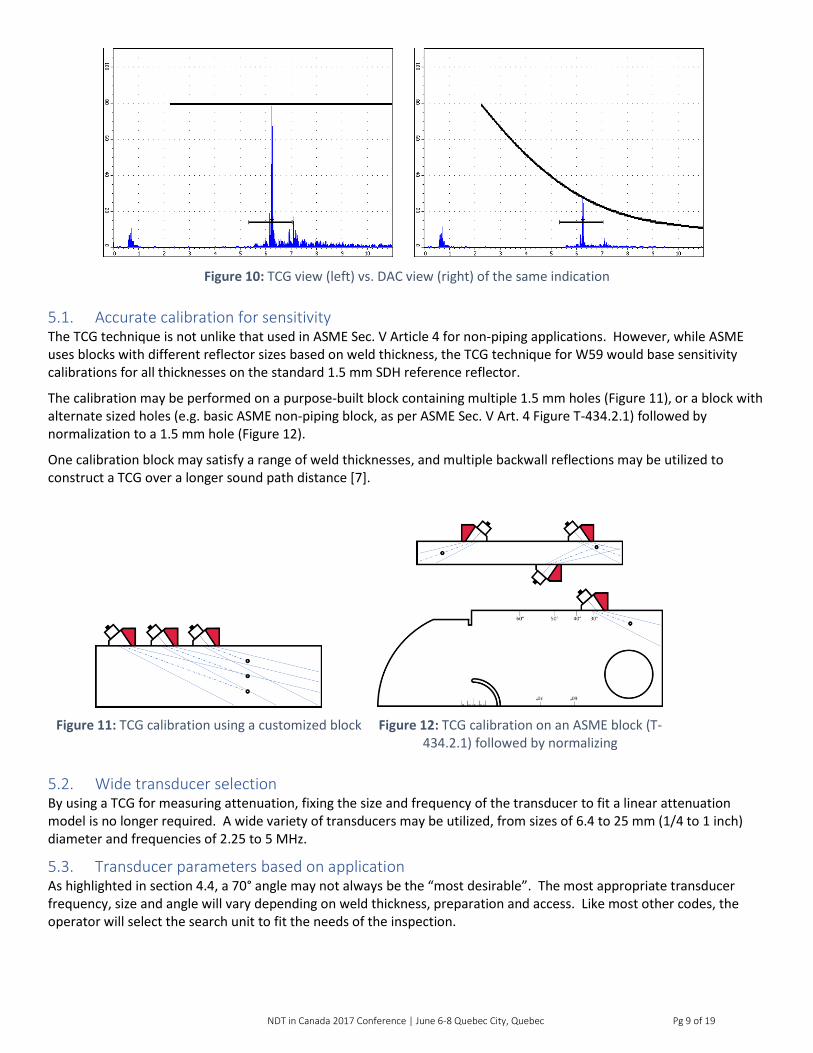
5. Elements of the Proposed Alternate Technique An alternate technique is proposed based on sensitivity calibration utilizing a Time Corrected Gain (TCG). This type of calibration is common in many other codes, and uses a series of reference reflectors at varying distances to accurately measure attenuation. A TCG varies from a Distance Amplitude Correction (DAC) by the fact that the reference heights are normalized at a consistent screen height, aiding in identification and sizing of indications (Figure 10). Use of a DAC would be permitted provided that no point on the DAC curve falls below a specified minimum screen height.
NDT in Canada 2017 Conference | June 6-8 Quebec City, Quebec Pg 9 of 19
Figure 10: TCG view (left) vs. DAC view (right) of the same indication
5.1. Accurate calibration for sensitivity The TCG technique is not unlike that used in ASME Sec. V Article 4 for non-piping applications. However, while ASME uses blocks with different reflector sizes based on weld thickness, the TCG technique for W59 would base sensitivity calibrations for all thicknesses on the standard 1.5 mm SDH reference reflector.
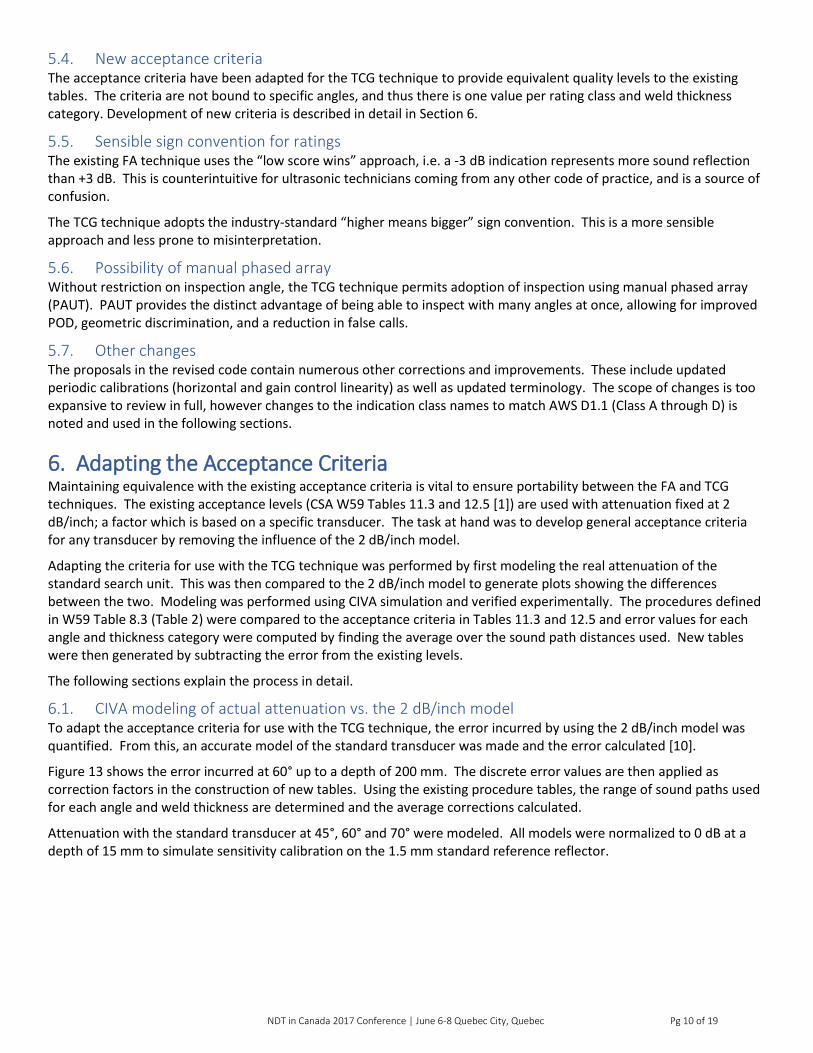
The calibration may be performed on a purpose-built block containing multiple 1.5 mm holes (Figure 11), or a block with alternate sized holes (e.g. basic ASME non-piping block, as per ASME Sec. V Art. 4 Figure T-434.2.1) followed by normalization to a 1.5 mm hole (Figure 12).
One calibration block may satisfy a range of weld thicknesses, and multiple backwall reflections may be utilized to construct a TCG over a longer sound path distance [7].
Figure 11: TCG calibration using a customized block .
Figure 12: TCG calibration on an ASME block (T-434.2.1) followed by normalizing
5.2. Wide transducer selection By using a TCG for measuring attenuation, fixing the size and frequency of the transducer to fit a linear attenuation model is no longer required. A wide variety of transducers may be utilized, from sizes of 6.4 to 25 mm (1/4 to 1 inch) diameter and frequencies of 2.25 to 5 MHz.
5.3. Transducer parameters based on application As highlighted in section 4.4, a 70° angle may not always be the “most desirable”. The most appropriate transducer frequency, size and angle will vary depending on weld thickness, preparation and access. Like most other codes, the operator will select the search unit to fit the needs of the inspection.
NDT in Canada 2017 Conference | June 6-8 Quebec City, Quebec Pg 10 of 19
5.4. New acceptance criteria The acceptance criteria have been adapted for the TCG technique to provide equivalent quality levels to the existing tables. The criteria are not bound to specific angles, and thus there is one value per rating class and weld thickness category. Development of new criteria is described in detail in Section 6.
5.5. Sensible sign convention for ratings The existing FA technique uses the “low score wins” approach, i.e. a -3 dB indication represents more sound reflection than +3 dB. This is counterintuitive for ultrasonic technicians coming from any other code of practice, and is a source of confusion.
The TCG technique adopts the industry-standard “higher means bigger” sign convention. This is a more sensible approach and less prone to misinterpretation.
5.6. Possibility of manual phased array Without restriction on inspection angle, the TCG technique permits adoption of inspection using manual phased array (PAUT). PAUT provides the distinct advantage of being able to inspect with many angles at once, allowing for improved POD, geometric discrimination, and a reduction in false calls.
5.7. Other changes The proposals in the revised code contain numerous other corrections and improvements. These include updated periodic calibrations (horizontal and gain control linearity) as well as updated terminology. The scope of changes is too expansive to review in full, however changes to the indication class names to match AWS D1.1 (Class A through D) is noted and used in the following sections.
6. Adapting the Acceptance Criteria Maintaining equivalence with the existing acceptance criteria is vital to ensure portability between the FA and TCG techniques. The existing acceptance levels (CSA W59 Tables 11.3 and 12.5 [1]) are used with attenuation fixed at 2 dB/inch; a factor which is based on a specific transducer. The task at hand was to develop general acceptance criteria for any transducer by removing the influence of the 2 dB/inch model.
Adapting the criteria for use with the TCG technique was performed by first modeling the real attenuation of the standard search unit. This was then compared to the 2 dB/inch model to generate plots showing the differences between the two. Modeling was performed using CIVA simulation and verified experimentally. The procedures defined in W59 Table 8.3 (Table 2) were compared to the acceptance criteria in Tables 11.3 and 12.5 and error values for each angle and thickness category were computed by finding the average over the sound path distances used. New tables were then generated by subtracting the error from the existing levels.
The following sections explain the process in detail.
6.1. CIVA modeling of actual attenuation vs. the 2 dB/inch model To adapt the acceptance criteria for use with the TCG technique, the error incurred by using the 2 dB/inch model was quantified. From this, an accurate model of the standard transducer was made and the error calculated [10].
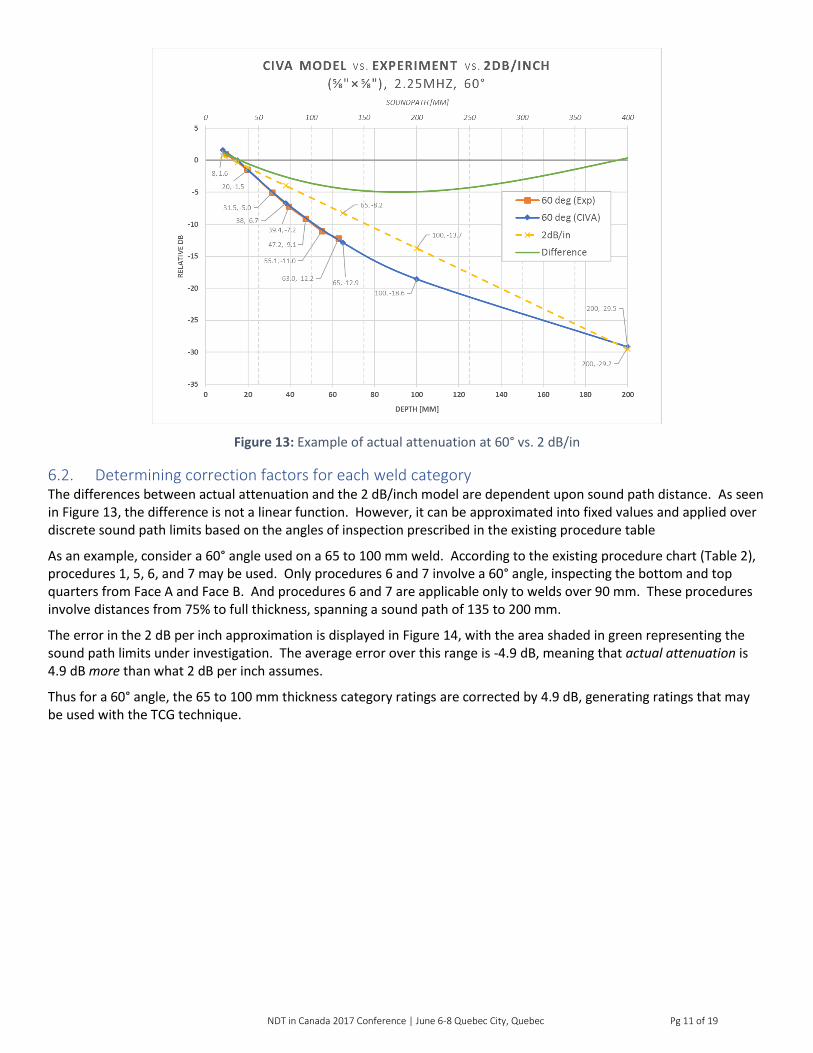
Figure 13 shows the error incurred at 60° up to a depth of 200 mm. The discrete error values are then applied as correction factors in the construction of new tables. Using the existing procedure tables, the range of sound paths used for each angle and weld thickness are determined and the average corrections calculated.
Attenuation with the standard transducer at 45°, 60° and 70° were modeled. All models were normalized to 0 dB at a depth of 15 mm to simulate sensitivity calibration on the 1.5 mm standard reference reflector.
NDT in Canada 2017 Conference | June 6-8 Quebec City, Quebec Pg 11 of 19
Figure 13: Example of actual attenuation at 60° vs. 2 dB/in
6.2. Determining correction factors for each weld category The differences between actual attenuation and the 2 dB/inch model are dependent upon sound path distance. As seen in Figure 13, the difference is not a linear function. However, it can be approximated into fixed values and applied over discrete sound path limits based on the angles of inspection prescribed in the existing procedure table
As an example, consider a 60° angle used on a 65 to 100 mm weld. According to the existing procedure chart (Table 2), procedures 1, 5, 6, and 7 may be used. Only procedures 6 and 7 involve a 60° angle, inspecting the bottom and top quarters from Face A and Face B. And procedures 6 and 7 are applicable only to welds over 90 mm. These procedures involve distances from 75% to full thickness, spanning a sound path of 135 to 200 mm.
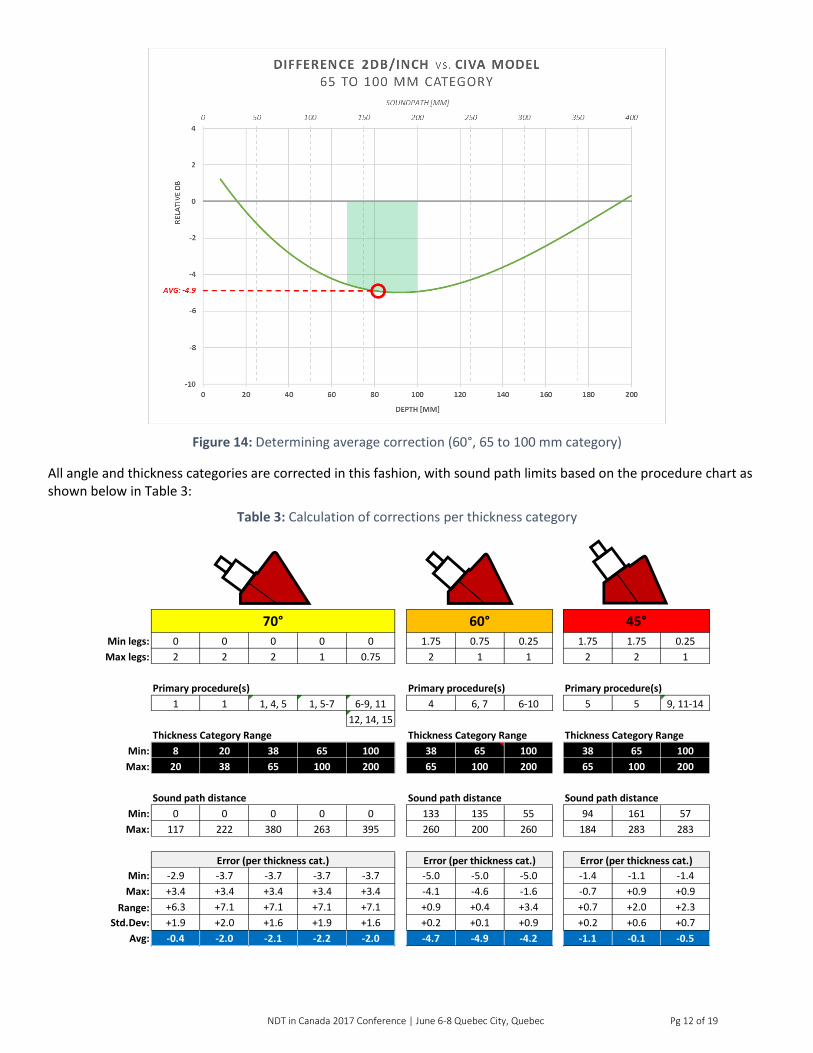
The error in the 2 dB per inch approximation is displayed in Figure 14, with the area shaded in green representing the sound path limits under investigation. The average error over this range is -4.9 dB, meaning that actual attenuation is 4.9 dB more than what 2 dB per inch assumes.
Thus for a 60° angle, the 65 to 100 mm thickness category ratings are corrected by 4.9 dB, generating ratings that may be used with the TCG technique.
NDT in Canada 2017 Conference | June 6-8 Quebec City, Quebec Pg 12 of 19
Figure 14: Determining average correction (60°, 65 to 100 mm category)
All angle and thickness categories are corrected in this fashion, with sound path limits based on the procedure chart as shown below in Table 3:
Table 3: Calculation of corrections per thickness category
Min legs: 0 0 0 0 0 1.75 0.75 0.25 1.75 1.75 0.25
Max legs: 2 2 2 1 0.75 2 1 1 2 2 1
Primary procedure(s) Primary procedure(s) Primary procedure(s)
1 1 1, 4, 5 1, 5-7 6-9, 11 4 6, 7 6-10 5 5 9, 11-14
12, 14, 15
Thickness Category Range Thickness Category Range Thickness Category Range
Min: 8 20 38 65 100 38 65 100 38 65 100
Max: 20 38 65 100 200 65 100 200 65 100 200
Sound path distance Sound path distance Sound path distance
Min: 0 0 0 0 0 133 135 55 94 161 57
Max: 117 222 380 263 395 260 200 260 184 283 283
Min: -2.9 -3.7 -3.7 -3.7 -3.7 -5.0 -5.0 -5.0 -1.4 -1.1 -1.4
Max: +3.4 +3.4 +3.4 +3.4 +3.4 -4.1 -4.6 -1.6 -0.7 +0.9 +0.9
Range: +6.3 +7.1 +7.1 +7.1 +7.1 +0.9 +0.4 +3.4 +0.7 +2.0 +2.3
Std.Dev: +1.9 +2.0 +1.6 +1.9 +1.6 +0.2 +0.1 +0.9 +0.2 +0.6 +0.7
Avg: -0.4 -2.0 -2.1 -2.2 -2.0 -4.7 -4.9 -4.2 -1.1 -0.1 -0.5
60° 45°
Error (per thickness cat.) Error (per thickness cat.)
70°
Error (per thickness cat.)
NDT in Canada 2017 Conference | June 6-8 Quebec City, Quebec Pg 13 of 19
6.3. Removing angle dependency One key improvement in the development of the TCG technique is freedom from angle-specific procedure and acceptance tables. Angle limitations were born from the idea of a “most desirable angle”. As shown in 4.4, this approach likely harms probability of detection (POD) more than it helps to produce consistent results.
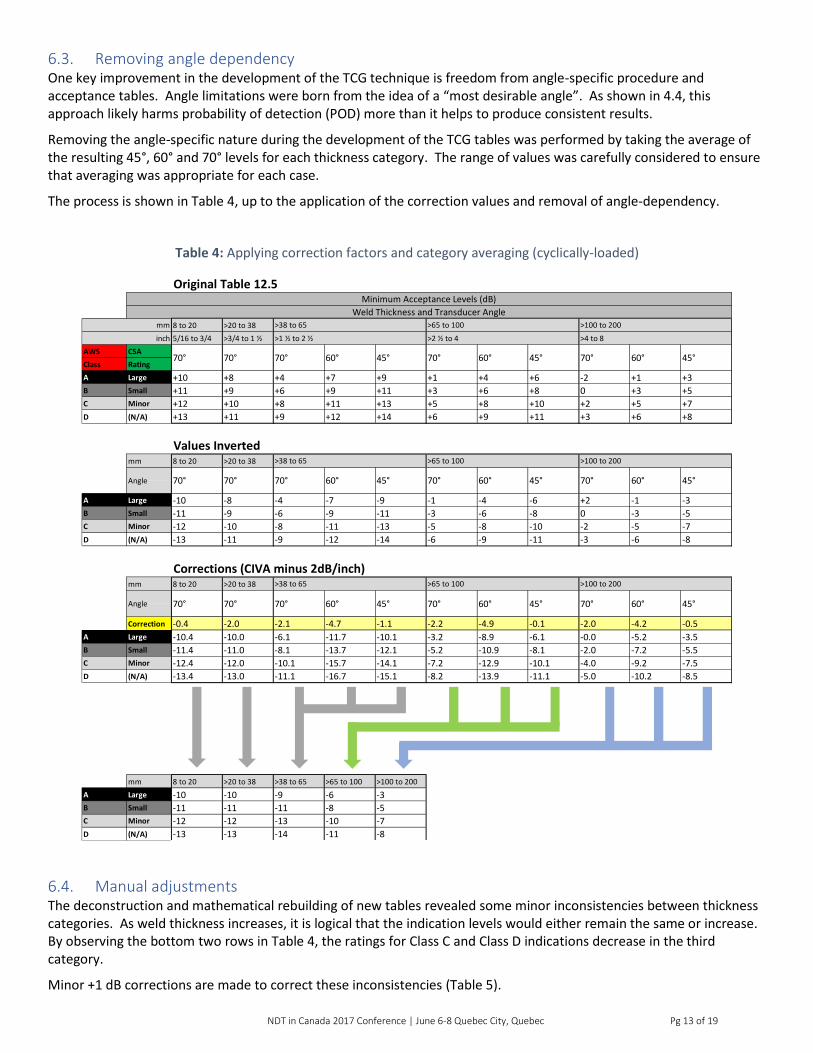
Removing the angle-specific nature during the development of the TCG tables was performed by taking the average of the resulting 45°, 60° and 70° levels for each thickness category. The range of values was carefully considered to ensure that averaging was appropriate for each case.
The process is shown in Table 4, up to the application of the correction values and removal of angle-dependency.
Table 4: Applying correction factors and category averaging (cyclically-loaded)
6.4. Manual adjustments The deconstruction and mathematical rebuilding of new tables revealed some minor inconsistencies between thickness categories. As weld thickness increases, it is logical that the indication levels would either remain the same or increase. By observing the bottom two rows in Table 4, the ratings for Class C and Class D indications decrease in the third category.
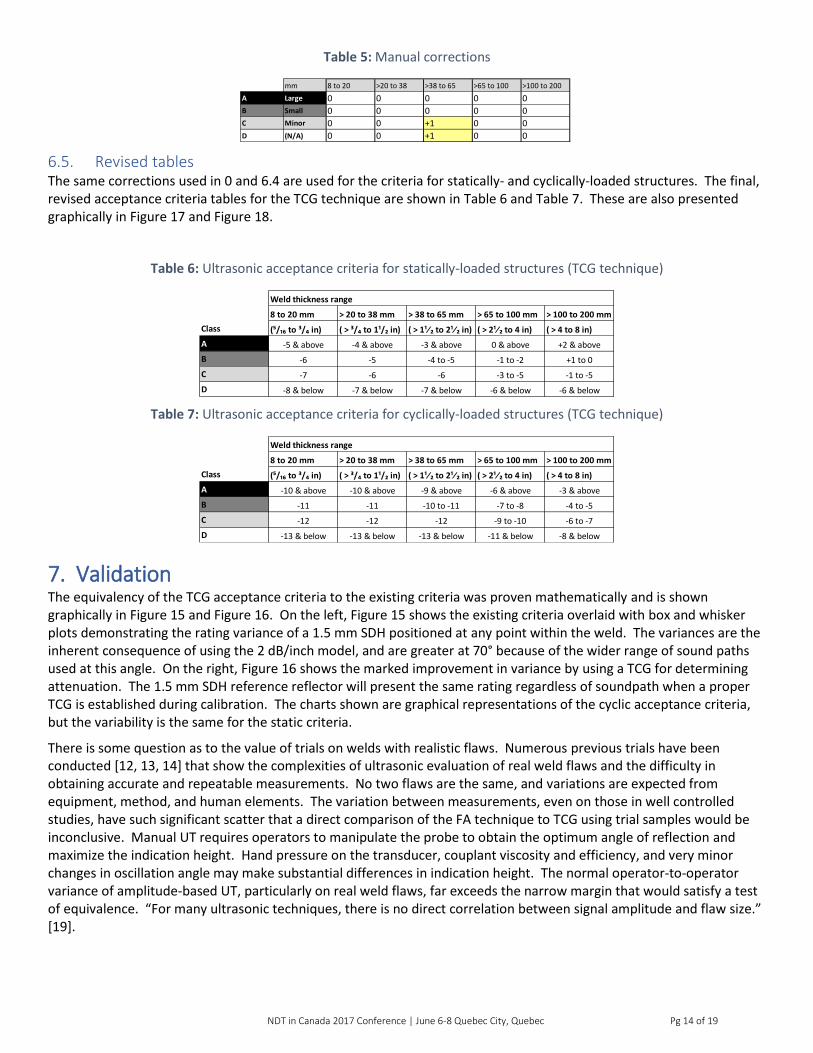
Minor +1 dB corrections are made to correct these inconsistencies (Table 5).
Original Table 12.5
8 to 20 >20 to 38
5/16 to 3/4 >3/4 to 1 ½
AWS CSA
Class Rating
A Large +10 +8 +4 +7 +9 +1 +4 +6 -2 +1 +3
B Small +11 +9 +6 +9 +11 +3 +6 +8 0 +3 +5
C Minor +12 +10 +8 +11 +13 +5 +8 +10 +2 +5 +7
D (N/A) +13 +11 +9 +12 +14 +6 +9 +11 +3 +6 +8
Values Invertedmm 8 to 20 >20 to 38
A Large -10 -8 -4 -7 -9 -1 -4 -6 +2 -1 -3
B Small -11 -9 -6 -9 -11 -3 -6 -8 0 -3 -5
C Minor -12 -10 -8 -11 -13 -5 -8 -10 -2 -5 -7
D (N/A) -13 -11 -9 -12 -14 -6 -9 -11 -3 -6 -8
Corrections (CIVA minus 2dB/inch)mm 8 to 20 >20 to 38
Correction -0.4 -2.0 -2.1 -4.7 -1.1 -2.2 -4.9 -0.1 -2.0 -4.2 -0.5
A Large -10.4 -10.0 -6.1 -11.7 -10.1 -3.2 -8.9 -6.1 -0.0 -5.2 -3.5
B Small -11.4 -11.0 -8.1 -13.7 -12.1 -5.2 -10.9 -8.1 -2.0 -7.2 -5.5
C Minor -12.4 -12.0 -10.1 -15.7 -14.1 -7.2 -12.9 -10.1 -4.0 -9.2 -7.5
D (N/A) -13.4 -13.0 -11.1 -16.7 -15.1 -8.2 -13.9 -11.1 -5.0 -10.2 -8.5
mm 8 to 20 >20 to 38 >38 to 65 >65 to 100 >100 to 200
A Large -10 -10 -9 -6 -3
B Small -11 -11 -11 -8 -5
C Minor -12 -12 -13 -10 -7
D (N/A) -13 -13 -14 -11 -8
>38 to 65 >65 to 100 >100 to 200
>38 to 65 >65 to 100 >100 to 200
Angle 70° 60°70° 70° 70°
70°
45°60° 45° 70° 60° 45°
70° 60° 45° 70° 60° 45°Angle 70°
Minimum Acceptance Levels (dB)
Weld Thickness and Transducer Angle
mm >38 to 65 >65 to 100 >100 to 200
45°
inch >1 ½ to 2 ½ >2 ½ to 4 >4 to 8
70° 70° 45° 70° 60° 45°60°70° 60° 45°
70° 70° 60°
NDT in Canada 2017 Conference | June 6-8 Quebec City, Quebec Pg 14 of 19
Table 5: Manual corrections
6.5. Revised tables The same corrections used in 0 and 6.4 are used for the criteria for statically- and cyclically-loaded structures. The final, revised acceptance criteria tables for the TCG technique are shown in Table 6 and Table 7. These are also presented graphically in Figure 17 and Figure 18.
Table 6: Ultrasonic acceptance criteria for statically-loaded structures (TCG technique)
Table 7: Ultrasonic acceptance criteria for cyclically-loaded structures (TCG technique)
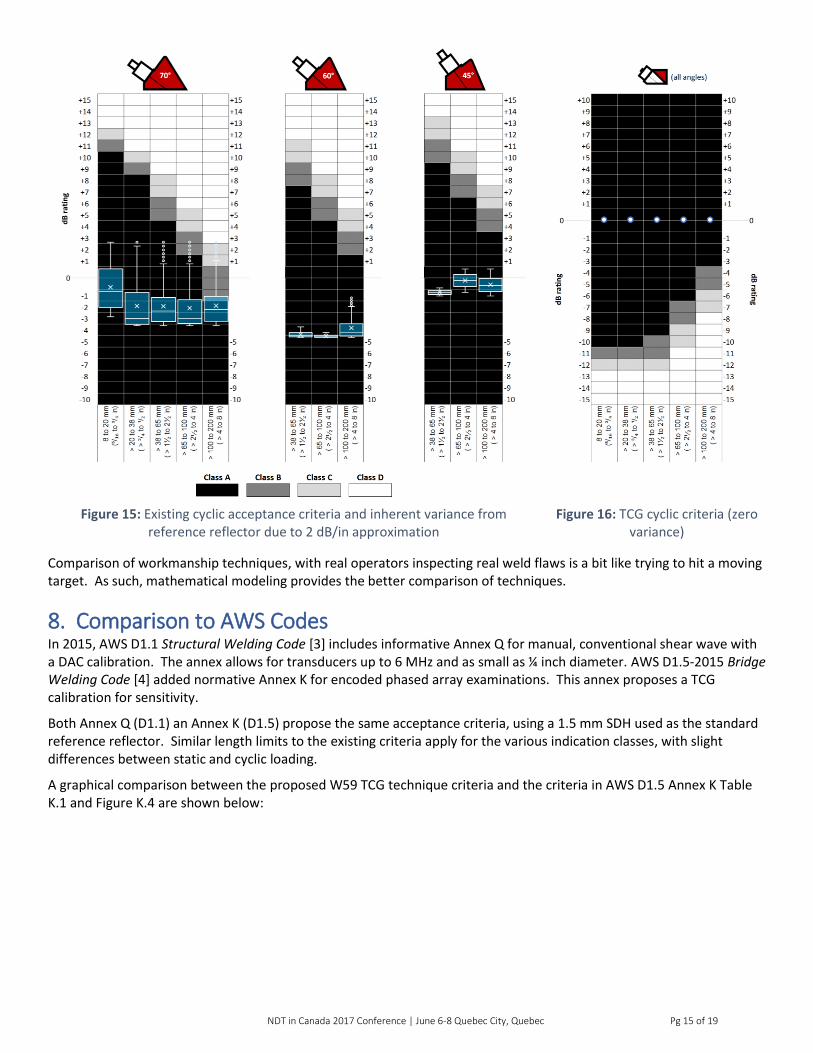
7. Validation The equivalency of the TCG acceptance criteria to the existing criteria was proven mathematically and is shown graphically in Figure 15 and Figure 16. On the left, Figure 15 shows the existing criteria overlaid with box and whisker plots demonstrating the rating variance of a 1.5 mm SDH positioned at any point within the weld. The variances are the inherent consequence of using the 2 dB/inch model, and are greater at 70° because of the wider range of sound paths used at this angle. On the right, Figure 16 shows the marked improvement in variance by using a TCG for determining attenuation. The 1.5 mm SDH reference reflector will present the same rating regardless of soundpath when a proper TCG is established during calibration. The charts shown are graphical representations of the cyclic acceptance criteria, but the variability is the same for the static criteria.
There is some question as to the value of trials on welds with realistic flaws. Numerous previous trials have been conducted [12, 13, 14] that show the complexities of ultrasonic evaluation of real weld flaws and the difficulty in obtaining accurate and repeatable measurements. No two flaws are the same, and variations are expected from equipment, method, and human elements. The variation between measurements, even on those in well controlled studies, have such significant scatter that a direct comparison of the FA technique to TCG using trial samples would be inconclusive. Manual UT requires operators to manipulate the probe to obtain the optimum angle of reflection and maximize the indication height. Hand pressure on the transducer, couplant viscosity and efficiency, and very minor changes in oscillation angle may make substantial differences in indication height. The normal operator-to-operator variance of amplitude-based UT, particularly on real weld flaws, far exceeds the narrow margin that would satisfy a test of equivalence. “For many ultrasonic techniques, there is no direct correlation between signal amplitude and flaw size.” [19].
mm 8 to 20 >20 to 38 >38 to 65 >65 to 100 >100 to 200
A Large 0 0 0 0 0
B Small 0 0 0 0 0
C Minor 0 0 +1 0 0
D (N/A) 0 0 +1 0 0
Required to create sensible increase
in ratings as thickness increases
-3 & above
(⁵/₁₆ to ³/₄ in)
A -5 & above -4 & above
Class
D -8 & below -7 & below -7 & below -6 & below
+1 to 0
C -7 -6 -6 -3 to -5 -1 to -5
B -6 -5 -4 to -5 -1 to -2
> 20 to 38 mm
-6 & below
0 & above +2 & above
( > 2¹⁄₂ to 4 in) ( > 4 to 8 in)
Weld thickness range
8 to 20 mm > 65 to 100 mm > 100 to 200 mm
( > 1¹⁄₂ to 2¹⁄₂ in)
> 38 to 65 mm
( > ³/₄ to 1¹/₂ in)
Class
-9 & above
-10 to -11
-12
-13 & below
Weld thickness range
8 to 20 mm
-3 & above
-4 to -5
-6 to -7
A
B
C
D -13 & below
> 20 to 38 mm > 38 to 65 mm
(⁵/₁₆ to ³/₄ in) ( > ³/₄ to 1¹/₂ in) ( > 1¹⁄₂ to 2¹⁄₂ in)
-10 & above
-11
-12
-10 & above
-11
-12
-13 & below
> 65 to 100 mm > 100 to 200 mm
( > 2¹⁄₂ to 4 in) ( > 4 to 8 in)
-8 & below
-6 & above
-7 to -8
-9 to -10
-11 & below
NDT in Canada 2017 Conference | June 6-8 Quebec City, Quebec Pg 15 of 19
Figure 15: Existing cyclic acceptance criteria and inherent variance from reference reflector due to 2 dB/in approximation
Figure 16: TCG cyclic criteria (zero variance)
Comparison of workmanship techniques, with real operators inspecting real weld flaws is a bit like trying to hit a moving target. As such, mathematical modeling provides the better comparison of techniques.
8. Comparison to AWS Codes In 2015, AWS D1.1 Structural Welding Code [3] includes informative Annex Q for manual, conventional shear wave with a DAC calibration. The annex allows for transducers up to 6 MHz and as small as ¼ inch diameter. AWS D1.5-2015 Bridge Welding Code [4] added normative Annex K for encoded phased array examinations. This annex proposes a TCG calibration for sensitivity.
Both Annex Q (D1.1) an Annex K (D1.5) propose the same acceptance criteria, using a 1.5 mm SDH used as the standard reference reflector. Similar length limits to the existing criteria apply for the various indication classes, with slight differences between static and cyclic loading.
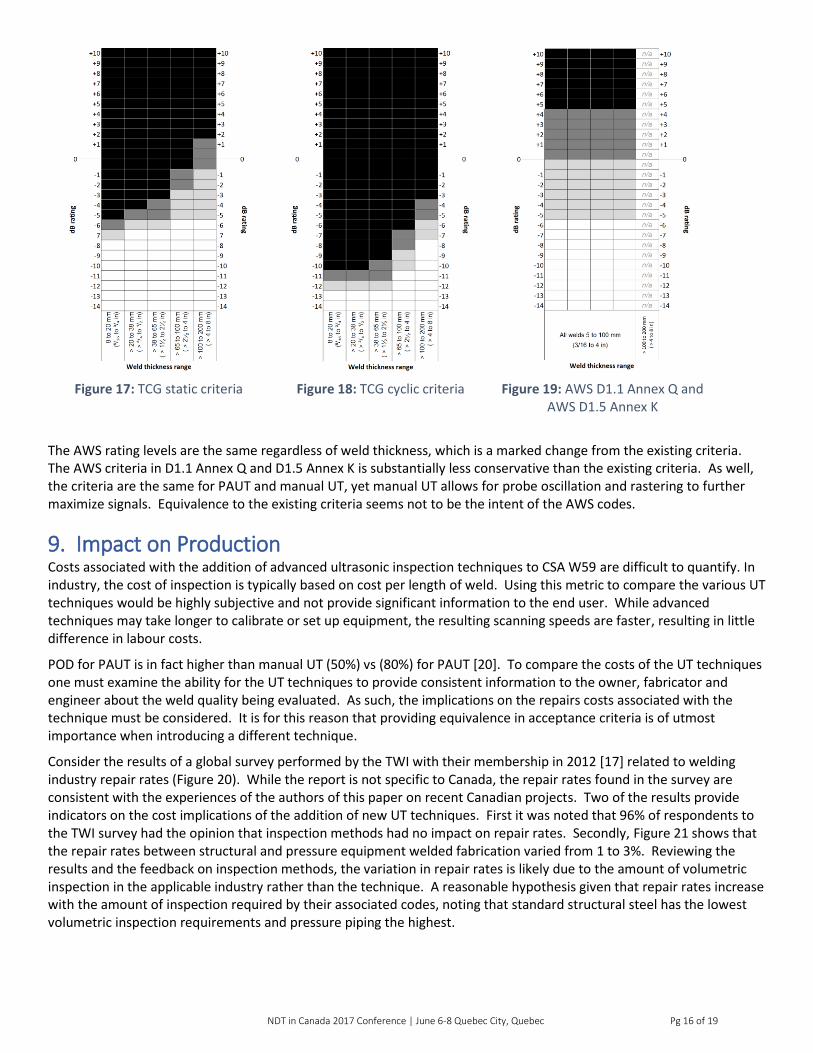
A graphical comparison between the proposed W59 TCG technique criteria and the criteria in AWS D1.5 Annex K Table K.1 and Figure K.4 are shown below:
NDT in Canada 2017 Conference | June 6-8 Quebec City, Quebec Pg 16 of 19
Figure 17: TCG static criteria Figure 18: TCG cyclic criteria Figure 19: AWS D1.1 Annex Q and AWS D1.5 Annex K
The AWS rating levels are the same regardless of weld thickness, which is a marked change from the existing criteria. The AWS criteria in D1.1 Annex Q and D1.5 Annex K is substantially less conservative than the existing criteria. As well, the criteria are the same for PAUT and manual UT, yet manual UT allows for probe oscillation and rastering to further maximize signals. Equivalence to the existing criteria seems not to be the intent of the AWS codes.
9. Impact on Production Costs associated with the addition of advanced ultrasonic inspection techniques to CSA W59 are difficult to quantify. In industry, the cost of inspection is typically based on cost per length of weld. Using this metric to compare the various UT techniques would be highly subjective and not provide significant information to the end user. While advanced techniques may take longer to calibrate or set up equipment, the resulting scanning speeds are faster, resulting in little difference in labour costs.
POD for PAUT is in fact higher than manual UT (50%) vs (80%) for PAUT [20]. To compare the costs of the UT techniques one must examine the ability for the UT techniques to provide consistent information to the owner, fabricator and engineer about the weld quality being evaluated. As such, the implications on the repairs costs associated with the technique must be considered. It is for this reason that providing equivalence in acceptance criteria is of utmost importance when introducing a different technique.
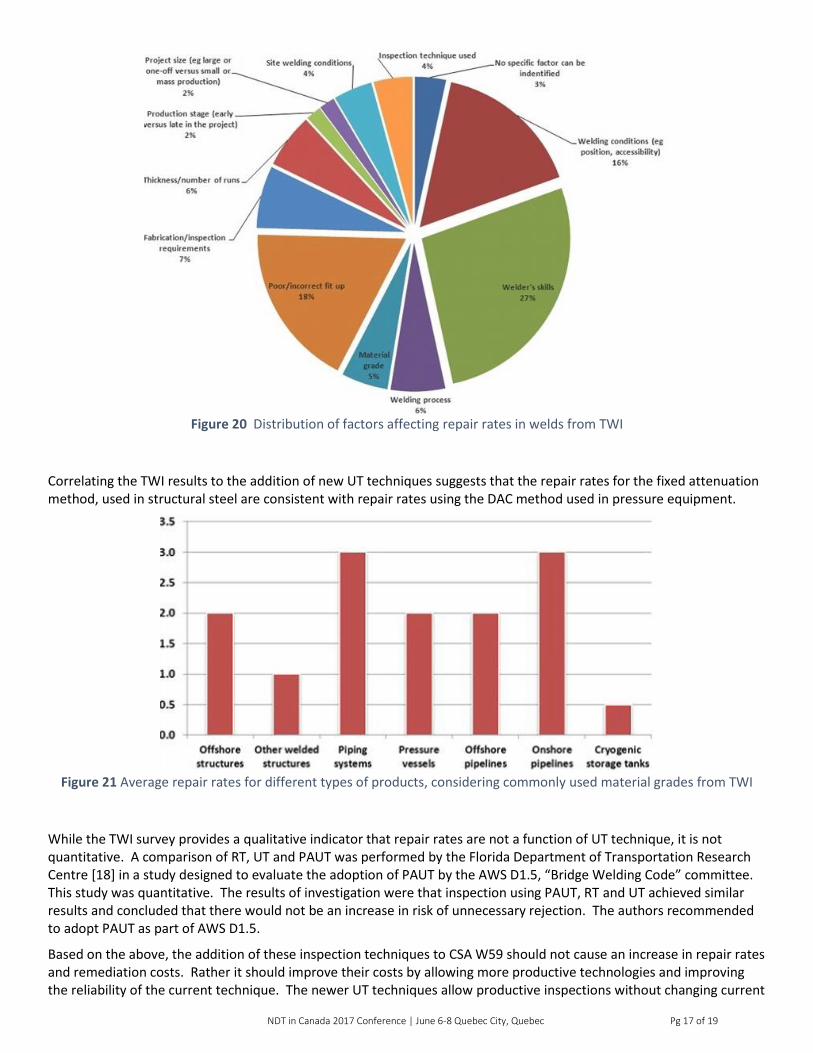
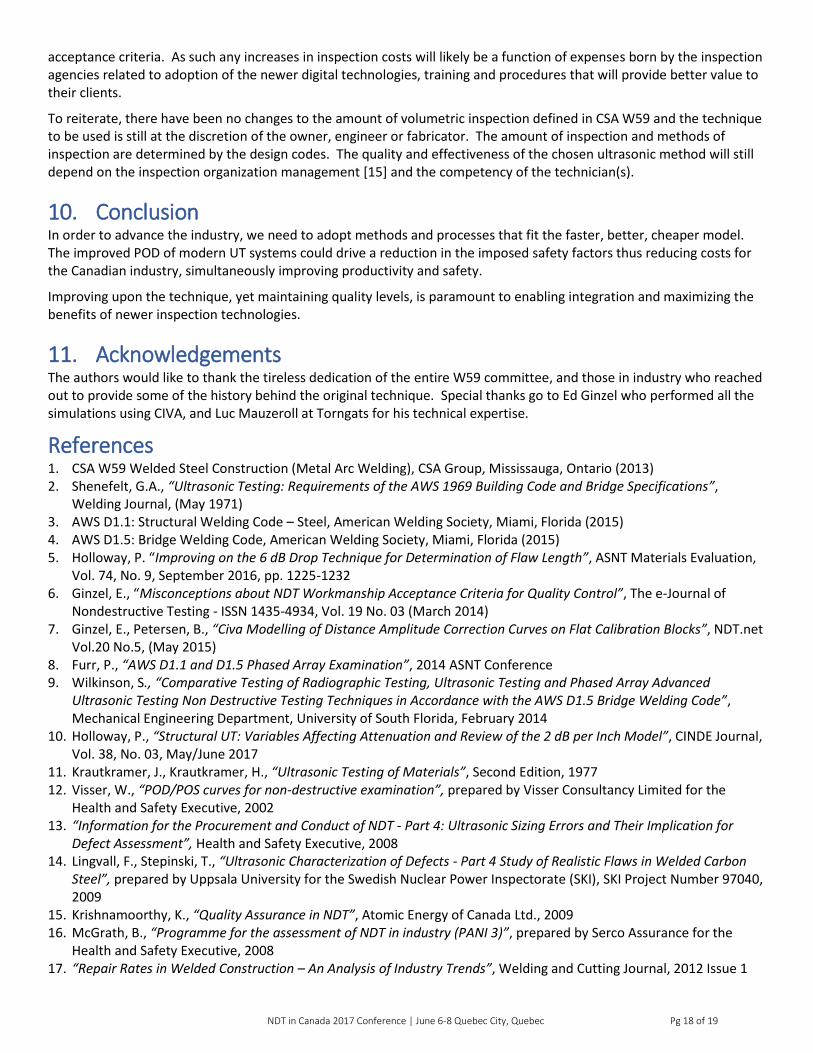
Consider the results of a global survey performed by the TWI with their membership in 2012 [17] related to welding industry repair rates (Figure 20). While the report is not specific to Canada, the repair rates found in the survey are consistent with the experiences of the authors of this paper on recent Canadian projects. Two of the results provide indicators on the cost implications of the addition of new UT techniques. First it was noted that 96% of respondents to the TWI survey had the opinion that inspection methods had no impact on repair rates. Secondly, Figure 21 shows that the repair rates between structural and pressure equipment welded fabrication varied from 1 to 3%. Reviewing the results and the feedback on inspection methods, the variation in repair rates is likely due to the amount of volumetric inspection in the applicable industry rather than the technique. A reasonable hypothesis given that repair rates increase with the amount of inspection required by their associated codes, noting that standard structural steel has the lowest volumetric inspection requirements and pressure piping the highest.
NDT in Canada 2017 Conference | June 6-8 Quebec City, Quebec Pg 17 of 19
Figure 20 Distribution of factors affecting repair rates in welds from TWI
Correlating the TWI results to the addition of new UT techniques suggests that the repair rates for the fixed attenuation method, used in structural steel are consistent with repair rates using the DAC method used in pressure equipment.
Figure 21 Average repair rates for different types of products, considering commonly used material grades from TWI
While the TWI survey provides a qualitative indicator that repair rates are not a function of UT technique, it is not quantitative. A comparison of RT, UT and PAUT was performed by the Florida Department of Transportation Research Centre [18] in a study designed to evaluate the adoption of PAUT by the AWS D1.5, “Bridge Welding Code” committee. This study was quantitative. The results of investigation were that inspection using PAUT, RT and UT achieved similar results and concluded that there would not be an increase in risk of unnecessary rejection. The authors recommended to adopt PAUT as part of AWS D1.5.
Based on the above, the addition of these inspection techniques to CSA W59 should not cause an increase in repair rates and remediation costs. Rather it should improve their costs by allowing more productive technologies and improving the reliability of the current technique. The newer UT techniques allow productive inspections without changing current
NDT in Canada 2017 Conference | June 6-8 Quebec City, Quebec Pg 18 of 19
acceptance criteria. As such any increases in inspection costs will likely be a function of expenses born by the inspection agencies related to adoption of the newer digital technologies, training and procedures that will provide better value to their clients.
To reiterate, there have been no changes to the amount of volumetric inspection defined in CSA W59 and the technique to be used is still at the discretion of the owner, engineer or fabricator. The amount of inspection and methods of inspection are determined by the design codes. The quality and effectiveness of the chosen ultrasonic method will still depend on the inspection organization management [15] and the competency of the technician(s).
10. Conclusion In order to advance the industry, we need to adopt methods and processes that fit the faster, better, cheaper model. The improved POD of modern UT systems could drive a reduction in the imposed safety factors thus reducing costs for the Canadian industry, simultaneously improving productivity and safety.
Improving upon the technique, yet maintaining quality levels, is paramount to enabling integration and maximizing the benefits of newer inspection technologies.
11. Acknowledgements The authors would like to thank the tireless dedication of the entire W59 committee, and those in industry who reached out to provide some of the history behind the original technique. Special thanks go to Ed Ginzel who performed all the simulations using CIVA, and Luc Mauzeroll at Torngats for his technical expertise.
References 1. CSA W59 Welded Steel Construction (Metal Arc Welding), CSA Group, Mississauga, Ontario (2013) 2. Shenefelt, G.A., “Ultrasonic Testing: Requirements of the AWS 1969 Building Code and Bridge Specifications”,
Welding Journal, (May 1971) 3. AWS D1.1: Structural Welding Code – Steel, American Welding Society, Miami, Florida (2015) 4. AWS D1.5: Bridge Welding Code, American Welding Society, Miami, Florida (2015) 5. Holloway, P. “Improving on the 6 dB Drop Technique for Determination of Flaw Length”, ASNT Materials Evaluation,
Vol. 74, No. 9, September 2016, pp. 1225-1232 6. Ginzel, E., “Misconceptions about NDT Workmanship Acceptance Criteria for Quality Control”, The e-Journal of
Nondestructive Testing - ISSN 1435-4934, Vol. 19 No. 03 (March 2014) 7. Ginzel, E., Petersen, B., “Civa Modelling of Distance Amplitude Correction Curves on Flat Calibration Blocks”, NDT.net
Vol.20 No.5, (May 2015) 8. Furr, P., “AWS D1.1 and D1.5 Phased Array Examination”, 2014 ASNT Conference 9. Wilkinson, S., “Comparative Testing of Radiographic Testing, Ultrasonic Testing and Phased Array Advanced
Ultrasonic Testing Non Destructive Testing Techniques in Accordance with the AWS D1.5 Bridge Welding Code”, Mechanical Engineering Department, University of South Florida, February 2014
10. Holloway, P., “Structural UT: Variables Affecting Attenuation and Review of the 2 dB per Inch Model”, CINDE Journal, Vol. 38, No. 03, May/June 2017
11. Krautkramer, J., Krautkramer, H., “Ultrasonic Testing of Materials”, Second Edition, 1977 12. Visser, W., “POD/POS curves for non-destructive examination”, prepared by Visser Consultancy Limited for the
Health and Safety Executive, 2002 13. “Information for the Procurement and Conduct of NDT - Part 4: Ultrasonic Sizing Errors and Their Implication for
Defect Assessment”, Health and Safety Executive, 2008 14. Lingvall, F., Stepinski, T., “Ultrasonic Characterization of Defects - Part 4 Study of Realistic Flaws in Welded Carbon
Steel”, prepared by Uppsala University for the Swedish Nuclear Power Inspectorate (SKI), SKI Project Number 97040, 2009
15. Krishnamoorthy, K., “Quality Assurance in NDT”, Atomic Energy of Canada Ltd., 2009 16. McGrath, B., “Programme for the assessment of NDT in industry (PANI 3)”, prepared by Serco Assurance for the
Health and Safety Executive, 2008 17. “Repair Rates in Welded Construction – An Analysis of Industry Trends”, Welding and Cutting Journal, 2012 Issue 1
NDT in Canada 2017 Conference | June 6-8 Quebec City, Quebec Pg 19 of 19
18. Wilkinson, S., “Comparative Testing of Radiographic Testing, Ultrasonic Testing and Phased Array Advanced Ultrasonic Testing Non Destructive Testing Techniques in Accordance with the AWS D1.5 Bridge Welding Code”, prepared by Mechanical Engineering Department, College of Engineering, University of South Florida for the Florida Department of Transportation, February 2014
19. Kurz, J., Dugan, S., Jungert, A., “Reliability Considerations of NDT by Probability of Detection (POD) Determination Using Ultrasound Phased Array – Results from a Project in Frame of the German Nuclear Safety Research”, 5th European-American Workshop on Reliability of NDE (Lecture 16), Germany 2013
20. Georgiou, G., “Probability of Detection (PoD) curves - Derivation, applications and limitations”, prepared by Jacobi Consulting Ltd. for the Health and Safety Executive, Research Report 454, 2006