Embed Size (px)
Citation preview

Western Kentucky UniversityTopSCHOLAR®
Masters Theses & Specialist Projects Graduate School
Spring 2017
Adapting Critical Chain Project Management toArmy Engineer Construction ProjectsEric E. RohrWestern Kentucky University, [email protected]
Follow this and additional works at: http://digitalcommons.wku.edu/theses
Part of the Business Administration, Management, and Operations Commons, and theOperations and Supply Chain Management Commons
This Thesis is brought to you for free and open access by TopSCHOLAR®. It has been accepted for inclusion in Masters Theses & Specialist Projects byan authorized administrator of TopSCHOLAR®. For more information, please contact [email protected].
Recommended CitationRohr, Eric E., "Adapting Critical Chain Project Management to Army Engineer Construction Projects" (2017). Masters Theses &Specialist Projects. Paper 1958.http://digitalcommons.wku.edu/theses/1958

ADAPTING CRITICAL CHAIN PROJECT MANAGEMENT
TO ARMY ENGINEER CONSTRUCTION PROJECTS
A Thesis
Presented to
The Faculty of the Department of Architectural and Manufacturing Sciences
Western Kentucky University
Bowling Green, Kentucky
In Partial Fulfillment
Of the Requirements for the Degree
Master of Science
By
Eric Rohr
May 2017

This thesis is dedicated to dedicate to my wife, Salina, whose support and sacrifice
allowed me to go to Graduate School and further my professional career. This thesis is
also dedicated my parents, Michael and Linda Rohr, who never let me doubt myself.

iv
ACKNOWLEDGMENTS
Credit for assisting in the completion of this research is owed to Dr. Doggett, Dr.
Jackson, and Dr. Orooji for their knowledge, support, and guidance throughout this
project. Particular thanks is owed to Dr. Doggett, whose support and encouragement of
student potential allows those from out the MSETM Program to reach for more.
A debt of gratitude is also owed to Major Matthew Burgoon, Captains Career
Course Instructor for Engineer Officers at the Maneuver Support Center of Excellence at
Fort Leonard Wood, MO, for his assistance in conducting research and collecting data
from a venerable U.S. Army institution.

v
CONTENTS
List of Figures ................................................................................................................... vii
List of Tables ................................................................................................................... viii
Abstract .............................................................................................................................. ix
Introduction ......................................................................................................................... 1
Problem Statement .................................................................................................. 2
Significance of Research......................................................................................... 4
Statement of Purpose .............................................................................................. 6
Research Questions ................................................................................................. 7
Variables ................................................................................................................. 7
Assumptions ............................................................................................................ 8
Delimitations ........................................................................................................... 8
Limitations .............................................................................................................. 8
Definition of Terms................................................................................................. 9
Review of Literature ......................................................................................................... 11
Traditional Army Construction Planning and Project Management..................... 11
Summary of the Army CPM System .................................................................... 24
Critical Chain Project Management .................................................................................. 25
Summary of Literature Review ............................................................................. 34
Methodology ..................................................................................................................... 37
Participants and Procedure .................................................................................... 37
Instrament and Materials....................................................................................... 37
Threats to Validity ................................................................................................ 39

vi
Analysis................................................................................................................. 40
Findings............................................................................................................................. 46
Section 1 – demographic Data of the 7 Groups Studied ....................................... 46
Statement Response Results: Survey Sections 2-5 ............................................... 47
Conclusion ........................................................................................................................ 68
Tying the Analyis back to the Review of Literature ............................................. 76
Suggestions for Future Resreach .......................................................................... 77
Appendix A: The Survey Instrument ................................................................................ 79
Appendix B: Survey - Initial Results ................................................................................ 86
Appendix C: ANOVA of Initial Results ......................................................................... 106
Appendix D: Demographic Analysis – Results .............................................................. 110
Appendix E: ANOVA of Experience and Education Groups ......................................... 125
References ....................................................................................................................... 129

vii
LIST OF FIGURES
Figure 1. Standard Army Critical Path logic diagram. .................................................... 12
Figure 2. Gantt Chart control levels in Army construction planning .............................. 15
Figure 3. Level 3 Gantt Chart before resource leveling .................................................. 17
Figure 4. Level 3 Gantt Chart with resource leveling applied. ....................................... 19
Figure 5. Resolving resource conflicts by extending a project schedule. ....................... 21
Figure 6. Application of TOC and CCPM....................................................................... 27
Figure 7. CPM vs. CCPM scheduling. ............................................................................ 29
Figure 8. Illustration of non-critical feeding buffer protection. ...................................... 31
Figure 9. CCPM resource critical leveling and scheduling. ............................................ 33
Figure 10. Example from Appendix B ............................................................................ 42
Figure 11. Example from Appendix D ............................................................................ 44
viii
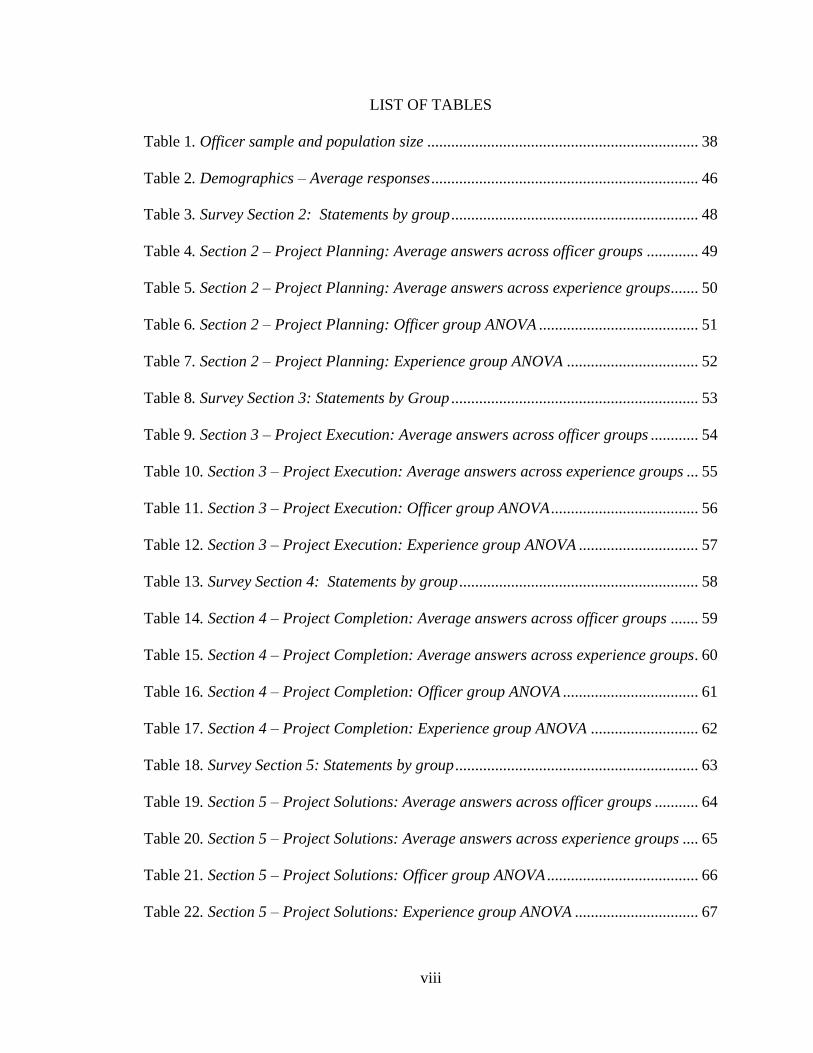
LIST OF TABLES
Table 1. Officer sample and population size .................................................................... 38
Table 2. Demographics – Average responses ................................................................... 46
Table 3. Survey Section 2: Statements by group .............................................................. 48
Table 4. Section 2 – Project Planning: Average answers across officer groups ............. 49
Table 5. Section 2 – Project Planning: Average answers across experience groups....... 50
Table 6. Section 2 – Project Planning: Officer group ANOVA ........................................ 51
Table 7. Section 2 – Project Planning: Experience group ANOVA ................................. 52
Table 8. Survey Section 3: Statements by Group .............................................................. 53
Table 9. Section 3 – Project Execution: Average answers across officer groups ............ 54
Table 10. Section 3 – Project Execution: Average answers across experience groups ... 55
Table 11. Section 3 – Project Execution: Officer group ANOVA ..................................... 56
Table 12. Section 3 – Project Execution: Experience group ANOVA .............................. 57
Table 13. Survey Section 4: Statements by group ............................................................ 58
Table 14. Section 4 – Project Completion: Average answers across officer groups ....... 59
Table 15. Section 4 – Project Completion: Average answers across experience groups. 60
Table 16. Section 4 – Project Completion: Officer group ANOVA .................................. 61
Table 17. Section 4 – Project Completion: Experience group ANOVA ........................... 62
Table 18. Survey Section 5: Statements by group ............................................................. 63
Table 19. Section 5 – Project Solutions: Average answers across officer groups ........... 64
Table 20. Section 5 – Project Solutions: Average answers across experience groups .... 65
Table 21. Section 5 – Project Solutions: Officer group ANOVA ...................................... 66
Table 22. Section 5 – Project Solutions: Experience group ANOVA ............................... 67

ix
ADAPTING CRITICAL CHAIN PROJECT MANAGEMENT
TO ARMY ENGINEER CONSTRUCTION PROJECTS
Eric Rohr May 2017 131 Pages
Directed by: Dr. Mark Dogget, Dr. Daniel Jackson, and Dr. Fatemeh Orooji.
Department of Architectural and Manufacturing Sciences Western Kentucky University
For decades, Army Engineers have utilized the systems of the Critical Path
Method (CPM) and multi-level Gantt chart planning system for its construction projects.
While these methods are well accepted, they are not without their flaws. Research and
literature in project management has given weight to several viable alternative options to
planning projects. One such option, Critical Chain Project Management (CCPM), was
developed to address the flaws of CPM by offering a holistic approach to project
management based on strict resource control and the use of time buffers. This method
attempts to eliminate multitasking and procrastination that can plague efficiency and
offer managers more flexibly on tasks that otherwise had no leeway. CCPM may give
project managers more flexibility and control while at the same time shortening the
overall length of a project, saving time and money.
The purpose of this thesis was to address the time saving and resource
management benefits of utilizing CCPM over CPM and analyze the viability of those
benefits being applied to U.S. Army Corps of Engineers construction project planning.
Through the use of surveys of Army Engineer project supervisors, several key factors that
cause delays because of CPM were identified and rated. The validity of CCPM based
solutions to the same issues were also assessed by Army project supervisors in the
survey. Analysis of the survey results indicated that CCPM may offer solutions to major
issues that Army project supervisors face.

1
Introduction
The United States Army Corps of Engineers overseas millions of dollars in
taxpayer funded public works projects every year. Many of these projects fit under the
combination of civilian and military organizations that make up the Corps. However,
many projects every year are completed by Active Duty and Reserve Army Engineers for
military use exclusively. These projects include improvement to weapons ranges, military
access roads to training areas, or runways and landing pads for aircraft.
Similar to civilian construction projects, Army projects are often plagued with the
same delays, cost and time overruns, and planning issues affecting equivalent civilian
projects within the private sector (Leach, 2014; Yang, 2007). Unlike their civilian
counterparts, Army construction projects are funded exclusively by taxpayers. Any
inefficiencies or issues with resource waste or inadequate scheduling that result in time
delays or cost overruns create a financial burden on tax military spending. Not only are
there public finance issues to consider, any change in personnel needed to complete a
delayed Army construction project can pull soldiers from other important duties or
training, affecting the quality of mission readiness.
Army Engineers have historically relied on the Critical Path Method (CPM) and
multi-level Gantt chart-based systems for planning, executing, and refining construction
projects. These methods are a well-established and institutionalized component of the
Project Management Body of Knowledge (PMBOK). CPM and Gantt chart-based project
management tools are the methods most frequently taught in civilian academia and
military training schools. Nonetheless, like any established system, these methods are not
without their flaws. The inflexibility of critical tasks in CPM and the lack of strict

2
personnel resource control in Gantt chart-based scheduling often lead to undesirable
factors including multitasking, procrastination, and schedule padding, which contribute to
project delays (Goldratt, 1997; Leach, 2014; Umble & Umble, 2000).
Research in project management has given weight to several viable alternative
options to planning projects. One such option, developed by Dr. Eliyahu Goldratt (1997)
in his book Critical Chain, attempted to address the shortfalls of traditional CPM based
construction planning. His method, Critical Chain Project Management (CCPM), was
adapted from several project management theories, including his own Theory of
Constraints (TOC) production methodologies, to offer a holistic approach to project
management methods (Trietsch, 2005). CCPM methods address multitasking and
procrastination issues that plague efficiency by reducing the padded time scheduled to
accomplish individual tasks by up to 50% and collecting it for use as project safety
buffers. Use of these methods, combined with strict personnel resource control have
demonstrated, in both production and project management, more flexibility and control
while at the same time shortening the overall length of a project, saving time and money
(Cerveny & Gallup, 2002; Smith, 2012; Yang, 2007). CCPM improvements may offer
viable solutions to planning and project delay issues that Army project supervisors face.
Problem Statement
Army construction projects that are subject to delays and planning efficiencies
present a burden to military spending and can negatively impact mission readiness. Issues
with project overruns are often a result of ineffective planning combined with lack of
adaptability and flexibility (Goldratt, 1997). Army construction projects share these
issues with their civilian counterparts, while at the same time offering unique scheduling

3
and personnel management issues of their own. In civilian construction projects, a
construction firm’s sole focus is the completion of a given construction project and the
efficient assignment of key personnel and equipment. The ultimate goal of that focus is to
finish a project on or ahead of time and at or below budget to satisfy the needs of the
customer while growing the company and maintaining a profit. Army Engineering
planners share the same burden to the customer, but are not subject to the constraints and
motivations of profit margins. Rather, they suffer from a lack of being able to schedule
and focus personnel and equipment due to unique constraints caused by military
readiness and training needs. These distractions, combined with inherent planning and
flexibility issues in the current system, can result in delays, overruns, and additional
personnel burdens hampering project completion (Leach, 2014). Unlike, their civilian
counterparts, Army project supervisors are not beholden to company owners or
shareholders when project delays affect schedules and budgets. The funding for military
project comes from tax revenue generated by the American people. Inefficiencies in
Army project management can burden budgets of Army engineering units; budgets
directly funded by taxpayers.
Mismanaged personnel resourcing, combined with project overruns, can also lead
to an additional issue Army project supervisors must address. The Army Training
Manuals (TM) for both project management and labor estimating prescribe some difficult
adjustments to personnel schedules in order to regain time lost due to delays. These
measures include bringing in additional personnel not originally assigned to the project,
taking personnel away from non-critical tasks while forcing multitasking, and eliminating
training time and other assigned tasks (Headquarters, Department of the Army, 2014). A

4
unit’s overall mission is to be completely trained, ready, and fully capable to deploy in
defense of the nation. Moving soldiers from vital training and other mission essential
tasks in order to complete an overdue construction project is counterproductive to the
Army’s core philosophy of mission readiness.
Significance of Research
Military spending, defense readiness, and lack of government oversight are
always controversial issues. The United States Department of Defense (DoD) outspends
the next eight most powerful militaries combined and often faces intense scrutiny on
issues of waste and inefficiency (Walker, 2014). The immense burden on Army leaders to
efficiently utilize time, personnel resources, and unit budgets cannot be understated. The
Army’s reliance on traditional CPM and Gantt chart-based planning, while established
and adequate, is not without significant flaws and opportunities for improvement.
Improving Army construction planning procedures would relieve many of the
burdens on engineering unit budgets and personnel management. Just as any construction
organization, proper time management throughout a project is necessary for staying at or
below a project’s budget. Engineering projects that are for exclusive military use, such as
training sites and military service routes on bases, are under the control of an active or
reserve engineering unit are paid for from tax revenue. Efficient time management from
Army project supervisors could allow for more projects to be completed on time and
under budget. Controlling projects means more efficient budgets, which allows for better
use of taxpayer money.
More efficient use of a unit’s budget also allows for more construction projects to
be accomplished within a given fiscal year. Army construction projects done in garrison

5
or within a normal theater of operations are considered training for when that unit must
deploy to a more austere or hostile environment in support of an operation. More efficient
construction planning leads to more construction projects, which means that unit has
more effective training, adding to unit readiness. The benefits of a system that could
induce this cyclical improvement, while at the same time not subtracting from other
mission essential tasks, could be substantial.
CCPM was designed to have strict personnel controls in place that prevent
reactionary scheduling and multitasking (Goldratt, 1997). Being free of these issues
would mean that project supervisors would not be forced to sacrifice other essential
mission tasks outside of their project in order to overcome delays. It could also help to
diminish the negative undesirable effects that often arise from multitasking. Although
often deemed necessary in both business and military project management spheres,
multitasking in traditional project management systems often contributes to project
delays, overruns, and mismanagement (Appelbaum, Fernandez, & Marchionni, 2008).
Just like their civilian counterparts, Army project supervisors can ill afford the distraction
and delays that arise from multitasking and poor management. Army project supervisors
have to contend with issues of stretching labor, requesting additional personnel, cutting
resources from other tasks, and being in more than one place at a time on the job site, just
as their civilian counterparts do. On top of that, they have to deal with the normal duties
of being a Platoon Leader, or Commander required of them as soldiers. It is essential to
balance an officer’s official duties with any additional assigned tasks (such as project
supervisor), in order to maintain military readiness.
6
There are clear benefits to utilizing a project management system that can
improve Army construction methods. Research has given weight to CCPM’s time
management and personnel efficiencies in civilian construction (Yang, 2007) military
logistics, and project planning (Smith, 2012). CCPM may provide Army construction
planners with the solutions they need for the problems they face, provided project
supervisors find those solutions effective.
Statement of Purpose
The purpose of this study was to determine the core issues that delay Army
Engineer construction projects and whether Critical Chain CCPM can resolve those core
issues. Research on adapting CCPM solutions to specific issues in Army construction
could prove beneficial to improving project completion rates and efficiency. This study
focused on the core issues Army project supervisors have with current construction
planning methodologies that negatively impact project completion. The study also
examined how receptive project supervisors are to adapting CCPM based solutions to the
core issues causing delays. Army Commissioned and Warrant Officers with construction
supervision experience were surveyed to quantify the major issues and rate the
effectiveness of CCPM measures against the core issues causing delays.
7
Research Questions
In designing CCPM, Goldratt created a package of methods that offers a holistic
solution, which can be adapted to existing planning methods or be used as a standalone
system (Leach, 2014, Trietsch, 2005). This study gauged the possible benefits of those
methods for Army construction project supervisors by addressing the following
questions:
1. What are the major scheduling issues negatively impacting on-time Army
construction project completions?
2. What are the major personnel management issues in Army construction
projects?
3. Can CCPM be adapted for Army construction projects?
4. Do Army project supervisors perceive CPM as a viable and adaptable
construction planning and scheduling tool for time and resource management?
5. Do Army project supervisors perceive CCPM as a viable and adaptable
construction planning and scheduling tool for time and resource management?
6. Are the responses of younger, less experienced Officers different from older,
more experienced Officers?
Variables
The independent variables in the first part of the study were the effectiveness of
current CPM based system for scheduling and resource management across three phases;
planning, execution, and completion. The dependent variables measured were the
responses of the various rank and experience groups. The independent variables for the
second part of the survey were the effectiveness of CPM and CCPM based solutions. The

8
dependent variables measured were the responses of the various rank and experience
groups.
Assumptions
This study was conducted under the following assumptions:
1. Answers to questionnaires were given in good faith.
2. Participants had an interest in improving project planning efficiency.
3. Answers given by survey subjects were accurate and representative of their true
perceptions.
Delimitations
This study was conducted with the following delimitations:
1. Surveys were limited to Active Duty, National Guard, and Reserve Army
personnel with Army construction planning and management experience.
2. Surveys were limited to Commissioned and Warrant Officers still in service.
3. Survey participants were limited to Officer’s attending career advancement
courses at the Maneuver Support Center of excellence at Ft. Leonard Wood, MO.
Limitations
This study was limited by the following:
1. Sample size was limited by the sizes of respective MSCOE training classes when
the survey was conducted.
Officer sample size gathered for the survey represented 2% - 4% of the total
population of Commissioned and Warrant Officers. Officer populations in the Corps of
Engineers across all components are small than that of other branches (see Table 1, p. 38,
9
in the Methodology Section). The exact number of Officers fluctuates daily based on
retirements, rebranching, and promotions, so all population (N) sizes are estimates.
1. Participation was voluntary and confidential.
Definition of Terms
For the purpose of the study the following definitions and explanation of
acronyms are needed:
1LT: First Lieutenant. Army rank for Level 1 Commissioned Officers.
ANOVA: Analysis of Variance. Study conducted between groups of data to
analyze the difference the means in those groups (Creswell, 2014).
CC: Critical Chain. A series of project tasks connected by needed critical
resources rather than time completion (Goldratt, 1997).
CP: Critical Path. The longest series of connected tasks in a project critical to
timely project completion (Leach, 2014).
CCPM: Critical Path Project Method. A system of project management base on
resource constrains and the use of time buffers to control project completion rates
(Goldratt, 1997).
Chief: Short hand for Chief Warrant Officer. Honorification given to Level 2 – 5
Warrant Officers
CPM: Critical Path Method. A system of logistical planning of tasks in project
management in which the longest series of tasks becomes critical to completing a
project on time (Leach, 2014).
CPT: Captain. Army Officer rank for Level 3 Commissioned Officers.

10
JCMS: Joint Construction Management System. A combination online and locally
stored database of both construction schematics and scheduling examples used in
all branches of the Department of Defense.
MSCOE: The Maneuver Support Center of Excellence. U.S. Military school
located at Ft. Leonard Wood MO. Responsible for advanced training of Army
Officers and enlisted personnel in engineering and construction techniques.
MD: Man Day. Army unit of measure for work accomplished in construction,
equal to eight hours of labor (Headquarters, Department of the Army, 2014).
NCO: Non-Commissioned Officer. Senior enlisted soldiers in supervisory roles
that serve as managers for lower enlisted soldiers and advisors to Officers.
PERT: Program Evaluation and Review Technique. A project management
system for analyzing the efficiency of scheduled tasks using CPM (Cerveny &
Gallup, 2002).
SITREP: Situation Report. A military based formal report detail construction
project progress at in a given category at a certain percentage of completion.
(Headquarters, Department of the Army, 2014).
TM: Training Manual. U.S. Army doctrine publications used as instruction
manuals by all ranks and branches for various tasks throughout the Army.
TOC: Theory of Constraints. Developed by Dr. Elyahu Goldratt as a system of
production controlling and improving its most constrained point. (Goldratt, 1997).
WIP: Work in Progress: Designation for ongoing project tasks that have been
started but not yet completed (Seider, 2006).
WO1: Warrant Officer Level 1: Army rank for Level 1 Warrant Officers.

11
Review of Literature
Traditional Army Construction Planning and Project Management
Directives for the planning, logistics, and control of Army Corps of Engineer
construction projects are rooted in traditional production methods developed in the early
and mid-20th century. The Critical Path Method, first developed by DuPont in the 1950s,
was the basic logic system and core project task planning system utilized in Army
Engineer planning construction projects. Army engineers also employed the use of Gantt
charts, first developed in 1905 by Henry Gantt, as the principle method of displaying
scheduled events in conjunction with resource allocation and providing a tool for Army
project managers to monitor project task completion and schedule management. It was
the combination of these two tried and true project management techniques that formed
the backbone of all Army Engineer construction projects. Construction Project
Management (Headquarters, Department of the Army, 2014) was the primary Army
Training Manual (TM) project managers and supervisors referenced for using CPM in
conjunction with Gantt charts to conduct construction project planning and control.
While these two established systems have been at the center of every successful
Army construction project for decades they are not without well documented shortfalls
when it comes to time management for both individual project tasks as well as overall
project schedule integrity (Cerveny & Gallup, 2002; Goldratt, 1997; Leach 1999, 2014;
Umble & Umble, 2000). In order to better understand these shortfalls and how they can
negatively impact Army construction project completion times, it is essential to review
the different aspects of CPM and Gantt chart scheduling. It is important to discuss the
alternative project management methods that have been developed to address the issues.
12
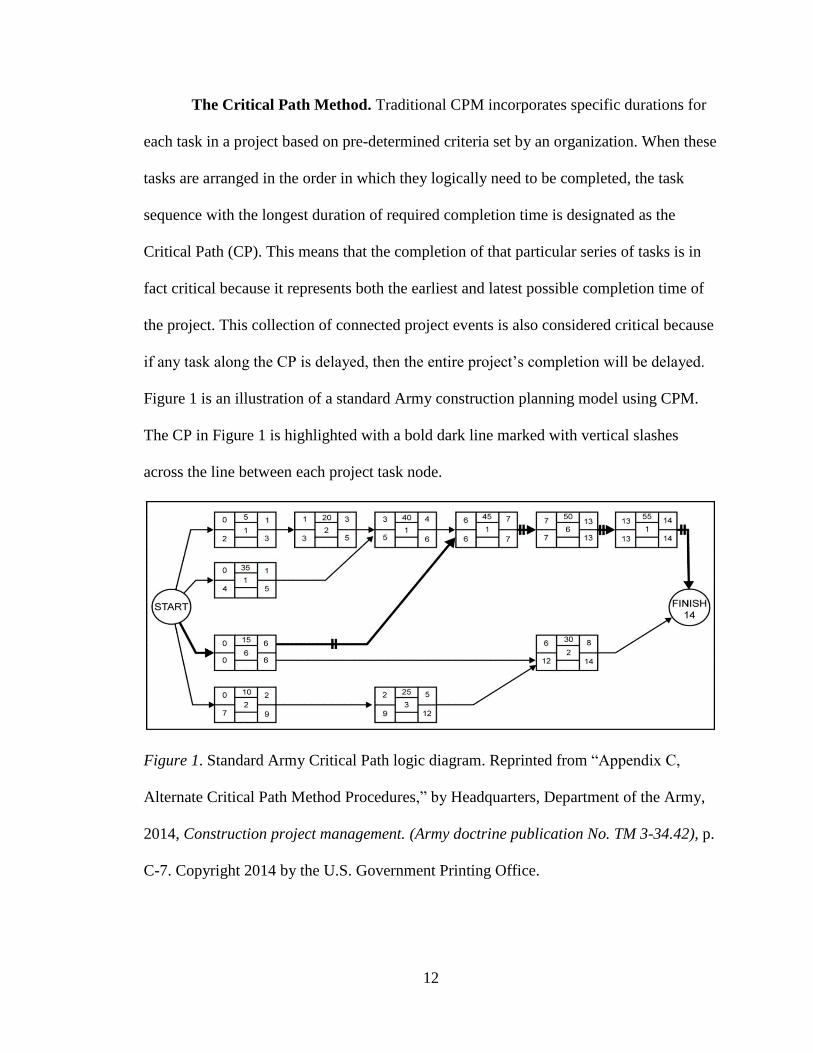
The Critical Path Method. Traditional CPM incorporates specific durations for
each task in a project based on pre-determined criteria set by an organization. When these
tasks are arranged in the order in which they logically need to be completed, the task
sequence with the longest duration of required completion time is designated as the
Critical Path (CP). This means that the completion of that particular series of tasks is in
fact critical because it represents both the earliest and latest possible completion time of
the project. This collection of connected project events is also considered critical because
if any task along the CP is delayed, then the entire project’s completion will be delayed.
Figure 1 is an illustration of a standard Army construction planning model using CPM.
The CP in Figure 1 is highlighted with a bold dark line marked with vertical slashes
across the line between each project task node.
Figure 1. Standard Army Critical Path logic diagram. Reprinted from “Appendix C,
Alternate Critical Path Method Procedures,” by Headquarters, Department of the Army,
2014, Construction project management. (Army doctrine publication No. TM 3-34.42), p.
C-7. Copyright 2014 by the U.S. Government Printing Office.
13
Each project task node in Figure 1 is made up of several boxes with numbers
indicating a different aspect of that particular project task’s effect on the oval duration of
the project. The number at the top center of the node designates the project task’s
assigned reference number. Below that, in the middle center of the node are the total
scheduled days of duration for that particular project task. On either side of each node are
four numbers, two on each side. The Early Start time (ES) is listed at the top left. The ES
number represents the earliest day at which the project task can start. Below the ES
number is the Late Start time (LS), which is the latest day that particular project task can
start, according to the scheduled task duration, without negatively effecting the overall
length of the entire project. On the right side of the node are numbers representing the
project task finish times. The Early Finish date (EF) is on the top right and denotes the
earliest date at which the project task can be completed. Below that is the subsequent
Late Finish date (LF), which denotes the last day the project task can be finished without
effecting the overall scheduled project finish time.
Using this system, it is easy for planners to identify the nodes designated as the
CP. Any project node that has ES and LS dates that are the same as well as EF and LF
dates will be designated as part of the CP. Because there is no difference in start or finish
dates, there is no flexibility in changing that task’s scheduled start or completion times
without effecting the overall length of the project. This flexibility is what Army planning
doctrine referred to as “float”. Float is “extra time available to complete an activity
beyond the activity’s duration” (Headquarters, Department of the Army, 2014, p. 3-10).
Any project task along the CP will naturally contain zero days of float. Therefore, staying
on schedule for tasks along the CP is critical to project completion. Any project task that

14
is not on the CP will contain some float and project managers will have flexibility in
scheduled start times and resource allocation when completing those tasks. Available
days of float within non-critical tasks act as a time and resource buffer. This allows
project managers the flexibility to pull resources from non-critical tasks not on the CP
and reallocate them to critical tasks that may need additional support in order to be
completed on time (Headquarters, Department of the Army, 2014, p. D-1).
Task duration and float. In determining proper task duration during planning
phases, Army project supervisors can draw on two separate resources for properly
scheduling task length. These publications act as general guidelines for planners in broad
based construction scenarios. The first guide, Construction Estimating (Headquarters,
Department of the Army, 2010), contained estimations for various construction tasks and
formula for determining task length. The second guide is the Joint Construction
Management System (JCMS), which is a combination of online and locally stored
computer databases of both construction schematics and typical task durations. These two
scheduling resources offer a wealth of scheduling examples for planners to draw on.
However, even with such a deep well to draw from, project supervisors still are
prone to make mistakes when it comes to proper estimating. One of the reasons for this is
built into the system itself. Construction Project Estimating (Headquarters, Department
of the Army, 2010) advised planners that they need to use their own judgement when it
comes scheduling task durations. Weather, terrain, cultural considerations, input from
experienced Non-Commissioned Officers, (NCOs), and the ever present ‘needs of the
Army’ are all factors that have to be considered when scheduling. These factors,
combined with limitations placed on the project by the supervisor’s chain of command,

15
can all contribute to inefficient planning and scheduling conflicts. Just like their civilian
counterparts, the outside pressures that Army project supervisors face in estimating a
schedule often lead to schedules becoming burdened with safety padding, duration over-
estimations, and unneeded safety time (Cerveny & Gallup, 2002; Leach, 2014). When
this occurs, the float time in non-critical tasks and extra safety time in critical tasks can
actually contribute to procrastination, lack of focus, and multitasking that may lead to
delays (Appelbaum, Fernandez & Marchionni, 2008; Goldratt, 1997)
Gantt charts. Once the series of project tasks has been ordered logically using
the CPM method, Army construction project supervisors can use that information, in
conjunction with planning data given by JMCS software, to construct Gantt charts in
order to track project completion projects. As seen in Figure 2, Army Gantt charts have
three levels of detail and control.
Figure 2. Gantt Chart control levels in Army construction planning. Reprinted from
“Section 3-2, Gantt Charts,” by Headquarters, Department of the Army, 2014,
Construction project management. (Army doctrine publication No. TM 3-34.42), p. 3-2.
Copyright 2014 by the U.S. Government Printing Office.

16
A Level 1 Project List Gantt chart displays resource planning and project tasks in
broader strokes on a month-to-month basis. The Level 2 Master Activities List and Level
3 Gantt Construction Activities List charts break down individual tasks further detailing
then on a weekly and daily progress respectively. The daily progress observed using a
Level 3 Gantt chart is then used to update the Level 2 Gantt chart’s weekly tracking,
which in turn is used to update a Level 1 Chart month-by-month. Individual task nodes
from a CPM diagram are translated into project tasks and listed vertically on the left side
of a Level 3 Gantt chart. Time duration for each task is displayed horizontally across the
chart. Tasks that are part of the CP are shown with bold black lines and have no available
float. Non-CP tasks are displayed with grey lines and available float is expressed using a
dotted line shown to the left of the task duration. The resource of the construction
personnel needed during a particular task is expressed in red next to the task and total of
needed personnel each day is displayed across the bottom. Figure 3 shows a completed
Level 3 Gantt chart using this process.
The labor totals in Army Gantt charts are expressed in the military unit of Man-
days (MD), which is described as a unit of work that is performed by one person in an
eight-hour day. MDs are not the same as work days because work days can change based
on the number of hours worked, but a unit of labor is always expressed as one eight-hour
MD regardless of the length of the work day (Headquarters, Department of the Army,
2014, pp. 3-2). For example, in order to complete the work needed on the first day (May
17th) of the project outlined in Figure 3, a project leader needs to assign seven personnel
to accomplish eight hours of work each during the length of the workday. However, the
workday on May 17th may be longer than eight hours, based on the schedule.

17
Figure 3. Level 3 Gantt Chart before resource leveling. “Adapted from Figure 3-8: Level
III Chart Example 1 (Sheets 1-2),” by Headquarters, Department of the Army, 2014,
Construction project management. (Army doctrine publication No. TM 3-34.42), pp. 3-15
- 3-16). Copyright 2014 by the U.S. Government Printing Office.
In the initial labor resource totals listed at the bottom of Figure 3, there exists a
large imbalance of required labor between the first few days of the project and the last. It
is impractical from a cost and labor standpoint to have more than a dozen personnel
engaged for a few short days and only a few working during the last days of a project.
Time constrained resource leveling is a key component of proper time management and
maintaining a project schedule (Headquarters, Department of the Army, 2014, pp. 3-14,
Leach, 2014).

18
Leveling human resources evenly across the duration of the project, while staying
within scheduled tasks durations, is an essential component of the traditional project
management methods adhered to by the Army. The inherent flexibility in the non-critical
tasks, i.e. the float, allows project managers move those tasks further along in the
schedule as long as they do not change the start days of critical tasks. However, by doing
this, non-critical tasks lose all their float during the resource leveling process and become
critical tasks themselves resulting in no float left to spare if work goes behind schedule.
Also, when moving human resources around in order to accommodate daily levels of
MDs, also known as resource smoothing, it can become necessary to extend critical task
durations when critical human resources become over scheduled (Leach, 2014). When
the order of scheduled activities is changed due to resource leveling, a new Critical Path
takes precedence over the old one. Project supervisors then have to redraw their CP logic
diagrams and task nodes to match the new Gantt chart schedule (Headquarters,
Department of the Army, 2014, p. 3-14). Construction Project Management
(Headquarters, Department of the Army, 2014), outlined the procedures project
supervisors should follow to in order to level human resources and maintain the relatively
the same number of personnel working each day throughout the duration of the project.
Figure 4 is the same Level 3 Gantt chart as in Figure 3; however, the resource leveling
procedures in Section 3.8 of Construction Project Management have been applied.

19
Figure 4. Level 3 Gantt Chart with resource leveling applied. Adapted from “Figure 3-
10: Level III Chart Example 3 (Sheets 1-2),” by Headquarters, Department of the Army,
2014, Construction project management. (Army doctrine publication No. TM 3-34.42),
pp. 3-20 - 3-21). Copyright 2014 by the U.S. Government Printing Office.
Critical tasks are still displayed with bold black lines across the length of their
duration. Non-critical tasks (originally drawn in grey) that can be rescheduled are crossed
out using red lines and given new dates, shown with red arrows, allowing for better
leveling of personnel. Total personnel needed across the duration of each task are listed
in blue next to the task. Finally, new resource leveled totals are listed in red at the bottom
in the Total Labor Resources line. This rough version of a leveled Level 3 Gantt chart is
then run through project software, such as Microsoft Project, to create the final schedule.

20
Once the final Level 3 Gantt charts have been resource leveled and daily MD
requirements have been calculated, they can be used to create Level 2 and Level 1 Gantt
charts. These higher-level charts are used to track cumulative MDs and project
completion rate across the duration of the project or multiple projects within a large
construction site. Before project completion information is transferred to a Level 2 Chart,
the information is first formatted by activity type (masonry, plumbing, carpentry, etc.)
and combined with MD totals from other projects of the same designated type
(Headquarters, Department of the Army, 2014, p. 3-22). This is designed to make it
easier for project supervisors to measure progress and ascribe it to the Level 2 weekly
progress, and the master activities list (Figure 2).
In the final phase of planning, project supervisors can use Level 1 Gantt charts,
also known as a synchronization matrix, to combine projects and track completion
percentages and MD requirements across a complex construction site if needed. Level 1
charts reemphasize the need for supervisors to carefully balance resource leveling across
projects as well as reinforce areas of a project that may be falling behind schedule.
Specifically, a detailed Level 3 chart becomes the project bedrock standard and rubric
that drives the project forward and dictates schedule and resource adjustment. Project
supervisors must use it “to resource-level requirements, to match constrained resources,
to compress the schedule to match a desired completion date, or to justify additional
resources” (Headquarters, Department of the Army, 2014, p. 4-9). When a projects
percentage of completion does not line up with where it is supposed to be at a given point
on a schedule, project supervisors have to take steps to start project reduction and get the
schedule back on track (Headquarters, Department of the Army, 2014).

21
Limitations of the current method. As discussed in the previous section, time
constrained resource leveling can have a negative impact on task durations and often
extends schedules. When two tasks are scheduled that require the same resource at the
same time, that resource becomes over scheduled (Figure 5, Schedule A). The traditional
solution for this dilemma is to extend the duration of one of the tasks This frees up the
resource where it was in conflict (Shurrab, 2015). Unfortunately, this method only adds
to task and project duration overall (Figure 5, Schedule B) (Leach, 2014).
Schedule A
Schedule B
Figure 5. Resolving resource conflicts by extending a project schedule. Adapted from
“PMP prep: Resource leveling and resource smoothing,” by S. Dash, 2015, Microsoft
Project User Group, Nov. 3, 2015. Copyright 2015 by MPUG.

22
Army construction planning can be a very involved and complicated process
requiring several rewrites of planning charts and CPM diagrams. This process, designed
with thoroughness in mind, can be a lengthy and time consuming. In addition, it may
distract project leaders from schedule maintenance and project supervision (Cerveny &
Gallup, 2002). The inherent rigidity of critical task duration scheduling, combined with
lack of flexibility, needless complexity, and the need to move resources from designated
non-critical tasks have all been cited as key contributors to project delays (Goldratt, 1997;
Leach 2014; Umble & Umble 2000).
Because delays in these interconnected critical events effect overall project
duration, Construction Project Management (Headquarters, Department of the Army,
2014) encouraged project supervisors to extend task durations to the longest available
allotted time in order to avoid a particular critical task finishing late and negatively
effecting the finish time of the project. “In most project environments, people feel good if
they complete an activity by the due date, and feel bad if they overrun the due date. This
reinforces their attempts to estimate high probability completion times” (Leach, 1999, p.
45). However, a key component to completing a project on time or ahead of schedule, as
well as on budget or under budget, is proper time management. Four specific undesirable
effects that often plague CPM planning are excessive duration estimating, lack of positive
task time variation, failing to pass on positive task time variation, and delays caused by
merging paths. These all fall within the category of poor time management (Goldratt,
1997). Army construction planning is also susceptible to these issues and planners often
attempt to remedy it by increasing planned duration times for particular project nodes.
Subsequently, these increases in schedule time often contribute to other project issues
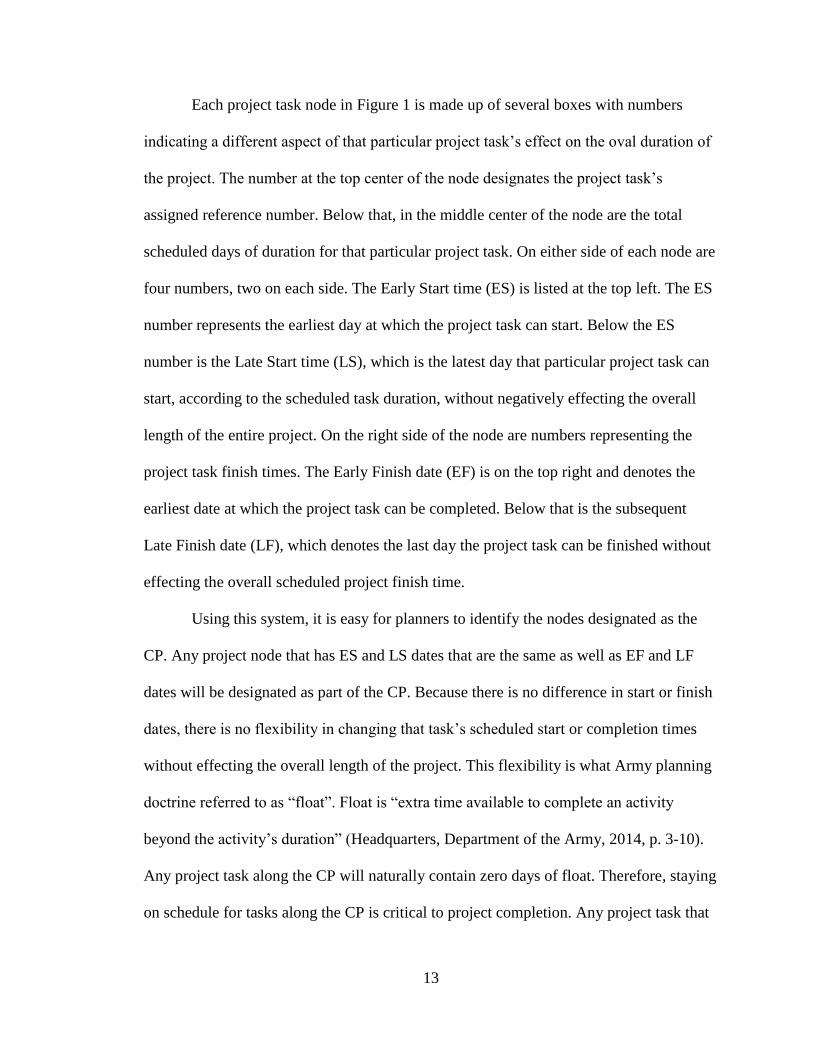
23
such as resource contention, working to time instead of project completion, and forcing
other tasks to automatically start on their late start times (Walker, 2010). Poor resource
scheduling issues can contribute to poor time management. Ineffective resource
scheduling can lead to additional undesirable effects of multi-tasking and loss of focus
(Appelbaum, Fernandez, & Marchionni, 2008; Leach, 1999). Another important
shortcoming in the current system of Army project planning is resource leveling. For
Army project supervisors, resource leveling is a way of maintaining a similar number of
MDs each day across the entire project. This form of resource leveling does not
necessarily take into account the effective scheduling of critical resources; those
personnel and equipment essential to task completion. Effective resource scheduling
would prevent many of the issues that require project supervisors to draw personnel from
non-critical tasks and readjust the schedule (Umble & Umble, 2000).
Regaining the schedule. Construction Project Management (Headquarters,
Department of the Army, 2014) encouraged project managers not to solely rely on Gantt
charts and Situation Reports (SITREPs) for tracking project progress. These systems can
point out when a project is falling behind schedule, but fall short in identifying a specific
reason. The TM recommended project managers to “get on the job, observe, and interact
with the project supervisor and crew to help the project supervisor develop corrective
actions” (Headquarters, Department of the Army, 2014, p. 7-13). On-site management is
necessary for regaining the schedule because, according to the TM, the most prudent
course of action for gaining ground involves requesting additional resource personnel or
increasing the availability factor of assigned personnel. This can only be done if a
manager has a shared understanding with the project supervisor of specific delays.

24
Availability factor increases for personnel may include working longer hours
(beyond a standard eight-hour MD), canceling any personal leave or passes, or even
sacrificing Army standards such as haircuts and site security (Headquarters, Department
of the Army, 2014, p. 7-16). Any request for additional personnel to regain lost time must
also be done through the chain of command and requires project leaders to draw up a
specific and detailed new plan for the temporary use of additional personnel to regain the
schedule (Headquarters, Department of the Army, 2014, p. 7-13).
Another option at project leader’s discretion is to split crewmembers and work
ahead on designated non-critical tasks. One of the perceived conveniences of the Army’s
form of CPM is that it allows project managers the ability to stretch out project duration
in order to decrease the size of a crew. This means these stretched tasks could easily be
shortened in emergency situations by bringing in extra personnel, splitting less essential
personnel or extending working hours. By doing so, project supervisors “may be able to
squeeze a few days out of the schedule by splitting up the crew and having some of them
work the next activity,” (Headquarters, Department of the Army, 2014, p. 7-13).
Essentially, what the TM is recommends for project managers to do is to plan extra time
into a project tasks to allow for fewer crew, while at same time encouraging them to split
up their crews or bring in additional personnel when behind schedule.
Summary of the Army CPM System
There are a number of issues with the current system of Army construction
planning that can be viewed as negative contributors to project completion. Construction
Project Management (Headquarters, Department of the Army, 2014) encouraged project
supervisors to have crews multitask, bring in outside personnel, and extend work hours in

25
order to regain the schedule of a delayed project. During the planning phase project
supervisors are encouraged to extend the schedule or create critical tasks out of what
were originally non-critical tasks in order to level resources across a project. All of these
issues can have a negative impact on time project completion (Goldratt, 1997; Leach
2014; Shurrab, 2015; Umble & Umble 2000). These issues are not new, nor are they
exclusive to the Army. Several methods and approaches have been developed over the
years to address the shortfalls of CPM. One such system, Critical Chain Project
Management (CCPM), may have solutions Army project supervisors need to succeed.
Critical Chain Project Management
In his book, Critical Chain, Dr. Eliyahu Goldratt attempted to apply production
management techniques to project management. He adapted separate resource and
schedule management systems suggested by other scholars and researchers and combined
them with his own Theory of Constraints (TOC) (Trietsch, 2005). This adapted project
management tool was dubbed Critical Chain Project Management (CCPM) and provided
a more holistic project management solution that could be both used on its own or
combined with traditional processes such as CPM (Cerveny & Gallup, 2002).
The Theory of Constraints. CCPM was Goldratt’s extension of the TOC
manufacturing management principles adapted to a project management system. TOC is
based on the subordinating a system to the slowest or weakest point in that system,
referred to as the constraint, and then improving that system to reach maximum
throughput. Goldratt (1997), created five focusing steps for improving a system:
1. Identify the constraint.
2. Exploit the constraint.

26
3. Subordinate everything else to the constraint
4. Elevate the constraint
5. If the constraint is broken, return to step one and repeat the process.
In Step One, identifying and exploiting a constraint, managers utilize the weakest
link as much as possible without overloading it. Step two, subordinating everything else
to the constraint, means that other points in the system are not overproducing, wasting
material or time that the constraint cannot utilize. The third step, elevating the constraint,
can require investment in improving the throughput of the system at the constraint, such
as more personnel or better equipment. If the constraint is elevated to the point that it is
no longer the weakest point in the system, the process repeats itself once the new
constraint has been identified (Goldratt, 1997). TOC presents a novel approach to system
improvement and has seen some success in industrial and production settings (Sonawane,
2004). TOC system improvement allows for smooth system-wide flow, throughput, and
helps eliminate waste, all while improving system output (Leach, 2014).
Applying TOC to project management. In creating the Critical Chain system,
Goldratt (1997), applied five focusing procedures for identifying system constraints
within a manufacturing chain and converted them into procedures that identify resource
constraints that affect projects. Goldratt theorized that a limited resource, such as
specialized or technically trained personnel or a specific piece of equipment that is
needed to complete a project have the same effect on a project as the weak link in a
production chain.

27
Projects, like production lines, can only continue effectively at the pace of their
constraint. Any extra production or completion of tasks ahead of what the constraint is
capable are viewed as waste in project management (Leach, 2014). In order for a project
to have effective throughput, constraints need to be identified and exploited, similar to
production management. Figure 6 is an illustration of how the Five Focusing steps for
production improvement can be converted to address resource constraints in project
management.
Figure 6. Application of TOC and CCPM. Reprinted from “How the Critical Chain
Scheduling Method is Working for Construction,” by J. Yang, 2007, Cost Engineering
49, (4), p. 26. Copyright 2007 by AACE International.
In CPM, the most critical factor is the longest chain of critical tasks that is needed
to complete a project on time. Goldratt (1997) instead argued that the real key to timely
project completion is not simply the critical tasks, but the resources attached to those
tasks makes them critical. In CCPM, becomes the longest chain of critical resources
needed to complete a project on time. Everything in a project is subordinated to these

28
resources. This is accomplished through improved time management with the use of
shortened tasks durations and time buffers as well as strict resource scheduling and
control.
CCPM and time management. When discussing project schedule management,
project safety (referring to a manager’s ability to maintain on time completion rates rather
than personnel or job site safety) is a paramount concern. Managers place great emphasis
on ensuring they have adequate time for tasks. Naturally, no one working on a project
wants to be responsible for their portion of project being late or requiring more resources
than scheduled. Subsequently, managers can inadvertently extend a project’s length by
over scheduling task durations that are unnecessarily long in order to ensure a 100%
completion rate for that task or for a project as a whole (Cerveny & Gallup, 2002, Leach,
2014).
Extending tasks durations for the sake of safety and completion rates can often
backfire on project schedule planners. The basis of CCPM time management efficiency is
its core value of cutting padded duration estimates of tasks by as much as 50% and
redistributing those as buffers to the end of a project (Figure 7). The end result is a chain
of project tasks that are shorter in duration while retaining schedule contingency because
managers can draw from the overall project buffer if tasks cannot be completed as
scheduled. This inherently simpler schedule drives employees to start and complete their
assigned tasks as fast as possible while allowing managers to retain the contingency time
needed to address issues when needed (Barnes, Dvir, & Raz, 2003).

29
Figure 7. CPM vs. CCPM scheduling. Adapted from “A Critical Look at Critical Chain
Project Management,” by R. Barnes, T. Raz, & D. Dvir, 2003, Project Management
Journal, 34(4), p. 25. Copyright 2003 by the Project Management Journal.
A task with a scheduled completion success rate of 50% means statistically half
will be completed at the new compressed rate (Barnes, Dvir, & Raz, 2003, Leach, 1999).
A contributing factor to tasks not being completed during normal or extended scheduling
is because humans have a tendency to delegate tasks based personal priority or urgency.
Often, procrastination leads tasks to be put off to the last minute until they become too
urgent to be ignored. This is what was referred to by Goldratt (1997) as student
syndrome. Student syndrome creates a propensity to take all of a task’s scheduled time,
thereby not adding any positive variation time savings to the project. A project with
ample or excessive scheduled time (or float in the case of Army projects), combined with
its status as a non-critical task means there is no urgency to begin the task. This often
means that managers might do as much as 100% of the work on a task during the last
30
25% - 33% of the scheduled time. If any problems arise during this time, they can lead to
the task running long, negating any benefits that padding the project time was supposed
to provide (Leach, 1999; Umble & Umble, 2000).
By eliminating individual safety and cutting task durations, CCPM effectively
takes issues brought on by procrastination out of the system and pushes managers and
project teams to utilize their time more effectively. It also has the added benefit of
eliminating the need for having early start and late start times for projects, which often
act as means of procrastination, rather than a time safety (Goldratt, 1997; Trietsch, 2005).
In traditional CPM, time management issues can also arise when chains of non-critical
tasks merge with the CP and these outlying tasks come with delays. These delays will
contribute to an overall project delay. In this way, non-critical tasks, such as those
designated with available float in Army construction projects, can actually affect project
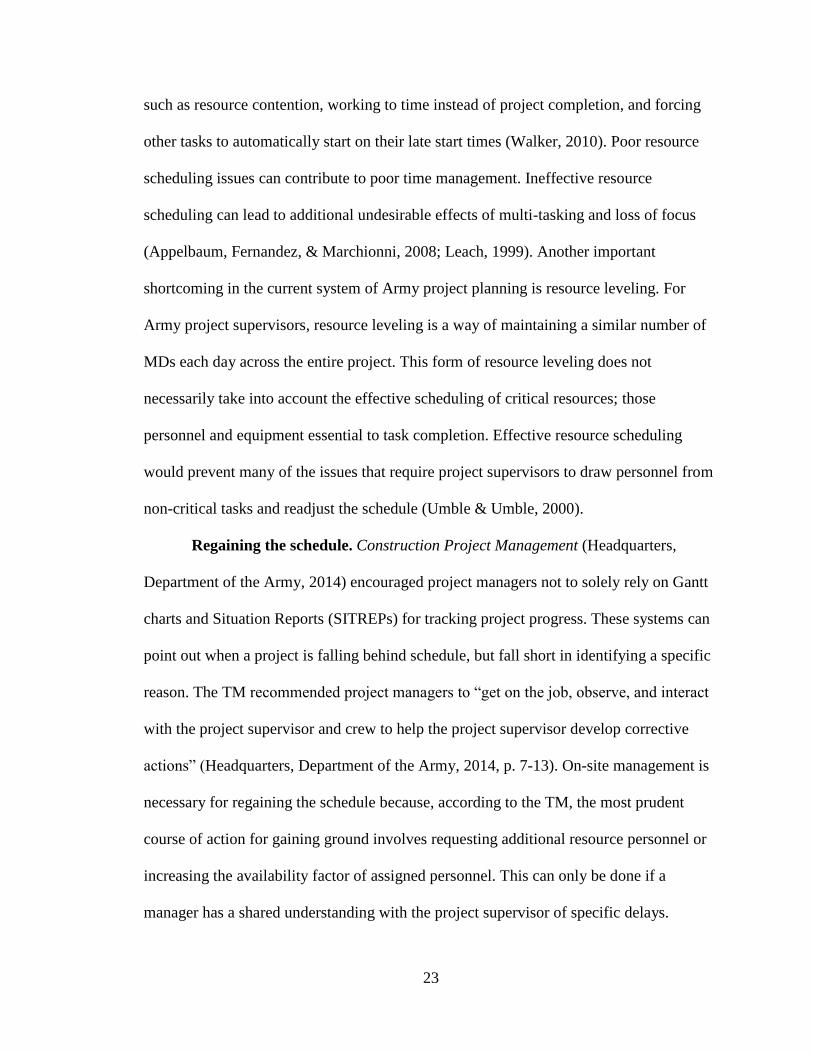
completion. CCPM addresses this flaw by applying specific project chain feeding buffers
(Figure 8), which protect the critical chain from delays.
Feeding buffers are created in the same manner as the overall project buffer. Up
to 50% of a feeder task’s duration is cut and added to the end. In this way, a non-critical
tasks or series of non-critical tasks essentially become their own mini project within the
greater project itself. This method can also be utilized in large construction projects that
have several separate projects with different managers or even construction firms. These
separate projects can safely feed into each other without carrying over delays into the
overall critical projects due date. Any extra slack time, padding, or float is taken out of
the critical tasks and stored in a feeding buffer at the end of the feeder chain. Just like the
main project buffer, the feeding buffer does not eliminate the safety time, but rather helps
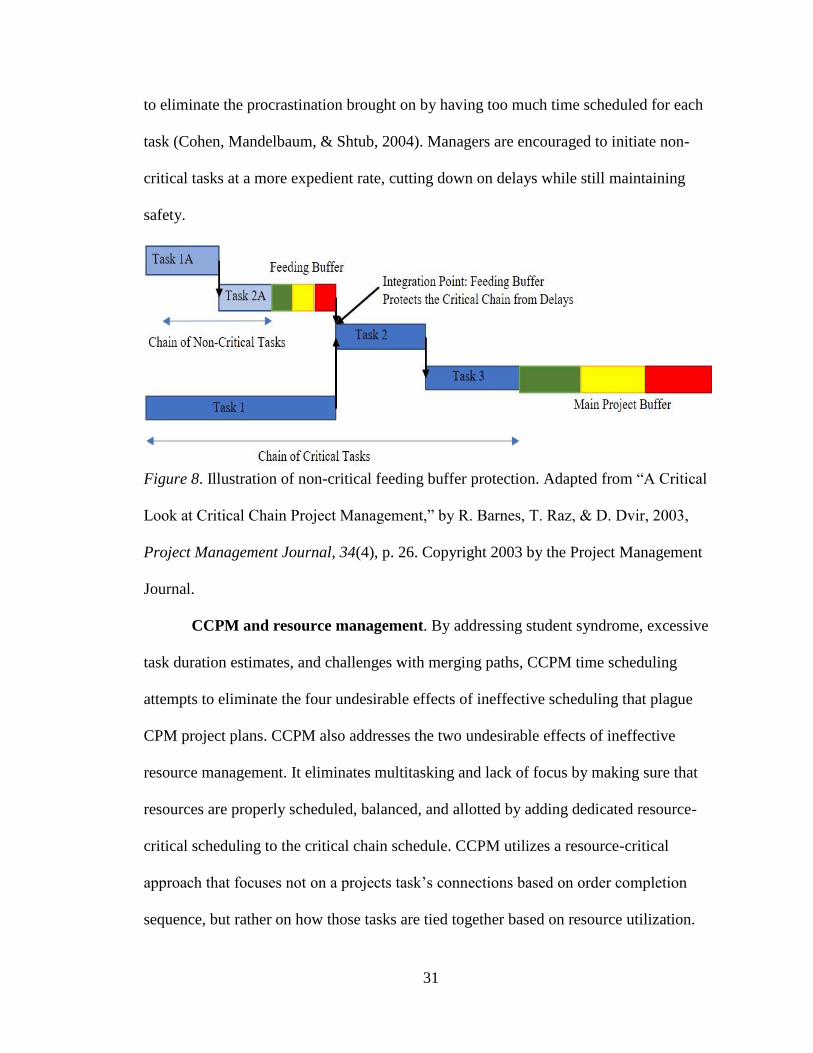
31
to eliminate the procrastination brought on by having too much time scheduled for each
task (Cohen, Mandelbaum, & Shtub, 2004). Managers are encouraged to initiate non-
critical tasks at a more expedient rate, cutting down on delays while still maintaining
safety.
Figure 8. Illustration of non-critical feeding buffer protection. Adapted from “A Critical
Look at Critical Chain Project Management,” by R. Barnes, T. Raz, & D. Dvir, 2003,
Project Management Journal, 34(4), p. 26. Copyright 2003 by the Project Management
Journal.
CCPM and resource management. By addressing student syndrome, excessive
task duration estimates, and challenges with merging paths, CCPM time scheduling
attempts to eliminate the four undesirable effects of ineffective scheduling that plague
CPM project plans. CCPM also addresses the two undesirable effects of ineffective
resource management. It eliminates multitasking and lack of focus by making sure that
resources are properly scheduled, balanced, and allotted by adding dedicated resource-
critical scheduling to the critical chain schedule. CCPM utilizes a resource-critical
approach that focuses not on a projects task’s connections based on order completion
sequence, but rather on how those tasks are tied together based on resource utilization.

32
Project tasks often have to utilize the same resources (time, people, equipment, and work
spaces). CCPM highlights the critical chain of resource utilization and shows the most
critical path of resource and task dependencies. By identifying those relationships, CCPM
allows planners to develop a project plan based on leveling resource management across
the project. Figure 9 illustrates a construction project schedule in which a resource has
been leveled and properly scheduled prevents its use in multiple places at once.
By taking a resource-critical approach when it comes to scheduling and leveling,
CCPM attempts to address the undesirable effects of CPM. CCPM urges planners to
consider the constraint of over scheduling resources before laying out task order and
duration. By doing so, planners can avoid the pitfall of having to extend tasks when
resources come into conflict because they are never in conflict (Shurrab, 2015). However,
in order to avoid these conflicts before they occur, both critical and non-critical project
tasks often need to be ‘pushed to the right’, which can extend project duration just as
CPM. Conversely, this negative increase in project time is offset through CCPM’s 50%
task times (Leach, 2014).

33
Figure 9. CCPM resource critical leveling and scheduling. Reprinted from “Critical Cain
Project Management Improves Project Performance,” by Larry P. Leach, 1999, Project
Management Journal, 39(2), p. 46. Copyright 1999 by Project Management Journal.
By focusing resources (time, people and equipment) in a detailed schedule,
CCPM ensures that those resources are not spread too thinly or pulled away for another
task or side project. Multi-tasking, along with maintaining an abundance of work-in-
progress (WIP), is often sought after by some managers who feel the need to keep
workers busy. However, this approach has disadvantages when it comes to efficient use
of resources. Keeping workers busy often does more harm than good when it comes to
maintaining schedule control and proper use of resources (Herroelen & Leus, 2005).
Workers who are multitasking with lots of WIP will stretch managers to their limit.
Managers that are dealing with too many issues at once are more likely to lose focus on
what is most critical on a project at any given time. In CCPM “it is advisable to reduce,
or even eliminate concurrent activities, focusing the project participants on the critical
chain” (Yang, 2007, p. 27). Focused workers and managers can concentrate on one

34
critical task and are better able to complete tasks on or ahead of schedule. They also
maintain the quality of work because of fewer distractions (Gill, 2008).
Summary of Literature Review
As stated earlier, Army Engineer construction projects adhere to the traditional
CPM standards of arranging tasks in logical order of completion. Engineering projects
focus on tasks deadlines set by the standards outlined in the 3-34 series of U.S. Army
Corp of Engineers Training Manuals. Detailed tables in these manuals outline how long a
given construction task is projected to take based on several factors including weather,
terrain, equipment capabilities and capacities, and labor. These established numbers are
factored into scheduling the duration of various tasks within a construction project. A key
measure of success for any project is completing it on time. A core issue is exceeding the
time schedule. The Army’s solution to this problem is to (1) extend the duration of a
given task in order to protect schedule overruns, and (2) regain the schedule through the
use of extra labor, overtime, or outside help (Headquarters, Department of the Army,
2014).
Protecting a construction project’s completion date and making sure that it is
completed on time or ahead of schedule by inflating individual tasks with too much
safety time extends the length of the overall project is counterintuitive (Gill, 2008). By
adopting the task reduction and time buffering techniques used in CCPM (namely, the
method of cutting each padded task by 50% and adding the safety to the overall project
buffer), Army construction project planners could avoid the project time overruns that
occur because of task duration overestimation. Adopting this approach could also have
the benefit of advancing early time completion to be passed on to the next task. Team

35
leaders on an Army construction project are just as likely to be subject to the pitfalls of
student syndrome and personally prioritizing their particular task over another. Task
duration inflation only compounds this issue. “With inflated duration, a project manager
cannot control the schedule because project participants are reserving their safety time.”
(Yang, 2007, p. 25). By eliminating an individual task’s safety time and adding it to an
overall project buffer instead, the tendency for team leaders to take all of their scheduled
task time may be reduced. This causes a positive time savings effect. Also, time
management and control of schedule overruns is limited to the control of the project
manager instead of every individual team leader. This would allow the project manager to
focus time saving actions and personnel on individual critical tasks that run long, rather
than rushing to fight multiple issues.
Perhaps the largest issue facing completion of Army construction projects is the
tendency for project site leadership to want to keep soldiers busy at all times. Army
construction projects are subject to the same determination that drives soldiers and
leaders through the dangers on the battlefield and keeps units focused and moving. While
admirable and necessary in combat, these virtues often manifest in negative ways on a
construction site such as being in conflict with the planned scheduling on the Gantt chart.
Unscheduled or hyper-scheduled tasks can often do more harm than good. “Untimely,
availability of an upstream resource can cause exponential degradation of a project,
especially if critical path tasks are forced to spin their wheels” (Seider, 2006, p. 44).
While it can be successful in keeping soldiers working, multitasking can negatively
impact a project’s completion time by tying up valuable resources. The result the start
times of critical tasks are delayed, or their duration is extended, because personnel are
36
sidetracked with a non-critical or non-project task that was harmless at one point, but
eventually gets out of hand (Appelbaum, Fernandez, & Marchionni, 2008; Gill, 2008).
The Army has adopted the traditional method of resource smoothing when it
comes to assigning personnel and maintaining schedule control. This practice can
produce the negative effects of increased project duration and critical resource conflicts
(Shurrab, 2015). CCPM addresses these issues through strict resource-critical scheduling,
eliminating much of the wasteful multitasking and misallocation of critical personnel
resources. If personnel and equipment resources are recognized as the most critical part
of an Army construction project, rather than the task itself, then issues of multitasking,
and procrastination could be kept in check (Leach, 2014).
CCPM specifically addresses the possible undesirable effects of the more task
oriented CPM by using several time and resource scheduling techniques that can provide
a more stable and focused alternative to project plan. Goldratt designed CCPM to be
simplistic in nature and holistic in design. Its benefits could be utilized either as a
complete alternative to CPM and Gantt based planning, or in an ad hoc fashion and using
the time management methods best suited for Army construction. There are questions
that have to be considered in using CCPM solutions for Army construction. Namely,
what specific time management and resource issues do Army project supervisors face? In
addition, does CCPM offer viable solutions to those issues that Army construction
planners can utilize?
37
Methodology
Participants and Procedure
The intent of the research was to conduct a study of Army Officers who have
served as project supervisors and managers and have experience in construction project
planning and execution. The study was conducted at the Captain’s Career Course and
Warrant Officer Schools at the Engineer branch of MSCOE at Ft. Leonard Wood,
Missouri. The schools at MSCOE train all Army Engineer Officer’s and Non-
Commissioned Officers in basic and advanced construction management methods. In
order to survey the largest number of classes, with the largest possible sample size, the
survey was administered in person by the lead researcher and proctored by class Small
Group Leaders (SGLs).
Four classes of Army Officers, two Commissioned and two Warrant, were
surveyed on site at MSCOE during the 16th-19th of March, 2017. Classes surveyed
consisted of Commissioned and Warrant officers at different stages of experience. This
sample provided 2% - 4% representation of the total number of Engineer Officers in the
Army. The Army Corps of Engineers is relatively small compared to other Army
branches (Table 1).
Instruments and Materials
The survey was administered on classes using a multipage paper format. The
survey instrument (Appendix A) was designed to protect confidentiality and comply with
university IRB guidelines and Army regulations. The survey was split into four sections.
The first survey section gathered demographic data. The next three survey sections
consisted of 83 statements on project planning, execution, and completion issues related

38
Table 1
Officer sample and population sizes
Sample Size - n Estimated Population Size - N
34 1LTs 1500
47 CPTs 1200
16 WO1s 250
22 Chief Warrant Officers 250
________________________________________________________________________
Note. Source: MSCOE Commissioned and Warrant Assignment Officers classroom
enrollment figures for Fiscal Year, 2016.
to the existing CPM system. Statements in sections 2 through 5 were numbered 1 to 84.
During the editing process, survey question 20 was deemed irrelevant and pulled from
section 2. The survey instrument was not renumbered and question number 20 does not
exist in the final survey.
The participants were asked to respond to each statement based on their perceived
level of impact. Each question was given a five-point scale of 1 – 5; with 1 representing
little to no impact and 5 being very impactful. The last section of the survey presented
participants with 20 statements and questions on CPM or CCPM based solutions.
Participants were asked to respond to each statement based on their level of agreement on
a scale of 1- 5, with 1 meaning they strongly disagreed with the statement, and 5 meaning
they strongly agree with the statement. The survey statements were based on categories
of project leadership including procrastination, multitasking, scheduling, resource
leveling, and project safety time.

39
Threats to Validity
The potential threats to the validity of this study were determined as follows:
1. Not all participants had an equal level of experience as an Army construction
project supervisor. To account for this, an ANOVA was conducted based on
experience responses in the demographic questionnaire section of the survey
instrument.
2. Feedback was based on project management education level and bias. To account
for this, an ANOVA was conducted based on education responses in the
demographic questionnaire section of the survey instrument.
3. 3.Because of the classroom setting and unique situation of having a captive
audience in a military school, respondents may have felt obligated to take the
survey. This could negatively impact the results. To account for this, all
participants were reminded that the survey was 100% voluntary. All surveys with
obvious quick responses (i.e. an entire section of 1s or answers circled in a zig zag
pattern, etc.), or substantial amounts of incomplete data were removed and not
recorded during the analysis phase.
4. Not all Commissioned Officers at the Captains Career Course (CCC) were
originally Engineers Officers. Some may have come from other branches and had
no previous Army or civilian engineering experience. To account for this, all
participants were reminded that the survey was 100% voluntary and dealt
exclusively with Army and Corps of Engineer projects. Officers from other
branches with no experience in engineering were advised not to participate.

40
5. Project management issues may not have been adequately covered in the survey
statements. To account for this, participants were encouraged to leave comments
on their surveys, highlighting any concerns. These comments are discussed in the
findings section.
Analysis
A total of 132 surveys were administered to classes at MSCOE from March 16th
to the 19th, 2017. Thirteen surveys were removed from the analysis because of issues 3
and 4 stated in the Threats to Validity Section. Of the remaining 119 participants, their
answers to the survey instrument were divided into four groups based on rank and five
sections based on the sections in the survey, and entered into an Excel spreadsheet
(Appendix B). The participants were assigned a respondent number in the order
processed. The four initial groups based on rank consisted of 34 1LTs, 47 CPTs, 16
WO1s, and 22 Chief Warrant Officers; of which 20 were Level 2 (CW2) and two were
Level 3 (CW3).
The first part of the survey was designed capture what participants perceived to be
the greatest issues when it came to successful completion of Army construction projects.
The independent variables in the first part of the study were the effectiveness of current
CPM based system for scheduling and resource management across three phases;
planning, execution, and completion. The dependent variables were the responses of the
various rank and experience groups. The independent variables for the second part of the
survey were the effectiveness of CPM and CCPM based solutions. The dependent
variables were the responses of the various rank and experience groups.
41
The methodology of the study was that of a quantitative analysis of the results of
the survey (Creswell, 2014). By analyzing the number of negative responses to issues that
affect CPM projects between the two groups of officers, it was possible to quantify the
issues perceived that negatively impact project completion under the current system.
Subsequently, analysis of data from the second part of the survey demonstrated the
perceived benefit of CCPM to CPM.
To conduct the quantitative analysis, the sections were further divided into two
sub-categories, one for resource issues and one for scheduling issues. The average answer
for each of these statements was derived using Excel, along with the standard deviation
for each set of question answers. A distribution analysis was conducted of all answers
within a sub section. This was done in order to have a visual representation of the how
the data in each section was distributed based on a normal curve and to have a visual
representation of each sample group’s relative homogeneity (Figure 10).

42
Figure 10. Example from Appendix B of initial data entry, analysis, and distribution
spreadsheet for 1LTs.
Resource Issues Scheduling Issues
Question Number> 1 2 6 8 9 10 13 14 15 16 17 21 22 24 25 3 4 5 7 11 12 18 19 23
Respondent Rank
1 1LT 2 5 3 3 1 2 2 3 4 3 2 1 1 2 2 4 4 3 3 3 1 1 2 1
2 1LT 4 5 4 4 2 3 2 2 4 5 2 3 2 4 3 4 2 2 2 2 4 4 5 4
3 1LT 2 2 1 1 1 1 1 1 1 2 1 1 1 1 1 1 2 1 1 1 2 2 1 1
4 1LT 1 4 1 2 3 1 5 2 4 2 1 3 1 1 1 2 1 1 2 2 1 1 1 1
5 1LT 3 3 5 5 1 3 3 4 4 3 2 2 3 3 5 4 5 4 4 4 1 1 2 2
6 1LT 5 4 3 4 3 4 3 4 2 4 3 1 4 3 4 3 4 3 3 2 4 4 2 4
7 1LT 3 4 2 4 4 5 4 2 5 5 1 4 4 4 3 3 3 3 4 2 3 2 2 3
8 1LT 4 5 4 5 1 2 3 3 5 3 2 2 2 1 2 3 3 4 3 2 2 2 1 2
9 1LT 4 4 2 2 5 2 3 2 2 1 1 2 4 4 3 3 4 2 2 2 2 3 3 4
10 1LT 4 4 3 4 3 4 3 4 5 4 2 2 3 4 2 3 3 3 4 4 2 2 2 3
11 1LT 4 3 2 4 2 5 2 4 4 4 3 5 4 3 2 3 5 3 4 4 2 3 1 5
12 1LT 2 2 2 4 1 1 1 1 1 4 2 1 1 1 4 3 2 2 1 4 1 3 2 1
13 1LT 3 3 2 5 2 3 4 3 3 4 5 4 2 4 4 4 4 4 3 4 2 4 2 2
14 1LT 3 2 2 4 2 3 3 1 2 3 1 5 2 4 2 1 1 1 1 4 2 3 1 1
15 1LT 3 3 3 4 2 3 3 3 4 4 3 3 3 2 1 3 3 3 3 2 4 1 3 2
16 1LT 1 2 2 1 2 3 4 2 3 3 2 1 1 1 1 4 5 2 5 2 4 4 3 1
17 1LT 5 4 5 5 2 3 5 4 1 4 4 2 4 4 4 5 5 5 3 5 1 4 2 4
18 1LT 3 3 3 3 3 4 4 3 4 4 2 2 2 3 4 2 3 4 2 4 3 2 3 3
19 1LT 4 4 4 4 1 4 4 3 4 4 2 2 3 2 2 3 4 3 3 4 2 2 3 2
20 1LT 3 3 1 5 1 2 5 1 4 1 1 1 1 3 1 1 3 4 5 4 1 3 1 1
21 1LT 2 3 1 3 4 3 4 3 4 1 1 1 2 1 1 2 2 1 1 4 2 2 3 3
22 1LT 4 3 3 4 2 2 3 3 3 3 5 2 2 2 2 3 4 3 3 2 2 2 3 3
23 1LT 3 3 3 4 2 4 4 4 5 3 3 4 2 2 3 3 3 4 2 4 2 3 2 4
24 1LT 2 4 1 3 3 2 3 3 5 5 2 1 1 1 1 3 4 3 1 3 1 1 1 1
25 1LT 2 3 4 5 3 4 5 4 4 5 3 3 3 3 3 3 2 4 5 4 4 3 3 3
26 1LT 2 2 3 2 1 2 2 2 2 2 2 2 2 1 1 2 2 2 3 2 1 2 3 1
27 1LT 3 5 2 1 1 3 4 4 2 3 1 1 5 2 4 4 5 2 2 2 1 3 2 2
28 1LT 3 4 4 4 2 4 4 4 4 4 3 3 3 5 4 2 3 3 4 4 2 1 2 2
29 1LT 2 3 4 4 3 4 3 3 3 3 3 2 3 2 2 3 3 4 3 2 2 2 3 3
30 1LT 5 3 3 4 1 1 5 5 5 5 2 4 2 1 1 3 4 2 1 4 1 1 1 1
31 1LT 4 3 2 3 2 2 3 2 3 3 3 2 3 3 2 2 3 1 2 4 2 2 2 2
32 1LT 3 4 5 5 1 2 3 4 4 4 3 3 2 1 2 5 4 3 4 5 1 2 3 4
33 1LT 5 2 1 4 1 2 3 5 3 2 2 2 2 2 2 2 4 1 1 5 2 1 3 5
34 1LT 4 3 4 4 2 3 3 2 4 3 4 3 4 4 3 3 3 3 4 4 2 4 4 3
Number of Respondents 34 34 34 34 34 34 34 34 34 34 34 34 34 34 34 34 34 34 34 34 34 34 34 34
Question Average 3.1 3.4 2.8 3.6 2.1 2.8 3.3 2.9 3.4 3.3 2.3 2.4 2.5 2.5 2.4 2.9 3.3 3.6 2.8 3.2 2.0 2.4 2.3 2.5
Standard Deviation 1.1 0.9 1.1 1.2 1.0 1.1 1.1 1.1 1.2 1.1 1.1 1.2 1.1 1.2 1.2 1.0 1.1 1.2 1.3 1.1 1.0 1.0 1.0 1.3
Section Average 2.9 Section Average 2.8
Standard Deviation 0.5 Standard Deviation 0.5
-10
40
90
140
-3 -2 -1 0 1 2 3 4 5 6 7 8
Section Distribution
-10
10
30
50
70
90
-3 -2 -1 0 1 2 3 4 5 6 7 8
Section Distribution

43
Statement response outliers were then identified from the average answers for
each section and rank group. Average question responses of 2.5 or less were highlighted
in green and averages of 3.5 or higher were highlighted in orange (Figure 10). This was
done in order to identify statement answers across all the sections and ranks distinctly
different from the average (a mean of 3).
Three additional groups were also compiled to be analyzed against each other
(Appendix D). The first group consisted of those respondents that indicated they had at
least some education (expressed by circling a 2 or higher) in both CPM and CCPM. The
second consisted of those respondents that indicated that they had experience in at least
two construction projects as both a supervisor and in a support role. The third group
consisted of a control group of all officers not included in the other groups. The groups
were analyzed with the same spreadsheet used for initial data (Figure 11).
The responses of the two larger groups of Army officers (1LTs, CPTs, WO1s,
Chiefs and Control, Education, Experience), were then submitted to a quantitative
analysis of variance (ANOVA, Appendices C and E) using Excel’s Single Factor
Measurement Tool. The reason for this was to analyze the variance in responses based on
each of the groups to see if there was a difference across the various groups.
Commissioned and Warrant Engineer officers have very different levels of
experience. Warrant Officers are former Enlisted NCOs that have experience not just in
supervisory positions, but also as lower enlisted crewmembers and equipment operators.
Warrant Officers are typically older, have less college education, but have more job
experience, technical expertise, and certification as Army Engineers.

44
Figure 11. Example from Appendix D of initial data entry, analysis, and distribution
spreadsheet for Education Group.
CPM CCPM
Question Number> 65 69 70 71 72 73 74 75 77 78 80 82 83 66 67 68 76 79 81 84
Respondent Rank
7 1LT 4 4 1 5 3 5 3 4 3 3 5 4 1 4 3 2 4 2 3 1
8 1LT 5 2 1 3 1 3 4 3 4 3 3 3 1 3 5 3 4 3 1 1
9 1LT 4 4 3 3 3 4 3 4 3 4 3 3 3 3 3 2 4 2 3 2
13 1LT 3 2 2 4 1 2 4 2 4 2 4 5 4 2 4 4 4 4 2 1
15 1LT 2 2 3 2 2 2 4 2 2 4 2 4 4 4 2 3 2 3 2 5
17 1LT 5 3 1 4 4 4 2 4 2 4 4 2 4 4 5 2 4 4 5 5
22 1LT 5 4 1 5 1 5 3 4 3 3 3 4 4 1 3 1 3 3 1 2
24 1LT 5 5 3 5 2 5 1 5 1 1 5 4 1 1 5 1 4 1 2 1
26 1LT 2 1 2 3 2 1 1 3 3 4 4 2 1 2 3 5 2 4 3 2
27 1LT 5 5 1 5 2 5 5 4 4 5 5 4 1 4 4 2 2 5 2 1
28 1LT 3 3 1 3 1 3 4 3 2 2 3 3 2 2 4 2 4 4 3 2
29 1LT 3 3 2 3 2 3 2 3 3 2 3 3 2 2 2 2 2 2 2 3
33 1LT 5 1 1 5 1 3 1 3 5 1 1 5 1 2 4 1 2 3 2 4
38 CPT 4 2 1 4 2 3 4 4 4 2 2 4 1 3 3 2 3 2 2
44 CPT 5 5 4 4 2 4 1 1 2 4 5 2 4 1 3 2 1 2 3 1
62 CPT 2 3 3 5 3 5 2 1 3 3 5 5 2 2 3 3 2 3 4 5
66 CPT 5 1 3 5 1 5 1 3 3 2 5 5 1 2 5 5 5 3 3 1
68 CPT 4 4 2 2 2 2 2 4 4 3 4 4 1 3 3 2 3 2 4 2
69 CPT 1 4 1 2 2 2 1 3 1 1 2 3 4 1 5 1 3 2 2 2
71 CPT 5 4 1 3 1 5 5 5 3 3 5 2 3 2 5 1 5 1 4 3
76 CPT 1 5 5 5 5 1 4 2 4 2 4 5 5 4 4 1 4 2 1 1
77 CPT 4 4 2 4 2 2 4 4 3 2 4 4 4 3 4 2 3 4 2 2
78 CPT 4 2 2 4 1 3 4 2 4 4 5 2 3 2 4 4 3 4 3 1
81 CPT 2 2 2 4 1 2 2 1 4 4 3 3 3 3 2 2 5 3 5 1
83 WO1 5 3 3 4 2 4 4 3 5 4 5 2 2 3 5 4 5 3 5 3
90 WO1 2 4 2 3 3 4 2 3 2 1 1 2 2 4 3 3 4 1 2 1
93 WO1 4 2 2 2 2 2 2 2 2 2 2 2 2 1 4 2 2 2 2 2
96 WO1 4 5 2 4 2 4 3 3 3 4 4 5 2 2 5 4 4 2 3 1
98 CW2 5 3 4 4 4 3 4 5 5 3 3 2 2 4 4 1 3 1 4 2
100 CW2 3 3 2 5 1 4 4 5 4 4 4 5 5 2 5 5 4 1 4 1
110 CW2 5 4 3 5 3 4 4 4 4 3 4 3 5 3 4 3 5 4 2 5
111 CW2 5 3 1 4 2 2 3 5 3 4 2 5 3 2 4 1 3 1 3 4
113 CW2 5 3 1 1 1 3 5 4 5 1 3 1 1 4 4 2 4 2 3 1
114 CW2 2 2 4 3 5 3 2 2 3 4 2 4 3 4 1 5 2 4 2 4
Number of Respondents 34 34 34 34 34 34 34 34 34 34 34 34 34 34 34 34 34 34 34 34
Average 3.8 3.1 2.1 3.7 2.1 3.3 2.9 3.2 3.2 2.9 3.5 3.4 2.6 2.6 3.7 2.5 3.4 2.6 2.8 2.2
Standard Deviation 1.3 1.2 1.1 1.1 1.1 1.2 1.3 1.2 1.1 1.1 1.2 1.2 1.4 1.0 1.1 1.3 1.1 1.1 1.1 1.4
Section Average 3.1 Section Average 2.8
Standard Deviation 0.5 Standard Deviation 0.5
-10
40
90
-3 -2 -1 0 1 2 3 4 5 6 7 8 9 10
Section Distribution
-10
10
30
50
70
-3 -2 -1 0 1 2 3 4 5 6 7 8 9 10
Section Distribution

45
Conversely, Commissioned Officers that are project supervisors are much
younger and less experienced. They are typically 1st or 2nd Lieutenants with one to five
years of leadership experience in the Army. They all have college educations by default,
though not necessarily engineering degrees. Subsequently, they also have less job
experience and technical expertise compared to Army Engineers.
Analyzing these groups based on experience level and education was important in
quantifying the validity of their responses. A p-value analysis of the ANOVA results was
conducted to determine if there was any considerable variance between the groups.

46
Findings
Section 1 - Demographic Data of the 7 Groups Studied
Table 2 is a breakdown of the average responses for the demographic data from
each of the respondents. The first four groups are broken down by rank. The next three
represent the average demographic responses of the education, experience, and control
groups. The education group was selected by choosing officers across all ranks that
answered a two or higher for both CPM and CCPM knowledge in Section 1. The
experience group was chosen from officers across all ranks that have participated in at
least two construction projects for the Corps of Engineers, both as a supervisor and in a
supporting role.
Table 2
Demographics - Average responses
________________________________________________________________________
Note. Years of experience are expressed as ranges, as they were on the survey instrument.
Years of CoE Projects CoE Projects Years of
Military Experience as Supervisor in Support Civilian Experience Six Sigma Lean TOC EVM CCPM CPM
1LTs 5-7 3 2 3-5 2 2 1 2 2 4
CPTs 7-9 2 2 0-3 2 1 1 1 1 3
WO1s 11-13 3 6 5-7 2 2 3 2 2 3
Chiefs 15 6 7 9-11 2 2 1 2 2 4
Control Group
Less Education 7-9 1 1 3-5 1 1 1 1 1 3
and Experience
Experience 11-13 6 7 5-7 2 2 2 2 2 4
Education 9-11 4 4 5-7 2 2 2 3 3 4

47
Statement Response Results: Survey Sections 2-5
Statement responses were divided into two subgroups, resource issues and
scheduling issues, and entered into the Excel spreadsheet. In Section 5, statement
responses were divided into CPM and CCPM based solution subgroups. The average
response for each statement, and corresponding standard deviation was compiled by
Army rank using the software. A section average and corresponding standard deviation,
was also calculated using the average answers in that section.
Data was further divided into the education, experience, and control groups. Excel
was used to compile section answers and calculate averages and standard deviations.
Once calculations were completed, outliers in the data were identified. Answers that
represented average responses at 2.5 or below were highlighted in green. Average
answers of 3.5 or above were highlighted in orange. This was done to easily identify
average question responses that were distinctly above or below the mean response of
three by a factor of 0.5. The average responses in each group were then put through two
separate ANOVAs using Excel’s single factor ANOVA function. First, an ANOVA was
conducted between each of the four rank groups surveyed. Next, an ANOVA was
conducted between the education, experience, and control groups. The results of this
analysis, corresponding questions, notes, and ANOVA findings can be found by survey
section under the next four subheadings.

48
Section 2 - Project Planning Issues Results
Table 3
Survey Section 2: Statements by Group
Resource Issues
1. The scope of a project changed significantly during planning.
2. The design of a project changed significantly during planning.
6. Too many tasks are assigned to too few people.
8. Planners assume the job is smaller than it really is.
9. Planners assume the job is larger than it really is.
10. Available resources are not used effectively.
13. There is a lack of communication between project planners.
14. There is a shortage of people needed to complete a schedule on time.
15. There is a shortage of equipment needed to complete a schedule on time.
16. Rules, procedures, or policies hold the project back rather than help.
17. It is difficult to plan things that have not been done before.
21. It is difficult to access historical data that could help with planning projects.
22. Current project planning methods are difficult to change.
24. The current project planning system is good; project planners just don’t know how to
properly use it.
25. The same project planning issues plague every project and are never addressed.
Scheduling Issues
3. The scheduling of project tasks changed significantly during planning.
4. The scheduling of project completion changed significantly during planning.
5. There are frustrations or disagreements about the priority of tasks during planning.
7. Tasks are poorly prioritized.
11. Project schedules are too optimistic – not enough scheduled time.
12. Project schedules are too pessimistic – too much time scheduled.
18. Project time estimates are padded or extended to be safe.
19. Project workload is either “feast or famine”. There is no steady day-to-day work load
throughout the project.
23. Project plans and estimates become self-fulfilling prophecies.
________________________________________________________________________
Note. There was one written response placed next to Statement 16 by a CPT. They circled
5, but wrote “actually 15 [sic]” next to the statement.
Table 4

49
Section 2 – Project Planning: Average answers across officer groups
________________________________________________________________________
Table 5
Project Planning Issues - 1LTs
Resource Issues Scheduling Issues
Question Number> 1 2 6 8 9 10 13 14 15 16 17 21 22 24 25 3 4 5 7 11 12 18 19 23
Number of Respondents 34 34 34 34 34 34 34 34 34 34 34 34 34 34 34 34 34 34 34 34 34 34 34 34
Question Average 3.1 3.4 2.8 3.6 2.1 2.8 3.3 2.9 3.4 3.3 2.3 2.4 2.5 2.5 2.4 2.9 3.3 3.6 2.8 3.2 2.0 2.4 2.3 2.5
Standard Deviation 1.1 0.9 1.1 1.2 1.0 1.1 1.1 1.1 1.2 1.1 1.1 1.2 1.1 1.2 1.2 1.0 1.1 1.2 1.3 1.1 1.0 1.0 1.0 1.3
Section Average 2.9 Section Average 2.8
Standard Deviation 0.5 Standard Deviation 0.5
Project Planning Issues -CPTs
Resource Issues Scheduling Issues
Question Number> 1 2 6 8 9 10 13 14 15 16 17 21 22 24 25 3 4 5 7 11 12 18 19 23
Number of Respondents 47 47 47 47 47 47 47 47 47 47 47 47 47 46 46 47 47 47 47 47 47 47 47 47
Average 3.0 2.8 3.0 3.1 2.0 2.8 2.9 2.5 2.7 3.2 2.5 2.8 2.3 2.3 2.7 3.0 2.9 2.5 2.5 3.2 1.7 2.1 2.7 2.3
Standard Deviation 1.4 1.3 1.4 1.1 1.0 1.2 1.4 1.2 1.2 1.4 1.3 1.3 1.1 1.2 1.4 1.3 1.3 1.2 1.2 1.3 0.8 1.1 1.3 1
Section Average 2.7 Section Average 2.5
Standard Deviation 0.3 Standard Deviation 0.5
Project Planning Issues - WO1s
Resource Issues Scheduling Issues
Question Number> 1 2 6 8 9 10 13 14 15 16 17 21 22 24 25 3 4 5 7 11 12 18 19 23
Number of Respondents 16 16 16 16 16 16 16 16 16 16 16 15 16 15 16 16 16 16 16 16 16 16 16 16
Average 2.7 2.6 2.6 3.4 2.3 2.8 3.3 2.7 3.1 3.1 2.3 2.5 2.3 2.1 2.8 2.6 2.8 2.5 2.6 2.9 2.3 2.1 2.3 2.2
Standard Deviation 0.9 1.0 1.1 0.9 1.1 1.2 1.0 1.1 1.3 1.1 0.9 1.1 1.2 1.2 1.2 0.9 0.9 0.9 1.0 1.2 0.9 1.0 1.0 0.9
Section Average 2.7 Section Average 2.5
Standard Deviation 0.4 Standard Deviation 0.3
Project Planning Issues - Chiefs
Resource Issues Scheduling Issues
Question Number> 1 2 6 8 9 10 13 14 15 16 17 21 22 24 25 3 4 5 7 11 12 18 19 23
Number of Respondents 22 22 22 22 22 22 22 22 22 22 22 22 22 22 22 22 22 22 22 22 22 22 22 22
Average 3.0 3.1 2.8 3.2 2.0 3.3 3.2 3.1 3.4 3.4 2.8 2.8 2.5 3.1 2.8 2.9 2.8 2.4 2.6 3.3 2.1 2.5 2.6 2.6
Standard Deviation 1.0 1.0 1.3 1.2 1.0 1.1 1.3 1.3 1.1 1.3 1.1 1.2 0.9 1.0 1.1 1.1 1.2 1.1 1.1 1.0 1.2 1.3 1.1 0.9
Section Average 3.0 Section Average 2.6
Standard Deviation 0.4 Standard Deviation 0.3
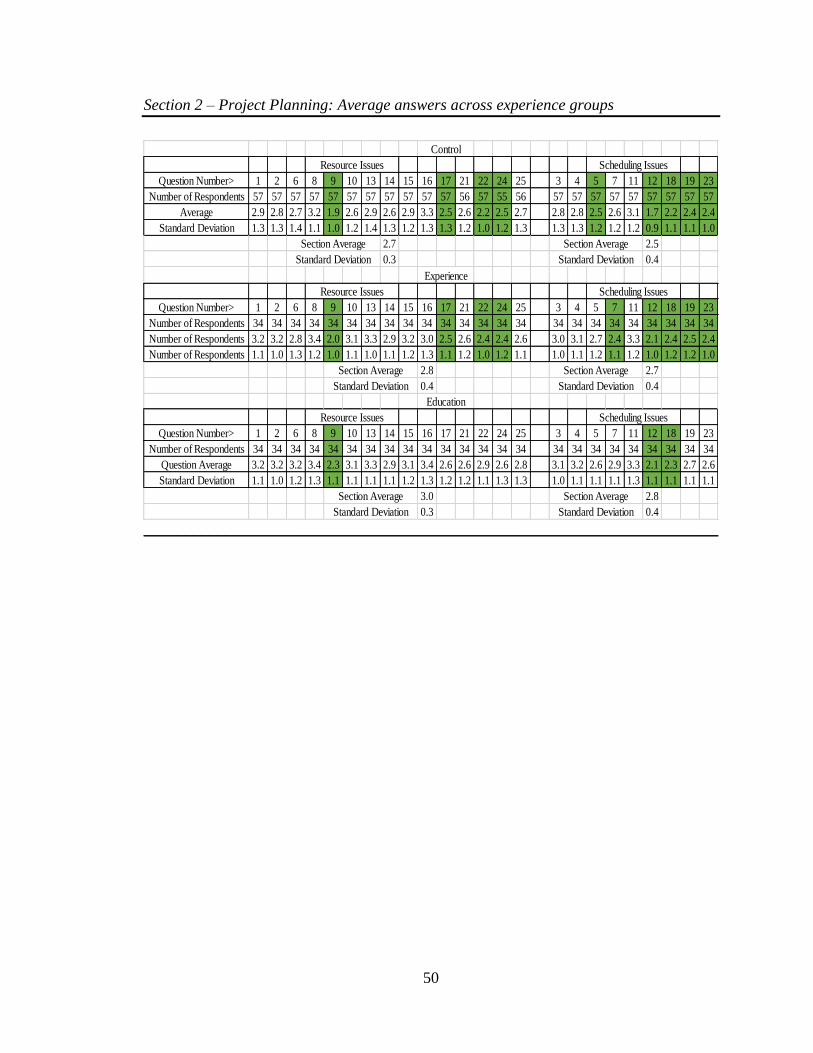
50
Section 2 – Project Planning: Average answers across experience groups
________________________________________________________________________
Control
Resource Issues Scheduling Issues
Question Number> 1 2 6 8 9 10 13 14 15 16 17 21 22 24 25 3 4 5 7 11 12 18 19 23
Number of Respondents 57 57 57 57 57 57 57 57 57 57 57 56 57 55 56 57 57 57 57 57 57 57 57 57
Average 2.9 2.8 2.7 3.2 1.9 2.6 2.9 2.6 2.9 3.3 2.5 2.6 2.2 2.5 2.7 2.8 2.8 2.5 2.6 3.1 1.7 2.2 2.4 2.4
Standard Deviation 1.3 1.3 1.4 1.1 1.0 1.2 1.4 1.3 1.2 1.3 1.3 1.2 1.0 1.2 1.3 1.3 1.3 1.2 1.2 1.2 0.9 1.1 1.1 1.0
Section Average 2.7 Section Average 2.5
Standard Deviation 0.3 Standard Deviation 0.4
Experience
Resource Issues Scheduling Issues
Question Number> 1 2 6 8 9 10 13 14 15 16 17 21 22 24 25 3 4 5 7 11 12 18 19 23
Number of Respondents 34 34 34 34 34 34 34 34 34 34 34 34 34 34 34 34 34 34 34 34 34 34 34 34
Number of Respondents 3.2 3.2 2.8 3.4 2.0 3.1 3.3 2.9 3.2 3.0 2.5 2.6 2.4 2.4 2.6 3.0 3.1 2.7 2.4 3.3 2.1 2.4 2.5 2.4
Number of Respondents 1.1 1.0 1.3 1.2 1.0 1.1 1.0 1.1 1.2 1.3 1.1 1.2 1.0 1.2 1.1 1.0 1.1 1.2 1.1 1.2 1.0 1.2 1.2 1.0
Section Average 2.8 Section Average 2.7
Standard Deviation 0.4 Standard Deviation 0.4
Education
Resource Issues Scheduling Issues
Question Number> 1 2 6 8 9 10 13 14 15 16 17 21 22 24 25 3 4 5 7 11 12 18 19 23
Number of Respondents 34 34 34 34 34 34 34 34 34 34 34 34 34 34 34 34 34 34 34 34 34 34 34 34
Question Average 3.2 3.2 3.2 3.4 2.3 3.1 3.3 2.9 3.1 3.4 2.6 2.6 2.9 2.6 2.8 3.1 3.2 2.6 2.9 3.3 2.1 2.3 2.7 2.6
Standard Deviation 1.1 1.0 1.2 1.3 1.1 1.1 1.1 1.1 1.2 1.3 1.2 1.2 1.1 1.3 1.3 1.0 1.1 1.1 1.1 1.3 1.1 1.1 1.1 1.1
Section Average 3.0 Section Average 2.8
Standard Deviation 0.3 Standard Deviation 0.4

51
Table 6
Section 2 – Project Planning: Officer group ANOVA
______________________________________________________________________________________________________
Note. No statistically significant findings were discovered between the groups.
Question Number LTs CPTs WO1s Chiefs
1 3.1 3.0 2.7 3.0 Anova: Single Factor Anova: Single Factor
2 3.4 2.8 2.6 3.1 SUMMARY SUMMARY
6 2.8 3.0 2.6 2.8 Groups Count Sum Average Variance Groups Count Sum Average Variance
8 3.6 3.1 3.4 3.2 WO1 24 62.475 2.6031 0.12891 LTs 24 67.7756 2.824 0.24907
9 2.1 2.0 2.3 2.0 Chiefs 24 68.3636 2.8485 0.14834 CPTs 24 63.4459 2.6436 0.15187
10 2.8 2.8 2.8 3.3 ANOVA ANOVA
13 3.3 2.9 3.3 3.2 Source of Variation SS df MS F P-value F crit Source of Variation SS df MS F P-value F crit
14 2.9 2.5 2.7 3.1 Between Groups 0.722 1 0.7224 5.21131 0.027 4.052 Between Groups 0.391 1 0.3906 1.9482 0.1695 4.0517
15 3.4 2.7 3.1 3.4 Within Groups 6.377 46 0.1386 Within Groups 9.222 46 0.2005
16 3.3 3.2 3.1 3.4 Total 7.099 47 Total 9.612 47
17 2.3 2.5 2.3 2.8
21 2.4 2.8 2.5 2.8 Anova: Single Factor Anova: Single Factor
22 2.5 2.3 2.3 2.5 SUMMARY SUMMARY
24 2.5 2.3 2.1 3.1 Groups Count Sum Average Variance Groups Count Sum Average Variance
25 2.4 2.7 2.8 2.8 LTs 24 67.7756 2.824 0.24907 CPTs 24 63.4459 2.6436 0.15187
3 2.9 3.0 2.6 2.9 WO1s 24 62.475 2.6031 0.12891 WO1s 24 62.475 2.6031 0.12891
4 3.3 2.9 2.8 2.8 ANOVA ANOVA
5 3.6 2.5 2.5 2.4 Source of Variation SS df MS F P-value F crit Source of Variation SS df MS F P-value F crit
7 2.8 2.5 2.6 2.6 Between Groups 0.585 1 0.5853 3.09728 0.085 4.052 Between Groups 0.02 1 0.0196 0.13988 0.7101 4.0517
11 3.2 3.2 2.9 3.3 Within Groups 8.693 46 0.189 Within Groups 6.458 46 0.1404
12 2.0 1.7 2.3 2.1 Total 9.279 47 Total 6.478 47
18 2.4 2.1 2.1 2.5
19 2.3 2.7 2.3 2.6 Anova: Single Factor Anova: Single Factor
23 2.5 2.3 2.2 2.6 SUMMARY SUMMARY
Groups Count Sum Average Variance Groups Count Sum Average Variance
LTs 24 67.7756 2.824 0.24907 CPTs 24 63.4459 2.6436 0.15187
Chiefs 24 68.3636 2.8485 0.14834 Chiefs 24 68.3636 2.8485 0.14834
ANOVA ANOVA
Source of Variation SS df MS F P-value F crit Source of Variation SS df MS F P-value F crit
Between Groups 0.007 1 0.0072 0.03625 0.85 4.052 Between Groups 0.504 1 0.5038 3.35651 0.0734 4.0517
Within Groups 9.14 46 0.1987 Within Groups 6.905 46 0.1501
Total 9.148 47 Total 7.409 47LTs
Chiefs
CPTs
WO1s
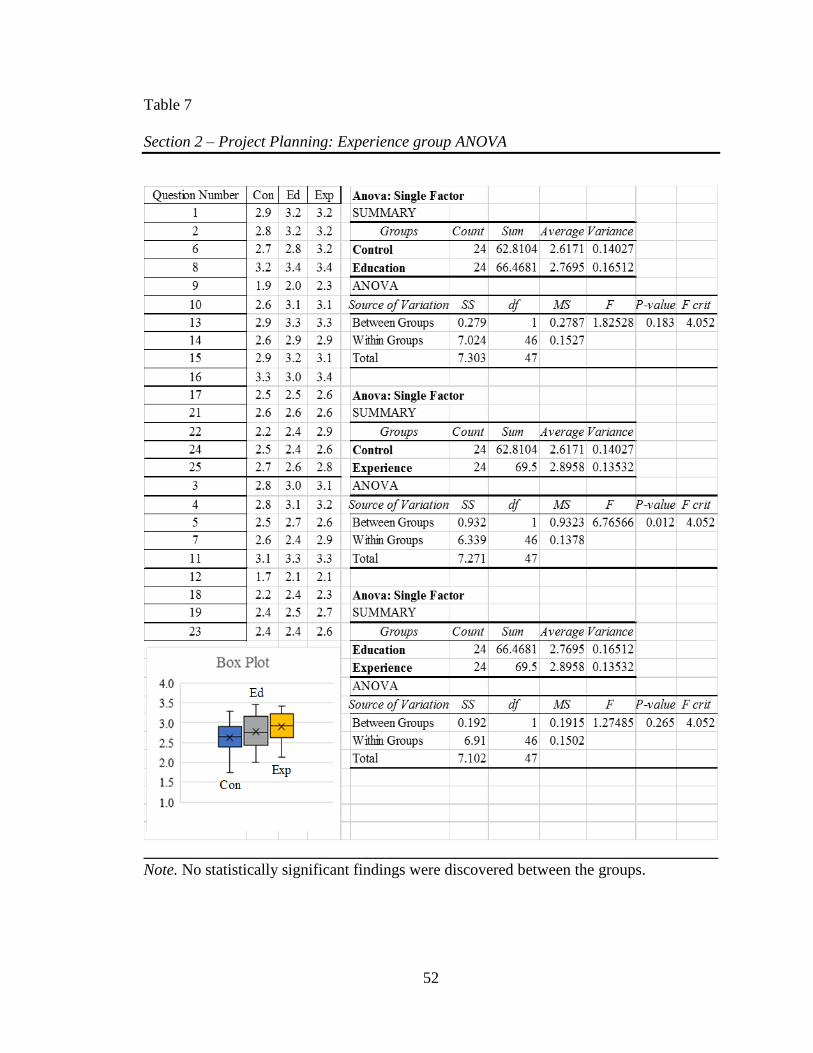
52
Table 7
Section 2 – Project Planning: Experience group ANOVA
________________________________________________________________________
Note. No statistically significant findings were discovered between the groups.

53
Section 3 – Project Execution Issues Results
Table 8
Survey Section 3: Statements by group
Resource Issues
26. The scope of a project change significantly during execution.
27. The design of a project changed significantly during execution.
31. Critical personnel or resource bottle necks occur that delay the project.
33. Issues don’t become apparent until it’s too late.
35. Assigned resources have to be moved to “more pressing needs”.
37. Work assignments change significantly during the course of a project.
44. People try to look busy when they really are not.
46. Extra working, polishing, tinkering, or perfecting often goes beyond what is
necessary.
47. People are reassigned to other tasks – or removed from the project if project leaders
underutilize or don’t keep them busy at all times
48. The same project execution issues plague every project and are never addressed.
Scheduling Issues
28. The scheduling of project tasks changed significantly during execution.
29. The scheduling of project completion changed significantly during execution.
30. There are frustrations or disagreements about the priority of tasks during execution.
32. Work expands to fill scheduled time available.
34. Procrastination or waiting until a task has become urgent before starting occurs.
36. People work on non-priority tasks while waiting for priority tasks to start.
38. When faced with time constraints, corners are cut and compromises made.
39. The project often faces non-scheduled events or tasks from outside the project that
threaten completion times.
40. Project work is “hurry up and wait”.
41. Progress tracking is inaccurate due to inefficient measures or tools.
42. Progress tracking is inaccurate due to inefficient communication or lack of
understanding between teams or individuals.
43. Multitasking, or jumping form one task to another, is needed to complete the project
on time.
45. Project estimates become “self-fulfilling prophesies”.
________________________________________________________________________
Note. There is one written answer for Section 3. It is from a CPT that circled a 5 for
Statement 39, but wrote in a number 10 next to it and then circled it.

54
Table 9
Section 3 – Project Execution: Average answers across officer groups
________________________________________________________________________
Project Execution Issues - LTs
Resource Issues Scheduling Issues
Question Number> 26 27 31 33 35 37 44 46 47 48 28 29 30 32 34 36 38 39 40 41 42 43 45
Number of Respondents 34 34 34 34 34 34 34 33 34 34 34 34 34 34 34 34 34 34 34 33 34 34 34
Average 3.6 3.7 3.4 3.1 3.0 2.9 2.6 2.2 2.6 2.7 3.2 3.4 3.1 2.9 2.7 2.4 3.3 3.3 2.4 2.5 2.8 2.9 2.6
Standard Deviation 1.3 1.1 1.2 1.2 1.3 1.2 1.2 1.2 1.3 1.3 1.1 1.1 1.2 1.4 1.1 1.2 1.1 1.0 0.9 1.0 1.1 1.1 1.3
Section Average 3.0 Section Average 2.9
Standard Deviation 0.5 Standard Deviation 0.3
Project Execution Issues - CPTs
Resource Issues Scheduling Issues
Question Number> 26 27 31 33 35 37 44 46 47 48 28 29 30 32 34 36 38 39 40 41 42 43 45
Number of Respondents 47 47 47 47 47 47 46 47 47 47 47 47 47 47 47 47 47 47 47 47 47 47 47
Average 3.3 3.0 3.3 3.0 3.0 2.6 2.8 2.4 2.9 2.6 3.0 3.1 2.6 2.7 2.8 2.1 2.9 3.5 2.7 2.8 2.8 3.0 2.3
Standard Deviation 1.3 1.3 1.2 1.3 1.2 1.2 1.3 1.2 1.3 1.3 1.3 1.4 1.2 1.2 1.2 1.1 1.3 1.3 1.2 1.2 1.1 1.3 1.2
Section Average 2.9 Section Average 2.8
Standard Deviation 0.3 Standard Deviation 0.3
Project Execution Issues - WO1s
Resource Issues Scheduling Issues
Question Number> 26 27 31 33 35 37 44 46 47 48 28 29 30 32 34 36 38 39 40 41 42 43 45
Number of Respondents 16 16 16 16 16 16 16 16 16 16 16 16 16 16 16 16 16 16 16 16 16 16 16
Average 3.4 3.1 3.4 2.8 2.9 2.9 2.8 2.7 2.9 2.8 3.2 3.1 3.1 2.5 3.3 2.4 3.7 2.8 3.0 2.9 3.3 3.0 2.6
Standard Deviation 1.0 1.3 1.2 1.2 1.3 1.2 1.6 1.3 1.3 1.5 1.0 1.0 1.3 1.4 1.3 1.3 1.1 1.3 1.3 1.1 1.1 0.9 1.3
Section Average 3.0 Section Average 3.0
Standard Deviation 0.3 Standard Deviation 0.4
Project Execution Issues - Chiefs
Resource Issues Scheduling Issues
Question Number> 26 27 31 33 35 37 44 46 47 48 28 29 30 32 34 36 38 39 40 41 42 43 45
Number of Respondents 22 22 22 22 22 22 22 22 22 22 22 22 22 22 22 22 22 22 22 22 22 22 22
Average 3.3 3.5 3.3 3.1 3.1 2.6 3.0 2.5 3.1 2.6 3.2 3.4 2.8 2.8 3.0 2.2 3.4 3.7 2.8 2.9 3.2 2.9 2.7
Standard Deviation 1.4 1.3 1.1 1.1 1.2 1.1 1.3 1.1 1.2 1.1 1.1 1.1 1.1 1.1 1.5 1.4 1.3 1.2 1.2 1.3 1.1 1.0 1.0
Section Average 3.0 Section Average 3.0
Standard Deviation 0.3 Standard Deviation 0.4
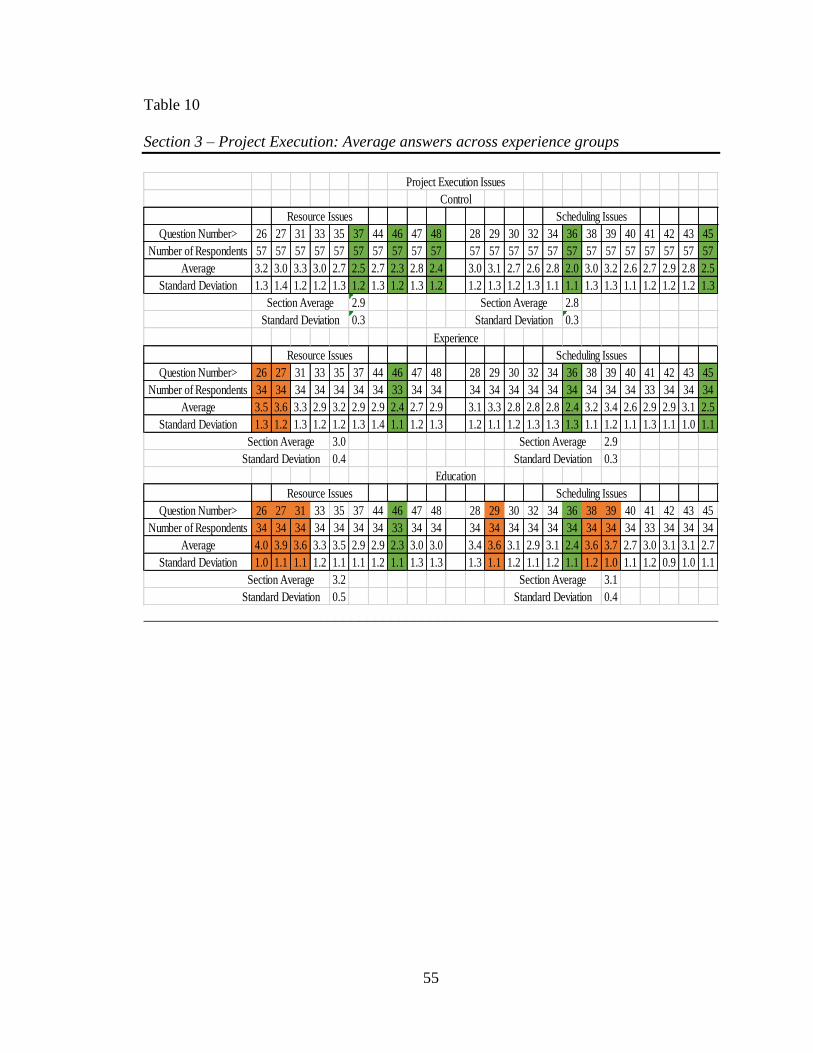
55
Table 10
Section 3 – Project Execution: Average answers across experience groups
________________________________________________________________________
Project Execution Issues
Control
Resource Issues Scheduling Issues
Question Number> 26 27 31 33 35 37 44 46 47 48 28 29 30 32 34 36 38 39 40 41 42 43 45
Number of Respondents 57 57 57 57 57 57 57 57 57 57 57 57 57 57 57 57 57 57 57 57 57 57 57
Average 3.2 3.0 3.3 3.0 2.7 2.5 2.7 2.3 2.8 2.4 3.0 3.1 2.7 2.6 2.8 2.0 3.0 3.2 2.6 2.7 2.9 2.8 2.5
Standard Deviation 1.3 1.4 1.2 1.2 1.3 1.2 1.3 1.2 1.3 1.2 1.2 1.3 1.2 1.3 1.1 1.1 1.3 1.3 1.1 1.2 1.2 1.2 1.3
Section Average 2.9 Section Average 2.8
Standard Deviation 0.3 Standard Deviation 0.3
Experience
Resource Issues Scheduling Issues
Question Number> 26 27 31 33 35 37 44 46 47 48 28 29 30 32 34 36 38 39 40 41 42 43 45
Number of Respondents 34 34 34 34 34 34 34 33 34 34 34 34 34 34 34 34 34 34 34 33 34 34 34
Average 3.5 3.6 3.3 2.9 3.2 2.9 2.9 2.4 2.7 2.9 3.1 3.3 2.8 2.8 2.8 2.4 3.2 3.4 2.6 2.9 2.9 3.1 2.5
Standard Deviation 1.3 1.2 1.3 1.2 1.2 1.3 1.4 1.1 1.2 1.3 1.2 1.1 1.2 1.3 1.3 1.3 1.1 1.2 1.1 1.3 1.1 1.0 1.1
Section Average 3.0 Section Average 2.9
Standard Deviation 0.4 Standard Deviation 0.3
Education
Resource Issues Scheduling Issues
Question Number> 26 27 31 33 35 37 44 46 47 48 28 29 30 32 34 36 38 39 40 41 42 43 45
Number of Respondents 34 34 34 34 34 34 34 33 34 34 34 34 34 34 34 34 34 34 34 33 34 34 34
Average 4.0 3.9 3.6 3.3 3.5 2.9 2.9 2.3 3.0 3.0 3.4 3.6 3.1 2.9 3.1 2.4 3.6 3.7 2.7 3.0 3.1 3.1 2.7
Standard Deviation 1.0 1.1 1.1 1.2 1.1 1.1 1.2 1.1 1.3 1.3 1.3 1.1 1.2 1.1 1.2 1.1 1.2 1.0 1.1 1.2 0.9 1.0 1.1
Section Average 3.2 Section Average 3.1
Standard Deviation 0.5 Standard Deviation 0.4
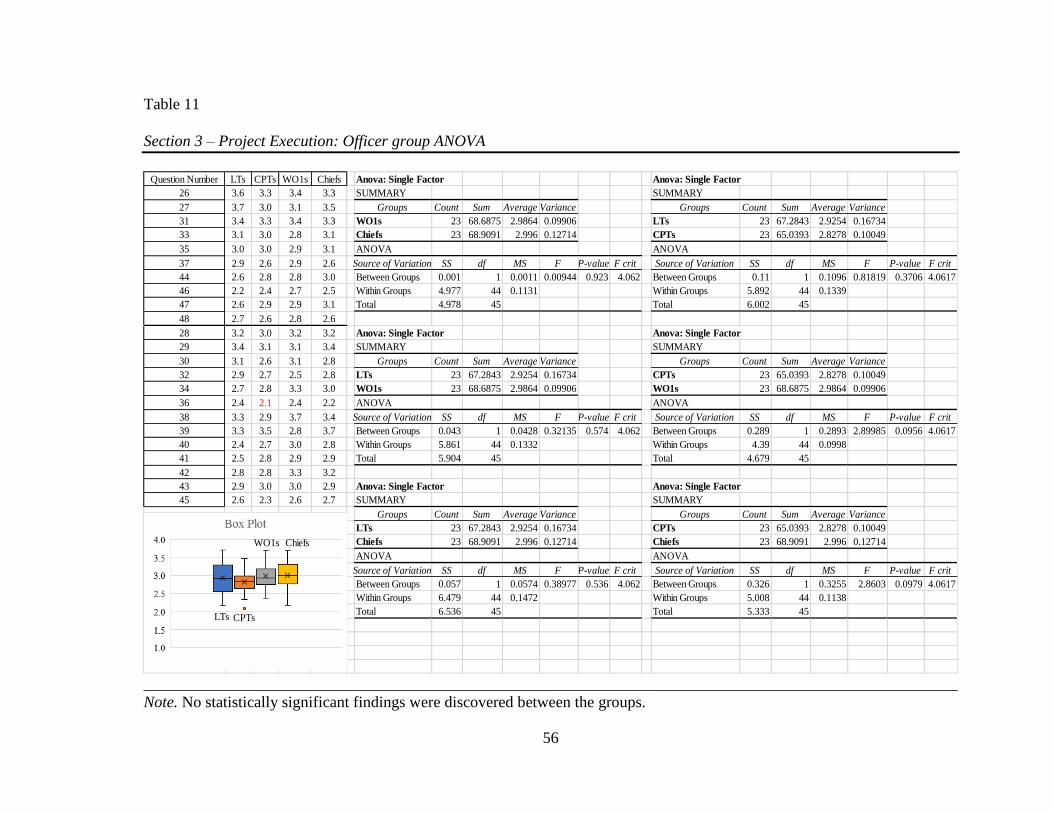
56
Table 11
Section 3 – Project Execution: Officer group ANOVA
______________________________________________________________________________________________________
Note. No statistically significant findings were discovered between the groups.
Question Number LTs CPTs WO1s Chiefs Anova: Single Factor Anova: Single Factor
26 3.6 3.3 3.4 3.3 SUMMARY SUMMARY
27 3.7 3.0 3.1 3.5 Groups Count Sum Average Variance Groups Count Sum Average Variance
31 3.4 3.3 3.4 3.3 WO1s 23 68.6875 2.9864 0.09906 LTs 23 67.2843 2.9254 0.16734
33 3.1 3.0 2.8 3.1 Chiefs 23 68.9091 2.996 0.12714 CPTs 23 65.0393 2.8278 0.10049
35 3.0 3.0 2.9 3.1 ANOVA ANOVA
37 2.9 2.6 2.9 2.6 Source of Variation SS df MS F P-value F crit Source of Variation SS df MS F P-value F crit
44 2.6 2.8 2.8 3.0 Between Groups 0.001 1 0.0011 0.00944 0.923 4.062 Between Groups 0.11 1 0.1096 0.81819 0.3706 4.0617
46 2.2 2.4 2.7 2.5 Within Groups 4.977 44 0.1131 Within Groups 5.892 44 0.1339
47 2.6 2.9 2.9 3.1 Total 4.978 45 Total 6.002 45
48 2.7 2.6 2.8 2.6
28 3.2 3.0 3.2 3.2 Anova: Single Factor Anova: Single Factor
29 3.4 3.1 3.1 3.4 SUMMARY SUMMARY
30 3.1 2.6 3.1 2.8 Groups Count Sum Average Variance Groups Count Sum Average Variance
32 2.9 2.7 2.5 2.8 LTs 23 67.2843 2.9254 0.16734 CPTs 23 65.0393 2.8278 0.10049
34 2.7 2.8 3.3 3.0 WO1s 23 68.6875 2.9864 0.09906 WO1s 23 68.6875 2.9864 0.09906
36 2.4 2.1 2.4 2.2 ANOVA ANOVA
38 3.3 2.9 3.7 3.4 Source of Variation SS df MS F P-value F crit Source of Variation SS df MS F P-value F crit
39 3.3 3.5 2.8 3.7 Between Groups 0.043 1 0.0428 0.32135 0.574 4.062 Between Groups 0.289 1 0.2893 2.89985 0.0956 4.0617
40 2.4 2.7 3.0 2.8 Within Groups 5.861 44 0.1332 Within Groups 4.39 44 0.0998
41 2.5 2.8 2.9 2.9 Total 5.904 45 Total 4.679 45
42 2.8 2.8 3.3 3.2
43 2.9 3.0 3.0 2.9 Anova: Single Factor Anova: Single Factor
45 2.6 2.3 2.6 2.7 SUMMARY SUMMARY
Groups Count Sum Average Variance Groups Count Sum Average Variance
LTs 23 67.2843 2.9254 0.16734 CPTs 23 65.0393 2.8278 0.10049
Chiefs 23 68.9091 2.996 0.12714 Chiefs 23 68.9091 2.996 0.12714
ANOVA ANOVA
Source of Variation SS df MS F P-value F crit Source of Variation SS df MS F P-value F crit
Between Groups 0.057 1 0.0574 0.38977 0.536 4.062 Between Groups 0.326 1 0.3255 2.8603 0.0979 4.0617
Within Groups 6.479 44 0.1472 Within Groups 5.008 44 0.1138
Total 6.536 45 Total 5.333 45LTs
Chiefs
CPTs
WO1s

57
Table 12
Section 3 – Project Execution: Experience group ANOVA
_______________________________________________________________________
Note. There was a statistically significant finding between the experience and control
group: F(1,44) = 11.763, p = .001
Question Number Con Ed Exp Anova: Single Factor
26 3.2 3.5 4.0 SUMMARY
27 3.0 3.6 3.9 Groups Count Sum Average Variance
31 3.3 3.3 3.6 Control 23 63.8596 2.7765 0.09329
33 3.0 2.9 3.3 Education 23 68.0486 2.9586 0.1117
35 2.7 3.2 3.5 ANOVA
37 2.5 2.9 2.9 Source of Variation SS df MS F P-value F crit
44 2.7 2.9 2.9 Between Groups 0.381 1 0.3815 3.72157 0.06 4.062
46 2.3 2.4 2.3 Within Groups 4.51 44 0.1025
47 2.8 2.7 3.0 Total 4.891 45
48 2.4 2.9 3.0
28 3.0 3.1 3.4 Anova: Single Factor
29 3.1 3.3 3.6 SUMMARY
30 2.7 2.8 3.1 Groups Count Sum Average Variance
32 2.6 2.8 2.9 Control 23 63.8596 2.7765 0.09329
34 2.8 2.8 3.1 Experience 23 72.6533 3.1588 0.19254
36 2.0 2.4 2.4 ANOVA
38 3.0 3.2 3.6 Source of Variation SS df MS F P-value F crit
39 3.2 3.4 3.7 Between Groups 1.681 1 1.681 11.7626 0.001 4.062
40 2.6 2.6 2.7 Within Groups 6.288 44 0.1429
41 2.7 2.9 3.0 Total 7.969 45
42 2.9 2.9 3.1
43 2.8 3.1 3.1 Anova: Single Factor
45 2.5 2.5 2.7 SUMMARY
Groups Count Sum Average Variance
Education 23 68.0486 2.9586 0.1117
Experience 23 72.6533 3.1588 0.19254
ANOVA
Source of Variation SS df MS F P-value F crit
Between Groups 0.461 1 0.4609 3.03014 0.089 4.062
Within Groups 6.693 44 0.1521
Total 7.154 45
Con
Exp
Ed

58
Section 4 – Project Completion Issues Results
Table 13
Survey Section 4: Statements by group
Resource Issues
52. Customers have expressed dissatisfaction with the quality of the finished product
after completion.
55. The project required more physical or virtual resources than originally estimated.
57. The project required more personnel than originally estimated.
61. Additional/outside personnel had to be brought in to finish the project on time.
Scheduling Issues
49. Original scheduled completion dates for tasks are not met.
50. Original scheduled completion date for the entire project is not met.
51. A task or task had to be abandoned before completion in order to complete the project
in a timely fashion.
53. Customers have expressed dissatisfaction with the extended length of time, over the
original completion date, that a project takes.
54. Customers wanted the original estimate of the project to be much shorter.
56. The project required more time than originally estimated.
58. Meeting scheduled early start times for project tasks was difficult.
59. Meeting scheduled late start times for project tasks was difficult.
60. Non-critical tasks – those not a part of the Critical Path – had a greater impact on
project than planned.
62. Project personnel had to work longer hours than originally scheduled in order to
complete the project on time.
63. Project personnel could not complete non-project related tasks and assignments in
order to complete the project on time.
64. Non-project related tasks and assignments negatively impacted the project’s
completion time.
________________________________________________________________________
Note. There was one written in answer for Section 4. It was from a CW2 that circled a 5
for Statement 64, but wrote the words “Mandatory Training [sic]” next to it.

59
Table 14
Section 4 – Project Completion: Average answers across officer groups
________________________________________________________________________
Project Completion Issues - LTs
Resource Issues Scheduling Issues
Question Number> 52 55 57 61 49 50 51 53 54 56 58 59 60 62 63 64
Number of Respondents 34 34 34 34 34 34 34 34 34 34 34 34 34 34 34 34
Average 2.6 3.2 3.0 2.7 3.5 3.6 3.1 2.5 2.7 3.3 2.5 2.4 2.8 3.2 2.8 3.2
Standard Deviation 1.4 1.1 1.1 1.1 1.2 1.3 1.2 1.3 1.2 1.1 1.1 1.0 1.1 1.2 1.2 1.1
Section Average 2.9 Section Average 3.0
Standard Deviation 0.3 Standard Deviation 0.4
Project Completion Issues - CPTs
Resource Issues Scheduling Issues
Question Number> 52 55 57 61 49 50 51 53 54 56 58 59 60 62 63 64
Number of Respondents 46 47 47 47 47 47 47 46 46 47 47 47 47 47 47 47
Average 2.6 3.1 3.1 2.7 3.0 3.1 2.7 2.7 2.7 3.5 2.4 2.7 2.7 2.9 2.6 2.8
Standard Deviation 1.4 1.4 1.1 1.2 1.2 1.3 1.2 1.4 1.5 1.2 1.3 1.3 1.1 1.3 1.3 1.4
Section Average 2.9 Section Average 2.8
Standard Deviation 0.3 Standard Deviation 0.3
Project Completion Issues WO1s
Resource Issues Scheduling Issues
Question Number> 52 55 57 61 49 50 51 53 54 56 58 59 60 62 63 64
Number of Respondents 15 16 16 16 16 16 16 16 16 16 16 16 16 16 16 16
Average 2.9 3.1 2.9 2.8 3.7 3.3 2.9 3.0 2.6 3.2 2.5 2.3 2.3 3.1 2.5 2.8
Standard Deviation 1.5 1.2 1.4 1.2 1.4 1.4 1.3 1.3 1.0 1.3 1.2 0.9 1.1 1.4 1.5 1.5
Section Average 2.9 Section Average 2.8
Standard Deviation 0.1 Standard Deviation 0.4
Project Completion Issues - Chiefs
Resource Issues Scheduling Issues
Question Number> 52 55 57 61 49 50 51 53 54 56 58 59 60 62 63 64
Number of Respondents 22 22 22 22 22 22 22 22 22 22 22 22 22 22 22 22
Average 2.7 3.1 3.5 2.4 3.5 3.6 3.0 3.1 2.5 3.6 2.5 2.6 3.0 3.2 2.8 3.4
Standard Deviation 1.5 1.1 1.2 1.3 1.1 1.3 1.4 1.5 1.3 1.1 0.9 1.0 1.1 1.2 1.4 1.3
Section Average 2.9 Section Average 3.1
Standard Deviation 0.5 Standard Deviation 0.4

60
Table 15
Section 4 – Project Completion: Average answers across experience groups
________________________________________________________________________
Control
Resource Issues Scheduling Issues
Question Number> 52 55 57 61 49 50 51 53 54 56 58 59 60 62 63 64
Number of Respondents 57 57 57 57 57 57 57 57 57 57 57 57 57 57 57 57
Average 2.5 3.1 3.1 2.6 3.0 3.1 2.8 2.5 2.5 3.2 2.3 2.7 2.6 2.9 2.6 2.9
Standard Deviation 1.4 1.3 1.2 1.2 1.3 1.3 1.2 1.3 1.3 1.2 1.1 1.3 1.2 1.3 1.3 1.3
Section Average 2.8 Section Average 2.8
Standard Deviation 0.3 Standard Deviation 0.3
Experience
Resource Issues Scheduling Issues
Question Number> 52 55 57 61 49 50 51 53 54 56 58 59 60 62 63 64
Number of Respondents 34 34 34 34 34 34 34 34 34 34 34 34 34 34 34 34
Average 2.6 3.2 3.0 2.6 3.8 3.6 3.1 2.9 2.7 3.4 2.6 2.3 2.8 3.2 2.7 3.1
Standard Deviation 1.4 1.1 1.2 1.1 1.1 1.3 1.3 1.4 1.3 1.1 1.2 1.1 1.1 1.3 1.4 1.4
Section Average 2.9 Section Average 3.0
Standard Deviation 0.3 Standard Deviation 0.4
Education
Resource Issues Scheduling Issues
Question Number> 52 55 57 61 49 50 51 53 54 56 58 59 60 62 63 64
Number of Respondents 34 34 34 34 34 34 34 34 34 34 34 34 34 34 34 34
Average 3.2 3.3 3.2 3.0 3.7 3.8 3.3 3.5 2.9 3.9 2.5 2.5 3.0 3.5 2.9 3.3
Standard Deviation 1.4 1.0 1.2 1.1 1.0 1.2 1.2 1.4 1.1 0.8 1.1 1.0 1.0 1.1 1.2 1.3
Section Average 3.2 Section Average 3.2
Standard Deviation 0.1 Standard Deviation 0.5

61
Table 16
Section 4 – Project Completion: Officer group ANOVA
______________________________________________________________________________________________________
Note. No statistically significant findings were discovered between the groups.
Question Number LTs CPTs WO1s Chiefs Anova: Single Factor Anova: Single Factor
52 2.6 2.6 2.9 2.7 SUMMARY SUMMARY
55 3.2 3.1 3.1 3.1 Groups Count Sum Average Variance Groups Count Sum Average Variance
57 3.0 3.1 2.9 3.5 WO1s 16 45.6833 2.8552 0.14512 LTs 16 47.2353 2.9522 0.13251
61 2.7 2.7 2.8 2.4 Chiefs 16 48.5455 3.0341 0.1646 CPTs 16 45.3201 2.8325 0.07197
49 3.5 3.0 3.7 3.5 ANOVA ANOVA
50 3.6 3.1 3.3 3.6 Source of Variation SS df MS F P-value F crit Source of Variation SS df MS F P-value F crit
51 3.1 2.7 2.9 3.0 Between Groups 0.256 1 0.256 1.65304 0.208 4.171 Between Groups 0.115 1 0.1146 1.12117 0.2981 4.1709
53 2.5 2.7 3.0 3.1 Within Groups 4.646 30 0.1549 Within Groups 3.067 30 0.1022
54 2.7 2.7 2.6 2.5 Total 4.902 31 Total 3.182 31
56 3.3 3.5 3.2 3.6
58 2.5 2.4 2.5 2.5 Anova: Single Factor Anova: Single Factor
59 2.4 2.7 2.3 2.6 SUMMARY SUMMARY
60 2.8 2.7 2.3 3.0 Groups Count Sum Average Variance Groups Count Sum Average Variance
62 3.2 2.9 3.1 3.2 LTs 16 47.2353 2.9522 0.13251 CPTs 16 45.3201 2.8325 0.07197
63 2.8 2.6 2.5 2.8 WO1s 16 45.6833 2.8552 0.14512 WO1s 16 45.6833 2.8552 0.14512
64 3.2 2.8 2.8 3.4 ANOVA ANOVA
Source of Variation SS df MS F P-value F crit Source of Variation SS df MS F P-value F crit
Between Groups 0.075 1 0.0753 0.54221 0.467 4.171 Between Groups 0.004 1 0.0041 0.03799 0.8468 4.1709
Within Groups 4.164 30 0.1388 Within Groups 3.256 30 0.1085
Total 4.24 31 Total 3.26 31
Anova: Single Factor Anova: Single Factor
SUMMARY SUMMARY
Groups Count Sum Average Variance Groups Count Sum Average Variance
LTs 16 47.2353 2.9522 0.13251 CPTs 16 45.3201 2.8325 0.07197
Chiefs 16 48.5455 3.0341 0.1646 Chiefs 16 48.5455 3.0341 0.1646
ANOVA ANOVA
Source of Variation SS df MS F P-value F crit Source of Variation SS df MS F P-value F crit
Between Groups 0.054 1 0.0536 0.36108 0.552 4.171 Between Groups 0.325 1 0.3251 2.74845 0.1078 4.1709
Within Groups 4.457 30 0.1486 Within Groups 3.549 30 0.1183
Total 4.51 31 Total 3.874 31
LTs
Chiefs
CPTs
WO1s

62
Table 17
Section 4 – Project Completion: Experience group ANOVA
_______________________________________________________________________
Note. There was a statistically significant finding between the experience and control
group: F(1,33) = 13.8086, p = .0008
Question Number Con Ed Exp Anova: Single Factor
52 2.5 2.6 3.2 SUMMARY
55 3.1 3.2 3.3 Groups Count Sum Average Variance
57 3.1 3.0 3.2 Control 16 44.386 2.7741 0.07066
61 2.6 2.6 3.0 Education 16 47.587 2.9742 0.16494
49 3.0 3.8 3.7 ANOVA
50 3.1 3.6 3.8 Source of Variation SS df MS F P-value F crit
51 2.8 3.1 3.3 Between Groups 0.32 1 0.3202 2.71811 0.10965 4.171
53 2.5 2.9 3.5 Within Groups 3.534 30 0.1178
54 2.5 2.7 2.9 Total 3.854 31
56 3.2 3.4 3.9
58 2.3 2.6 2.5 Anova: Single Factor
59 2.7 2.3 2.5 SUMMARY
60 2.6 2.8 3.0 Groups Count Sum Average Variance
62 2.9 3.2 3.5 Control 16 44.386 2.7741 0.07066
63 2.6 2.7 2.9 Experience 16 51.5169 3.2198 0.1595
64 2.9 3.1 3.3 ANOVA
Source of Variation SS df MS F P-value F crit
Between Groups 1.589 1 1.5891 13.8086 0.000828 4.171
Within Groups 3.452 30 0.1151
Total 5.041 31
Anova: Single Factor
SUMMARY
Groups Count Sum Average Variance
Education 16 47.587 2.9742 0.16494
Experience 16 51.5169 3.2198 0.1595
ANOVA
Source of Variation SS df MS F P-value F crit
Between Groups 0.483 1 0.4826 2.9753 0.094835 4.171
Within Groups 4.867 30 0.1622
Total 5.349 31
Con
ExpEd
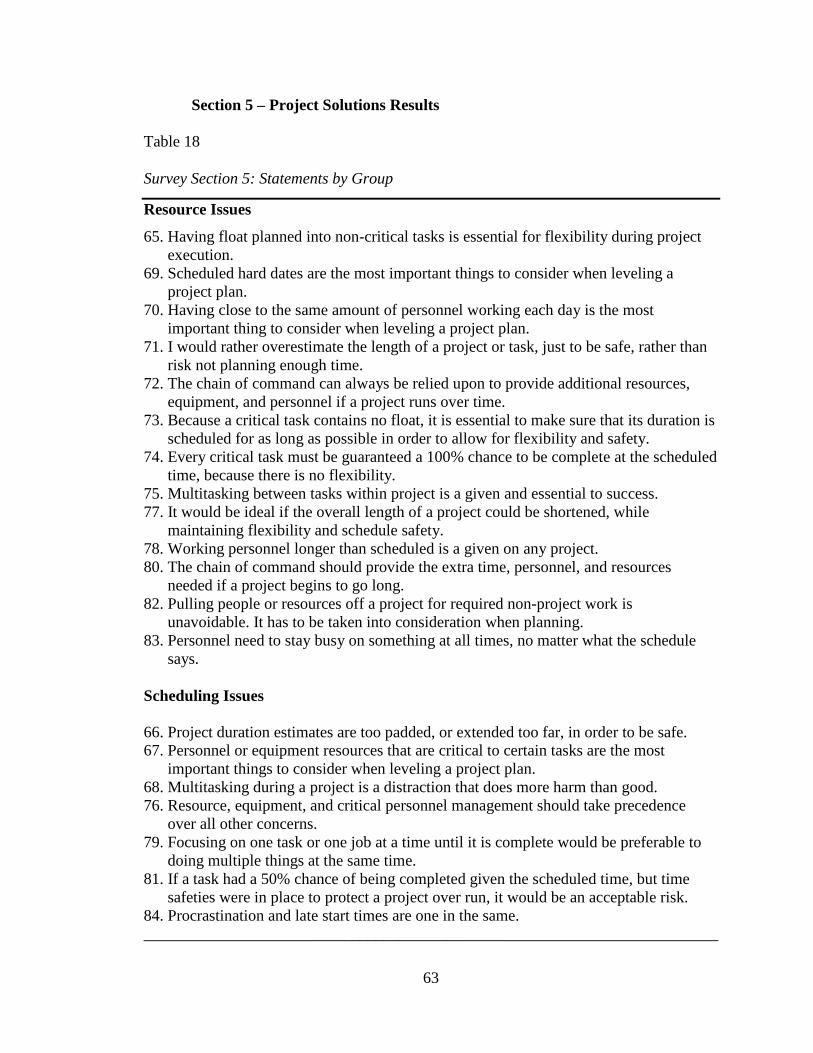
63
Section 5 – Project Solutions Results
Table 18
Survey Section 5: Statements by Group
Resource Issues
65. Having float planned into non-critical tasks is essential for flexibility during project
execution.
69. Scheduled hard dates are the most important things to consider when leveling a
project plan.
70. Having close to the same amount of personnel working each day is the most
important thing to consider when leveling a project plan.
71. I would rather overestimate the length of a project or task, just to be safe, rather than
risk not planning enough time.
72. The chain of command can always be relied upon to provide additional resources,
equipment, and personnel if a project runs over time.
73. Because a critical task contains no float, it is essential to make sure that its duration is
scheduled for as long as possible in order to allow for flexibility and safety.
74. Every critical task must be guaranteed a 100% chance to be complete at the scheduled
time, because there is no flexibility.
75. Multitasking between tasks within project is a given and essential to success.
77. It would be ideal if the overall length of a project could be shortened, while
maintaining flexibility and schedule safety.
78. Working personnel longer than scheduled is a given on any project.
80. The chain of command should provide the extra time, personnel, and resources
needed if a project begins to go long.
82. Pulling people or resources off a project for required non-project work is
unavoidable. It has to be taken into consideration when planning.
83. Personnel need to stay busy on something at all times, no matter what the schedule
says.
Scheduling Issues
66. Project duration estimates are too padded, or extended too far, in order to be safe.
67. Personnel or equipment resources that are critical to certain tasks are the most
important things to consider when leveling a project plan.
68. Multitasking during a project is a distraction that does more harm than good.
76. Resource, equipment, and critical personnel management should take precedence
over all other concerns.
79. Focusing on one task or one job at a time until it is complete would be preferable to
doing multiple things at the same time.
81. If a task had a 50% chance of being completed given the scheduled time, but time
safeties were in place to protect a project over run, it would be an acceptable risk.
84. Procrastination and late start times are one in the same.
________________________________________________________________________
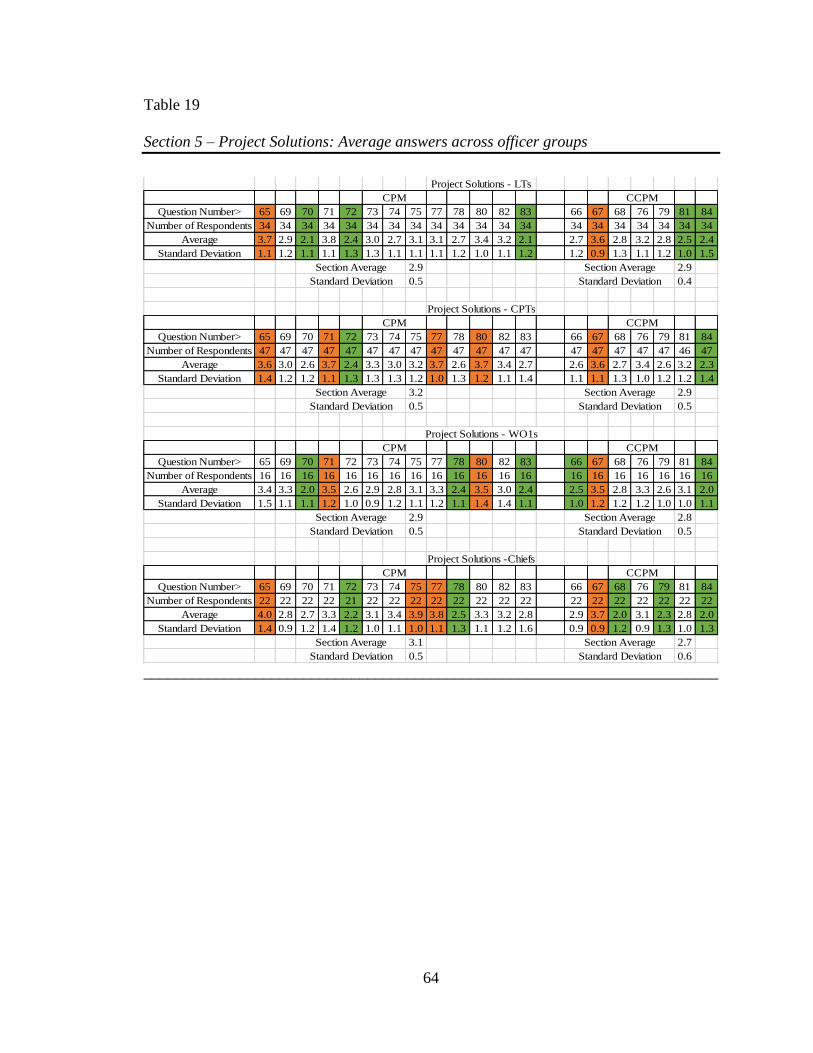
64
Table 19
Section 5 – Project Solutions: Average answers across officer groups
________________________________________________________________________
Project Solutions - LTs
CPM CCPM
Question Number> 65 69 70 71 72 73 74 75 77 78 80 82 83 66 67 68 76 79 81 84
Number of Respondents 34 34 34 34 34 34 34 34 34 34 34 34 34 34 34 34 34 34 34 34
Average 3.7 2.9 2.1 3.8 2.4 3.0 2.7 3.1 3.1 2.7 3.4 3.2 2.1 2.7 3.6 2.8 3.2 2.8 2.5 2.4
Standard Deviation 1.1 1.2 1.1 1.1 1.3 1.3 1.1 1.1 1.1 1.2 1.0 1.1 1.2 1.2 0.9 1.3 1.1 1.2 1.0 1.5
Section Average 2.9 Section Average 2.9
Standard Deviation 0.5 Standard Deviation 0.4
Project Solutions - CPTs
CPM CCPM
Question Number> 65 69 70 71 72 73 74 75 77 78 80 82 83 66 67 68 76 79 81 84
Number of Respondents 47 47 47 47 47 47 47 47 47 47 47 47 47 47 47 47 47 47 46 47
Average 3.6 3.0 2.6 3.7 2.4 3.3 3.0 3.2 3.7 2.6 3.7 3.4 2.7 2.6 3.6 2.7 3.4 2.6 3.2 2.3
Standard Deviation 1.4 1.2 1.2 1.1 1.3 1.3 1.3 1.2 1.0 1.3 1.2 1.1 1.4 1.1 1.1 1.3 1.0 1.2 1.2 1.4
Section Average 3.2 Section Average 2.9
Standard Deviation 0.5 Standard Deviation 0.5
Project Solutions - WO1s
CPM CCPM
Question Number> 65 69 70 71 72 73 74 75 77 78 80 82 83 66 67 68 76 79 81 84
Number of Respondents 16 16 16 16 16 16 16 16 16 16 16 16 16 16 16 16 16 16 16 16
Average 3.4 3.3 2.0 3.5 2.6 2.9 2.8 3.1 3.3 2.4 3.5 3.0 2.4 2.5 3.5 2.8 3.3 2.6 3.1 2.0
Standard Deviation 1.5 1.1 1.1 1.2 1.0 0.9 1.2 1.1 1.2 1.1 1.4 1.4 1.1 1.0 1.2 1.2 1.2 1.0 1.0 1.1
Section Average 2.9 Section Average 2.8
Standard Deviation 0.5 Standard Deviation 0.5
Project Solutions -Chiefs
CPM CCPM
Question Number> 65 69 70 71 72 73 74 75 77 78 80 82 83 66 67 68 76 79 81 84
Number of Respondents 22 22 22 22 21 22 22 22 22 22 22 22 22 22 22 22 22 22 22 22
Average 4.0 2.8 2.7 3.3 2.2 3.1 3.4 3.9 3.8 2.5 3.3 3.2 2.8 2.9 3.7 2.0 3.1 2.3 2.8 2.0
Standard Deviation 1.4 0.9 1.2 1.4 1.2 1.0 1.1 1.0 1.1 1.3 1.1 1.2 1.6 0.9 0.9 1.2 0.9 1.3 1.0 1.3
Section Average 3.1 Section Average 2.7
Standard Deviation 0.5 Standard Deviation 0.6
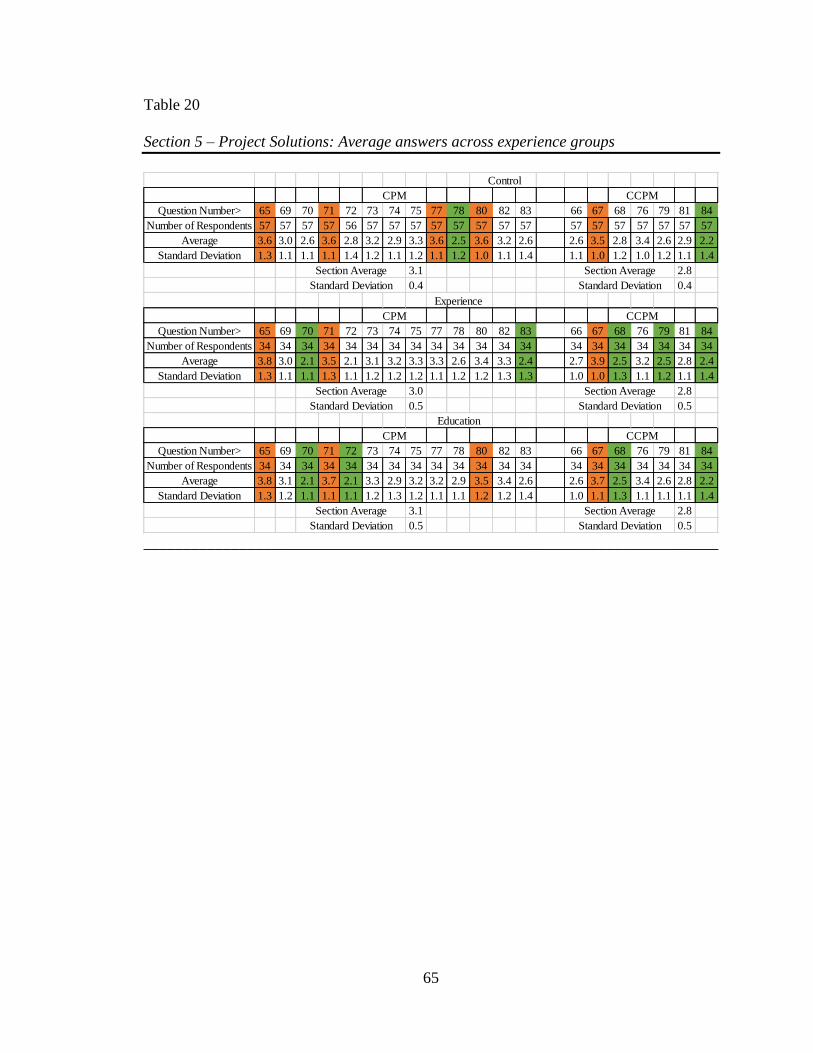
65
Table 20
Section 5 – Project Solutions: Average answers across experience groups
________________________________________________________________________
Control
CPM CCPM
Question Number> 65 69 70 71 72 73 74 75 77 78 80 82 83 66 67 68 76 79 81 84
Number of Respondents 57 57 57 57 56 57 57 57 57 57 57 57 57 57 57 57 57 57 57 57
Average 3.6 3.0 2.6 3.6 2.8 3.2 2.9 3.3 3.6 2.5 3.6 3.2 2.6 2.6 3.5 2.8 3.4 2.6 2.9 2.2
Standard Deviation 1.3 1.1 1.1 1.1 1.4 1.2 1.1 1.2 1.1 1.2 1.0 1.1 1.4 1.1 1.0 1.2 1.0 1.2 1.1 1.4
Section Average 3.1 Section Average 2.8
Standard Deviation 0.4 Standard Deviation 0.4
Experience
CPM CCPM
Question Number> 65 69 70 71 72 73 74 75 77 78 80 82 83 66 67 68 76 79 81 84
Number of Respondents 34 34 34 34 34 34 34 34 34 34 34 34 34 34 34 34 34 34 34 34
Average 3.8 3.0 2.1 3.5 2.1 3.1 3.2 3.3 3.3 2.6 3.4 3.3 2.4 2.7 3.9 2.5 3.2 2.5 2.8 2.4
Standard Deviation 1.3 1.1 1.1 1.3 1.1 1.2 1.2 1.2 1.1 1.2 1.2 1.3 1.3 1.0 1.0 1.3 1.1 1.2 1.1 1.4
Section Average 3.0 Section Average 2.8
Standard Deviation 0.5 Standard Deviation 0.5
Education
CPM CCPM
Question Number> 65 69 70 71 72 73 74 75 77 78 80 82 83 66 67 68 76 79 81 84
Number of Respondents 34 34 34 34 34 34 34 34 34 34 34 34 34 34 34 34 34 34 34 34
Average 3.8 3.1 2.1 3.7 2.1 3.3 2.9 3.2 3.2 2.9 3.5 3.4 2.6 2.6 3.7 2.5 3.4 2.6 2.8 2.2
Standard Deviation 1.3 1.2 1.1 1.1 1.1 1.2 1.3 1.2 1.1 1.1 1.2 1.2 1.4 1.0 1.1 1.3 1.1 1.1 1.1 1.4
Section Average 3.1 Section Average 2.8
Standard Deviation 0.5 Standard Deviation 0.5

66
Table 21
Section 5 – Project Solutions: Officer group ANOVA
_____________________________________________________________________________________________________
Note. No statistically significant findings were discovered between the groups.
Question Number LTs CPTs WO1s Chiefs
65 3.7 3.6 3.4 4.0 Anova: Single Factor Anova: Single Factor
69 2.9 3.0 3.3 2.8 SUMMARY SUMMARY
70 2.1 2.6 2.0 2.7 Groups Count Sum Average Variance Groups Count Sum Average Variance
71 3.8 3.7 3.5 3.3 WO1s 20 58 2.9 0.22303 LTs 20 58.3824 2.9191 0.2351
72 2.4 2.4 2.6 2.2 Chiefs 20 59.6472 2.9824 0.35265 CPTs 20 61.4075 3.0704 0.23886
73 3.0 3.3 2.9 3.1 ANOVA ANOVA
74 2.7 3.0 2.8 3.4 Source of Variation SS df MS F P-value F crit Source of Variation SS df MS F P-value F crit
75 3.1 3.2 3.1 3.9 Between Groups 0.068 1 0.0678 0.23566 0.63 4.098 Between Groups 0.229 1 0.2288 0.96542 0.332 4.0982
77 3.1 3.7 3.3 3.8 Within Groups 10.94 38 0.2878 Within Groups 9.005 38 0.237
78 2.7 2.6 2.4 2.5 Total 11.01 39 Total 9.234 39
80 3.4 3.7 3.5 3.3
82 3.2 3.4 3.0 3.2 Anova: Single Factor Anova: Single Factor
83 2.1 2.7 2.4 2.8 SUMMARY SUMMARY
66 2.7 2.6 2.5 2.9 Groups Count Sum Average Variance Groups Count Sum Average Variance
67 3.6 3.6 3.5 3.7 LTs 20 58.3824 2.9191 0.2351 CPTs 20 61.4075 3.0704 0.23886
68 2.8 2.7 2.8 2.0 WO1s 20 58 2.9 0.22303 Chiefs 20 58 2.9 0.22303
76 3.2 3.4 3.3 3.1 ANOVA ANOVA
79 2.8 2.6 2.6 2.3 Source of Variation SS df MS F P-value F crit Source of Variation SS df MS F P-value F crit
81 2.5 3.2 3.1 2.8 Between Groups 0.004 1 0.0037 0.01596 0.9 4.098 Between Groups 0.29 1 0.2903 1.2569 0.2693 4.0982
84 2.4 2.3 2.0 2.0 Within Groups 8.704 38 0.2291 Within Groups 8.776 38 0.2309
Total 8.708 39 Total 9.066 39
Anova: Single Factor Anova: Single Factor
SUMMARY SUMMARY
Groups Count Sum Average Variance Groups Count Sum Average Variance
LTs 20 58.3824 2.9191 0.2351 CPTs 20 61.4075 3.0704 0.23886
Chiefs 20 59.6472 2.9824 0.35265 Chiefs 20 59.6472 2.9824 0.35265
ANOVA ANOVA
Source of Variation SS df MS F P-value F crit Source of Variation SS df MS F P-value F crit
Between Groups 0.04 1 0.04 0.1361 0.714 4.098 Between Groups 0.077 1 0.0775 0.26193 0.6118 4.0982
Within Groups 11.17 38 0.2939 Within Groups 11.24 38 0.2958
Total 11.21 39 Total 11.32 39
LTs
Chiefs
CPTs
WO1s

67
Table 22
Section 5 – Project Solutions: Experience group ANOVA
_______________________________________________________________________
Note. There were no statistically significant findings discovered.
Question Number Con Ed Exp Anova: Single Factor
65 3.6 3.8 3.8 SUMMARY
69 3.0 3.0 3.1 Groups Count Sum Average Variance
70 2.6 2.1 2.1 Control 20 60.4342 3.0217 0.20375
71 3.6 3.5 3.7 Education 20 59.2128 2.9606 0.2773
72 2.8 2.1 2.1 ANOVA
73 3.2 3.1 3.3 Source of Variation SS df MS F P-value F crit
74 2.9 3.2 2.9 Between Groups 0.037 1 0.0373 0.15507 0.696 4.098
75 3.3 3.3 3.2 Within Groups 9.14 38 0.2405
77 3.6 3.3 3.2 Total 9.177 39
78 2.5 2.6 2.9
80 3.6 3.4 3.5 Anova: Single Factor
82 3.2 3.3 3.4 SUMMARY
83 2.6 2.4 2.6 Groups Count Sum Average Variance
66 2.6 2.7 2.6 Control 20 60.4342 3.0217 0.20375
67 3.5 3.9 3.7 Experience 20 59.7585 2.9879 0.2849
68 2.8 2.5 2.5 ANOVA
76 3.4 3.2 3.4 Source of Variation SS df MS F P-value F crit
79 2.6 2.5 2.6 Between Groups 0.011 1 0.0114 0.04672 0.83 4.098
81 2.9 2.8 2.8 Within Groups 9.284 38 0.2443
84 2.2 2.4 2.2 Total 9.296 39
Anova: Single Factor
SUMMARY
Groups Count Sum Average Variance
Education 20 59.2128 2.9606 0.2773
Experience 20 59.7585 2.9879 0.2849
ANOVA
Source of Variation SS df MS F P-value F crit
Between Groups 0.007 1 0.0074 0.02648 0.872 4.098
Within Groups 10.68 38 0.2811
Total 10.69 39
Con
ExpEd

68
Conclusion
By applying a quantitative analysis methodology of the results, the researcher was
able to answer some of the research questions put forth by the thesis. Other questions will
require further research or more in-depth examination of the data to definitively answer.
Scheduling and Resource Questions Analysis and Interpretation.
1. What are the major scheduling issues negatively impacting on-time Army
construction project completions?
2. What are the major personnel management issues in Army construction
projects?
The evidence in the analysis across the three sections indicated that among all the
officer groups, there was a large amount of disagreement as to the effectiveness of the
system. There were no statistically significant findings in Officer Group ANOVAs.
However, they did show a large degree of variance within each group. The average
answers and analysis for the experience groups showed a much greater variance,
including significant variance between experienced and non-experienced groups in the
execution and conclusion sections.
The analysis gave evidence that there are both major scheduling and major
resource issues within the current system among those with more education in project
management and experience with Army construction projects. Statements pertaining to
outside tasks causing delays and personnel issues, both in the execution and conclusion
phases of projects (Statements 31, 39, 55 and 57), had the highest negative impact scores,
especially among the more experienced. Concerns about customer satisfaction and

69
project scope changing also had a high negative impact among more experienced
personnel (Statements 26, 27, 29, 49, 50, 53, 56, and 62). These issues caused the greatest
concern with more experienced personnel. However, these issues were less of a concern
to the less experienced officers.
The analysis pointed out that there are certain scheduling and personnel issues,
during the execution and conclusion phases, among more experienced Army project
managers. These issues deal with influences outside the project distracting or taking away
personnel and causing delays. These delays then have a negative impact on timely project
completion and customer perception. Interestingly, none of the two main groups, officer
or experience, perceived extra detailing work, beautification, or busy work (Statements
32, 36, and 46) as having the same kind of negative impact. The planning phase for both
main groups also had lower negative impact scores as a whole.
In summary, Army project managers have fewer issues with planning in the
current system and more issues with outside influence negatively impacting their project
schedules and resources during execution and conclusion. Conversely, there is less of a
perceived impact for busy work and beautification on the schedule and resource
allocation. The following provides additional detailed analysis and interpretation of each
survey section in support of the conclusions above.
Section 2. For officer group responses (Table 4), percentage wise, most
respondents indicated fewer issues with schedule planning. Statements 12 and 18 were
low across all ranks. Interestingly, Statement 5 was low across CPTs, WO1s, and Chiefs,
but high with 1LTs. In the resource issue section, Statements 9 and 22 were also lower on
average across all ranks. Statements 17 and 24 also had lower than average responses
70
among 1LTs, CPTs, and WO1s. Statements 5 and 8 in the 1LT group were the only ones
above the mean. Statement 5 deals with priority of tasks and 8 deals with assuming a
project is smaller than it is. Statement 8 scored above the mean across all groups, though
it was not originally labeled an outlier. This indicated that participants had some issue in
planning project scope. Statement 5 impact may be due to 1LTs limited relative
experience.
Overall, responses were average to slightly below average in both sub groups of
the planning section. The lowest overall totals belonging to the CPTs and WO1a with
Chiefs scoring closest to the mean. The ANOVA showed similar results (Table 6). No
single group deviated far from an average answer of 3 for the overall section. Chiefs were
closest to the mean, with 1LTs right behind. The ANOVA showed there is very little
deviation between the group’s answers and no statistically significant findings between
groups. However, both the ANOVA and the Box Plot diagram for the section showed that
there is a large degree of variance within the 1LTs compared to the other groups. 1LTs
also had the largest group of answers above the section mean compared to the other
groups. The data analysis indicated a degree of disagreement among the most junior
officers about what is effective in project planning.
A similar situation was found in the analysis of the education and experience
groups (Table 5). Overall scores were slightly below the mean. The ANOVA for the
section (Table 7) did show there is both a degree of internal variance as well as some
cross variance between those with less education and experience and those with higher.
Even though both experience and education groups were at or below the mean on

71
average, having more experience seems to have indicated less agreement with the
planning status quo.
The one written response placed next to Statement 16 by a CPT may indicate this
disagreement. They circled 5, but wrote “actually 15 [sic]” next to the statement.
Statement 16 deals with rules and procedures holding projects back. It scored above the
mean across all groups, which indicated there is perception that current rules and
procedures in the planning phase do more harm than good.
Analysis of the groups officer and experience, indicated there is, on average, slightly
fewer issues among officers on the status quo when it comes to project planning
effectiveness. This was especially true among officers with less education and
experience. However, there was a large degree of variance among all the groups. This
indicated that there are those that strongly agree the system works and those that may
believe the system needs improvement.
Section 3. In the Section 3 Officer group responses (Table 9), average answers
were closer to the mean. Unlike the previous section, there were fewer statements that
each group agreed had little to no impact. Statement 36 in the scheduling issues section
was the only exception. There were more statements in this section than in the first
section that respondents felt had a more severe negative impact, though lower scores
were more prominent.
The ANOVA showed similar results (Table 11). No single group deviated very
far from an average answer for the overall section. The ANOVA showed little deviation
between the group’s answers and no statistically significant findings between the groups.
Similar to the last section, both the ANOVA and the Box Plot diagram for the section

72
showed that 1LTs had the largest degree of internal variance, followed again by the
Chiefs. CPTs, had the overall tightest group with one extreme outlier on the low end for
Statement 36. This statement was about access to historical data and planning projects,
which the majority respondents seemed to agree was not an issue.
The average answers for the experience groups varied from the officer groups in
Section 3 (Table 10). Those with less education and experience in project management
stayed close to or slightly below the mean. However, those with project management
education had average scores just above the mean. There were also more statements in
both sections that scored high, rather than low. The ANOVA supported this analysis
(Table 12). There remained a high internal variance within groups and a widening
variance between those without experience and education, and those with. There was a
statistically significant variance between the less experienced (control) and experienced
group F(1,44) = 11.763, p = .001.
There was also one write in answer for Section 3. It was from a CPT that circled a
5 for Statement 39, but wrote in a number 10 next to it and circled it. Statement 39 is
about non-scheduled events cutting into completion times. It scored above the mean for
all groups except WO1s. This written response indicated that there were concerns with
this issue during project completion.
An analysis of all groups indicated that there is still wide disagreement among
officers when it comes to the effectiveness of project execution with the current methods.
However, the analysis indicated there is a greater dissatisfaction among those officers
with more project management education and experience.

73
Section 4. Officer group responses (Table 16) answers were again close to the
mean. However, aside from lower scores for Statement 58, indicating it had a low
perceived impact on project completion, there is less agreement and more variance across
the group. The ANOVA of the group (Table 14) shed more light on this issue. The
average answers stayed close to the mean and there remained little variance between
groups. However, variance within groups was extremely high, indicating there was a
wide level of disagreement among officers as to the effectiveness of the current system
during project completion.
The answer for this may be found in experience group for Section 4 (Table 14).
Those with less education and experience remained more amiable to the current system.
However, those officers with more education and experience, especially the education
section, seemed more discontent with the effectiveness of the closing projects with the
current system. There was also one write in answer for Section 4. It came from a CW2
that circled a five for Statement 64, but wrote next to it the words “Mandatory Training”
[sic]. Statement 64 is about outside issues having a negative impact on project
completion. The average score for this statement for Chiefs and those with education and
experience was above the mean, indicating it was an issue for many in those groups.
This analysis continued in the experience group ANOVA as well (Table 17). Intergroup
variance continued to widen in this section. There was more agreement among those with
less experience and education compared to those with, and their answers were mostly
below the mean. However, those with more education and experience disagreed among
themselves on the effectiveness of the current system.
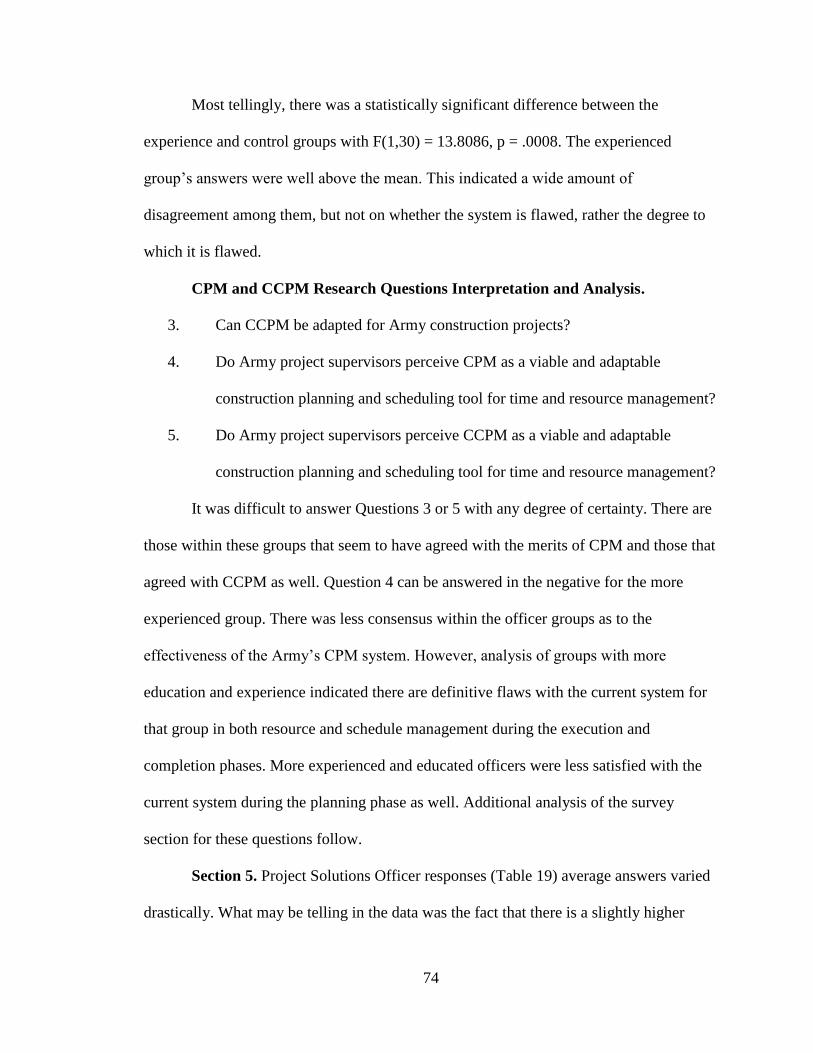
74
Most tellingly, there was a statistically significant difference between the
experience and control groups with F(1,30) = 13.8086, p = .0008. The experienced
group’s answers were well above the mean. This indicated a wide amount of
disagreement among them, but not on whether the system is flawed, rather the degree to
which it is flawed.
CPM and CCPM Research Questions Interpretation and Analysis.
3. Can CCPM be adapted for Army construction projects?
4. Do Army project supervisors perceive CPM as a viable and adaptable
construction planning and scheduling tool for time and resource management?
5. Do Army project supervisors perceive CCPM as a viable and adaptable
construction planning and scheduling tool for time and resource management?
It was difficult to answer Questions 3 or 5 with any degree of certainty. There are
those within these groups that seem to have agreed with the merits of CPM and those that
agreed with CCPM as well. Question 4 can be answered in the negative for the more
experienced group. There was less consensus within the officer groups as to the
effectiveness of the Army’s CPM system. However, analysis of groups with more
education and experience indicated there are definitive flaws with the current system for
that group in both resource and schedule management during the execution and
completion phases. More experienced and educated officers were less satisfied with the
current system during the planning phase as well. Additional analysis of the survey
section for these questions follow.
Section 5. Project Solutions Officer responses (Table 19) average answers varied
drastically. What may be telling in the data was the fact that there is a slightly higher

75
average agreement for CPM solutions than there is for CCPM solutions to project
management issues. On the CCPM side there is a positive response for Statement 67,
which indicated that officers generally support the idea that resources should be of the
upmost consideration when leveling a schedule on a project plan. Conversely, there was
also agreement with Statement 84, indicating that procrastination was less of an issue.
The ANOVA of the officers group (Table 21), showed much the same data as Table 19.
There was a wide degree of intra-variance across each group, showing little consensus
among the various officer types on what CPM or CCPM solutions would be most ideal.
The data analysis from the experience groups also showed a high degree of variance and
disagreement (Table 20). Again Statements 67 and 84 showed the same degree of
agreement and disagreement. On the CPM side, there are three statements that had above
average agreement. As with the officer group data, the scores for CPM solutions were at,
or just above, the mean with CCPM scoring just below.
The ANOVA of the experience group tells a similar story (Table 21). Means were
nearly identical across the board. There was also a large degree of variance within the
groups themselves, indicating again that there was little consensus as to the effectiveness
of CPM or CCPM solutions.
Research Questions on Age and Experience differences.
6. Are the responses of younger, less experienced Officers different from older,
more experienced Officers?
This question was answered affirmatively with the ANOVA of the experience and
education groups. Yes, the more educated and experience officers had a more negative
view of the current system’s effectiveness in both the execution and completion phases.
76
More experienced and educated officers were less satisfied with the current system
during the planning phase as well. However, there was less consensus across the groups
when it came to the viability of CCPM as an alternative.
Tying the Analysis Back to the Review of Literature
The original focus of this study was two-fold. First, the study identified major
issues that exist with the current construction project planning and management methods
used by the U.S. Army Corps of Engineers. These resource and schedule planning issues
and short falls where discussed at length in the Review of Literature. Limitations in the
current method for identifying the proper way to level resources across a project,
managing extra time and float, over padding of schedules for safety, and issues regaining
lost time were all identified.
The average statement response results and ANOVA comparisons of the officer
and experience groups revealed that there were issues among the more experienced
project planners during the execution and completion phase of a project. The greatest
issues arose when it came to outside influence interfering with project completion. There
was less concern, across all groups and sections, but especially during planning, with
issues of extra busy work not on the critical path. These results give weight to the notion
that there is disassociation between extra time padding and float planned into a project
and the impact it has during execution and conclusion. Army project managers may
perceive greater negative impact coming from outside the project, in the form of other
work their personnel may have to do, rather than the way they are scheduled and leveled
within the project itself. This disconnect in planning and resource management is
congruent with Leach’s (2014) assessment of government based “do more better”

77
approaches to projects (p. 37) and lack of scrutiny of the negative impacts of the current
project planning systems. Army project supervisors may perceive that their current
system of planning is sound, but the project execution and conclusion are hampered by
outside forces. It may also demonstrate that officers planning projects have issues with
the distractions of multitasking with tasks outside a project. However, multitasking
within the project was perceived to be less of an issue.
What was not adequately demonstrated with the research, was the perceived
effectiveness of CCPM as an alternative to Army CPM. The Review of Literature
discussed the benefits CCPM could provide Army construction project managers.
However, surveying Army construction project managers revealed there was less
knowledge about CCPM as a management and planning tool and the benefits it could
provide. Statements on CCPM contained in the survey met with varied responses and a
positive or negative perception could not be ascertained with the given analysis of data.
These unresolved issues mean that there are several excellent opportunities for research
on this subject going forward.
Suggestions for Future Research
The research conducted in this study was able to identify several issues that
project managers of Army construction projects face. It was also able to demonstrate that
more experienced officers perceive the issues to be of greater consequence to successful
project completion than their less experienced counterparts. However, the issue of the
effectiveness of CCPM as viable and adaptable alternative for Army construction projects
could not be ascertained with the results of this survey. This may be due to the fact that
CCPM solution statements were limited and generic. Future research on this subject
78
should be more targeted to identify specific issues, unique to Army Corps of Engineer
construction projects, and how CCPM could be adapted to fix them. Many respondents to
the survey had little knowledge of CCPM as a project management method. There were
also many verbal solicitations from survey participants at MSCOE inquired as to the
nature of TOC and CCPM. Still others indicated their belief that the current system is
fine, but only when used properly. The final hand written response, submitted by a 1LT at
the end of their survey, speaks to this issue:
“As a KO (Contracting Officer) I find CPM to be useful, but only if taken
seriously. Most of the time the government estimate or A&E don’t take the appropriate
time. Neither on or before award do we completely evaluate the appropriate CP.” [sic]
Further research could more thoroughly examine the propensity of the Army
Corps of Engineer’s “do more better” approach to planning. There must also be reasons
for the disconnect with officers who plan extra time and order extra work in a project and
the minimal perceived impact it has on timely completion compared to outside
influences. Discovering those reasons would shed light on planning issues not covered by
this study. Another option for further research may be to identify what parts of CPM
Army project managers feel are still effective when managers use them properly and
what can be done to make more planners do so. Before another CCPM analysis is done
on Army Officers, it would be more effective to make sure they are all educated on the
benefits that CCPM can provide over CPM. Perhaps the best method of research would
be to draw up construction project plans, one using Army CPM and one using a new
Army specific CCPM tool set. It may then be possible to better gauge project managers
perceived effectiveness of CPM against the exact CCPM solution for the same issue.

79
Appendix A: The Survey Instrument
A Leading American University with International Reach
Department of Architectural and Manufacturing Sciences
Date: February 7th, 2017
Dear Participant,
I am a graduate student and ROTC cadet at Western Kentucky University,
Bowling Green, in the Architectural and Manufacturing Sciences Department. I am doing
research on analyzing scheduling and resource management issues that negatively impact
Army Engineering construction projects, as well as examining the feasibility of Critical
Chain Project Management (CCPM) concepts to address those issues.
The purpose of this study is to identify the major issues that Army Engineer
project supervisors face, and gauge perceptions on the effectiveness of both traditional
and CCPM project management solutions to common problems.
Your participation in this study is completely voluntary and confidential. The
survey takes approximately 20 minutes to complete. Your responses will be combined
with other responses and analyzed to find the perceived severity of common project
management issues as well as the effectives of the given solutions to those issues. A copy
of the research will be available upon request.
If you have any questions regarding the survey, or this thesis research, please
contact Cadet Eric Rohr ([email protected] / 262-719-3874) or the Thesis
Chair Dr. Mark Doggett ([email protected] / 270-745-6951). Your participation in
this research is greatly appreciated.
Sincerely,
Cadet Eric Rohr
WKU ROTC Hilltopper Battalion
Mark Doggett, PhD
Western Kentucky University
1906 College Heights Blvd.
Bowling Green, KY, 42101

80
Section 1 – Demographics and Knowledge Base
The purpose of the section is for demographic and project management experience
information only. All responses will be kept confidential.
Please circle one answer in each of the following:
Your Service Component:
Active Duty National Guard Army Reserves
Your Rank:
2LT 1LT CPT MAJ LTC WO1 CW2 CW3 CW4
CW5
Years of Military Experience:
0-3 3-5 5-7 7-9 9-11 11-13 13-15 15+
How many Corps of Engineer construction projects have you been involved with
where you have been in the role of Project Manager or Project Supervisor?
None 1 2 3 4 5 6 7 8 9 10+
How many Corps of Engineer construction projects have you been involved with (as an
Officer or Enlisted Soldier) where you have been in a supporting role such as: crew
leader, crew member, safety supervisor, equipment operator, or as an outside
consultant, SME, or supporting advisor?
None 1 2 3 4 5 6 7 8 9 10+
How many years of civilian construction experience do you have outside the Corps of
Engineers?
None 0-3 3-5 5-7 7-9 9-11 11-13 13-15 15+
Please circle all that apply:
On a scale of 1 to 5 (1 having little experience and 5 being very experienced) which of
the following production and project management methods do you have experience
with?
Six
Sigma
Lean
Production
Theory of
Constraints
(TOC)
Earned
Value
Management
(EVM)
Critical
Chain
Project
Management
(CCPM)
Critical
Path
Method
(CPM)
1 2 3 4 5 1 2 3 4 5 1 2 3 4 5 1 2 3 4 5 1 2 3 4 5 1 2 3 4 5

81
Section 2 – Project Planning Issues
The purpose of this section is to gauge the severity of common resource and time
scheduling issues that occur during project planning. Think back on a project or
projects you have worked on and assign and assign a score to each statement based on
what occurred during that project.
-1 means that statement or event had little or no impact on a project, 5 means it had a
severe negative impact.
Please circle one number for each of the following:
1. The scope of a project changed significantly during planning. 1 2 3 4 5
2. The design of a project changed significantly during planning. 1 2 3 4 5
3. The scheduling of project tasks changed significantly during
planning.
1 2 3 4 5
4. The scheduling of project completion changed significantly
during planning.
1 2 3 4 5
5. There are frustrations or disagreements about the priority of
tasks during planning.
1 2 3 4 5
6. Too many tasks are assigned to too few people. 1 2 3 4 5
7. Tasks are poorly prioritized. 1 2 3 4 5
8. Planners assume the job is smaller than it really is. 1 2 3 4 5
9. Planners assume the job is larger than it really is. 1 2 3 4 5
10. Available resources are not used effectively. 1 2 3 4 5
11. Project schedules are too optimistic – not enough scheduled
time.
1 2 3 4 5
12. Project schedules are too pessimistic – too much time
scheduled.
1 2 3 4 5
13. There is a lack of communication between project planners. 1 2 3 4 5
14. There is a shortage of people needed to complete a schedule
on time.
1 2 3 4 5
15. There is a shortage of equipment needed to complete a
schedule on time.
1 2 3 4 5
16. Rules, procedures, or policies hold the project back rather
than help.
1 2 3 4 5
17. It is difficult to plan things that have not been done before. 1 2 3 4 5
18. Project time estimates are padded or extended to be safe. 1 2 3 4 5
19. Project workload is either “feast or famine”. There is no
steady day-to-day work load throughout the project.
1 2 3 4 5
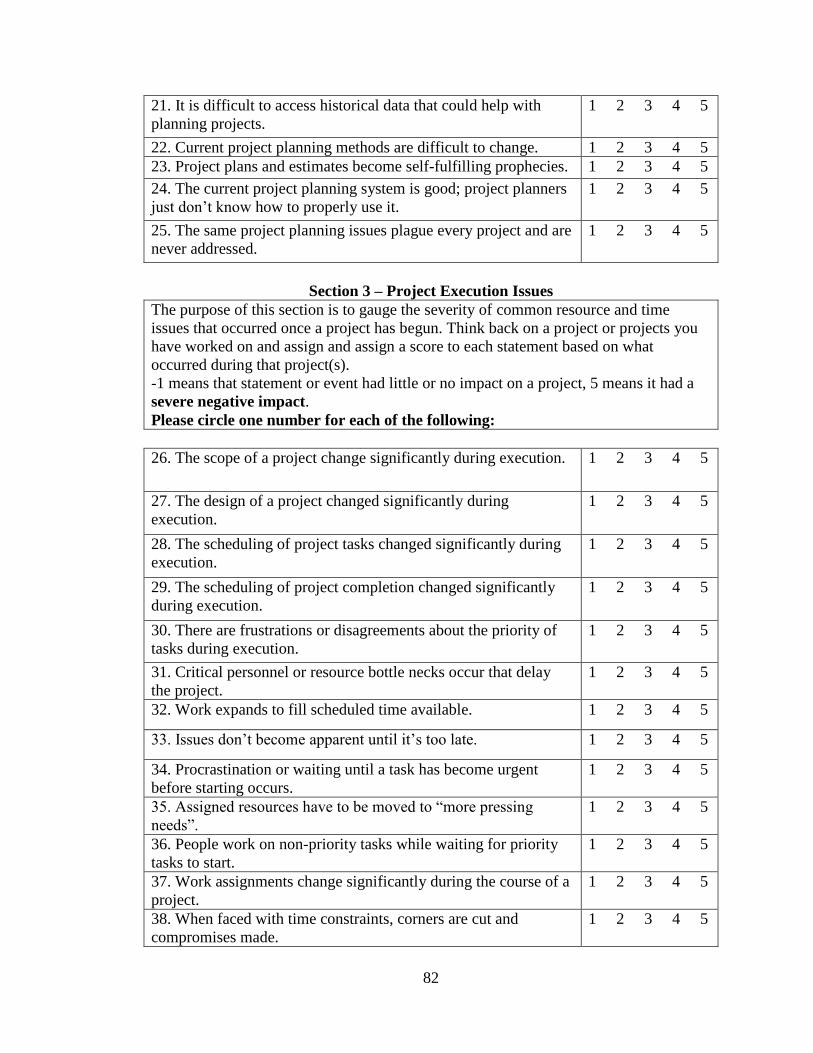
82
21. It is difficult to access historical data that could help with
planning projects.
1 2 3 4 5
22. Current project planning methods are difficult to change. 1 2 3 4 5
23. Project plans and estimates become self-fulfilling prophecies. 1 2 3 4 5
24. The current project planning system is good; project planners
just don’t know how to properly use it.
1 2 3 4 5
25. The same project planning issues plague every project and are
never addressed.
1 2 3 4 5
Section 3 – Project Execution Issues
The purpose of this section is to gauge the severity of common resource and time
issues that occurred once a project has begun. Think back on a project or projects you
have worked on and assign and assign a score to each statement based on what
occurred during that project(s).
-1 means that statement or event had little or no impact on a project, 5 means it had a
severe negative impact.
Please circle one number for each of the following:
26. The scope of a project change significantly during execution. 1 2 3 4 5
27. The design of a project changed significantly during
execution.
1 2 3 4 5
28. The scheduling of project tasks changed significantly during
execution.
1 2 3 4 5
29. The scheduling of project completion changed significantly
during execution.
1 2 3 4 5
30. There are frustrations or disagreements about the priority of
tasks during execution.
1 2 3 4 5
31. Critical personnel or resource bottle necks occur that delay
the project.
1 2 3 4 5
32. Work expands to fill scheduled time available. 1 2 3 4 5
33. Issues don’t become apparent until it’s too late. 1 2 3 4 5
34. Procrastination or waiting until a task has become urgent
before starting occurs.
1 2 3 4 5
35. Assigned resources have to be moved to “more pressing
needs”.
1 2 3 4 5
36. People work on non-priority tasks while waiting for priority
tasks to start.
1 2 3 4 5
37. Work assignments change significantly during the course of a
project.
1 2 3 4 5
38. When faced with time constraints, corners are cut and
compromises made.
1 2 3 4 5

83
39. The project often faces non-scheduled events or tasks from
outside the project that threaten completion times.
1 2 3 4 5
40. Project work is “hurry up and wait”. 1 2 3 4 5
41. Progress tracking is inaccurate due to inefficient measures or
tools.
1 2 3 4 5
42. Progress tracking is inaccurate due to inefficient
communication or lack of understanding between teams or
individuals.
1 2 3 4 5
43. Multitasking, or jumping form one task to another, is needed
to complete the project on time.
1 2 3 4 5
44. People try to look busy when they really are not. 1 2 3 4 5
45. Project estimates become “self-fulfilling prophesies”. 1 2 3 4 5
46. Extra working, polishing, tinkering, or perfecting often goes
beyond what is necessary.
1 2 3 4 5
47. People are reassigned to other tasks – or removed from the
project if project leaders underutilize or don’t keep them busy at
all times
1 2 3 4 5
48. The same project execution issues plague every project and
are never addressed.
1 2 3 4 5
Section 4 – Project Completion Issues
The purpose of this section is to gauge the severity of common resource and time
issues that occurred once a project is near completion or has completed. Think back on
a project or projects you have worked on and assign and assign a score to each
statement based on what occurred during that project(s).
-1 means that statement or event had little or no impact on a project, 5 means it had a
severe negative impact.
Please circle one number for each of the following:
49. Original scheduled completion dates for tasks are not met. 1 2 3 4 5
50. Original scheduled completion date for the entire project is
not met.
1 2 3 4 5
51. A task or task had to be abandoned before completion in order
to complete the project in a timely fashion.
1 2 3 4 5
52. Customers have expressed dissatisfaction with the quality of
the finished product after completion.
1 2 3 4 5
53. Customers have expressed dissatisfaction with the extended
length of time, over the original completion date, that a project
takes.
1 2 3 4 5
54. Customers wanted the original estimate of the project to be
much shorter.
1 2 3 4 5
55. The project required more physical or virtual resources than
originally estimated.
1 2 3 4 5
56. The project required more time than originally estimated. 1 2 3 4 5

84
57. The project required more personnel than originally
estimated.
1 2 3 4 5
58. Meeting scheduled early start times for project tasks was
difficult.
1 2 3 4 5
59. Meeting scheduled late start times for project tasks was
difficult.
1 2 3 4 5
60. Non-critical tasks – those not a part of the Critical Path – had
a greater impact on project than planned.
1 2 3 4 5
61. Additional/outside personnel had to be brought in to finish the
project on time.
1 2 3 4 5
62. Project personnel had to work longer hours than originally
scheduled in order to complete the project on time.
1 2 3 4 5
63. Project personnel could not complete non-project related tasks
and assignments in order to complete the project on time.
1 2 3 4 5
64. Non-project related tasks and assignments negatively
impacted the project’s completion time.
1 2 3 4 5
Section 5 – Project Solutions
The purpose of this section is to gauge the effectiveness of common resource and time
planning and execution solutions offered by the current Critical Path system and the
Critical Chain based system. Each statement represents a positive attitude toward CPM
or CCPM based ideas. The statements are intermixed and placed at random. –
- 1 means that you strongly disagree with the statement, 5 means you strongly agree
with the statement.
Please circle one number for each of the following:
65. Having float planned into non-critical tasks is essential for flexibility
during project execution.
1 2 3 4 5
66. Project duration estimates are too padded, or extended too far, in
order to be safe.
1 2 3 4 5
67. Personnel or equipment resources that at critical to certain tasks are
the most important things to consider when leveling a project plan.
1 2 3 4 5
68. Multitasking during a project is a distraction that does more harm
than good.
1 2 3 4 5
69. Scheduled hard dates are the most important things to consider when
leveling a project plan.
1 2 3 4 5
70. Having close to the same amount of personnel working each day is
the most important thing to consider when leveling a project plan.
1 2 3 4 5
71. I would rather overestimate the length of a project or task, just to be
safe, rather than risk not planning enough time.
1 2 3 4 5
72. The chain of command can always be relied upon to provide
additional resources, equipment, and personnel if a project runs over
time.
1 2 3 4 5
73. Because a critical task contains no float, it is essential to make sure
that its duration is scheduled for as long as possible in order to allow for
flexibility and safety.
1 2 3 4 5

85
74. Every critical task must be guaranteed a 100% chance to be
complete at the scheduled time, because there is no flexibility.
1 2 3 4 5
75. Multitasking between tasks within project is a given and essential to
success.
1 2 3 4 5
76. Resource, equipment, and critical personnel management should
take precedence over all other concerns.
1 2 3 4 5
77. It would be ideal if the overall length of a project could be
shortened, while maintaining flexibility and schedule safety.
1 2 3 4 5
78. Working personnel longer than scheduled is a given on any project. 1 2 3 4 5
79. Focusing on one task or one job at a time until it is complete would
be preferable to doing multiple things at the same time.
1 2 3 4 5
80. The chain of command should provide the extra time, personnel, and
resources needed if a project begins to go long.
1 2 3 4 5
81. If a task had a 50% chance of being completed given the scheduled
time, but time safeties were in place to protect a project over run, it
would be an acceptable risk.
1 2 3 4 5
82. Pulling people or resources off a project for required non-project
work is unavoidable. It has to be taken into consideration when
planning.
1 2 3 4 5
83. Personnel need to stay busy on something at all times, no matter
what the schedule says.
1 2 3 4 5
84. Procrastination and late start times are one in the same. 1 2 3 4 5
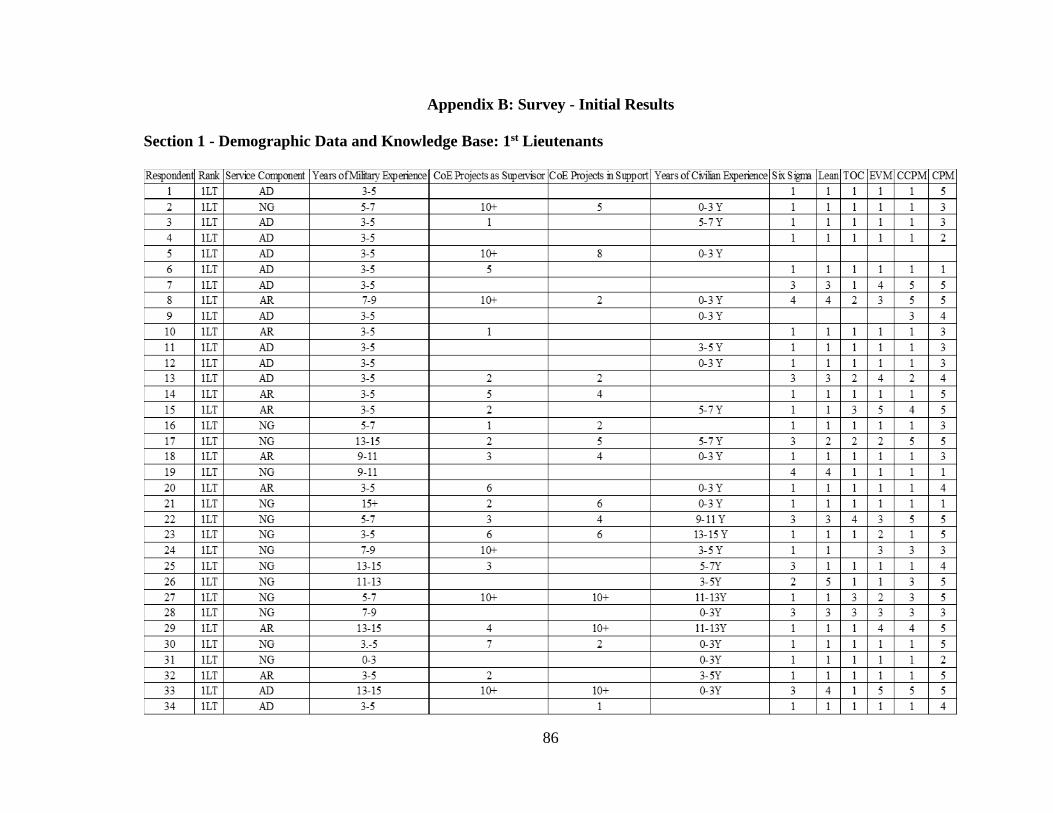
86
Appendix B: Survey - Initial Results
Section 1 - Demographic Data and Knowledge Base: 1st Lieutenants

87
Section 1 - Demographic Data and Knowledge Base: Captains
Respondent Rank Service Component Years of Military Experience CoE Projects as Supervisor CoE Projects in Support Years of Civilian Experience Six Sigma Lean TOC EVM CCPM CPM
35 CPT AD 3-5 4 1 1 1 1 1 1 3
36 CPT AD 9-11 7 10+ 0-3 Y 2 2 1 3 1 5
37 CPT AD 3-5 6 0-3 Y 1 1 1 1 1 1
38 CPT AD 3-5 1 1 1 1 2 2
39 CPT AD 11-13 1 1 1 1 1 1
40 CPT AD 3-5 1 1 1 1 1 1 1 3
41 CPT 5-7 2 1 1 1 1 1 3
42 CPT AR 5-7 1 1 1 1 1 1
43 CPT AD 3-5 5 3 3 1 2 1 5
44 CPT AD 5-7 0-3 Y 1 1 2 2 5 5
45 CPT AD 5-7 0-3 Y 3 3 1 2 1 4
46 CPT AD 3-5 2 2
47 CPT AD 3-5 5 2
48 CPT USMC 7-9 0-3 Y 1 1 1 1 1 3
49 CPT AD 3-5 5 2 2 1 2 1 3
50 CPT AD 3-5 3 1 1 1 1 1 3
51 CPT AD 5-7 1 1 1 1 1 1 1
52 CPT AD 3-5 1 1 1 1 1 1
53 CPT AD 15+ 2 1
54 CPT AD 7-9 9-11 Y 2 1 1 1 1 1
55 CPT AD 3-5 2 1 1 1 1 1 1
56 CPT AD 3-5 1 1 1 1 1 2
57 CPT AD 3-5 2 0-3 Y 3 5
58 CPT AD 5-7 3 3 0-3 Y 1 1 1 1 1 3
59 CPT AD 5-7 1 1 1 1 1 3
60 CPT AD 5-7 1 1 1 1 1 1
61 CPT AD 3-5 0-3 Y 1 1 1 1 1 3
62 CPT AD 5-7 6 4 0-3 Y 3 3 3
63 CPT AD 3-5 4 0-3 Y 1 1 1 1 1 4
64 CPT AD 7-9 0-3 Y 1 1 1 1 1 5
65 CPT AD 5-7 1 1 1 2 1 4
66 CPT AD 3-5 0-3 Y 3 1 1 1 2 2
67 CPT NG 15+ 1 1 1 1 1 1
68 CPT NG 7-9 4 4 7-9 Y 3 3 3 5 5 5
69 CPT AR 13-15 3 3 2 2 1 3 3 3
70 CPT AR 7-9 8 15+ 1 1 1 1 1 1
71 CPT AR 11-13 10+ 10+ 5-7 Y 4 4 3 1 1 5
72 CPT NG 15+ 10+ 6 0-3 Y 1 1 1 1 1 1
73 CPT AR 13-15 3-5 Y 1 1 1 1 1 4
74 CPT NG 11-13 0-3 Y 1 1 1 1 1 1
75 CPT AR 5-7 3-5 Y 1 1 1 1 1 3
76 CPT AR 5-7 3 2 2 2 2 2 2
77 CPT NG 15+ 10+ 10+ 11-13Y 2 1 1 1 2 5
78 CPT 9-11 3 0-3Y 2 2 4 4 3 5
79 CPT NG 9-11 7 3 1 1 1 1 1
80 CPT AR 9-11 4 4 0-3Y 1 1 1 1 1 1
81 CPT AD 3-5 2 0-3Y 1 1 1 1 2 5

88
Section 1 - Demographic Data and Knowledge Base: Warrant Officer Level Ones
Respondent Rank Service Component Years of Military Experience CoE Projects as Supervisor CoE Projects in Support Years of Civilian Experience Six Sigma Lean TOC EVM CCPM CPM
82 WO1 AD 13-15 NA 10+ 11-13Y 1 1 1 1 1 1
83 WO1 NG 9-11 1 NA 15+ 4 4 5
84 WO1 AD 11-13 6 9 NA 1 2 2 2 1 5
85 WO1 AD 11-13 5 5 NA
86 WO1 NG 15+ NA NA 7-9Y 1 1 1 1 1 1
87 WO1 AD 11-13 8 10+ 0-3Y 1 1 1 1 1 5
88 WO1 NG 5-7 NA 6 15+ 1 1 1 1 1 1
89 WO1 AR 15+ 4 10+ 0-3Y 3 3 1 1 1 4
90 WO1 AR 7-9 NA NA 5-7Y 3 4 4 4 4 4
91 WO1 AR 7-9 3 11-13Y 4 3 1 1 1 1
92 WO1 NG 11-13 3 4 3-5Y 1 1 1 1 1 2
93 WO1 AD 13-15 5 5 7-9Y 1 2 4 4 4 4
94 WO1 AD 11-13 4 3 NA 1 1 1 1 1 4
95 WO1 NG 13-15 NA 4 15+ 1 2
96 WO1 AR 7-9 3 10+ 3-5Y 4 3 2 3 2 5
97 WO1 NG 15+ 7 10+ 0-3 5

89
Section 1 - Demographic Data and Knowledge Base: Chief Warrant Officers
Respondent Rank Service Component Years of Military Experience CoE Projects as Supervisor CoE Projects in Support Years of Civilian Experience Six Sigma Lean TOC EVM CCPM CPM
98 CW2 NG 15+ 10+ 10+ 9-11Y 1 1 1 3 3 5
99 CW2 AD 15+ 10+ 10+ NA 2 2 1 3 1 5
100 CW2 NG 15+ 2 6 15+ 1 3 1 2 2 3
101 CW2 NG 15+ 10+ 10+ 15+ 5 5
102 CW2 NG 15+ NA 4 15+ 5 5
103 CW2 NG 15+ 10+ 10+ 15+ 1 1 1 1 1 4
104 CW2 AR 15+ 3 NA 9-11Y 3 2 1 1 1 3
105 CW2 NG 15+ 10+ 1 15+ 1 1 1 2 1 4
106 CW2 AD 15+ 10+ 10+ 5-7Y 2 1 1 3 1 4
107 CW2 NG 15+ 10+ 10+ 15+ 1 1 1 1 1 5
108 CW2 AR 15+ 10+ 10+ 11-13Y 1 1 1 2 1 5
109 CW2 AD 13-15 NA 5 0-3Y 1 1 1 1 1 4
110 CW2 AD 15+ 2 5 NA 2 3 2 2 2 3
111 CW2 AD 13-15 NA 3 0-3Y 1 1 1 4 5 5
112 CW2 NG 15+ 1 2 13-15Y 1 1 1 1 1 3
113 CW2 AD 11-13 10+ 10+ 0-3Y 1 1 1 2 2 4
114 CW2 AD 15+ 3 5 15+ 3 1 1 2 2 4
115 CW2 AR 15+ NA 10+ 0-3Y 1 1 1 1 1 3
116 CW2 AD 15+ 10+ 10+ NA 4
117 CW2 NG 15+ 10+ 10+ 9-11Y 3 2 1 3 1 4
118 CW3 AR 15+ NA NA 15+ 2
119 CW3 AD 15+ 10+ 10+ 5-7Y 2 2 2 1 1 5

90
Section 2 - Project Planning Issues: 1st Lieutenants
Resource Issues Scheduling Issues
Question Number> 1 2 6 8 9 10 13 14 15 16 17 21 22 24 25 3 4 5 7 11 12 18 19 23
Respondent Rank
1 1LT 2 5 3 3 1 2 2 3 4 3 2 1 1 2 2 4 4 3 3 3 1 1 2 1
2 1LT 4 5 4 4 2 3 2 2 4 5 2 3 2 4 3 4 2 2 2 2 4 4 5 4
3 1LT 2 2 1 1 1 1 1 1 1 2 1 1 1 1 1 1 2 1 1 1 2 2 1 1
4 1LT 1 4 1 2 3 1 5 2 4 2 1 3 1 1 1 2 1 1 2 2 1 1 1 1
5 1LT 3 3 5 5 1 3 3 4 4 3 2 2 3 3 5 4 5 4 4 4 1 1 2 2
6 1LT 5 4 3 4 3 4 3 4 2 4 3 1 4 3 4 3 4 3 3 2 4 4 2 4
7 1LT 3 4 2 4 4 5 4 2 5 5 1 4 4 4 3 3 3 3 4 2 3 2 2 3
8 1LT 4 5 4 5 1 2 3 3 5 3 2 2 2 1 2 3 3 4 3 2 2 2 1 2
9 1LT 4 4 2 2 5 2 3 2 2 1 1 2 4 4 3 3 4 2 2 2 2 3 3 4
10 1LT 4 4 3 4 3 4 3 4 5 4 2 2 3 4 2 3 3 3 4 4 2 2 2 3
11 1LT 4 3 2 4 2 5 2 4 4 4 3 5 4 3 2 3 5 3 4 4 2 3 1 5
12 1LT 2 2 2 4 1 1 1 1 1 4 2 1 1 1 4 3 2 2 1 4 1 3 2 1
13 1LT 3 3 2 5 2 3 4 3 3 4 5 4 2 4 4 4 4 4 3 4 2 4 2 2
14 1LT 3 2 2 4 2 3 3 1 2 3 1 5 2 4 2 1 1 1 1 4 2 3 1 1
15 1LT 3 3 3 4 2 3 3 3 4 4 3 3 3 2 1 3 3 3 3 2 4 1 3 2
16 1LT 1 2 2 1 2 3 4 2 3 3 2 1 1 1 1 4 5 2 5 2 4 4 3 1
17 1LT 5 4 5 5 2 3 5 4 1 4 4 2 4 4 4 5 5 5 3 5 1 4 2 4
18 1LT 3 3 3 3 3 4 4 3 4 4 2 2 2 3 4 2 3 4 2 4 3 2 3 3
19 1LT 4 4 4 4 1 4 4 3 4 4 2 2 3 2 2 3 4 3 3 4 2 2 3 2
20 1LT 3 3 1 5 1 2 5 1 4 1 1 1 1 3 1 1 3 4 5 4 1 3 1 1
21 1LT 2 3 1 3 4 3 4 3 4 1 1 1 2 1 1 2 2 1 1 4 2 2 3 3
22 1LT 4 3 3 4 2 2 3 3 3 3 5 2 2 2 2 3 4 3 3 2 2 2 3 3
23 1LT 3 3 3 4 2 4 4 4 5 3 3 4 2 2 3 3 3 4 2 4 2 3 2 4
24 1LT 2 4 1 3 3 2 3 3 5 5 2 1 1 1 1 3 4 3 1 3 1 1 1 1
25 1LT 2 3 4 5 3 4 5 4 4 5 3 3 3 3 3 3 2 4 5 4 4 3 3 3
26 1LT 2 2 3 2 1 2 2 2 2 2 2 2 2 1 1 2 2 2 3 2 1 2 3 1
27 1LT 3 5 2 1 1 3 4 4 2 3 1 1 5 2 4 4 5 2 2 2 1 3 2 2
28 1LT 3 4 4 4 2 4 4 4 4 4 3 3 3 5 4 2 3 3 4 4 2 1 2 2
29 1LT 2 3 4 4 3 4 3 3 3 3 3 2 3 2 2 3 3 4 3 2 2 2 3 3
30 1LT 5 3 3 4 1 1 5 5 5 5 2 4 2 1 1 3 4 2 1 4 1 1 1 1
31 1LT 4 3 2 3 2 2 3 2 3 3 3 2 3 3 2 2 3 1 2 4 2 2 2 2
32 1LT 3 4 5 5 1 2 3 4 4 4 3 3 2 1 2 5 4 3 4 5 1 2 3 4
33 1LT 5 2 1 4 1 2 3 5 3 2 2 2 2 2 2 2 4 1 1 5 2 1 3 5
34 1LT 4 3 4 4 2 3 3 2 4 3 4 3 4 4 3 3 3 3 4 4 2 4 4 3
Number of Respondents 34 34 34 34 34 34 34 34 34 34 34 34 34 34 34 34 34 34 34 34 34 34 34 34
Question Average 3.1 3.4 2.8 3.6 2.1 2.8 3.3 2.9 3.4 3.3 2.3 2.4 2.5 2.5 2.4 2.9 3.3 3.6 2.8 3.2 2.0 2.4 2.3 2.5
Standard Deviation 1.1 0.9 1.1 1.2 1.0 1.1 1.1 1.1 1.2 1.1 1.1 1.2 1.1 1.2 1.2 1.0 1.1 1.2 1.3 1.1 1.0 1.0 1.0 1.3
Section Average 2.9 Section Average 2.8
Standard Deviation 0.5 Standard Deviation 0.5
-10
40
90
140
-3 -2 -1 0 1 2 3 4 5 6 7 8
Section Distribution
-10
10
30
50
70
90
-3 -2 -1 0 1 2 3 4 5 6 7 8
Section Distribution

91
Section 2 - Project Planning Issues: Captains
Resource Issues Scheduling Issues
Question Number> 1 2 6 8 9 10 13 14 15 16 17 21 22 24 25 3 4 5 7 11 12 18 19 23
Respondent Rank
35 CPT 3 2 2 4 2 2 2 2 2 5 2 5 3 3 3 5 5 3 2 3 2 4 4 2
36 CPT 4 4 5 5 2 5 5 4 5 3 5 4 3 3 4 5 5 3 3 5 2 2 4 3
37 CPT 1 1 1 1 1 1 1 1 1 1 4 3 2 1 1 1 1 1 1 1 1 2 1 2
38 CPT 3 3 3 3 2 2 2 3 4 2 2 3 2 2 3 2 2 2 3 3 2 2 3 3
39 CPT 1 1 1 3 3 3 5 5 4 4 5 3 3 3 5 1 1 1 3 3 3 4 4 3
40 CPT 1 2 2 3 2 2 1 1 1 1 1 1 2 1 1 1 3 1 1 2 3 3 1 2
41 CPT 2 2 4 3 1 1 2 4 3 1 1 3 1 1 1 3 2 4 1 1 1 3 1 2
42 CPT 5 5 2 4 2 3 4 2 2 4 3 3 2 3 3 2 3 3 2 2 2 2 3 4
43 CPT 5 3 1 4 1 1 2 5 3 3 4 3 2 2 1 2 2 1 1 3 1 2 1 1
44 CPT 3 4 4 2 2 4 1 3 3 5 5 1 3 1 1 5 4 2 4 2 1 2 3 1
45 CPT 2 1 4 3 1 3 2 3 3 3 3 2 2 3 3 1 1 2 4 4 1 1 2 3
46 CPT 4 2 1 4 1 4 3 2 3 2 1 2 2 2 1 3 5 2 2 3 2 1 4 3
47 CPT 3 3 4 3 2 1 2 2 3 3 3 2 1 2 3 4 4 2 2 2 1 2 1 1
48 CPT 4 4 2 3 1 2 4 2 5 4 1 4 2 1 1 4 3 3 2 3 3 1 2 1
49 CPT 4 5 2 4 1 3 5 2 2 3 3 1 1 1 4 2 1 2 2 4 3 1 2 2
50 CPT 4 2 4 3 1 1 4 2 2 2 2 2 2 2 2 2 2 3 1 3 1 1 1 2
51 CPT 4 4 2 2 2 2 3 2 2 5 2 4 2 2 4 3 4 4 2 3 1 4 5 2
52 CPT 3 2 4 4 2 3 4 4 4 2 3 3 4 2 3 3 3 2 3 4 1 3 3 2
53 CPT 1 1 2 1 3 1 1 1 1 2 1 2 3 4 2 1 1 1 1 2 1 2 1 3
54 CPT 3 1 5 5 5 3 4 2 4 5 5 5 1 3 1 2 3 5 3 5 1 1 1 3
55 CPT 3 3 1 2 1 3 1 1 1 1 1 1 1 1 1 4 5 1 1 5 1 1 1 1
56 CPT 3 2 4 2 3 2 3 3 3 3 2 3 2 2 3 3 3 2 3 2 2 1 2 3
57 CPT 1 2 1 4 2 5 1 2 2 5 5 3 1 3 3 5 4 2 1 1 1 3 3 3
58 CPT 1 1 2 3 1 3 2 1 2 1 1 3 1 1 2 1 1 2 2 3 1 1 2 1
59 CPT 3 3 4 3 3 4 3 4 4 3 3 3 3 3 3 3 3 4 4 3 3 3 3 3
60 CPT 4 4 4 3 3 2 2 4 4 2 1 1 2 1 3 4 3 3 4 4 1 1 2 1
61 CPT 2 1 2 3 2 2 2 2 3 3 5 3 3 2 3 3 2 4 2 3 1 3 2 2
62 CPT 3 3 1 2 2 2 2 1 2 5 2 4 4 2 2 3 2 1 1 4 4 1 4 3
63 CPT 1 2 1 4 1 3 1 1 4 4 4 2 3 4 2 1 2 1 1 2 1 2 3 2
64 CPT 5 5 5 5 1 5 5 4 3 5 4 2 4 3 4 4 1 3 2 4 2 5 5 4
65 CPT 5 5 5 5 1 3 5 2 2 5 2 5 3 5 5 5 5 5 3 5 1 2 3 3
66 CPT 4 3 5 5 1 3 5 2 3 4 1 5 4 3 1 5 2 4 3 5 2 1 3 3
67 CPT 4 5 5 3 3 2 5 5 5 2 3 3 3 4 4 4 4 3 3 4 2 3 3 3
68 CPT 5 4 4 3 2 4 4 3 3 3 2 2 4 3 3 3 2 2 3 3 3 2 3 2
69 CPT 1 2 2 1 1 1 2 1 1 1 1 1 1 1 1 2 2 1 1 1 1 1 1 1
70 CPT 3 4 4 2 2 5 5 2 2 5 1 2 1 1 5 5 5 4 5 5 1 1 2 5
71 CPT 4 2 4 4 2 5 4 4 2 5 2 3 4 1 5 2 2 5 4 5 2 4 5 1
72 CPT 3 2 2 3 3 2 3 2 2 1 2 1 2 2 2 1 3 2 1 2 3 2 2 1
73 CPT 4 3 4 2 4 3 4 4 2 4 2 3 2 4 3 3 2 2 2 3 3 4 3 3
74 CPT 3 2 2 3 1 3 3 3 3 3 2 3 3 3 3 2 3 3 2 2 2 3
75 CPT 4 4 2 3 3 3 1 1 2 3 3 5 3 1 1 4 2 2 3 4 1 2 5 2
76 CPT 3 3 5 1 1 5 5 1 5 5 1 5 5 5 5 3 5 1 5 5 1 1 5 1
77 CPT 5 5 4 2 2 2 3 2 2 4 3 1 1 1 1 3 5 3 3 4 2 3 5 3
78 CPT 2 3 4 3 3 4 4 3 4 4 4 4 3 3 3 3 2 2 3 4 2 3 2 4
79 CPT 5 5 5 2 3 3 2 2 2 5 2 3 2 5 5 5 5 5 5 1 1 2 2 2
80 CPT 1 1 2 5 1 4 2 3 3 1 1 1 1 1 3 3 3 1 4 5 1 1 4 1
81 CPT 1 1 3 4 3 2 2 1 1 2 3 2 1 2 2 2 2 2 3 2 1 2 2 2
Number of Respondents 47 47 47 47 47 47 47 47 47 47 47 47 47 46 46 47 47 47 47 47 47 47 47 47
Average 3.0 2.8 3.0 3.1 2.0 2.8 2.9 2.5 2.7 3.2 2.5 2.8 2.3 2.3 2.7 3.0 2.9 2.5 2.5 3.2 1.7 2.1 2.7 2.3
Standard Deviation 1.4 1.3 1.4 1.1 1.0 1.2 1.4 1.2 1.2 1.4 1.3 1.3 1.1 1.2 1.4 1.3 1.3 1.2 1.2 1.3 0.8 1.1 1.3 1
Section Average 2.7 Section Average 2.5
Standard Deviation 0.3 Standard Deviation 0.5
-10
40
90
140
190
-3 -2 -1 0 1 2 3 4 5 6 7 8
Section Distribution
-10
40
90
140
-3 -2 -1 0 1 2 3 4 5 6 7 8
Section Distribution

92
Section 2 - Project Planning Issues: Warrant Officer Level Ones
Resource Issues Scheduling Issues
Question Number> 1 2 6 8 9 10 13 14 15 16 17 21 22 24 25 3 4 5 7 11 12 18 19 23
Respondent Rank
82 WO1 1 1 1 1 1 5 3 3 4 5 1 5 5 5 5 1 1 2 3 1 1 1 3 1
83 WO1 2 2 4 4 4 5 5 5 5 3 3 2 3 2 4 2 3 2 4 5 2 4 3 4
84 WO1 2 2 3 3 3 2 2 3 3 2 3 3 3 2 3 2 2 3 2 2 3 3 3 3
85 WO1 2 3 2 4 1 2 5 3 5 4 1 4 4 1 3 2 4 4 4 4 1 1 4 1
86 WO1 3 2 3 4 1 1 3 2 1 4 2 3 1 4 1 3 3 1 1 2 2 1 1 1
87 WO1 4 2 4 4 4 4 3 2 2 3 3 3 2 2 4 4 4 4 3 3 3 2 3 2
88 WO1 3 4 2 4 3 1 4 1 1 3 2 1 2 3 4 2 3 2 2 1 2 3
89 WO1 4 3 2 3 2 2 2 2 2 4 3 2 1 1 1 2 2 3 1 4 1 2 1 1
90 WO1 2 2 2 4 2 3 3 3 3 4 3 2 3 3 4 2 2 1 3 2 4 4 3 2
91 WO1 2 3 4 4 2 2 3 4 4 3 4 2 2 3 4 3 3 2 4 4 3 2 2 3
92 WO1 3 3 2 3 3 3 3 3 3 2 2 3 2 1 3 2 2 2 2 2 2 2 2 2
93 WO1 3 2 2 2 2 2 2 2 2 2 2 2 2 2 2 3 3 3 2 2 2 2 2 2
94 WO1 3 3 1 4 1 3 4 1 4 3 2 1 1 1 1 2 2 3 2 3 3 1 1 3
95 WO1 2 1 4 3 3 4 4 3 4 2 1 1 2 1 3 2 2 3 3 4 3 2 4 2
96 WO1 3 3 4 4 1 3 2 4 4 4 3 3 3 2 3 4 4 3 2 5 2 3 2 3
97 WO1 4 5 2 3 3 2 4 2 2 1 2 2 1 1 2 4 3 2 3 2 2 2 1 2
Number of Respondents 16 16 16 16 16 16 16 16 16 16 16 15 16 15 16 16 16 16 16 16 16 16 16 16
Average 2.7 2.6 2.6 3.4 2.3 2.8 3.3 2.7 3.1 3.1 2.3 2.5 2.3 2.1 2.8 2.6 2.8 2.5 2.6 2.9 2.3 2.1 2.3 2.2
Standard Deviation 0.9 1.0 1.1 0.9 1.1 1.2 1.0 1.1 1.3 1.1 0.9 1.1 1.2 1.2 1.2 0.9 0.9 0.9 1.0 1.2 0.9 1.0 1.0 0.9
Section Average 2.7 Section Average 2.5
Standard Deviation 0.4 Standard Deviation 0.3
-10
10
30
50
70
-3 -2 -1 0 1 2 3 4 5 6 7 8
Section Distribution
-10
10
30
50
-3 -2 -1 0 1 2 3 4 5 6 7 8
Section Distribution

93
Section -2 Project Planning Issues: Chief Warrant Officers
Resource Issues Scheduling Issues
Question Number> 1 2 6 8 9 10 13 14 15 16 17 21 22 24 25 3 4 5 7 11 12 18 19 23
Respondent Rank
98 CW2 5 3 4 5 2 3 3 4 4 1 1 5 3 4 5 3 3 3 3 2 1 1 1 3
99 CW2 2 3 5 4 1 3 3 4 1 1 2 2 1 3 2 2 3 4 3 3 1 1 4 2
100 CW2 4 4 2 4 5 2 4 2 2 2 4 3 2 4 3 5 3 2 2 3 1 1 2 4
101 CW2 2 2 1 1 2 5 2 1 4 5 2 2 4 2 2 2 2 3 3 3 4 3 4 3
102 CW2 1 1 1 1 1 2 1 4 2 5 1 1 1 2 2 1 1 1 1 2 1 3 2 2
103 CW2 3 4 1 4 1 5 4 4 5 5 3 3 3 3 3 4 3 5 1 2 1 1 5 3
104 CW2 3 3 3 4 3 3 3 4 4 4 5 2 3 4 4 5 4 4 3 4 3 3 2 3
105 CW2 2 2 1 2 2 2 2 1 2 4 3 4 3 3 3 3 3 3 1 2 2 3 3 3
106 CW2 3 4 3 4 2 3 3 3 3 3 2 5 3 3 2 3 2 2 3 4 3 4 2 2
107 CW2 5 3 2 1 1 3 2 2 4 3 3 2 2 3 2 4 5 2 2 5 1 3 1 3
108 CW2 4 4 4 4 1 5 5 2 5 4 3 3 3 4 3 3 1 1 2 3 1 4 2 3
109 CW2 3 1 3 4 1 3 5 5 4 3 1 1 2 3 5 1 1 1 4 5 2 1 3 2
110 CW2 3 5 4 3 3 4 5 4 4 5 4 3 3 4 3 3 5 2 4 5 3 4 4 2
111 CW2 4 3 5 5 3 5 5 5 5 4 3 3 4 4 5 3 4 3 5 4 4 2 4 4
112 CW2 2 2 2 3 2 3 1 2 3 4 3 2 2 3 3 2 2 2 2 3 1 2 3 2
113 CW2 3 3 4 5 3 4 3 3 3 3 2 3 4 3 3 4 4 3 4 4 5 4 3 3
114 CW2 3 4 2 3 2 3 3 2 3 3 3 3 2 4 3 2 2 3 2 4 2 3 2 4
115 CW2 3 3 3 3 2 2 3 4 4 3 2 3 2 1 2 3 3 2 3 3 2 1 2 2
116 CW2 2 4 4 3 2 2 3 4 2 2 4 2 2 5 2 2 2 2 2 3 2 4 2 2
117 CW2 3 3 1 2 2 3 2 1 3 2 3 2 1 1 1 2 2 1 1 2 2 1 1 1
118 CW3 4 4 2 3 2 3 3 4 4 5 3 2 3 3 2 4 4 2 2 3 3 2 2 3
119 CW3 2 3 4 3 1 5 5 4 4 3 4 5 3 3 2 2 3 2 4 4 1 5 3 1
Number of Respondents 22 22 22 22 22 22 22 22 22 22 22 22 22 22 22 22 22 22 22 22 22 22 22 22
Average 3.0 3.1 2.8 3.2 2.0 3.3 3.2 3.1 3.4 3.4 2.8 2.8 2.5 3.1 2.8 2.9 2.8 2.4 2.6 3.3 2.1 2.5 2.6 2.6
Standard Deviation 1.0 1.0 1.3 1.2 1.0 1.1 1.3 1.3 1.1 1.3 1.1 1.2 0.9 1.0 1.1 1.1 1.2 1.1 1.1 1.0 1.2 1.3 1.1 0.9
Section Average 3.0 Section Average 2.6
Standard Deviation 0.4 Standard Deviation 0.3
-10
40
90
-3 -2 -1 0 1 2 3 4 5 6 7 8
Section Distribution
-10
10
30
50
-3 -2 -1 0 1 2 3 4 5 6 7 8
Section Distribution

94
Section 3 – Project Execution Issues: 1st Lieutenants
Resource Issues Scheduling Issues
Question Number> 26 27 31 33 35 37 44 46 47 48 28 29 30 32 34 36 38 39 40 41 42 43 45
Respondent Rank
1 1LT 5 5 1 3 1 3 1 1 1 4 5 3 3 2 2 2 3 1 2 2 2 1 1
2 1LT 5 3 4 2 2 2 4 4 2 2 2 2 3 5 2 3 4 4 3 2 4 3 4
3 1LT 1 1 2 1 1 1 1 1 1 1 1 1 1 1 1 1 1 2 1 1 1 1 1
4 1LT 5 5 4 5 1 2 1 3 1 1 3 1 1 4 2 1 1 4 1 1 5 2 1
5 1LT 4 4 3 4 3 5 2 1 2 5 3 4 3 2 3 1 3 3 2 3 3 3 2
6 1LT 4 4 4 3 4 4 4 4 5 4 3 5 3 5 4 2 4 4 5 4 3 3 4
7 1LT 3 2 5 4 4 3 2 2 4 3 4 3 4 4 4 3 4 4 2 3 3 4 4
8 1LT 5 5 2 3 2 3 1 1 1 1 3 3 2 1 2 1 2 5 3 3 2 5 1
9 1LT 4 2 4 2 4 3 3 2 4 2 4 3 3 2 3 3 4 4 2 3 2 4 3
10 1LT 5 4 4 4 3 4 3 3 4 2 4 3 4 2 4 2 4 3 2 3 4 4 3
11 1LT 4 4 5 4 4 3 4 5 5 4 3 4 4 3 4 4 4 3 2 4 4 3 5
12 1LT 2 2 4 3 1 1 3 1 1 1 2 2 2 4 2 1 3 2 3 2 2 2 1
13 1LT 4 3 3 4 4 4 2 3 5 5 4 4 2 2 3 2 3 4 2 2 3 4 3
14 1LT 2 4 1 2 2 5 1 4 2 3 2 2 1 4 1 4 4 5 4 4 2 4 1
15 1LT 4 4 4 4 2 4 4 2 2 3 4 4 4 4 4 2 4 4 3 3 3 2 3
16 1LT 1 1 5 3 4 4 5 3 3 3 1 5 4 5 3 4 5 3 4 4 2 4 4
17 1LT 4 4 4 5 5 4 4 2 2 5 5 5 5 4 4 5 2 2 4 4 2
18 1LT 4 4 3 3 2 4 1 2 3 3 3 4 3 3 2 3 4 2 3 2 2 3 2
19 1LT 4 4 3 4 4 4 3 3 2 2 4 4 3 3 4 4 4 4 3 3 3 3 3
20 1LT 1 5 5 1 1 1 1 1 1 1 3 3 5 1 1 1 1 5 1 2 4 3 1
21 1LT 2 3 3 1 3 2 2 2 4 1 3 3 4 1 1 1 3 2 3 2 3 3 3
22 1LT 5 5 2 3 2 2 2 2 2 3 2 3 2 2 3 2 4 3 2 2 2 2 2
23 1LT 3 3 4 3 4 4 4 5 3 3 4 3 4 5 3 4 4 3 2 2 2 4 4
24 1LT 2 3 2 2 3 1 3 1 2 1 2 3 3 3 1 1 1 2 2 1 1 1 1
25 1LT 4 4 4 5 3 4 3 1 2 3 4 4 4 2 4 4 5 3 3 3 5 3 3
26 1LT 4 5 4 4 4 3 2 1 1 2 4 4 4 3 4 3 4 4 3 4 3 4 1
27 1LT 3 4 5 4 2 1 4 1 2 4 2 4 2 2 4 1 3 3 1 2 2 4 2
28 1LT 5 5 3 3 4 4 3 1 3 2 5 4 3 1 4 3 4 4 2 2 4 2 2
29 1LT 3 3 3 2 3 2 3 2 2 3 2 3 3 3 3 3 3 3 2 2 3 2 3
30 1LT 5 5 5 1 4 1 2 1 1 4 4 3 4 1 1 1 3 4 2 1 1 3 1
31 1LT 2 3 2 3 2 2 3 3 3 3 2 2 1 2 2 3 2 3 3 2 2 1 2
32 1LT 4 4 5 3 5 3 1 2 4 1 5 5 5 5 2 3 2 4 3 1 1 3 5
33 1LT 5 5 1 5 5 3 5 2 4 5 3 5 2 3 2 1 3 3 2 5 3 2 5
34 1LT 4 4 4 4 4 3 3 2 3 4 3 4 3 4 3 4 4 4 3 2 4 3 4
Number of Respondents 34 34 34 34 34 34 34 33 34 34 34 34 34 34 34 34 34 34 34 33 34 34 34
Average 3.6 3.7 3.4 3.1 3.0 2.9 2.6 2.2 2.6 2.7 3.2 3.4 3.1 2.9 2.7 2.4 3.3 3.3 2.4 2.5 2.8 2.9 2.6
Standard Deviation 1.3 1.1 1.2 1.2 1.3 1.2 1.2 1.2 1.3 1.3 1.1 1.1 1.2 1.4 1.1 1.2 1.1 1.0 0.9 1.0 1.1 1.1 1.3
Section Average 3.0 Section Average 2.9
Standard Deviation 0.5 Standard Deviation 0.3
-10
40
90
-3 -2 -1 0 1 2 3 4 5 6 7 8
Section Distribution
-10
40
90
140
-3 -2 -1 0 1 2 3 4 5 6 7 8
Section Distribution

95
Section 3 – Project Execution Issues: Captains
Resource Issues Scheduling Issues
Question Number> 26 27 31 33 35 37 44 46 47 48 28 29 30 32 34 36 38 39 40 41 42 43 45
Respondent Rank
35 CPT 3 2 3 3 3 1 2 2 2 2 5 5 2 2 2 1 4 5 2 5 2 5 2
36 CPT 4 4 5 5 5 5 2 2 5 5 5 5 4 3 5 1 4 5 3 5 3 5 2
37 CPT 1 1 1 1 1 1 2 3 1 1 1 1 1 1 1 2 1 3 1 1 1 2 2
38 CPT 5 4 3 3 3 3 3 2 2 3 4 3 3 3 2 2 4 4 3 2 4 2 3
39 CPT 3 4 4 4 4 5 5 4 5 4 4 4 4 4 4 5 5 4 4 5 5 3 4
40 CPT 1 2 3 1 1 2 2 1 1 1 1 1 2 2 1 1 3 2 1 1 1 2 1
41 CPT 2 1 3 1 1 3 1 1 2 1 1 1 3 1 2 1 2 3 1 1 1 1 1
42 CPT 4 4 3 2 5 4 2 5 2 3 3 4 2 5 3 2 3 4 3 4 2 5 4
43 CPT 2 1 4 1 2 3 2 2 4 1 1 3 1 1 1 1 1 5 2 1 2 3 1
44 CPT 2 3 4 2 2 2 3 4 4 1 1 2 2 3 2 1 5 4 1 2 3 3 1
45 CPT 4 5 4 3 3 4 4 2 3 3 3 2 3 1 4 1 4 4 4 4 4 4 1
46 CPT 3 2 5 4 4 3 4 4 5 2 4 4 4 2 1 4 3 4 4 3 5 3 3
47 CPT 3 4 3 4 2 2 1 1 4 4 4 4 2 2 3 2 4 4 4 2 3 2 2
48 CPT 4 5 2 1 2 4 2 3 4 2 4 4 2 1 3 1 1 5 2 2 3 1 1
49 CPT 4 5 3 4 2 2 1 1 1 4 2 2 2 3 4 2 3 3 2 1 1 2 2
50 CPT 3 1 3 3 2 1 1 4 2 1 1 3 2 1 3 1 3 3 2 2 2 4 1
51 CPT 5 3 5 4 4 3 3 2 2 4 2 2 2 2 4 1 3 3 4 3 2 2 1
52 CPT 4 4 3 5 4 2 3 2 4 2 3 4 2 4 4 1 2 2 3 3 4 5 3
53 CPT 2 2 2 2 3 2 4 4 3 3 2 1 1 2 2 3 2 3 4 3 3 3 4
54 CPT 1 1 5 2 5 1 5 1 3 3 3 5 1 3 5 3 2 5 1 3 3 5 1
55 CPT 5 5 5 2 1 1 1 1 1 5 4 5 3 1 1 1 4 1 1 3 1 1 2
56 CPT 3 3 4 4 4 2 5 2 4 3 3 2 3 4 3 2 3 4 3 3 3 4 2
57 CPT 1 1 1 1 3 1 1 1 1 1 5 5 3 3 3 4 1 5 3 1 1 4 1
58 CPT 3 2 1 4 2 2 2 3 1 1 2 2 2 1 2 2 3 2 3 4 3 3 3
59 CPT 4 3 4 5 4 3 5 3 4 3 4 4 4 4 4 2 5 4 3 4 4 4 4
60 CPT 5 4 4 4 2 5 1 4 1 2 3 5 4 4 2 1 2 5 2 2 3 1 1
61 CPT 2 1 3 3 3 2 4 3 3 2 2 2 1 3 4 3 2 2 4 4 2 4 2
62 CPT 3 3 3 2 3 3 4 2 4 2 3 3 2 2 3 3 1 5 4 3 2 5 3
63 CPT 2 2 4 4 4 4 3 1 5 3 2 3 2 4 2 1 4 3 3 4 4 1 4
64 CPT 4 3 4 4 5 2 3 4 4 3 4 4 4 4 4 3 5 5 4 4 3 4 4
65 CPT 5 5 5 5 4 4 4 1 4 5 5 5 4 5 5 1 5 5 5 2 4 3 1
66 CPT 4 4 5 4 2 2 2 2 5 3 2 2 4 2 2 4 5 4 2 2 3 2 2
67 CPT 4 2 2 3 3 3 2 3 2 2 3 3 2 2 2 2 1 2 2 4 3 3 3
68 CPT 5 4 4 2 2 4 1 3 4 3 2 3 3 3 3 2 3 4 3 2 2 2 2
69 CPT 5 5 2 2 2 2 4 3 3 3 1 2 1 2 2 2 2 2 1 3 2 2 4
70 CPT 2 2 1 1 1 1 5 2 2 1 2 2 1 1 1 1 1 1 1 2 5 2 2
71 CPT 4 3 5 2 5 4 4 2 2 5 5 5 5 3 2 3 4 5 5 5 4 4 2
72 CPT 2 3 1 2 2 1 2 1 2 2 2 1 1 2 1 2 1 2 2 3 1 1 2
73 CPT 4 2 3 4 2 4 4 3 3 2 3 1 5 3 3 2 3 4 3 4 2 4 5
74 CPT 2 2 3 3 3 2 3 2 3 2 3 4 3 2 2 3 4 3 3 4 4 4 3
75 CPT 4 4 2 3 3 1 5 3 2 1 4 2 2 3 3 4 1 1 2 3 3 2 5
76 CPT 5 3 5 5 5 5 5 5 5 5 5 5 5 5 5 5 5 5 2 4 4 1
77 CPT 5 5 4 2 4 2 1 1 1 1 5 5 4 2 4 1 4 3 1 2 3 3 1
78 CPT 4 3 3 3 4 2 4 1 3 4 3 2 3 5 3 2 3 4 3 2 4 3 3
79 CPT 4 4 4 5 3 3 3 2 4 2 4 4 4 4 4 2 2 4 2 3 3 4 3
80 CPT 1 1 3 4 2 1 3 1 1 1 1 1 2 3 2 1 2 1 1 1 3 3 1
81 CPT 2 2 3 2 4 3 3 4 3 3 3 2 2 4 3 3 2 2 3 2 3 2 4
Number of Respondents 47 47 47 47 47 47 46 47 47 47 47 47 47 47 47 47 47 47 47 47 47 47 47
Average 3.3 3.0 3.3 3.0 3.0 2.6 2.8 2.4 2.9 2.6 3.0 3.1 2.6 2.7 2.8 2.1 2.9 3.5 2.7 2.8 2.8 3.0 2.3
Standard Deviation 1.3 1.3 1.2 1.3 1.2 1.2 1.3 1.2 1.3 1.3 1.3 1.4 1.2 1.2 1.2 1.1 1.3 1.3 1.2 1.2 1.1 1.3 1.2
Section Average 2.9 Section Average 2.8
Standard Deviation 0.3 Standard Deviation 0.3
-10
40
90
140
-3 -2 -1 0 1 2 3 4 5 6 7 8
Section Distribution
-10
40
90
140
-3 -2 -1 0 1 2 3 4 5 6 7 8
Section Distribution

96
Section 3 - Project Execution Issues: Warrant Officer Level Ones
Resource Issues Scheduling Issues
Question Number> 26 27 31 33 35 37 44 46 47 48 28 29 30 32 34 36 38 39 40 41 42 43 45
Respondent Rank
82 WO1 2 2 4 3 1 3 1 1 5 5 2 2 3 1 4 1 5 1 5 4 4 1 1
83 WO1 5 5 5 5 5 4 5 5 5 1 5 5 5 5 5 3 5 5 4 3 4 4 3
84 WO1 1 2 3 2 3 3 2 3 3 2 3 3 3 2 3 2 2 2 4 3 2 3 3
85 WO1 4 3 4 1 2 5 5 3 4 5 4 2 5 5 5 4 4 3 4 4 5 4 4
86 WO1 4 1 1 2 3 1 2 1 1 1 3 2 1 3 2 1 4 1 1 1 2 3 1
87 WO1 4 4 5 4 4 4 5 5 3 5 4 4 3 4 5 5 3 3 5 3 4 3 3
88 WO1 3 2 2 2 2 4 2 3 3 2 2 3 4 2 3 2 4 2 3 2 4 3 4
89 WO1 3 2 3 1 1 1 1 2 1 1 2 2 1 1 3 1 2 1 2 2 2 4 1
90 WO1 3 4 3 3 3 2 2 3 3 4 3 4 4 2 2 4 4 3 3 4 4 3 4
91 WO1 3 3 4 3 3 2 2 2 4 3 4 4 4 4 4 2 4 3 2 2 2 2 3
92 WO1 4 4 4 5 4 4 5 3 4 4 3 4 3 3 3 4 3 3 4 3 4 4 4
93 WO1 4 2 3 2 2 2 2 2 2 2 2 2 2 2 1 2 2 2 2 2 2 2 2
94 WO1 3 3 4 3 4 3 3 4 3 1 2 3 2 1 5 1 4 3 3 4 4 2 1
95 WO1 3 3 2 3 1 4 5 3 3 2 3 2 4 2 3 2 5 5 3 3 4 4 4
96 WO1 4 5 5 3 4 3 2 2 1 4 5 4 4 2 3 2 3 4 2 5 4 3 3
97 WO1 5 5 2 2 4 2 1 1 2 2 4 4 2 1 2 2 5 4 1 2 2 3 1
Number of Respondents 16 16 16 16 16 16 16 16 16 16 16 16 16 16 16 16 16 16 16 16 16 16 16
Average 3.4 3.1 3.4 2.8 2.9 2.9 2.8 2.7 2.9 2.8 3.2 3.1 3.1 2.5 3.3 2.4 3.7 2.8 3.0 2.9 3.3 3.0 2.6
Standard Deviation 1.0 1.3 1.2 1.2 1.3 1.2 1.6 1.3 1.3 1.5 1.0 1.0 1.3 1.4 1.3 1.3 1.1 1.3 1.3 1.1 1.1 0.9 1.3
Section Average 3.0 Section Average 3.0
Standard Deviation 0.3 Standard Deviation 0.4
-10
10
30
50
-3 -2 -1 0 1 2 3 4 5 6 7 8
Section Distribution
-10
10
30
50
-3 -2 -1 0 1 2 3 4 5 6 7 8
Section Distribution
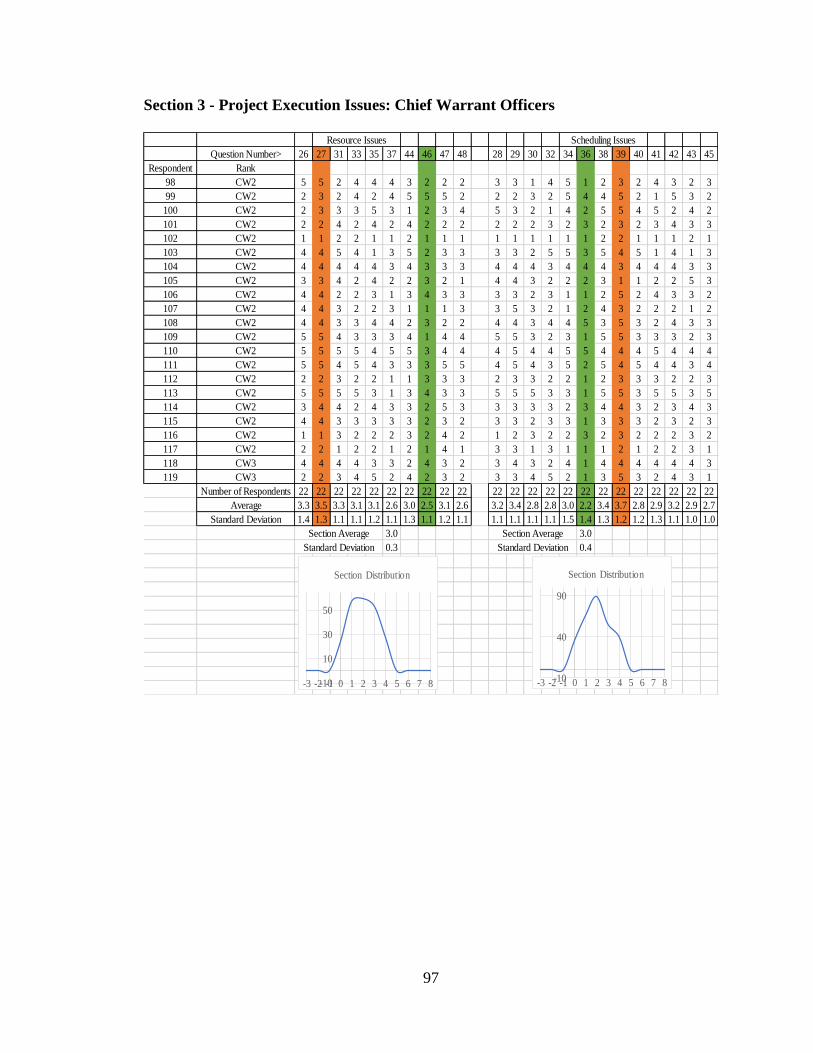
97
Section 3 - Project Execution Issues: Chief Warrant Officers
Resource Issues Scheduling Issues
Question Number> 26 27 31 33 35 37 44 46 47 48 28 29 30 32 34 36 38 39 40 41 42 43 45
Respondent Rank
98 CW2 5 5 2 4 4 4 3 2 2 2 3 3 1 4 5 1 2 3 2 4 3 2 3
99 CW2 2 3 2 4 2 4 5 5 5 2 2 2 3 2 5 4 4 5 2 1 5 3 2
100 CW2 2 3 3 3 5 3 1 2 3 4 5 3 2 1 4 2 5 5 4 5 2 4 2
101 CW2 2 2 4 2 4 2 4 2 2 2 2 2 2 3 2 3 2 3 2 3 4 3 3
102 CW2 1 1 2 2 1 1 2 1 1 1 1 1 1 1 1 1 2 2 1 1 1 2 1
103 CW2 4 4 5 4 1 3 5 2 3 3 3 3 2 5 5 3 5 4 5 1 4 1 3
104 CW2 4 4 4 4 4 3 4 3 3 3 4 4 4 3 4 4 4 3 4 4 4 3 3
105 CW2 3 3 4 2 4 2 2 3 2 1 4 4 3 2 2 2 3 1 1 2 2 5 3
106 CW2 4 4 2 2 3 1 3 4 3 3 3 3 2 3 1 1 2 5 2 4 3 3 2
107 CW2 4 4 3 2 2 3 1 1 1 3 3 5 3 2 1 2 4 3 2 2 2 1 2
108 CW2 4 4 3 3 4 4 2 3 2 2 4 4 3 4 4 5 3 5 3 2 4 3 3
109 CW2 5 5 4 3 3 3 4 1 4 4 5 5 3 2 3 1 5 5 3 3 3 2 3
110 CW2 5 5 5 5 4 5 5 3 4 4 4 5 4 4 5 5 4 4 4 5 4 4 4
111 CW2 5 5 4 5 4 3 3 3 5 5 4 5 4 3 5 2 5 4 5 4 4 3 4
112 CW2 2 2 3 2 2 1 1 3 3 3 2 3 3 2 2 1 2 3 3 3 2 2 3
113 CW2 5 5 5 5 3 1 3 4 3 3 5 5 5 3 3 1 5 5 3 5 5 3 5
114 CW2 3 4 4 2 4 3 3 2 5 3 3 3 3 3 2 3 4 4 3 2 3 4 3
115 CW2 4 4 3 3 3 3 3 2 3 2 3 3 2 3 3 1 3 3 3 2 3 2 3
116 CW2 1 1 3 2 2 2 3 2 4 2 1 2 3 2 2 3 2 3 2 2 2 3 2
117 CW2 2 2 1 2 2 1 2 1 4 1 3 3 1 3 1 1 1 2 1 2 2 3 1
118 CW3 4 4 4 4 3 3 2 4 3 2 3 4 3 2 4 1 4 4 4 4 4 4 3
119 CW3 2 2 3 4 5 2 4 2 3 2 3 3 4 5 2 1 3 5 3 2 4 3 1
Number of Respondents 22 22 22 22 22 22 22 22 22 22 22 22 22 22 22 22 22 22 22 22 22 22 22
Average 3.3 3.5 3.3 3.1 3.1 2.6 3.0 2.5 3.1 2.6 3.2 3.4 2.8 2.8 3.0 2.2 3.4 3.7 2.8 2.9 3.2 2.9 2.7
Standard Deviation 1.4 1.3 1.1 1.1 1.2 1.1 1.3 1.1 1.2 1.1 1.1 1.1 1.1 1.1 1.5 1.4 1.3 1.2 1.2 1.3 1.1 1.0 1.0
Section Average 3.0 Section Average 3.0
Standard Deviation 0.3 Standard Deviation 0.4
-10
10
30
50
-3 -2 -1 0 1 2 3 4 5 6 7 8
Section Distribution
-10
40
90
-3 -2 -1 0 1 2 3 4 5 6 7 8
Section Distribution

98
Section 4 – Project Completion Issues: 1st Lieutenants
Resource Issues Scheduling Issues
Question Number> 52 55 57 61 49 50 51 53 54 56 58 59 60 62 63 64
Respondent Rank
1 1LT 3 3 3 3 4 4 3 2 3 3 2 2 2 2 2 2
2 1LT 4 2 2 4 2 2 1 2 4 3 4 2 5 4 2 2
3 1LT 1 1 1 1 1 1 1 1 1 1 1 1 1 1 1 1
4 1LT 1 5 2 1 1 1 2 1 1 1 1 1 3 3 2 4
5 1LT 3 4 3 2 4 4 4 2 3 3 2 2 3 2 2 2
6 1LT 1 4 4 4 5 5 2 1 2 4 4 4 3 5 4 5
7 1LT 3 4 4 4 3 3 2 3 2 4 3 3 4 4 4 4
8 1LT 1 4 4 4 4 5 3 1 1 4 1 1 2 4 3 3
9 1LT 1 3 3 3 3 3 2 1 3 3 3 3 4 3 3 3
10 1LT 4 5 5 2 3 4 4 4 4 4 3 3 2 4 4 4
11 1LT 4 2 3 4 4 4 3 3 2 3 4 3 5 4 3 4
12 1LT 2 2 2 2 4 4 3 3 4 2 4 3 2 2 2 3
13 1LT 2 4 4 4 4 3 4 2 4 4 3 2 4 4 5 5
14 1LT 1 3 2 1 2 1 3 1 1 1 1 1 2 1 1 2
15 1LT 4 4 4 2 5 5 4 4 3 4 3 2 3 4 4 4
16 1LT 1 2 1 3 5 5 5 2 5 5 4 2 2 3 2 3
17 1LT 2 4 4 4 4 4 4 4 2 4 4 4 4 5 5 4
18 1LT 4 3 3 3 4 4 4 4 3 3 2 2 3 3 3 3
19 1LT 2 3 3 3 3 3 4 3 3 3 3 3 3 3 3 3
20 1LT 1 5 3 3 3 5 1 1 1 5 3 3 1 5 1 1
21 1LT 1 3 3 1 2 2 1 1 2 3 1 1 1 2 1 3
22 1LT 4 2 2 4 5 5 4 4 3 3 2 2 4 4 2 2
23 1LT 2 4 4 3 2 2 3 2 2 3 4 2 3 5 4 3
24 1LT 1 4 1 1 2 2 1 1 4 4 2 2 1 5 1 3
25 1LT 4 3 4 2 4 4 4 5 4 4 3 3 3 3 3 2
26 1LT 5 3 4 4 4 5 3 5 3 4 3 3 3 2 3 4
27 1LT 4 2 2 1 5 5 5 5 5 4 2 2 4 5 3 2
28 1LT 3 3 3 3 4 4 3 2 2 3 2 3 2 2 2 3
29 1LT 3 3 3 3 3 2 3 3 2 3 3 3 2 2 3 3
30 1LT 1 1 3 2 4 4 2 1 2 1 1 1 2 1 1 4
31 1LT 3 4 3 3 5 5 4 3 3 3 1 5 3 2 3 3
32 1LT 5 5 5 3 5 5 5 4 5 5 3 3 5 3 5 5
33 1LT 5 3 1 1 3 5 5 2 1 4 1 1 2 3 5 5
34 1LT 4 3 3 4 4 3 4 3 2 3 3 4 3 3 3 4
Number of Respondents 34 34 34 34 34 34 34 34 34 34 34 34 34 34 34 34
Average 2.6 3.2 3.0 2.7 3.5 3.6 3.1 2.5 2.7 3.3 2.5 2.4 2.8 3.2 2.8 3.2
Standard Deviation 1.4 1.1 1.1 1.1 1.2 1.3 1.2 1.3 1.2 1.1 1.1 1.0 1.1 1.2 1.2 1.1
Section Average 2.9 Section Average 3.0
Standard Deviation 0.3 Standard Deviation 0.4
-10
10
30
50
-3 -2 -1 0 1 2 3 4 5 6 7 8
Section Distribution
-10
40
90
-3 -2 -1 0 1 2 3 4 5 6 7 8
Section Distribution

99
Section 4 – Project Completion Issues: Captains
Resource Issues Scheduling Issues
Question Number> 52 55 57 61 49 50 51 53 54 56 58 59 60 62 63 64
Respondent Rank
35 CPT 1 1 3 1 4 4 2 1 1 3 3 3 3 3 2 3
36 CPT 4 5 5 5 4 5 5 5 4 5 5 5 5 5 5 5
37 CPT 3 1 1 1 1 1 1 2 1 1 1 5 2 1 1 1
38 CPT 4 4 2 3 4 3 4 2 2 3 2 3 3
39 CPT 5 5 5 5 4 5 5 5 5 5 5 5 5 5 5 5
40 CPT 1 2 2 2 3 2 2 1 2 2 2 1 1 1 1 1
41 CPT 1 1 3 2 2 2 1 2 1 1 3 2 1 1 2 1
42 CPT 3 3 4 5 4 2 5 2 4 4 2 4 3 2 4 3
43 CPT 3 4 3 3 4 4 2 2 1 4 1 2 3 2 4 5
44 CPT 4 3 4 3 3 3 3 4 2 4 2 2 2 3 1 1
45 CPT 3 4 4 2 2 2 3 2 2 4 2 4 3 2 1 4
46 CPT 2 4 3 2 3 4 3 2 5 4 4 4 2 4 4 5
47 CPT 2 4 3 4 3 4 3 3 2 4 3 3 4 3 3 2
48 CPT 3 4 5 4 2 2 4 3 1 4 3 2 4 4 3 3
49 CPT 5 3 2 1 2 3 3 4 3 3 1 2 2 1 1 2
50 CPT 1 2 2 3 2 2 3 3 4 3 1 1 3 4 3 3
51 CPT 2 4 2 3 4 4 4 2 2 4 2 2 3 4 4 2
52 CPT 3 2 4 4 4 4 2 4 3 3 2 3 3 4 2 3
53 CPT 1 1 2 2 1 1 2 1 1 1 3 3 3 3 4 4
54 CPT 1 5 1 3 3 3 2 3 5 5 3 5 1 3 4 3
55 CPT 1 3 2 1 5 4 1 1 1 2 1 1 1 1 1 1
56 CPT 3 3 3 2 4 3 4 3 4 3 3 2 3 2 2 2
57 CPT 1 5 3 3 1 1 3 1 5 5 1 1 1 4 4 5
58 CPT 1 3 2 2 2 2 1 2 1 3 2 2 1 2 1 1
59 CPT 5 5 5 2 5 4 5 5 4 4 3 4 4 4 4 4
60 CPT 3 1 4 1 2 5 2 2 1 1 1 4 4 4 1 4
61 CPT 3 2 2 1 2 1 2 2 3 2 2 2 3 3 2 2
62 CPT 1 3 2 3 4 4 3 4 3 3 1 1 2 3 3 5
63 CPT 4 4 4 4 3 4 3 2 3 4 2 4 2 4 2 3
64 CPT 3 3 3 4 5 4 3 3 3 3 4 4 4 4 4 5
65 CPT 5 5 2 2 5 5 5 5 5 5 5 5 2 5 3 3
66 CPT 4 1 3 5 5 5 2 5 4 5 1 1 3 5 3 5
67 CPT 2 3 3 3 3 3 3 2 4 3 3 2 3 2 2 2
68 CPT 3 3 2 3 3 3 4 4 4 4 4 2 3 3 2 2
69 CPT 5 3 3 2 4 4 1 4 2 3 2 2 1 2 1 1
70 CPT 1 5 5 1 2 2 1 1 1 5 1 1 1 2 2 2
71 CPT 3 5 3 4 4 5 2 5 5 5 5 5 2 4 2 2
72 CPT 1 1 3 2 2 2 2 1 1 3 3 3 2 2 1 1
73 CPT 2 3 4 4 2 4 3 4 2 2 3 2 4 3 5 3
74 CPT 2 2 4 2 3 3 3 2 2 4 1 1 2 3 3 3
75 CPT 3 5 2 3 4 3 2 1 3 4 4 3 2 1 4 5
76 CPT 4 1 1 2 1 1 1 5 5 5 1 3 4 5 1 1
77 CPT 5 4 4 4 4 4 5 5 1 4 2 4 4 2 2 4
78 CPT 3 4 5 2 4 2 3 2 4 4 4 3 3 4 4 2
79 CPT 1 4 4 4 2 2 3 1 1 4 1 1 4 1 1 2
80 CPT 1 3 3 2 1 1 1 1 1 3 1 1 2 1 1 1
81 CPT 2 2 2 2 3 2 3 2 2 2 2 2 3 3 2 2
Number of Respondents 46 47 47 47 47 47 47 46 46 47 47 47 47 47 47 47
Average 2.6 3.1 3.1 2.7 3.0 3.1 2.7 2.7 2.7 3.5 2.4 2.7 2.7 2.9 2.6 2.8
Standard Deviation 1.4 1.4 1.1 1.2 1.2 1.3 1.2 1.4 1.5 1.2 1.3 1.3 1.1 1.3 1.3 1.4
Section Average 2.9 Section Average 2.8
Standard Deviation 0.3 Standard Deviation 0.3
-10
10
30
50
-3 -2 -1 0 1 2 3 4 5 6 7 8
Section Distribution
-10
40
90
140
-3 -2 -1 0 1 2 3 4 5 6 7 8
Section Distribution
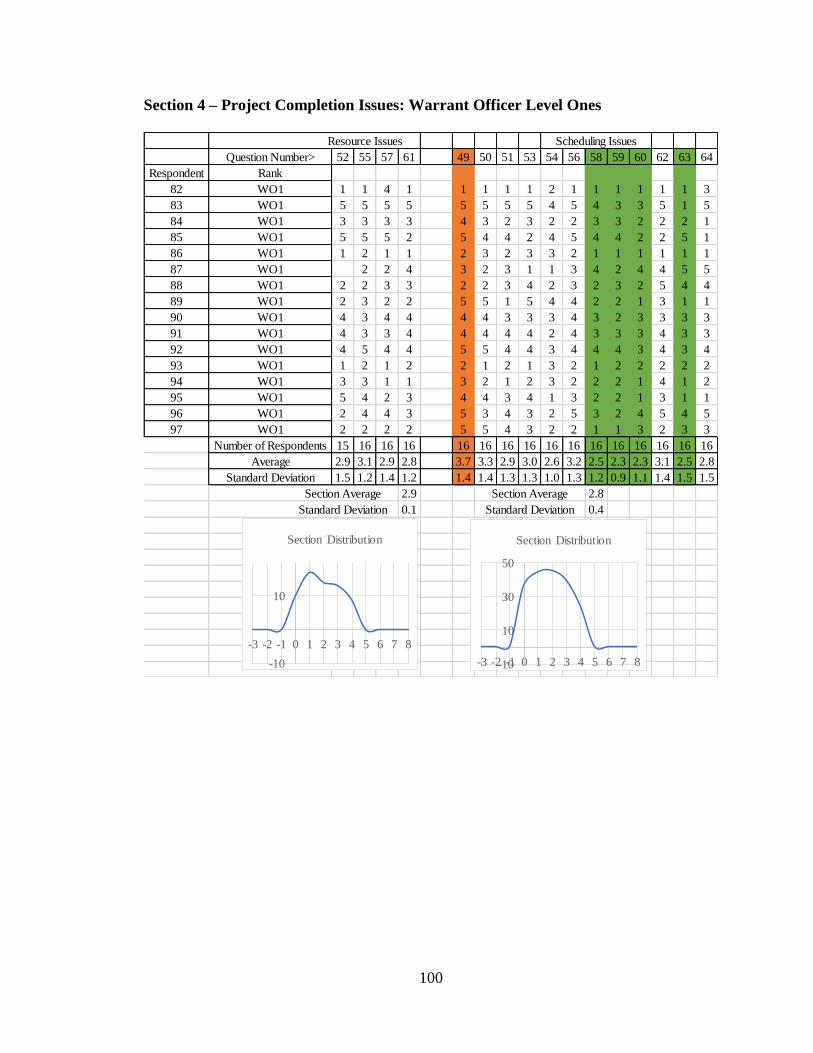
100
Section 4 – Project Completion Issues: Warrant Officer Level Ones
Resource Issues Scheduling Issues
Question Number> 52 55 57 61 49 50 51 53 54 56 58 59 60 62 63 64
Respondent Rank
82 WO1 1 1 4 1 1 1 1 1 2 1 1 1 1 1 1 3
83 WO1 5 5 5 5 5 5 5 5 4 5 4 3 3 5 1 5
84 WO1 3 3 3 3 4 3 2 3 2 2 3 3 2 2 2 1
85 WO1 5 5 5 2 5 4 4 2 4 5 4 4 2 2 5 1
86 WO1 1 2 1 1 2 3 2 3 3 2 1 1 1 1 1 1
87 WO1 2 2 4 3 2 3 1 1 3 4 2 4 4 5 5
88 WO1 2 2 3 3 2 2 3 4 2 3 2 3 2 5 4 4
89 WO1 2 3 2 2 5 5 1 5 4 4 2 2 1 3 1 1
90 WO1 4 3 4 4 4 4 3 3 3 4 3 2 3 3 3 3
91 WO1 4 3 3 4 4 4 4 4 2 4 3 3 3 4 3 3
92 WO1 4 5 4 4 5 5 4 4 3 4 4 4 3 4 3 4
93 WO1 1 2 1 2 2 1 2 1 3 2 1 2 2 2 2 2
94 WO1 3 3 1 1 3 2 1 2 3 2 2 2 1 4 1 2
95 WO1 5 4 2 3 4 4 3 4 1 3 2 2 1 3 1 1
96 WO1 2 4 4 3 5 3 4 3 2 5 3 2 4 5 4 5
97 WO1 2 2 2 2 5 5 4 3 2 2 1 1 3 2 3 3
Number of Respondents 15 16 16 16 16 16 16 16 16 16 16 16 16 16 16 16
Average 2.9 3.1 2.9 2.8 3.7 3.3 2.9 3.0 2.6 3.2 2.5 2.3 2.3 3.1 2.5 2.8
Standard Deviation 1.5 1.2 1.4 1.2 1.4 1.4 1.3 1.3 1.0 1.3 1.2 0.9 1.1 1.4 1.5 1.5
Section Average 2.9 Section Average 2.8
Standard Deviation 0.1 Standard Deviation 0.4
-10
10
-3 -2 -1 0 1 2 3 4 5 6 7 8
Section Distribution
-10
10
30
50
-3 -2 -1 0 1 2 3 4 5 6 7 8
Section Distribution

101
Section 4 – Project Completion Issues: Chief Warrant Officers
Resource Issues Scheduling Issues
Question Number> 52 55 57 61 49 50 51 53 54 56 58 59 60 62 63 64
Respondent Rank
98 CW2 2 3 3 2 3 5 4 3 2 3 2 2 2 2 2 2
99 CW2 1 4 5 4 5 5 2 3 1 4 3 3 4 5 1 4
100 CW2 3 5 5 4 3 5 4 4 4 5 3 3 5 4 4 5
101 CW2 2 4 2 2 4 3 3 2 3 2 3 2 2 1 1 5
102 CW2 1 1 1 1 1 1 1 1 1 1 1 1 1 1 1 1
103 CW2 5 5 5 1 4 4 5 5 3 5 2 2 2 1 1 4
104 CW2 3 3 4 1 2 3 3 3 3 4 2 2 2 3 2 2
105 CW2 1 2 2 1 2 1 1 1 1 2 2 2 2 3 2 2
106 CW2 3 2 2 2 4 4 2 2 1 3 2 2 2 4 3 4
107 CW2 3 2 3 2 5 5 4 4 2 3 4 4 4 4 5 3
108 CW2 1 4 4 1 4 3 2 2 5 4 3 2 2 4 2 2
109 CW2 5 2 5 5 5 5 5 5 3 5 1 5 5 5 5 5
110 CW2 5 4 5 5 5 5 5 5 3 5 4 4 4 4 4 3
111 CW2 3 2 3 2 3 4 5 4 2 5 4 3 4 4 4 5
112 CW2 3 3 4 3 3 3 3 3 3 4 3 3 3 3 3 3
113 CW2 5 4 4 3 5 4 3 5 3 4 2 5 4 5 5 5
114 CW2 3 4 3 3 4 4 3 4 4 4 2 2 3 3 2 3
115 CW2 1 2 3 2 3 3 2 2 2 3 2 2 3 2 3 3
116 CW2 1 2 2 1 2 1 1 1 1 2 2 2 2 3 2 2
117 CW2 1 3 3 2 3 3 1 1 1 3 2 2 2 4 2 3
118 CW3 5 3 4 4 4 3 4 4 3 4 3 3 4 3 4 3
119 CW3 2 4 4 2 4 5 3 5 5 4 3 2 3 3 4 5
Number of Respondents 22 22 22 22 22 22 22 22 22 22 22 22 22 22 22 22
Average 2.7 3.1 3.5 2.4 3.5 3.6 3.0 3.1 2.5 3.6 2.5 2.6 3.0 3.2 2.8 3.4
Standard Deviation 1.5 1.1 1.2 1.3 1.1 1.3 1.4 1.5 1.3 1.1 0.9 1.0 1.1 1.2 1.4 1.3
Section Average 2.9 Section Average 3.1
Standard Deviation 0.5 Standard Deviation 0.4
-10
10
-3 -2 -1 0 1 2 3 4 5 6 7 8
Section Distribution
-10
10
30
50
70
-3 -2 -1 0 1 2 3 4 5 6 7 8
Section Distribution

102
Section 5 - Project Solutions - 1st Lieutenants
CPM CCPM
Question Number> 65 69 70 71 72 73 74 75 77 78 80 82 83 66 67 68 76 79 81 84
Respondent Rank
1 1LT 5 3 1 5 1 1 1 3 5 2 2 3 1 5 4 2 3 1 3 1
2 1LT 4 1 1 4 2 2 4 4 3 2 2 1 1 5 4 2 2 1 4 1
3 1LT 4 3 3 2 2 3 3 1 4 2 3 3 2 2 4 4 3 2 2 2
4 1LT 4 2 1 5 3 3 3 1 4 2 4 3 1 1 4 4 4 4 3 1
5 1LT 4 4 3 5 2 4 4 4 3 2 4 2 2 3 4 4 1 1 2 4
6 1LT 5 4 5 3 5 4 3 4 5 3 5 3 1 3 4 5 5 4 3 3
7 1LT 4 4 1 5 3 5 3 4 3 3 5 4 1 4 3 2 4 2 3 1
8 1LT 5 2 1 3 1 3 4 3 4 3 3 3 1 3 5 3 4 3 1 1
9 1LT 4 4 3 3 3 4 3 4 3 4 3 3 3 3 3 2 4 2 3 2
10 1LT 3 4 2 4 1 3 3 3 3 1 4 2 1 2 5 3 4 3 2 4
11 1LT 4 2 1 3 3 5 1 1 3 3 4 2 1 1 3 4 2 3 2 1
12 1LT 5 2 2 4 1 1 2 2 3 4 2 3 2 3 3 2 2 2 1 1
13 1LT 3 2 2 4 1 2 4 2 4 2 4 5 4 2 4 4 4 4 2 1
14 1LT 2 4 2 5 2 4 3 4 2 2 4 3 5 3 5 3 3 4 2 3
15 1LT 2 2 3 2 2 2 4 2 2 4 2 4 4 4 2 3 2 3 2 5
16 1LT 4 4 5 2 3 3 3 2 3 3 3 2 2 3 3 5 4 4 2 1
17 1LT 5 3 1 4 4 4 2 4 2 4 4 2 4 4 5 2 4 4 5 5
18 1LT 4 2 2 4 3 4 1 4 3 3 4 2 2 3 4 1 4 2 3 4
19 1LT 2 2 2 2 4 2 2 3 2 3 3 4 4 2 2 4 2 3 4 1
20 1LT 5 3 3 5 4 4 3 4 3 1 4 5 2 2 5 2 5 1 2 1
21 1LT 2 2 3 3 2 2 3 2 1 1 4 3 2 1 3 4 4 4 2 4
22 1LT 5 4 1 5 1 5 3 4 3 3 3 4 4 1 3 1 3 3 1 2
23 1LT 3 4 2 4 2 4 5 3 4 5 4 3 2 2 5 4 5 3 2 3
24 1LT 5 5 3 5 2 5 1 5 1 1 5 4 1 1 5 1 4 1 2 1
25 1LT 3 2 2 4 5 3 2 2 3 2 3 3 2 3 3 4 3 2 2 2
26 1LT 2 1 2 3 2 1 1 3 3 4 4 2 1 2 3 5 2 4 3 2
27 1LT 5 5 1 5 2 5 5 4 4 5 5 4 1 4 4 2 2 5 2 1
28 1LT 3 3 1 3 1 3 4 3 2 2 3 3 2 2 4 2 4 4 3 2
29 1LT 3 3 2 3 2 3 2 3 3 2 3 3 2 2 2 2 2 2 2 3
30 1LT 4 4 3 2 1 1 2 5 4 4 4 5 2 2 4 1 4 1 3 5
31 1LT 3 4 2 4 2 2 2 3 4 2 2 2 2 2 3 4 4 2 2 2
32 1LT 1 1 1 5 5 1 3 1 1 5 4 5 4 5 3 1 1 3 5 5
33 1LT 5 1 1 5 1 3 1 3 5 1 1 5 1 2 4 1 2 3 2 4
34 1LT 3 4 3 3 4 2 3 4 3 3 3 4 3 4 2 3 4 4 2 4
Number of Respondents 34 34 34 34 34 34 34 34 34 34 34 34 34 34 34 34 34 34 34 34
Average 3.7 2.9 2.1 3.8 2.4 3.0 2.7 3.1 3.1 2.7 3.4 3.2 2.1 2.7 3.6 2.8 3.2 2.8 2.5 2.4
Standard Deviation 1.1 1.2 1.1 1.1 1.3 1.3 1.1 1.1 1.1 1.2 1.0 1.1 1.2 1.2 0.9 1.3 1.1 1.2 1.0 1.5
Section Average 2.9 Section Average 2.9
Standard Deviation 0.5 Standard Deviation 0.4
-10
40
90
-3 -2 -1 0 1 2 3 4 5 6 7 8
Section Distribution
-10
10
30
50
70
-3 -2 -1 0 1 2 3 4 5 6 7 8
Section Distribution

103
Section 5 - Project Solutions - Captains
CPM CCPM
Question Number> 65 69 70 71 72 73 74 75 77 78 80 82 83 66 67 68 76 79 81 84
Respondent Rank
35 CPT 5 3 3 4 2 4 3 5 3 3 3 3 5 3 5 1 4 1 1 1
36 CPT 5 4 4 5 1 1 5 1 4 3 2 5 1 1 5 5 5 4 2 4
37 CPT 1 3 2 4 1 2 1 3 2 1 5 4 1 1 4 3 2 1 5 1
38 CPT 4 2 1 4 2 3 4 4 4 2 2 4 1 3 3 2 3 2 2
39 CPT 5 3 4 4 4 3 4 4 4 5 3 5 5 3 4 2 5 5 4 5
40 CPT 3 3 4 4 4 3 2 3 4 1 3 3 2 1 2 3 3 2 4 1
41 CPT 4 2 4 4 2 3 3 1 4 2 3 2 1 3 5 4 5 3 3 1
42 CPT 5 3 2 2 4 5 3 5 3 3 5 2 3 3 4 2 4 4 5 4
43 CPT 4 3 1 4 1 3 4 4 5 1 4 3 4 3 4 2 3 1 4 1
44 CPT 5 5 4 4 2 4 1 1 2 4 5 2 4 1 3 2 1 2 3 1
45 CPT 2 2 1 5 1 5 2 2 5 1 4 1 1 2 4 5 2 2 4 1
46 CPT 1 2 3 3 1 4 4 2 3 2 2 4 1 2 3 2 3 4 4 3
47 CPT 3 5 2 5 1 4 1 3 5 1 2 2 2 2 4 2 4 2 3 1
48 CPT 3 4 2 4 2 2 2 4 5 2 3 4 4 4 4 2 4 2 4 3
49 CPT 2 3 1 5 2 4 2 3 3 4 3 4 1 2 5 2 4 4 2 4
50 CPT 4 2 2 4 3 3 4 4 5 4 4 4 4 4 4 2 4 3 4 3
51 CPT 4 3 2 4 1 5 4 4 3 4 5 5 5 2 4 4 3 4 1 1
52 CPT 3 2 3 3 2 3 3 3 3 2 4 3 3 4 3 2 3 2 3 1
53 CPT 4 4 4 5 3 2 3 3 4 4 5 3 2 4 3 2 3 2 3 4
54 CPT 2 3 5 5 2 4 3 5 4 5 5 5 4 5 2 4 5 5 4 4
55 CPT 5 2 2 5 2 4 4 4 4 1 4 4 2 2 4 2 5 2 4 1
56 CPT 4 3 2 5 3 2 2 4 4 2 4 4 2 4 3 2 4 2 2 2
57 CPT 5 5 4 4 5 5 5 5 5 1 5 4 3 5 4 3 4 1 5 1
58 CPT 3 3 3 4 2 4 3 4 4 2 4 4 3 3 3 4 3 3 2 1
59 CPT 5 3 4 3 2 3 2 3 5 2 5 3 3 3 3 5 3 3 4 2
60 CPT 5 4 2 5 4 5 4 5 4 4 5 4 1 2 5 2 4 1 1 1
61 CPT 4 3 3 3 2 2 4 3 4 2 2 3 4 3 3 5 3 3 4 3
62 CPT 2 3 3 5 3 5 2 1 3 3 5 5 2 2 3 3 2 3 4 5
63 CPT 4 1 2 4 2 2 4 4 4 1 4 3 1 2 2 1 3 1 1 1
64 CPT 5 4 5 3 5 3 5 5 4 4 4 4 5 3 5 5 4 4 5 5
65 CPT 5 3 3 5 1 5 5 3 5 5 5 5 5 1 4 5 4 5 4 1
66 CPT 5 1 3 5 1 5 1 3 3 2 5 5 1 2 5 5 5 3 3 1
67 CPT 3 3 3 3 5 5 4 3 4 4 4 2 1 3 2 3 3 2 2 2
68 CPT 4 4 2 2 2 2 2 4 4 3 4 4 1 3 3 2 3 2 4 2
69 CPT 1 4 1 2 2 2 1 3 1 1 2 3 4 1 5 1 3 2 2 2
70 CPT 1 1 1 1 5 5 1 1 1 1 1 5 1 1 1 1 3 1 1 1
71 CPT 5 4 1 3 1 5 5 5 3 3 5 2 3 2 5 1 5 1 4 3
72 CPT 1 2 2 1 2 1 1 1 3 4 2 3 3 1 1 2 2 3 4 2
73 CPT 4 5 1 3 3 2 4 4 2 4 4 3 2 2 4 2 2 2 3 5
74 CPT 4 2 2 4 3 2 2 4 5 3 4 4 1 3 4 2 3 3 3 2
75 CPT 4 1 3 2 5 4 2 3 4 3 2 2 1 1 3 4 2 1 3 4
76 CPT 1 5 5 5 5 1 4 2 4 2 4 5 5 4 4 1 4 2 1 1
77 CPT 4 4 2 4 2 2 4 4 3 2 4 4 4 3 4 2 3 4 2 2
78 CPT 4 2 2 4 1 3 4 2 4 4 5 2 3 2 4 4 3 4 3 1
79 CPT 5 5 4 3 1 5 3 3 5 2 5 1 4 3 4 2 4 2 3 5
80 CPT 5 2 2 2 1 4 4 3 3 1 3 3 4 3 3 2 3 3 3 4
81 CPT 2 2 2 4 1 2 2 1 4 4 3 3 3 3 2 2 5 3 5 1
Number of Respondents 47 47 47 47 47 47 47 47 47 47 47 47 47 47 47 47 47 47 46 47
Average 3.6 3.0 2.6 3.7 2.4 3.3 3.0 3.2 3.7 2.6 3.7 3.4 2.7 2.6 3.6 2.7 3.4 2.6 3.2 2.3
Standard Deviation 1.4 1.2 1.2 1.1 1.3 1.3 1.3 1.2 1.0 1.3 1.2 1.1 1.4 1.1 1.1 1.3 1.0 1.2 1.2 1.4
Section Average 3.2 Section Average 2.9
Standard Deviation 0.5 Standard Deviation 0.5
-10
40
90
140
-3 -2 -1 0 1 2 3 4 5 6 7 8
Section Distribution
-10
10
30
50
70
90
-3 -2 -1 0 1 2 3 4 5 6 7 8
Section Distribution

104
Section 5 - Project Solutions - Warrant Officer Level Ones
CPM CCPM
Question Number> 65 69 70 71 72 73 74 75 77 78 80 82 83 66 67 68 76 79 81 84
Respondent Rank
82 WO1 1 3 3 1 5 3 1 5 3 3 5 4 1 1 1 1 5 1 3 1
83 WO1 5 3 3 4 2 4 4 3 5 4 5 2 2 3 5 4 5 3 5 3
84 WO1 4 3 1 3 2 3 2 2 2 4 4 5 4 2 3 4 3 4 3 4
85 WO1 5 5 1 5 2 1 4 1 3 2 1 5 4 3 4 1 1 2 4 4
86 WO1 2 1 1 3 3 4 2 3 2 1 3 2 2 1 2 3 2 4 3 1
87 WO1 3 4 5 5 5 3 4 5 4 4 5 5 2 4 2 4 3 3 5 1
88 WO1 5 4 2 4 2 3 1 3 4 2 3 2 4 3 4 3 3 4 2 2
89 WO1 1 2 1 4 3 2 3 4 5 3 3 2 1 2 4 2 3 2 4 1
90 WO1 2 4 2 3 3 4 2 3 2 1 1 2 2 4 3 3 4 1 2 1
91 WO1 4 4 3 4 3 3 3 4 4 2 3 4 3 3 4 2 4 2 2 3
92 WO1 2 3 2 2 2 2 3 2 5 2 3 2 4 3 4 4 4 4 3 2
93 WO1 4 2 2 2 2 2 2 2 2 2 2 2 2 1 4 2 2 2 2 2
94 WO1 5 2 1 5 2 3 5 4 3 2 5 2 1 3 5 1 5 3 3 3
95 WO1 3 4 1 3 2 2 2 2 4 2 5 2 3 2 2 3 2 2 3 2
96 WO1 4 5 2 4 2 4 3 3 3 4 4 5 2 2 5 4 4 2 3 1
97 WO1 5 3 2 4 2 4 4 3 1 1 4 2 2 3 4 4 2 2 3 1
Number of Respondents 16 16 16 16 16 16 16 16 16 16 16 16 16 16 16 16 16 16 16 16
Average 3.4 3.3 2.0 3.5 2.6 2.9 2.8 3.1 3.3 2.4 3.5 3.0 2.4 2.5 3.5 2.8 3.3 2.6 3.1 2.0
Standard Deviation 1.5 1.1 1.1 1.2 1.0 0.9 1.2 1.1 1.2 1.1 1.4 1.4 1.1 1.0 1.2 1.2 1.2 1.0 1.0 1.1
Section Average 2.9 Section Average 2.8
Standard Deviation 0.5 Standard Deviation 0.5
-10
10
30
50
70
-3 -2 -1 0 1 2 3 4 5 6 7 8
Section Distribution
-10
10
30
-3 -2 -1 0 1 2 3 4 5 6 7 8
Section Distribution

105
Section 5 - Project Solutions - Chief Warrant Officers
CPM CCPM
Question Number> 65 69 70 71 72 73 74 75 77 78 80 82 83 66 67 68 76 79 81 84
Respondent Rank
98 CW2 5 3 4 4 4 3 4 5 5 3 3 2 2 4 4 1 3 1 4 2
99 CW2 5 3 2 1 3 1 3 4 3 1 4 3 1 4 4 1 2 1 3 1
100 CW2 3 3 2 5 1 4 4 5 4 4 4 5 5 2 5 5 4 1 4 1
101 CW2 3 1 3 2 1 3 1 2 4 1 5 2 1 2 3 2 4 2 4 3
102 CW2 5 3 3 2 2 4 5 5 2 1 3 5 5 1 3 1 3 2 3 2
103 CW2 5 4 3 5 1 5 4 3 5 1 1 3 1 3 4 1 1 1 1 2
104 CW2 1 4 4 3 2 2 4 4 2 3 4 2 4 3 2 2 2 3 2 1
105 CW2 4 4 4 2 2 2 4 3 1 2 2 1 2 4 1 3 4 3 4
106 CW2 4 2 4 4 4 4 4 4 2 3 3 4 4 4 3 2 4 2 4 2
107 CW2 5 2 1 2 2 5 4 5 4 5 4 4 5 4 4 1 3 2 3 1
108 CW2 5 3 3 4 1 4 4 4 3 3 4 2 1 2 3 2 4 1 3 1
109 CW2 2 3 3 4 2 3 3 3 5 2 3 2 4 2 4 3 4 4 3 1
110 CW2 5 4 3 5 3 4 4 4 4 3 4 3 5 3 4 3 5 4 2 5
111 CW2 5 3 1 4 2 2 3 5 3 4 2 5 3 2 4 1 3 1 3 4
112 CW2 5 2 2 2 4 3 3 5 3 4 4 3 4 4 4 1 3 3 3 1
113 CW2 5 3 1 1 1 3 5 4 5 1 3 1 1 4 4 2 4 2 3 1
114 CW2 2 2 4 3 5 3 2 2 3 4 2 4 3 4 1 5 2 4 2 4
115 CW2 4 3 3 5 3 4 4 4 4 3 4 3 3 3 4 3 3 2 3 2
116 CW2 4 3 2 3 1 2 2 3 4 2 1 4 3 3 4 2 3 5 2 4
117 CW2 5 1 1 5 2 3 2 5 5 3 4 3 1 2 5 2 3 1 1 1
118 CW3 4 2 5 4 2 3 3 3 5 1 4 3 3 2 3 2 3 3 4 1
119 CW3 1 4 1 2 1 2 5 2 5 1 5 5 1 3 5 1 3 1 1 1
Number of Respondents 22 22 22 22 21 22 22 22 22 22 22 22 22 22 22 22 22 22 22 22
Average 4.0 2.8 2.7 3.3 2.2 3.1 3.4 3.9 3.8 2.5 3.3 3.2 2.8 2.9 3.7 2.0 3.1 2.3 2.8 2.0
Standard Deviation 1.4 0.9 1.2 1.4 1.2 1.0 1.1 1.0 1.1 1.3 1.1 1.2 1.6 0.9 0.9 1.2 0.9 1.3 1.0 1.3
Section Average 3.1 Section Average 2.7
Standard Deviation 0.5 Standard Deviation 0.6
-10
10
30
50
70
-3 -2 -1 0 1 2 3 4 5 6 7 8
Section Distribution
-10
10
30
-3 -2 -1 0 1 2 3 4 5 6 7 8
Section Distribution

106
Appendix C: ANOVA of Initial Results
Section 2: Project Planning Issues – Commissioned vs. Warrant Officers
Question Number LTs CPTs WO1s Chiefs
1 3.1 3.0 2.7 3.0 Anova: Single Factor Anova: Single Factor
2 3.4 2.8 2.6 3.1 SUMMARY SUMMARY
6 2.8 3.0 2.6 2.8 Groups Count Sum Average Variance Groups Count Sum Average Variance
8 3.6 3.1 3.4 3.2 WO1 24 62.475 2.6031 0.12891 LTs 24 67.7756 2.824 0.24907
9 2.1 2.0 2.3 2.0 Chiefs 24 68.3636 2.8485 0.14834 CPTs 24 63.4459 2.6436 0.15187
10 2.8 2.8 2.8 3.3 ANOVA ANOVA
13 3.3 2.9 3.3 3.2 Source of Variation SS df MS F P-value F crit Source of Variation SS df MS F P-value F crit
14 2.9 2.5 2.7 3.1 Between Groups 0.722 1 0.7224 5.21131 0.027 4.052 Between Groups 0.391 1 0.3906 1.9482 0.1695 4.0517
15 3.4 2.7 3.1 3.4 Within Groups 6.377 46 0.1386 Within Groups 9.222 46 0.2005
16 3.3 3.2 3.1 3.4 Total 7.099 47 Total 9.612 47
17 2.3 2.5 2.3 2.8
21 2.4 2.8 2.5 2.8 Anova: Single Factor Anova: Single Factor
22 2.5 2.3 2.3 2.5 SUMMARY SUMMARY
24 2.5 2.3 2.1 3.1 Groups Count Sum Average Variance Groups Count Sum Average Variance
25 2.4 2.7 2.8 2.8 LTs 24 67.7756 2.824 0.24907 CPTs 24 63.4459 2.6436 0.15187
3 2.9 3.0 2.6 2.9 WO1s 24 62.475 2.6031 0.12891 WO1s 24 62.475 2.6031 0.12891
4 3.3 2.9 2.8 2.8 ANOVA ANOVA
5 3.6 2.5 2.5 2.4 Source of Variation SS df MS F P-value F crit Source of Variation SS df MS F P-value F crit
7 2.8 2.5 2.6 2.6 Between Groups 0.585 1 0.5853 3.09728 0.085 4.052 Between Groups 0.02 1 0.0196 0.13988 0.7101 4.0517
11 3.2 3.2 2.9 3.3 Within Groups 8.693 46 0.189 Within Groups 6.458 46 0.1404
12 2.0 1.7 2.3 2.1 Total 9.279 47 Total 6.478 47
18 2.4 2.1 2.1 2.5
19 2.3 2.7 2.3 2.6 Anova: Single Factor Anova: Single Factor
23 2.5 2.3 2.2 2.6 SUMMARY SUMMARY
Groups Count Sum Average Variance Groups Count Sum Average Variance
LTs 24 67.7756 2.824 0.24907 CPTs 24 63.4459 2.6436 0.15187
Chiefs 24 68.3636 2.8485 0.14834 Chiefs 24 68.3636 2.8485 0.14834
ANOVA ANOVA
Source of Variation SS df MS F P-value F crit Source of Variation SS df MS F P-value F crit
Between Groups 0.007 1 0.0072 0.03625 0.85 4.052 Between Groups 0.504 1 0.5038 3.35651 0.0734 4.0517
Within Groups 9.14 46 0.1987 Within Groups 6.905 46 0.1501
Total 9.148 47 Total 7.409 47LTs
Chiefs
CPTs
WO1s

107
Section 3: Project Execution Issues – Commissioned vs. Warrant Officers
Question Number LTs CPTs WO1s Chiefs Anova: Single Factor Anova: Single Factor
26 3.6 3.3 3.4 3.3 SUMMARY SUMMARY
27 3.7 3.0 3.1 3.5 Groups Count Sum Average Variance Groups Count Sum Average Variance
31 3.4 3.3 3.4 3.3 WO1s 23 68.6875 2.9864 0.09906 LTs 23 67.2843 2.9254 0.16734
33 3.1 3.0 2.8 3.1 Chiefs 23 68.9091 2.996 0.12714 CPTs 23 65.0393 2.8278 0.10049
35 3.0 3.0 2.9 3.1 ANOVA ANOVA
37 2.9 2.6 2.9 2.6 Source of Variation SS df MS F P-value F crit Source of Variation SS df MS F P-value F crit
44 2.6 2.8 2.8 3.0 Between Groups 0.001 1 0.0011 0.00944 0.923 4.062 Between Groups 0.11 1 0.1096 0.81819 0.3706 4.0617
46 2.2 2.4 2.7 2.5 Within Groups 4.977 44 0.1131 Within Groups 5.892 44 0.1339
47 2.6 2.9 2.9 3.1 Total 4.978 45 Total 6.002 45
48 2.7 2.6 2.8 2.6
28 3.2 3.0 3.2 3.2 Anova: Single Factor Anova: Single Factor
29 3.4 3.1 3.1 3.4 SUMMARY SUMMARY
30 3.1 2.6 3.1 2.8 Groups Count Sum Average Variance Groups Count Sum Average Variance
32 2.9 2.7 2.5 2.8 LTs 23 67.2843 2.9254 0.16734 CPTs 23 65.0393 2.8278 0.10049
34 2.7 2.8 3.3 3.0 WO1s 23 68.6875 2.9864 0.09906 WO1s 23 68.6875 2.9864 0.09906
36 2.4 2.1 2.4 2.2 ANOVA ANOVA
38 3.3 2.9 3.7 3.4 Source of Variation SS df MS F P-value F crit Source of Variation SS df MS F P-value F crit
39 3.3 3.5 2.8 3.7 Between Groups 0.043 1 0.0428 0.32135 0.574 4.062 Between Groups 0.289 1 0.2893 2.89985 0.0956 4.0617
40 2.4 2.7 3.0 2.8 Within Groups 5.861 44 0.1332 Within Groups 4.39 44 0.0998
41 2.5 2.8 2.9 2.9 Total 5.904 45 Total 4.679 45
42 2.8 2.8 3.3 3.2
43 2.9 3.0 3.0 2.9 Anova: Single Factor Anova: Single Factor
45 2.6 2.3 2.6 2.7 SUMMARY SUMMARY
Groups Count Sum Average Variance Groups Count Sum Average Variance
LTs 23 67.2843 2.9254 0.16734 CPTs 23 65.0393 2.8278 0.10049
Chiefs 23 68.9091 2.996 0.12714 Chiefs 23 68.9091 2.996 0.12714
ANOVA ANOVA
Source of Variation SS df MS F P-value F crit Source of Variation SS df MS F P-value F crit
Between Groups 0.057 1 0.0574 0.38977 0.536 4.062 Between Groups 0.326 1 0.3255 2.8603 0.0979 4.0617
Within Groups 6.479 44 0.1472 Within Groups 5.008 44 0.1138
Total 6.536 45 Total 5.333 45LTs
Chiefs
CPTs
WO1s
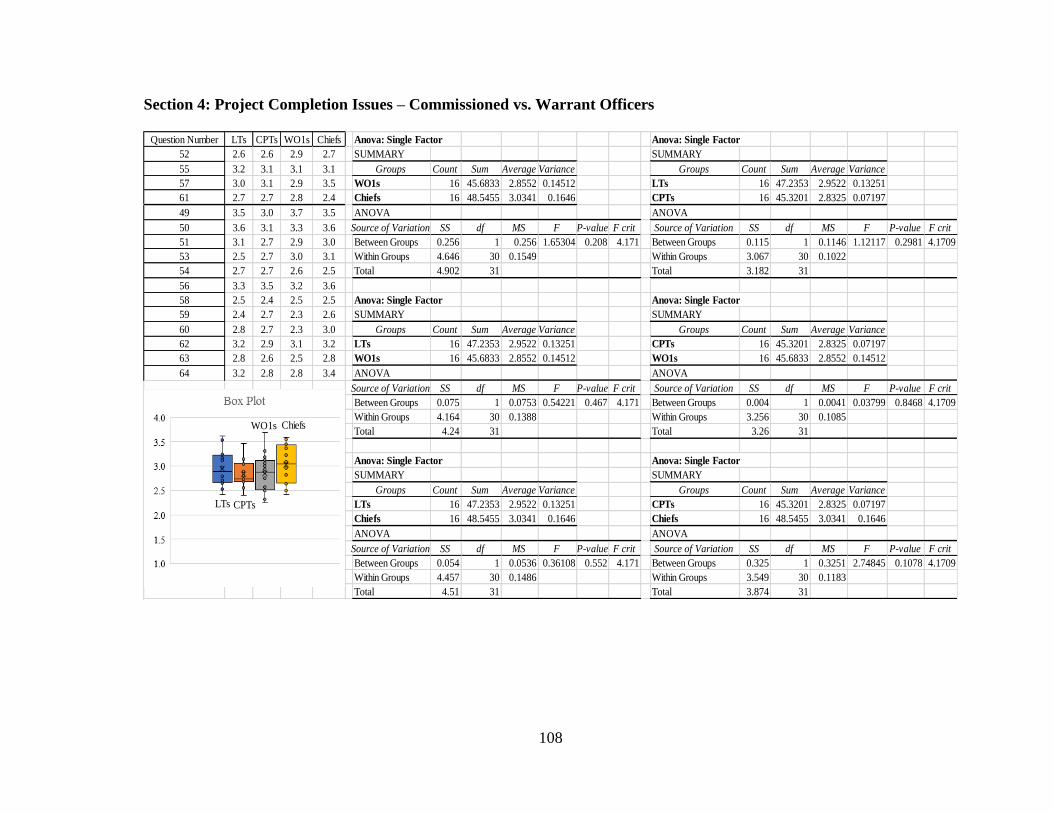
108
Section 4: Project Completion Issues – Commissioned vs. Warrant Officers
Question Number LTs CPTs WO1s Chiefs Anova: Single Factor Anova: Single Factor
52 2.6 2.6 2.9 2.7 SUMMARY SUMMARY
55 3.2 3.1 3.1 3.1 Groups Count Sum Average Variance Groups Count Sum Average Variance
57 3.0 3.1 2.9 3.5 WO1s 16 45.6833 2.8552 0.14512 LTs 16 47.2353 2.9522 0.13251
61 2.7 2.7 2.8 2.4 Chiefs 16 48.5455 3.0341 0.1646 CPTs 16 45.3201 2.8325 0.07197
49 3.5 3.0 3.7 3.5 ANOVA ANOVA
50 3.6 3.1 3.3 3.6 Source of Variation SS df MS F P-value F crit Source of Variation SS df MS F P-value F crit
51 3.1 2.7 2.9 3.0 Between Groups 0.256 1 0.256 1.65304 0.208 4.171 Between Groups 0.115 1 0.1146 1.12117 0.2981 4.1709
53 2.5 2.7 3.0 3.1 Within Groups 4.646 30 0.1549 Within Groups 3.067 30 0.1022
54 2.7 2.7 2.6 2.5 Total 4.902 31 Total 3.182 31
56 3.3 3.5 3.2 3.6
58 2.5 2.4 2.5 2.5 Anova: Single Factor Anova: Single Factor
59 2.4 2.7 2.3 2.6 SUMMARY SUMMARY
60 2.8 2.7 2.3 3.0 Groups Count Sum Average Variance Groups Count Sum Average Variance
62 3.2 2.9 3.1 3.2 LTs 16 47.2353 2.9522 0.13251 CPTs 16 45.3201 2.8325 0.07197
63 2.8 2.6 2.5 2.8 WO1s 16 45.6833 2.8552 0.14512 WO1s 16 45.6833 2.8552 0.14512
64 3.2 2.8 2.8 3.4 ANOVA ANOVA
Source of Variation SS df MS F P-value F crit Source of Variation SS df MS F P-value F crit
Between Groups 0.075 1 0.0753 0.54221 0.467 4.171 Between Groups 0.004 1 0.0041 0.03799 0.8468 4.1709
Within Groups 4.164 30 0.1388 Within Groups 3.256 30 0.1085
Total 4.24 31 Total 3.26 31
Anova: Single Factor Anova: Single Factor
SUMMARY SUMMARY
Groups Count Sum Average Variance Groups Count Sum Average Variance
LTs 16 47.2353 2.9522 0.13251 CPTs 16 45.3201 2.8325 0.07197
Chiefs 16 48.5455 3.0341 0.1646 Chiefs 16 48.5455 3.0341 0.1646
ANOVA ANOVA
Source of Variation SS df MS F P-value F crit Source of Variation SS df MS F P-value F crit
Between Groups 0.054 1 0.0536 0.36108 0.552 4.171 Between Groups 0.325 1 0.3251 2.74845 0.1078 4.1709
Within Groups 4.457 30 0.1486 Within Groups 3.549 30 0.1183
Total 4.51 31 Total 3.874 31
LTs
Chiefs
CPTs
WO1s
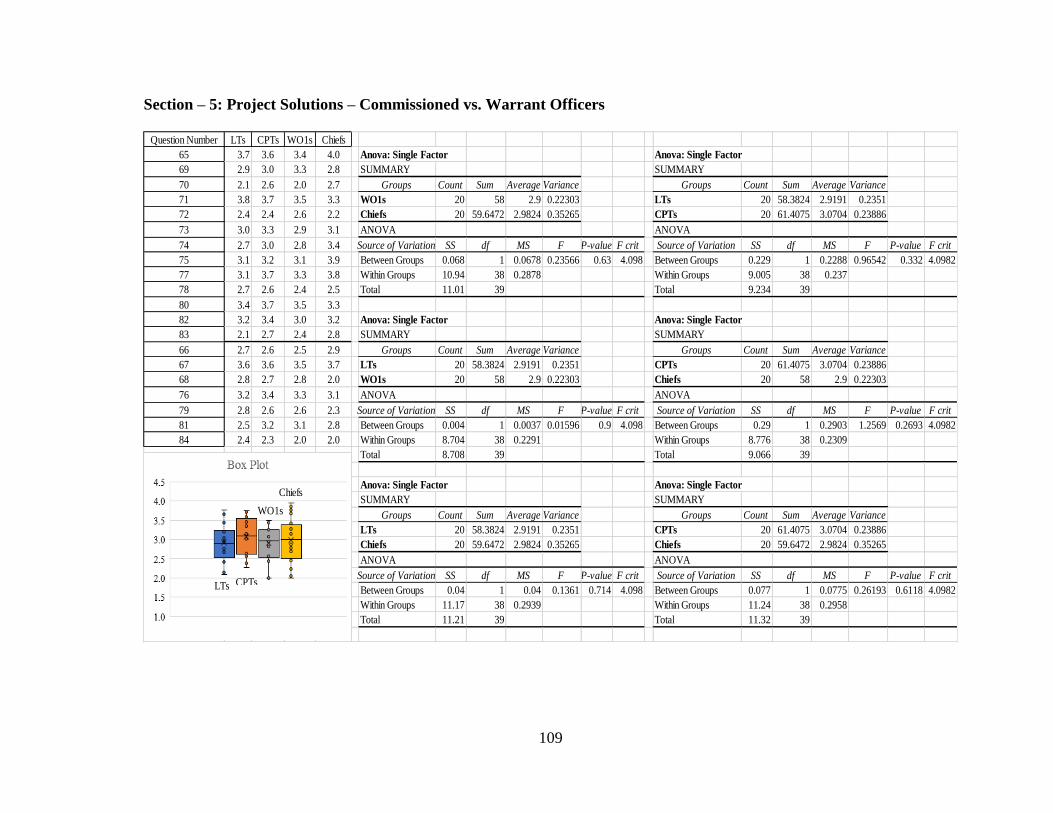
109
Section – 5: Project Solutions – Commissioned vs. Warrant Officers
Question Number LTs CPTs WO1s Chiefs
65 3.7 3.6 3.4 4.0 Anova: Single Factor Anova: Single Factor
69 2.9 3.0 3.3 2.8 SUMMARY SUMMARY
70 2.1 2.6 2.0 2.7 Groups Count Sum Average Variance Groups Count Sum Average Variance
71 3.8 3.7 3.5 3.3 WO1s 20 58 2.9 0.22303 LTs 20 58.3824 2.9191 0.2351
72 2.4 2.4 2.6 2.2 Chiefs 20 59.6472 2.9824 0.35265 CPTs 20 61.4075 3.0704 0.23886
73 3.0 3.3 2.9 3.1 ANOVA ANOVA
74 2.7 3.0 2.8 3.4 Source of Variation SS df MS F P-value F crit Source of Variation SS df MS F P-value F crit
75 3.1 3.2 3.1 3.9 Between Groups 0.068 1 0.0678 0.23566 0.63 4.098 Between Groups 0.229 1 0.2288 0.96542 0.332 4.0982
77 3.1 3.7 3.3 3.8 Within Groups 10.94 38 0.2878 Within Groups 9.005 38 0.237
78 2.7 2.6 2.4 2.5 Total 11.01 39 Total 9.234 39
80 3.4 3.7 3.5 3.3
82 3.2 3.4 3.0 3.2 Anova: Single Factor Anova: Single Factor
83 2.1 2.7 2.4 2.8 SUMMARY SUMMARY
66 2.7 2.6 2.5 2.9 Groups Count Sum Average Variance Groups Count Sum Average Variance
67 3.6 3.6 3.5 3.7 LTs 20 58.3824 2.9191 0.2351 CPTs 20 61.4075 3.0704 0.23886
68 2.8 2.7 2.8 2.0 WO1s 20 58 2.9 0.22303 Chiefs 20 58 2.9 0.22303
76 3.2 3.4 3.3 3.1 ANOVA ANOVA
79 2.8 2.6 2.6 2.3 Source of Variation SS df MS F P-value F crit Source of Variation SS df MS F P-value F crit
81 2.5 3.2 3.1 2.8 Between Groups 0.004 1 0.0037 0.01596 0.9 4.098 Between Groups 0.29 1 0.2903 1.2569 0.2693 4.0982
84 2.4 2.3 2.0 2.0 Within Groups 8.704 38 0.2291 Within Groups 8.776 38 0.2309
Total 8.708 39 Total 9.066 39
Anova: Single Factor Anova: Single Factor
SUMMARY SUMMARY
Groups Count Sum Average Variance Groups Count Sum Average Variance
LTs 20 58.3824 2.9191 0.2351 CPTs 20 61.4075 3.0704 0.23886
Chiefs 20 59.6472 2.9824 0.35265 Chiefs 20 59.6472 2.9824 0.35265
ANOVA ANOVA
Source of Variation SS df MS F P-value F crit Source of Variation SS df MS F P-value F crit
Between Groups 0.04 1 0.04 0.1361 0.714 4.098 Between Groups 0.077 1 0.0775 0.26193 0.6118 4.0982
Within Groups 11.17 38 0.2939 Within Groups 11.24 38 0.2958
Total 11.21 39 Total 11.32 39
LTs
Chiefs
CPTs
WO1s
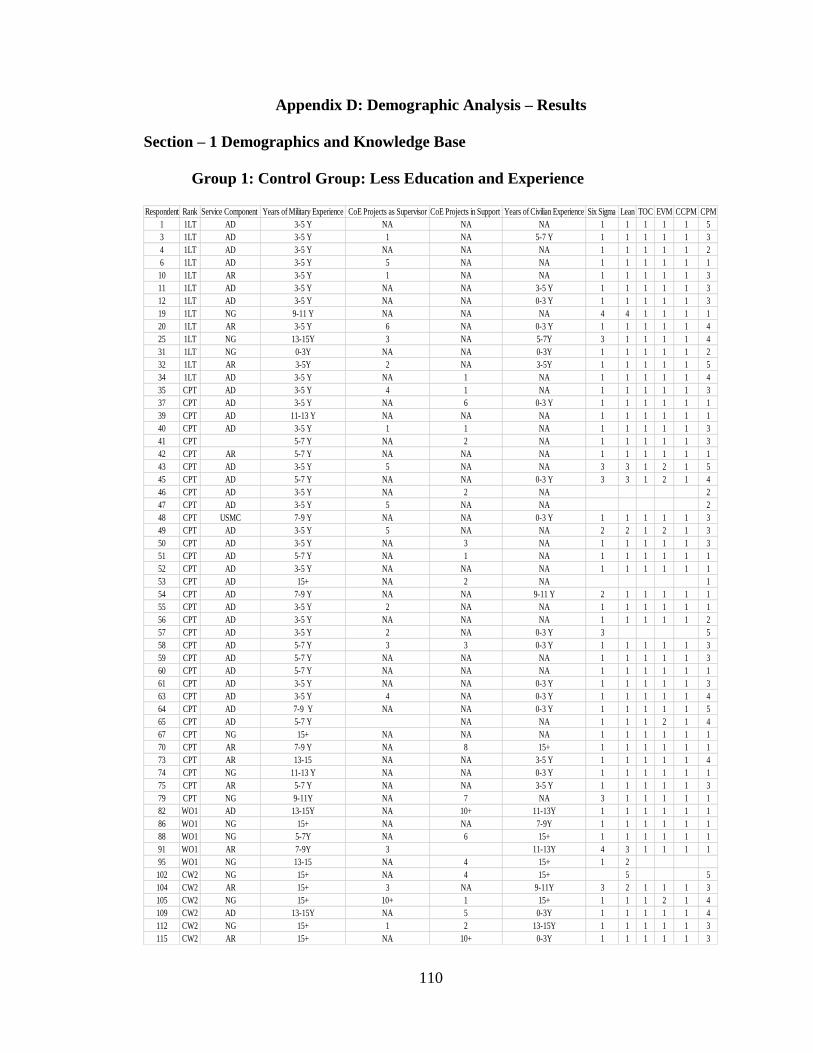
110
Appendix D: Demographic Analysis – Results
Section – 1 Demographics and Knowledge Base
Group 1: Control Group: Less Education and Experience
Respondent Rank Service Component Years of Military Experience CoE Projects as Supervisor CoE Projects in Support Years of Civilian Experience Six Sigma Lean TOC EVM CCPM CPM
1 1LT AD 3-5 Y NA NA NA 1 1 1 1 1 5
3 1LT AD 3-5 Y 1 NA 5-7 Y 1 1 1 1 1 3
4 1LT AD 3-5 Y NA NA NA 1 1 1 1 1 2
6 1LT AD 3-5 Y 5 NA NA 1 1 1 1 1 1
10 1LT AR 3-5 Y 1 NA NA 1 1 1 1 1 3
11 1LT AD 3-5 Y NA NA 3-5 Y 1 1 1 1 1 3
12 1LT AD 3-5 Y NA NA 0-3 Y 1 1 1 1 1 3
19 1LT NG 9-11 Y NA NA NA 4 4 1 1 1 1
20 1LT AR 3-5 Y 6 NA 0-3 Y 1 1 1 1 1 4
25 1LT NG 13-15Y 3 NA 5-7Y 3 1 1 1 1 4
31 1LT NG 0-3Y NA NA 0-3Y 1 1 1 1 1 2
32 1LT AR 3-5Y 2 NA 3-5Y 1 1 1 1 1 5
34 1LT AD 3-5 Y NA 1 NA 1 1 1 1 1 4
35 CPT AD 3-5 Y 4 1 NA 1 1 1 1 1 3
37 CPT AD 3-5 Y NA 6 0-3 Y 1 1 1 1 1 1
39 CPT AD 11-13 Y NA NA NA 1 1 1 1 1 1
40 CPT AD 3-5 Y 1 1 NA 1 1 1 1 1 3
41 CPT 5-7 Y NA 2 NA 1 1 1 1 1 3
42 CPT AR 5-7 Y NA NA NA 1 1 1 1 1 1
43 CPT AD 3-5 Y 5 NA NA 3 3 1 2 1 5
45 CPT AD 5-7 Y NA NA 0-3 Y 3 3 1 2 1 4
46 CPT AD 3-5 Y NA 2 NA 2
47 CPT AD 3-5 Y 5 NA NA 2
48 CPT USMC 7-9 Y NA NA 0-3 Y 1 1 1 1 1 3
49 CPT AD 3-5 Y 5 NA NA 2 2 1 2 1 3
50 CPT AD 3-5 Y NA 3 NA 1 1 1 1 1 3
51 CPT AD 5-7 Y NA 1 NA 1 1 1 1 1 1
52 CPT AD 3-5 Y NA NA NA 1 1 1 1 1 1
53 CPT AD 15+ NA 2 NA 1
54 CPT AD 7-9 Y NA NA 9-11 Y 2 1 1 1 1 1
55 CPT AD 3-5 Y 2 NA NA 1 1 1 1 1 1
56 CPT AD 3-5 Y NA NA NA 1 1 1 1 1 2
57 CPT AD 3-5 Y 2 NA 0-3 Y 3 5
58 CPT AD 5-7 Y 3 3 0-3 Y 1 1 1 1 1 3
59 CPT AD 5-7 Y NA NA NA 1 1 1 1 1 3
60 CPT AD 5-7 Y NA NA NA 1 1 1 1 1 1
61 CPT AD 3-5 Y NA NA 0-3 Y 1 1 1 1 1 3
63 CPT AD 3-5 Y 4 NA 0-3 Y 1 1 1 1 1 4
64 CPT AD 7-9 Y NA NA 0-3 Y 1 1 1 1 1 5
65 CPT AD 5-7 Y NA NA 1 1 1 2 1 4
67 CPT NG 15+ NA NA NA 1 1 1 1 1 1
70 CPT AR 7-9 Y NA 8 15+ 1 1 1 1 1 1
73 CPT AR 13-15 NA NA 3-5 Y 1 1 1 1 1 4
74 CPT NG 11-13 Y NA NA 0-3 Y 1 1 1 1 1 1
75 CPT AR 5-7 Y NA NA 3-5 Y 1 1 1 1 1 3
79 CPT NG 9-11Y NA 7 NA 3 1 1 1 1 1
82 WO1 AD 13-15Y NA 10+ 11-13Y 1 1 1 1 1 1
86 WO1 NG 15+ NA NA 7-9Y 1 1 1 1 1 1
88 WO1 NG 5-7Y NA 6 15+ 1 1 1 1 1 1
91 WO1 AR 7-9Y 3 11-13Y 4 3 1 1 1 1
95 WO1 NG 13-15 NA 4 15+ 1 2
102 CW2 NG 15+ NA 4 15+ 5 5
104 CW2 AR 15+ 3 NA 9-11Y 3 2 1 1 1 3
105 CW2 NG 15+ 10+ 1 15+ 1 1 1 2 1 4
109 CW2 AD 13-15Y NA 5 0-3Y 1 1 1 1 1 4
112 CW2 NG 15+ 1 2 13-15Y 1 1 1 1 1 3
115 CW2 AR 15+ NA 10+ 0-3Y 1 1 1 1 1 3

111
Group 2: Project Management Education
Respondent Rank Service Component Years of Military Experience CoE Projects as Supervisor CoE Projects in Support Years of Civilian Experience Six Sigma Lean TOC EVM CCPM CPM
7 1LT AD 3-5 NA NA NA 3 3 1 4 5 5
8 1LT AR 7-9 10+ 2 0-3 Y 4 4 2 3 5 5
9 1LT AD 3-5 NA NA 0-3 Y 3 4
13 1LT AD 3-5 2 2 NA 3 3 2 4 2 4
15 1LT AR 3-5 2 5-7 Y 1 1 3 5 4 5
17 1LT NG 13-15 2 5 5-7 Y 3 2 2 2 5 5
22 1LT NG 5-7 3 4 9-11 Y 3 3 4 3 5 5
24 1LT NG 7-9 10+ NA 3-5 Y 1 1 3 3 3
26 1LT NG 11-13 NA NA 3-5Y 2 5 1 1 3 5
27 1LT NG 5-7 10+ 10+ 11-13Y 1 1 3 2 3 5
28 1LT NG 7-9 NA NA 0-3Y 3 3 3 3 3 3
29 1LT AR 13-15 4 10+ 11-13Y 1 1 1 4 4 5
33 1LT AD 13-15 10+ 10+ 0-3Y 3 4 1 5 5 5
38 CPT AD 3-5 NA NA NA 1 1 1 1 2 2
44 CPT AD 5-7 NA NA 0-3 Y 1 1 2 2 5 5
62 CPT AD 5-7 6 4 0-3 Y 3 3 3
66 CPT AD 3-5 NA NA 0-3 Y 3 1 1 1 2 2
68 CPT NG 7-9 4 4 7-9 Y 3 3 3 5 5 5
69 CPT AR 13-15 3 3 NA 2 2 1 3 3 3
71 CPT AR 11-13 10+ 10+ 5-7 Y 4 4 3 1 1 5
76 CPT AR 5-7 3 NA NA 2 2 2 2 2 2
77 CPT NG 15+ 10+ 10+ 11-13Y 2 1 1 1 2 5
78 CPT 9-11 NA 3 0-3Y 2 2 4 4 3 5
81 CPT AD 3-5 NA 2 0-3Y 1 1 1 1 2 5
83 WO1 NG 9-11 1 NA 15+ 4 4 5
90 WO1 AR 7-9 NA NA 5-7Y 3 4 4 4 4 4
93 WO1 AD 13-15 5 5 7-9Y 1 2 4 4 4 4
96 WO1 AR 7-9 3 10+ 3-5Y 4 3 2 3 2 5
98 CW2 NG 15+ 10+ 10+ 9-11Y 1 1 1 3 3 5
100 CW2 NG 15+ 2 6 15+ 1 3 1 2 2 3
110 CW2 AD 15+ 2 5 NA 2 3 2 2 2 3
111 CW2 AD 13-15 NA 3 0-3Y 1 1 1 4 5 5
113 CW2 AD 11-13 10+ 10+ 0-3Y 1 1 1 2 2 4
114 CW2 AD 15+ 3 5 15+ 3 1 1 2 2 4

112
Section – 1 Demographics and Knowledge Base
Group 3: Project Management Experience
Respondent Rank Service Component Years of Military Experience CoE Projects as Supervisor CoE Projects in Support Years of Civilian Experience Six Sigma Lean TOC EVM CCPM CPM
2 1LT NG 5-7 10+ 5 0-3 Y 1 1 1 1 1 3
5 1LT AD 3-5 10+ 8 0-3 Y
8 1LT AR 7-9 10+ 2 0-3 Y 4 4 2 3 5 5
13 1LT AD 3-5 2 2 3 3 2 4 2 4
14 1LT AR 3-5 5 4 1 1 1 1 1 5
16 1LT NG 5-7 1 2 1 1 1 1 1 3
17 1LT NG 13-15 2 5 5-7 Y 3 2 2 2 5 5
18 1LT AR 9-11 3 4 0-3 Y 1 1 1 1 1 3
21 1LT NG 15+ 2 6 0-3 Y 1 1 1 1 1 1
22 1LT NG 5-7 3 4 9-11 Y 3 3 4 3 5 5
23 1LT NG 3-5 6 6 13-15 Y 1 1 1 2 1 5
27 1LT NG 5-7 10+ 10+ 11-13Y 1 1 3 2 3 5
29 1LT AR 13-15 4 10+ 11-13Y 1 1 1 4 4 5
30 1LT NG 3.-5 7 2 0-3Y 1 1 1 1 1 5
33 1LT AD 13-15 10+ 10+ 0-3Y 3 4 1 5 5 5
36 CPT AD 9-11 7 10+ 0-3 Y 2 2 1 3 1 5
62 CPT AD 5-7 6 4 0-3 Y 3 3 3
68 CPT NG 7-9 4 4 7-9 Y 3 3 3 5 5 5
69 CPT AR 13-15 3 3 2 2 1 3 3 3
71 CPT AR 11-13 10+ 10+ 5-7 Y 4 4 3 1 1 5
72 CPT NG 15+ 10+ 6 0-3 Y 1 1 1 1 1 1
80 CPT AR 9-11 4 4 0-3Y 1 1 1 1 1 1
84 WO1 AD 11-13 6 9 1 2 2 2 1 5
85 WO1 AD 11-13 5 5
87 WO1 AD 11-13 8 10+ 0-3Y 1 1 1 1 1 5
89 WO1 AR 15+ 4 10+ 0-3Y 3 3 1 1 1 4
92 WO1 NG 11-13 3 4 3-5Y 1 1 1 1 1 2
93 WO1 AD 13-15 5 5 7-9Y 1 2 4 4 4 4
94 WO1 AD 11-13 4 3 1 1 1 1 1 4
96 WO1 AR 7-9 3 10+ 3-5Y 4 3 2 3 2 5
97 WO1 NG 15+ 7 10+ 0-3 5
96 WO1 AR 7-9 3 10+ 3-5Y 4 3 2 3 2 5
97 WO1 NG 15+ 7 10+ 0-3 5
98 CW2 NG 15+ 10+ 10+ 9-11Y 1 1 1 3 3 5
99 CW2 AD 15+ 10+ 10+ 2 2 1 3 1 5
100 CW2 NG 15+ 2 6 15+ 1 3 1 2 2 3
101 CW2 NG 15+ 10+ 10+ 15+ 5 5
103 CW2 NG 15+ 10+ 10+ 15+ 1 1 1 1 1 4
106 CW2 AD 15+ 10+ 10+ 5-7Y 2 1 1 3 1 4
107 CW2 NG 15+ 10+ 10+ 15+ 1 1 1 1 1 5
108 CW2 AR 15+ 10+ 10+ 11-13Y 1 1 1 2 1 5
110 CW2 AD 15+ 2 5 2 3 2 2 2 3
113 CW2 AD 11-13 10+ 10+ 0-3Y 1 1 1 2 2 4
114 CW2 AD 15+ 3 5 15+ 3 1 1 2 2 4
116 CW2 AD 15+ 10+ 10+ 4
117 CW2 NG 15+ 10+ 10+ 9-11Y 3 2 1 3 1 4
119 CW3 AD 15+ 10+ 10+ 5-7Y 2 2 2 1 1 5

113
Section – 2: Project Planning Issues – Control Group
Resource Issues Scheduling Issues
Question Number> 1 2 6 8 9 10 13 14 15 16 17 21 22 24 25 3 4 5 7 11 12 18 19 23
Rank
1LT 2 5 3 3 1 2 2 3 4 3 2 1 1 2 2 4 4 3 3 3 1 1 2 1
1LT 2 2 1 1 1 1 1 1 1 2 1 1 1 1 1 1 2 1 1 1 2 2 1 1
1LT 1 4 1 2 3 1 5 2 4 2 1 3 1 1 1 2 1 1 2 2 1 1 1 1
1LT 5 4 3 4 3 4 3 4 2 4 3 1 4 3 4 3 4 3 3 2 4 4 2 4
1LT 4 4 3 4 3 4 3 4 5 4 2 2 3 4 2 3 3 3 4 4 2 2 2 3
1LT 4 3 2 4 2 5 2 4 4 4 3 5 4 3 2 3 5 3 4 4 2 3 1 5
1LT 2 2 2 4 1 1 1 1 1 4 2 1 1 1 4 3 2 2 1 4 1 3 2 1
1LT 4 4 4 4 1 4 4 3 4 4 2 2 3 2 2 3 4 3 3 4 2 2 3 2
1LT 3 3 1 5 1 2 5 1 4 1 1 1 1 3 1 1 3 4 5 4 1 3 1 1
1LT 2 3 4 5 3 4 5 4 4 5 3 3 3 3 3 3 2 4 5 4 4 3 3 3
1LT 4 3 2 3 2 2 3 2 3 3 3 2 3 3 2 2 3 1 2 4 2 2 2 2
1LT 3 4 5 5 1 2 3 4 4 4 3 3 2 1 2 5 4 3 4 5 1 2 3 4
1LT 4 3 4 4 2 3 3 2 4 3 4 3 4 4 3 3 3 3 4 4 2 4 4 3
CPT 3 2 2 4 2 2 2 2 2 5 2 5 3 3 3 5 5 3 2 3 2 4 4 2
CPT 1 1 1 1 1 1 1 1 1 1 4 3 2 1 1 1 1 1 1 1 1 2 1 2
CPT 1 1 1 3 3 3 5 5 4 4 5 3 3 3 5 1 1 1 3 3 3 4 4 3
CPT 1 2 2 3 2 2 1 1 1 1 1 1 2 1 1 1 3 1 1 2 3 3 1 2
CPT 2 2 4 3 1 1 2 4 3 1 1 3 1 1 1 3 2 4 1 1 1 3 1 2
CPT 5 5 2 4 2 3 4 2 2 4 3 3 2 3 3 2 3 3 2 2 2 2 3 4
CPT 5 3 1 4 1 1 2 5 3 3 4 3 2 2 1 2 2 1 1 3 1 2 1 1
CPT 2 1 4 3 1 3 2 3 3 3 3 2 2 3 3 1 1 2 4 4 1 1 2 3
CPT 4 2 1 4 1 4 3 2 3 2 1 2 2 2 1 3 5 2 2 3 2 1 4 3
CPT 3 3 4 3 2 1 2 2 3 3 3 2 1 2 3 4 4 2 2 2 1 2 1 1
CPT 4 4 2 3 1 2 4 2 5 4 1 4 2 1 1 4 3 3 2 3 3 1 2 1
CPT 4 5 2 4 1 3 5 2 2 3 3 1 1 1 4 2 1 2 2 4 3 1 2 2
CPT 4 2 4 3 1 1 4 2 2 2 2 2 2 2 2 2 2 3 1 3 1 1 1 2
CPT 4 4 2 2 2 2 3 2 2 5 2 4 2 2 4 3 4 4 2 3 1 4 5 2
CPT 3 2 4 4 2 3 4 4 4 2 3 3 4 2 3 3 3 2 3 4 1 3 3 2
CPT 1 1 2 1 3 1 1 1 1 2 1 2 3 4 2 1 1 1 1 2 1 2 1 3
CPT 3 1 5 5 5 3 4 2 4 5 5 5 1 3 1 2 3 5 3 5 1 1 1 3
CPT 3 3 1 2 1 3 1 1 1 1 1 1 1 1 1 4 5 1 1 5 1 1 1 1
CPT 3 2 4 2 3 2 3 3 3 3 2 3 2 2 3 3 3 2 3 2 2 1 2 3
CPT 1 2 1 4 2 5 1 2 2 5 5 3 1 3 3 5 4 2 1 1 1 3 3 3
CPT 1 1 2 3 1 3 2 1 2 1 1 3 1 1 2 1 1 2 2 3 1 1 2 1
CPT 3 3 4 3 3 4 3 4 4 3 3 3 3 3 3 3 3 4 4 3 3 3 3 3
CPT 4 4 4 3 3 2 2 4 4 2 1 1 2 1 3 4 3 3 4 4 1 1 2 1
CPT 2 1 2 3 2 2 2 2 3 3 5 3 3 2 3 3 2 4 2 3 1 3 2 2
CPT 1 2 1 4 1 3 1 1 4 4 4 2 3 4 2 1 2 1 1 2 1 2 3 2
CPT 5 5 5 5 1 5 5 4 3 5 4 2 4 3 4 4 1 3 2 4 2 5 5 4
CPT 5 5 5 5 1 3 5 2 2 5 2 5 3 5 5 5 5 5 3 5 1 2 3 3
CPT 4 5 5 3 3 2 5 5 5 2 3 3 3 4 4 4 4 3 3 4 2 3 3 3
CPT 3 4 4 2 2 5 5 2 2 5 1 2 1 1 5 5 5 4 5 5 1 1 2 5
CPT 4 3 4 2 4 3 4 4 2 4 2 3 2 4 3 3 2 2 2 3 3 4 3 3
CPT 3 2 2 3 1 3 3 3 3 3 2 3 3 3 3 2 3 3 2 2 2 3
CPT 4 4 2 3 3 3 1 1 2 3 3 5 3 1 1 4 2 2 3 4 1 2 5 2
CPT 5 5 5 2 3 3 2 2 2 5 2 3 2 5 5 5 5 5 5 1 1 2 2 2
WO1 1 1 1 1 1 5 3 3 4 5 1 5 5 5 5 1 1 2 3 1 1 1 3 1
WO1 3 2 3 4 1 1 3 2 1 4 2 3 1 4 1 3 3 1 1 2 2 1 1 1
WO1 3 4 2 4 3 1 4 1 1 3 2 1 2 3 4 2 3 2 2 1 2 3
WO1 2 3 4 4 2 2 3 4 4 3 4 2 2 3 4 3 3 2 4 4 3 2 2 3
WO1 2 1 4 3 3 4 4 3 4 2 1 1 2 1 3 2 2 3 3 4 3 2 4 2
CW2 1 1 1 1 1 2 1 4 2 5 1 1 1 2 2 1 1 1 1 2 1 3 2 2
CW2 3 3 3 4 3 3 3 4 4 4 5 2 3 4 4 5 4 4 3 4 3 3 2 3
CW2 2 2 1 2 2 2 2 1 2 4 3 4 3 3 3 3 3 3 1 2 2 3 3 3
CW2 3 1 3 4 1 3 5 5 4 3 1 1 2 3 5 1 1 1 4 5 2 1 3 2
CW2 2 2 2 3 2 3 1 2 3 4 3 2 2 3 3 2 2 2 2 3 1 2 3 2
CW2 3 3 3 3 2 2 3 4 4 3 2 3 2 1 2 3 3 2 3 3 2 1 2 2
Number of Respondents 57 57 57 57 57 57 57 57 57 57 57 56 57 55 56 57 57 57 57 57 57 57 57 57
Average 2.9 2.8 2.7 3.2 1.9 2.6 2.9 2.6 2.9 3.3 2.5 2.6 2.2 2.5 2.7 2.8 2.8 2.5 2.6 3.1 1.7 2.2 2.4 2.4
Standard Deviation 1.3 1.3 1.4 1.1 1.0 1.2 1.4 1.3 1.2 1.3 1.3 1.2 1.0 1.2 1.3 1.3 1.3 1.2 1.2 1.2 0.9 1.1 1.1 1.0
Section Average 2.7 Section Average 2.5
Standard Deviation 0.3 Standard Deviation 0.4
-1015406590
115140165190215240
-3 2 7
Section Distribution
-10
15
40
65
90
115
140
165
-3 2 7
Section Distribution

114
Section – 3: Project Execution Issues – Control Group
Resource Issues Scheduling Issues
Question Number> 26 27 31 33 35 37 44 46 47 48 28 29 30 32 34 36 38 39 40 41 42 43 45
Respondent Rank
1 1LT 5 5 1 3 1 3 1 1 1 4 5 3 3 2 2 2 3 1 2 2 2 1 1
3 1LT 1 1 2 1 1 1 1 1 1 1 1 1 1 1 1 1 1 2 1 1 1 1 1
4 1LT 5 5 4 5 1 2 1 3 1 1 3 1 1 4 2 1 1 4 1 1 5 2 1
6 1LT 4 4 4 3 4 4 4 4 5 4 3 5 3 5 4 2 4 4 5 4 3 3 4
10 1LT 5 4 4 4 3 4 3 3 4 2 4 3 4 2 4 2 4 3 2 3 4 4 3
11 1LT 4 4 5 4 4 3 4 5 5 4 3 4 4 3 4 4 4 3 2 4 4 3 5
12 1LT 2 2 4 3 1 1 3 1 1 1 2 2 2 4 2 1 3 2 3 2 2 2 1
19 1LT 4 4 3 4 4 4 3 3 2 2 4 4 3 3 4 4 4 4 3 3 3 3 3
20 1LT 1 5 5 1 1 1 1 1 1 1 3 3 5 1 1 1 1 5 1 2 4 3 1
25 1LT 4 4 4 5 3 4 3 1 2 3 4 4 4 2 4 4 5 3 3 3 5 3 3
31 1LT 2 3 2 3 2 2 3 3 3 3 2 2 1 2 2 3 2 3 3 2 2 1 2
32 1LT 4 4 5 3 5 3 1 2 4 1 5 5 5 5 2 3 2 4 3 1 1 3 5
34 1LT 4 4 4 4 4 3 3 2 3 4 3 4 3 4 3 4 4 4 3 2 4 3 4
35 CPT 3 2 3 3 3 1 2 2 2 2 5 5 2 2 2 1 4 5 2 5 2 5 2
37 CPT 1 1 1 1 1 1 2 3 1 1 1 1 1 1 1 2 1 3 1 1 1 2 2
39 CPT 3 4 4 4 4 5 5 4 5 4 4 4 4 4 4 5 5 4 4 5 5 3 4
40 CPT 1 2 3 1 1 2 2 1 1 1 1 1 2 2 1 1 3 2 1 1 1 2 1
41 CPT 2 1 3 1 1 3 1 1 2 1 1 1 3 1 2 1 2 3 1 1 1 1 1
42 CPT 4 4 3 2 5 4 2 5 2 3 3 4 2 5 3 2 3 4 3 4 2 5 4
43 CPT 2 1 4 1 2 3 2 2 4 1 1 3 1 1 1 1 1 5 2 1 2 3 1
45 CPT 4 5 4 3 3 4 4 2 3 3 3 2 3 1 4 1 4 4 4 4 4 4 1
46 CPT 3 2 5 4 4 3 4 4 5 2 4 4 4 2 1 4 3 4 4 3 5 3 3
47 CPT 3 4 3 4 2 2 1 1 4 4 4 4 2 2 3 2 4 4 4 2 3 2 2
48 CPT 4 5 2 1 2 4 2 3 4 2 4 4 2 1 3 1 1 5 2 2 3 1 1
49 CPT 4 5 3 4 2 2 1 1 1 4 2 2 2 3 4 2 3 3 2 1 1 2 2
50 CPT 3 1 3 3 2 1 1 4 2 1 1 3 2 1 3 1 3 3 2 2 2 4 1
51 CPT 5 3 5 4 4 3 3 2 2 4 2 2 2 2 4 1 3 3 4 3 2 2 1
52 CPT 4 4 3 5 4 2 3 2 4 2 3 4 2 4 4 1 2 2 3 3 4 5 3
53 CPT 2 2 2 2 3 2 4 4 3 3 2 1 1 2 2 3 2 3 4 3 3 3 4
54 CPT 1 1 5 2 5 1 5 1 3 3 3 5 1 3 5 3 2 5 1 3 3 5 1
55 CPT 5 5 5 2 1 1 1 1 1 5 4 5 3 1 1 1 4 1 1 3 1 1 2
56 CPT 3 3 4 4 4 2 5 2 4 3 3 2 3 4 3 2 3 4 3 3 3 4 2
57 CPT 1 1 1 1 3 1 1 1 1 1 5 5 3 3 3 4 1 5 3 1 1 4 1
58 CPT 3 2 1 4 2 2 2 3 1 1 2 2 2 1 2 2 3 2 3 4 3 3 3
59 CPT 4 3 4 5 4 3 5 3 4 3 4 4 4 4 4 2 5 4 3 4 4 4 4
60 CPT 5 4 4 4 2 5 1 4 1 2 3 5 4 4 2 1 2 5 2 2 3 1 1
61 CPT 2 1 3 3 3 2 4 3 3 2 2 2 1 3 4 3 2 2 4 4 2 4 2
63 CPT 2 2 4 4 4 4 3 1 5 3 2 3 2 4 2 1 4 3 3 4 4 1 4
64 CPT 4 3 4 4 5 2 3 4 4 3 4 4 4 4 4 3 5 5 4 4 3 4 4
65 CPT 5 5 5 5 4 4 4 1 4 5 5 5 4 5 5 1 5 5 5 2 4 3 1
67 CPT 4 2 2 3 3 3 2 3 2 2 3 3 2 2 2 2 1 2 2 4 3 3 3
70 CPT 2 2 1 1 1 1 5 2 2 1 2 2 1 1 1 1 1 1 1 2 5 2 2
73 CPT 4 2 3 4 2 4 4 3 3 2 3 1 5 3 3 2 3 4 3 4 2 4 5
74 CPT 2 2 3 3 3 2 3 2 3 2 3 4 3 2 2 3 4 3 3 4 4 4 3
75 CPT 4 4 2 3 3 1 5 3 2 1 4 2 2 3 3 4 1 1 2 3 3 2 5
79 CPT 4 4 4 5 3 3 3 2 4 2 4 4 4 4 4 2 2 4 2 3 3 4 3
82 WO1 2 2 4 3 1 3 1 1 5 5 2 2 3 1 4 1 5 1 5 4 4 1 1
86 WO1 4 1 1 2 3 1 2 1 1 1 3 2 1 3 2 1 4 1 1 1 2 3 1
88 WO1 3 2 2 2 2 4 2 3 3 2 2 3 4 2 3 2 4 2 3 2 4 3 4
91 WO1 3 3 4 3 3 2 2 2 4 3 4 4 4 4 4 2 4 3 2 2 2 2 3
95 WO1 3 3 2 3 1 4 5 3 3 2 3 2 4 2 3 2 5 5 3 3 4 4 4
102 CW2 1 1 2 2 1 1 2 1 1 1 1 1 1 1 1 1 2 2 1 1 1 2 1
104 CW2 4 4 4 4 4 3 4 3 3 3 4 4 4 3 4 4 4 3 4 4 4 3 3
105 CW2 3 3 4 2 4 2 2 3 2 1 4 4 3 2 2 2 3 1 1 2 2 5 3
109 CW2 5 5 4 3 3 3 4 1 4 4 5 5 3 2 3 1 5 5 3 3 3 2 3
112 CW2 2 2 3 2 2 1 1 3 3 3 2 3 3 2 2 1 2 3 3 3 2 2 3
115 CW2 4 4 3 3 3 3 3 2 3 2 3 3 2 3 3 1 3 3 3 2 3 2 3
Number of Respondents 57 57 57 57 57 57 57 57 57 57 57 57 57 57 57 57 57 57 57 57 57 57 57
Average 3.2 3.0 3.3 3.0 2.7 2.5 2.7 2.3 2.8 2.4 3.0 3.1 2.7 2.6 2.8 2.0 3.0 3.2 2.6 2.7 2.9 2.8 2.5
Standard Deviation 1.3 1.4 1.2 1.2 1.3 1.2 1.3 1.2 1.3 1.2 1.2 1.3 1.2 1.3 1.1 1.1 1.3 1.3 1.1 1.2 1.2 1.2 1.3
Section Average 2.9 Section Average 2.8
Standard Deviation 0.3 Standard Deviation 0.3
-10
15
40
65
90
115
140
165
-3 2 7
Section Distribution
-1015406590
115140165190215
-3 2 7
Section Distribution
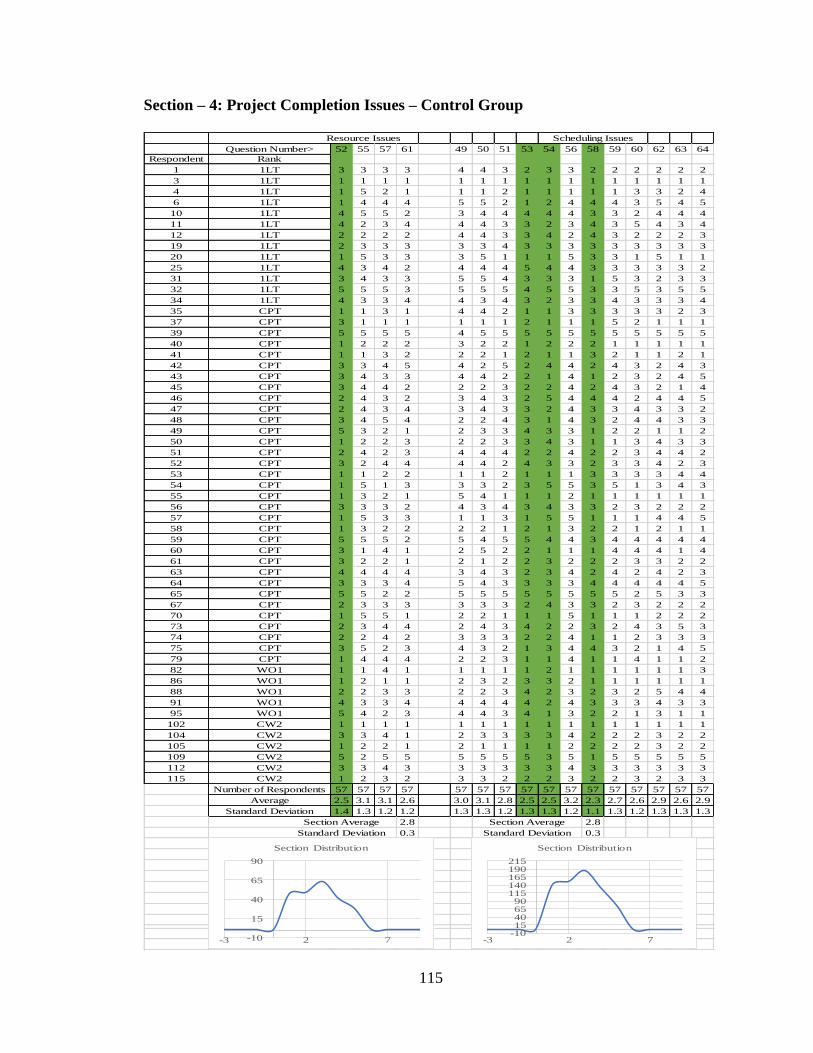
115
Section – 4: Project Completion Issues – Control Group
Resource Issues Scheduling Issues
Question Number> 52 55 57 61 49 50 51 53 54 56 58 59 60 62 63 64
Respondent Rank
1 1LT 3 3 3 3 4 4 3 2 3 3 2 2 2 2 2 2
3 1LT 1 1 1 1 1 1 1 1 1 1 1 1 1 1 1 1
4 1LT 1 5 2 1 1 1 2 1 1 1 1 1 3 3 2 4
6 1LT 1 4 4 4 5 5 2 1 2 4 4 4 3 5 4 5
10 1LT 4 5 5 2 3 4 4 4 4 4 3 3 2 4 4 4
11 1LT 4 2 3 4 4 4 3 3 2 3 4 3 5 4 3 4
12 1LT 2 2 2 2 4 4 3 3 4 2 4 3 2 2 2 3
19 1LT 2 3 3 3 3 3 4 3 3 3 3 3 3 3 3 3
20 1LT 1 5 3 3 3 5 1 1 1 5 3 3 1 5 1 1
25 1LT 4 3 4 2 4 4 4 5 4 4 3 3 3 3 3 2
31 1LT 3 4 3 3 5 5 4 3 3 3 1 5 3 2 3 3
32 1LT 5 5 5 3 5 5 5 4 5 5 3 3 5 3 5 5
34 1LT 4 3 3 4 4 3 4 3 2 3 3 4 3 3 3 4
35 CPT 1 1 3 1 4 4 2 1 1 3 3 3 3 3 2 3
37 CPT 3 1 1 1 1 1 1 2 1 1 1 5 2 1 1 1
39 CPT 5 5 5 5 4 5 5 5 5 5 5 5 5 5 5 5
40 CPT 1 2 2 2 3 2 2 1 2 2 2 1 1 1 1 1
41 CPT 1 1 3 2 2 2 1 2 1 1 3 2 1 1 2 1
42 CPT 3 3 4 5 4 2 5 2 4 4 2 4 3 2 4 3
43 CPT 3 4 3 3 4 4 2 2 1 4 1 2 3 2 4 5
45 CPT 3 4 4 2 2 2 3 2 2 4 2 4 3 2 1 4
46 CPT 2 4 3 2 3 4 3 2 5 4 4 4 2 4 4 5
47 CPT 2 4 3 4 3 4 3 3 2 4 3 3 4 3 3 2
48 CPT 3 4 5 4 2 2 4 3 1 4 3 2 4 4 3 3
49 CPT 5 3 2 1 2 3 3 4 3 3 1 2 2 1 1 2
50 CPT 1 2 2 3 2 2 3 3 4 3 1 1 3 4 3 3
51 CPT 2 4 2 3 4 4 4 2 2 4 2 2 3 4 4 2
52 CPT 3 2 4 4 4 4 2 4 3 3 2 3 3 4 2 3
53 CPT 1 1 2 2 1 1 2 1 1 1 3 3 3 3 4 4
54 CPT 1 5 1 3 3 3 2 3 5 5 3 5 1 3 4 3
55 CPT 1 3 2 1 5 4 1 1 1 2 1 1 1 1 1 1
56 CPT 3 3 3 2 4 3 4 3 4 3 3 2 3 2 2 2
57 CPT 1 5 3 3 1 1 3 1 5 5 1 1 1 4 4 5
58 CPT 1 3 2 2 2 2 1 2 1 3 2 2 1 2 1 1
59 CPT 5 5 5 2 5 4 5 5 4 4 3 4 4 4 4 4
60 CPT 3 1 4 1 2 5 2 2 1 1 1 4 4 4 1 4
61 CPT 3 2 2 1 2 1 2 2 3 2 2 2 3 3 2 2
63 CPT 4 4 4 4 3 4 3 2 3 4 2 4 2 4 2 3
64 CPT 3 3 3 4 5 4 3 3 3 3 4 4 4 4 4 5
65 CPT 5 5 2 2 5 5 5 5 5 5 5 5 2 5 3 3
67 CPT 2 3 3 3 3 3 3 2 4 3 3 2 3 2 2 2
70 CPT 1 5 5 1 2 2 1 1 1 5 1 1 1 2 2 2
73 CPT 2 3 4 4 2 4 3 4 2 2 3 2 4 3 5 3
74 CPT 2 2 4 2 3 3 3 2 2 4 1 1 2 3 3 3
75 CPT 3 5 2 3 4 3 2 1 3 4 4 3 2 1 4 5
79 CPT 1 4 4 4 2 2 3 1 1 4 1 1 4 1 1 2
82 WO1 1 1 4 1 1 1 1 1 2 1 1 1 1 1 1 3
86 WO1 1 2 1 1 2 3 2 3 3 2 1 1 1 1 1 1
88 WO1 2 2 3 3 2 2 3 4 2 3 2 3 2 5 4 4
91 WO1 4 3 3 4 4 4 4 4 2 4 3 3 3 4 3 3
95 WO1 5 4 2 3 4 4 3 4 1 3 2 2 1 3 1 1
102 CW2 1 1 1 1 1 1 1 1 1 1 1 1 1 1 1 1
104 CW2 3 3 4 1 2 3 3 3 3 4 2 2 2 3 2 2
105 CW2 1 2 2 1 2 1 1 1 1 2 2 2 2 3 2 2
109 CW2 5 2 5 5 5 5 5 5 3 5 1 5 5 5 5 5
112 CW2 3 3 4 3 3 3 3 3 3 4 3 3 3 3 3 3
115 CW2 1 2 3 2 3 3 2 2 2 3 2 2 3 2 3 3
Number of Respondents 57 57 57 57 57 57 57 57 57 57 57 57 57 57 57 57
Average 2.5 3.1 3.1 2.6 3.0 3.1 2.8 2.5 2.5 3.2 2.3 2.7 2.6 2.9 2.6 2.9
Standard Deviation 1.4 1.3 1.2 1.2 1.3 1.3 1.2 1.3 1.3 1.2 1.1 1.3 1.2 1.3 1.3 1.3
Section Average 2.8 Section Average 2.8
Standard Deviation 0.3 Standard Deviation 0.3
-10
15
40
65
90
-3 2 7
Section Distribution
-1015406590
115140165190215
-3 2 7
Section Distribution

116
Section – 5: Project Solutions – Control Group
CPM CCPM
Question Number> 65 69 70 71 72 73 74 75 77 78 80 82 83 66 67 68 76 79 81 84
Respondent Rank
1 1LT 5 3 1 5 1 1 1 3 5 2 2 3 1 5 4 2 3 1 3 1
3 1LT 4 3 3 2 2 3 3 1 4 2 3 3 2 2 4 4 3 2 2 2
4 1LT 4 2 1 5 3 3 3 1 4 2 4 3 1 1 4 4 4 4 3 1
6 1LT 5 4 5 3 5 4 3 4 5 3 5 3 1 3 4 5 5 4 3 3
10 1LT 3 4 2 4 1 3 3 3 3 1 4 2 1 2 5 3 4 3 2 4
11 1LT 4 2 1 3 3 5 1 1 3 3 4 2 1 1 3 4 2 3 2 1
12 1LT 5 2 2 4 1 1 2 2 3 4 2 3 2 3 3 2 2 2 1 1
19 1LT 2 2 2 2 4 2 2 3 2 3 3 4 4 2 2 4 2 3 4 1
20 1LT 5 3 3 5 4 4 3 4 3 1 4 5 2 2 5 2 5 1 2 1
25 1LT 3 2 2 4 5 3 2 2 3 2 3 3 2 3 3 4 3 2 2 2
31 1LT 3 4 2 4 2 2 2 3 4 2 2 2 2 2 3 4 4 2 2 2
32 1LT 1 1 1 5 5 1 3 1 1 5 4 5 4 5 3 1 1 3 5 5
34 1LT 3 4 3 3 4 2 3 4 3 3 3 4 3 4 2 3 4 4 2 4
35 CPT 5 3 3 4 2 4 3 5 3 3 3 3 5 3 5 1 4 1 1 1
37 CPT 1 3 2 4 1 2 1 3 2 1 5 4 1 1 4 3 2 1 5 1
39 CPT 5 3 4 4 4 3 4 4 4 5 3 5 5 3 4 2 5 5 4 5
40 CPT 3 3 4 4 4 3 2 3 4 1 3 3 2 1 2 3 3 2 4 1
41 CPT 4 2 4 4 2 3 3 1 4 2 3 2 1 3 5 4 5 3 3 1
42 CPT 5 3 2 2 4 5 3 5 3 3 5 2 3 3 4 2 4 4 5 4
43 CPT 4 3 1 4 1 3 4 4 5 1 4 3 4 3 4 2 3 1 4 1
45 CPT 2 2 1 5 1 5 2 2 5 1 4 1 1 2 4 5 2 2 4 1
46 CPT 1 2 3 3 1 4 4 2 3 2 2 4 1 2 3 2 3 4 4 3
47 CPT 3 5 2 5 1 4 1 3 5 1 2 2 2 2 4 2 4 2 3 1
48 CPT 3 4 2 4 2 2 2 4 5 2 3 4 4 4 4 2 4 2 4 3
49 CPT 2 3 1 5 2 4 2 3 3 4 3 4 1 2 5 2 4 4 2 4
50 CPT 4 2 2 4 3 3 4 4 5 4 4 4 4 4 4 2 4 3 4 3
51 CPT 4 3 2 4 1 5 4 4 3 4 5 5 5 2 4 4 3 4 1 1
52 CPT 3 2 3 3 2 3 3 3 3 2 4 3 3 4 3 2 3 2 3 1
53 CPT 4 4 4 5 3 2 3 3 4 4 5 3 2 4 3 2 3 2 3 4
54 CPT 2 3 5 5 2 4 3 5 4 5 5 5 4 5 2 4 5 5 4 4
55 CPT 5 2 2 5 2 4 4 4 4 1 4 4 2 2 4 2 5 2 4 1
56 CPT 4 3 2 5 3 2 2 4 4 2 4 4 2 4 3 2 4 2 2 2
57 CPT 5 5 4 4 5 5 5 5 5 1 5 4 3 5 4 3 4 1 5 1
58 CPT 3 3 3 4 2 4 3 4 4 2 4 4 3 3 3 4 3 3 2 1
59 CPT 5 3 4 3 2 3 2 3 5 2 5 3 3 3 3 5 3 3 4 2
60 CPT 5 4 2 5 4 5 4 5 4 4 5 4 1 2 5 2 4 1 1 1
61 CPT 4 3 3 3 2 2 4 3 4 2 2 3 4 3 3 5 3 3 4 3
63 CPT 4 1 2 4 2 2 4 4 4 1 4 3 1 2 2 1 3 1 1 1
64 CPT 5 4 5 3 5 3 5 5 4 4 4 4 5 3 5 5 4 4 5 5
65 CPT 5 3 3 5 1 5 5 3 5 5 5 5 5 1 4 5 4 5 4 1
67 CPT 3 3 3 3 5 5 4 3 4 4 4 2 1 3 2 3 3 2 2 2
70 CPT 1 1 1 1 5 5 1 1 1 1 1 5 1 1 1 1 3 1 1 1
73 CPT 4 5 1 3 3 2 4 4 2 4 4 3 2 2 4 2 2 2 3 5
74 CPT 4 2 2 4 3 2 2 4 5 3 4 4 1 3 4 2 3 3 3 2
75 CPT 4 1 3 2 5 4 2 3 4 3 2 2 1 1 3 4 2 1 3 4
79 CPT 5 5 4 3 1 5 3 3 5 2 5 1 4 3 4 2 4 2 3 5
82 WO1 1 3 3 1 5 3 1 5 3 3 5 4 1 1 1 1 5 1 3 1
86 WO1 2 1 1 3 3 4 2 3 2 1 3 2 2 1 2 3 2 4 3 1
88 WO1 5 4 2 4 2 3 1 3 4 2 3 2 4 3 4 3 3 4 2 2
91 WO1 4 4 3 4 3 3 3 4 4 2 3 4 3 3 4 2 4 2 2 3
95 WO1 3 4 1 3 2 2 2 2 4 2 5 2 3 2 2 3 2 2 3 2
102 CW2 5 3 3 2 2 4 5 5 2 1 3 5 5 1 3 1 3 2 3 2
104 CW2 1 4 4 3 2 2 4 4 2 3 4 2 4 3 2 2 2 3 2 1
105 CW2 4 4 4 2 2 2 4 3 1 2 2 1 2 4 1 3 4 3 4
109 CW2 2 3 3 4 2 3 3 3 5 2 3 2 4 2 4 3 4 4 3 1
112 CW2 5 2 2 2 4 3 3 5 3 4 4 3 4 4 4 1 3 3 3 1
115 CW2 4 3 3 5 3 4 4 4 4 3 4 3 3 3 4 3 3 2 3 2
Number of Respondents 57 57 57 57 56 57 57 57 57 57 57 57 57 57 57 57 57 57 57 57
Average 3.6 3.0 2.6 3.6 2.8 3.2 2.9 3.3 3.6 2.5 3.6 3.2 2.6 2.6 3.5 2.8 3.4 2.6 2.9 2.2
Standard Deviation 1.3 1.1 1.1 1.1 1.4 1.2 1.1 1.2 1.1 1.2 1.0 1.1 1.4 1.1 1.0 1.2 1.0 1.2 1.1 1.4
Section Average 3.1 Section Average 2.8
Standard Deviation 0.4 Standard Deviation 0.4
-1015406590
115140165190215
-3 2 7
Section Distribution
-10
15
40
65
90
115
-3 2 7
Section Distribution
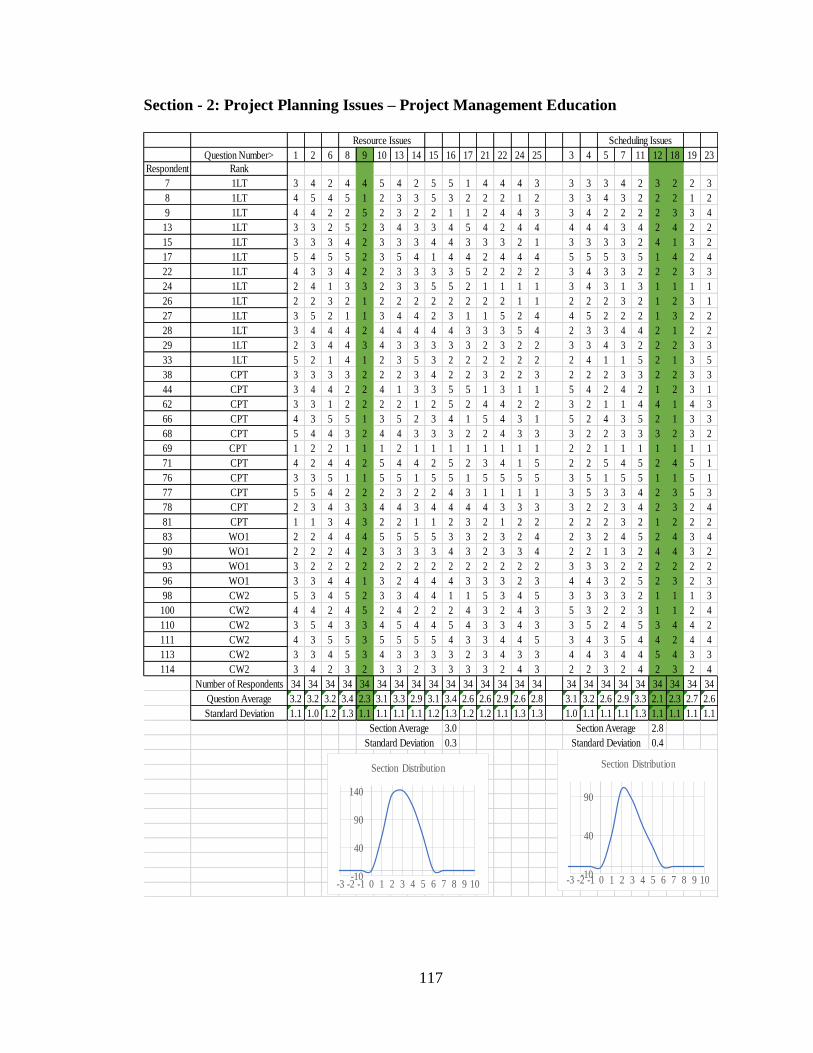
117
Section - 2: Project Planning Issues – Project Management Education
Resource Issues Scheduling Issues
Question Number> 1 2 6 8 9 10 13 14 15 16 17 21 22 24 25 3 4 5 7 11 12 18 19 23
Respondent Rank
7 1LT 3 4 2 4 4 5 4 2 5 5 1 4 4 4 3 3 3 3 4 2 3 2 2 3
8 1LT 4 5 4 5 1 2 3 3 5 3 2 2 2 1 2 3 3 4 3 2 2 2 1 2
9 1LT 4 4 2 2 5 2 3 2 2 1 1 2 4 4 3 3 4 2 2 2 2 3 3 4
13 1LT 3 3 2 5 2 3 4 3 3 4 5 4 2 4 4 4 4 4 3 4 2 4 2 2
15 1LT 3 3 3 4 2 3 3 3 4 4 3 3 3 2 1 3 3 3 3 2 4 1 3 2
17 1LT 5 4 5 5 2 3 5 4 1 4 4 2 4 4 4 5 5 5 3 5 1 4 2 4
22 1LT 4 3 3 4 2 2 3 3 3 3 5 2 2 2 2 3 4 3 3 2 2 2 3 3
24 1LT 2 4 1 3 3 2 3 3 5 5 2 1 1 1 1 3 4 3 1 3 1 1 1 1
26 1LT 2 2 3 2 1 2 2 2 2 2 2 2 2 1 1 2 2 2 3 2 1 2 3 1
27 1LT 3 5 2 1 1 3 4 4 2 3 1 1 5 2 4 4 5 2 2 2 1 3 2 2
28 1LT 3 4 4 4 2 4 4 4 4 4 3 3 3 5 4 2 3 3 4 4 2 1 2 2
29 1LT 2 3 4 4 3 4 3 3 3 3 3 2 3 2 2 3 3 4 3 2 2 2 3 3
33 1LT 5 2 1 4 1 2 3 5 3 2 2 2 2 2 2 2 4 1 1 5 2 1 3 5
38 CPT 3 3 3 3 2 2 2 3 4 2 2 3 2 2 3 2 2 2 3 3 2 2 3 3
44 CPT 3 4 4 2 2 4 1 3 3 5 5 1 3 1 1 5 4 2 4 2 1 2 3 1
62 CPT 3 3 1 2 2 2 2 1 2 5 2 4 4 2 2 3 2 1 1 4 4 1 4 3
66 CPT 4 3 5 5 1 3 5 2 3 4 1 5 4 3 1 5 2 4 3 5 2 1 3 3
68 CPT 5 4 4 3 2 4 4 3 3 3 2 2 4 3 3 3 2 2 3 3 3 2 3 2
69 CPT 1 2 2 1 1 1 2 1 1 1 1 1 1 1 1 2 2 1 1 1 1 1 1 1
71 CPT 4 2 4 4 2 5 4 4 2 5 2 3 4 1 5 2 2 5 4 5 2 4 5 1
76 CPT 3 3 5 1 1 5 5 1 5 5 1 5 5 5 5 3 5 1 5 5 1 1 5 1
77 CPT 5 5 4 2 2 2 3 2 2 4 3 1 1 1 1 3 5 3 3 4 2 3 5 3
78 CPT 2 3 4 3 3 4 4 3 4 4 4 4 3 3 3 3 2 2 3 4 2 3 2 4
81 CPT 1 1 3 4 3 2 2 1 1 2 3 2 1 2 2 2 2 2 3 2 1 2 2 2
83 WO1 2 2 4 4 4 5 5 5 5 3 3 2 3 2 4 2 3 2 4 5 2 4 3 4
90 WO1 2 2 2 4 2 3 3 3 3 4 3 2 3 3 4 2 2 1 3 2 4 4 3 2
93 WO1 3 2 2 2 2 2 2 2 2 2 2 2 2 2 2 3 3 3 2 2 2 2 2 2
96 WO1 3 3 4 4 1 3 2 4 4 4 3 3 3 2 3 4 4 3 2 5 2 3 2 3
98 CW2 5 3 4 5 2 3 3 4 4 1 1 5 3 4 5 3 3 3 3 2 1 1 1 3
100 CW2 4 4 2 4 5 2 4 2 2 2 4 3 2 4 3 5 3 2 2 3 1 1 2 4
110 CW2 3 5 4 3 3 4 5 4 4 5 4 3 3 4 3 3 5 2 4 5 3 4 4 2
111 CW2 4 3 5 5 3 5 5 5 5 4 3 3 4 4 5 3 4 3 5 4 4 2 4 4
113 CW2 3 3 4 5 3 4 3 3 3 3 2 3 4 3 3 4 4 3 4 4 5 4 3 3
114 CW2 3 4 2 3 2 3 3 2 3 3 3 3 2 4 3 2 2 3 2 4 2 3 2 4
Number of Respondents 34 34 34 34 34 34 34 34 34 34 34 34 34 34 34 34 34 34 34 34 34 34 34 34
Question Average 3.2 3.2 3.2 3.4 2.3 3.1 3.3 2.9 3.1 3.4 2.6 2.6 2.9 2.6 2.8 3.1 3.2 2.6 2.9 3.3 2.1 2.3 2.7 2.6
Standard Deviation 1.1 1.0 1.2 1.3 1.1 1.1 1.1 1.1 1.2 1.3 1.2 1.2 1.1 1.3 1.3 1.0 1.1 1.1 1.1 1.3 1.1 1.1 1.1 1.1
Section Average 3.0 Section Average 2.8
Standard Deviation 0.3 Standard Deviation 0.4
-10
40
90
140
-3 -2 -1 0 1 2 3 4 5 6 7 8 9 10
Section Distribution
-10
40
90
-3 -2 -1 0 1 2 3 4 5 6 7 8 9 10
Section Distribution
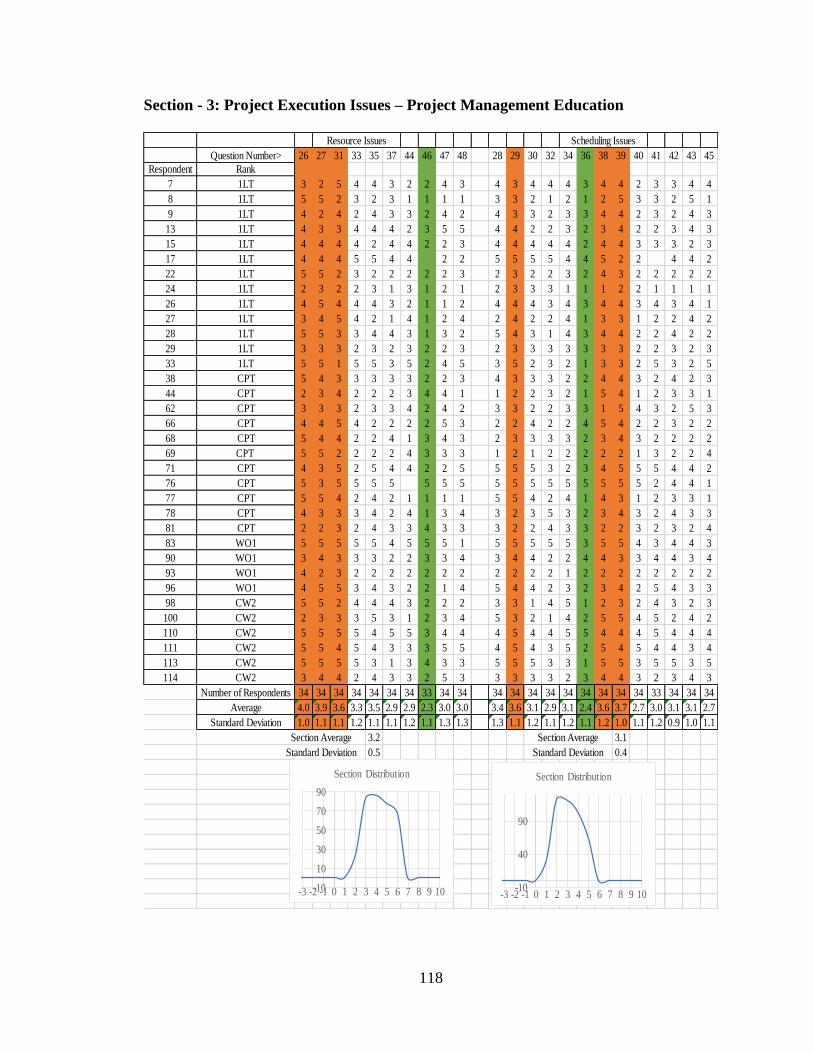
118
Section - 3: Project Execution Issues – Project Management Education
Resource Issues Scheduling Issues
Question Number> 26 27 31 33 35 37 44 46 47 48 28 29 30 32 34 36 38 39 40 41 42 43 45
Respondent Rank
7 1LT 3 2 5 4 4 3 2 2 4 3 4 3 4 4 4 3 4 4 2 3 3 4 4
8 1LT 5 5 2 3 2 3 1 1 1 1 3 3 2 1 2 1 2 5 3 3 2 5 1
9 1LT 4 2 4 2 4 3 3 2 4 2 4 3 3 2 3 3 4 4 2 3 2 4 3
13 1LT 4 3 3 4 4 4 2 3 5 5 4 4 2 2 3 2 3 4 2 2 3 4 3
15 1LT 4 4 4 4 2 4 4 2 2 3 4 4 4 4 4 2 4 4 3 3 3 2 3
17 1LT 4 4 4 5 5 4 4 2 2 5 5 5 5 4 4 5 2 2 4 4 2
22 1LT 5 5 2 3 2 2 2 2 2 3 2 3 2 2 3 2 4 3 2 2 2 2 2
24 1LT 2 3 2 2 3 1 3 1 2 1 2 3 3 3 1 1 1 2 2 1 1 1 1
26 1LT 4 5 4 4 4 3 2 1 1 2 4 4 4 3 4 3 4 4 3 4 3 4 1
27 1LT 3 4 5 4 2 1 4 1 2 4 2 4 2 2 4 1 3 3 1 2 2 4 2
28 1LT 5 5 3 3 4 4 3 1 3 2 5 4 3 1 4 3 4 4 2 2 4 2 2
29 1LT 3 3 3 2 3 2 3 2 2 3 2 3 3 3 3 3 3 3 2 2 3 2 3
33 1LT 5 5 1 5 5 3 5 2 4 5 3 5 2 3 2 1 3 3 2 5 3 2 5
38 CPT 5 4 3 3 3 3 3 2 2 3 4 3 3 3 2 2 4 4 3 2 4 2 3
44 CPT 2 3 4 2 2 2 3 4 4 1 1 2 2 3 2 1 5 4 1 2 3 3 1
62 CPT 3 3 3 2 3 3 4 2 4 2 3 3 2 2 3 3 1 5 4 3 2 5 3
66 CPT 4 4 5 4 2 2 2 2 5 3 2 2 4 2 2 4 5 4 2 2 3 2 2
68 CPT 5 4 4 2 2 4 1 3 4 3 2 3 3 3 3 2 3 4 3 2 2 2 2
69 CPT 5 5 2 2 2 2 4 3 3 3 1 2 1 2 2 2 2 2 1 3 2 2 4
71 CPT 4 3 5 2 5 4 4 2 2 5 5 5 5 3 2 3 4 5 5 5 4 4 2
76 CPT 5 3 5 5 5 5 5 5 5 5 5 5 5 5 5 5 5 5 2 4 4 1
77 CPT 5 5 4 2 4 2 1 1 1 1 5 5 4 2 4 1 4 3 1 2 3 3 1
78 CPT 4 3 3 3 4 2 4 1 3 4 3 2 3 5 3 2 3 4 3 2 4 3 3
81 CPT 2 2 3 2 4 3 3 4 3 3 3 2 2 4 3 3 2 2 3 2 3 2 4
83 WO1 5 5 5 5 5 4 5 5 5 1 5 5 5 5 5 3 5 5 4 3 4 4 3
90 WO1 3 4 3 3 3 2 2 3 3 4 3 4 4 2 2 4 4 3 3 4 4 3 4
93 WO1 4 2 3 2 2 2 2 2 2 2 2 2 2 2 1 2 2 2 2 2 2 2 2
96 WO1 4 5 5 3 4 3 2 2 1 4 5 4 4 2 3 2 3 4 2 5 4 3 3
98 CW2 5 5 2 4 4 4 3 2 2 2 3 3 1 4 5 1 2 3 2 4 3 2 3
100 CW2 2 3 3 3 5 3 1 2 3 4 5 3 2 1 4 2 5 5 4 5 2 4 2
110 CW2 5 5 5 5 4 5 5 3 4 4 4 5 4 4 5 5 4 4 4 5 4 4 4
111 CW2 5 5 4 5 4 3 3 3 5 5 4 5 4 3 5 2 5 4 5 4 4 3 4
113 CW2 5 5 5 5 3 1 3 4 3 3 5 5 5 3 3 1 5 5 3 5 5 3 5
114 CW2 3 4 4 2 4 3 3 2 5 3 3 3 3 3 2 3 4 4 3 2 3 4 3
Number of Respondents 34 34 34 34 34 34 34 33 34 34 34 34 34 34 34 34 34 34 34 33 34 34 34
Average 4.0 3.9 3.6 3.3 3.5 2.9 2.9 2.3 3.0 3.0 3.4 3.6 3.1 2.9 3.1 2.4 3.6 3.7 2.7 3.0 3.1 3.1 2.7
Standard Deviation 1.0 1.1 1.1 1.2 1.1 1.1 1.2 1.1 1.3 1.3 1.3 1.1 1.2 1.1 1.2 1.1 1.2 1.0 1.1 1.2 0.9 1.0 1.1
Section Average 3.2 Section Average 3.1
Standard Deviation 0.5 Standard Deviation 0.4
-10
10
30
50
70
90
-3 -2 -1 0 1 2 3 4 5 6 7 8 9 10
Section Distribution
-10
40
90
-3 -2 -1 0 1 2 3 4 5 6 7 8 9 10
Section Distribution

119
Section - 4: Project Completion Issues – Project Management Education
Resource Issues Scheduling Issues
Question Number> 52 55 57 61 49 50 51 53 54 56 58 59 60 62 63 64
Respondent Rank
7 1LT 3 4 4 4 3 3 2 3 2 4 3 3 4 4 4 4
8 1LT 1 4 4 4 4 5 3 1 1 4 1 1 2 4 3 3
9 1LT 1 3 3 3 3 3 2 1 3 3 3 3 4 3 3 3
13 1LT 2 4 4 4 4 3 4 2 4 4 3 2 4 4 5 5
15 1LT 4 4 4 2 5 5 4 4 3 4 3 2 3 4 4 4
17 1LT 2 4 4 4 4 4 4 4 2 4 4 4 4 5 5 4
22 1LT 4 2 2 4 5 5 4 4 3 3 2 2 4 4 2 2
24 1LT 1 4 1 1 2 2 1 1 4 4 2 2 1 5 1 3
26 1LT 5 3 4 4 4 5 3 5 3 4 3 3 3 2 3 4
27 1LT 4 2 2 1 5 5 5 5 5 4 2 2 4 5 3 2
28 1LT 3 3 3 3 4 4 3 2 2 3 2 3 2 2 2 3
29 1LT 3 3 3 3 3 2 3 3 2 3 3 3 2 2 3 3
33 1LT 5 3 1 1 3 5 5 2 1 4 1 1 2 3 5 5
38 CPT 4 4 2 3 4 3 4 2 2 3 2 3 3
44 CPT 4 3 4 3 3 3 3 4 2 4 2 2 2 3 1 1
62 CPT 1 3 2 3 4 4 3 4 3 3 1 1 2 3 3 5
66 CPT 4 1 3 5 5 5 2 5 4 5 1 1 3 5 3 5
68 CPT 3 3 2 3 3 3 4 4 4 4 4 2 3 3 2 2
69 CPT 5 3 3 2 4 4 1 4 2 3 2 2 1 2 1 1
71 CPT 3 5 3 4 4 5 2 5 5 5 5 5 2 4 2 2
76 CPT 4 1 1 2 1 1 1 5 5 5 1 3 4 5 1 1
77 CPT 5 4 4 4 4 4 5 5 1 4 2 4 4 2 2 4
78 CPT 3 4 5 2 4 2 3 2 4 4 4 3 3 4 4 2
81 CPT 2 2 2 2 3 2 3 2 2 2 2 2 3 3 2 2
83 WO1 5 5 5 5 5 5 5 5 4 5 4 3 3 5 1 5
90 WO1 4 3 4 4 4 4 3 3 3 4 3 2 3 3 3 3
93 WO1 1 2 1 2 2 1 2 1 3 2 1 2 2 2 2 2
96 WO1 2 4 4 3 5 3 4 3 2 5 3 2 4 5 4 5
98 CW2 2 3 3 2 3 5 4 3 2 3 2 2 2 2 2 2
100 CW2 3 5 5 4 3 5 4 4 4 5 3 3 5 4 4 5
110 CW2 5 4 5 5 5 5 5 5 3 5 4 4 4 4 4 3
111 CW2 3 2 3 2 3 4 5 4 2 5 4 3 4 4 4 5
113 CW2 5 4 4 3 5 4 3 5 3 4 2 5 4 5 5 5
114 CW2 3 4 3 3 4 4 3 4 4 4 2 2 3 3 2 3
Number of Respondents 34 34 34 34 34 34 34 34 34 34 34 34 34 34 34 34
Average 3.2 3.3 3.2 3.0 3.7 3.8 3.3 3.5 2.9 3.9 2.5 2.5 3.0 3.5 2.9 3.3
Standard Deviation 1.4 1.0 1.2 1.1 1.0 1.2 1.2 1.4 1.1 0.8 1.1 1.0 1.0 1.1 1.2 1.3
Section Average 3.2 Section Average 3.2
Standard Deviation 0.1 Standard Deviation 0.5
-10
10
30
-3 -2 -1 0 1 2 3 4 5 6 7 8 9 10
Section Distribution
-10
40
90
-3 -2 -1 0 1 2 3 4 5 6 7 8 9 10
Section Distribution

120
Section – 5: Project Solutions - Project Management Education
CPM CCPM
Question Number> 65 69 70 71 72 73 74 75 77 78 80 82 83 66 67 68 76 79 81 84
Respondent Rank
7 1LT 4 4 1 5 3 5 3 4 3 3 5 4 1 4 3 2 4 2 3 1
8 1LT 5 2 1 3 1 3 4 3 4 3 3 3 1 3 5 3 4 3 1 1
9 1LT 4 4 3 3 3 4 3 4 3 4 3 3 3 3 3 2 4 2 3 2
13 1LT 3 2 2 4 1 2 4 2 4 2 4 5 4 2 4 4 4 4 2 1
15 1LT 2 2 3 2 2 2 4 2 2 4 2 4 4 4 2 3 2 3 2 5
17 1LT 5 3 1 4 4 4 2 4 2 4 4 2 4 4 5 2 4 4 5 5
22 1LT 5 4 1 5 1 5 3 4 3 3 3 4 4 1 3 1 3 3 1 2
24 1LT 5 5 3 5 2 5 1 5 1 1 5 4 1 1 5 1 4 1 2 1
26 1LT 2 1 2 3 2 1 1 3 3 4 4 2 1 2 3 5 2 4 3 2
27 1LT 5 5 1 5 2 5 5 4 4 5 5 4 1 4 4 2 2 5 2 1
28 1LT 3 3 1 3 1 3 4 3 2 2 3 3 2 2 4 2 4 4 3 2
29 1LT 3 3 2 3 2 3 2 3 3 2 3 3 2 2 2 2 2 2 2 3
33 1LT 5 1 1 5 1 3 1 3 5 1 1 5 1 2 4 1 2 3 2 4
38 CPT 4 2 1 4 2 3 4 4 4 2 2 4 1 3 3 2 3 2 2
44 CPT 5 5 4 4 2 4 1 1 2 4 5 2 4 1 3 2 1 2 3 1
62 CPT 2 3 3 5 3 5 2 1 3 3 5 5 2 2 3 3 2 3 4 5
66 CPT 5 1 3 5 1 5 1 3 3 2 5 5 1 2 5 5 5 3 3 1
68 CPT 4 4 2 2 2 2 2 4 4 3 4 4 1 3 3 2 3 2 4 2
69 CPT 1 4 1 2 2 2 1 3 1 1 2 3 4 1 5 1 3 2 2 2
71 CPT 5 4 1 3 1 5 5 5 3 3 5 2 3 2 5 1 5 1 4 3
76 CPT 1 5 5 5 5 1 4 2 4 2 4 5 5 4 4 1 4 2 1 1
77 CPT 4 4 2 4 2 2 4 4 3 2 4 4 4 3 4 2 3 4 2 2
78 CPT 4 2 2 4 1 3 4 2 4 4 5 2 3 2 4 4 3 4 3 1
81 CPT 2 2 2 4 1 2 2 1 4 4 3 3 3 3 2 2 5 3 5 1
83 WO1 5 3 3 4 2 4 4 3 5 4 5 2 2 3 5 4 5 3 5 3
90 WO1 2 4 2 3 3 4 2 3 2 1 1 2 2 4 3 3 4 1 2 1
93 WO1 4 2 2 2 2 2 2 2 2 2 2 2 2 1 4 2 2 2 2 2
96 WO1 4 5 2 4 2 4 3 3 3 4 4 5 2 2 5 4 4 2 3 1
98 CW2 5 3 4 4 4 3 4 5 5 3 3 2 2 4 4 1 3 1 4 2
100 CW2 3 3 2 5 1 4 4 5 4 4 4 5 5 2 5 5 4 1 4 1
110 CW2 5 4 3 5 3 4 4 4 4 3 4 3 5 3 4 3 5 4 2 5
111 CW2 5 3 1 4 2 2 3 5 3 4 2 5 3 2 4 1 3 1 3 4
113 CW2 5 3 1 1 1 3 5 4 5 1 3 1 1 4 4 2 4 2 3 1
114 CW2 2 2 4 3 5 3 2 2 3 4 2 4 3 4 1 5 2 4 2 4
Number of Respondents 34 34 34 34 34 34 34 34 34 34 34 34 34 34 34 34 34 34 34 34
Average 3.8 3.1 2.1 3.7 2.1 3.3 2.9 3.2 3.2 2.9 3.5 3.4 2.6 2.6 3.7 2.5 3.4 2.6 2.8 2.2
Standard Deviation 1.3 1.2 1.1 1.1 1.1 1.2 1.3 1.2 1.1 1.1 1.2 1.2 1.4 1.0 1.1 1.3 1.1 1.1 1.1 1.4
Section Average 3.1 Section Average 2.8
Standard Deviation 0.5 Standard Deviation 0.5
-10
40
90
-3 -2 -1 0 1 2 3 4 5 6 7 8 9 10
Section Distribution
-10
10
30
50
70
-3 -2 -1 0 1 2 3 4 5 6 7 8 9 10
Section Distribution

121
Section - 3: Project Planning Issues – Project Management Experience
Resource Issues Scheduling Issues
Question Number> 1 2 6 8 9 10 13 14 15 16 17 21 22 24 25 3 4 5 7 11 12 18 19 23
Respondent Rank
2 1LT 4 5 4 4 2 3 2 2 4 5 2 3 2 4 3 4 2 2 2 2 4 4 5 4
5 1LT 3 3 5 5 1 3 3 4 4 3 2 2 3 3 5 4 5 4 4 4 1 1 2 2
8 1LT 4 5 4 5 1 2 3 3 5 3 2 2 2 1 2 3 3 4 3 2 2 2 1 2
13 1LT 3 3 2 5 2 3 4 3 3 4 5 4 2 4 4 4 4 4 3 4 2 4 2 2
14 1LT 3 2 2 4 2 3 3 1 2 3 1 5 2 4 2 1 1 1 1 4 2 3 1 1
16 1LT 1 2 2 1 2 3 4 2 3 3 2 1 1 1 1 4 5 2 5 2 4 4 3 1
17 1LT 5 4 5 5 2 3 5 4 1 4 4 2 4 4 4 5 5 5 3 5 1 4 2 4
18 1LT 3 3 3 3 3 4 4 3 4 4 2 2 2 3 4 2 3 4 2 4 3 2 3 3
21 1LT 2 3 1 3 4 3 4 3 4 1 1 1 2 1 1 2 2 1 1 4 2 2 3 3
22 1LT 4 3 3 4 2 2 3 3 3 3 5 2 2 2 2 3 4 3 3 2 2 2 3 3
23 1LT 3 3 3 4 2 4 4 4 5 3 3 4 2 2 3 3 3 4 2 4 2 3 2 4
27 1LT 3 5 2 1 1 3 4 4 2 3 1 1 5 2 4 4 5 2 2 2 1 3 2 2
29 1LT 2 3 4 4 3 4 3 3 3 3 3 2 3 2 2 3 3 4 3 2 2 2 3 3
30 1LT 5 3 3 4 1 1 5 5 5 5 2 4 2 1 1 3 4 2 1 4 1 1 1 1
33 1LT 5 2 1 4 1 2 3 5 3 2 2 2 2 2 2 2 4 1 1 5 2 1 3 5
36 CPT 4 4 5 5 2 5 5 4 5 3 5 4 3 3 4 5 5 3 3 5 2 2 4 3
62 CPT 3 3 1 2 2 2 2 1 2 5 2 4 4 2 2 3 2 1 1 4 4 1 4 3
68 CPT 5 4 4 3 2 4 4 3 3 3 2 2 4 3 3 3 2 2 3 3 3 2 3 2
69 CPT 1 2 2 1 1 1 2 1 1 1 1 1 1 1 1 2 2 1 1 1 1 1 1 1
71 CPT 4 2 4 4 2 5 4 4 2 5 2 3 4 1 5 2 2 5 4 5 2 4 5 1
72 CPT 3 2 2 3 3 2 3 2 2 1 2 1 2 2 2 1 3 2 1 2 3 2 2 1
80 CPT 1 1 2 5 1 4 2 3 3 1 1 1 1 1 3 3 3 1 4 5 1 1 4 1
84 WO1 2 2 3 3 3 2 2 3 3 2 3 3 3 2 3 2 2 3 2 2 3 3 3 3
85 WO1 2 3 2 4 1 2 5 3 5 4 1 4 4 1 3 2 4 4 4 4 1 1 4 1
87 WO1 4 2 4 4 4 4 3 2 2 3 3 3 2 2 4 4 4 4 3 3 3 2 3 2
89 WO1 4 3 2 3 2 2 2 2 2 4 3 2 1 1 1 2 2 3 1 4 1 2 1 1
92 WO1 3 3 2 3 3 3 3 3 3 2 2 3 2 1 3 2 2 2 2 2 2 2 2 2
93 WO1 3 2 2 2 2 2 2 2 2 2 2 2 2 2 2 3 3 3 2 2 2 2 2 2
94 WO1 3 3 1 4 1 3 4 1 4 3 2 1 1 1 1 2 2 3 2 3 3 1 1 3
96 WO1 3 3 4 4 1 3 2 4 4 4 3 3 3 2 3 4 4 3 2 5 2 3 2 3
97 WO1 4 5 2 3 3 2 4 2 2 1 2 2 1 1 2 4 3 2 3 2 2 2 1 2
96 WO1 3 3 4 4 1 3 2 4 4 4 3 3 3 2 3 4 4 3 2 5 2 3 2 3
97 WO1 4 5 2 3 3 2 4 2 2 1 2 2 1 1 2 4 3 2 3 2 2 2 1 2
98 CW2 5 3 4 5 2 3 3 4 4 1 1 5 3 4 5 3 3 3 3 2 1 1 1 3
99 CW2 2 3 5 4 1 3 3 4 1 1 2 2 1 3 2 2 3 4 3 3 1 1 4 2
100 CW2 4 4 2 4 5 2 4 2 2 2 4 3 2 4 3 5 3 2 2 3 1 1 2 4
101 CW2 2 2 1 1 2 5 2 1 4 5 2 2 4 2 2 2 2 3 3 3 4 3 4 3
103 CW2 3 4 1 4 1 5 4 4 5 5 3 3 3 3 3 4 3 5 1 2 1 1 5 3
106 CW2 3 4 3 4 2 3 3 3 3 3 2 5 3 3 2 3 2 2 3 4 3 4 2 2
107 CW2 5 3 2 1 1 3 2 2 4 3 3 2 2 3 2 4 5 2 2 5 1 3 1 3
108 CW2 4 4 4 4 1 5 5 2 5 4 3 3 3 4 3 3 1 1 2 3 1 4 2 3
110 CW2 3 5 4 3 3 4 5 4 4 5 4 3 3 4 3 3 5 2 4 5 3 4 4 2
113 CW2 3 3 4 5 3 4 3 3 3 3 2 3 4 3 3 4 4 3 4 4 5 4 3 3
114 CW2 3 4 2 3 2 3 3 2 3 3 3 3 2 4 3 2 2 3 2 4 2 3 2 4
116 CW2 2 4 4 3 2 2 3 4 2 2 4 2 2 5 2 2 2 2 2 3 2 4 2 2
117 CW2 3 3 1 2 2 3 2 1 3 2 3 2 1 1 1 2 2 1 1 2 2 1 1 1
119 CW3 2 3 4 3 1 5 5 4 4 3 4 5 3 3 2 2 3 2 4 4 1 5 3 1
Number of Respondents 34 34 34 34 34 34 34 34 34 34 34 34 34 34 34 34 34 34 34 34 34 34 34 34
Number of Respondents 3.2 3.2 2.8 3.4 2.0 3.1 3.3 2.9 3.2 3.0 2.5 2.6 2.4 2.4 2.6 3.0 3.1 2.7 2.4 3.3 2.1 2.4 2.5 2.4
Number of Respondents 1.1 1.0 1.3 1.2 1.0 1.1 1.0 1.1 1.2 1.3 1.1 1.2 1.0 1.2 1.1 1.0 1.1 1.2 1.1 1.2 1.0 1.2 1.2 1.0
Section Average 2.8 Section Average 2.7
Standard Deviation 0.4 Standard Deviation 0.4
-10
40
90
140
190
-3 -2 -1 0 1 2 3 4 5 6 7 8 9 10
Section Distribution
-10
40
90
140
-3 -2 -1 0 1 2 3 4 5 6 7 8 9 10
Section Distribution

122
Section - 3: Project Execution Issues – Project Management Experience
Resource Issues Scheduling Issues
Question Number> 26 27 31 33 35 37 44 46 47 48 28 29 30 32 34 36 38 39 40 41 42 43 45
Respondent Rank
2 1LT 5 3 4 2 2 2 4 4 2 2 2 2 3 5 2 3 4 4 3 2 4 3 4
5 1LT 4 4 3 4 3 5 2 1 2 5 3 4 3 2 3 1 3 3 2 3 3 3 2
8 1LT 5 5 2 3 2 3 1 1 1 1 3 3 2 1 2 1 2 5 3 3 2 5 1
13 1LT 4 3 3 4 4 4 2 3 5 5 4 4 2 2 3 2 3 4 2 2 3 4 3
14 1LT 2 4 1 2 2 5 1 4 2 3 2 2 1 4 1 4 4 5 4 4 2 4 1
16 1LT 1 1 5 3 4 4 5 3 3 3 1 5 4 5 3 4 5 3 4 4 2 4 4
17 1LT 4 4 4 5 5 4 4 2 2 5 5 5 5 4 4 5 2 2 4 4 2
18 1LT 4 4 3 3 2 4 1 2 3 3 3 4 3 3 2 3 4 2 3 2 2 3 2
21 1LT 2 3 3 1 3 2 2 2 4 1 3 3 4 1 1 1 3 2 3 2 3 3 3
22 1LT 5 5 2 3 2 2 2 2 2 3 2 3 2 2 3 2 4 3 2 2 2 2 2
23 1LT 3 3 4 3 4 4 4 5 3 3 4 3 4 5 3 4 4 3 2 2 2 4 4
27 1LT 3 4 5 4 2 1 4 1 2 4 2 4 2 2 4 1 3 3 1 2 2 4 2
29 1LT 3 3 3 2 3 2 3 2 2 3 2 3 3 3 3 3 3 3 2 2 3 2 3
30 1LT 5 5 5 1 4 1 2 1 1 4 4 3 4 1 1 1 3 4 2 1 1 3 1
33 1LT 5 5 1 5 5 3 5 2 4 5 3 5 2 3 2 1 3 3 2 5 3 2 5
36 CPT 4 4 5 5 5 5 2 2 5 5 5 5 4 3 5 1 4 5 3 5 3 5 2
62 CPT 3 3 3 2 3 3 4 2 4 2 3 3 2 2 3 3 1 5 4 3 2 5 3
68 CPT 5 4 4 2 2 4 1 3 4 3 2 3 3 3 3 2 3 4 3 2 2 2 2
69 CPT 5 5 2 2 2 2 4 3 3 3 1 2 1 2 2 2 2 2 1 3 2 2 4
71 CPT 4 3 5 2 5 4 4 2 2 5 5 5 5 3 2 3 4 5 5 5 4 4 2
72 CPT 2 3 1 2 2 1 2 1 2 2 2 1 1 2 1 2 1 2 2 3 1 1 2
80 CPT 1 1 3 4 2 1 3 1 1 1 1 1 2 3 2 1 2 1 1 1 3 3 1
84 WO1 1 2 3 2 3 3 2 3 3 2 3 3 3 2 3 2 2 2 4 3 2 3 3
85 WO1 4 3 4 1 2 5 5 3 4 5 4 2 5 5 5 4 4 3 4 4 5 4 4
87 WO1 4 4 5 4 4 4 5 5 3 5 4 4 3 4 5 5 3 3 5 3 4 3 3
89 WO1 3 2 3 1 1 1 1 2 1 1 2 2 1 1 3 1 2 1 2 2 2 4 1
92 WO1 4 4 4 5 4 4 5 3 4 4 3 4 3 3 3 4 3 3 4 3 4 4 4
93 WO1 4 2 3 2 2 2 2 2 2 2 2 2 2 2 1 2 2 2 2 2 2 2 2
94 WO1 3 3 4 3 4 3 3 4 3 1 2 3 2 1 5 1 4 3 3 4 4 2 1
96 WO1 4 5 5 3 4 3 2 2 1 4 5 4 4 2 3 2 3 4 2 5 4 3 3
97 WO1 5 5 2 2 4 2 1 1 2 2 4 4 2 1 2 2 5 4 1 2 2 3 1
96 WO1 4 5 5 3 4 3 2 2 1 4 5 4 4 2 3 2 3 4 2 5 4 3 3
97 WO1 5 5 2 2 4 2 1 1 2 2 4 4 2 1 2 2 5 4 1 2 2 3 1
98 CW2 5 5 2 4 4 4 3 2 2 2 3 3 1 4 5 1 2 3 2 4 3 2 3
99 CW2 2 3 2 4 2 4 5 5 5 2 2 2 3 2 5 4 4 5 2 1 5 3 2
100 CW2 2 3 3 3 5 3 1 2 3 4 5 3 2 1 4 2 5 5 4 5 2 4 2
101 CW2 2 2 4 2 4 2 4 2 2 2 2 2 2 3 2 3 2 3 2 3 4 3 3
103 CW2 4 4 5 4 1 3 5 2 3 3 3 3 2 5 5 3 5 4 5 1 4 1 3
106 CW2 4 4 2 2 3 1 3 4 3 3 3 3 2 3 1 1 2 5 2 4 3 3 2
107 CW2 4 4 3 2 2 3 1 1 1 3 3 5 3 2 1 2 4 3 2 2 2 1 2
108 CW2 4 4 3 3 4 4 2 3 2 2 4 4 3 4 4 5 3 5 3 2 4 3 3
110 CW2 5 5 5 5 4 5 5 3 4 4 4 5 4 4 5 5 4 4 4 5 4 4 4
113 CW2 5 5 5 5 3 1 3 4 3 3 5 5 5 3 3 1 5 5 3 5 5 3 5
114 CW2 3 4 4 2 4 3 3 2 5 3 3 3 3 3 2 3 4 4 3 2 3 4 3
116 CW2 1 1 3 2 2 2 3 2 4 2 1 2 3 2 2 3 2 3 2 2 2 3 2
117 CW2 2 2 1 2 2 1 2 1 4 1 3 3 1 3 1 1 1 2 1 2 2 3 1
119 CW3 2 2 3 4 5 2 4 2 3 2 3 3 4 5 2 1 3 5 3 2 4 3 1
Number of Respondents 34 34 34 34 34 34 34 33 34 34 34 34 34 34 34 34 34 34 34 33 34 34 34
Average 3.5 3.6 3.3 2.9 3.2 2.9 2.9 2.4 2.7 2.9 3.1 3.3 2.8 2.8 2.8 2.4 3.2 3.4 2.6 2.9 2.9 3.1 2.5
Standard Deviation 1.3 1.2 1.3 1.2 1.2 1.3 1.4 1.1 1.2 1.3 1.2 1.1 1.2 1.3 1.3 1.3 1.1 1.2 1.1 1.3 1.1 1.0 1.1
Section Average 3.0 Section Average 2.9
Standard Deviation 0.4 Standard Deviation 0.3
-10
40
90
140
-3 -2 -1 0 1 2 3 4 5 6 7 8 9 10
Section Distribution
-10
40
90
140
190
-3 -2 -1 0 1 2 3 4 5 6 7 8 9 10
Section Distribution
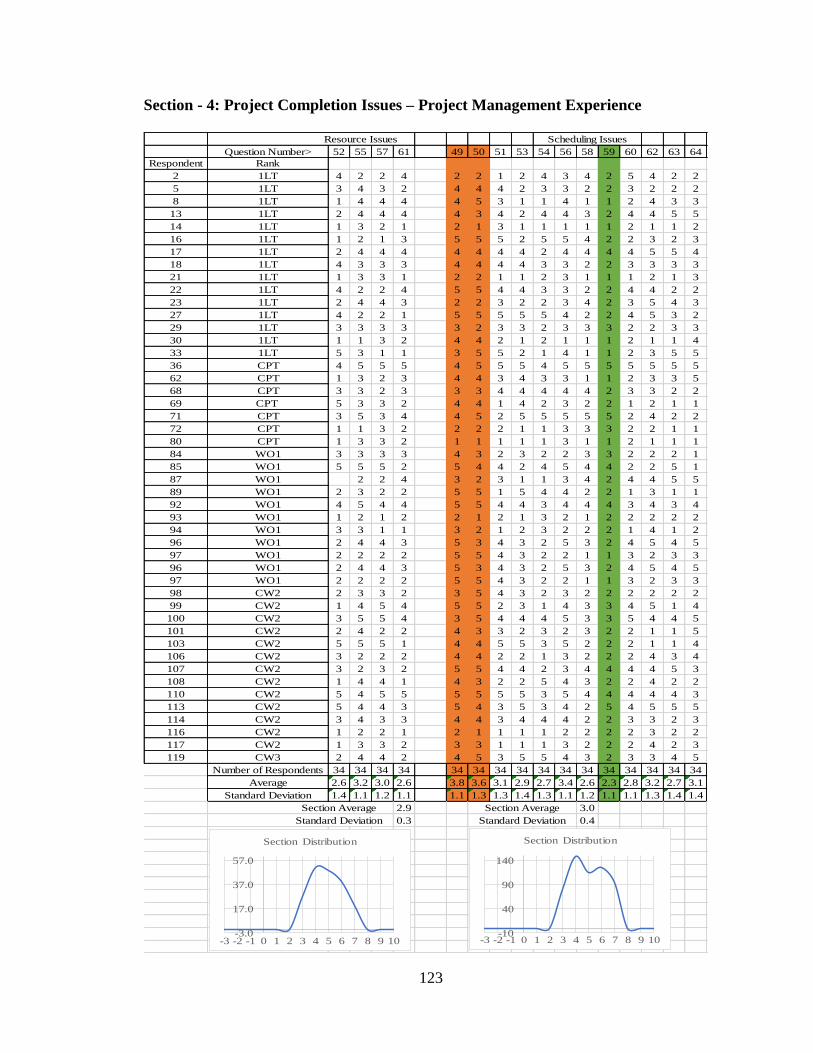
123
Section - 4: Project Completion Issues – Project Management Experience
Resource Issues Scheduling Issues
Question Number> 52 55 57 61 49 50 51 53 54 56 58 59 60 62 63 64
Respondent Rank
2 1LT 4 2 2 4 2 2 1 2 4 3 4 2 5 4 2 2
5 1LT 3 4 3 2 4 4 4 2 3 3 2 2 3 2 2 2
8 1LT 1 4 4 4 4 5 3 1 1 4 1 1 2 4 3 3
13 1LT 2 4 4 4 4 3 4 2 4 4 3 2 4 4 5 5
14 1LT 1 3 2 1 2 1 3 1 1 1 1 1 2 1 1 2
16 1LT 1 2 1 3 5 5 5 2 5 5 4 2 2 3 2 3
17 1LT 2 4 4 4 4 4 4 4 2 4 4 4 4 5 5 4
18 1LT 4 3 3 3 4 4 4 4 3 3 2 2 3 3 3 3
21 1LT 1 3 3 1 2 2 1 1 2 3 1 1 1 2 1 3
22 1LT 4 2 2 4 5 5 4 4 3 3 2 2 4 4 2 2
23 1LT 2 4 4 3 2 2 3 2 2 3 4 2 3 5 4 3
27 1LT 4 2 2 1 5 5 5 5 5 4 2 2 4 5 3 2
29 1LT 3 3 3 3 3 2 3 3 2 3 3 3 2 2 3 3
30 1LT 1 1 3 2 4 4 2 1 2 1 1 1 2 1 1 4
33 1LT 5 3 1 1 3 5 5 2 1 4 1 1 2 3 5 5
36 CPT 4 5 5 5 4 5 5 5 4 5 5 5 5 5 5 5
62 CPT 1 3 2 3 4 4 3 4 3 3 1 1 2 3 3 5
68 CPT 3 3 2 3 3 3 4 4 4 4 4 2 3 3 2 2
69 CPT 5 3 3 2 4 4 1 4 2 3 2 2 1 2 1 1
71 CPT 3 5 3 4 4 5 2 5 5 5 5 5 2 4 2 2
72 CPT 1 1 3 2 2 2 2 1 1 3 3 3 2 2 1 1
80 CPT 1 3 3 2 1 1 1 1 1 3 1 1 2 1 1 1
84 WO1 3 3 3 3 4 3 2 3 2 2 3 3 2 2 2 1
85 WO1 5 5 5 2 5 4 4 2 4 5 4 4 2 2 5 1
87 WO1 2 2 4 3 2 3 1 1 3 4 2 4 4 5 5
89 WO1 2 3 2 2 5 5 1 5 4 4 2 2 1 3 1 1
92 WO1 4 5 4 4 5 5 4 4 3 4 4 4 3 4 3 4
93 WO1 1 2 1 2 2 1 2 1 3 2 1 2 2 2 2 2
94 WO1 3 3 1 1 3 2 1 2 3 2 2 2 1 4 1 2
96 WO1 2 4 4 3 5 3 4 3 2 5 3 2 4 5 4 5
97 WO1 2 2 2 2 5 5 4 3 2 2 1 1 3 2 3 3
96 WO1 2 4 4 3 5 3 4 3 2 5 3 2 4 5 4 5
97 WO1 2 2 2 2 5 5 4 3 2 2 1 1 3 2 3 3
98 CW2 2 3 3 2 3 5 4 3 2 3 2 2 2 2 2 2
99 CW2 1 4 5 4 5 5 2 3 1 4 3 3 4 5 1 4
100 CW2 3 5 5 4 3 5 4 4 4 5 3 3 5 4 4 5
101 CW2 2 4 2 2 4 3 3 2 3 2 3 2 2 1 1 5
103 CW2 5 5 5 1 4 4 5 5 3 5 2 2 2 1 1 4
106 CW2 3 2 2 2 4 4 2 2 1 3 2 2 2 4 3 4
107 CW2 3 2 3 2 5 5 4 4 2 3 4 4 4 4 5 3
108 CW2 1 4 4 1 4 3 2 2 5 4 3 2 2 4 2 2
110 CW2 5 4 5 5 5 5 5 5 3 5 4 4 4 4 4 3
113 CW2 5 4 4 3 5 4 3 5 3 4 2 5 4 5 5 5
114 CW2 3 4 3 3 4 4 3 4 4 4 2 2 3 3 2 3
116 CW2 1 2 2 1 2 1 1 1 1 2 2 2 2 3 2 2
117 CW2 1 3 3 2 3 3 1 1 1 3 2 2 2 4 2 3
119 CW3 2 4 4 2 4 5 3 5 5 4 3 2 3 3 4 5
Number of Respondents 34 34 34 34 34 34 34 34 34 34 34 34 34 34 34 34
Average 2.6 3.2 3.0 2.6 3.8 3.6 3.1 2.9 2.7 3.4 2.6 2.3 2.8 3.2 2.7 3.1
Standard Deviation 1.4 1.1 1.2 1.1 1.1 1.3 1.3 1.4 1.3 1.1 1.2 1.1 1.1 1.3 1.4 1.4
Section Average 2.9 Section Average 3.0
Standard Deviation 0.3 Standard Deviation 0.4
-3.0
17.0
37.0
57.0
-3 -2 -1 0 1 2 3 4 5 6 7 8 9 10
Section Distribution
-10
40
90
140
-3 -2 -1 0 1 2 3 4 5 6 7 8 9 10
Section Distribution

124
Section – 5: Project Solutions – Project Management Experience
CPM CCPM
Question Number> 65 69 70 71 72 73 74 75 77 78 80 82 83 66 67 68 76 79 81 84
Respondent Rank
2 1LT 4 1 1 4 2 2 4 4 3 2 2 1 1 5 4 2 2 1 4 1
5 1LT 4 4 3 5 2 4 4 4 3 2 4 2 2 3 4 4 1 1 2 4
8 1LT 5 2 1 3 1 3 4 3 4 3 3 3 1 3 5 3 4 3 1 1
13 1LT 3 2 2 4 1 2 4 2 4 2 4 5 4 2 4 4 4 4 2 1
14 1LT 2 4 2 5 2 4 3 4 2 2 4 3 5 3 5 3 3 4 2 3
16 1LT 4 4 5 2 3 3 3 2 3 3 3 2 2 3 3 5 4 4 2 1
17 1LT 5 3 1 4 4 4 2 4 2 4 4 2 4 4 5 2 4 4 5 5
18 1LT 4 2 2 4 3 4 1 4 3 3 4 2 2 3 4 1 4 2 3 4
21 1LT 2 2 3 3 2 2 3 2 1 1 4 3 2 1 3 4 4 4 2 4
22 1LT 5 4 1 5 1 5 3 4 3 3 3 4 4 1 3 1 3 3 1 2
23 1LT 3 4 2 4 2 4 5 3 4 5 4 3 2 2 5 4 5 3 2 3
27 1LT 5 5 1 5 2 5 5 4 4 5 5 4 1 4 4 2 2 5 2 1
29 1LT 3 3 2 3 2 3 2 3 3 2 3 3 2 2 2 2 2 2 2 3
30 1LT 4 4 3 2 1 1 2 5 4 4 4 5 2 2 4 1 4 1 3 5
33 1LT 5 1 1 5 1 3 1 3 5 1 1 5 1 2 4 1 2 3 2 4
36 CPT 5 4 4 5 1 1 5 1 4 3 2 5 1 1 5 5 5 4 2 4
62 CPT 2 3 3 5 3 5 2 1 3 3 5 5 2 2 3 3 2 3 4 5
68 CPT 4 4 2 2 2 2 2 4 4 3 4 4 1 3 3 2 3 2 4 2
69 CPT 1 4 1 2 2 2 1 3 1 1 2 3 4 1 5 1 3 2 2 2
71 CPT 5 4 1 3 1 5 5 5 3 3 5 2 3 2 5 1 5 1 4 3
72 CPT 1 2 2 1 2 1 1 1 3 4 2 3 3 1 1 2 2 3 4 2
80 CPT 5 2 2 2 1 4 4 3 3 1 3 3 4 3 3 2 3 3 3 4
84 WO1 4 3 1 3 2 3 2 2 2 4 4 5 4 2 3 4 3 4 3 4
85 WO1 5 5 1 5 2 1 4 1 3 2 1 5 4 3 4 1 1 2 4 4
87 WO1 3 4 5 5 5 3 4 5 4 4 5 5 2 4 2 4 3 3 5 1
89 WO1 1 2 1 4 3 2 3 4 5 3 3 2 1 2 4 2 3 2 4 1
92 WO1 2 3 2 2 2 2 3 2 5 2 3 2 4 3 4 4 4 4 3 2
93 WO1 4 2 2 2 2 2 2 2 2 2 2 2 2 1 4 2 2 2 2 2
94 WO1 5 2 1 5 2 3 5 4 3 2 5 2 1 3 5 1 5 3 3 3
96 WO1 4 5 2 4 2 4 3 3 3 4 4 5 2 2 5 4 4 2 3 1
97 WO1 5 3 2 4 2 4 4 3 1 1 4 2 2 3 4 4 2 2 3 1
96 WO1 4 5 2 4 2 4 3 3 3 4 4 5 2 2 5 4 4 2 3 1
97 WO1 5 3 2 4 2 4 4 3 1 1 4 2 2 3 4 4 2 2 3 1
98 CW2 5 3 4 4 4 3 4 5 5 3 3 2 2 4 4 1 3 1 4 2
99 CW2 5 3 2 1 3 1 3 4 3 1 4 3 1 4 4 1 2 1 3 1
100 CW2 3 3 2 5 1 4 4 5 4 4 4 5 5 2 5 5 4 1 4 1
101 CW2 3 1 3 2 1 3 1 2 4 1 5 2 1 2 3 2 4 2 4 3
103 CW2 5 4 3 5 1 5 4 3 5 1 1 3 1 3 4 1 1 1 1 2
106 CW2 4 2 4 4 4 4 4 4 2 3 3 4 4 4 3 2 4 2 4 2
107 CW2 5 2 1 2 2 5 4 5 4 5 4 4 5 4 4 1 3 2 3 1
108 CW2 5 3 3 4 1 4 4 4 3 3 4 2 1 2 3 2 4 1 3 1
110 CW2 5 4 3 5 3 4 4 4 4 3 4 3 5 3 4 3 5 4 2 5
113 CW2 5 3 1 1 1 3 5 4 5 1 3 1 1 4 4 2 4 2 3 1
114 CW2 2 2 4 3 5 3 2 2 3 4 2 4 3 4 1 5 2 4 2 4
116 CW2 4 3 2 3 1 2 2 3 4 2 1 4 3 3 4 2 3 5 2 4
117 CW2 5 1 1 5 2 3 2 5 5 3 4 3 1 2 5 2 3 1 1 1
119 CW3 1 4 1 2 1 2 5 2 5 1 5 5 1 3 5 1 3 1 1 1
Number of Respondents 34 34 34 34 34 34 34 34 34 34 34 34 34 34 34 34 34 34 34 34
Average 3.8 3.0 2.1 3.5 2.1 3.1 3.2 3.3 3.3 2.6 3.4 3.3 2.4 2.7 3.9 2.5 3.2 2.5 2.8 2.4
Standard Deviation 1.3 1.1 1.1 1.3 1.1 1.2 1.2 1.2 1.1 1.2 1.2 1.3 1.3 1.0 1.0 1.3 1.1 1.2 1.1 1.4
Section Average 3.0 Section Average 2.8
Standard Deviation 0.5 Standard Deviation 0.5
-10
40
90
-3 -2 -1 0 1 2 3 4 5 6 7 8
Section Distribution
-10
10
30
50
70
-3 -2 -1 0 1 2 3 4 5 6 7 8
Section Distribution
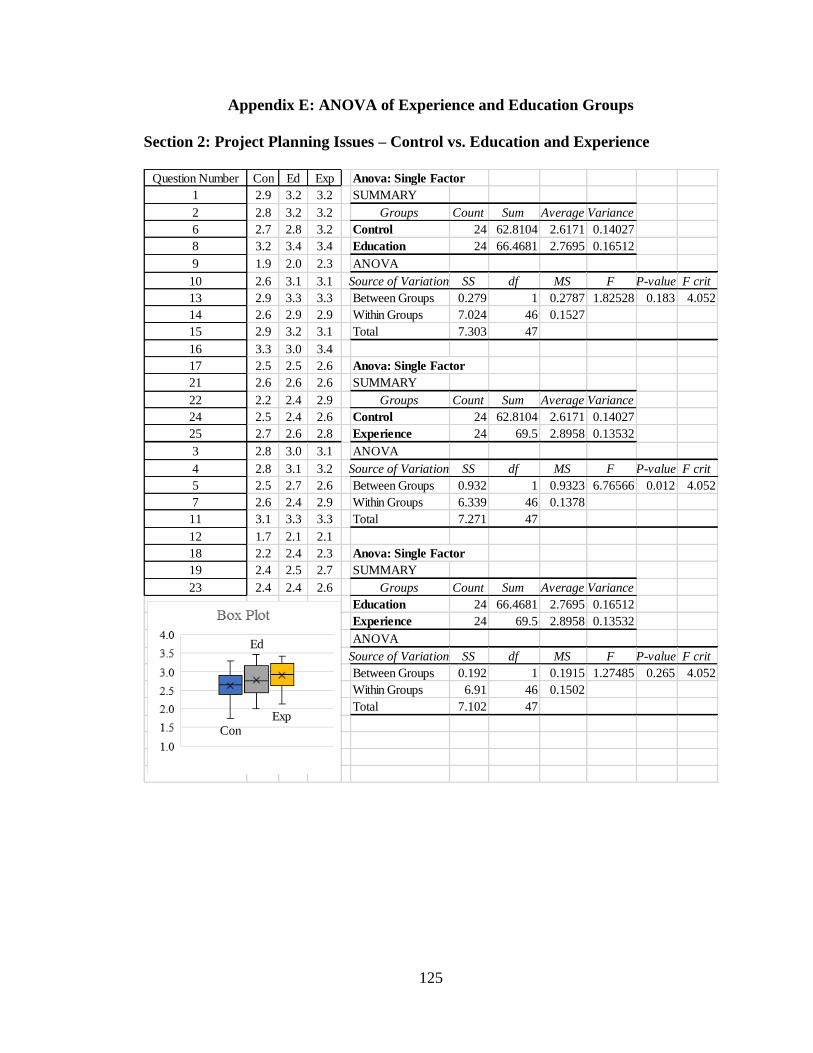
125
Appendix E: ANOVA of Experience and Education Groups
Section 2: Project Planning Issues – Control vs. Education and Experience
Question Number Con Ed Exp Anova: Single Factor
1 2.9 3.2 3.2 SUMMARY
2 2.8 3.2 3.2 Groups Count Sum Average Variance
6 2.7 2.8 3.2 Control 24 62.8104 2.6171 0.14027
8 3.2 3.4 3.4 Education 24 66.4681 2.7695 0.16512
9 1.9 2.0 2.3 ANOVA
10 2.6 3.1 3.1 Source of Variation SS df MS F P-value F crit
13 2.9 3.3 3.3 Between Groups 0.279 1 0.2787 1.82528 0.183 4.052
14 2.6 2.9 2.9 Within Groups 7.024 46 0.1527
15 2.9 3.2 3.1 Total 7.303 47
16 3.3 3.0 3.4
17 2.5 2.5 2.6 Anova: Single Factor
21 2.6 2.6 2.6 SUMMARY
22 2.2 2.4 2.9 Groups Count Sum Average Variance
24 2.5 2.4 2.6 Control 24 62.8104 2.6171 0.14027
25 2.7 2.6 2.8 Experience 24 69.5 2.8958 0.13532
3 2.8 3.0 3.1 ANOVA
4 2.8 3.1 3.2 Source of Variation SS df MS F P-value F crit
5 2.5 2.7 2.6 Between Groups 0.932 1 0.9323 6.76566 0.012 4.052
7 2.6 2.4 2.9 Within Groups 6.339 46 0.1378
11 3.1 3.3 3.3 Total 7.271 47
12 1.7 2.1 2.1
18 2.2 2.4 2.3 Anova: Single Factor
19 2.4 2.5 2.7 SUMMARY
23 2.4 2.4 2.6 Groups Count Sum Average Variance
Education 24 66.4681 2.7695 0.16512
Experience 24 69.5 2.8958 0.13532
ANOVA
Source of Variation SS df MS F P-value F crit
Between Groups 0.192 1 0.1915 1.27485 0.265 4.052
Within Groups 6.91 46 0.1502
Total 7.102 47
ConExp
Ed
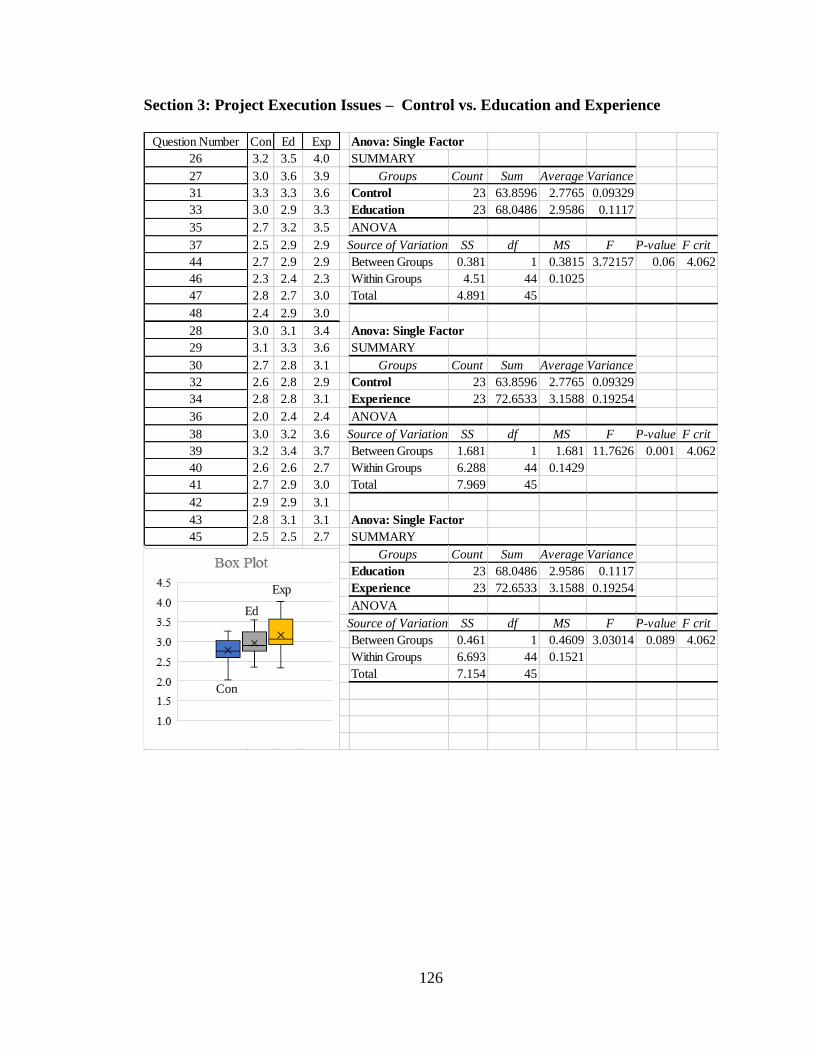
126
Section 3: Project Execution Issues – Control vs. Education and Experience
Question Number Con Ed Exp Anova: Single Factor
26 3.2 3.5 4.0 SUMMARY
27 3.0 3.6 3.9 Groups Count Sum Average Variance
31 3.3 3.3 3.6 Control 23 63.8596 2.7765 0.09329
33 3.0 2.9 3.3 Education 23 68.0486 2.9586 0.1117
35 2.7 3.2 3.5 ANOVA
37 2.5 2.9 2.9 Source of Variation SS df MS F P-value F crit
44 2.7 2.9 2.9 Between Groups 0.381 1 0.3815 3.72157 0.06 4.062
46 2.3 2.4 2.3 Within Groups 4.51 44 0.1025
47 2.8 2.7 3.0 Total 4.891 45
48 2.4 2.9 3.0
28 3.0 3.1 3.4 Anova: Single Factor
29 3.1 3.3 3.6 SUMMARY
30 2.7 2.8 3.1 Groups Count Sum Average Variance
32 2.6 2.8 2.9 Control 23 63.8596 2.7765 0.09329
34 2.8 2.8 3.1 Experience 23 72.6533 3.1588 0.19254
36 2.0 2.4 2.4 ANOVA
38 3.0 3.2 3.6 Source of Variation SS df MS F P-value F crit
39 3.2 3.4 3.7 Between Groups 1.681 1 1.681 11.7626 0.001 4.062
40 2.6 2.6 2.7 Within Groups 6.288 44 0.1429
41 2.7 2.9 3.0 Total 7.969 45
42 2.9 2.9 3.1
43 2.8 3.1 3.1 Anova: Single Factor
45 2.5 2.5 2.7 SUMMARY
Groups Count Sum Average Variance
Education 23 68.0486 2.9586 0.1117
Experience 23 72.6533 3.1588 0.19254
ANOVA
Source of Variation SS df MS F P-value F crit
Between Groups 0.461 1 0.4609 3.03014 0.089 4.062
Within Groups 6.693 44 0.1521
Total 7.154 45
Con
Exp
Ed

127
Section 4: Project Completion Issues – Control vs. Education and Experience
Question Number Con Ed Exp Anova: Single Factor
52 2.5 2.6 3.2 SUMMARY
55 3.1 3.2 3.3 Groups Count Sum Average Variance
57 3.1 3.0 3.2 Control 16 44.386 2.7741 0.07066
61 2.6 2.6 3.0 Education 16 47.587 2.9742 0.16494
49 3.0 3.8 3.7 ANOVA
50 3.1 3.6 3.8 Source of Variation SS df MS F P-value F crit
51 2.8 3.1 3.3 Between Groups 0.32 1 0.3202 2.71811 0.10965 4.171
53 2.5 2.9 3.5 Within Groups 3.534 30 0.1178
54 2.5 2.7 2.9 Total 3.854 31
56 3.2 3.4 3.9
58 2.3 2.6 2.5 Anova: Single Factor
59 2.7 2.3 2.5 SUMMARY
60 2.6 2.8 3.0 Groups Count Sum Average Variance
62 2.9 3.2 3.5 Control 16 44.386 2.7741 0.07066
63 2.6 2.7 2.9 Experience 16 51.5169 3.2198 0.1595
64 2.9 3.1 3.3 ANOVA
Source of Variation SS df MS F P-value F crit
Between Groups 1.589 1 1.5891 13.8086 0.000828 4.171
Within Groups 3.452 30 0.1151
Total 5.041 31
Anova: Single Factor
SUMMARY
Groups Count Sum Average Variance
Education 16 47.587 2.9742 0.16494
Experience 16 51.5169 3.2198 0.1595
ANOVA
Source of Variation SS df MS F P-value F crit
Between Groups 0.483 1 0.4826 2.9753 0.094835 4.171
Within Groups 4.867 30 0.1622
Total 5.349 31
Con
ExpEd

128
Section 5: Project Solutions – Control vs. Education and Experience
Question Number Con Ed Exp Anova: Single Factor
65 3.6 3.8 3.8 SUMMARY
69 3.0 3.0 3.1 Groups Count Sum Average Variance
70 2.6 2.1 2.1 Control 20 60.4342 3.0217 0.20375
71 3.6 3.5 3.7 Education 20 59.2128 2.9606 0.2773
72 2.8 2.1 2.1 ANOVA
73 3.2 3.1 3.3 Source of Variation SS df MS F P-value F crit
74 2.9 3.2 2.9 Between Groups 0.037 1 0.0373 0.15507 0.696 4.098
75 3.3 3.3 3.2 Within Groups 9.14 38 0.2405
77 3.6 3.3 3.2 Total 9.177 39
78 2.5 2.6 2.9
80 3.6 3.4 3.5 Anova: Single Factor
82 3.2 3.3 3.4 SUMMARY
83 2.6 2.4 2.6 Groups Count Sum Average Variance
66 2.6 2.7 2.6 Control 20 60.4342 3.0217 0.20375
67 3.5 3.9 3.7 Experience 20 59.7585 2.9879 0.2849
68 2.8 2.5 2.5 ANOVA
76 3.4 3.2 3.4 Source of Variation SS df MS F P-value F crit
79 2.6 2.5 2.6 Between Groups 0.011 1 0.0114 0.04672 0.83 4.098
81 2.9 2.8 2.8 Within Groups 9.284 38 0.2443
84 2.2 2.4 2.2 Total 9.296 39
Anova: Single Factor
SUMMARY
Groups Count Sum Average Variance
Education 20 59.2128 2.9606 0.2773
Experience 20 59.7585 2.9879 0.2849
ANOVA
Source of Variation SS df MS F P-value F crit
Between Groups 0.007 1 0.0074 0.02648 0.872 4.098
Within Groups 10.68 38 0.2811
Total 10.69 39
Con
ExpEd
129
References
Appelbaum, S. H., Fernandez, A., & Marchionni, A. (2008). The multi-tasking paradox:
Perceptions, problems and strategies. Management Decision, 46(9), 1313- 1325.
Barnes, R., Dvir, D., & Raz, T. (2003). A critical cook at critical chain project
management. Project Management Journal, 34(4), pp. 24-32.
Cerveny, J. F., & Gallup, S. D. (2002). Critical chain project management holistic
solution aligning quantitative and qualitative project management methods.
Production and Inventory Management Journal, 43(3/4),55-64.
Cohen, I., Mandelbaum, A., & Shtub, A. (2004). Multi-project scheduling and control: A
process-based comparative study of the critical chain methodology and some
alternatives. Project Management Journal, 35(2), pp. 39-50.
Creswell, J. W. (2014). Research design: Qualitative, quantitative, and mixed methods
approaches (4th ed.). Thousand Oaks, CA: Sage Publications, Inc.
Dash, S. (2015). PMP prep: Resource leveling and resource smoothing. Microsoft Project
User Group, Nov. 3, 2015. Retrieved form http://www.mpug.com/articles
Gill, A. (2008). An effect-cause-effect analysis of project objectives and trade-off
assumptions. International Journal of Managing Projects in Business, 1(4), 535.
Goldratt, E. (1997). Critical chain. Great Barrington, MA: North River Press Publishing
Corporation.
Headquarters, Department of the Army. (2010). Construction estimating. (Army doctrine
publication No. TM 3-34.41). Washington, DC: U.S. Government Printing Office.
130
Headquarters, Department of the Army. (2014). Construction project management.
(Army doctrine publication No. TM 3-34.42). Washington, DC: U.S. Government
Printing Office.
Herroelen, W., & Leus, R. (2005). Identification and illumination of popular
misconceptions about project scheduling and time buffering in a resource-
constrained environment. Journal of the Operational Research Society. 56, 102-
109.
Leach, L., P. (1999). Critical chain project management improves project performance.
Project Management Journal. 30(2), 39-51.
Leach, L., P. (2014). Critical chain project management (3rd ed.). Norwood, MA: Artech
House.
Seider, R. (2006). Optimizing project portfolios. Research Technology Management
Journal, Sep.-Oct. 2006, 43-48.
Shurrab, M. (2015). Traditional Critical Path Method versus Critical Chain Project
Management: A comparative view. International Journal of Economic
Management Sciences, 4(292).
Smith, D., G. (2012). Theory of constraints project management: Improving cost,
schedule, performance, and overall effectiveness. (Doctoral dissertation).
Retrieved from: ProQuest.
Sonawane, R. (2004). Applying system dynamics and critical chain methods to
develop a modern construction project management system. (Master
of Science Thesis). Retrieved from: ProQuest.
131
Trietsch, D. (2005). Why a critical path by any other name would smell less sweet?
Towards a holistic approach to PERT/CPM. Project Management Institute, 36(1),
27-36.
Umble, M., & Umble, E. (2000). Manage your projects for success: An application of the
theory of constraints. Production and Inventory Management, 41(2), 27-32.
Yang, J. (2007). How the critical chain scheduling method is working for construction.
Cost Engineering, 49(A).
Walker, D. (2014, July 15). Trends in U.S. military spending. Council on Foreign
Relations. Retrieved from: http://www.cfr.org/defense-budget/trends-us-military-
spending/p28855