Embed Size (px)
Citation preview
Participatory Educational Research (PER)
Vol. 6(1), pp. 10-26, June, 2019
Available online at http://www.perjournal.com
ISSN: 2148-6123
http://dx.doi.org/10.17275/per.19.2.6.1
Adapting Computational Thinking Scale (CTS) for Chinese High School
Students and Their Thinking Scale Skills Level
Özgen Korkmaz*
Amasya University, Technology Faculty, Department of Computer Engineering, Amasya,
Turkey
Xuemei Bai East China Normal University, Shanghai, China
Article history
Received:
27.11.2018
Received in revised form: 06.03.2019
Accepted:
07.03.2019
The purpose of this study is to adapt the computational thinking scale to
Chinese. The study group consists of 1015 students. The study was
performed in the descriptive scanning model. The final version of the
scale was corrected in line with the opinions of the language experts who
received the items translated from Turkish to Chinese. Exploratory and
confirmatory factor analyses were calculated to determine the validity of
the scale. Later, the distinctiveness forces were calculated. To determine
the reliability of the scale internal consistency and stability levels were
calculated. It has been concluded that the computational thinking scale is
a valid and reliable tool in Chinese culture that can be used to determine
high school students' computational thinking skills. In addition, it was
concluded that the students' computational thinking skills were quite
high. In terms of factors, the students' highest level skills are “Creativity”
and the lowest ones are “Problem Solving” and “Algorithmic Thinking”.
In terms of total scores and factors, computational thinking skills of male
students are higher than female students. But problem solving skills are
similar. It was concluded that k10 students' computational thinking skills
were higher than k11 students in terms of “Problem Solving”, “Critical
Thinking” and total scores. Based on the results obtained from this
research and the literature, it is recommended that students frequently
take part in activities that aim to improve their Problem Solving and
Algorithmic Thinking skills, especially within the context of different
courses.
Key words:
Computational thinking, scale
development, validity,
reliability
Introduction
Computational Thinking (CT) as a concept has become popular in recent years.
However, nowadays almost everyone, irrespective of age, is expected to have some basic
computational thinking skills in parallel with the developments in technology. Hence, being a
digital citizen requires students to possess CT skills. Computational thinking is a
comprehensive thinking that includes mathematical thinking, engineering thinking and
scientific thinking. It is an important carrier of innovative thinking ability.
*Correspondence: [email protected]
Participatory Educational Research (PER), 6(1);10-26, 1 June, 2019
Participatory Educational Research (PER)
-11-
Wing (2006) outlined the basic definition of CT as a way of “solving problems, designing
systems and understanding human behaviors by drawing on the concepts of computer
science”. The International Society for Technology in Education (ISTE) and Computer
Science Teacher Association (CSTA) published an operational definition about computational
thinking :CT is a way to use computer and other tools to solve the problem, involved in data
collection, data analysis, data presentation, using the algorithm steps and resources for
thinking to develop the optimal combination of automation solutions, and problem solving
process can be extended to other areas (CSTA and ISTE,2011) .In 2016, the Computer
Science Teacher Association (CSTA) updated their definition of computational thinking:
computational thinking is a kind of the methodology to solve the problem, this method can be
extended to all disciplines from the Computer Science field, providing a unique way for
analyzing and developing problems that can be solved by the calculating method
(CSTA,2016). It is possible to define Computational Thinking briefly as having the
knowledge, skill and attitudes necessary to be able to use the computers in the solution of life
problems for production purposes (Ozden, 2015). From the views of different scholars, we
can see that while most scholars emphasize the characteristics of computational thinking as
the ability to solve a problem, from different angles, the interpretation of computational
thinking is different.
Although there is no unified definition of computational thinking, its importance is obvious.
When the fact that computational thinking has a border and general frame is taken into
consideration, it is a valid basic skill not only for the computers, but also for everybody and it
is considered that it will take place in the basic skills (reading, writing and arithmetic) used by
everyone in the near future (Wing, 2006). Jeannette Wing presented CT and defined it as a
skill for everyone, not just for computer scientists (Wing, 2006). Computational Thinking is a
new perspective for children in k-12 to observe and understand the world around them. It's a
new ability to understand and solve problems using computational processes and methods,
and it's a necessary skill for them to deal with future competition and challenges.
Nowadays, more researchers are paying attention to computational thinking. Especially the
experts in the educational technology field have emphasized that Computational thinking is
very significant in terms of the skills of the 21st century (Voogt, Fisser, Good, Mishra, &
Yadav, 2015). And how to cultivate and evaluate students' computational thinking ability
attracts their attention. There is no doubt that the most critical work in the development of
computational thinking is evaluation. The evaluation of computational thinking plays an
important role in the k-12 practice field, which is the basis of the CT training activities and
the evidence of the training results. However, there is no widely accepted standard for
evaluating CT in k-12. The existing research about evaluation standards of computational
thinking in k-12 mostly adopted the multidimensional and hierarchical setting methods,
combined with some content elements of science of computer and problem solving process,
and using the grade as reference to divide different standards. Among them, the most
authoritative one is the "Case guide" of computational thinking that different school age
students should reach different levels from International Society for Technology in Education
(ISTE) and Computer Science Teacher Association (CSTA).Computational thinking is
divided into nine dimensions: data collection, data analysis, data presentation, problem
decomposition, abstract, automation, simulation and parallel algorithm and process, and use
case describes the reference performance behavior of computational thinking ability that k-12
students in different stages need to master.
Since computational thinking is the thinking process of solving problems, and problems are
Adapting Computational Thinking Scale (CTS) for Chinese High School Students Özgen Korkmaz, Xuemei Bai
Participatory Educational Research (PER)
-12-
generated in situations, most evaluation methods are carried out under certain circumstances.
Currently, the most commonly used evaluation methods are text discourse analysis, subject
test, work analysis, graphic analysis and behavior analysis. Discourse analysis based on text
means to discover students' thinking changes from their language, mainly through interviews
and thinking-aloud. However, this kind of an interview is time-consuming and requires
students to have a clear memory of the process to finish their work. For the students in the
lower grade, there may be a situation of unclear expressions and irrelevant answers.
Therefore, it is difficult and limited to use interview and other text discourse analysis in k-12.
Testing refers to using some questions or problems to test students’ computational thinking at
a certain stage of the course teaching, the results of the analysis can provide feedback to the
teacher and students in a timely manner. At present, this way is used very often. It is very
convenient, and can get students’ learning process information to a certain extent, but the
design of the test is very critical, which requires certain theoretical or evaluation criteria (Koh
et al.,2010; Aggarwal, Gardner-Mc Cune, Touretzky, 2017; Chen et al.,2017).Work analysis
means analyzing student performances in various modules from their work and then
diagnosing the improvement level of their ability in different aspects, but the operation is
difficult, unless there is a specific analysis tool support(Román –González, Pérez –González,
Jiménez –Fernández, 2016). Graphic analysis and behavior analysis mainly focus on students'
thinking process and behavior performance, which are the most difficult methods. Graphic
analysis mainly adopts flowchart and pseudo-code to reflect students' logical solution and
thinking path when they solve problems. Behavior analysis begins from the students' learning
behavior, analyzing students' problem solving in the practice process as well as error
correction, the recycling process, analyzing the path to solve a problem, observing the
application of various modules, evaluating students’ computational thinking performance.
Field observation needs extra observers in the process of teaching activities to record the
operating behavior of the students, and with the development of technology, the records of
student behaviors can be obtained by using some recording screens. However, this method
requires to record as many details as possible, which is time-consuming and requires a large
amount of analysis (Esteves, Fonseca, Morgado, 2011).
On the other hands, there is no scale found of which validity and reliability have been proven
to measure the levels regarding especially the computational thinking skills in Chinese.
Therefore, this research is limited with self-report based scale and other assessment
techniques were not taken into consideration. The purpose of this study is to describe the
students' computational thinking skills and adapt the Computational Thinking Scales into
Chinese from Turkish for determining the computational thinking skills of the high school
students by filling this space in the literature. Hope this scale makes significance to measure
CT.
Method
Research Design
In addition to being a scale adaptation study, this is a descriptive research. It is
executed in the scanning model. In this context; students’ computational thinking skills have
been tried to be determined.
Participatory Educational Research (PER), 6(1);10-26, 1 June, 2019
Participatory Educational Research (PER)
-13-
Study Group
The study group of this study consists of 1015 high school students at the levels of
K10 and K11 degree in one private School in Ningxia Province and another public school in
Jiangxi Province, China. While descriptive factor analysis was performed on data collected
from K11 level students, confirmatory factor analysis was performed on data collected from
K10 level students. All data were used in other analyses. The distribution of the students
according to gender and class levels is summarized in Table 1.
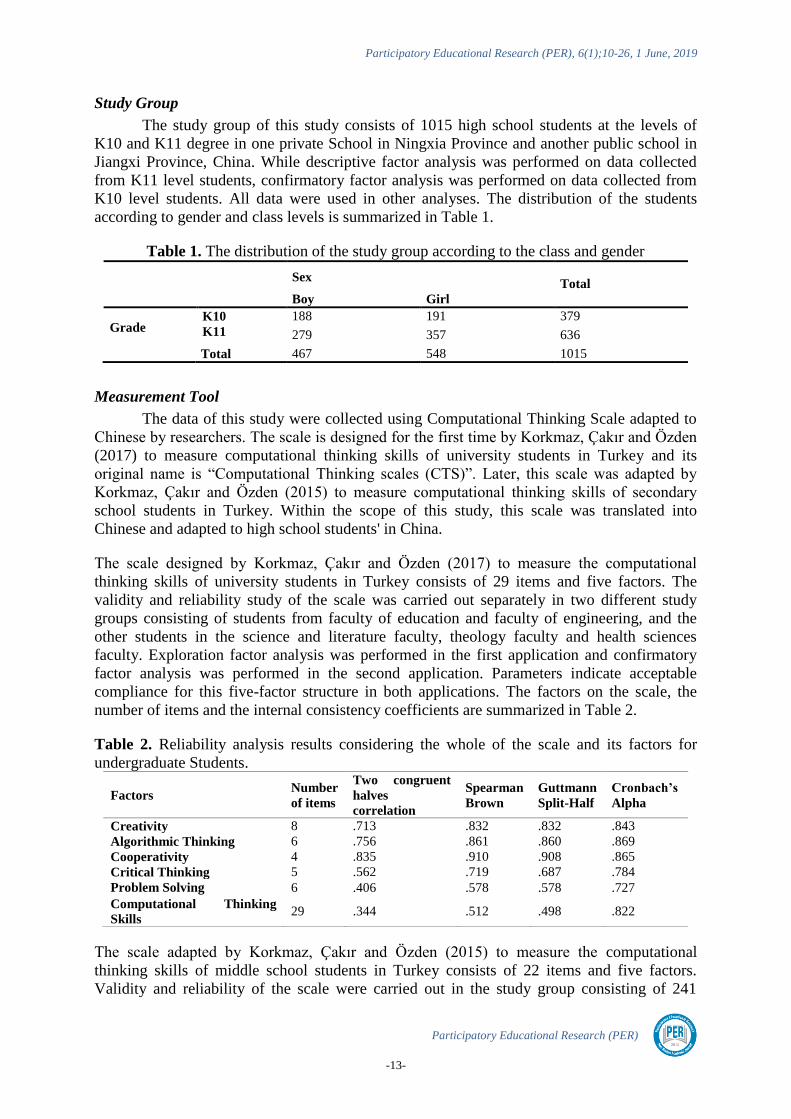
Table 1. The distribution of the study group according to the class and gender
Sex Total
Boy Girl
Grade K10 188 191 379
K11 279 357 636
Total 467 548 1015
Measurement Tool
The data of this study were collected using Computational Thinking Scale adapted to
Chinese by researchers. The scale is designed for the first time by Korkmaz, Çakır and Özden
(2017) to measure computational thinking skills of university students in Turkey and its
original name is “Computational Thinking scales (CTS)”. Later, this scale was adapted by
Korkmaz, Çakır and Özden (2015) to measure computational thinking skills of secondary
school students in Turkey. Within the scope of this study, this scale was translated into
Chinese and adapted to high school students' in China.
The scale designed by Korkmaz, Çakır and Özden (2017) to measure the computational
thinking skills of university students in Turkey consists of 29 items and five factors. The
validity and reliability study of the scale was carried out separately in two different study
groups consisting of students from faculty of education and faculty of engineering, and the
other students in the science and literature faculty, theology faculty and health sciences
faculty. Exploration factor analysis was performed in the first application and confirmatory
factor analysis was performed in the second application. Parameters indicate acceptable
compliance for this five-factor structure in both applications. The factors on the scale, the
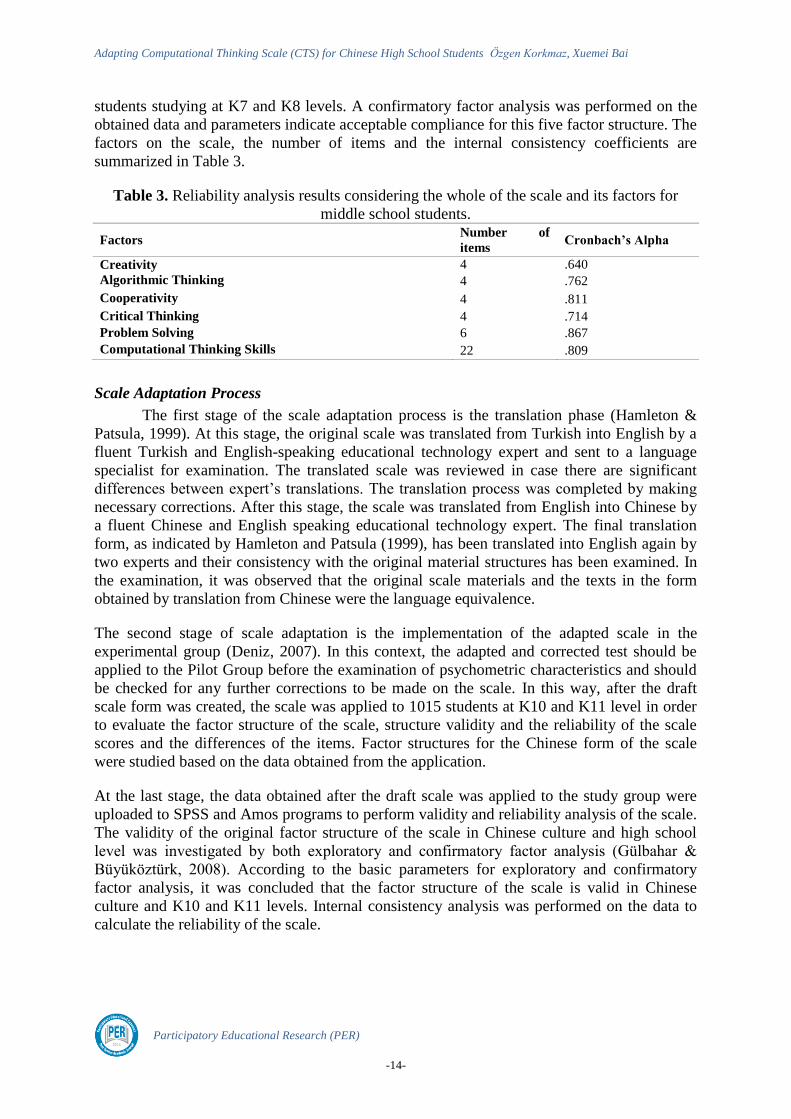
number of items and the internal consistency coefficients are summarized in Table 2.
Table 2. Reliability analysis results considering the whole of the scale and its factors for
undergraduate Students.
Factors Number
of items
Two congruent
halves
correlation
Spearman
Brown
Guttmann
Split-Half
Cronbach’s
Alpha
Creativity 8 .713 .832 .832 .843
Algorithmic Thinking 6 .756 .861 .860 .869
Cooperativity 4 .835 .910 .908 .865
Critical Thinking 5 .562 .719 .687 .784
Problem Solving 6 .406 .578 .578 .727
Computational Thinking
Skills 29 .344 .512 .498 .822
The scale adapted by Korkmaz, Çakır and Özden (2015) to measure the computational
thinking skills of middle school students in Turkey consists of 22 items and five factors.
Validity and reliability of the scale were carried out in the study group consisting of 241
Adapting Computational Thinking Scale (CTS) for Chinese High School Students Özgen Korkmaz, Xuemei Bai
Participatory Educational Research (PER)
-14-
students studying at K7 and K8 levels. A confirmatory factor analysis was performed on the
obtained data and parameters indicate acceptable compliance for this five factor structure. The
factors on the scale, the number of items and the internal consistency coefficients are
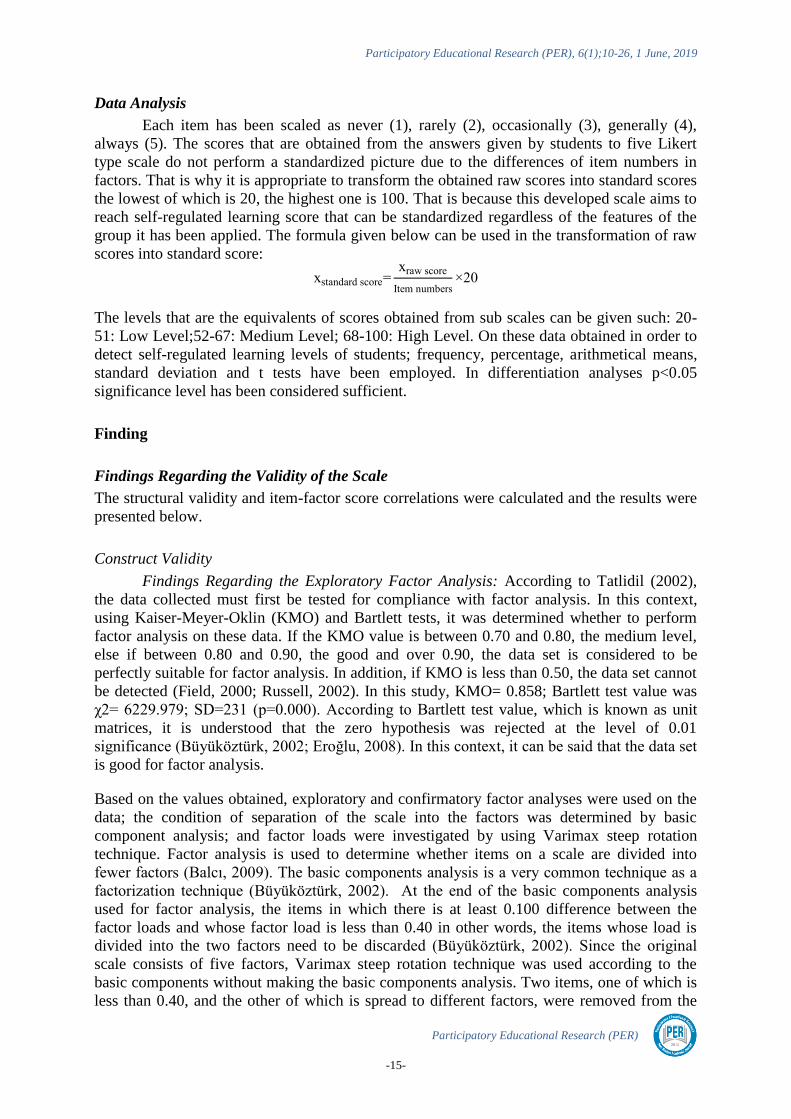
summarized in Table 3.
Table 3. Reliability analysis results considering the whole of the scale and its factors for
middle school students.
Factors Number of
items Cronbach’s Alpha
Creativity 4 .640
Algorithmic Thinking 4 .762
Cooperativity 4 .811
Critical Thinking 4 .714
Problem Solving 6 .867
Computational Thinking Skills 22 .809
Scale Adaptation Process
The first stage of the scale adaptation process is the translation phase (Hamleton &
Patsula, 1999). At this stage, the original scale was translated from Turkish into English by a
fluent Turkish and English-speaking educational technology expert and sent to a language
specialist for examination. The translated scale was reviewed in case there are significant
differences between expert’s translations. The translation process was completed by making
necessary corrections. After this stage, the scale was translated from English into Chinese by
a fluent Chinese and English speaking educational technology expert. The final translation
form, as indicated by Hamleton and Patsula (1999), has been translated into English again by
two experts and their consistency with the original material structures has been examined. In
the examination, it was observed that the original scale materials and the texts in the form
obtained by translation from Chinese were the language equivalence.
The second stage of scale adaptation is the implementation of the adapted scale in the
experimental group (Deniz, 2007). In this context, the adapted and corrected test should be
applied to the Pilot Group before the examination of psychometric characteristics and should
be checked for any further corrections to be made on the scale. In this way, after the draft
scale form was created, the scale was applied to 1015 students at K10 and K11 level in order
to evaluate the factor structure of the scale, structure validity and the reliability of the scale
scores and the differences of the items. Factor structures for the Chinese form of the scale
were studied based on the data obtained from the application.
At the last stage, the data obtained after the draft scale was applied to the study group were
uploaded to SPSS and Amos programs to perform validity and reliability analysis of the scale.
The validity of the original factor structure of the scale in Chinese culture and high school
level was investigated by both exploratory and confirmatory factor analysis (Gülbahar &
Büyüköztürk, 2008). According to the basic parameters for exploratory and confirmatory
factor analysis, it was concluded that the factor structure of the scale is valid in Chinese
culture and K10 and K11 levels. Internal consistency analysis was performed on the data to
calculate the reliability of the scale.
Participatory Educational Research (PER), 6(1);10-26, 1 June, 2019
Participatory Educational Research (PER)
-15-
Data Analysis
Each item has been scaled as never (1), rarely (2), occasionally (3), generally (4),
always (5). The scores that are obtained from the answers given by students to five Likert
type scale do not perform a standardized picture due to the differences of item numbers in
factors. That is why it is appropriate to transform the obtained raw scores into standard scores
the lowest of which is 20, the highest one is 100. That is because this developed scale aims to
reach self-regulated learning score that can be standardized regardless of the features of the
group it has been applied. The formula given below can be used in the transformation of raw
scores into standard score:
xstandard score xraw score
Item numbers 20
The levels that are the equivalents of scores obtained from sub scales can be given such: 20-
51: Low Level;52-67: Medium Level; 68-100: High Level. On these data obtained in order to
detect self-regulated learning levels of students; frequency, percentage, arithmetical means,
standard deviation and t tests have been employed. In differentiation analyses p<0.05
significance level has been considered sufficient.
Finding
Findings Regarding the Validity of the Scale
The structural validity and item-factor score correlations were calculated and the results were
presented below.
Construct Validity
Findings Regarding the Exploratory Factor Analysis: According to Tatlidil (2002),
the data collected must first be tested for compliance with factor analysis. In this context,
using Kaiser-Meyer-Oklin (KMO) and Bartlett tests, it was determined whether to perform
factor analysis on these data. If the KMO value is between 0.70 and 0.80, the medium level,
else if between 0.80 and 0.90, the good and over 0.90, the data set is considered to be
perfectly suitable for factor analysis. In addition, if KMO is less than 0.50, the data set cannot
be detected (Field, 2000; Russell, 2002). In this study, KMO= 0.858; Bartlett test value was
χ2 6229.979; SD 231 (p 0.000). According to Bartlett test value, which is known as unit
matrices, it is understood that the zero hypothesis was rejected at the level of 0.01
significance (Büyüköztürk, 2002; Eroğlu, 2008). In this context, it can be said that the data set
is good for factor analysis.
Based on the values obtained, exploratory and confirmatory factor analyses were used on the
data; the condition of separation of the scale into the factors was determined by basic
component analysis; and factor loads were investigated by using Varimax steep rotation
technique. Factor analysis is used to determine whether items on a scale are divided into
fewer factors (Balcı, 2009). The basic components analysis is a very common technique as a
factorization technique (Büyüköztürk, 2002). At the end of the basic components analysis
used for factor analysis, the items in which there is at least 0.100 difference between the
factor loads and whose factor load is less than 0.40 in other words, the items whose load is
divided into the two factors need to be discarded (Büyüköztürk, 2002). Since the original
scale consists of five factors, Varimax steep rotation technique was used according to the
basic components without making the basic components analysis. Two items, one of which is
less than 0.40, and the other of which is spread to different factors, were removed from the
Adapting Computational Thinking Scale (CTS) for Chinese High School Students Özgen Korkmaz, Xuemei Bai
Participatory Educational Research (PER)
-16-
scale. As a result of these operations, 20 items remaining in the scale can be collected under
five factors similar to the original scale. It was determined that the KMO value of the 20-item
scale was 0.883; the Bartlett values were χ2 5475.929; SD 190; p<0.001. The basic criteria
in evaluating factor analysis results are factor loads (Balcı, 2009; Gorsuch, 1983; Eroğlu,
2008). The high factor load is seen as an indicator that the variable can be placed under the
given factor (Büyüközütk, 2002). The factor loads of 20 items on the scale without being
subjected to rotation (unrotated) were between 0.400 and 0.690; however, these loads were
subjected to rotation after Varimax steep rotation technique, between .570 and .823. The
explanation of at least 40% of the general variance in the literature is sufficient in terms of
behavioral Sciences (Büyüköztürk, 2002; Eroğlu, 2008; Klein, 1994; Scherer at al., 1988). It
was determined that the items and factors included in the scale explained 56.312% of the total
variance. When the contents of the factors in the next step were examined, it was observed
that the original scale was preserved. In this context, factor names remained the same. In the
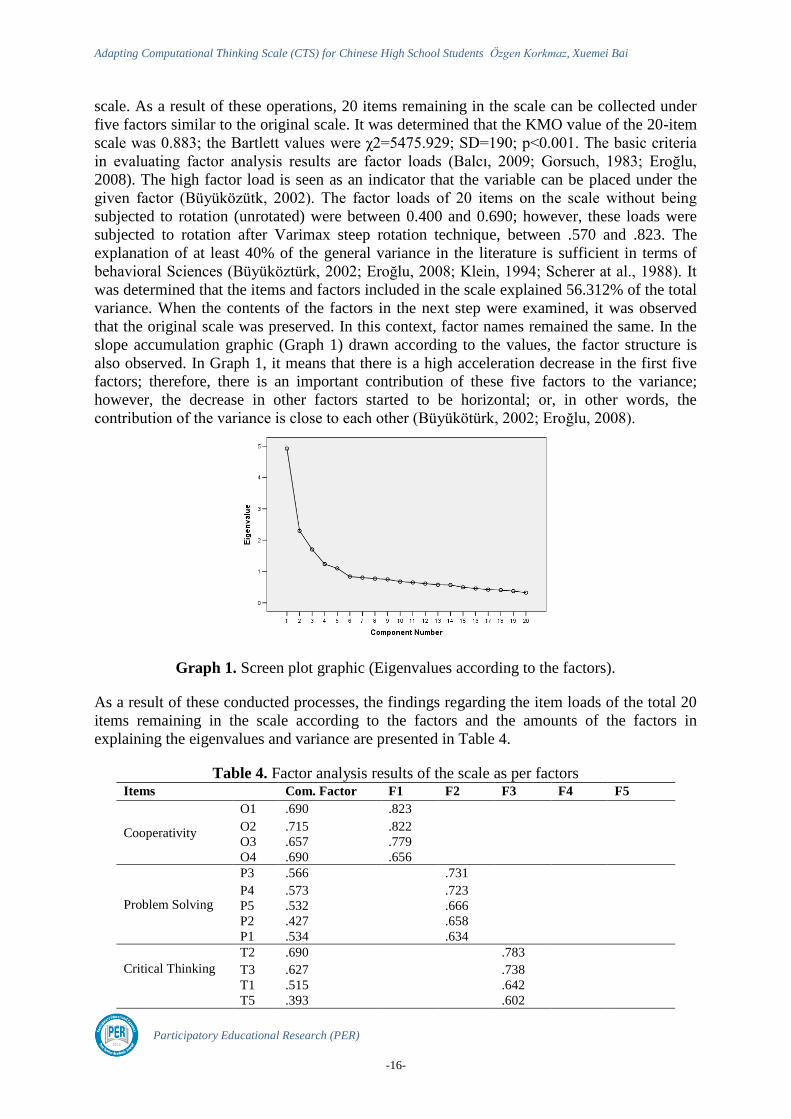
slope accumulation graphic (Graph 1) drawn according to the values, the factor structure is
also observed. In Graph 1, it means that there is a high acceleration decrease in the first five
factors; therefore, there is an important contribution of these five factors to the variance;
however, the decrease in other factors started to be horizontal; or, in other words, the
contribution of the variance is close to each other (Büyükötürk, 2002; Eroğlu, 2008).
Graph 1. Screen plot graphic (Eigenvalues according to the factors).
As a result of these conducted processes, the findings regarding the item loads of the total 20
items remaining in the scale according to the factors and the amounts of the factors in
explaining the eigenvalues and variance are presented in Table 4.
Table 4. Factor analysis results of the scale as per factors Items Com. Factor F1 F2 F3 F4 F5
Cooperativity
O1 .690 .823
O2 .715 .822
O3 .657 .779
O4 .690 .656
Problem Solving
P3 .566 .731
P4 .573 .723
P5 .532 .666
P2 .427 .658
P1 .534 .634
Critical Thinking
T2 .690 .783
T3 .627 .738
T1 .515 .642
T5 .393 .602
Participatory Educational Research (PER), 6(1);10-26, 1 June, 2019
Participatory Educational Research (PER)
-17-
Algorithmic
Thinking
A6 .647 .709
A3 .580 .708
A4 .606 .698
A1 .467 .650
Creativity
C5 .591 .762
C4 .529 .615
C1 .400 .570
Eigenvalues 4.92 2.30 1.70 1.23 1.09
Explained variance 13.05 12.46 11.96 11.11 7.72
As shown in Table 4, The Cooperativity factor of the scale contains 4 items and the factor
loads vary between 0.656 and 0.823. The eigenvalues of this factor is 4.92; the contribution it
provides to the total variance is 13.05%. Problem solving factor contains 5 items. Factor loads
of items are between 0.634 and 0.731. The eigenvalues of this factor is 2.30; the contribution
it provides to the total variance is 12.46%. The Critical Thinking factor contains 4 items.
Factor loads of items are between 0.602 and 0.783. The eigenvalues of this factor is 1.70; the
contribution it provides to the total variance is 11.96%. The Algorithmic Thinking factor
contains 4 items. Factor loads of items are between 0.650 and 0.709. The eigenvalues of this
factor is 1.23; the contribution it provides to the total variance is 11.11%. The Creativity
factor contains 3 substances. Factor loads of items are between 0.570 and 0.762. The
eigenvalues of this factor is 1.09; the contribution it provides to the total variance is 7.72%.
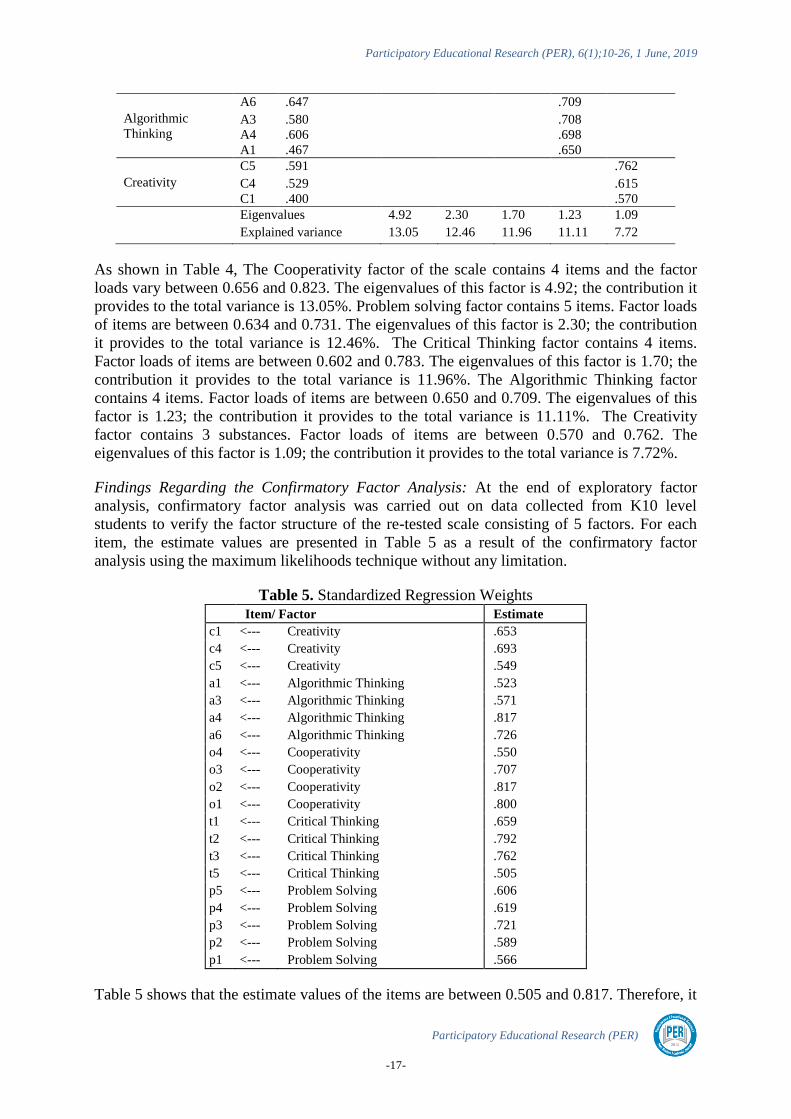
Findings Regarding the Confirmatory Factor Analysis: At the end of exploratory factor
analysis, confirmatory factor analysis was carried out on data collected from K10 level
students to verify the factor structure of the re-tested scale consisting of 5 factors. For each
item, the estimate values are presented in Table 5 as a result of the confirmatory factor
analysis using the maximum likelihoods technique without any limitation.
Table 5. Standardized Regression Weights
Item/ Factor Estimate
c1 <--- Creativity .653
c4 <--- Creativity .693
c5 <--- Creativity .549
a1 <--- Algorithmic Thinking .523
a3 <--- Algorithmic Thinking .571
a4 <--- Algorithmic Thinking .817
a6 <--- Algorithmic Thinking .726
o4 <--- Cooperativity .550
o3 <--- Cooperativity .707
o2 <--- Cooperativity .817
o1 <--- Cooperativity .800
t1 <--- Critical Thinking .659
t2 <--- Critical Thinking .792
t3 <--- Critical Thinking .762
t5 <--- Critical Thinking .505
p5 <--- Problem Solving .606
p4 <--- Problem Solving .619
p3 <--- Problem Solving .721
p2 <--- Problem Solving .589
p1 <--- Problem Solving .566
Table 5 shows that the estimate values of the items are between 0.505 and 0.817. Therefore, it
Adapting Computational Thinking Scale (CTS) for Chinese High School Students Özgen Korkmaz, Xuemei Bai
Participatory Educational Research (PER)
-18-
can be said that the estimate values are generally near to 0.70 and that there are no values that
are far from 0.70. In confirmatory factor analysis, model-data compatibility is examined
(Kline, 1994; Tabachnick & Fidell, 2001: Cited in Gülbahar & Büyüköztürk, 2008). In the
confirmatory factor analysis, a large number of adjustment indexes are used to assess the
validity of the model. Among these, the most frequently used ones are Chi-Square, the
goodness fit index (GFI), the corrected goodness fit index (AGFI), the square root of mean
errors (RMR or RMS), and the mean square root of approximate errors (RMSEA) (Gülbahar
& Büyüközütürk, 2008). In the literature, if the ratio of (χ2/SD) calculated with DFA is less
than 5, it can be seen as an indicator of the model's good compatibility with real data
(MacCallum et al., 1996; Sumer, 2000). For model data compatibility, it is expected that GFI
and AGFI values be higher than90, RMS or standardized RMS and RMSEA values be lower
than ,05 (Sumer, 2000; Kline, 2005; Şimşek, 2007). On the other hand the smallness of GFI
value from 0.85, the highness of AGFI value from 0.80 and the smallness of RMS value from
0.10 is taken as criteria indicating the compatibility of model with actual data (Anderson &
Gerbing, 1984; Marsh et al., 1988; Sümer, 2000; Kline, 2005; Şimsek, 2007).
The confirmatory factor analysis is based on the principle that the correlations between the
observed and the unobserved variables are evaluated and tested as a hypothesis (Pohlmann,
2004). In this context, if the values obtained from confirmatory factor analysis are in the
range of χ2/D<3; 0<RMSEA<0.05; 0≤s-RMR≤0.05; 0.97≤NFI≤1; 0.97≤CFI≤1; 0.95≤GFI≤1;
0.95≤AGFI≤1 and 0.95 ≤ IFI ≤ 1. they show perfect fit, and if they are in the range of
χ2/D<5; 0.06≤RMSEA<0.08; 0.06≤S-RMR≤0.08; 0.90≤NFI≤0.96; 0.90≤CFI≤0.96;
0.90≤GFI≤0.96; 0.90≤AG≤0.96; 0.90≤IFI≤0.96 and 0.90 ≤ IFI ≤ 0.96 they show acceptable
compatibility (Kline, 2005; Şimşek, 2007). When the goodness of fit values obtained for CTS
are examined, It was found as χ2(SD=160, n=379)= 311.132 p<.001, CMIN/DF=1.945, RMSEA=
0.050, S-RMR= 0.043, GFI= 0.92, AGFI= 0.90, CFI= 0.93 and IFI= 0.93. According to these
values, it can be said that χ2/D, RMSEA and S-RMR observed fit values were excellent; CFI,
GFI, AGFI and IFI observed fit values were acceptable (Kline, 2005; Şimşek, 2007). In other
words, this model obtained shows that the factors are verified by means of the data. The
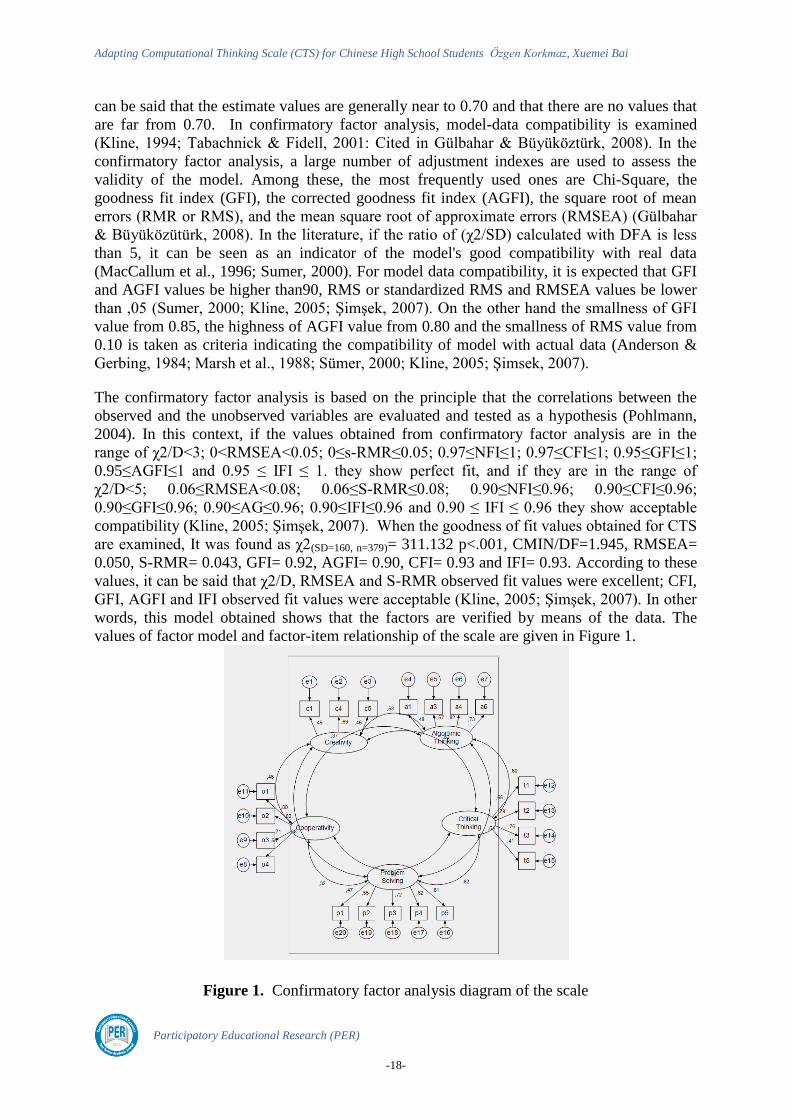
values of factor model and factor-item relationship of the scale are given in Figure 1.
Figure 1. Confirmatory factor analysis diagram of the scale
Participatory Educational Research (PER), 6(1);10-26, 1 June, 2019
Participatory Educational Research (PER)
-19-
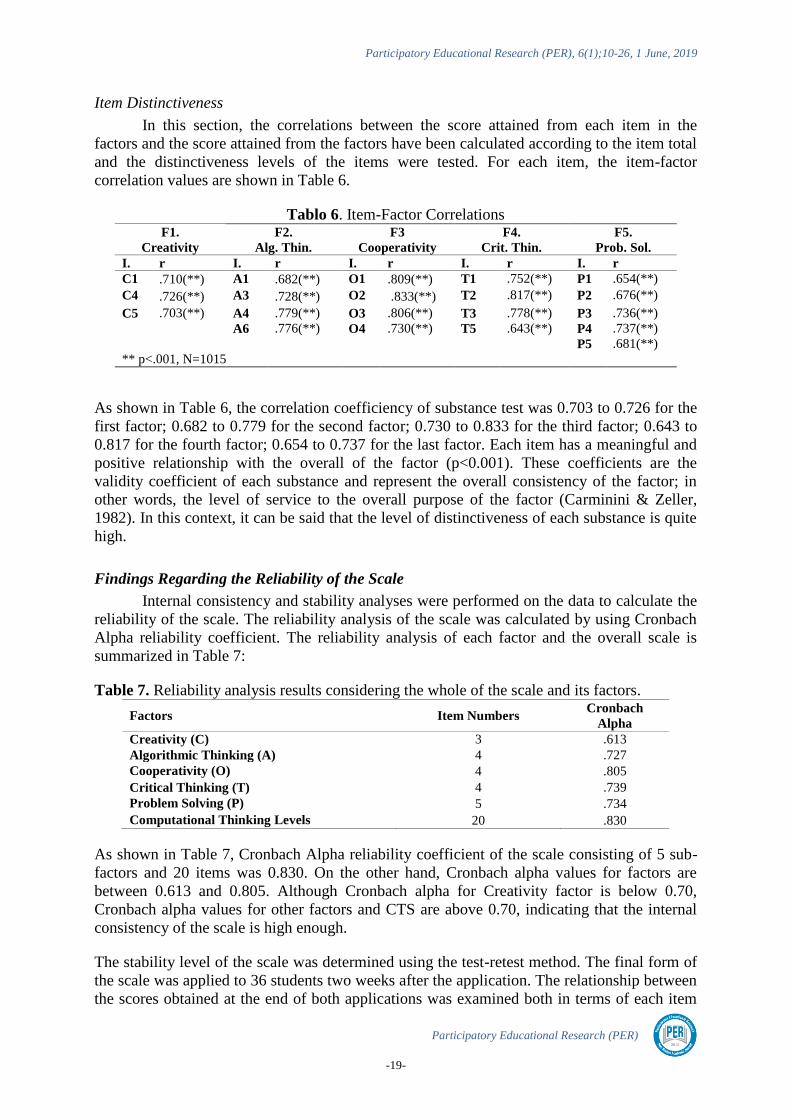
Item Distinctiveness
In this section, the correlations between the score attained from each item in the
factors and the score attained from the factors have been calculated according to the item total
and the distinctiveness levels of the items were tested. For each item, the item-factor
correlation values are shown in Table 6.
Tablo 6. Item-Factor Correlations F1.
Creativity
F2.
Alg. Thin.
F3
Cooperativity
F4.
Crit. Thin.
F5.
Prob. Sol.
I. r I. r I. r I. r I. r
C1 .710(**) A1 .682(**) O1 .809(**) T1 .752(**) P1 .654(**)
C4 .726(**) A3 .728(**) O2 .833(**) T2 .817(**) P2 .676(**)
C5 .703(**) A4 .779(**) O3 .806(**) T3 .778(**) P3 .736(**)
A6 .776(**) O4 .730(**) T5 .643(**) P4 .737(**)
P5 .681(**)
** p<.001, N=1015
As shown in Table 6, the correlation coefficiency of substance test was 0.703 to 0.726 for the
first factor; 0.682 to 0.779 for the second factor; 0.730 to 0.833 for the third factor; 0.643 to
0.817 for the fourth factor; 0.654 to 0.737 for the last factor. Each item has a meaningful and
positive relationship with the overall of the factor (p<0.001). These coefficients are the
validity coefficient of each substance and represent the overall consistency of the factor; in
other words, the level of service to the overall purpose of the factor (Carminini & Zeller,
1982). In this context, it can be said that the level of distinctiveness of each substance is quite
high.
Findings Regarding the Reliability of the Scale
Internal consistency and stability analyses were performed on the data to calculate the
reliability of the scale. The reliability analysis of the scale was calculated by using Cronbach
Alpha reliability coefficient. The reliability analysis of each factor and the overall scale is
summarized in Table 7:
Table 7. Reliability analysis results considering the whole of the scale and its factors.
Factors Item Numbers Cronbach
Alpha
Creativity (C) 3 .613
Algorithmic Thinking (A) 4 .727
Cooperativity (O) 4 .805
Critical Thinking (T) 4 .739
Problem Solving (P) 5 .734
Computational Thinking Levels 20 .830
As shown in Table 7, Cronbach Alpha reliability coefficient of the scale consisting of 5 sub-
factors and 20 items was 0.830. On the other hand, Cronbach alpha values for factors are
between 0.613 and 0.805. Although Cronbach alpha for Creativity factor is below 0.70,
Cronbach alpha values for other factors and CTS are above 0.70, indicating that the internal
consistency of the scale is high enough.
The stability level of the scale was determined using the test-retest method. The final form of
the scale was applied to 36 students two weeks after the application. The relationship between
the scores obtained at the end of both applications was examined both in terms of each item
Adapting Computational Thinking Scale (CTS) for Chinese High School Students Özgen Korkmaz, Xuemei Bai
Participatory Educational Research (PER)
-20-
and in terms of the overall scale. In this way, the ability to make stable measurements of both
the items and the overall of the scale has been tested and the results are summarized in Table
8.
Table 8. Test-retest results F1.
Creativity
F2.
Alg. Think.
F3
Cooperativity
F4.
Crit. Thin.
F5.
Prob. Sol.
I. r I. r I. r I. r I. r
C1 .824(**) A1 .612(**) O1 .822(**) T1 .763(**) P1 .803(**)
C4 .668(**) A3 .769(**) O2 .805(**) T2 .877(**) P2 .930(**)
C5 .652(**) A4 .859(**) O3 .805(**) T3 .905(**) P3 .981(**)
A6 .730(**) O4 .427(**) T5 .898(**) P4 .982(**)
P5 .908(**)
F1 .784(**) F2 .884(**) F3 .894(**) F4 .936(**) F5 .978(**)
Total .923(**)
N: 36; **=p<0.001
Correlation coefficients obtained by test-retest method of each item change between 0.427
and 0.982 and they are observed that each relationship is meaningful and positive in Table 8.
Correlation coefficients obtained by test-retest method of the factors forming the scale range
between .784 and .978. The correlation between total scores is .923 and it is observed that
each relationship is meaningful and positive. Accordingly, it can be said that the scale can
make stable measurements.
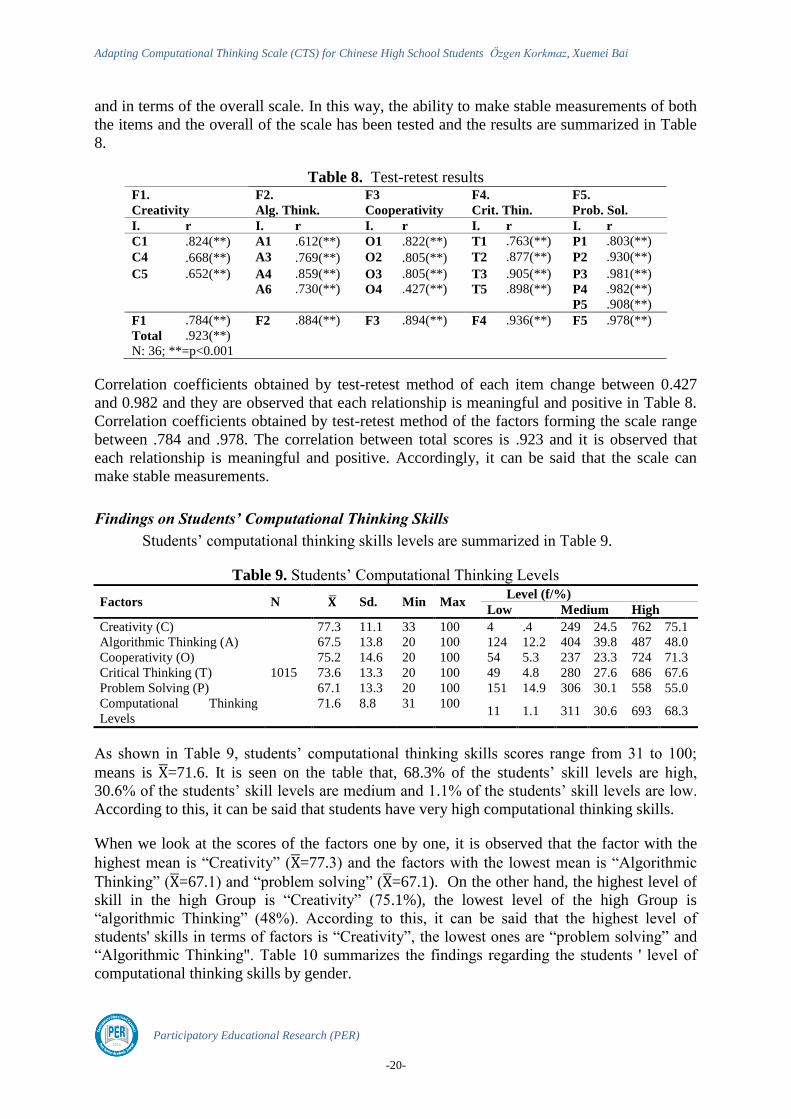
Findings on Students’ Computational Thinking Skills
Students’ computational thinking skills levels are summarized in Table 9.
Table 9. Students’ Computational Thinking Levels
Factors N Sd. Min Max Level (f/%)
Low Medium High
Creativity (C)
1015
77.3 11.1 33 100 4 .4 249 24.5 762 75.1
Algorithmic Thinking (A) 67.5 13.8 20 100 124 12.2 404 39.8 487 48.0
Cooperativity (O) 75.2 14.6 20 100 54 5.3 237 23.3 724 71.3
Critical Thinking (T) 73.6 13.3 20 100 49 4.8 280 27.6 686 67.6
Problem Solving (P) 67.1 13.3 20 100 151 14.9 306 30.1 558 55.0
Computational Thinking
Levels
71.6 8.8 31 100 11 1.1 311 30.6 693 68.3
As shown in Table 9, students’ computational thinking skills scores range from 31 to 100;
means is =71.6. It is seen on the table that, 68.3% of the students’ skill levels are high,
30.6% of the students’ skill levels are medium and 1.1% of the students’ skill levels are low.
According to this, it can be said that students have very high computational thinking skills.
When we look at the scores of the factors one by one, it is observed that the factor with the
highest mean is “Creativity” ( =77.3) and the factors with the lowest mean is “Algorithmic
Thinking” ( =67.1) and “problem solving” ( =67.1). On the other hand, the highest level of
skill in the high Group is “Creativity” (75.1%), the lowest level of the high Group is
“algorithmic Thinking” (48%). According to this, it can be said that the highest level of
students' skills in terms of factors is “Creativity”, the lowest ones are “problem solving” and
“Algorithmic Thinking". Table 10 summarizes the findings regarding the students ' level of
computational thinking skills by gender.
Participatory Educational Research (PER), 6(1);10-26, 1 June, 2019
Participatory Educational Research (PER)
-21-
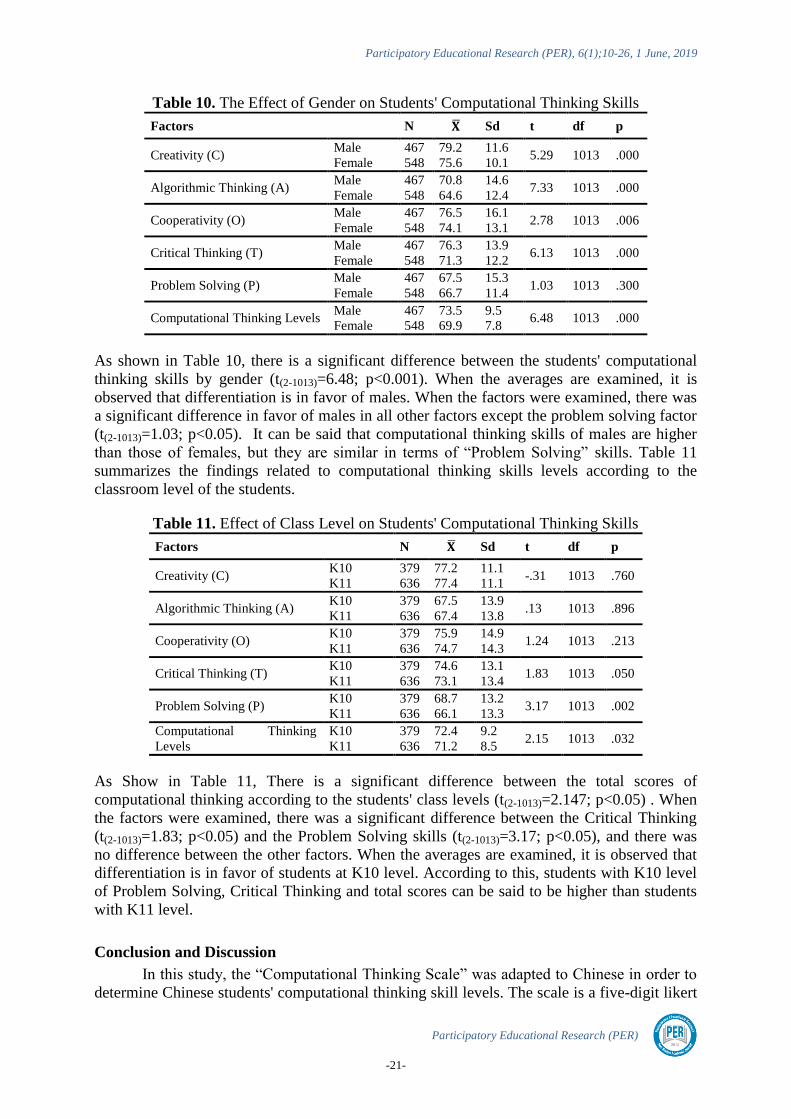
Table 10. The Effect of Gender on Students' Computational Thinking Skills
Factors N Sd t df p
Creativity (C) Male 467 79.2 11.6
5.29 1013 .000 Female 548 75.6 10.1
Algorithmic Thinking (A) Male 467 70.8 14.6
7.33 1013 .000 Female 548 64.6 12.4
Cooperativity (O) Male 467 76.5 16.1
2.78 1013 .006 Female 548 74.1 13.1
Critical Thinking (T) Male 467 76.3 13.9
6.13 1013 .000 Female 548 71.3 12.2
Problem Solving (P) Male 467 67.5 15.3
1.03 1013 .300 Female 548 66.7 11.4
Computational Thinking Levels Male 467 73.5 9.5
6.48 1013 .000 Female 548 69.9 7.8
As shown in Table 10, there is a significant difference between the students' computational
thinking skills by gender (t(2-1013)=6.48; p<0.001). When the averages are examined, it is
observed that differentiation is in favor of males. When the factors were examined, there was
a significant difference in favor of males in all other factors except the problem solving factor
(t(2-1013)=1.03; p<0.05). It can be said that computational thinking skills of males are higher
than those of females, but they are similar in terms of “Problem Solving” skills. Table 11
summarizes the findings related to computational thinking skills levels according to the
classroom level of the students.
Table 11. Effect of Class Level on Students' Computational Thinking Skills
Factors N Sd t df p
Creativity (C) K10 379 77.2 11.1
-.31 1013 .760 K11 636 77.4 11.1
Algorithmic Thinking (A) K10 379 67.5 13.9
.13 1013 .896 K11 636 67.4 13.8
Cooperativity (O) K10 379 75.9 14.9
1.24 1013 .213 K11 636 74.7 14.3
Critical Thinking (T) K10 379 74.6 13.1
1.83 1013 .050 K11 636 73.1 13.4
Problem Solving (P) K10 379 68.7 13.2
3.17 1013 .002 K11 636 66.1 13.3
Computational Thinking
Levels
K10 379 72.4 9.2 2.15 1013 .032
K11 636 71.2 8.5
As Show in Table 11, There is a significant difference between the total scores of
computational thinking according to the students' class levels (t(2-1013)=2.147; p<0.05) . When
the factors were examined, there was a significant difference between the Critical Thinking
(t(2-1013)=1.83; p<0.05) and the Problem Solving skills (t(2-1013)=3.17; p<0.05), and there was
no difference between the other factors. When the averages are examined, it is observed that
differentiation is in favor of students at K10 level. According to this, students with K10 level
of Problem Solving, Critical Thinking and total scores can be said to be higher than students
with K11 level.
Conclusion and Discussion
In this study, the “Computational Thinking Scale” was adapted to Chinese in order to
determine Chinese students' computational thinking skill levels. The scale is a five-digit likert
Adapting Computational Thinking Scale (CTS) for Chinese High School Students Özgen Korkmaz, Xuemei Bai
Participatory Educational Research (PER)
-22-
type scale, consisting of 20 items that can be collected under five factors. Exploratory and
confirmatory factor analysis was performed to verify the factor structure of the scale. The
factor analysis is based on the analysis of the factors, the factor load, the factors' eigenvalues,
and the explanatory variance ratios of the factors and it can be said that the scale is a scale
with structural validity. A confirmatory factor analysis was carried out to verify the factor
structures of the scale, which was determined to be composed of 5 factors as a result of
exploratory factor analysis. According to the results of confirmatory factor analysis, the
observed values of the scale model were determined to be acceptable for the CFI, GFI, AGFI
and IFI indices, and to be perfect for the χ2/D, RMSEA and S-RMR.
The correlation between the score obtained from each item and the score obtained from the
factor to which the item belongs is used as a criterion in terms of understanding the level of
the item to serve the overall purpose of the factor (Balci, 2009). In this respect, the correlation
between each item of the scale and the points obtained from the factor to which the item
belongs varies between 0.643 and 0.833. It can be said that each item in the scale and each
factor serves a significant purpose to measure the quality of the scale in general and each item
is distinguished at the desired level. Internal consistency coefficients of the scale were
calculated using the Cronbach Alpha formula. Cronbach Alpha reliability coefficient of the
scale was determined as .830. Stability level of the scale test- retest method and obtained the
correlation coefficients were determined to be between .784 -.978 and the correlation in the
range of the total score was .923. It can be said that the scale can perform reliable
measurements within the framework of these values. As a matter of fact, the reliability
coefficient of 0.70 and above is considered to be an indicator of the reliability of the scale
(Büyüközütk, 2002; Gorsuch, 1983). As a result, it can be said that “Computational thinking
Scale” is a valid and reliable scale that can be used to determine computational thinking skill
levels of high school students at K10 and K11 levels in China.
On the other hand, the following results have been obtained regarding the students'
computational thinking skills:
Students' computational thinking skills are quite high. In terms of factors, the students’
highest level skills are “Creativity” and the lowest ones are “Problem Solving” and
“Algorithmic Thinking”. Similar results were obtained in the scope of the research conducted
by Korkmaz and his colleagues (2015) to examine the computational thinking skills of
university students in terms of different variables. In this research, it is emphasized that
students perceive their own computational thinking skills at a moderate and high level. In
addition, it is emphasized that the students’ Problem Solving skills are low and cooperation
skills are high then the other skills. In both studies, it was concluded that students’ problem-
Solving and algorithmic thinking skills were lower than other skills. If the students are facing
some obstacles while trying to gain access to a specific purpose or understanding, there is a
problem for that person (Aksoy, 2004). Learning to overcome the problems students may face
in the future is one of the primary goals of the schools. The process of solving the problem
should be combined and the problem should be used in the solution (Soylu & Soylu, 2006).
Algorithmic thinking is defined as the ability to understand, implement, evaluate and produce
algorithms (Brown, 2015). In summary, algorithmic thinking and problem-solving skills are
important skills among the 21st century’s skills. It can be said that the students have one of
these skills, which means that they can have the other skills. Therefore, it can be said that it is
natural for these two skills to be involved in the lowest or highest group together.
In terms of total scores and factors, computational thinking kills of males are higher than
Participatory Educational Research (PER), 6(1);10-26, 1 June, 2019
Participatory Educational Research (PER)
-23-
females’, but similar for Problem Solving. Research conducted by Korkmaz and his
colleagues (2015) shows that gender is effective on critical thinking skills, and that males feel
more confident about critical thinking skills than females. In the study conducted by Korkmaz
(2009), although there is no difference in the tendency and levels of critical thinking by
gender, males are more curious and more confident than female students. In addition, it is
possible to come up with the results that males feel more comfortable about using computer
technologies than females.
Problem solving, Critical thinking and total scores of K10 level students in terms of
computational thinking skills are higher than K11 level students. In the research conducted by
Korkmaz and his colleagues (2015), similarly, the computational thinking skills of graduate
students decrease as the class level progresses. Accordingly, it can be said that schools have
not been able to contribute to computational thinking skills during the education process.
As a result, if computational thinking skills are summarized as a kind of problem-solving
approach (ISTE, 2015; Wing, 2006; Barr, Harrison & Conery, 2011) that strengthens human
thinking skills with technology, it can be said that it is important for individuals to acquire
and develop these skills within their educational processes. In particular, it is stated that when
we examine the above-mentioned factors (creative thinking, algorithmic thinking, critical
thinking, problem solving and cooperation skills), it is stated that individuals will have these
skills in school age, develop themselves and have a digital age learning culture (ISTE, 2015;
Barr et al., 2011; Brown, 2015; Aksoy, 2004; Günüç, Odabaşı & Kuzu, 2013; Grover & Pea,
2013; Lye & Koh, 2014). Barr and his colleagues (2011) emphasize that students should
acquire these skills in school age so that they can transfer these skills to other problem
situations. Brown (2015) emphasized that developing these skills in schools would be an
important gain in considering that everyday life is surrounded by algorithms and complex
problems. Based on the results achieved by this research and the literature, it is recommended
that students frequently take part in activities that aim to improve their problem solving and
algorithmic thinking skills, especially in the context of different courses.
References
Aggarwal A., Gardner -Mc Cune C. & Touretzky, D. S. (2017). Evaluating the Effect of
Using Physical Manipulatives to Foster Computational Thinking in Elementary
School, The 2017 ACM SIGCSE Technical Symposium on Computer Science
Education. ACM,9-14.
Aksoy, B. (2004). Coğrafya öğretiminde probleme dayalı öğrenme yaklaşımı[The Problem-
Based Learning Approach in Geography Teaching ]. (Unpublished master’s thesis).
Gazi University, Institute of Education Sciences, Ankara.
Anderson, J. C. & Gerbing, D. W. (1984). The effect of sampling error on convergence,
improper solutions, and goodness-offit indices for maximum likelihood confirmatory
factor analysis. Psychometrika, 49, 155-173.
Balcı, A. (2009). Sosyal bilimlerde araştırma: Yöntem, teknik ve ilkeler [Research in social
science: Methods, techniques and principles]. Ankara: PegemA Pub.
Barr, D., Harrison, J. & Conery, L (2011). Computational Thinking: A Dijital Age Skill for
Everyone, Available at: http://files.eric.ed.gov/fulltext/EJ918910.pdf
Brennan K. & Resnick M. (2012). New Frameworks for Studying and Assessing the
Development of Computational Thinking. The 2012Annual Meeting of the American
Educational Research Association,1-25.
Adapting Computational Thinking Scale (CTS) for Chinese High School Students Özgen Korkmaz, Xuemei Bai
Participatory Educational Research (PER)
-24-
Brown, W. (2015). Introduction to Algorithmic Thinking. Available at:
www.cs4fn.com/algoritmicthinking.php
Büyüköztürk, Ş. (2002). Sosyal bilimler için veri analizi el kitabı [Data analysis for social
sciences hand book]. Ankara: PegemA Pub.
Carmines, E.G. & Zeller, R.A. (1982). Reliability and validity assessment. 5th
ed. Beverly
Hills: Sage Publications Inc.
Chen, G., Shen, J., Barth-Cohe, L., Jiang, S., Huang, X. & Eltoukhy, M. (2017).
Assessing Elementary Students’ Computational Thinking in Everyday Reasoning and
Robotics Programming. Computers & Education, 109: 162-175.
CSTA (2016). K-12 Computer Science Standards. [2018-06-26].
https//c.ymcdn.com/sites/www.csteachers.org/resource/resmgr/Docs/Standards/2016St
andards Revision/INTERIM_Standards FINAL_07222.pdf.
CSTA and ISTE (2011). Computational Thinking in K-12 Education Lead-ership Toolkit.
[2018-06-26].http ://csta.acm.org/Curriculum/sub/Curr Files/471.11CTLeadershipt
Toolkit-SP-v F.pdf.
Deniz, K.Z. (2007). The adaptation of psychological scales. Ankara University, Journal of
Faculty of Educational Sciences, 40(1), 1-16.
Eroğlu, A. (2008). Faktör analizi [Factor analyses]. In: Kalaycı, Ş. (ed), SPSS Uygulamalı
Çok Değişkenli İstatistik Teknikleri [Statistics Techniques with Multi Variable in
SPSS Applications], Ankara: Asil Publishers, 321-331.
Esteves, M., Fonseca B., Morgado L & et al. (2011). Improving Teaching and Learning of
Computer Programming through the Use of the SecondLife Virtual World. British
Journal of Educational Technology, 42(4): 624-637.
Field, A. (2000). Discovering Statistics using SPSS for Windows. London: Thousand Oaks-
New Delhi: Sage Pub.
Gorsuch, R. L. (1983). Factor analysis. Hillsdale: Lawrence Erlbaum Associates.
Grover S. & Pea R. (2013). Computational thinking in K-12: A review of the state of the
field. Educational Researcher, 42 (2), 59–69.
Gülbahar, Y. & Büyüköztürk, Ş. (2008). Adaptation of Assessment Preferences Inverntory to
Turkish. H. U. Journal of Education, 35, 148-161.
Günüç, S. Odabaşı, F. & Kuzu A. (2013). 21. yüzyıl öğrenci özelliklerinin öğretmen adayları
tarafından tanımlanması: Bir twitter uygulaması. The defining characteristics of
students of the 21st century by student teachers: A twitter activity. journal of theory
and practice in education, 9(4): 436-455.
Hambleton, R.K. & Patsula, L. (1999). Increasing the validity of adapted tests: myths to be
avoided an guidelines for improving test adaptation practices. Journal of Applied
Testing Technology, August Issue. Online:
http://data.memberclicks.com/site/atpu/volume%201%20issue%201Increasing%20val
idity.pdf
Iste. (2015). CT Leadership toolkit. Available at http://www.iste.org/docs/ct-documents/ct-
leadershipt-toolkit.pdf?sfvrsn=4.
Kline, P. (1994). An easy guide to factor analysis. London and New York: Routledge.
Kline, R.B. (2005). Principles and practice of structural equation modeling, 2nd
ed, New
York: Guilford Press.
Koh, K.H, Basawapatna, A., Bennett, V. & Repenning, A (2010). Towards the Automatic
Recognition of Computational Thinking for Adaptive Visual Language Learning.
Visual Languages and Human -Centric Computational thinking, 59-66.
Korkmaz, Ö. (2009). The influence of education faculties on students’ critical thinking level
and disposition. Turkish Journal of Educationa Science 7(4):879-902.
Participatory Educational Research (PER), 6(1);10-26, 1 June, 2019
Participatory Educational Research (PER)
-25-
Korkmaz, Ö., Çakır, R. & Özden, M. Y. (2015). Computational thinking levels scale (CTLS)
adaptation for secondary school level. Gazi journal of education sciences, 1(2): 67-86.
Korkmaz, Ö., Çakır, R. & Özden, M.Y. (2017). A validity and reliability study of the
Computational Thinking Scales (CTS). Computers in Human Behaviours. 72:558-569.
(SSCI)
Korkmaz, Ö., Çakır, R., Özden, M. Y, Oluk & A., Sarıoğlu, S. (2015). Investigation of
Individuals’ Computational Thinking Skills in terms of Different Variables, Ondokuz
Mayis University Journal of Faculty of Education, 34(2): 68-87
Lye, S. Y., & Koh, J. H. L. (2014). Review on teaching and learning of computational
thinking through programming: What is next for K-12?. Computers in Human
Behavior, 41, 51-61
MacCallum, R.C., Browne, M.W., & Sugawara, H.M. (1996). Power analysis and
determination of sample size for covariance structure modeling. Psychological
Methods, 1, 130-149.
Marsh, H. W., Balla, J. R. & McDonald, R. P. (1988). Goodness-of-fit indexes in
confirmatory factor analysis: The effect of sample size. Psychological Bulletin, 103,
391-410.
Ozden, M. Y. (2015). Computational thinking.
http://myozden.blogspot.com.tr/2015/06/computational-thinking-bilgisayarca.html.
Pohlmann, J.T. (2004). Use and Interpretation of Factor Analysis in The Journal of
Educational Research: 1992-2002. The Journal of Educational Research, 98(1), 14-23
Román -González, M., Pérez -González, J.C. & Jiménez -Fernández, C. (2016). Which
Cognitive Abilities Underlie Computational Thinking? Criterion Validity of the
Computational Thinking Test. Computers in Human Behavior, 72: 678-691.
Russell, D. W. (2002). In search of underlying dimensions: The use (and abuse) of factor
analysis. Personality and Social Psychology Bulletin, 28, 1629–1646.
Scherer, R.F., Wiebe F.A., Luther, D. C. & Adams J. S. (1988). Dimensionality of coping:
Factor stability using the ways of coping questionnaire, Psychological Reports 62(3),
763-770. PubMed PMID: 3406294.
Şimşek, Ö.F. (2007). Yapısal eşitlik modellemesine giriş [Introduction to structural equation
modeling]. Ankara: Ekinoks Pub., 18-71.
Soylu, Y. & Soylu, C. (2006). The Role of Problem Solving In Mathematics Lessons For
Success. Inönü University Educational Journal, 7(11), 97-111.
Sümer, N. (2000). Structural equation models: Basic concepts and sample applications.
Turkish Psychology Articles, 3(6), 49-74.
Tabachnick, B. G. & Fidell, L.S. (2001). Using multivariate statistics (4th edition). Boston:
Allyn and Bacon.
Tatlidil, H. (2002). Uygulamalı çok değişkenli istatistiksel analiz [Applied multivariate
statistical analysis], Akademi Pub, Ankara
Voogt, J., Fisser, P., Good, J., Mishra, P., & Yadav, A. (2015). Computational thinking
incompulsory education: Towards an agenda for research and practice. Education and
Information Technologies, 20(4), 715-728.
Wing, J. M. (2006). Computational thinking. Communications of the ACM, 49, 33-35.
Yukselturk, E. & Bulut, S. (2009). Gender differences in self-regulated online learning
environment. Educational Technology & Society, 12(3), 12–22.
Adapting Computational Thinking Scale (CTS) for Chinese High School Students Özgen Korkmaz, Xuemei Bai
Participatory Educational Research (PER)
-26-
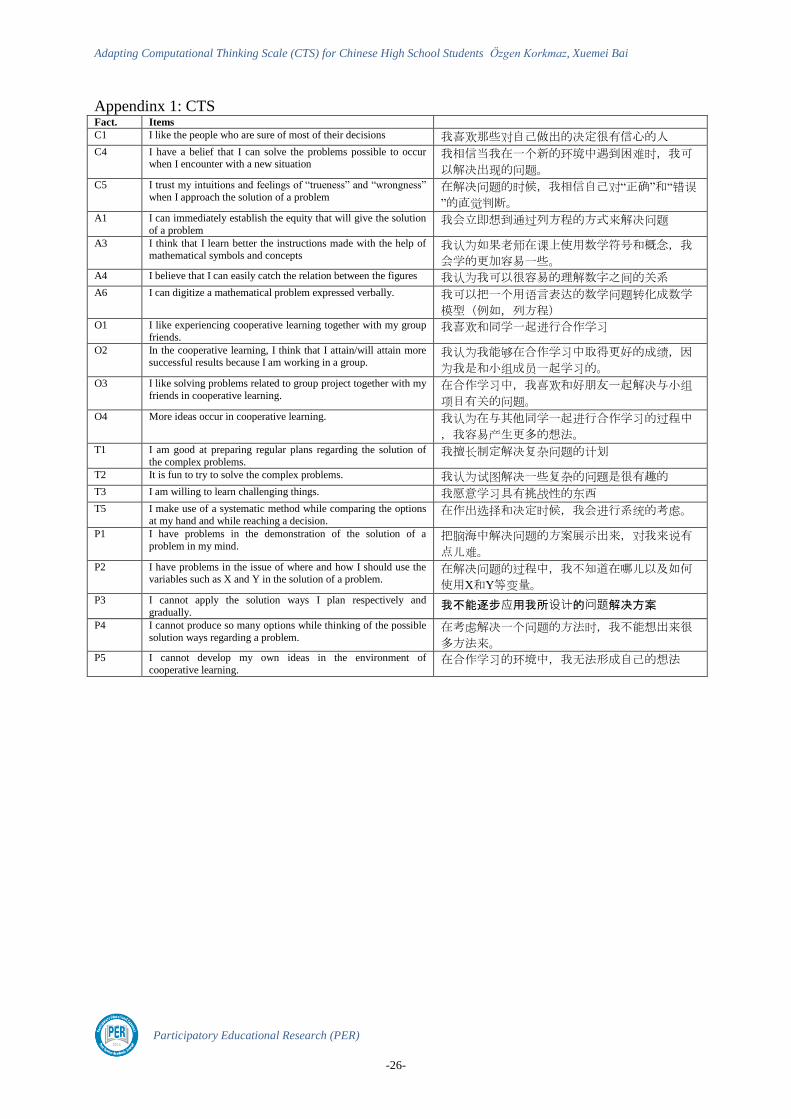
Appendinx 1: CTS Fact. Items
C1 I like the people who are sure of most of their decisions 我喜欢那些对自己做出的决定很有信心的人
C4 I have a belief that I can solve the problems possible to occur when I encounter with a new situation
我相信当我在一个新的环境中遇到困难时,我可
以解决出现的问题。
C5 I trust my intuitions and feelings of “trueness” and “wrongness”
when I approach the solution of a problem 在解决问题的时候,我相信自己对“正确”和“错误
”的直觉判断。
A1 I can immediately establish the equity that will give the solution
of a problem 我会立即想到通过列方程的方式来解决问题
A3 I think that I learn better the instructions made with the help of mathematical symbols and concepts
我认为如果老师在课上使用数学符号和概念,我
会学的更加容易一些。
A4 I believe that I can easily catch the relation between the figures 我认为我可以很容易的理解数字之间的关系
A6 I can digitize a mathematical problem expressed verbally. 我可以把一个用语言表达的数学问题转化成数学
模型(例如,列方程)
O1 I like experiencing cooperative learning together with my group
friends. 我喜欢和同学一起进行合作学习
O2 In the cooperative learning, I think that I attain/will attain more
successful results because I am working in a group. 我认为我能够在合作学习中取得更好的成绩,因
为我是和小组成员一起学习的。
O3 I like solving problems related to group project together with my
friends in cooperative learning. 在合作学习中,我喜欢和好朋友一起解决与小组
项目有关的问题。
O4 More ideas occur in cooperative learning. 我认为在与其他同学一起进行合作学习的过程中
,我容易产生更多的想法。
T1 I am good at preparing regular plans regarding the solution of
the complex problems. 我擅长制定解决复杂问题的计划
T2 It is fun to try to solve the complex problems. 我认为试图解决一些复杂的问题是很有趣的
T3 I am willing to learn challenging things. 我愿意学习具有挑战性的东西
T5 I make use of a systematic method while comparing the options
at my hand and while reaching a decision. 在作出选择和决定时候,我会进行系统的考虑。
P1 I have problems in the demonstration of the solution of a
problem in my mind. 把脑海中解决问题的方案展示出来,对我来说有
点儿难。
P2 I have problems in the issue of where and how I should use the variables such as X and Y in the solution of a problem.
在解决问题的过程中,我不知道在哪儿以及如何
使用X和Y等变量。
P3 I cannot apply the solution ways I plan respectively and
gradually. 我不能逐步应用我所设计的问题解决方案
P4 I cannot produce so many options while thinking of the possible
solution ways regarding a problem. 在考虑解决一个问题的方法时,我不能想出来很
多方法来。
P5 I cannot develop my own ideas in the environment of
cooperative learning. 在合作学习的环境中,我无法形成自己的想法