Embed Size (px)
Citation preview
ADAPT-PT® 2010-Tutorial- 1
ADAPT-PT 2010 Tutorial
Idealization of Design Strip in ADAPT-PT
Update:
April 2010
Copyright © ADAPT Corporation all rights reserved
ADAPT-PT® 2010-Tutorial- 2
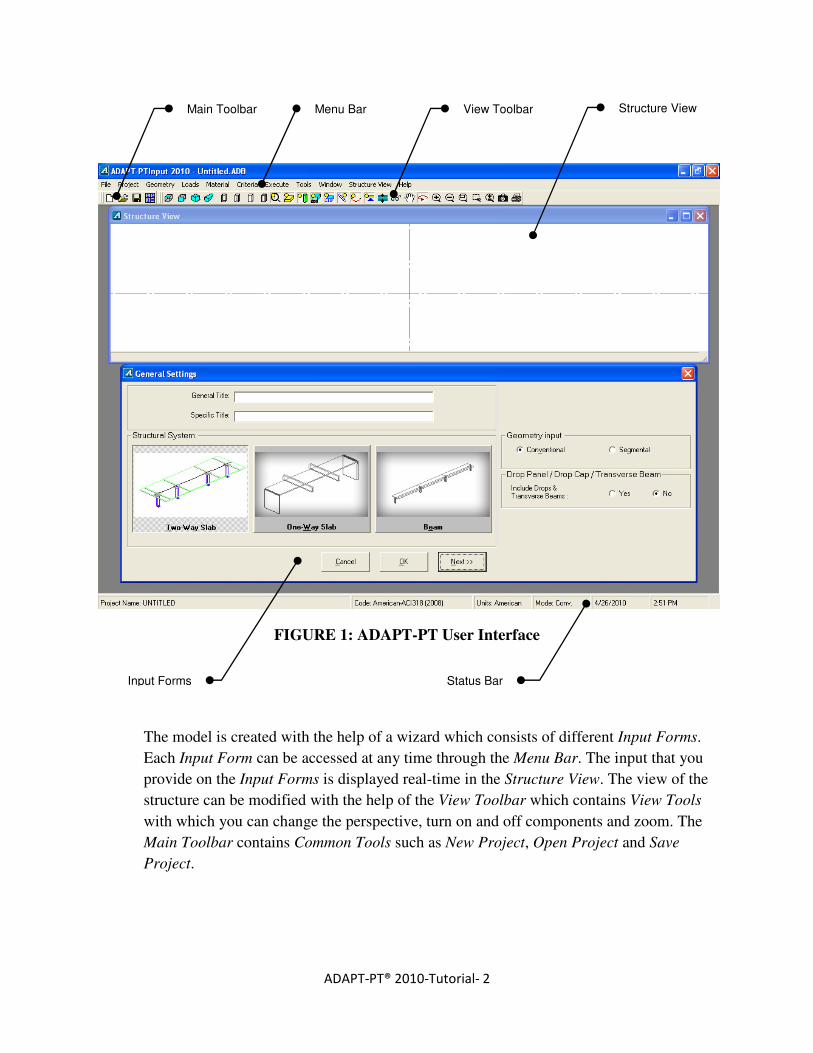
FIGURE 1: ADAPT-PT User Interface
The model is created with the help of a wizard which consists of different Input Forms.
Each Input Form can be accessed at any time through the Menu Bar. The input that you
provide on the Input Forms is displayed real-time in the Structure View. The view of the
structure can be modified with the help of the View Toolbar which contains View Tools
with which you can change the perspective, turn on and off components and zoom. The
Main Toolbar contains Common Tools such as New Project, Open Project and Save
Project.
Menu Bar View Toolbar
Status Bar
Structure View
Input Forms
Main Toolbar
ADAPT-PT® 2010-Tutorial- 3
1 COLUMN-SUPPORTED SLAB (TWO-WAY SYSTEM)
The objective of this tutorial is to explain how a floor strip is idealized from a complete
Floor system in the course of modeling in ADAPT-PT. This tutorial will demonstrate the
step-by-step procedure in ADAPT-PT to generate data, analyze and design a column-
supported slab which is a part of a Floor system. A column-supported slab is generally
considered as a two-way system. The tutorial covers the following features of the
program:
• Generation of input data, using the simple “Conventional” option of the program.
Generation of data for complex geometry is demonstrated in a separate tutorial.
• Design based on the “effective force” method, as opposed to selection of number of
tendons. The application of the program for selection of number of tendons is
reviewed in a separate tutorial.
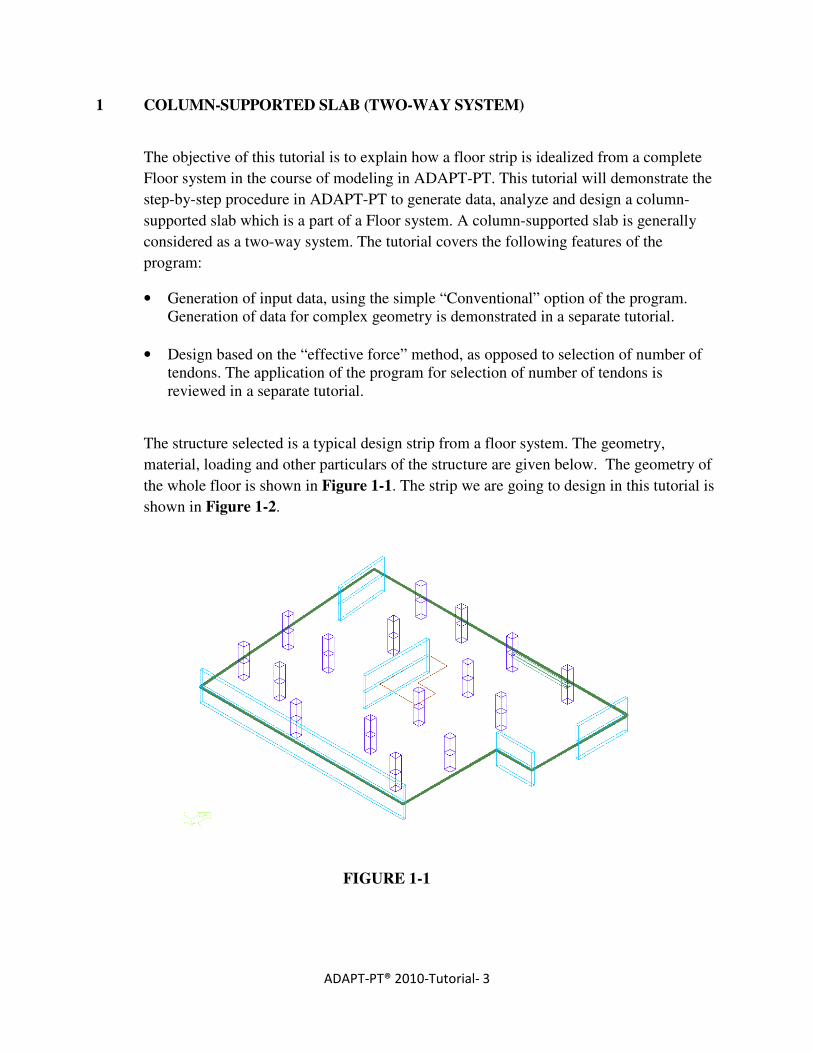
The structure selected is a typical design strip from a floor system. The geometry,
material, loading and other particulars of the structure are given below. The geometry of
the whole floor is shown in Figure 1-1. The strip we are going to design in this tutorial is
shown in Figure 1-2.
FIGURE 1-1
ADAPT-PT® 2010-Tutorial- 4
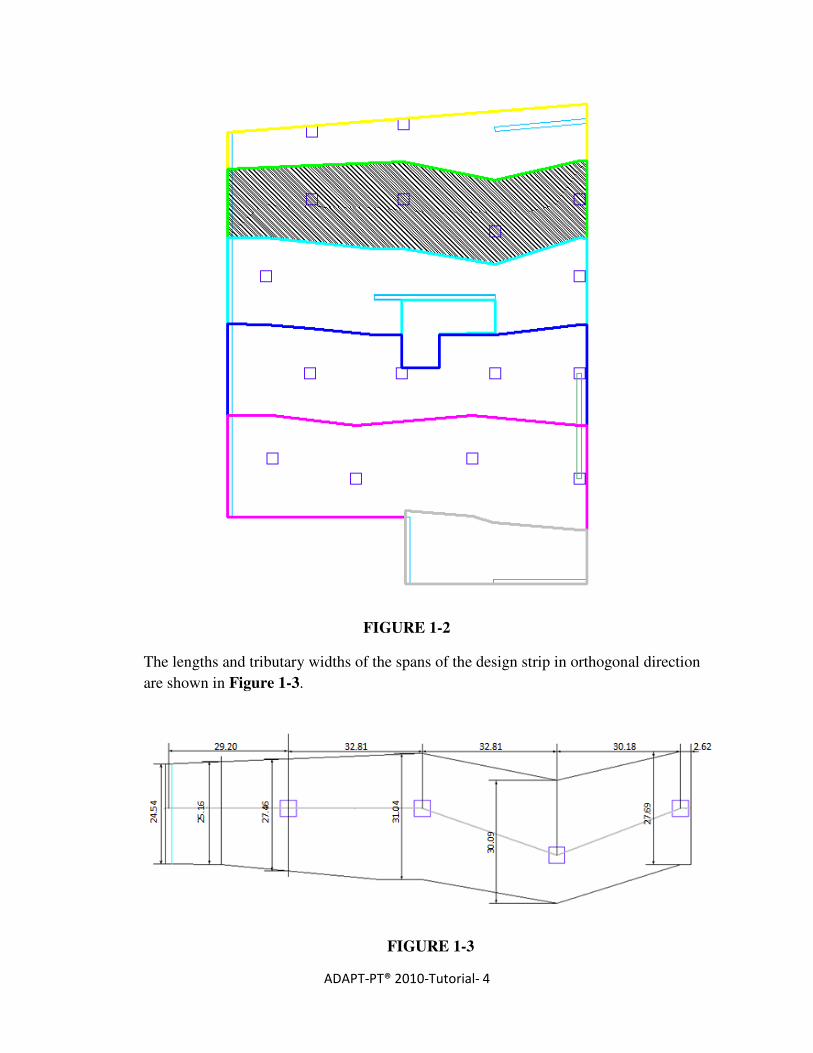
FIGURE 1-2
The lengths and tributary widths of the spans of the design strip in orthogonal direction
are shown in Figure 1-3.
FIGURE 1-3
ADAPT-PT® 2010-Tutorial- 5
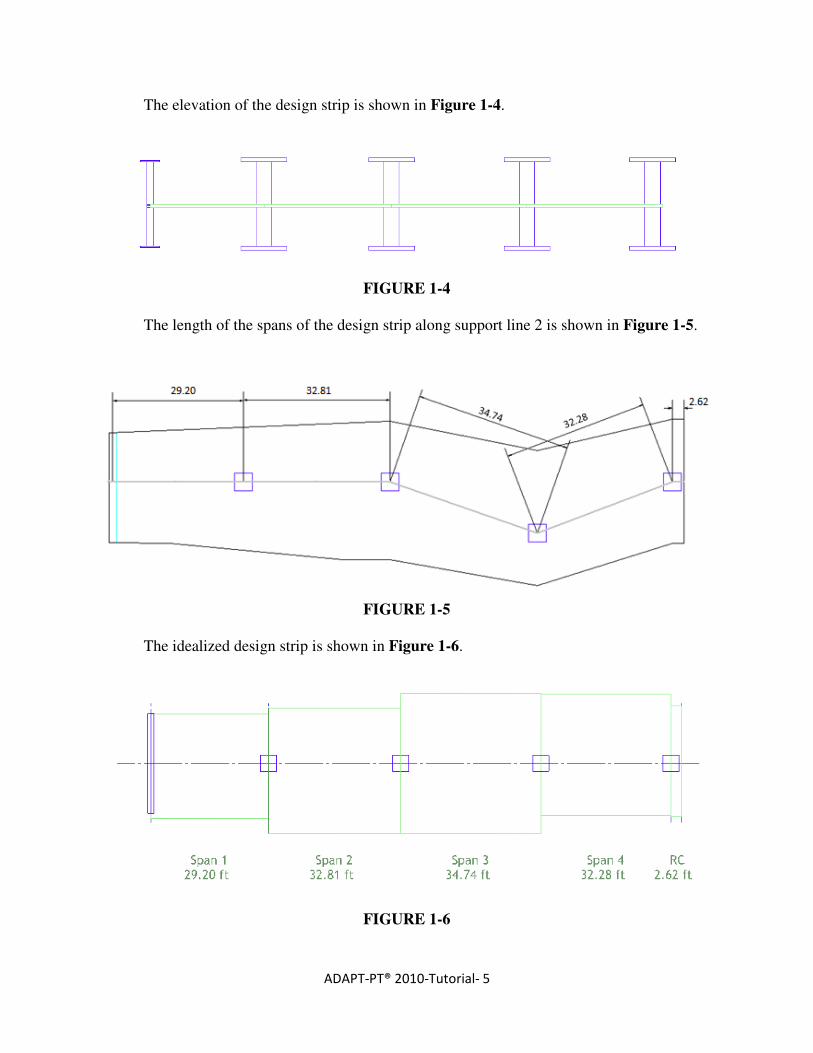
The elevation of the design strip is shown in Figure 1-4.
FIGURE 1-4
The length of the spans of the design strip along support line 2 is shown in Figure 1-5.
FIGURE 1-5
The idealized design strip is shown in Figure 1-6.
FIGURE 1-6
ADAPT-PT® 2010-Tutorial- 6
Thickness of slab = 10 inch
(i) Material Properties
o Concrete:
Compressive strength, f’c = 4000 psi
Weight = 150 pcf
Modulus of Elasticity = 3605 psi
o Prestressing:
Low Relaxation, Unbonded System
Strand Diameter = 0.5 inch
Strand Area = 0.153 inch2
Modulus of Elasticity = 29000 ksi
Ultimate strength of strand, fpu = 270 ksi
Minimum strand cover
From top fiber = 1.5 inch
From bottom fiber
Interior spans = 1.5 inch
Exterior spans = 2 inch
o Nonprestressed Reinforcement:
Yield stress, fy = 60 ksi
Modulus of Elasticity = 29000 ksi
Minimum Rebar Cover = 1 inch Top and Bottom
(ii) Loading
Superimposed Dead load = 30 psf
Live load = 50 psf
1.1 GENERATE THE STRUCTURAL MODEL
In the ADAPT-PT screen, click the Options menu and set the Default Code as
American-ACI318 (2008) / IBC 2009 and Default Units as American.
1.1.1 Edit the Project Information
1.1.1.1 General Settings
Open the new project by clicking either New on the File menu or the New Project button
on the toolbar. This automatically opens the General Settings input screen, as in Figure
1.1-1. You can enter the General Title and /or Specific Title of the project in that window.
For the purpose of this tutorial, enter the General Title as Support Line 2. This will
appear at the top of the first page of the output. Enter Specific Title as Two Way Slab.
This will appear at the top of each subsequent page of the output.
ADAPT-PT® 2010-Tutorial- 7
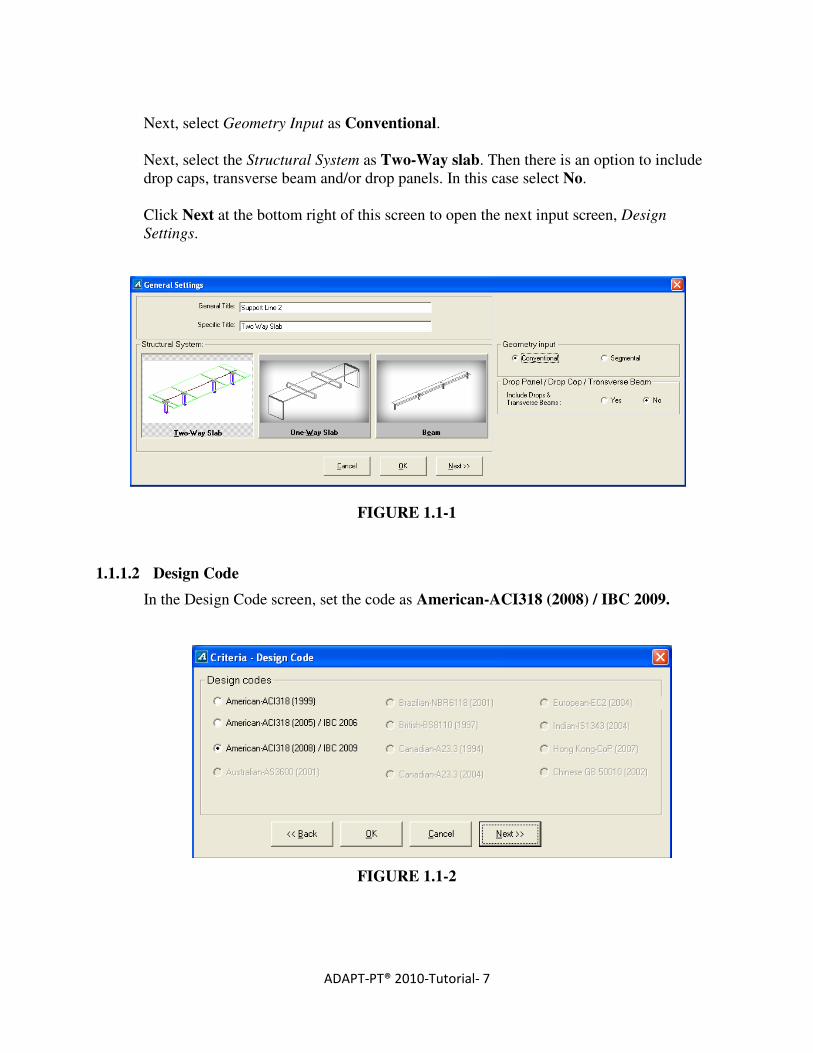
Next, select Geometry Input as Conventional.
Next, select the Structural System as Two-Way slab. Then there is an option to include
drop caps, transverse beam and/or drop panels. In this case select No.
Click Next at the bottom right of this screen to open the next input screen, Design
Settings.
FIGURE 1.1-1
1.1.1.2 Design Code
In the Design Code screen, set the code as American-ACI318 (2008) / IBC 2009.
FIGURE 1.1-2
ADAPT-PT® 2010-Tutorial- 8
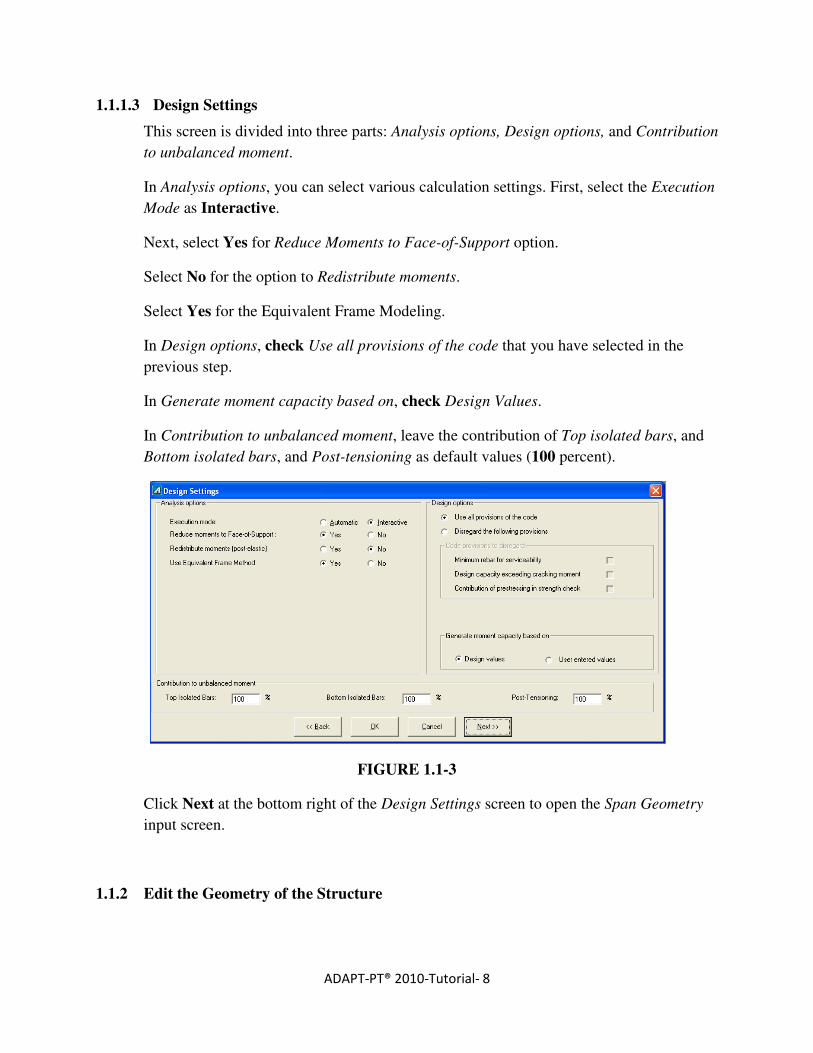
1.1.1.3 Design Settings
This screen is divided into three parts: Analysis options, Design options, and Contribution
to unbalanced moment.
In Analysis options, you can select various calculation settings. First, select the Execution
Mode as Interactive.
Next, select Yes for Reduce Moments to Face-of-Support option.
Select No for the option to Redistribute moments.
Select Yes for the Equivalent Frame Modeling.
In Design options, check Use all provisions of the code that you have selected in the
previous step.
In Generate moment capacity based on, check Design Values.
In Contribution to unbalanced moment, leave the contribution of Top isolated bars, and
Bottom isolated bars, and Post-tensioning as default values (100 percent).
FIGURE 1.1-3
Click Next at the bottom right of the Design Settings screen to open the Span Geometry
input screen.
1.1.2 Edit the Geometry of the Structure
ADAPT-PT® 2010-Tutorial- 9
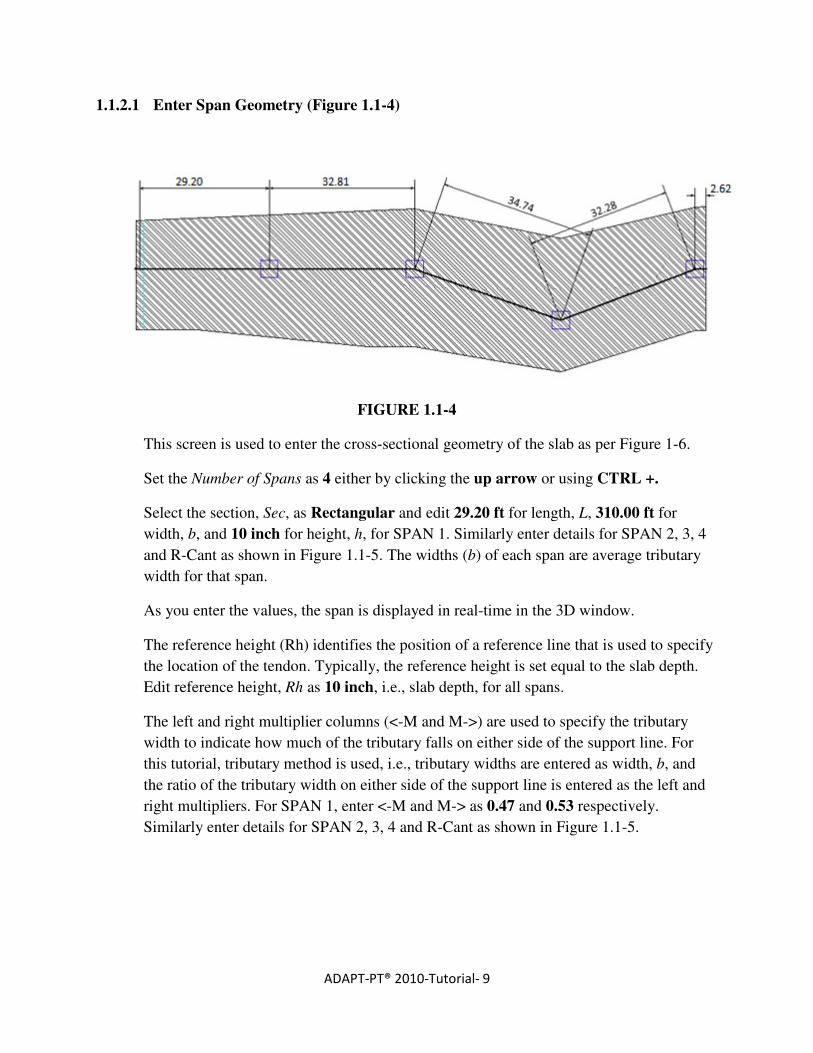
1.1.2.1 Enter Span Geometry (Figure 1.1-4)
FIGURE 1.1-4
This screen is used to enter the cross-sectional geometry of the slab as per Figure 1-6.
Set the Number of Spans as 4 either by clicking the up arrow or using CTRL +.
Select the section, Sec, as Rectangular and edit 29.20 ft for length, L, 310.00 ft for
width, b, and 10 inch for height, h, for SPAN 1. Similarly enter details for SPAN 2, 3, 4
and R-Cant as shown in Figure 1.1-5. The widths (b) of each span are average tributary
width for that span.
As you enter the values, the span is displayed in real-time in the 3D window.
The reference height (Rh) identifies the position of a reference line that is used to specify
the location of the tendon. Typically, the reference height is set equal to the slab depth.
Edit reference height, Rh as 10 inch, i.e., slab depth, for all spans.
The left and right multiplier columns (<-M and M->) are used to specify the tributary
width to indicate how much of the tributary falls on either side of the support line. For
this tutorial, tributary method is used, i.e., tributary widths are entered as width, b, and
the ratio of the tributary width on either side of the support line is entered as the left and
right multipliers. For SPAN 1, enter <-M and M-> as 0.47 and 0.53 respectively.
Similarly enter details for SPAN 2, 3, 4 and R-Cant as shown in Figure 1.1-5.
ADAPT-PT® 2010-Tutorial- 10
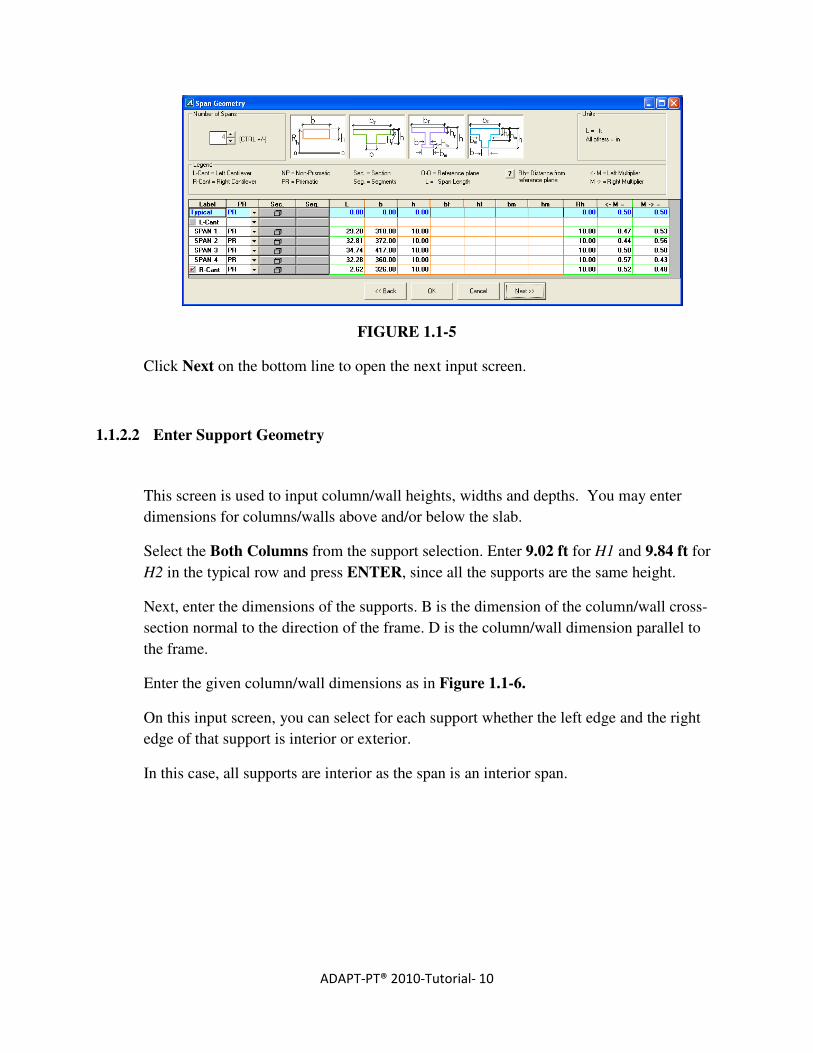
FIGURE 1.1-5
Click Next on the bottom line to open the next input screen.
1.1.2.2 Enter Support Geometry
This screen is used to input column/wall heights, widths and depths. You may enter
dimensions for columns/walls above and/or below the slab.
Select the Both Columns from the support selection. Enter 9.02 ft for H1 and 9.84 ft for
H2 in the typical row and press ENTER, since all the supports are the same height.
Next, enter the dimensions of the supports. B is the dimension of the column/wall cross-
section normal to the direction of the frame. D is the column/wall dimension parallel to
the frame.
Enter the given column/wall dimensions as in Figure 1.1-6.
On this input screen, you can select for each support whether the left edge and the right
edge of that support is interior or exterior.
In this case, all supports are interior as the span is an interior span.
ADAPT-PT® 2010-Tutorial- 11
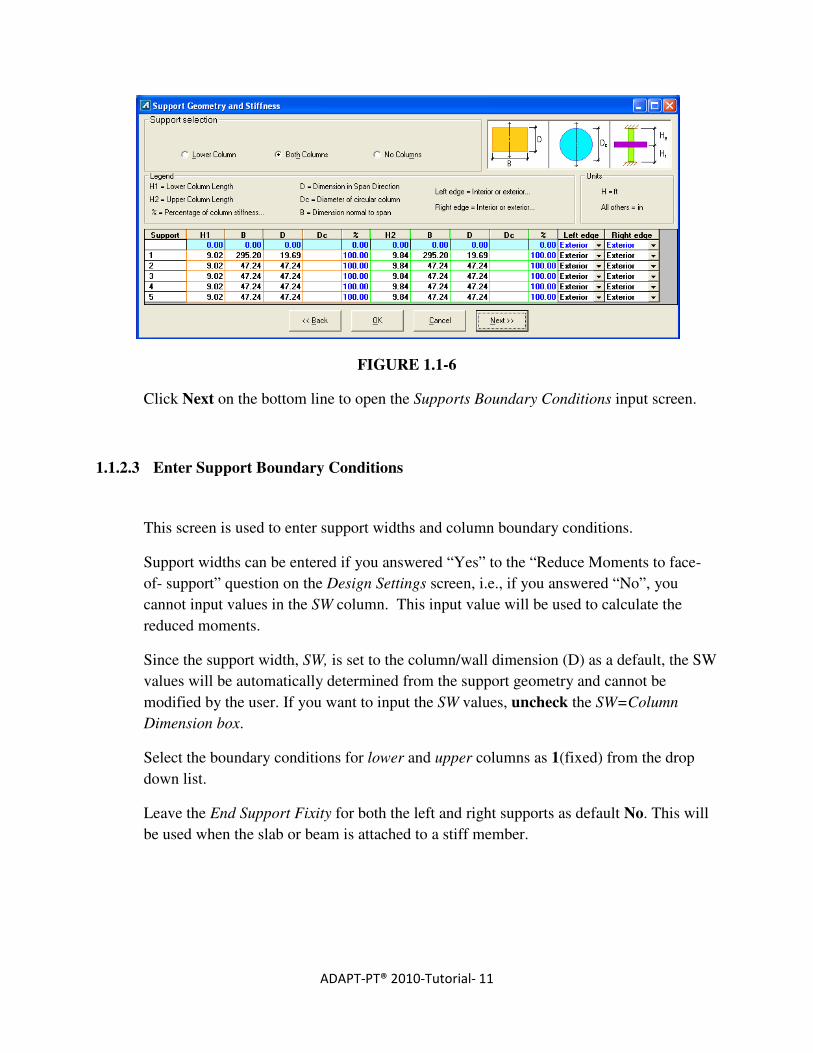
FIGURE 1.1-6
Click Next on the bottom line to open the Supports Boundary Conditions input screen.
1.1.2.3 Enter Support Boundary Conditions
This screen is used to enter support widths and column boundary conditions.
Support widths can be entered if you answered “Yes” to the “Reduce Moments to face-
of- support” question on the Design Settings screen, i.e., if you answered “No”, you
cannot input values in the SW column. This input value will be used to calculate the
reduced moments.
Since the support width, SW, is set to the column/wall dimension (D) as a default, the SW
values will be automatically determined from the support geometry and cannot be
modified by the user. If you want to input the SW values, uncheck the SW=Column
Dimension box.
Select the boundary conditions for lower and upper columns as 1(fixed) from the drop
down list.
Leave the End Support Fixity for both the left and right supports as default No. This will
be used when the slab or beam is attached to a stiff member.
ADAPT-PT® 2010-Tutorial- 12
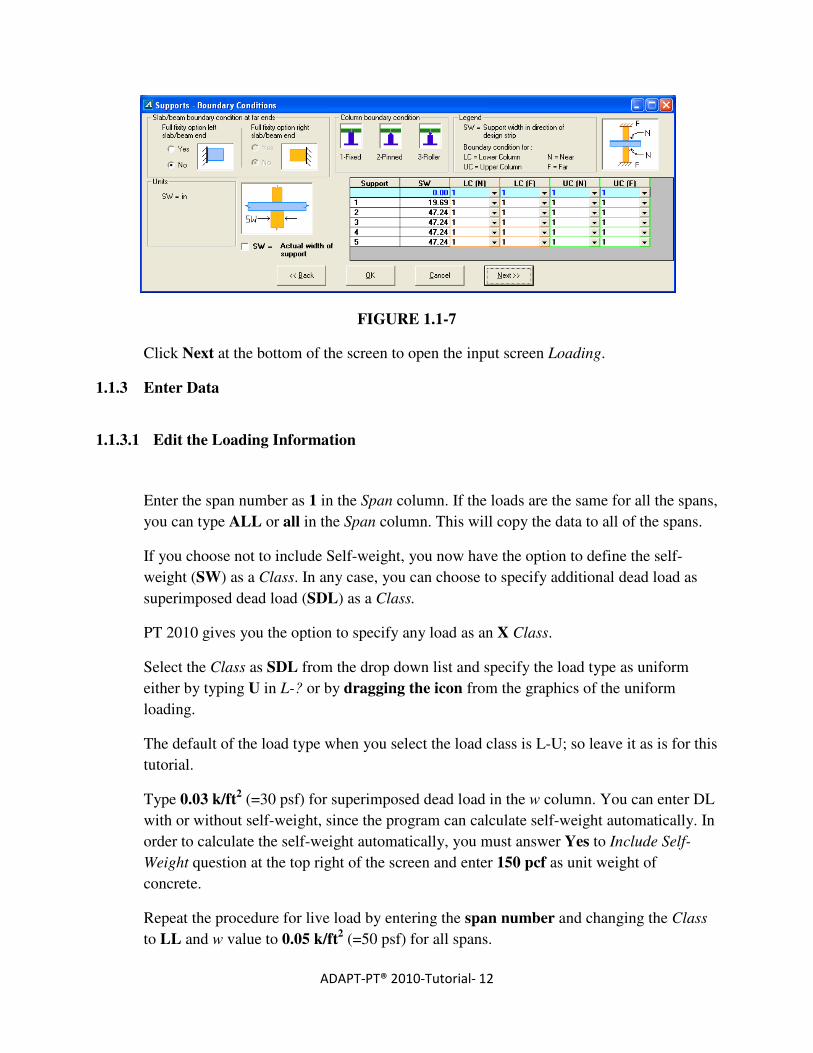
FIGURE 1.1-7
Click Next at the bottom of the screen to open the input screen Loading.
1.1.3 Enter Data
1.1.3.1 Edit the Loading Information
Enter the span number as 1 in the Span column. If the loads are the same for all the spans,
you can type ALL or all in the Span column. This will copy the data to all of the spans.
If you choose not to include Self-weight, you now have the option to define the self-
weight (SW) as a Class. In any case, you can choose to specify additional dead load as
superimposed dead load (SDL) as a Class.
PT 2010 gives you the option to specify any load as an X Class.
Select the Class as SDL from the drop down list and specify the load type as uniform
either by typing U in L-? or by dragging the icon from the graphics of the uniform
loading.
The default of the load type when you select the load class is L-U; so leave it as is for this
tutorial.
Type 0.03 k/ft2 (=30 psf) for superimposed dead load in the w column. You can enter DL
with or without self-weight, since the program can calculate self-weight automatically. In
order to calculate the self-weight automatically, you must answer Yes to Include Self-
Weight question at the top right of the screen and enter 150 pcf as unit weight of
concrete.
Repeat the procedure for live load by entering the span number and changing the Class
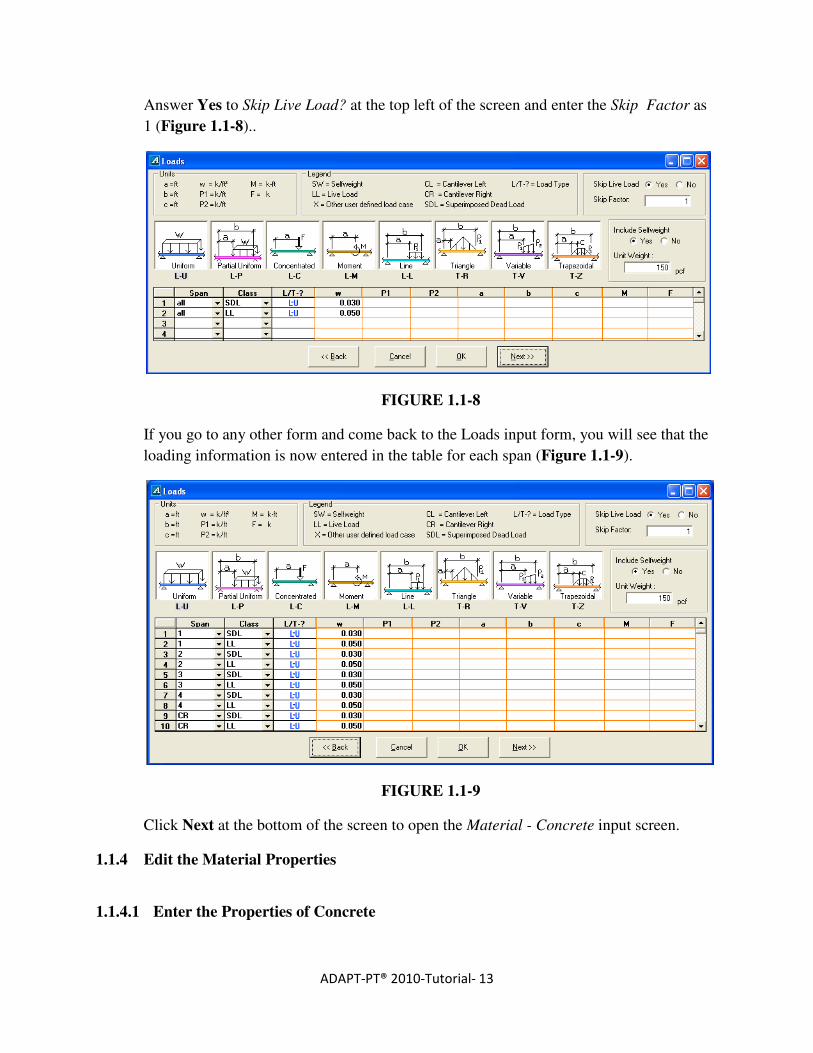
to LL and w value to 0.05 k/ft2 (=50 psf) for all spans.
ADAPT-PT® 2010-Tutorial- 13
Answer Yes to Skip Live Load? at the top left of the screen and enter the Skip Factor as
1 (Figure 1.1-8)..
FIGURE 1.1-8
If you go to any other form and come back to the Loads input form, you will see that the
loading information is now entered in the table for each span (Figure 1.1-9).
FIGURE 1.1-9
Click Next at the bottom of the screen to open the Material - Concrete input screen.
1.1.4 Edit the Material Properties
1.1.4.1 Enter the Properties of Concrete
ADAPT-PT® 2010-Tutorial- 14
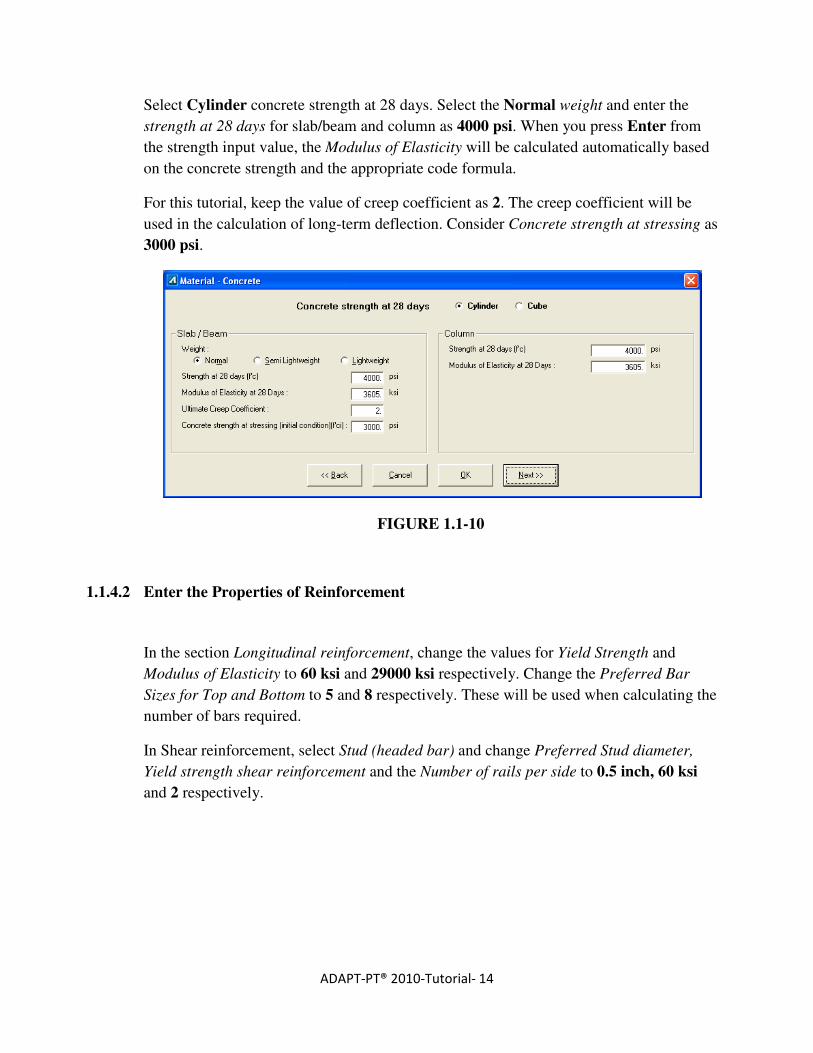
Select Cylinder concrete strength at 28 days. Select the Normal weight and enter the
strength at 28 days for slab/beam and column as 4000 psi. When you press Enter from
the strength input value, the Modulus of Elasticity will be calculated automatically based
on the concrete strength and the appropriate code formula.
For this tutorial, keep the value of creep coefficient as 2. The creep coefficient will be
used in the calculation of long-term deflection. Consider Concrete strength at stressing as
3000 psi.
FIGURE 1.1-10
1.1.4.2 Enter the Properties of Reinforcement
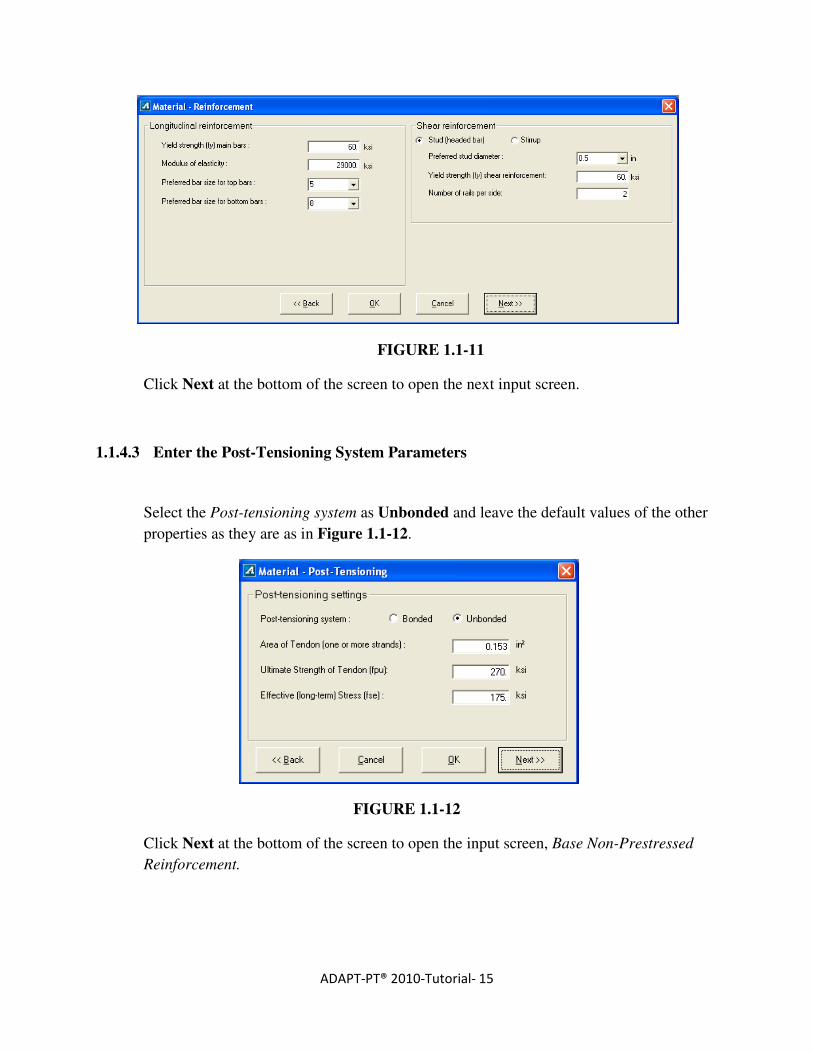
In the section Longitudinal reinforcement, change the values for Yield Strength and
Modulus of Elasticity to 60 ksi and 29000 ksi respectively. Change the Preferred Bar
Sizes for Top and Bottom to 5 and 8 respectively. These will be used when calculating the
number of bars required.
In Shear reinforcement, select Stud (headed bar) and change Preferred Stud diameter,
Yield strength shear reinforcement and the Number of rails per side to 0.5 inch, 60 ksi
and 2 respectively.
ADAPT-PT® 2010-Tutorial- 15
FIGURE 1.1-11
Click Next at the bottom of the screen to open the next input screen.
1.1.4.3 Enter the Post-Tensioning System Parameters
Select the Post-tensioning system as Unbonded and leave the default values of the other
properties as they are as in Figure 1.1-12.
FIGURE 1.1-12
Click Next at the bottom of the screen to open the input screen, Base Non-Prestressed
Reinforcement.
ADAPT-PT® 2010-Tutorial- 16
1.1.4.4 Edit Base Reinforcement
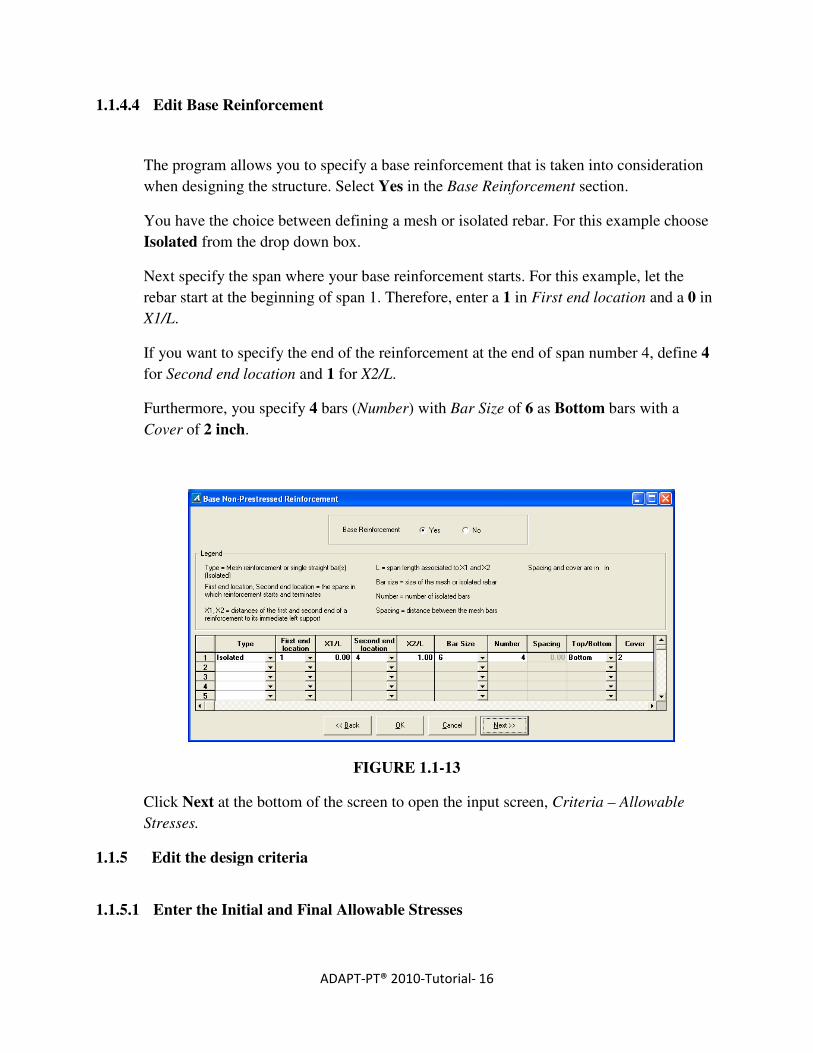
The program allows you to specify a base reinforcement that is taken into consideration
when designing the structure. Select Yes in the Base Reinforcement section.
You have the choice between defining a mesh or isolated rebar. For this example choose
Isolated from the drop down box.
Next specify the span where your base reinforcement starts. For this example, let the
rebar start at the beginning of span 1. Therefore, enter a 1 in First end location and a 0 in
X1/L.
If you want to specify the end of the reinforcement at the end of span number 4, define 4
for Second end location and 1 for X2/L.
Furthermore, you specify 4 bars (Number) with Bar Size of 6 as Bottom bars with a
Cover of 2 inch.
FIGURE 1.1-13
Click Next at the bottom of the screen to open the input screen, Criteria – Allowable
Stresses.
1.1.5 Edit the design criteria
1.1.5.1 Enter the Initial and Final Allowable Stresses
ADAPT-PT® 2010-Tutorial- 17
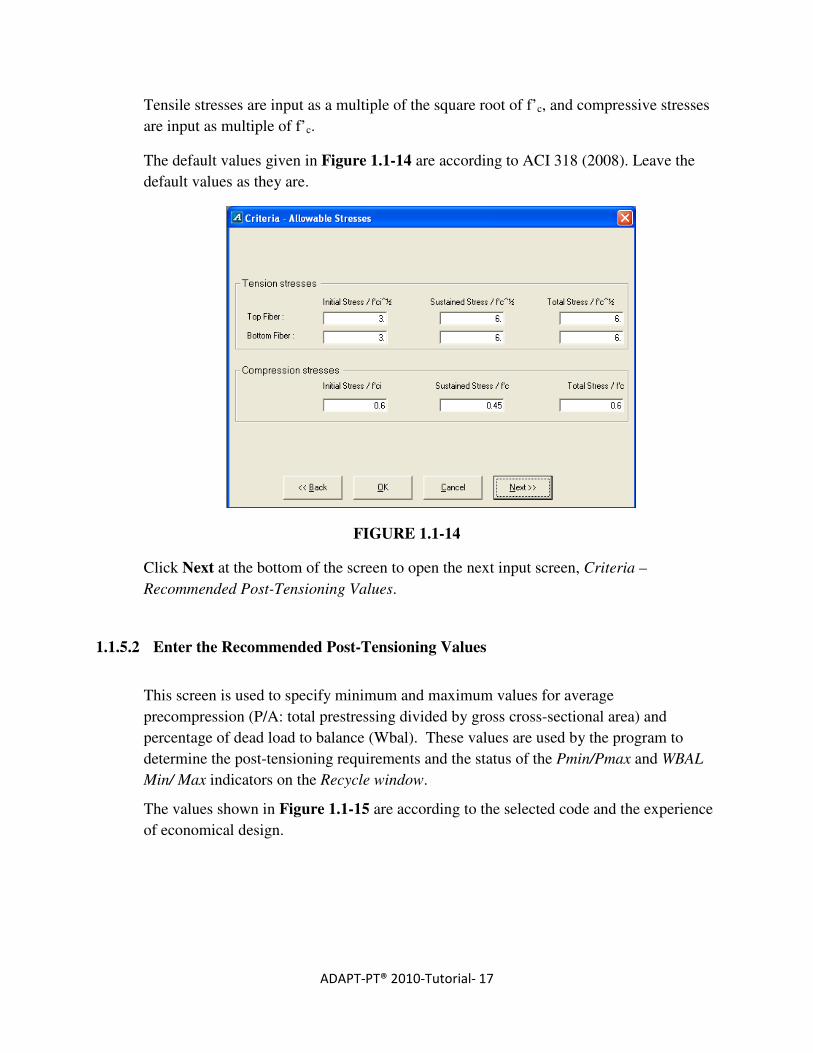
Tensile stresses are input as a multiple of the square root of f’c, and compressive stresses
are input as multiple of f’c.
The default values given in Figure 1.1-14 are according to ACI 318 (2008). Leave the
default values as they are.
FIGURE 1.1-14
Click Next at the bottom of the screen to open the next input screen, Criteria –
Recommended Post-Tensioning Values.
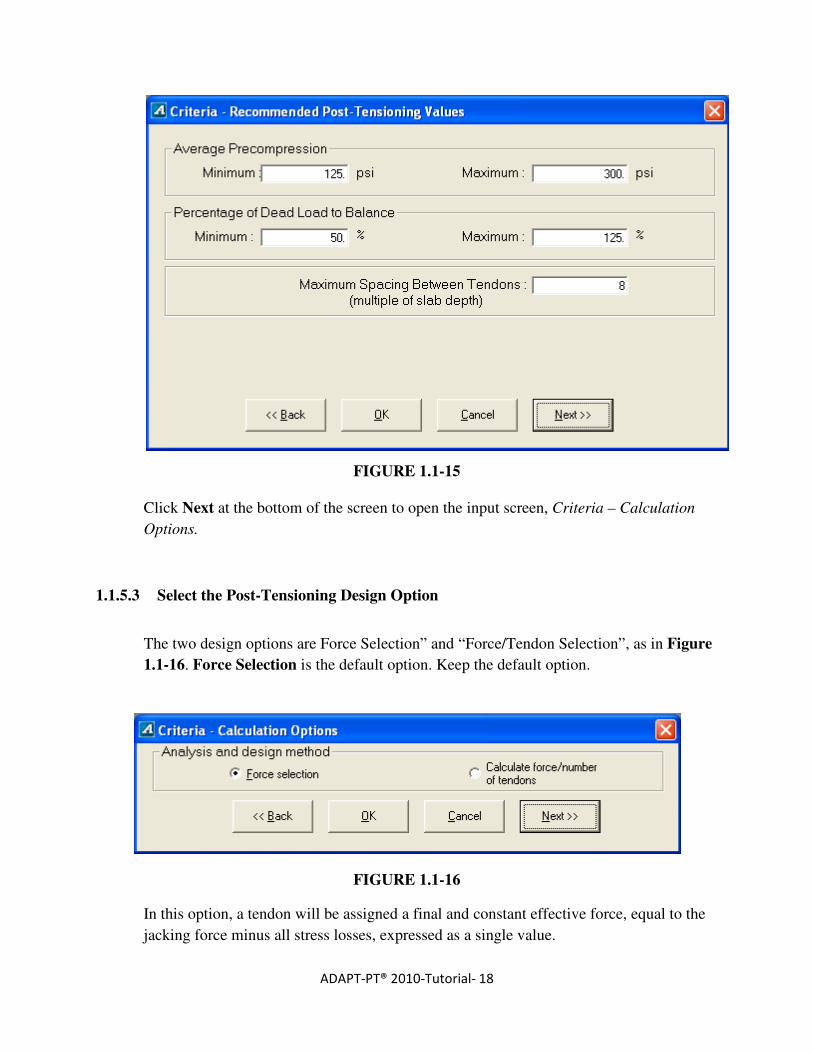
1.1.5.2 Enter the Recommended Post-Tensioning Values
This screen is used to specify minimum and maximum values for average
precompression (P/A: total prestressing divided by gross cross-sectional area) and
percentage of dead load to balance (Wbal). These values are used by the program to
determine the post-tensioning requirements and the status of the Pmin/Pmax and WBAL
Min/ Max indicators on the Recycle window.
The values shown in Figure 1.1-15 are according to the selected code and the experience
of economical design.
ADAPT-PT® 2010-Tutorial- 18
FIGURE 1.1-15
Click Next at the bottom of the screen to open the input screen, Criteria – Calculation
Options.
1.1.5.3 Select the Post-Tensioning Design Option
The two design options are Force Selection” and “Force/Tendon Selection”, as in Figure
1.1-16. Force Selection is the default option. Keep the default option.
FIGURE 1.1-16
In this option, a tendon will be assigned a final and constant effective force, equal to the
jacking force minus all stress losses, expressed as a single value.
ADAPT-PT® 2010-Tutorial- 19
Click Next at the bottom of the screen to open the next input screen, Criteria – Tendon
Profile.
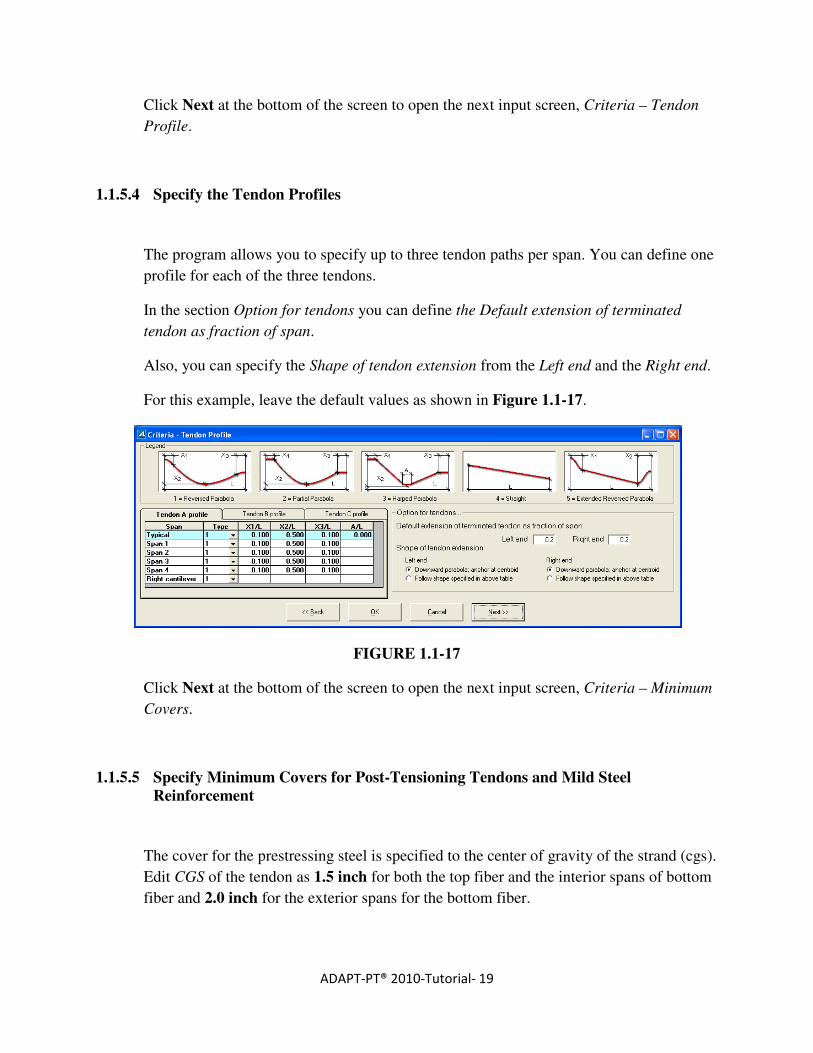
1.1.5.4 Specify the Tendon Profiles
The program allows you to specify up to three tendon paths per span. You can define one
profile for each of the three tendons.
In the section Option for tendons you can define the Default extension of terminated
tendon as fraction of span.
Also, you can specify the Shape of tendon extension from the Left end and the Right end.
For this example, leave the default values as shown in Figure 1.1-17.
FIGURE 1.1-17
Click Next at the bottom of the screen to open the next input screen, Criteria – Minimum
Covers.
1.1.5.5 Specify Minimum Covers for Post-Tensioning Tendons and Mild Steel
Reinforcement
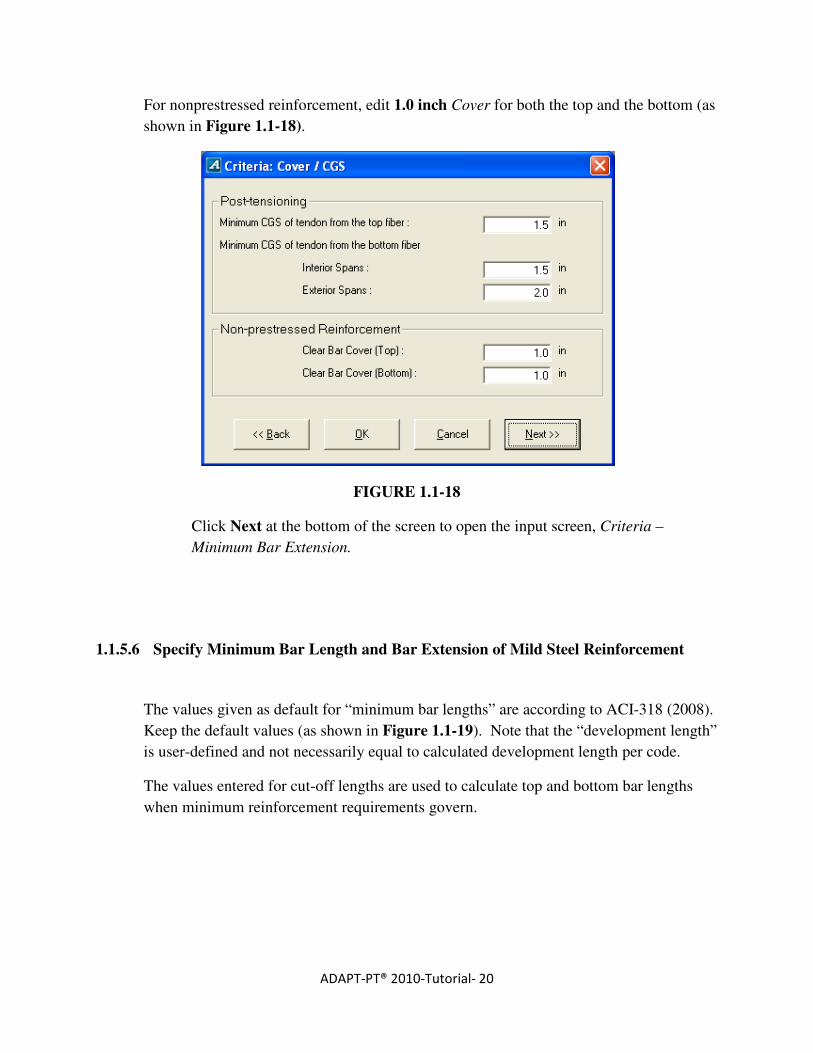
The cover for the prestressing steel is specified to the center of gravity of the strand (cgs).
Edit CGS of the tendon as 1.5 inch for both the top fiber and the interior spans of bottom
fiber and 2.0 inch for the exterior spans for the bottom fiber.
ADAPT-PT® 2010-Tutorial- 20
For nonprestressed reinforcement, edit 1.0 inch Cover for both the top and the bottom (as
shown in Figure 1.1-18).
FIGURE 1.1-18
Click Next at the bottom of the screen to open the input screen, Criteria –
Minimum Bar Extension.
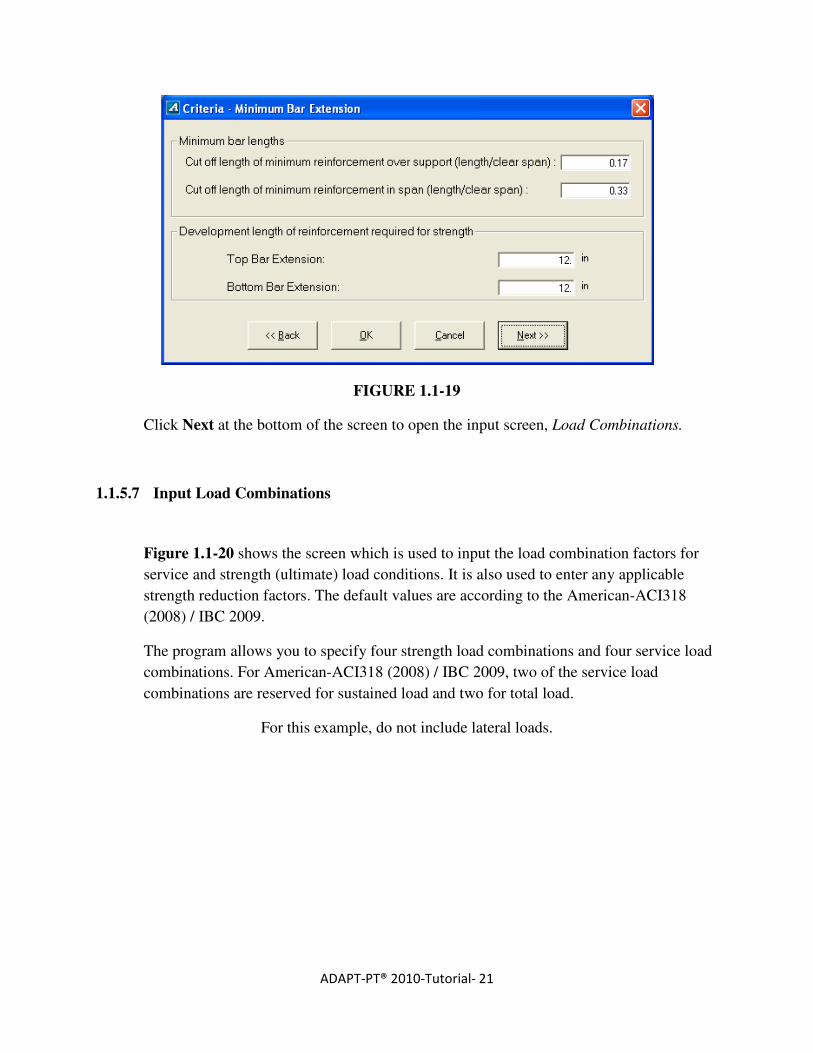
1.1.5.6 Specify Minimum Bar Length and Bar Extension of Mild Steel Reinforcement
The values given as default for “minimum bar lengths” are according to ACI-318 (2008).
Keep the default values (as shown in Figure 1.1-19). Note that the “development length”
is user-defined and not necessarily equal to calculated development length per code.
The values entered for cut-off lengths are used to calculate top and bottom bar lengths
when minimum reinforcement requirements govern.
ADAPT-PT® 2010-Tutorial- 21
FIGURE 1.1-19
Click Next at the bottom of the screen to open the input screen, Load Combinations.
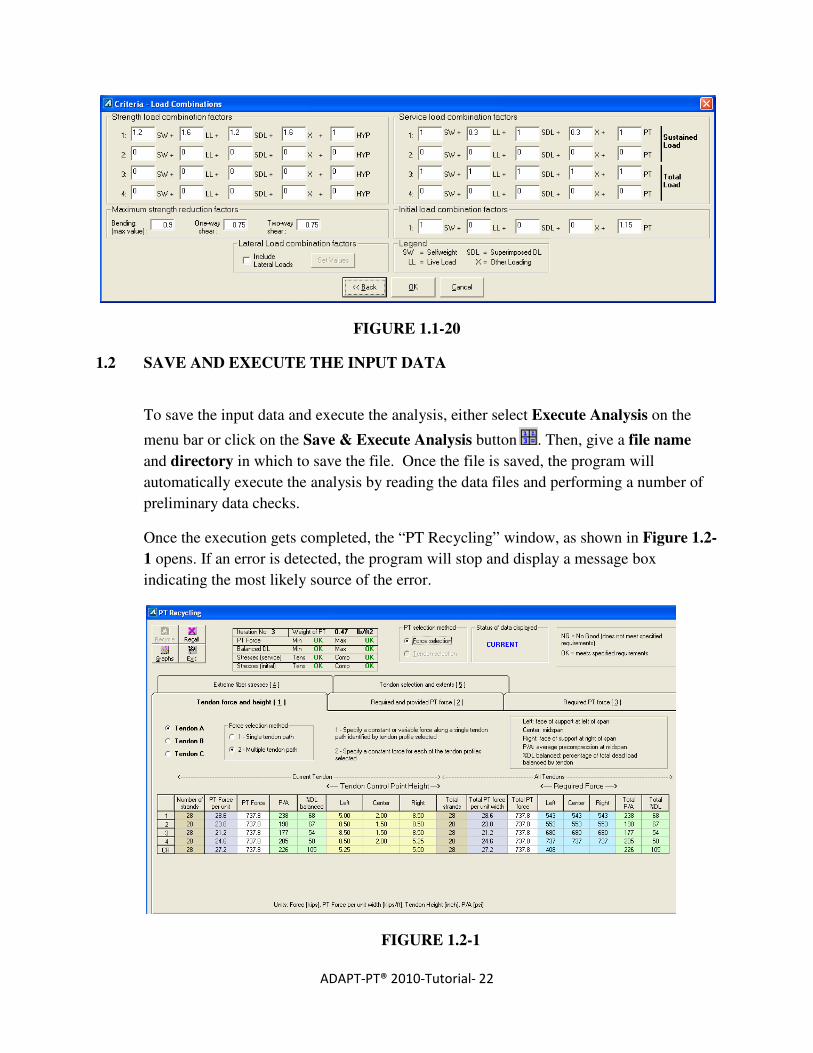
1.1.5.7 Input Load Combinations
Figure 1.1-20 shows the screen which is used to input the load combination factors for
service and strength (ultimate) load conditions. It is also used to enter any applicable
strength reduction factors. The default values are according to the American-ACI318
(2008) / IBC 2009.
The program allows you to specify four strength load combinations and four service load
combinations. For American-ACI318 (2008) / IBC 2009, two of the service load
combinations are reserved for sustained load and two for total load.
For this example, do not include lateral loads.
ADAPT-PT® 2010-Tutorial- 22
FIGURE 1.1-20
1.2 SAVE AND EXECUTE THE INPUT DATA
To save the input data and execute the analysis, either select Execute Analysis on the
menu bar or click on the Save & Execute Analysis button . Then, give a file name
and directory in which to save the file. Once the file is saved, the program will
automatically execute the analysis by reading the data files and performing a number of
preliminary data checks.
Once the execution gets completed, the “PT Recycling” window, as shown in Figure 1.2-
1 opens. If an error is detected, the program will stop and display a message box
indicating the most likely source of the error.
FIGURE 1.2-1
ADAPT-PT® 2010-Tutorial- 23
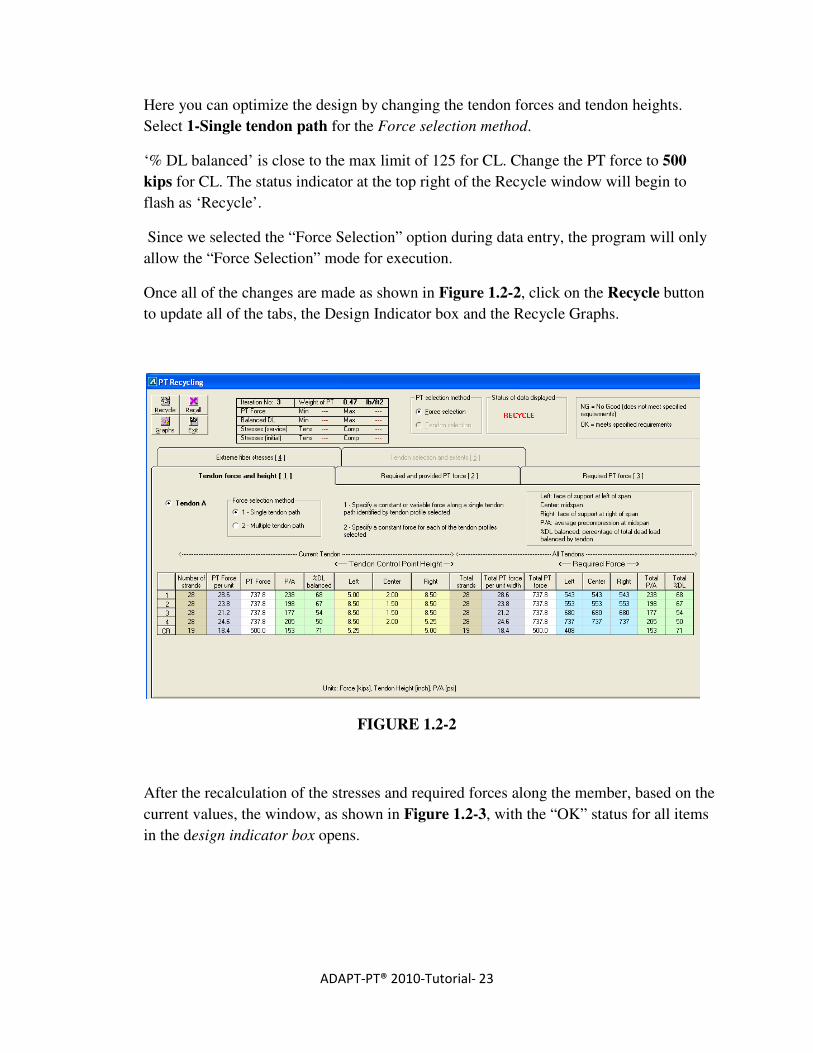
Here you can optimize the design by changing the tendon forces and tendon heights.
Select 1-Single tendon path for the Force selection method.
‘% DL balanced’ is close to the max limit of 125 for CL. Change the PT force to 500
kips for CL. The status indicator at the top right of the Recycle window will begin to
flash as ‘Recycle’.
Since we selected the “Force Selection” option during data entry, the program will only
allow the “Force Selection” mode for execution.
Once all of the changes are made as shown in Figure 1.2-2, click on the Recycle button
to update all of the tabs, the Design Indicator box and the Recycle Graphs.
FIGURE 1.2-2
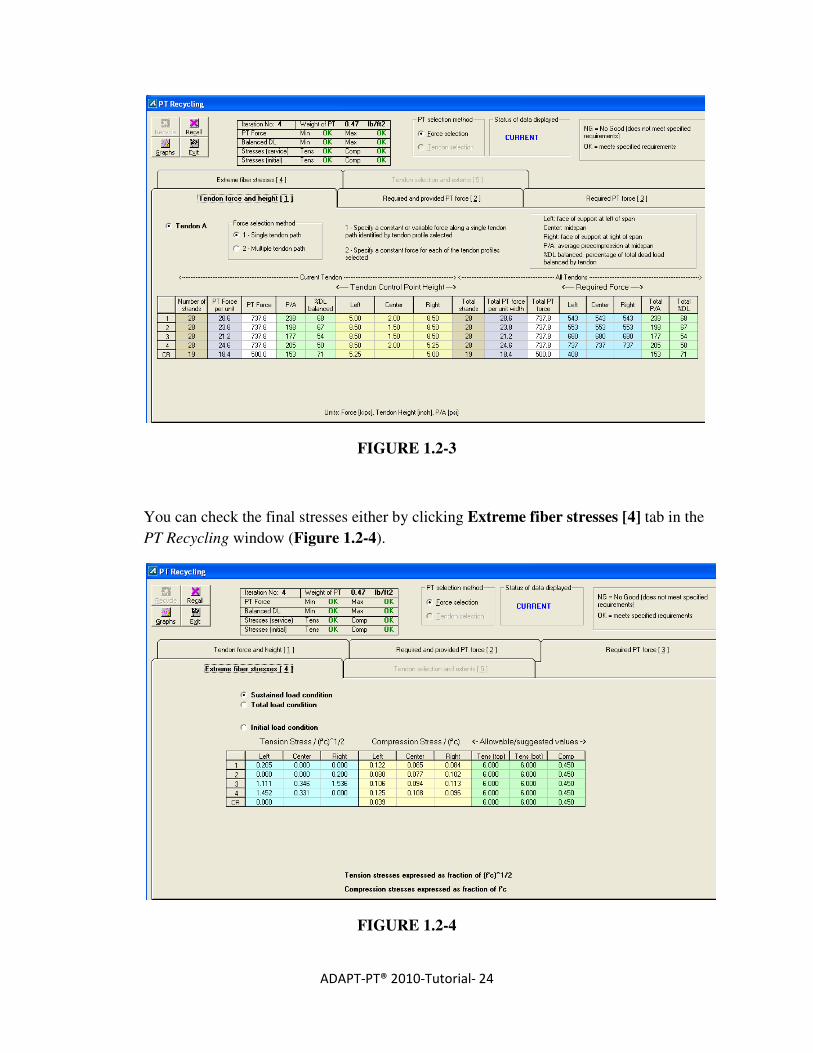
After the recalculation of the stresses and required forces along the member, based on the
current values, the window, as shown in Figure 1.2-3, with the “OK” status for all items
in the design indicator box opens.
ADAPT-PT® 2010-Tutorial- 24
FIGURE 1.2-3
You can check the final stresses either by clicking Extreme fiber stresses [4] tab in the
PT Recycling window (Figure 1.2-4).
FIGURE 1.2-4
ADAPT-PT® 2010-Tutorial- 25
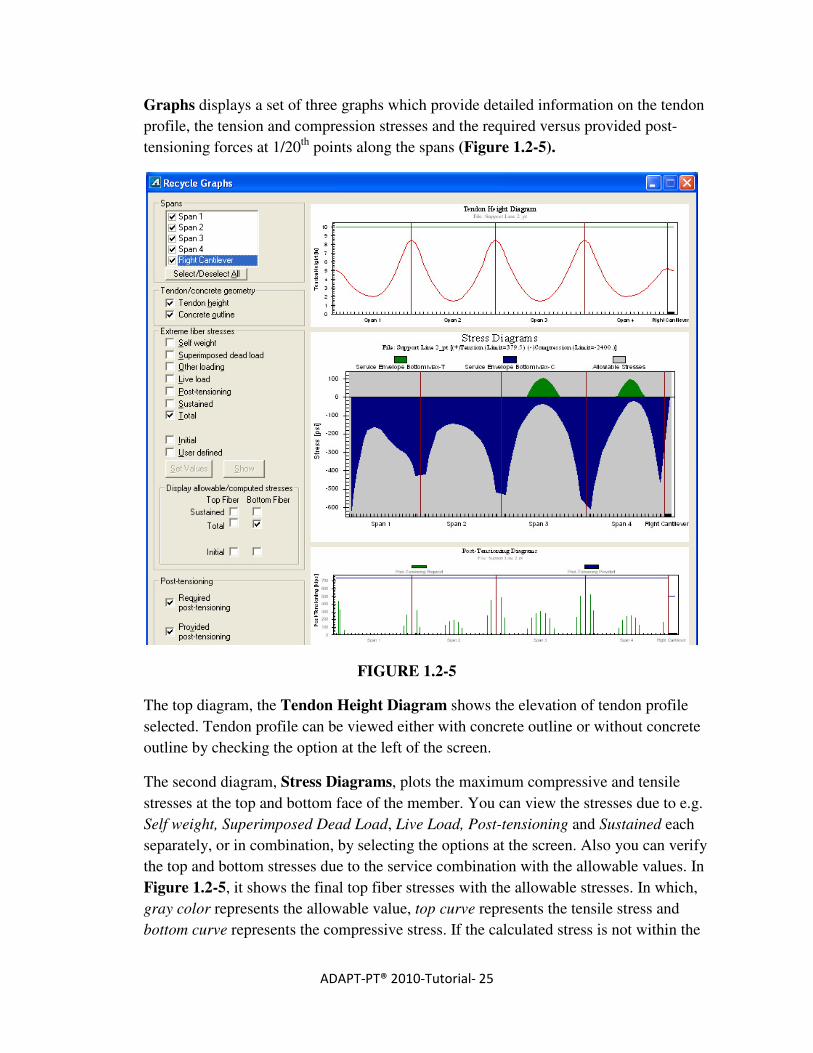
Graphs displays a set of three graphs which provide detailed information on the tendon
profile, the tension and compression stresses and the required versus provided post-
tensioning forces at 1/20th
points along the spans (Figure 1.2-5).
FIGURE 1.2-5
The top diagram, the Tendon Height Diagram shows the elevation of tendon profile
selected. Tendon profile can be viewed either with concrete outline or without concrete
outline by checking the option at the left of the screen.
The second diagram, Stress Diagrams, plots the maximum compressive and tensile
stresses at the top and bottom face of the member. You can view the stresses due to e.g.
Self weight, Superimposed Dead Load, Live Load, Post-tensioning and Sustained each
separately, or in combination, by selecting the options at the screen. Also you can verify
the top and bottom stresses due to the service combination with the allowable values. In
Figure 1.2-5, it shows the final top fiber stresses with the allowable stresses. In which,
gray color represents the allowable value, top curve represents the tensile stress and
bottom curve represents the compressive stress. If the calculated stress is not within the
ADAPT-PT® 2010-Tutorial- 26
limit, i.e., the top or bottom curve is outside the gray portion; you need to modify the
forces to optimize the design.
The third diagram, Post-Tensioning Diagrams shows the required and provided post-
tensioning force at 1/20th points along each span. The vertical line represents the
required post-tensioning and the horizontal line represents the provided post-tensioning
at that section. At each design section along a span, the program performs an analysis
based on the post-tensioning force at that section
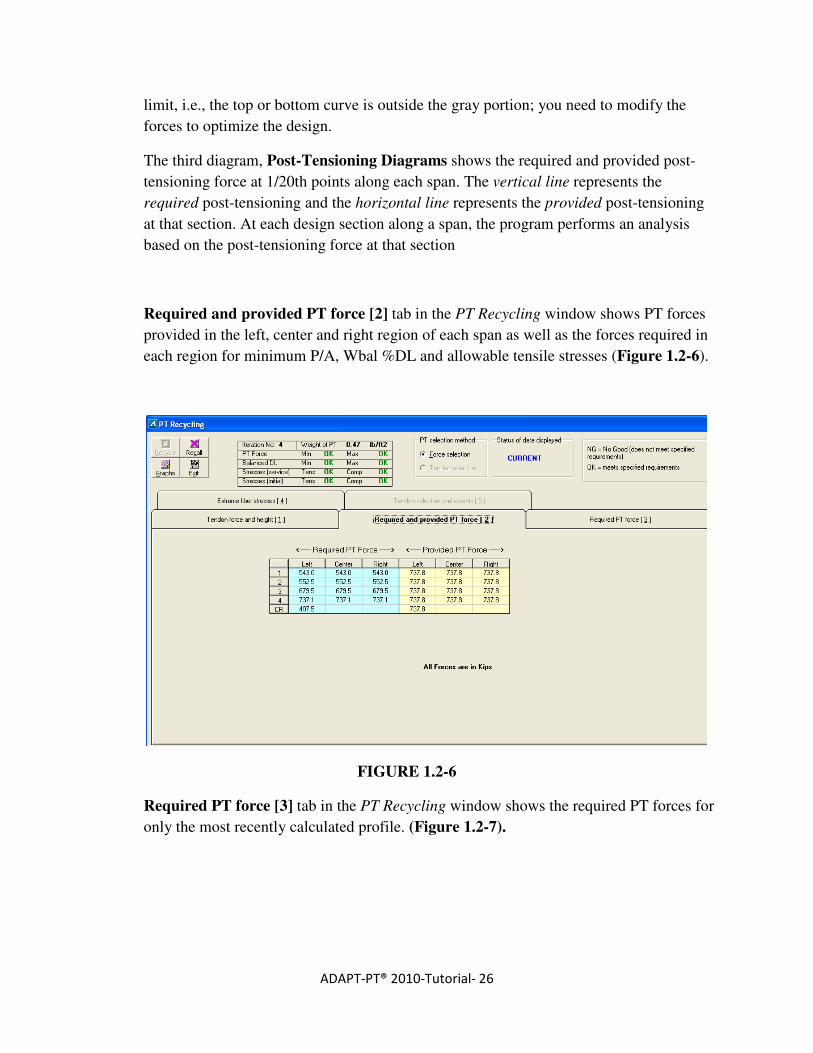
Required and provided PT force [2] tab in the PT Recycling window shows PT forces
provided in the left, center and right region of each span as well as the forces required in
each region for minimum P/A, Wbal %DL and allowable tensile stresses (Figure 1.2-6).
FIGURE 1.2-6
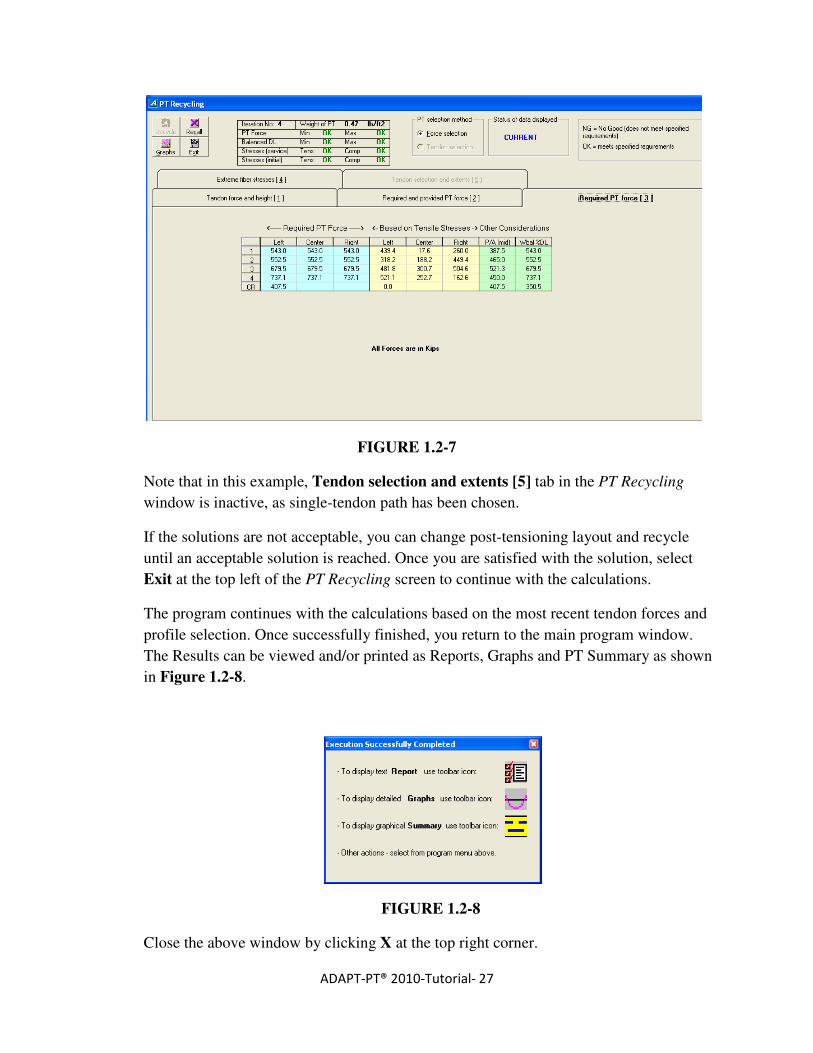
Required PT force [3] tab in the PT Recycling window shows the required PT forces for
only the most recently calculated profile. (Figure 1.2-7).
ADAPT-PT® 2010-Tutorial- 27
FIGURE 1.2-7
Note that in this example, Tendon selection and extents [5] tab in the PT Recycling
window is inactive, as single-tendon path has been chosen.
If the solutions are not acceptable, you can change post-tensioning layout and recycle
until an acceptable solution is reached. Once you are satisfied with the solution, select
Exit at the top left of the PT Recycling screen to continue with the calculations.
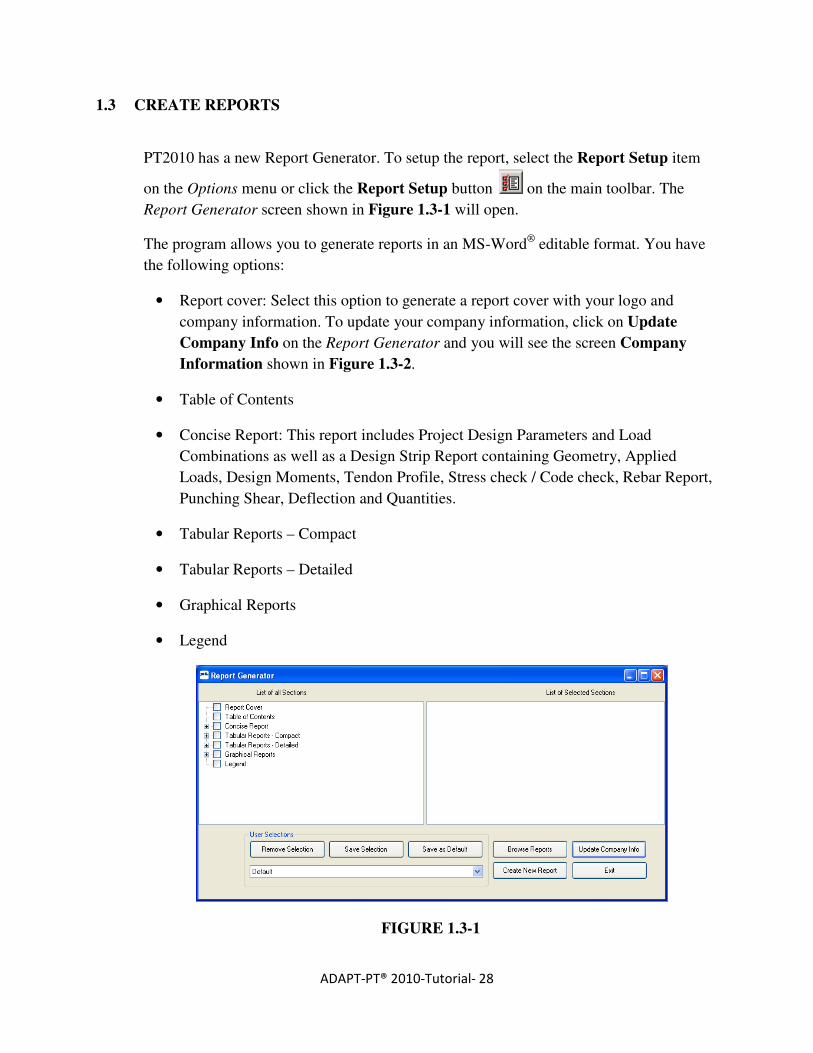
The program continues with the calculations based on the most recent tendon forces and
profile selection. Once successfully finished, you return to the main program window.
The Results can be viewed and/or printed as Reports, Graphs and PT Summary as shown
in Figure 1.2-8.
FIGURE 1.2-8
Close the above window by clicking X at the top right corner.
ADAPT-PT® 2010-Tutorial- 28
1.3 CREATE REPORTS
PT2010 has a new Report Generator. To setup the report, select the Report Setup item
on the Options menu or click the Report Setup button on the main toolbar. The
Report Generator screen shown in Figure 1.3-1 will open.
The program allows you to generate reports in an MS-Word®
editable format. You have
the following options:
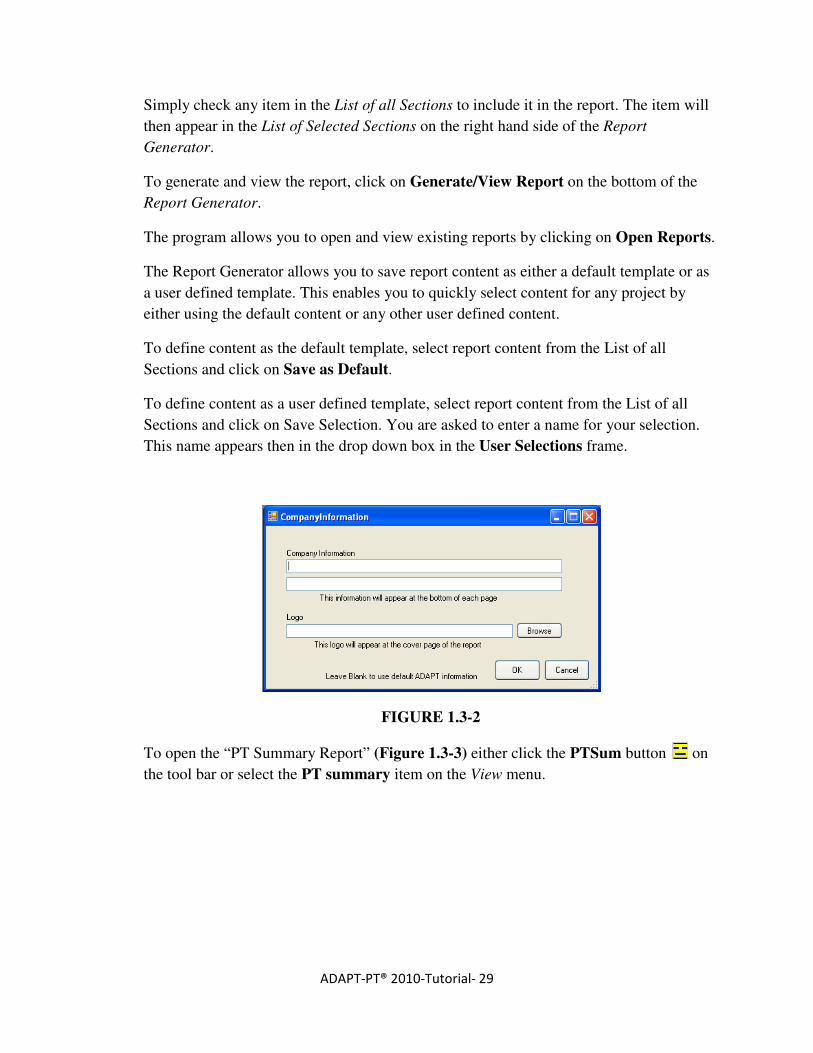
• Report cover: Select this option to generate a report cover with your logo and
company information. To update your company information, click on Update
Company Info on the Report Generator and you will see the screen Company
Information shown in Figure 1.3-2.
• Table of Contents
• Concise Report: This report includes Project Design Parameters and Load
Combinations as well as a Design Strip Report containing Geometry, Applied
Loads, Design Moments, Tendon Profile, Stress check / Code check, Rebar Report,
Punching Shear, Deflection and Quantities.
• Tabular Reports – Compact
• Tabular Reports – Detailed
• Graphical Reports
• Legend
FIGURE 1.3-1
ADAPT-PT® 2010-Tutorial- 29
Simply check any item in the List of all Sections to include it in the report. The item will
then appear in the List of Selected Sections on the right hand side of the Report
Generator.
To generate and view the report, click on Generate/View Report on the bottom of the
Report Generator.
The program allows you to open and view existing reports by clicking on Open Reports.
The Report Generator allows you to save report content as either a default template or as
a user defined template. This enables you to quickly select content for any project by
either using the default content or any other user defined content.
To define content as the default template, select report content from the List of all
Sections and click on Save as Default.
To define content as a user defined template, select report content from the List of all
Sections and click on Save Selection. You are asked to enter a name for your selection.
This name appears then in the drop down box in the User Selections frame.
FIGURE 1.3-2
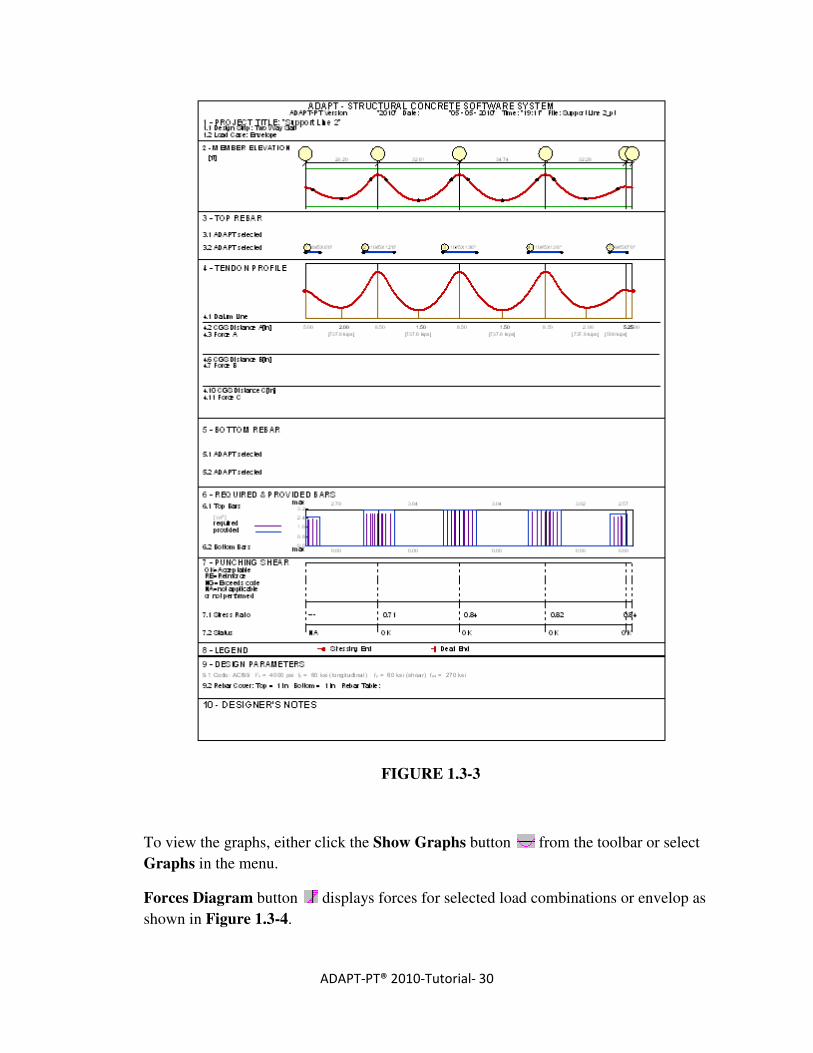
To open the “PT Summary Report” (Figure 1.3-3) either click the PTSum button on
the tool bar or select the PT summary item on the View menu.
ADAPT-PT® 2010-Tutorial- 30
FIGURE 1.3-3
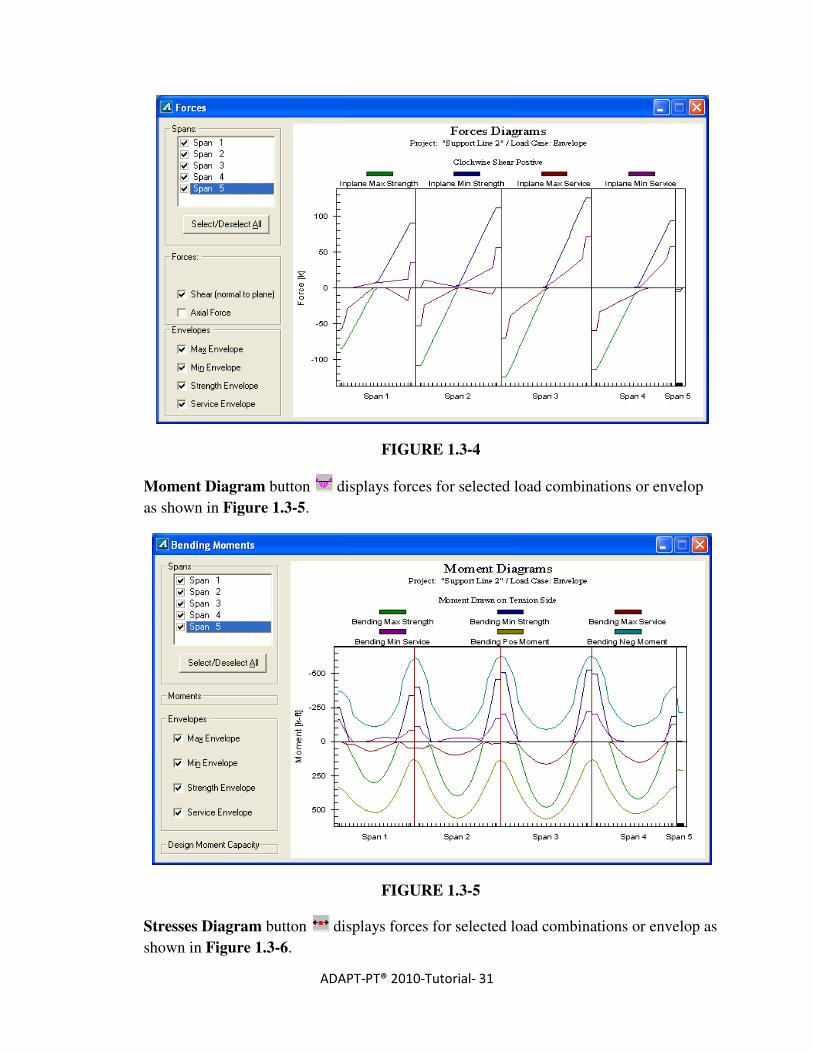
To view the graphs, either click the Show Graphs button from the toolbar or select
Graphs in the menu.
Forces Diagram button displays forces for selected load combinations or envelop as
shown in Figure 1.3-4.
ADAPT-PT® 2010-Tutorial- 31
FIGURE 1.3-4
Moment Diagram button displays forces for selected load combinations or envelop
as shown in Figure 1.3-5.
FIGURE 1.3-5
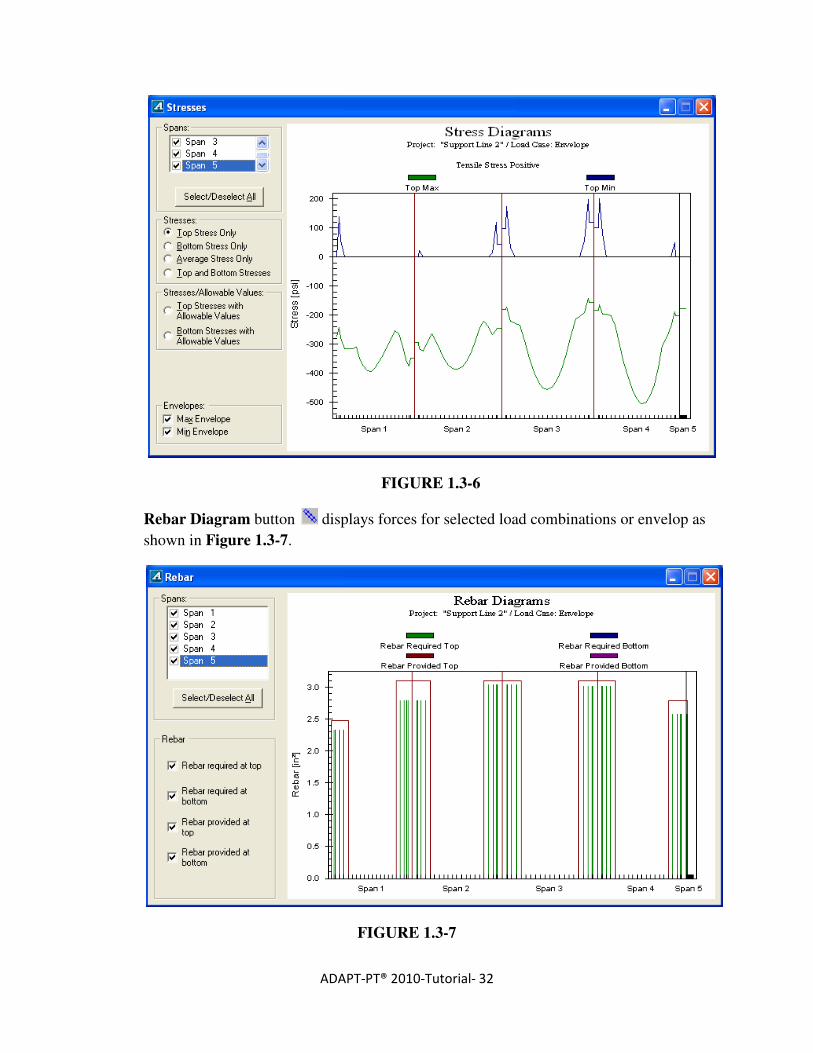
Stresses Diagram button displays forces for selected load combinations or envelop as
shown in Figure 1.3-6.
ADAPT-PT® 2010-Tutorial- 32
FIGURE 1.3-6
Rebar Diagram button displays forces for selected load combinations or envelop as
shown in Figure 1.3-7.
FIGURE 1.3-7

ADAPT-PT® 2010-Tutorial- 33
References to be consulted with this manual:
1. ADAPT-PT7 – Manual_Vol_I
2. ADAPT-PT7 – Manual_Vol_II
3. ADAPT-PT7 – Manual_Vol_III
4. ADAPT-PT8 – Getting Started Guide
5. ADAPT-PT 2010 – Getting Started Guide