Embed Size (px)
Citation preview

ADAPT-Builder 2012 Getting Started Guide
Update: February 2013 Copyright © ADAPT Corporation all rights reserved

ADAPT –Builder 2012 Getting Started Guide I
B2012_GSG_02202012
TABLE OF CONTENTS
1 Overview of ADAPT-Builder Platform ......................................................................... 9 1.1 ADAPT Builder 2012 .............................................................................................. 9
1.1.1 ADAPT-Modeler ............................................................................................ 10 1.1.2 ADAPT-Edge *New Feature ........................................................................ 10
1.1.3 ADAPT-Floor Pro .......................................................................................... 10 1.1.4 ADAPT-MAT ................................................................................................ 10 1.1.5 ADAPT-SOG ................................................................................................. 10 1.1.6 Dynamic Rebar Designer (DRD) ................................................................... 10
1.1.7 Post-tensioning Shop Drawing ....................................................................... 11
1.1.8 Strip Modeling & PT/RC Export ................................................................... 11
1.1.9 Other Options on Initial Screen ...................................................................... 11
1.2 ADAPT-Modeler Main Screen .............................................................................. 11
1.2.1 Mouse Function and Operation ...................................................................... 13
1.2.2 Transform to Structural Components Toolbar ............................................... 13
1.2.3 Selection Toolbar ........................................................................................... 14 1.2.4 Camera and Viewports Toolbar ..................................................................... 18
1.2.5 Settings Toolbar ............................................................................................. 19 1.2.6 Snap Toolbar .................................................................................................. 19 1.2.7 Model/Design Strips Toolbar ......................................................................... 20
1.2.8 Modeling Toolbar ........................................................................................... 21 1.2.9 Support Line/Results Scale Toolbar ............................................................... 24
1.2.10 Reinforcement Toolbar ............................................................................... 25
1.2.11 Tendon Toolbar .......................................................................................... 26
1.2.12 Cursor Function and Operation .................................................................. 29
1.2.13 Story Manager Toolbar *new feature ......................................................... 30
1.2.14 Save As Project Template *new feature ..................................................... 32
1.2.15 Modify/Selection Toolbar ........................................................................... 32
2 Generation of 3D Structural Model through DWG Import ......................................... 35
2.1 First Drawing Import ............................................................................................. 35 2.2 Transformation of Structural Components ............................................................ 38
3 Generation of 3D Structural Model through Revit import .......................................... 44
3.1 Export the ADAPT Exchange File from Autodesk Revit ..................................... 45
3.2 Import the ADAPT Exchange file into ADAPT-Builder ...................................... 46
3.3 Imported material modifications and component connectivity ............................. 50
4 Generation of 3D Structural Model using of ADAPT-Builder Modeling Tools ......... 53 4.1 Manual addition of levels to an existing model ..................................................... 53
4.2 modeling tendons ................................................................................................... 56 4.2.1 Defining Banded Tendons .............................................................................. 56
4.2.2 Additional Comments .................................................................................... 61
4.3 Copying/moving components vertically ................................................................ 61
4.4 modifying existing slab regions and nested slabs .................................................. 63
4.5 modifying Beam sizes and properties .................................................................... 68
4.6 Regeneration of component connectivity .............................................................. 70
5 Materials, Assigning Supports, CRITERIA and adding loads/load combinations ...... 71
5.1 Set and Assign Material Properties ....................................................................... 71 5.2 Assigning support conditions ................................................................................ 74 5.3 Set Design Criteria................................................................................................. 77 5.4 Loading .................................................................................................................. 81
Index (II )
B2012_GSG_02202012
5.4.1 Patch Load Generation ................................................................................... 81
5.4.2 Wind Load Generation ................................................................................... 84
5.4.3 Seismic Load Generation ............................................................................... 87
5.4.4 Program Generated Loads .............................................................................. 92
5.4.5 Lateral Load Solution Sets ............................................................................. 95
5.4.6 Load Combinations ........................................................................................ 95 6 Finite Element Meshing, Analysis, and View Results ................................................. 99
6.1 Generation of finite element mesh ......................................................................... 99 6.2 Analysis Options and Analyze ............................................................................ 101 6.3 Viewing Analysis Results .................................................................................... 104
6.3.1 View Analysis Results (ADViewer) ............................................................ 105
6.3.1.1 Viewing Global Z-direction displacement for Selfweight ..................... 110
6.3.1.2 Viewing Global X and Y displacement for WindX and EQY ............... 114 6.3.1.3 Viewing Column Actions ....................................................................... 117
6.3.1.4 Viewing Beam Actions .......................................................................... 119
6.3.1.5 Viewing Slab Actions ............................................................................. 120
6.3.1.6 Section Cut Tool for Viewing Slab Actions (M, V, N) .......................... 121
6.3.1.7 Viewing Extreme Fiber Slab Stresses .................................................... 123
6.3.1.8 Viewing Mid-depth Slab Stress (Precompression)................................. 124
6.3.2 Line Contours ............................................................................................... 125 6.3.3 Support Line Results/Scale Toolbar ............................................................. 128
6.3.3.1 Column Bending Moments About Local s-s Axis for Full-Structure .... 130 6.3.3.2 Column Axial Forces for Full-structure ................................................. 132
6.3.3.3 Wall Bending Moments about Local s-s Axis for Full-Structure .......... 132
6.3.4 Graphical Column and Wall Reactions ........................................................ 134
6.3.5 Tabular Reports for Analysis Results........................................................... 136
6.3.6 Punching Shear Check ................................................................................. 138
6.3.7 Manual Design Sections ............................................................................... 141
7 ADAPT-Floor Pro – Design of Slab Systems ........................................................... 144
7.1 Support Lines and Splitters .................................................................................. 145 7.1.1 X-Direction................................................................................................... 145 7.1.2 Y-Direction................................................................................................... 151
7.2 Generating Design Strips and Design Sections ................................................... 153
7.2.1 Manual Strip Generation .............................................................................. 154
7.2.2 Automatic Strip Generation ......................................................................... 155
7.2.3 Manual Modifications for Automatically-Generated Strips......................... 157
7.3 Design the Design Sections ................................................................................. 162 7.4 Results for Support Lines .................................................................................... 165
7.4.1 Result Display Settings ................................................................................ 166 7.5 Generate Rebar Drawing ..................................................................................... 172 7.6 Cracked Deflection Check ................................................................................... 174 7.7 Compiled Report Generator ................................................................................. 175
8 ADAPT-MAT Workflow with ADAPT Edge ........................................................... 179
8.1 ADAPT-MAT Workflow 1 ................................................................................. 179
8.2 ADAPT-MAT Workflow 2 ................................................................................. 184
Index (III )
B2012_GSG_02202012 Overview
TABLE OF FIGURES FIGURE 1-1 ADAPT 2012 Builder Initial Screen .................................................................... 9 FIGURE 1-2 ADAPT Modeler Main Screen in MAT Mode .................................................. 12
FIGURE 1-3 Right-Click Options Of The Mouse ................................................................... 13 FIGURE 1-4 Transform to Structural Component Toolbar ..................................................... 13 FIGURE 1-5 Selection Toolbar ............................................................................................... 15 FIGURE 1-6 Select Layers Dialog Window ........................................................................... 16 FIGURE 1-7 Select by Type Dialog ........................................................................................ 17 FIGURE 1-8 Camera and Viewports Toolbar ......................................................................... 18 FIGURE 1-9 Setting Toolbar ................................................................................................... 19 FIGURE 1-10 Snap Toolbar .................................................................................................... 20 FIGURE 1-11 Model/Design Strips Toolbar ........................................................................... 20 FIGURE 1-12 Modeling Toolbar............................................................................................. 21 FIGURE 1-13 Support Line Wizard ........................................................................................ 22 FIGURE 1-14 Splitter Property dialogue screen ..................................................................... 23 FIGURE 1-15 Support Line/Results Scale Toolbar ................................................................. 24 FIGURE 1-16 Result Display Settings .................................................................................... 25 FIGURE 1-17 Reinforcement Toolbar .................................................................................... 26 FIGURE 1-18 Tendon Toolbar ................................................................................................ 26 FIGURE 1-19 Map Distributed Tendon Dialogue box............................................................ 27 FIGURE 1-20 Map Banded (Grouped) Tendons Dialogue ..................................................... 28
FIGURE 1-21 Tendon Elevation Section ................................................................................ 28 FIGURE 1-22 Tendon Properties Shape/System/Friction display, with Minimum Radius of Curvature (R) input at bottom of screen .................................................................................. 29 FIGURE 1-23 Cursor Modes and Options............................................................................... 30 FIGURE 1-24 Story Manager Toolbar .................................................................................... 30 FIGURE 1-25 Copy Reference Planes Input ........................................................................... 30 FIGURE 1-26 Copy/Move Vertical Input Screen ................................................................... 31 FIGURE 1-27 Reference Plane Manager ................................................................................ 31 FIGURE 1-28 Save as Project Template ................................................................................. 32 FIGURE 1-29 Modify Selection Toolbar ................................................................................ 32 FIGURE 1-30 Modify Item Properties Input Screen ............................................................... 34 FIGURE 2-1 Import DWG / DXF Dialog ............................................................................... 35 FIGURE 2-2 Start and End Points of Calibration Line ........................................................... 36 FIGURE 2-3 Grouping Dialog box.......................................................................................... 37 FIGURE 2-4 Reference Plane Manager / Level Assignment Dialog box ............................... 38
FIGURE 2-5 Reference Plane Manager / Level Assignment Dialog box updated.................. 38
FIGURE 2-6 Transform to Structural Component Toolbar ..................................................... 39 FIGURE 2-7 Layers Dialog Box ............................................................................................. 39 FIGURE 2-8 Top-Front-Right View with Transformed Column and Column Dialog ........... 40
FIGURE 2-9 Slab Region Properties ....................................................................................... 40 FIGURE 2-10 Select by Type Dialog box ............................................................................... 42 FIGURE 2-11 View Toolbar and View Menu (partial) ........................................................... 42 FIGURE 2-12 Select/ Set View Items Dialog Box .................................................................. 43 FIGURE 3-1 Hybrid PT/RC structure as modeled in Autodesk Revit 2013 ........................... 44
FIGURE 3-2 Export Model to ADAPT ................................................................................... 45 FIGURE 3-3 ADAPT-Revit Link 2013 Export screen ............................................................ 45 FIGURE 3-4 ADAPT data exchange file save-as dialogue window ....................................... 46
FIGURE 3-5 Builder Platform Module Selection ................................................................... 46
Index (IV )
B2012_GSG_02202012
FIGURE 3-6 Import REVIT Model into Builder .................................................................... 47 FIGURE 3-7 ADAPT Data Exchange File Open Dialogue Window ...................................... 47
FIGURE 3-8 Import Options Dialogue Window ..................................................................... 48 FIGURE 3-9 Imported 7-Story Structure Shown in Plan View in ADAPT-Edge .................. 49
FIGURE 3-10 Imported 7-Story Structure Shown in 3D Isometric View in ADAPT-Edge ... 50
FIGURE 3-11 Concrete Material Input Window ..................................................................... 51 FIGURE 3-12 Column offset relative to slab position ............................................................ 52 FIGURE 4-1 Reference Plane Manager .................................................................................. 54 FIGURE 4-2 Reference Plane Manager after adding new levels ............................................ 55
FIGURE 4-3 Reference Plane Manager with new names and heights .................................... 55
FIGURE 4-4 Left elevation view showing added levels ......................................................... 56 FIGURE 4-5 Tendon Toolbar .................................................................................................. 56 FIGURE 4-6 Tendon 1 Modeling Location ............................................................................. 57 FIGURE 4-7 Tendon 1 Plan View ........................................................................................... 57 FIGURE 4-8 Tendon Properties Input Screen ......................................................................... 58 FIGURE 4-9 Tendon Stressing Method Input Screen ............................................................. 58 FIGURE 4-10 Tendon Shape/System/Friction input ............................................................... 59 FIGURE 4-11 3D View of Single Tendon in Transfer Beam at Level 4 ................................ 59
FIGURE 4-12 Plan View of Tendons with CGS values .......................................................... 60 FIGURE 4-13 3D View of Banded Tendons in Transfer Beams at Level 4 ........................... 60
FIGURE 4-14 Highlighted Components at Level 7 ................................................................ 62 FIGURE 4-15 Copy and Move Vertical Settings .................................................................... 62 FIGURE 4-16 Side Elevation View of the Structure including Levels 8-10 ........................... 62
FIGURE 4-17 Changing Thickness for Multiple Slab Regions .............................................. 63
FIGURE 4-18 Level 10 Prior to Slab Modifications ............................................................... 64 FIGURE 4-19 Level 10 after slab modifications ..................................................................... 64 FIGURE 4-20 Level 10 Right Slab with Column and Wall labels .......................................... 65
FIGURE 4-21 Construction lines used to modify slab region ................................................. 66 FIGURE 4-22 Final Slab Position ........................................................................................... 67 FIGURE 4-23 Thickened Slab Section Cuts ........................................................................... 68 FIGURE 4-24 Beam labels ...................................................................................................... 69 FIGURE 4-25 Beam Release Input Window ........................................................................... 69 FIGURE 4-26 Rendered 3D View of Upturned Beam ............................................................ 70 FIGURE 5-1 Concrete Material input ...................................................................................... 71 FIGURE 5-2 Material Modifications for Multiple Components ............................................. 72
FIGURE 5-3 Slab Region Properties to Verify Concrete Material ......................................... 73
FIGURE 5-4 Mild Steel Material Input ................................................................................... 73 FIGURE 5-5 Prestressing Steel Material Input ....................................................................... 74 FIGURE 5-6 Support Conditions Input (partial) ..................................................................... 75 FIGURE 5-7 Graphically Displaying Support Conditions in Select/Set View Items ............. 76
FIGURE 5-8 3D View of Model with Base Supports Shown ................................................. 76
FIGURE 5-9 Manual Modification of Point Supports (partial) ............................................... 77 FIGURE 5-10 Design Code Section of Criteria (partial)......................................................... 77 FIGURE 5-11 Reinforcement Bar Lengths in Criteria (partial) .............................................. 78 FIGURE 5-12 Rebar Minimum Cover – Two-way slabs (partial) .......................................... 78
FIGURE 5-13 Rebar Minimum Cover – Beams (partial) ........................................................ 79 FIGURE 5-14 Tendon Height Defaults (FEM) (partial) ........................................................ 79 FIGURE 5-15 Allowable stresses ............................................................................................ 80 FIGURE 5-16 Rebar Round Up ............................................................................................... 81 FIGURE 5-17 Patch Load Wizard Input ................................................................................. 82
Index (V)
B2012_GSG_02202012 Overview
FIGURE 5-18 3D Graphical Representation of Patch (Area) Loads ....................................... 83
FIGURE 5-19 Patch Load Properties Input ............................................................................. 84 FIGURE 5-20 Load Case Library ............................................................................................ 85 FIGURE 5-21 Wind Load Wizard ........................................................................................... 85 FIGURE 5-22 Graphical Representation of Wind Loads ........................................................ 87 FIGURE 5-23 Seismic Load Wizard Screen ........................................................................... 88 FIGURE 5-24 Vibration Combination Input ........................................................................... 89 FIGURE 5-25 Seismic Load Wizard – User Defined Input .................................................... 90
FIGURE 5-26 Story Force Input.............................................................................................. 90 FIGURE 5-27 Example of Seismic Data File for EQX ........................................................... 91 FIGURE 5-28 Program Generated Loads ................................................................................ 93 FIGURE 5-29 Program Generated Loads added to Level 4 transfer slab ............................... 94
FIGURE 5-30 Program Generated Load property input.......................................................... 94 FIGURE 5-31 Load Combinations .......................................................................................... 95 FIGURE 5-32 Load Combination Definition and Input .......................................................... 98 FIGURE 5-33 Creep and Shrinkage Factor Input.................................................................... 98 FIGURE 6-1 Automatic Mesh Generation ............................................................................ 100 FIGURE 6-2 Node Proximity Mesh Warning ....................................................................... 100 FIGURE 6-3 Completed Model displaying Finite Element Meshing ................................... 101
FIGURE 6-4 Analysis Options .............................................................................................. 102 FIGURE 6-5 Load Case Warning at Analysis Onset ............................................................. 103 FIGURE 6-6 Analysis Status ................................................................................................. 104 FIGURE 6-7 ADViewer Graphical Interface ........................................................................ 105 FIGURE 6-8 ADViewer Options........................................................................................... 106 FIGURE 6-9 Load Cases/Combinations Tab ........................................................................ 107 FIGURE 6-10 Vibration Results Tab .................................................................................... 108 FIGURE 6-11 Components and Entities Tab ........................................................................ 109 FIGURE 6-12 Groups/Planes for Display Tab ...................................................................... 110 FIGURE 6-13 Z-Translation under Selfweight ..................................................................... 111 FIGURE 6-14 Z-Translation – 3D View ............................................................................... 111 FIGURE 6-15 Z-Translation for Selfweight – Level 4 .......................................................... 112 FIGURE 6-16 Z-Translation – Warped View for Level 4 ..................................................... 113 FIGURE 6-17 Z-Translation for Frame Elements – Beams and Columns ............................ 113
FIGURE 6-18 Global Deformatin for Selfweight ................................................................. 114 FIGURE 6-19 X-Translation for Frame Elements – Columns .............................................. 115
FIGURE 6-20 Y-Translation for Frame Elements – Columns .............................................. 116
FIGURE 6-21 Global Deformation for SeismicY ................................................................. 117 FIGURE 6-22 Column Axial Forces for SeismicY ............................................................... 118 FIGURE 6-23 Column Moments for SeismicY – Level 4 .................................................... 119
FIGURE 6-24 Beam Moments for WindX – Level 4 ............................................................ 120 FIGURE 6-25 Slab Moments about Y-Y Axis for Service (Total Load) Combination ........ 121
FIGURE 6-26 Slab Action Section Cut ................................................................................. 122 FIGURE 6-27 Slab Action Section Cut – Moment Value ..................................................... 123 FIGURE 6-28 Bottom Fiber Stress along XX Direction ....................................................... 124 FIGURE 6-29 Mid-Depth Slab Stress along XX Direction................................................... 125
FIGURE 6-30 Contour Toolbar ............................................................................................. 125 FIGURE 6-31 Generate Line Contour Options ..................................................................... 126 FIGURE 6-32 Slab Bending Actions M11 for Strength Condition ....................................... 127
FIGURE 6-33 Slab Bending Actions M11 – Increased contour density ............................... 127
FIGURE 6-34 Result Display Settings – Line Contours ....................................................... 128
Index (VI )
B2012_GSG_02202012
FIGURE 6-35 Support Line Results/Scale Toolbar ............................................................... 128 FIGURE 6-36 Result Display Settings .................................................................................. 129 FIGURE 6-37 Column Moments about Local r-r Axis for Seismic X .................................. 131
FIGURE 6-38 Rotate View Input Window ........................................................................... 131 FIGURE 6-39 Column Axial Forces for Strength (Dead and Live) Combination ................ 133
FIGURE 6-40 Wall Moments about Local s-s Axis for WindY ........................................... 133
FIGURE 6-41 Column Reaction Settings .............................................................................. 135 FIGURE 6-42 Column Reactions at Level 1 ......................................................................... 136 FIGURE 6-43 Point Support Reactions Report (Partial) ....................................................... 137 FIGURE 6-44 Punching Shear Check Results at Level 1...................................................... 139 FIGURE 6-45 Punching Shear Check Tabular Reports (partial) ........................................... 140
FIGURE 6-46 Manual Design Sections – Level 1................................................................. 142 FIGURE 6-47 Manual Design Sections Results Window ..................................................... 143
FIGURE 7-1 Builder Platform Module Selection – Floor Pro only ...................................... 145
FIGURE 7-2 FEM Menu ....................................................................................................... 146 FIGURE 7-3 Support Line in X-Direction ............................................................................ 147 FIGURE 7-4 Support Lines in X-Direction ........................................................................... 147 FIGURE 7-5 Support Line Design Section Options .............................................................. 148 FIGURE 7-6 Support Line Design Criteria ........................................................................... 149 FIGURE 7-7 Splitters for X-Direction .................................................................................. 150 FIGURE 7-8 Support Line in Y-Direction ............................................................................ 151 FIGURE 7-9 Support Lines in Y-Direction ........................................................................... 152 FIGURE 7-10 Splitters for Y-Direction ................................................................................ 153 FIGURE 7-11 Manually-Generated Design Strip for Support Line 9 ................................... 154
FIGURE 7-12 Manually-Generated Design Strips for Y-Direction ...................................... 155
FIGURE 7-13 Automatically-Generated Design Strips and Sections ................................... 156
FIGURE 7-14 Viewing Options for Design Sections ............................................................ 157 FIGURE 7-15 Design Strips and Sections for Y-Direction ................................................... 158 FIGURE 7-16 Idealized Design Tributaries for Y-Direction ................................................ 159 FIGURE 7-17 Support Line 9 Tributary Region ................................................................... 159 FIGURE 7-18 Support Line 9 Modified Tributary at Opening ............................................. 160
FIGURE 7-19 Support Line 10 Tributary Region ................................................................. 161 FIGURE 7-20 Support Line 10 Modified Tributary at Opening ........................................... 161
FIGURE 7-21 Modified Design Strips and Sections for Y-Direction ................................... 162
FIGURE 7-22 Design Criteria Display Option ...................................................................... 163 FIGURE 7-23 Design Criteria Display Option, Y-Direction ................................................ 163 FIGURE 7-24 RC-Only: Analysis/Design Options [Column Strip, Middle Strip] ............... 164
FIGURE 7-25 Support Line/Results Scale Toolbar ............................................................... 165 FIGURE 7-26 Result Display Settings for Design Section Checks ...................................... 167
FIGURE 7-27 Bending Moments along X-Direction for Service (Total Load) Combination................................................................................................................................................ 168
FIGURE 7-28 Deflections along X-direction for Service (Total Load) Combination .......... 169
FIGURE 7-29 Bottom Fiber Stresses along X-direction for Service (Total Load) Combination ........................................................................................................................... 170
FIGURE 7-30 Top Fiber Stresses along X-direction for Service (Total Load) Combination................................................................................................................................................ 170
FIGURE 7-31 Precompression along X-direction for Service (Total Load) Combination ... 171
FIGURE 7-32 Balanced Loading along X-direction for Service (Total Load) Combination 171
FIGURE 7-33 Generate Rebar Drawing Options .................................................................. 172 FIGURE 7-34 Rebar Drawing for Level 4 ............................................................................ 173
Index (VII )
B2012_GSG_02202012 Overview
FIGURE 7-35 ADViewer Load Cases/Combinations with Cracking ................................... 174
FIGURE 7-36 Z-Translation for Cracked_Sustained Load Combination ............................. 175
FIGURE 7-37 Compiled Report Generator ........................................................................... 176 FIGURE 7-38 Compiled Report Generator with expanded sections ..................................... 176
FIGURE 7-39 Compiled Report Generator with selected reports ......................................... 177
FIGURE 7-40 Print Options for Compiled Reports .............................................................. 178 FIGURE 8-1 Builder Platform Module Selection – MAT Workflow 1 ................................ 180
FIGURE 8-2 Plan View of Base Level mat foundation ........................................................ 181 FIGURE 8-3 Plan View of Base Level mat foundation ........................................................ 181 FIGURE 8-4 Side View of Model with mat foundation and soil support ............................ 182
FIGURE 8-5 Z-deformation at Base Level for Service (Total Load) condition .................... 183
FIGURE 8-6 Soil Pressure at Base Level – Workflow 1...................................................... 183 FIGURE 8-7 Analysis Options for MAT workflow 2 ........................................................... 185 FIGURE 8-8 Soil Pressure at Base Level – Workflow 2....................................................... 186

Index (VIII )
B2012_GSG_02202012
Index (9)
B2012_GSG_02202012 Overview
1 OVERVIEW OF ADAPT-BUILDER PLATFORM
1.1 ADAPT BUILDER 2012 Developed from the ground up with ADAPT Building Information Modeling (BIM) Technology, the ADAPT-Builder Platform is a collection of fully integrated design and analysis tools for concrete buildings, floor systems, foundations, and beam structures, with or without post-tensioning. The solution's intuitive and easy-to-use 3D component modeling capabilities allow you to quickly model any structure. Builder contains specialized design tools for concrete buildings, one-way or two-way column-supported flat slabs, parking structures, mat foundations, and ground-supported slabs. Built-in building codes include American (ACI), International (IBC), Canadian (A23), British (BS), European (EC), Australian (AS), Brazilian (NBR), and Indian (IS). The purpose of this Getting Started Guide is to provide the User with details and information for common workflows and tools to model, analyze and design concrete structures using Builder 2012 Floor Pro, Edge, and MAT programs. The most common and straightforward instructions will be provided in this guide. Other alternatives may exist to perform the same functions, but the purpose of this guide is to provide a quick and useful resource for a user new to Builder 2012 programs.
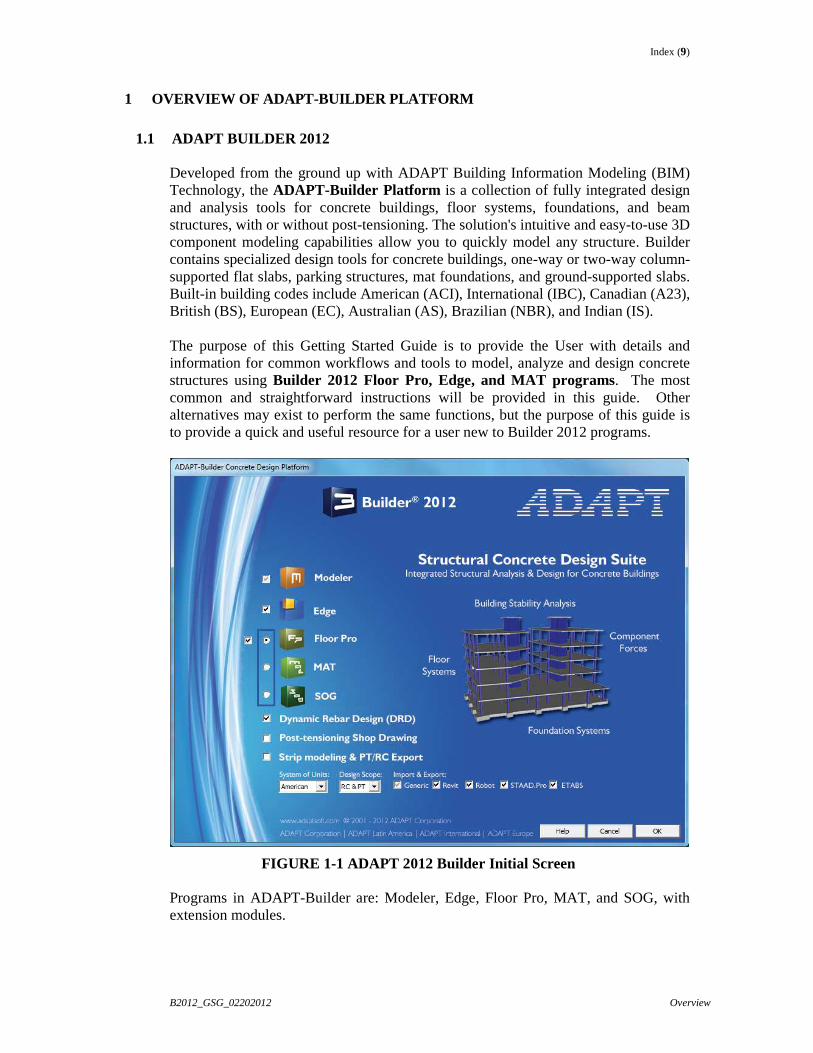
FIGURE 1-1 ADAPT 2012 Builder Initial Screen Programs in ADAPT-Builder are: Modeler, Edge, Floor Pro, MAT, and SOG, with extension modules.
Index (10)
B2012_GSG_02202012 5. Generation of 3D Structural Model through DWG Import
ADAPT Builder ’s initial screen is shown in the FIGURE 1-1. The user can select the Structure Type, and choose among the following:
(i) Full building modeling and analysis (EDGE) (ii) Elevated Floor Systems, Beam Frames, Grid Frames (FLOOR PRO) (iii) Mat/Raft Foundation, Grade Beams (MAT) (iv) Post-Tensioned Slab-On-Ground (SOG)
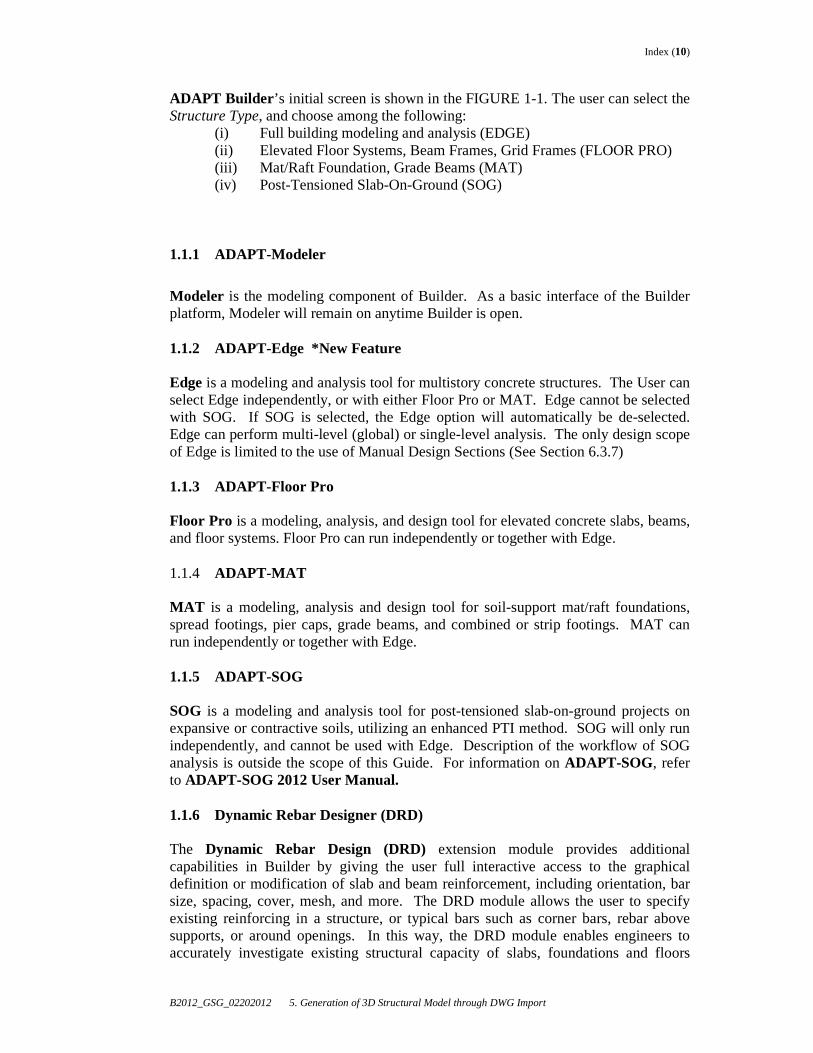
1.1.1 ADAPT-Modeler
Modeler is the modeling component of Builder. As a basic interface of the Builder platform, Modeler will remain on anytime Builder is open. 1.1.2 ADAPT-Edge *New Feature Edge is a modeling and analysis tool for multistory concrete structures. The User can select Edge independently, or with either Floor Pro or MAT. Edge cannot be selected with SOG. If SOG is selected, the Edge option will automatically be de-selected. Edge can perform multi-level (global) or single-level analysis. The only design scope of Edge is limited to the use of Manual Design Sections (See Section 6.3.7) 1.1.3 ADAPT-Floor Pro Floor Pro is a modeling, analysis, and design tool for elevated concrete slabs, beams, and floor systems. Floor Pro can run independently or together with Edge. 1.1.4 ADAPT-MAT MAT is a modeling, analysis and design tool for soil-support mat/raft foundations, spread footings, pier caps, grade beams, and combined or strip footings. MAT can run independently or together with Edge. 1.1.5 ADAPT-SOG SOG is a modeling and analysis tool for post-tensioned slab-on-ground projects on expansive or contractive soils, utilizing an enhanced PTI method. SOG will only run independently, and cannot be used with Edge. Description of the workflow of SOG analysis is outside the scope of this Guide. For information on ADAPT-SOG, refer to ADAPT-SOG 2012 User Manual. 1.1.6 Dynamic Rebar Designer (DRD) The Dynamic Rebar Design (DRD) extension module provides additional capabilities in Builder by giving the user full interactive access to the graphical definition or modification of slab and beam reinforcement, including orientation, bar size, spacing, cover, mesh, and more. The DRD module allows the user to specify existing reinforcing in a structure, or typical bars such as corner bars, rebar above supports, or around openings. In this way, the DRD module enables engineers to accurately investigate existing structural capacity of slabs, foundations and floors
Index (11)
B2012_GSG_02202012 Overview
systems. Additionally, the DRD module provides the user with automated report generation of post-tensioning steel and conventional reinforcing steel quantities. Detailed usage of the DRD module is outside the scope of this guide. For more information on the DRD module, refer to ADAPT-Floor Pro 2012 User Manual. 1.1.7 Post-tensioning Shop Drawing The Post-tensioning Shop Drawing extension module provides the user with additional functionality as pertains to the creation of post-tension shop drawings. With this module it is possible to perform friction and elongation calculations, manage the display of tendon chair/ support heights, and calculate tendon quantities and generate tendon-specific reports. Detailed usage of the Post-tensioning Shop Drawing module is outside the scope of this guide. For more information on this module, refer to ADAPT-Floor Pro 2012 User Manual. 1.1.8 Strip Modeling & PT/RC Export ADAPT also offers 2D, Equivalent Frame Solution software for post-tensioned and conventionally reinforced beams and slabs: ADAPT-PT and RC, respectively. These strip programs operate independently of Builder. However, it is possible to create a 3D model in Modeler/Edge/Floor Pro and export support lines for analysis and design in ADAPT-PT or RC. The use of this feature is outside the scope of this guide. Additional documentation and tutorials related to the usage of the strip modeling capabilities within Builder can be requested by contacting ADAPT Support ([email protected]). 1.1.9 Other Options on Initial Screen System of Units: The user can choose the system of units by selecting SI, American, or MKS from the drop-down menu. In this guide, we will use American units. Design Scope: The user can model a conventional Reinforced Concrete (RC) Structure or a Post-tensioned Structure (RC & PT) by selecting either option from the drop-down menu. In this guide, we will use both RC and RC&PT design scopes. Import/Exports: The user can import geometry and/or loading from other 3rd party general structural analysis and modeling solutions. Select Revit (Autodesk Revit Structure), Robot (Autodesk Robot Structural Analysis), STAAD.Pro, and/or ETABS as applies to your projects. General is the default import/export option, and will remain on while Builder is open.
1.2 ADAPT-MODELER MAIN SCREEN FIGURE 1-2 shows the full-screen display of the ADAPT-Modeler program, with typical features labeled for easy identification.
Index (12)
B2012_GSG_02202012 5. Generation of 3D Structural Model through DWG Import
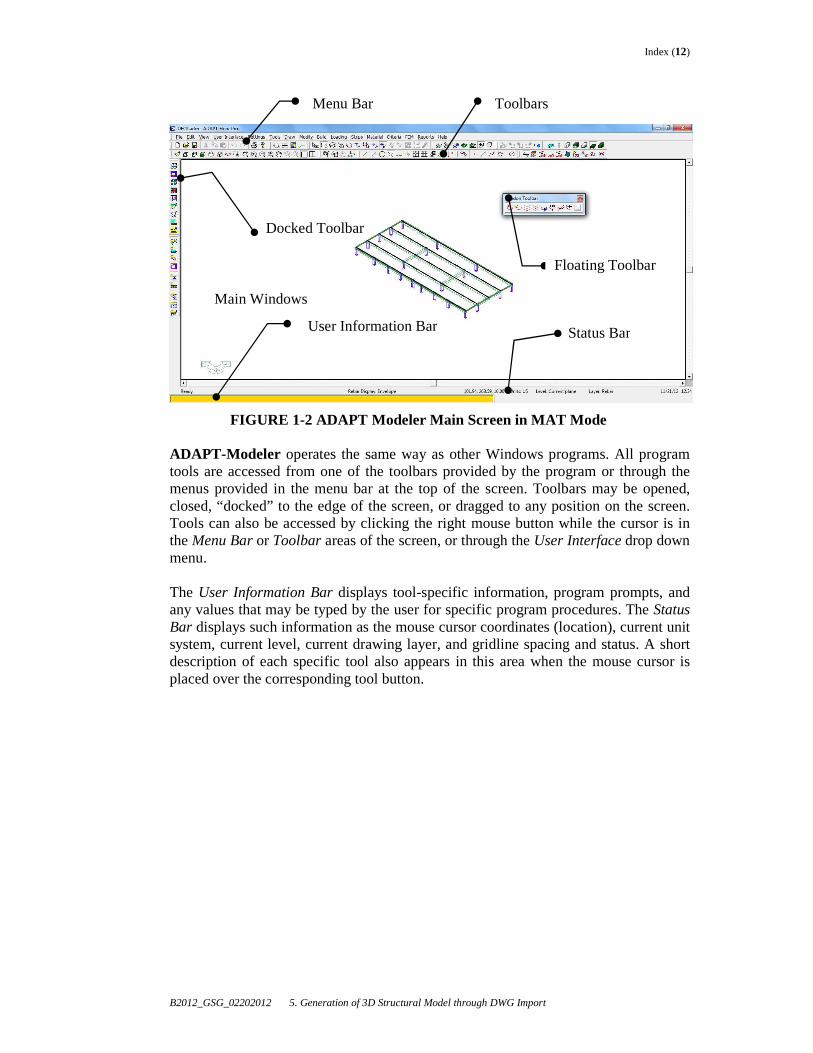
FIGURE 1-2 ADAPT Modeler Main Screen in MAT Mode ADAPT-Modeler operates the same way as other Windows programs. All program tools are accessed from one of the toolbars provided by the program or through the menus provided in the menu bar at the top of the screen. Toolbars may be opened, closed, “docked” to the edge of the screen, or dragged to any position on the screen. Tools can also be accessed by clicking the right mouse button while the cursor is in the Menu Bar or Toolbar areas of the screen, or through the User Interface drop down menu. The User Information Bar displays tool-specific information, program prompts, and any values that may be typed by the user for specific program procedures. The Status Bar displays such information as the mouse cursor coordinates (location), current unit system, current level, current drawing layer, and gridline spacing and status. A short description of each specific tool also appears in this area when the mouse cursor is placed over the corresponding tool button.
Toolbars
User Information Bar
Status Bar
Docked Toolbar
Menu Bar
Main Windows
Floating Toolbar
Index (13)
B2012_GSG_02202012 Overview
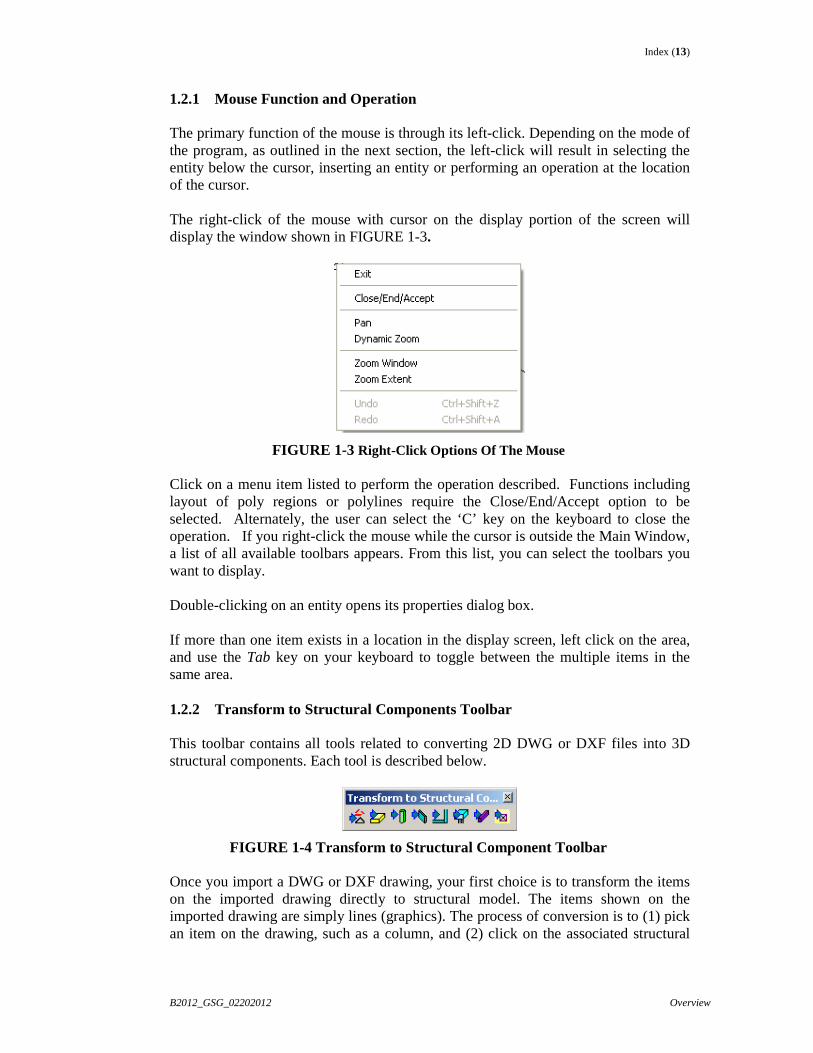
1.2.1 Mouse Function and Operation The primary function of the mouse is through its left-click. Depending on the mode of the program, as outlined in the next section, the left-click will result in selecting the entity below the cursor, inserting an entity or performing an operation at the location of the cursor. The right-click of the mouse with cursor on the display portion of the screen will display the window shown in FIGURE 1-3.
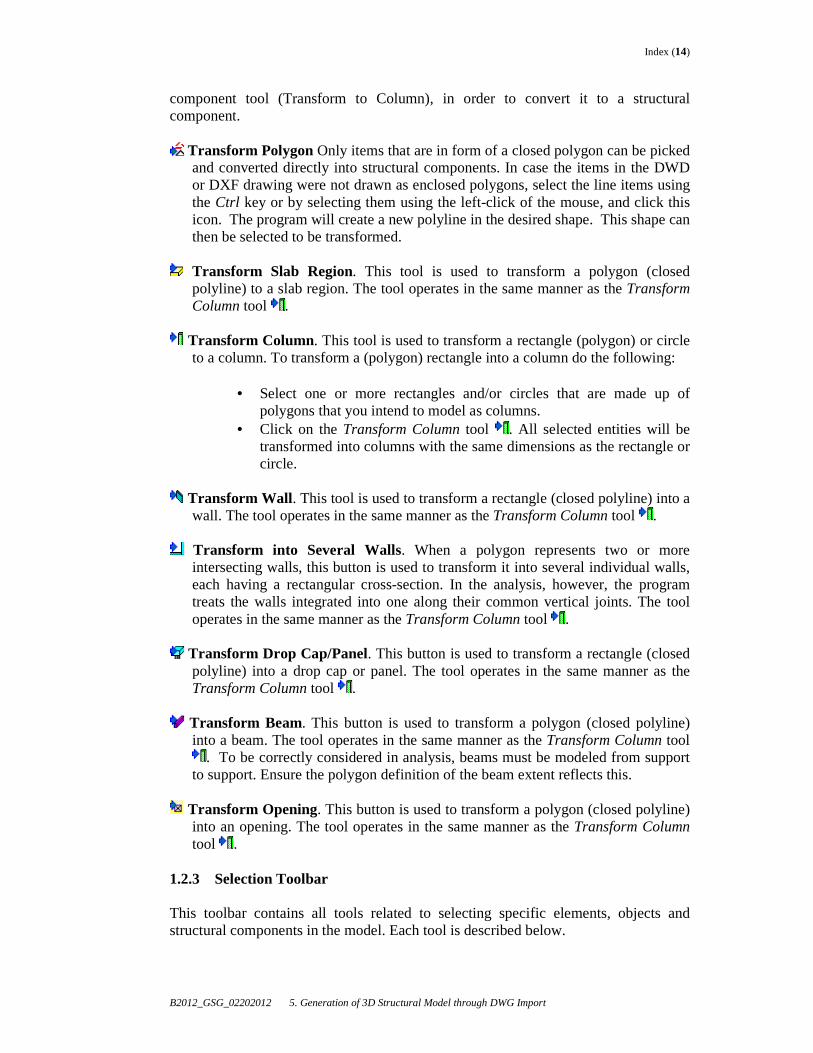
FIGURE 1-3 Right-Click Options Of The Mouse Click on a menu item listed to perform the operation described. Functions including layout of poly regions or polylines require the Close/End/Accept option to be selected. Alternately, the user can select the ‘C’ key on the keyboard to close the operation. If you right-click the mouse while the cursor is outside the Main Window, a list of all available toolbars appears. From this list, you can select the toolbars you want to display. Double-clicking on an entity opens its properties dialog box. If more than one item exists in a location in the display screen, left click on the area, and use the Tab key on your keyboard to toggle between the multiple items in the same area. 1.2.2 Transform to Structural Components Toolbar This toolbar contains all tools related to converting 2D DWG or DXF files into 3D structural components. Each tool is described below.
FIGURE 1-4 Transform to Structural Component Toolbar Once you import a DWG or DXF drawing, your first choice is to transform the items on the imported drawing directly to structural model. The items shown on the imported drawing are simply lines (graphics). The process of conversion is to (1) pick an item on the drawing, such as a column, and (2) click on the associated structural
Index (14)
B2012_GSG_02202012 5. Generation of 3D Structural Model through DWG Import
component tool (Transform to Column), in order to convert it to a structural component.
Transform Polygon Only items that are in form of a closed polygon can be picked and converted directly into structural components. In case the items in the DWD or DXF drawing were not drawn as enclosed polygons, select the line items using the Ctrl key or by selecting them using the left-click of the mouse, and click this icon. The program will create a new polyline in the desired shape. This shape can then be selected to be transformed.
Transform Slab Region. This tool is used to transform a polygon (closed
polyline) to a slab region. The tool operates in the same manner as the Transform Column tool .
Transform Column. This tool is used to transform a rectangle (polygon) or circle
to a column. To transform a (polygon) rectangle into a column do the following:
• Select one or more rectangles and/or circles that are made up of polygons that you intend to model as columns.
• Click on the Transform Column tool . All selected entities will be transformed into columns with the same dimensions as the rectangle or circle.
Transform Wall . This tool is used to transform a rectangle (closed polyline) into a
wall. The tool operates in the same manner as the Transform Column tool .
Transform into Several Walls. When a polygon represents two or more intersecting walls, this button is used to transform it into several individual walls, each having a rectangular cross-section. In the analysis, however, the program treats the walls integrated into one along their common vertical joints. The tool operates in the same manner as the Transform Column tool .
Transform Drop Cap/Panel. This button is used to transform a rectangle (closed
polyline) into a drop cap or panel. The tool operates in the same manner as the Transform Column tool .
Transform Beam. This button is used to transform a polygon (closed polyline)
into a beam. The tool operates in the same manner as the Transform Column tool . To be correctly considered in analysis, beams must be modeled from support
to support. Ensure the polygon definition of the beam extent reflects this.
Transform Opening. This button is used to transform a polygon (closed polyline) into an opening. The tool operates in the same manner as the Transform Column tool .
1.2.3 Selection Toolbar This toolbar contains all tools related to selecting specific elements, objects and structural components in the model. Each tool is described below.
Index (15)
B2012_GSG_02202012 Overview
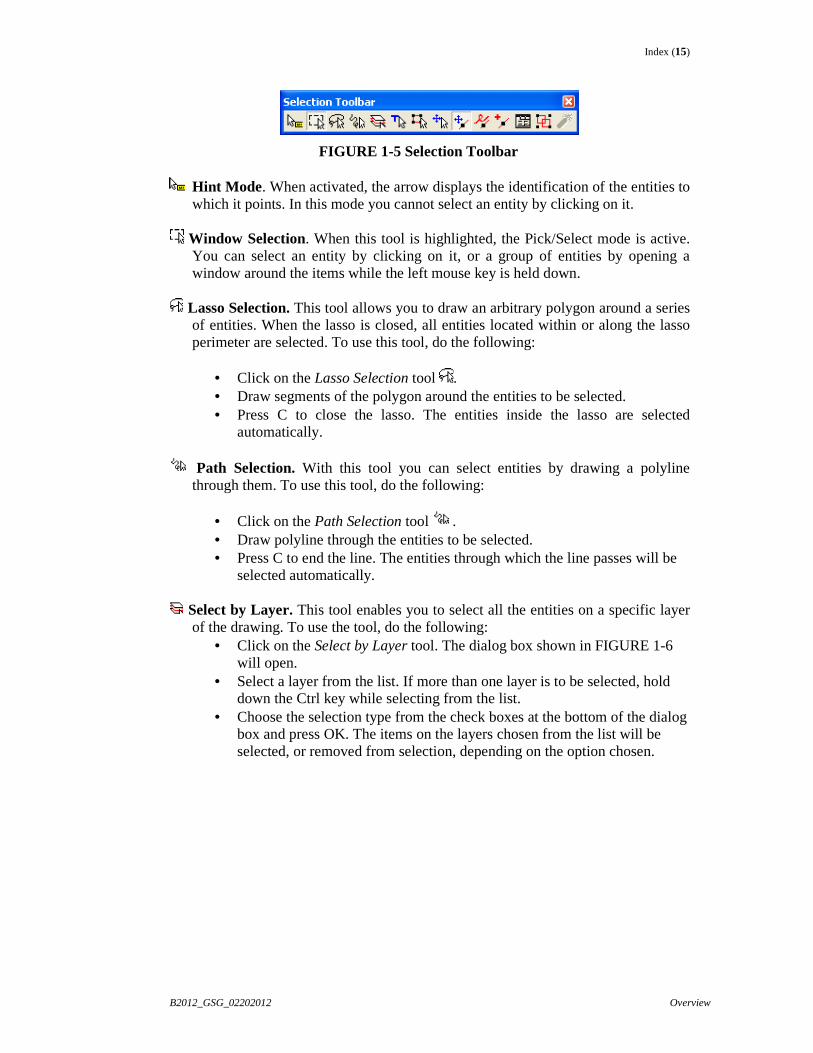
FIGURE 1-5 Selection Toolbar
Hint Mode. When activated, the arrow displays the identification of the entities to which it points. In this mode you cannot select an entity by clicking on it.
Window Selection. When this tool is highlighted, the Pick/Select mode is active.
You can select an entity by clicking on it, or a group of entities by opening a window around the items while the left mouse key is held down.
Lasso Selection. This tool allows you to draw an arbitrary polygon around a series
of entities. When the lasso is closed, all entities located within or along the lasso perimeter are selected. To use this tool, do the following:
• Click on the Lasso Selection tool . • Draw segments of the polygon around the entities to be selected. • Press C to close the lasso. The entities inside the lasso are selected
automatically.
Path Selection. With this tool you can select entities by drawing a polyline through them. To use this tool, do the following:
• Click on the Path Selection tool . • Draw polyline through the entities to be selected. • Press C to end the line. The entities through which the line passes will be
selected automatically.
Select by Layer. This tool enables you to select all the entities on a specific layer of the drawing. To use the tool, do the following:
• Click on the Select by Layer tool. The dialog box shown in FIGURE 1-6 will open.
• Select a layer from the list. If more than one layer is to be selected, hold down the Ctrl key while selecting from the list.
• Choose the selection type from the check boxes at the bottom of the dialog box and press OK. The items on the layers chosen from the list will be selected, or removed from selection, depending on the option chosen.
Index (16)
B2012_GSG_02202012 5. Generation of 3D Structural Model through DWG Import
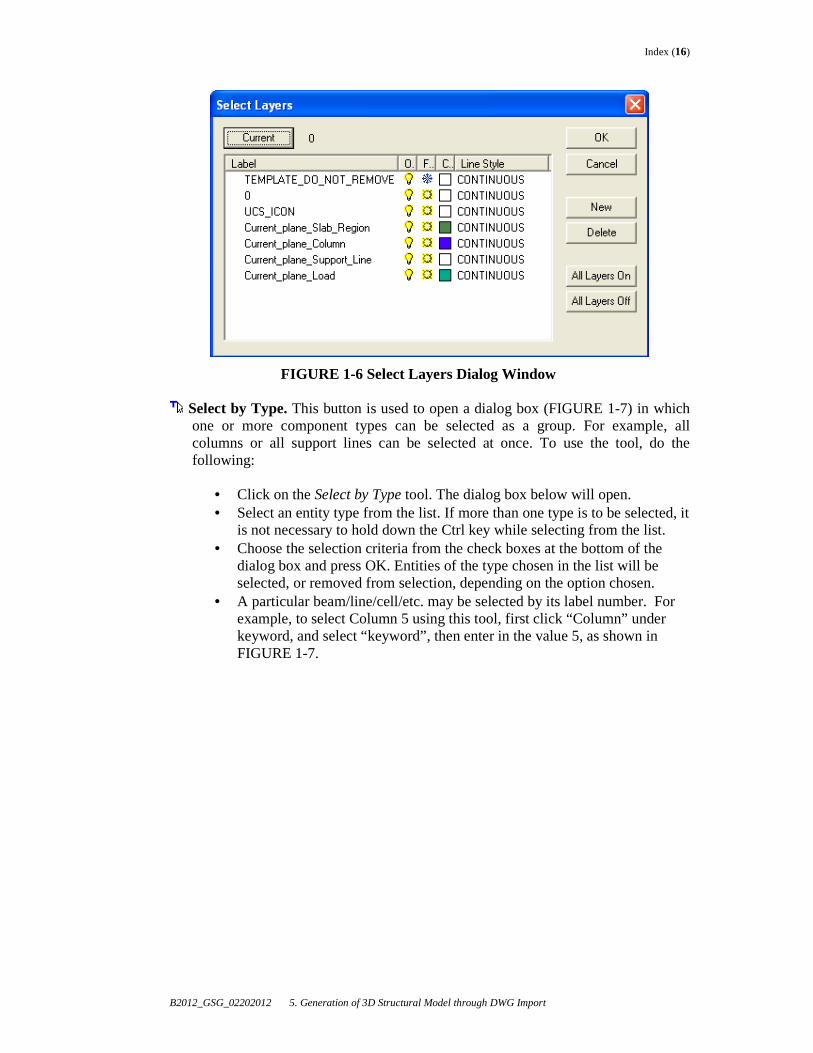
FIGURE 1-6 Select Layers Dialog Window
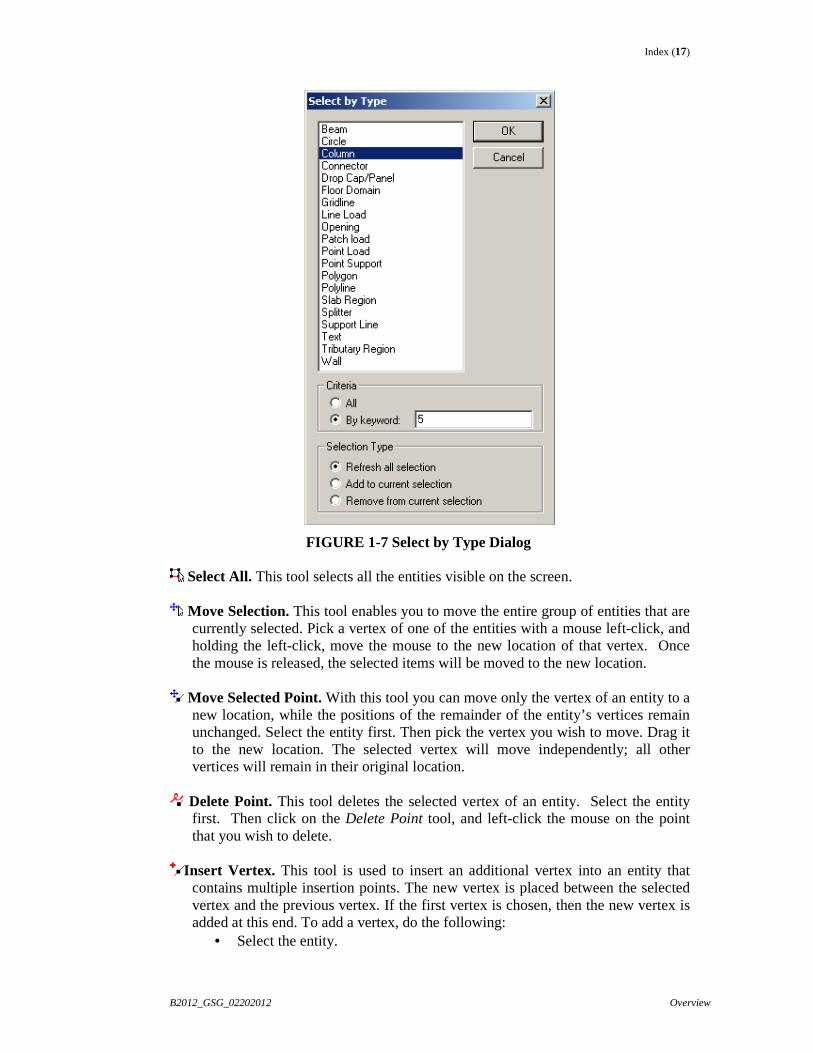
Select by Type. This button is used to open a dialog box (FIGURE 1-7) in which one or more component types can be selected as a group. For example, all columns or all support lines can be selected at once. To use the tool, do the following:
• Click on the Select by Type tool. The dialog box below will open. • Select an entity type from the list. If more than one type is to be selected, it
is not necessary to hold down the Ctrl key while selecting from the list. • Choose the selection criteria from the check boxes at the bottom of the
dialog box and press OK. Entities of the type chosen in the list will be selected, or removed from selection, depending on the option chosen.
• A particular beam/line/cell/etc. may be selected by its label number. For example, to select Column 5 using this tool, first click “Column” under keyword, and select “keyword”, then enter in the value 5, as shown in FIGURE 1-7.
Index (17)
B2012_GSG_02202012 Overview
FIGURE 1-7 Select by Type Dialog
Select All. This tool selects all the entities visible on the screen.
Move Selection. This tool enables you to move the entire group of entities that are currently selected. Pick a vertex of one of the entities with a mouse left-click, and holding the left-click, move the mouse to the new location of that vertex. Once the mouse is released, the selected items will be moved to the new location.
Move Selected Point. With this tool you can move only the vertex of an entity to a
new location, while the positions of the remainder of the entity’s vertices remain unchanged. Select the entity first. Then pick the vertex you wish to move. Drag it to the new location. The selected vertex will move independently; all other vertices will remain in their original location.
Delete Point. This tool deletes the selected vertex of an entity. Select the entity
first. Then click on the Delete Point tool, and left-click the mouse on the point that you wish to delete.
Insert Vertex. This tool is used to insert an additional vertex into an entity that
contains multiple insertion points. The new vertex is placed between the selected vertex and the previous vertex. If the first vertex is chosen, then the new vertex is added at this end. To add a vertex, do the following:
• Select the entity.
Index (18)
B2012_GSG_02202012 5. Generation of 3D Structural Model through DWG Import
• Click on the Insert Vertex tool . • Click on one of the entities’ vertices. Another vertex will be added to the
entity, adjacent to the selected vertex.
Item’s Properties (Alt + Enter). This tool opens up the Properties dialog box for the selected entity. The properties may then be edited, as specified in other parts of this manual. This dialog will also come up when an entity is double-clicked.
Group Selection. This tool creates a block containing all entities currently
selected. The block may then be dragged as one unit across the screen.
Explode Block. This tool breaks down a previously created block into its components. It also works with blocks of imported DWG or DXF files.
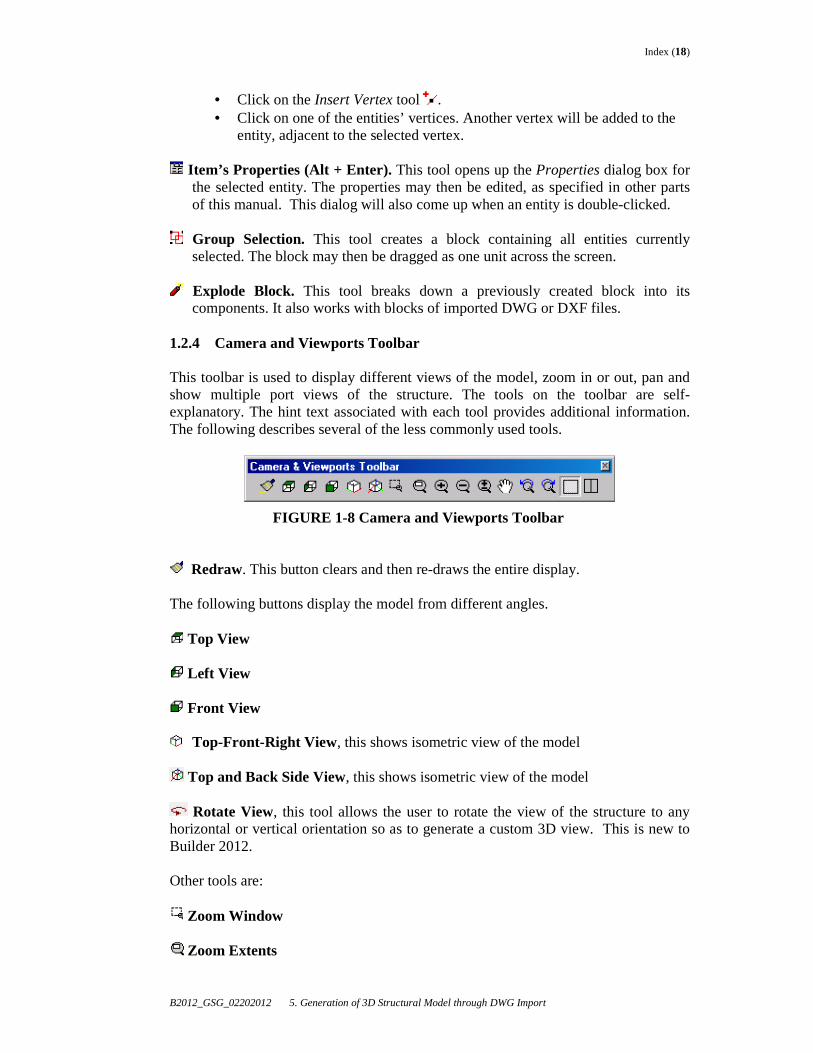
1.2.4 Camera and Viewports Toolbar This toolbar is used to display different views of the model, zoom in or out, pan and show multiple port views of the structure. The tools on the toolbar are self-explanatory. The hint text associated with each tool provides additional information. The following describes several of the less commonly used tools.
FIGURE 1-8 Camera and Viewports Toolbar
Redraw. This button clears and then re-draws the entire display. The following buttons display the model from different angles.
Top View
Left View
Front View
Top-Front-Right View , this shows isometric view of the model
Top and Back Side View, this shows isometric view of the model
Rotate View, this tool allows the user to rotate the view of the structure to any horizontal or vertical orientation so as to generate a custom 3D view. This is new to Builder 2012. Other tools are:
Zoom Window
Zoom Extents
Index (19)
B2012_GSG_02202012 Overview
Zoom In
Zoom Out
Dynamic Zoom
Dynamic Pan
Undo Zoom / Pan
Redo Zoom / Pan
Single Viewport
Two Vertical Viewports
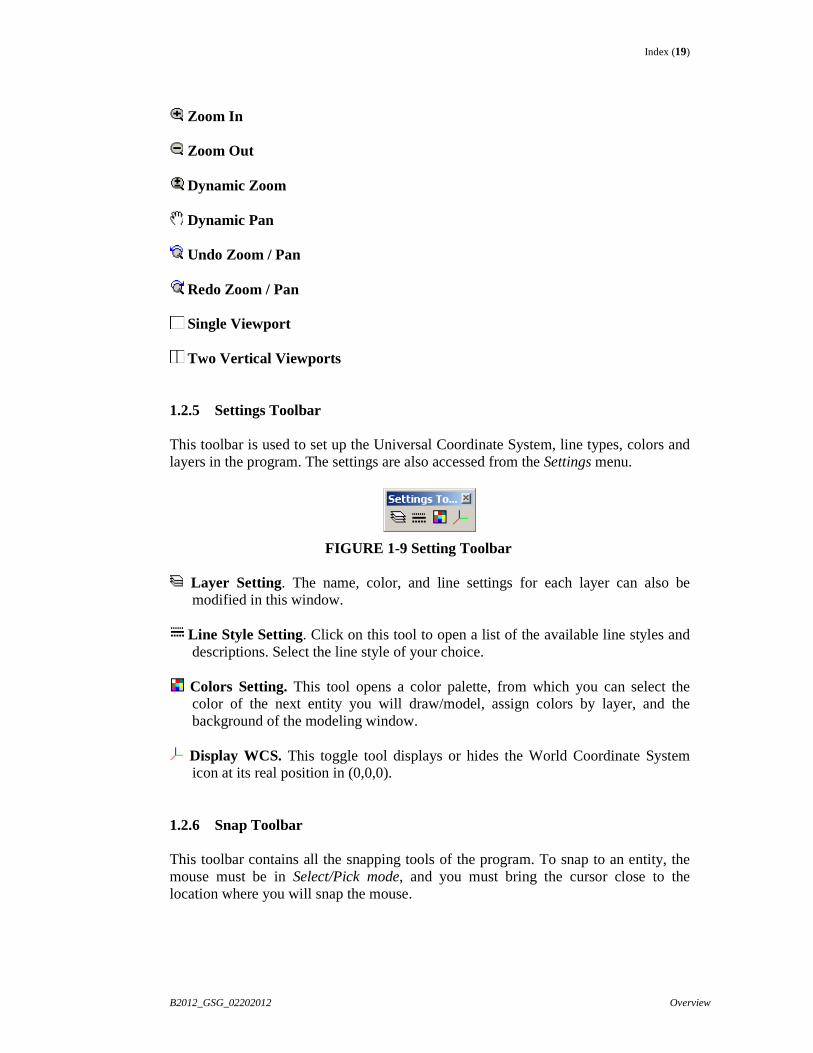
1.2.5 Settings Toolbar This toolbar is used to set up the Universal Coordinate System, line types, colors and layers in the program. The settings are also accessed from the Settings menu.
FIGURE 1-9 Setting Toolbar
Layer Setting. The name, color, and line settings for each layer can also be modified in this window.
Line Style Setting. Click on this tool to open a list of the available line styles and
descriptions. Select the line style of your choice.
Colors Setting. This tool opens a color palette, from which you can select the color of the next entity you will draw/model, assign colors by layer, and the background of the modeling window.
Display WCS. This toggle tool displays or hides the World Coordinate System
icon at its real position in (0,0,0). 1.2.6 Snap Toolbar
This toolbar contains all the snapping tools of the program. To snap to an entity, the mouse must be in Select/Pick mode, and you must bring the cursor close to the location where you will snap the mouse.
Index (20)
B2012_GSG_02202012 5. Generation of 3D Structural Model through DWG Import
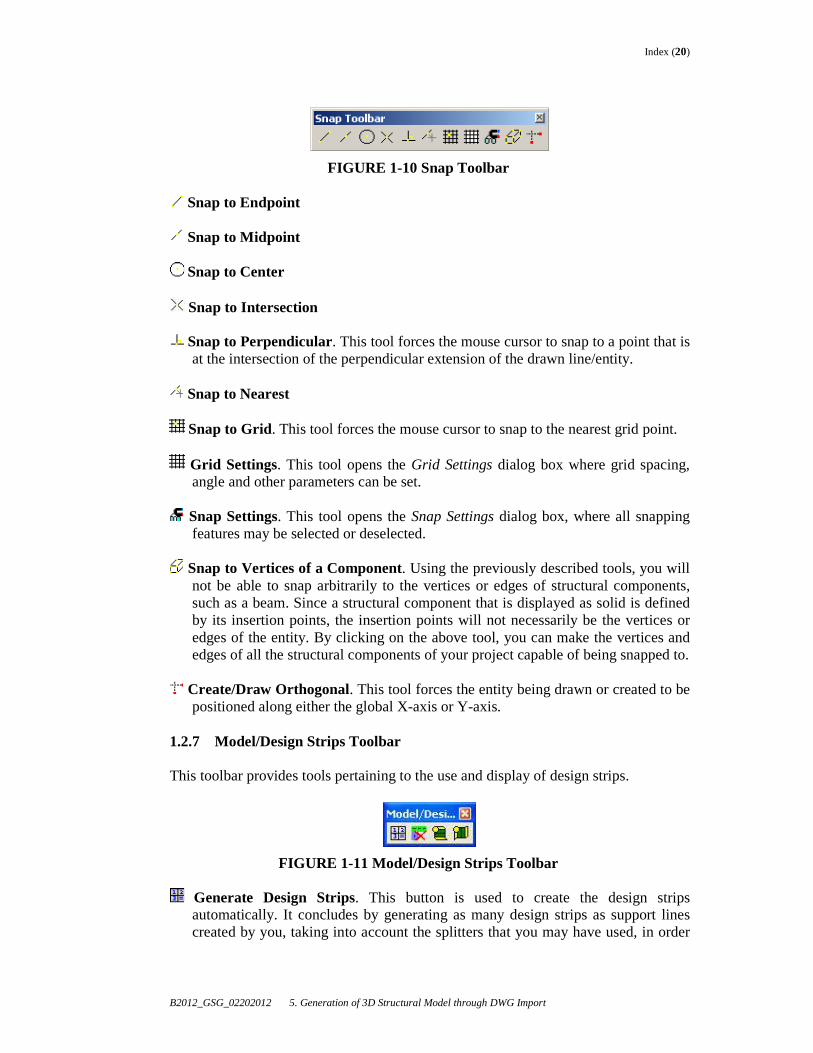
FIGURE 1-10 Snap Toolbar
Snap to Endpoint
Snap to Midpoint
Snap to Center
Snap to Intersection
Snap to Perpendicular. This tool forces the mouse cursor to snap to a point that is at the intersection of the perpendicular extension of the drawn line/entity.
Snap to Nearest
Snap to Grid. This tool forces the mouse cursor to snap to the nearest grid point.
Grid Settings. This tool opens the Grid Settings dialog box where grid spacing, angle and other parameters can be set.
Snap Settings. This tool opens the Snap Settings dialog box, where all snapping
features may be selected or deselected.
Snap to Vertices of a Component. Using the previously described tools, you will not be able to snap arbitrarily to the vertices or edges of structural components, such as a beam. Since a structural component that is displayed as solid is defined by its insertion points, the insertion points will not necessarily be the vertices or edges of the entity. By clicking on the above tool, you can make the vertices and edges of all the structural components of your project capable of being snapped to.
Create/Draw Orthogonal. This tool forces the entity being drawn or created to be
positioned along either the global X-axis or Y-axis. 1.2.7 Model/Design Strips Toolbar This toolbar provides tools pertaining to the use and display of design strips.
FIGURE 1-11 Model/Design Strips Toolbar
Generate Design Strips. This button is used to create the design strips automatically. It concludes by generating as many design strips as support lines created by you, taking into account the splitters that you may have used, in order
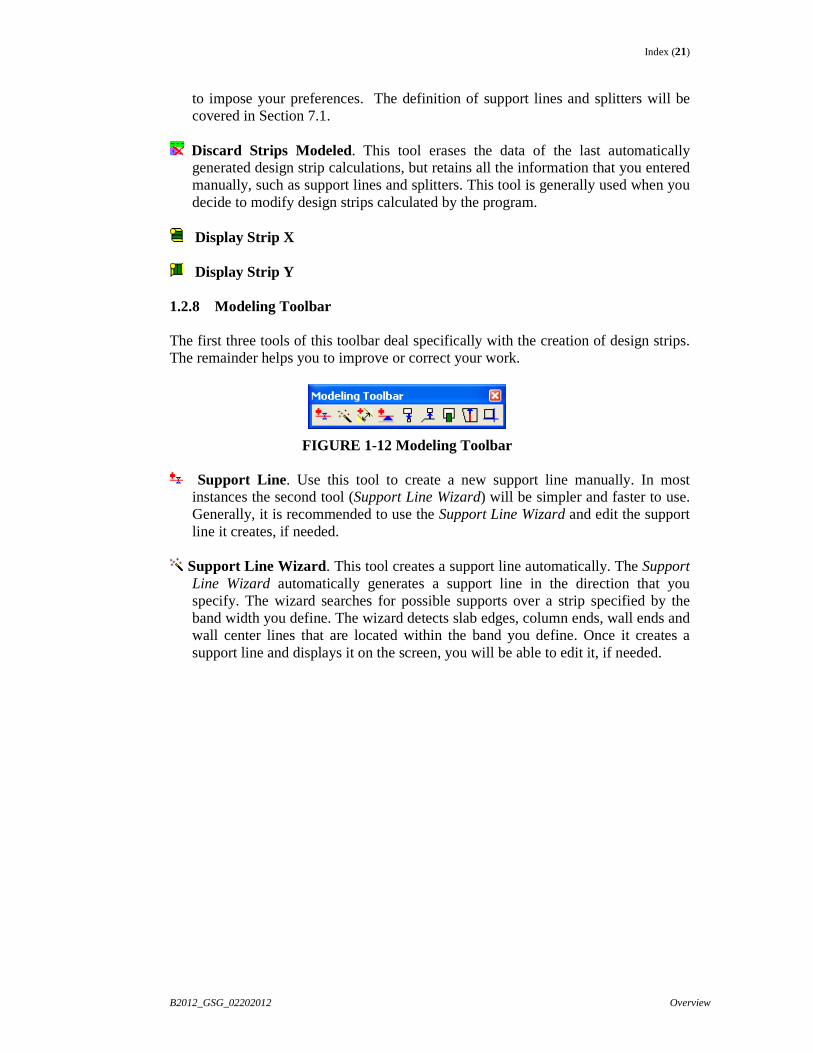
Index (21)
B2012_GSG_02202012 Overview
to impose your preferences. The definition of support lines and splitters will be covered in Section 7.1.
Discard Strips Modeled. This tool erases the data of the last automatically
generated design strip calculations, but retains all the information that you entered manually, such as support lines and splitters. This tool is generally used when you decide to modify design strips calculated by the program.
Display Strip X
Display Strip Y
1.2.8 Modeling Toolbar The first three tools of this toolbar deal specifically with the creation of design strips. The remainder helps you to improve or correct your work.
FIGURE 1-12 Modeling Toolbar
Support Line. Use this tool to create a new support line manually. In most instances the second tool (Support Line Wizard) will be simpler and faster to use. Generally, it is recommended to use the Support Line Wizard and edit the support line it creates, if needed.
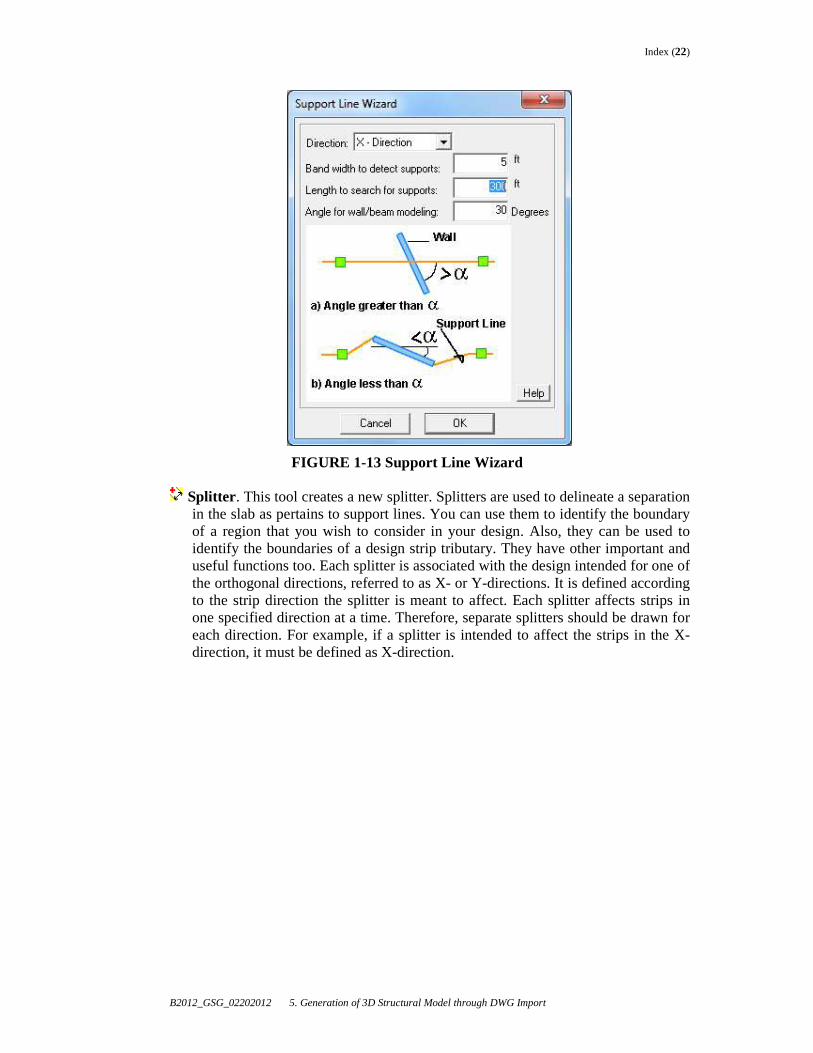
Support Line Wizard . This tool creates a support line automatically. The Support
Line Wizard automatically generates a support line in the direction that you specify. The wizard searches for possible supports over a strip specified by the band width you define. The wizard detects slab edges, column ends, wall ends and wall center lines that are located within the band you define. Once it creates a support line and displays it on the screen, you will be able to edit it, if needed.
Index (22)
B2012_GSG_02202012 5. Generation of 3D Structural Model through DWG Import
FIGURE 1-13 Support Line Wizard
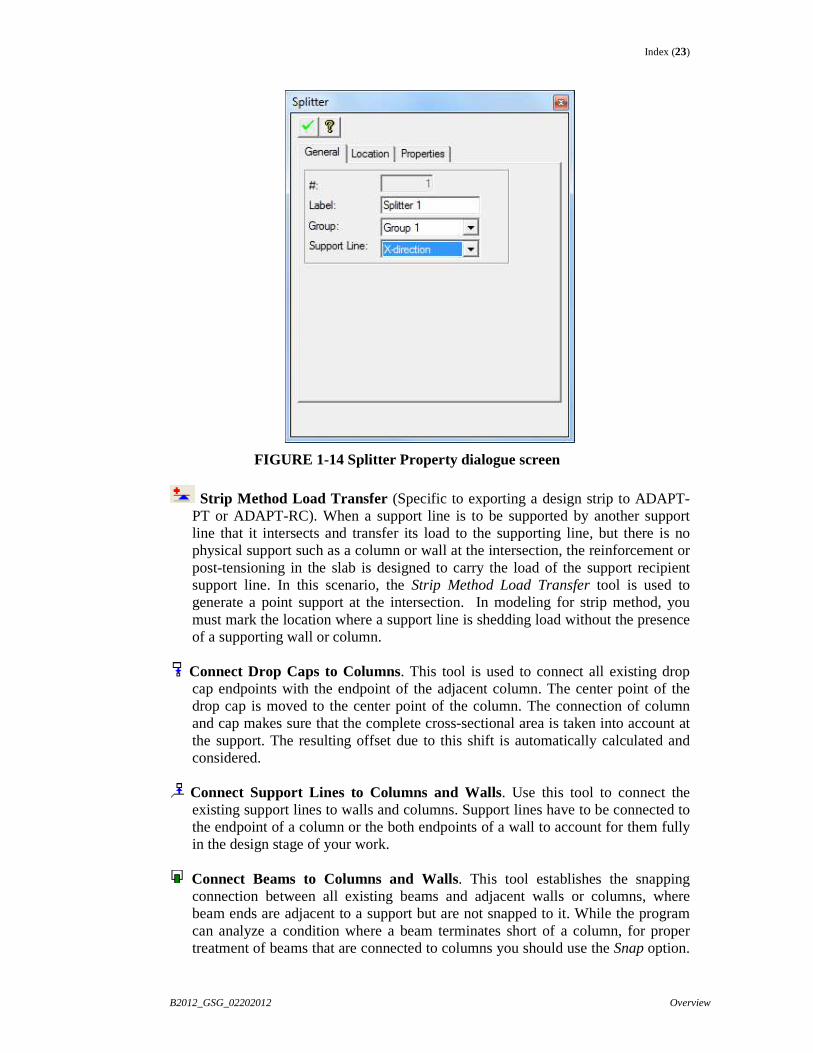
Splitter . This tool creates a new splitter. Splitters are used to delineate a separation in the slab as pertains to support lines. You can use them to identify the boundary of a region that you wish to consider in your design. Also, they can be used to identify the boundaries of a design strip tributary. They have other important and useful functions too. Each splitter is associated with the design intended for one of the orthogonal directions, referred to as X- or Y-directions. It is defined according to the strip direction the splitter is meant to affect. Each splitter affects strips in one specified direction at a time. Therefore, separate splitters should be drawn for each direction. For example, if a splitter is intended to affect the strips in the X-direction, it must be defined as X-direction.
Index (23)
B2012_GSG_02202012 Overview
FIGURE 1-14 Splitter Property dialogue screen
Strip Method Load Transfer (Specific to exporting a design strip to ADAPT-PT or ADAPT-RC). When a support line is to be supported by another support line that it intersects and transfer its load to the supporting line, but there is no physical support such as a column or wall at the intersection, the reinforcement or post-tensioning in the slab is designed to carry the load of the support recipient support line. In this scenario, the Strip Method Load Transfer tool is used to generate a point support at the intersection. In modeling for strip method, you must mark the location where a support line is shedding load without the presence of a supporting wall or column.
Connect Drop Caps to Columns. This tool is used to connect all existing drop
cap endpoints with the endpoint of the adjacent column. The center point of the drop cap is moved to the center point of the column. The connection of column and cap makes sure that the complete cross-sectional area is taken into account at the support. The resulting offset due to this shift is automatically calculated and considered.
Connect Support Lines to Columns and Walls. Use this tool to connect the
existing support lines to walls and columns. Support lines have to be connected to the endpoint of a column or the both endpoints of a wall to account for them fully in the design stage of your work.
Connect Beams to Columns and Walls. This tool establishes the snapping
connection between all existing beams and adjacent walls or columns, where beam ends are adjacent to a support but are not snapped to it. While the program can analyze a condition where a beam terminates short of a column, for proper treatment of beams that are connected to columns you should use the Snap option.
Index (24)
B2012_GSG_02202012 5. Generation of 3D Structural Model through DWG Import
This tool will search for such instances in your model and will establish the connection.
Support Lines Extension. This tool extends all existing support lines to the edges
of the slab. Use this tool if you created a support line manually, and you missed snapping its ends to the slab edges. If the distance of the support line end to a slab edge is more than the program’s tolerance, you must make the connection manually.
Align Structural Components. This tool improves the quality of your modeling.
You can automatically adjust the location of a wall or column that you have drawn to line up with the face of slab.
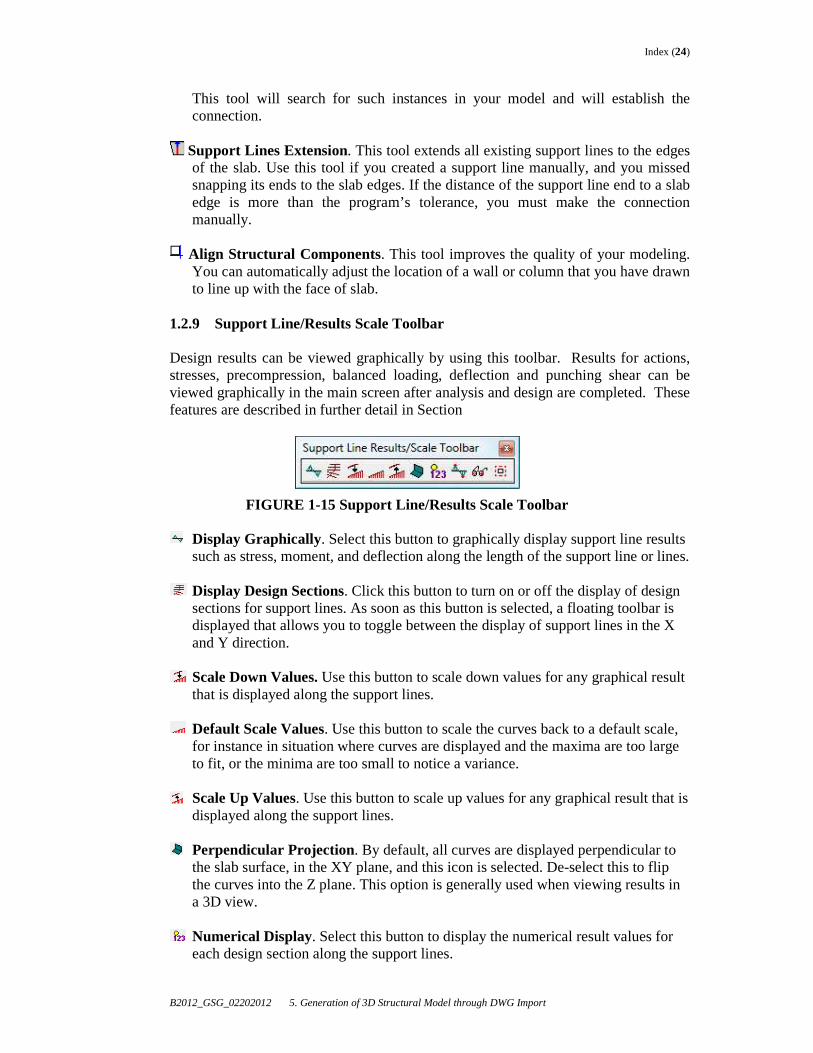
1.2.9 Support Line/Results Scale Toolbar Design results can be viewed graphically by using this toolbar. Results for actions, stresses, precompression, balanced loading, deflection and punching shear can be viewed graphically in the main screen after analysis and design are completed. These features are described in further detail in Section
FIGURE 1-15 Support Line/Results Scale Toolbar
Display Graphically. Select this button to graphically display support line results such as stress, moment, and deflection along the length of the support line or lines.
Display Design Sections. Click this button to turn on or off the display of design sections for support lines. As soon as this button is selected, a floating toolbar is displayed that allows you to toggle between the display of support lines in the X and Y direction.
Scale Down Values. Use this button to scale down values for any graphical result that is displayed along the support lines.
Default Scale Values. Use this button to scale the curves back to a default scale, for instance in situation where curves are displayed and the maxima are too large to fit, or the minima are too small to notice a variance.
Scale Up Values. Use this button to scale up values for any graphical result that is
displayed along the support lines.
Perpendicular Projection. By default, all curves are displayed perpendicular to the slab surface, in the XY plane, and this icon is selected. De-select this to flip the curves into the Z plane. This option is generally used when viewing results in a 3D view.
Numerical Display. Select this button to display the numerical result values for each design section along the support lines.
Index (25)
B2012_GSG_02202012 Overview
Display Min/Max Values. Select this button to only display the minimum and maximum result values along the support lines.
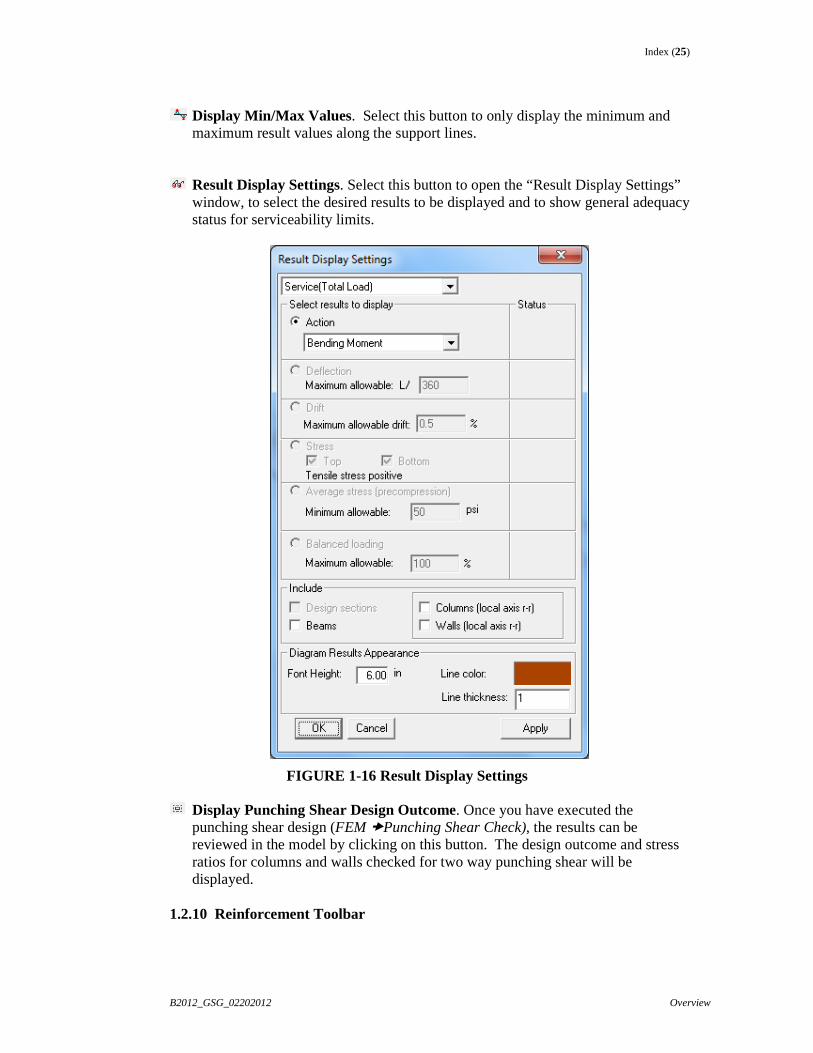
Result Display Settings. Select this button to open the “Result Display Settings” window, to select the desired results to be displayed and to show general adequacy status for serviceability limits.
FIGURE 1-16 Result Display Settings
Display Punching Shear Design Outcome. Once you have executed the punching shear design (FEM �Punching Shear Check), the results can be reviewed in the model by clicking on this button. The design outcome and stress ratios for columns and walls checked for two way punching shear will be displayed.
1.2.10 Reinforcement Toolbar
Index (26)
B2012_GSG_02202012 5. Generation of 3D Structural Model through DWG Import
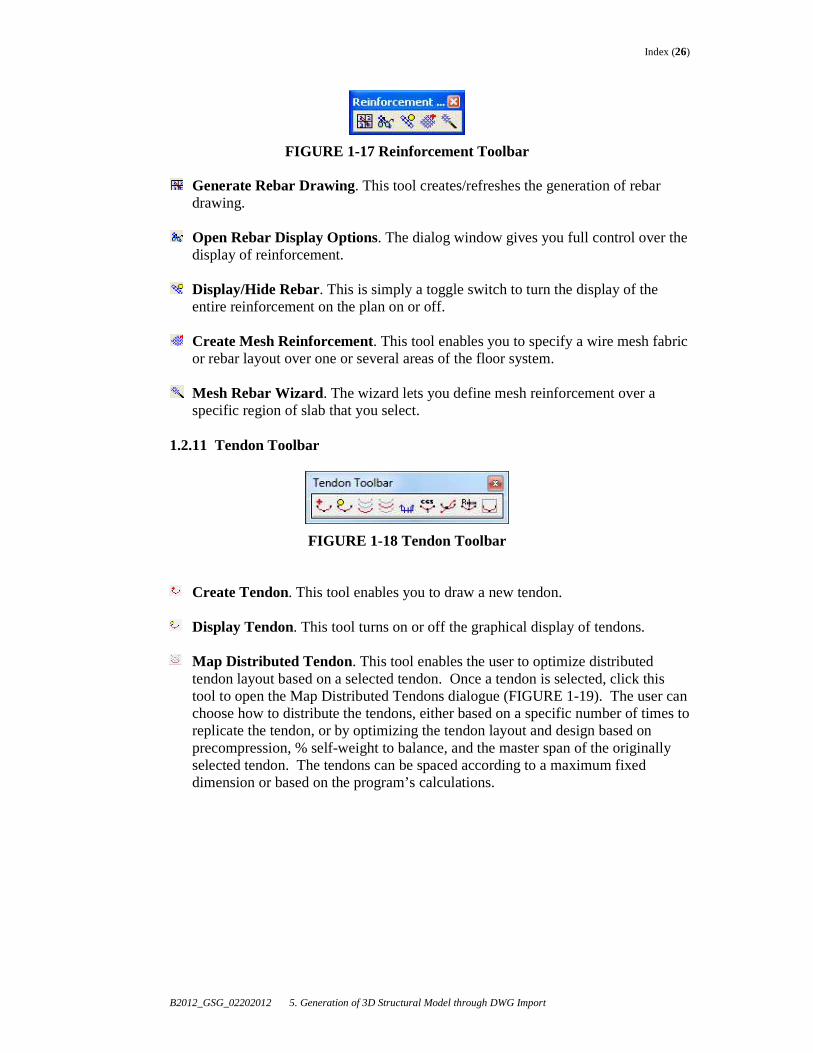
FIGURE 1-17 Reinforcement Toolbar
Generate Rebar Drawing. This tool creates/refreshes the generation of rebar drawing.
Open Rebar Display Options. The dialog window gives you full control over the
display of reinforcement.
Display/Hide Rebar. This is simply a toggle switch to turn the display of the entire reinforcement on the plan on or off.
Create Mesh Reinforcement. This tool enables you to specify a wire mesh fabric
or rebar layout over one or several areas of the floor system.
Mesh Rebar Wizard. The wizard lets you define mesh reinforcement over a specific region of slab that you select.
1.2.11 Tendon Toolbar
FIGURE 1-18 Tendon Toolbar
Create Tendon. This tool enables you to draw a new tendon.
Display Tendon. This tool turns on or off the graphical display of tendons.
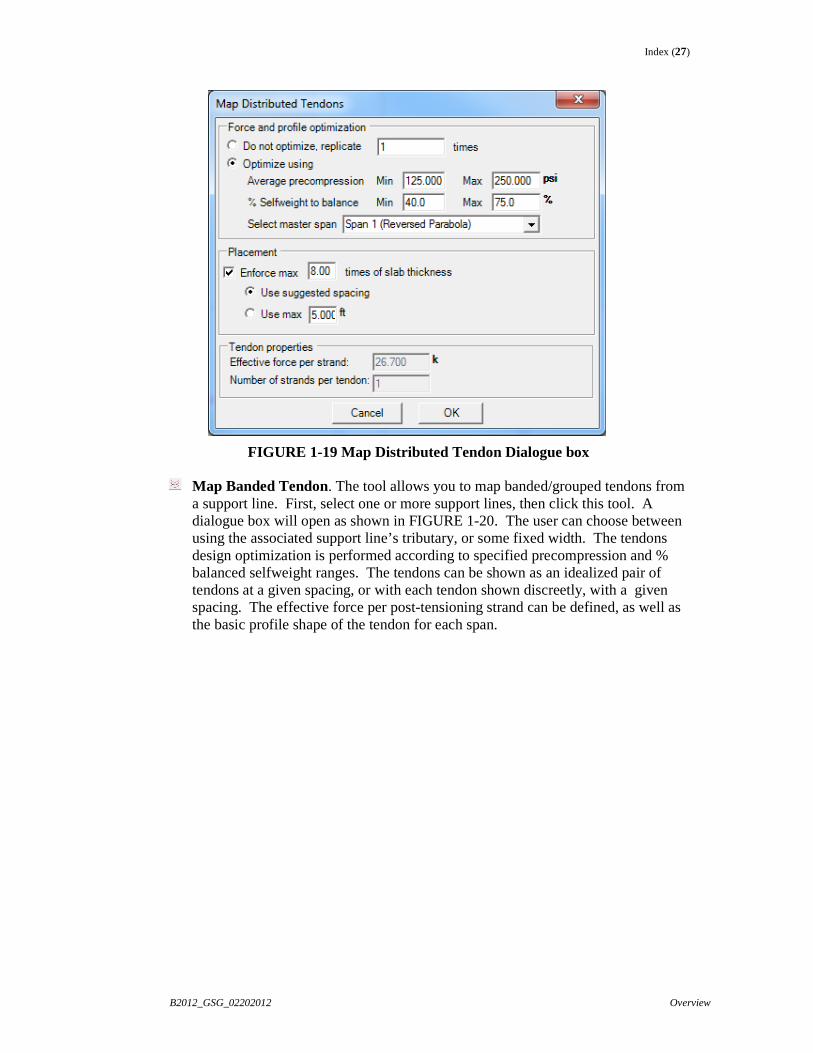
Map Distributed Tendon. This tool enables the user to optimize distributed tendon layout based on a selected tendon. Once a tendon is selected, click this tool to open the Map Distributed Tendons dialogue (FIGURE 1-19). The user can choose how to distribute the tendons, either based on a specific number of times to replicate the tendon, or by optimizing the tendon layout and design based on precompression, % self-weight to balance, and the master span of the originally selected tendon. The tendons can be spaced according to a maximum fixed dimension or based on the program’s calculations.
Index (27)
B2012_GSG_02202012 Overview
FIGURE 1-19 Map Distributed Tendon Dialogue box
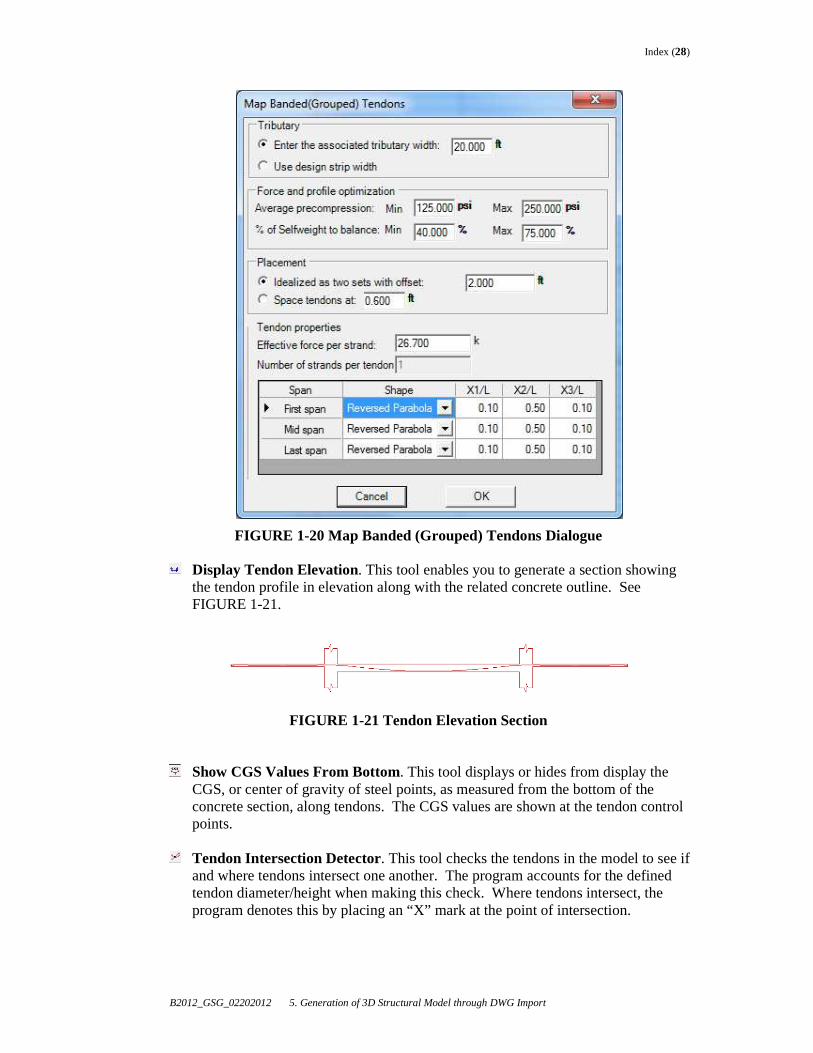
Map Banded Tendon. The tool allows you to map banded/grouped tendons from a support line. First, select one or more support lines, then click this tool. A dialogue box will open as shown in FIGURE 1-20. The user can choose between using the associated support line’s tributary, or some fixed width. The tendons design optimization is performed according to specified precompression and % balanced selfweight ranges. The tendons can be shown as an idealized pair of tendons at a given spacing, or with each tendon shown discreetly, with a given spacing. The effective force per post-tensioning strand can be defined, as well as the basic profile shape of the tendon for each span.
Index (28)
B2012_GSG_02202012 5. Generation of 3D Structural Model through DWG Import
FIGURE 1-20 Map Banded (Grouped) Tendons Dialogue
Display Tendon Elevation. This tool enables you to generate a section showing the tendon profile in elevation along with the related concrete outline. See FIGURE 1-21.
FIGURE 1-21 Tendon Elevation Section
Show CGS Values From Bottom. This tool displays or hides from display the CGS, or center of gravity of steel points, as measured from the bottom of the concrete section, along tendons. The CGS values are shown at the tendon control points.
Tendon Intersection Detector. This tool checks the tendons in the model to see if
and where tendons intersect one another. The program accounts for the defined tendon diameter/height when making this check. Where tendons intersect, the program denotes this by placing an “X” mark at the point of intersection.
Index (29)
B2012_GSG_02202012 Overview
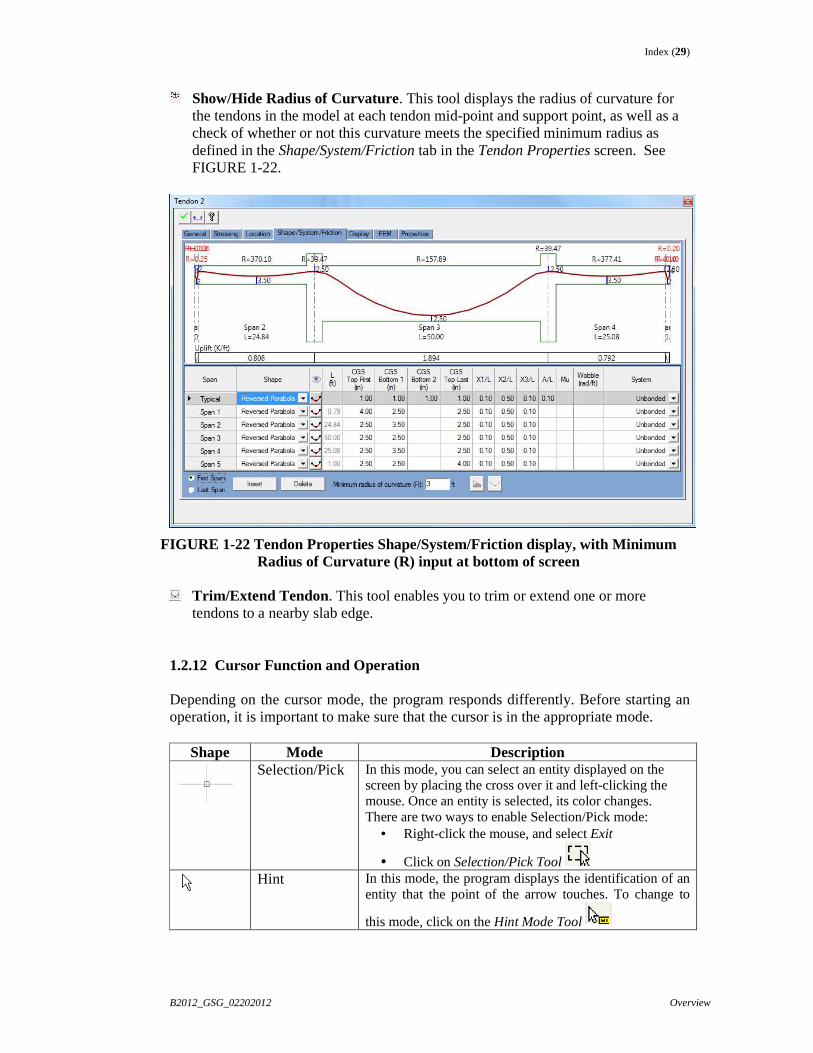
Show/Hide Radius of Curvature. This tool displays the radius of curvature for the tendons in the model at each tendon mid-point and support point, as well as a check of whether or not this curvature meets the specified minimum radius as defined in the Shape/System/Friction tab in the Tendon Properties screen. See FIGURE 1-22.
FIGURE 1-22 Tendon Properties Shape/System/Friction display, with Minimum Radius of Curvature (R) input at bottom of screen
Trim/Extend Tendon. This tool enables you to trim or extend one or more
tendons to a nearby slab edge. 1.2.12 Cursor Function and Operation Depending on the cursor mode, the program responds differently. Before starting an operation, it is important to make sure that the cursor is in the appropriate mode.
Shape Mode Description
Selection/Pick In this mode, you can select an entity displayed on the screen by placing the cross over it and left-clicking the mouse. Once an entity is selected, its color changes. There are two ways to enable Selection/Pick mode:
• Right-click the mouse, and select Exit
• Click on Selection/Pick Tool
Hint In this mode, the program displays the identification of an
entity that the point of the arrow touches. To change to
this mode, click on the Hint Mode Tool
Index (30)
B2012_GSG_02202012 5. Generation of 3D Structural Model through DWG Import
Creation In this mode, the program will create an entity, such as a line, column or slab. Place the cross at the location where you want the entity to be created and left-click the mouse. Detailed instruction for creation of each entity will be prompted on the User Information Bar at the bottom of the screen. To enable Creation Mode, left-click the mouse on the tool of the entity you intend to create. Then follow the instructions at the bottom of the screen.
Snap
In this mode, the magnet indicates that the cursor is in Snap Mode and is searching to snap onto an entity. The cursor will search for one or more entities. Once the cursor becomes close to any of the entities or conditions it is searching for, it will display a yellow sign over the location to be snapped. The shape of the yellow sign displayed identifies the entity for snapping.
Undefined Creation
In this mode, the program can be requested to create an entity, although the plane on which the entity is to be created is not displayed. You must change the screen view (go to Plan View, if you are in Elevation) before you can create the entity in mind.
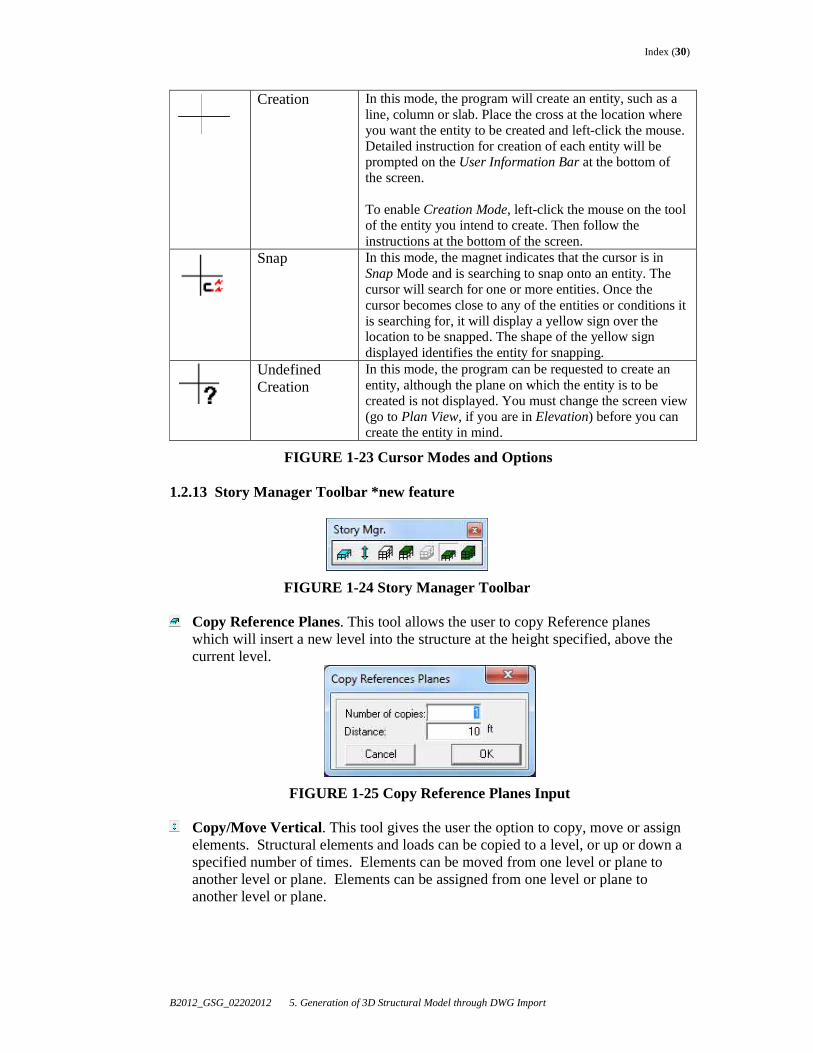
FIGURE 1-23 Cursor Modes and Options 1.2.13 Story Manager Toolbar *new feature
FIGURE 1-24 Story Manager Toolbar
Copy Reference Planes. This tool allows the user to copy Reference planes which will insert a new level into the structure at the height specified, above the current level.
FIGURE 1-25 Copy Reference Planes Input
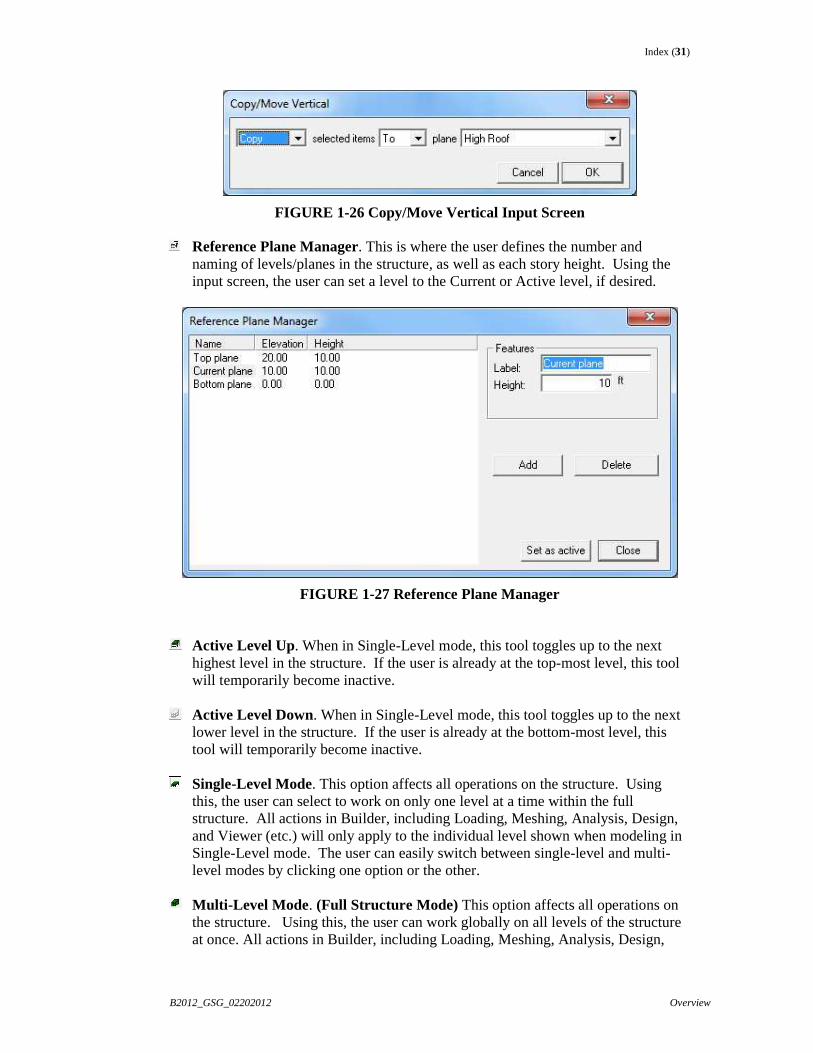
Copy/Move Vertical. This tool gives the user the option to copy, move or assign elements. Structural elements and loads can be copied to a level, or up or down a specified number of times. Elements can be moved from one level or plane to another level or plane. Elements can be assigned from one level or plane to another level or plane.
Index (31)
B2012_GSG_02202012 Overview
FIGURE 1-26 Copy/Move Vertical Input Screen
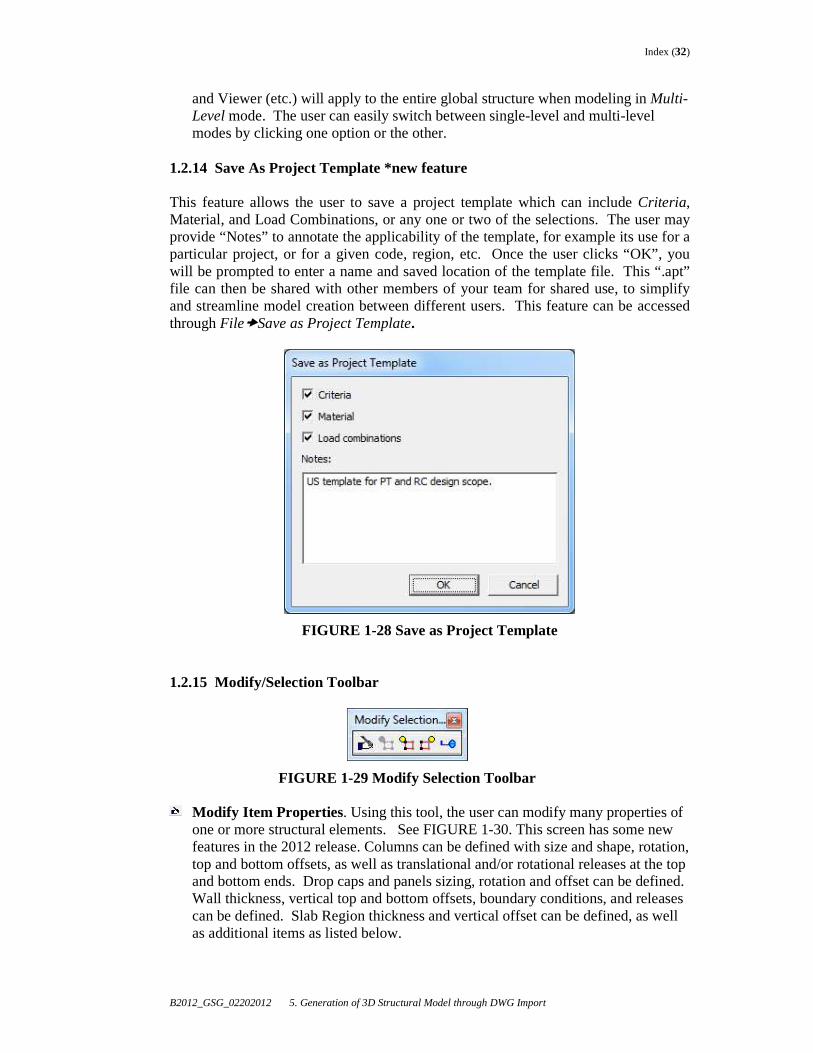
Reference Plane Manager. This is where the user defines the number and naming of levels/planes in the structure, as well as each story height. Using the input screen, the user can set a level to the Current or Active level, if desired.
FIGURE 1-27 Reference Plane Manager
Active Level Up. When in Single-Level mode, this tool toggles up to the next highest level in the structure. If the user is already at the top-most level, this tool will temporarily become inactive.
Active Level Down. When in Single-Level mode, this tool toggles up to the next
lower level in the structure. If the user is already at the bottom-most level, this tool will temporarily become inactive.
Single-Level Mode. This option affects all operations on the structure. Using
this, the user can select to work on only one level at a time within the full structure. All actions in Builder, including Loading, Meshing, Analysis, Design, and Viewer (etc.) will only apply to the individual level shown when modeling in Single-Level mode. The user can easily switch between single-level and multi-level modes by clicking one option or the other.
Multi-Level Mode . (Full Structure Mode) This option affects all operations on
the structure. Using this, the user can work globally on all levels of the structure at once. All actions in Builder, including Loading, Meshing, Analysis, Design,
Index (32)
B2012_GSG_02202012 5. Generation of 3D Structural Model through DWG Import
and Viewer (etc.) will apply to the entire global structure when modeling in Multi-Level mode. The user can easily switch between single-level and multi-level modes by clicking one option or the other.
1.2.14 Save As Project Template *new feature This feature allows the user to save a project template which can include Criteria, Material, and Load Combinations, or any one or two of the selections. The user may provide “Notes” to annotate the applicability of the template, for example its use for a particular project, or for a given code, region, etc. Once the user clicks “OK”, you will be prompted to enter a name and saved location of the template file. This “.apt” file can then be shared with other members of your team for shared use, to simplify and streamline model creation between different users. This feature can be accessed through File�Save as Project Template.
FIGURE 1-28 Save as Project Template 1.2.15 Modify/Selection Toolbar
FIGURE 1-29 Modify Selection Toolbar
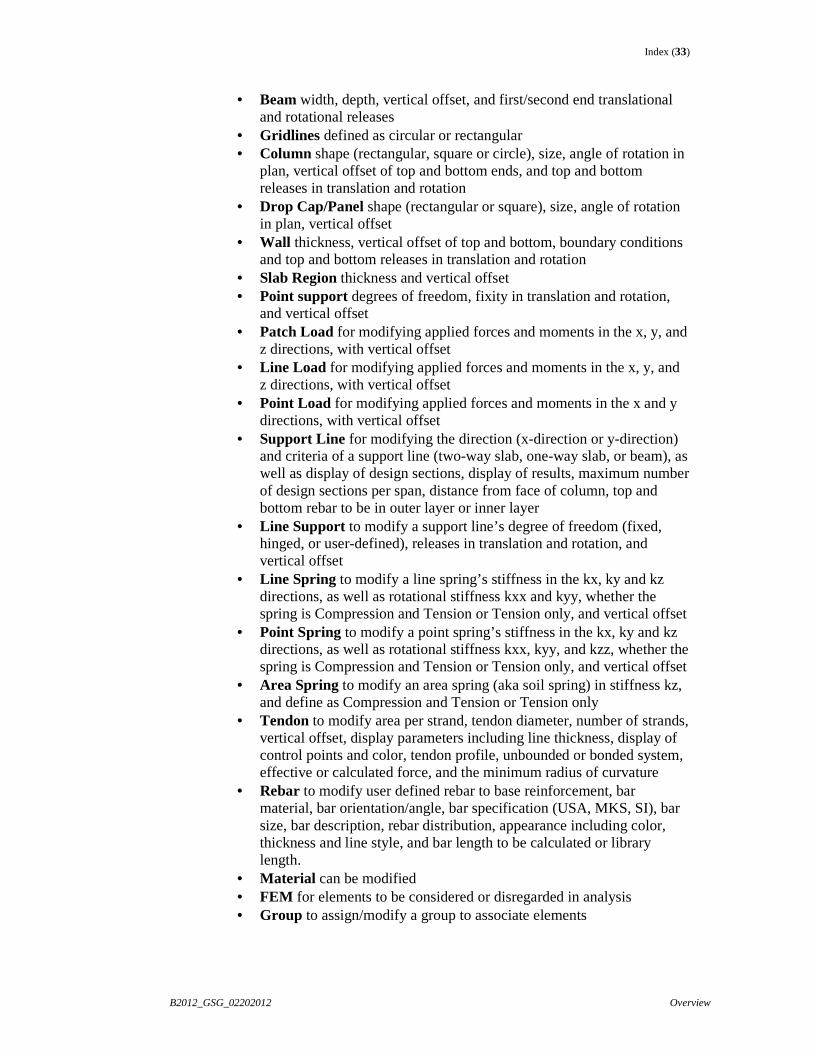
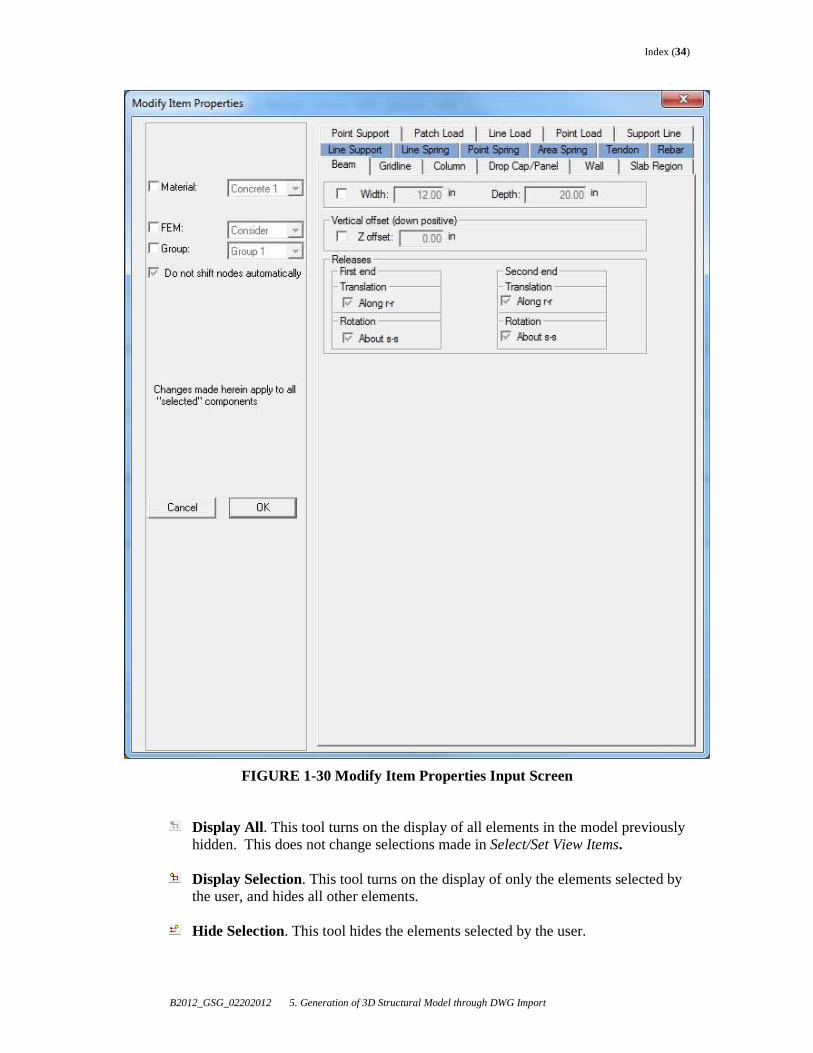
Modify Item Properties. Using this tool, the user can modify many properties of one or more structural elements. See FIGURE 1-30. This screen has some new features in the 2012 release. Columns can be defined with size and shape, rotation, top and bottom offsets, as well as translational and/or rotational releases at the top and bottom ends. Drop caps and panels sizing, rotation and offset can be defined. Wall thickness, vertical top and bottom offsets, boundary conditions, and releases can be defined. Slab Region thickness and vertical offset can be defined, as well as additional items as listed below.
Index (33)
B2012_GSG_02202012 Overview
• Beam width, depth, vertical offset, and first/second end translational and rotational releases
• Gridlines defined as circular or rectangular • Column shape (rectangular, square or circle), size, angle of rotation in
plan, vertical offset of top and bottom ends, and top and bottom releases in translation and rotation
• Drop Cap/Panel shape (rectangular or square), size, angle of rotation in plan, vertical offset
• Wall thickness, vertical offset of top and bottom, boundary conditions and top and bottom releases in translation and rotation
• Slab Region thickness and vertical offset • Point support degrees of freedom, fixity in translation and rotation,
and vertical offset • Patch Load for modifying applied forces and moments in the x, y, and
z directions, with vertical offset • Line Load for modifying applied forces and moments in the x, y, and
z directions, with vertical offset • Point Load for modifying applied forces and moments in the x and y
directions, with vertical offset • Support Line for modifying the direction (x-direction or y-direction)
and criteria of a support line (two-way slab, one-way slab, or beam), as well as display of design sections, display of results, maximum number of design sections per span, distance from face of column, top and bottom rebar to be in outer layer or inner layer
• Line Support to modify a support line’s degree of freedom (fixed, hinged, or user-defined), releases in translation and rotation, and vertical offset
• Line Spring to modify a line spring’s stiffness in the kx, ky and kz directions, as well as rotational stiffness kxx and kyy, whether the spring is Compression and Tension or Tension only, and vertical offset
• Point Spring to modify a point spring’s stiffness in the kx, ky and kz directions, as well as rotational stiffness kxx, kyy, and kzz, whether the spring is Compression and Tension or Tension only, and vertical offset
• Area Spring to modify an area spring (aka soil spring) in stiffness kz, and define as Compression and Tension or Tension only
• Tendon to modify area per strand, tendon diameter, number of strands, vertical offset, display parameters including line thickness, display of control points and color, tendon profile, unbounded or bonded system, effective or calculated force, and the minimum radius of curvature
• Rebar to modify user defined rebar to base reinforcement, bar material, bar orientation/angle, bar specification (USA, MKS, SI), bar size, bar description, rebar distribution, appearance including color, thickness and line style, and bar length to be calculated or library length.
• Material can be modified • FEM for elements to be considered or disregarded in analysis • Group to assign/modify a group to associate elements
Index (34)
B2012_GSG_02202012 5. Generation of 3D Structural Model through DWG Import
FIGURE 1-30 Modify Item Properties Input Screen
Display All. This tool turns on the display of all elements in the model previously hidden. This does not change selections made in Select/Set View Items.
Display Selection. This tool turns on the display of only the elements selected by
the user, and hides all other elements.
Hide Selection. This tool hides the elements selected by the user.
Index (35)
B2012_GSG_02202012 Overview
2 GENERATION OF 3D STRUCTURAL MODEL THROUGH DWG IMPOR T
The steps to follow for the generation of a 3D structural model of the floor system or multi-level building structure through import of a drawing file are detailed below. After the initial drawing has been transformed into a structural model, the steps to import a revised drawing are outlined.
2.1 FIRST DRAWING IMPORT At this step, the simplified structural or architectural drawing will be imported to the Builder program and converted to a structural model. Follow the steps below:
• Open ADAPT-Builder in Floor Pro and Edge mode with American unit system (as shown in FIGURE 1-1).
• From File pull-down menu select File� Import �DXF/DWG. • Open the desired file. Note the file cannot be open at the same time you try to
import it. Be sure to save the file down to a version compatible with ADAPT (Autocad 2007 or earlier)
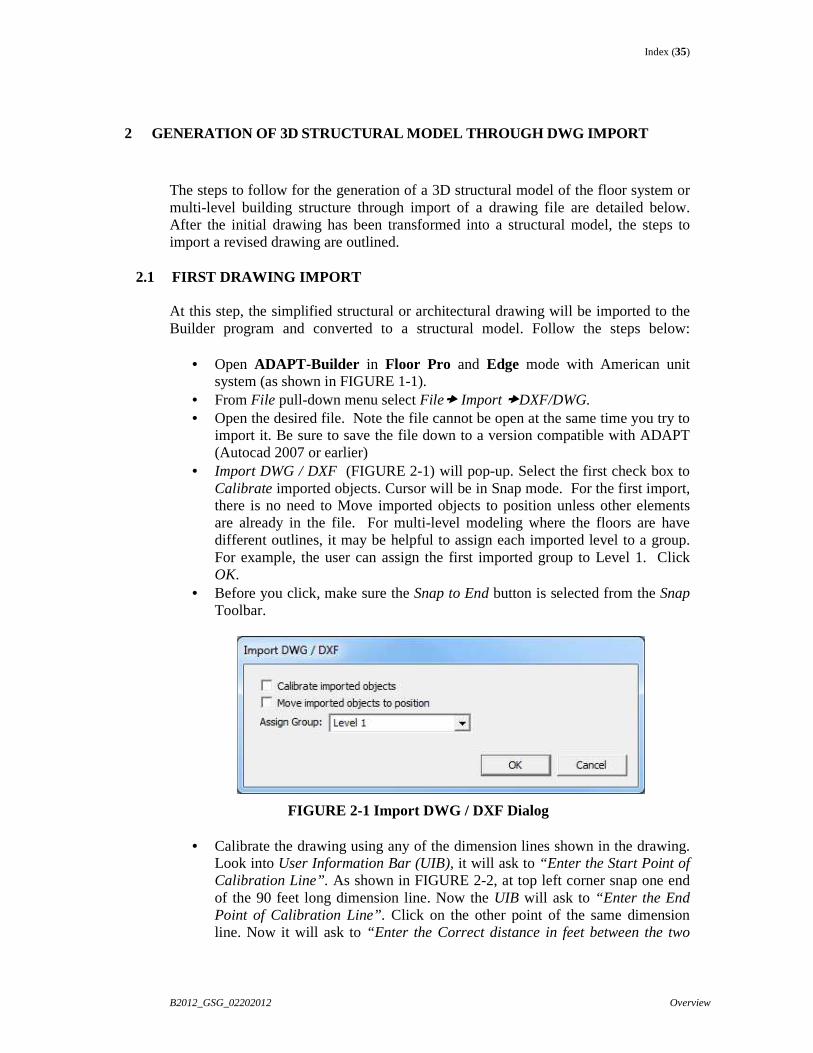
• Import DWG / DXF (FIGURE 2-1) will pop-up. Select the first check box to Calibrate imported objects. Cursor will be in Snap mode. For the first import, there is no need to Move imported objects to position unless other elements are already in the file. For multi-level modeling where the floors are have different outlines, it may be helpful to assign each imported level to a group. For example, the user can assign the first imported group to Level 1. Click OK.
• Before you click, make sure the Snap to End button is selected from the Snap Toolbar.
FIGURE 2-1 Import DWG / DXF Dialog
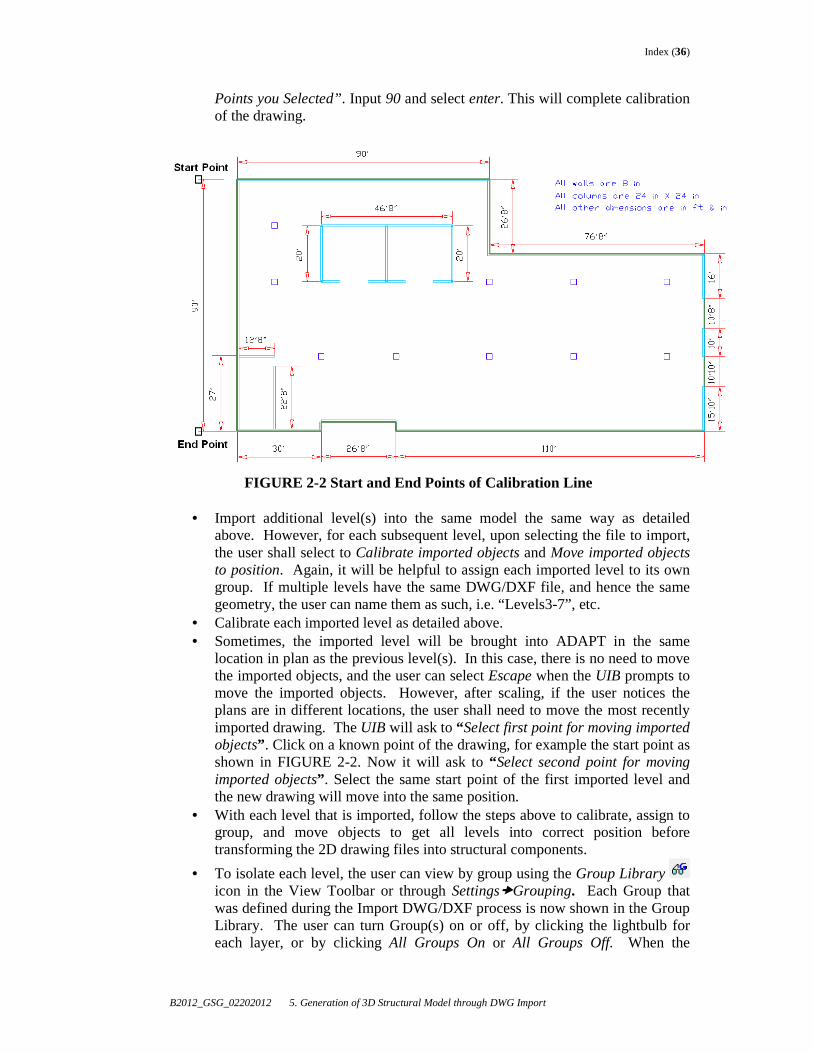
• Calibrate the drawing using any of the dimension lines shown in the drawing. Look into User Information Bar (UIB), it will ask to “Enter the Start Point of Calibration Line”. As shown in FIGURE 2-2, at top left corner snap one end of the 90 feet long dimension line. Now the UIB will ask to “Enter the End Point of Calibration Line”. Click on the other point of the same dimension line. Now it will ask to “Enter the Correct distance in feet between the two
Index (36)
B2012_GSG_02202012 5. Generation of 3D Structural Model through DWG Import
Points you Selected”. Input 90 and select enter. This will complete calibration of the drawing.
FIGURE 2-2 Start and End Points of Calibration Line
• Import additional level(s) into the same model the same way as detailed above. However, for each subsequent level, upon selecting the file to import, the user shall select to Calibrate imported objects and Move imported objects to position. Again, it will be helpful to assign each imported level to its own group. If multiple levels have the same DWG/DXF file, and hence the same geometry, the user can name them as such, i.e. “Levels3-7”, etc.
• Calibrate each imported level as detailed above. • Sometimes, the imported level will be brought into ADAPT in the same
location in plan as the previous level(s). In this case, there is no need to move the imported objects, and the user can select Escape when the UIB prompts to move the imported objects. However, after scaling, if the user notices the plans are in different locations, the user shall need to move the most recently imported drawing. The UIB will ask to “ Select first point for moving imported objects” . Click on a known point of the drawing, for example the start point as shown in FIGURE 2-2. Now it will ask to “ Select second point for moving imported objects” . Select the same start point of the first imported level and the new drawing will move into the same position.
• With each level that is imported, follow the steps above to calibrate, assign to group, and move objects to get all levels into correct position before transforming the 2D drawing files into structural components.
• To isolate each level, the user can view by group using the Group Library icon in the View Toolbar or through Settings�Grouping. Each Group that was defined during the Import DWG/DXF process is now shown in the Group Library. The user can turn Group(s) on or off, by clicking the lightbulb for each layer, or by clicking All Groups On or All Groups Off. When the
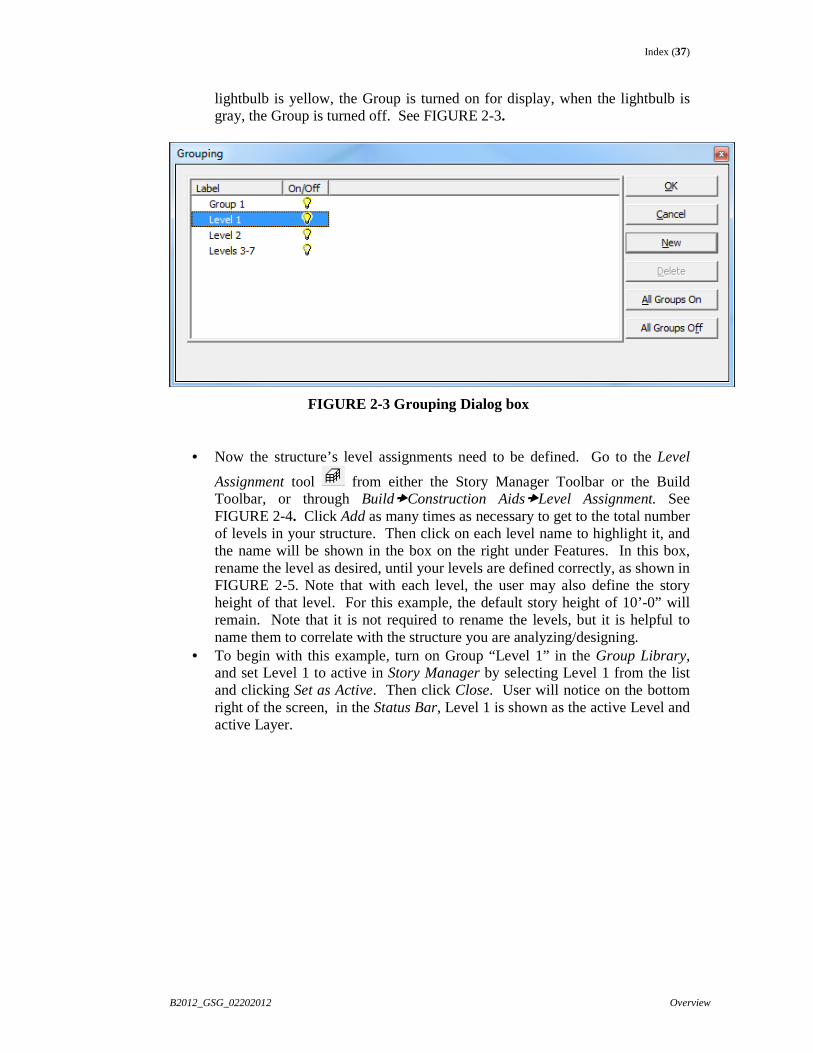
Index (37)
B2012_GSG_02202012 Overview
lightbulb is yellow, the Group is turned on for display, when the lightbulb is gray, the Group is turned off. See FIGURE 2-3.
FIGURE 2-3 Grouping Dialog box
• Now the structure’s level assignments need to be defined. Go to the Level
Assignment tool from either the Story Manager Toolbar or the Build Toolbar, or through Build�Construction Aids�Level Assignment. See FIGURE 2-4. Click Add as many times as necessary to get to the total number of levels in your structure. Then click on each level name to highlight it, and the name will be shown in the box on the right under Features. In this box, rename the level as desired, until your levels are defined correctly, as shown in FIGURE 2-5. Note that with each level, the user may also define the story height of that level. For this example, the default story height of 10’-0” will remain. Note that it is not required to rename the levels, but it is helpful to name them to correlate with the structure you are analyzing/designing.
• To begin with this example, turn on Group “Level 1” in the Group Library, and set Level 1 to active in Story Manager by selecting Level 1 from the list and clicking Set as Active. Then click Close. User will notice on the bottom right of the screen, in the Status Bar, Level 1 is shown as the active Level and active Layer.
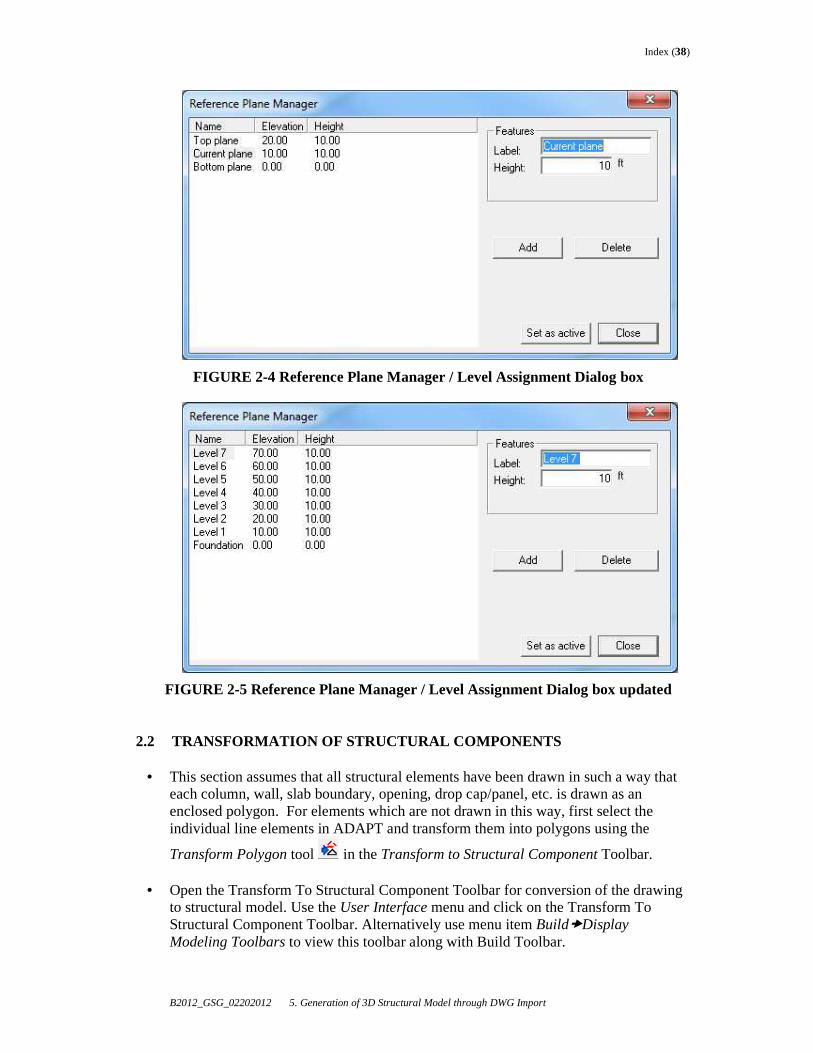
Index (38)
B2012_GSG_02202012 5. Generation of 3D Structural Model through DWG Import
FIGURE 2-4 Reference Plane Manager / Level Assignment Dialog box
FIGURE 2-5 Reference Plane Manager / Level Assignment Dialog box updated
2.2 TRANSFORMATION OF STRUCTURAL COMPONENTS
• This section assumes that all structural elements have been drawn in such a way that each column, wall, slab boundary, opening, drop cap/panel, etc. is drawn as an enclosed polygon. For elements which are not drawn in this way, first select the individual line elements in ADAPT and transform them into polygons using the
Transform Polygon tool in the Transform to Structural Component Toolbar.
• Open the Transform To Structural Component Toolbar for conversion of the drawing to structural model. Use the User Interface menu and click on the Transform To Structural Component Toolbar. Alternatively use menu item Build�Display Modeling Toolbars to view this toolbar along with Build Toolbar.
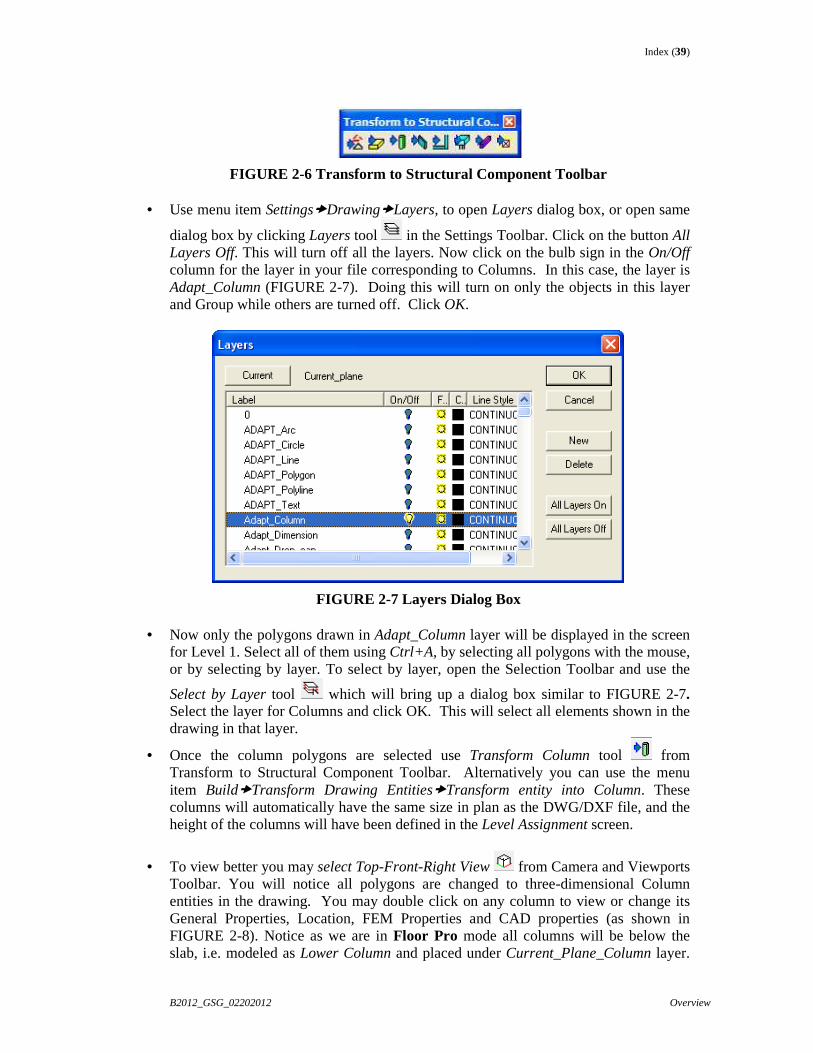
Index (39)
B2012_GSG_02202012 Overview
FIGURE 2-6 Transform to Structural Component Toolbar
• Use menu item Settings�Drawing�Layers, to open Layers dialog box, or open same
dialog box by clicking Layers tool in the Settings Toolbar. Click on the button All Layers Off. This will turn off all the layers. Now click on the bulb sign in the On/Off column for the layer in your file corresponding to Columns. In this case, the layer is Adapt_Column (FIGURE 2-7). Doing this will turn on only the objects in this layer and Group while others are turned off. Click OK.
FIGURE 2-7 Layers Dialog Box • Now only the polygons drawn in Adapt_Column layer will be displayed in the screen
for Level 1. Select all of them using Ctrl+A, by selecting all polygons with the mouse, or by selecting by layer. To select by layer, open the Selection Toolbar and use the
Select by Layer tool which will bring up a dialog box similar to FIGURE 2-7. Select the layer for Columns and click OK. This will select all elements shown in the drawing in that layer.
• Once the column polygons are selected use Transform Column tool from Transform to Structural Component Toolbar. Alternatively you can use the menu item Build�Transform Drawing Entities�Transform entity into Column. These columns will automatically have the same size in plan as the DWG/DXF file, and the height of the columns will have been defined in the Level Assignment screen.
• To view better you may select Top-Front-Right View from Camera and Viewports Toolbar. You will notice all polygons are changed to three-dimensional Column entities in the drawing. You may double click on any column to view or change its General Properties, Location, FEM Properties and CAD properties (as shown in FIGURE 2-8). Notice as we are in Floor Pro mode all columns will be below the slab, i.e. modeled as Lower Column and placed under Current_Plane_Column layer.
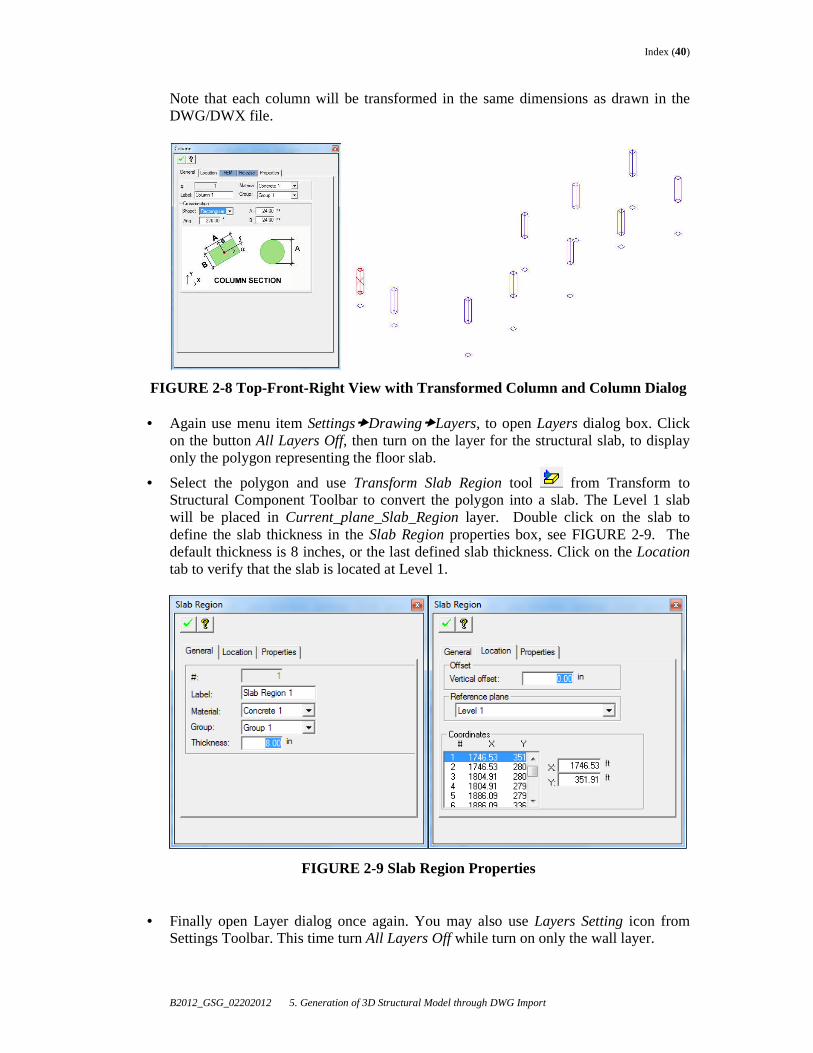
Index (40)
B2012_GSG_02202012 5. Generation of 3D Structural Model through DWG Import
Note that each column will be transformed in the same dimensions as drawn in the DWG/DWX file.
FIGURE 2-8 Top-Front-Right View with Transformed Column and Column Dialog
• Again use menu item Settings�Drawing�Layers, to open Layers dialog box. Click on the button All Layers Off, then turn on the layer for the structural slab, to display only the polygon representing the floor slab.
• Select the polygon and use Transform Slab Region tool from Transform to Structural Component Toolbar to convert the polygon into a slab. The Level 1 slab will be placed in Current_plane_Slab_Region layer. Double click on the slab to define the slab thickness in the Slab Region properties box, see FIGURE 2-9. The default thickness is 8 inches, or the last defined slab thickness. Click on the Location tab to verify that the slab is located at Level 1.
FIGURE 2-9 Slab Region Properties
• Finally open Layer dialog once again. You may also use Layers Setting icon from
Settings Toolbar. This time turn All Layers Off while turn on only the wall layer.
Index (41)
B2012_GSG_02202012 Overview
• Select all the polygons (representing walls) and use Transform Wall tool from Transform to Structural Component Toolbar to convert all polygons as walls. If walls are drawn in a way that they are combined walls drawn together, rather than
individual walls, you may use the Transform into Several Walls tool . All walls will be Lower Walls and will be placed under Current_plane_Wall layer.
• The user may transform Drop Caps/Panels, Beams, and Openings in the same manner
as described above, using the Transform Drop Cap/Panel tool , Transform Beam
tool icon, and the Transform Opening tool icon from the Transform to Structural Component Toolbar. For Drop Caps/Panels, be sure to define the thickness of the Cap in the Item Properties box. For beams, be sure to note where the end point of the beam falls. A sound modeling approach would be to model beams from support centroid to support centroid (i.e. column to column, or girder to girder, etc) to ensure connectivity. Often, beams are drawn from faces of supports in DWG/DXF files. In this case, click on the beam and, using the mouse, drag the end point/s of the beam to the center of its supporting member. This ensures that the beam ends will fall onto a support line, and that the beam will be correctly considered in the analysis/design. Support lines are covered later in this guide.
• To move up the building, the user can repeat the process of displaying the next Group Level and setting the next level up to be Active, and continuing through the steps outlined above.
• For Columns and Walls or other elements that the user knows are continuous up the building, an alternative which may be faster, is to select the elements that continue up, either individually using the mouse while depressing the ‘control’ key, or by selecting
by type. To select by type, click the Select by Type tool in the Selection Toolbar. Click on appropriate elements for your model and click OK. See FIGURE 2-10. This will highlight all columns and walls in the model. Select the Copy/Move Vertical tool in the Story Manager Toolbar as described in Section 1.2.13. Copy the elements up the appropriate number of times, or assign to a particular level.
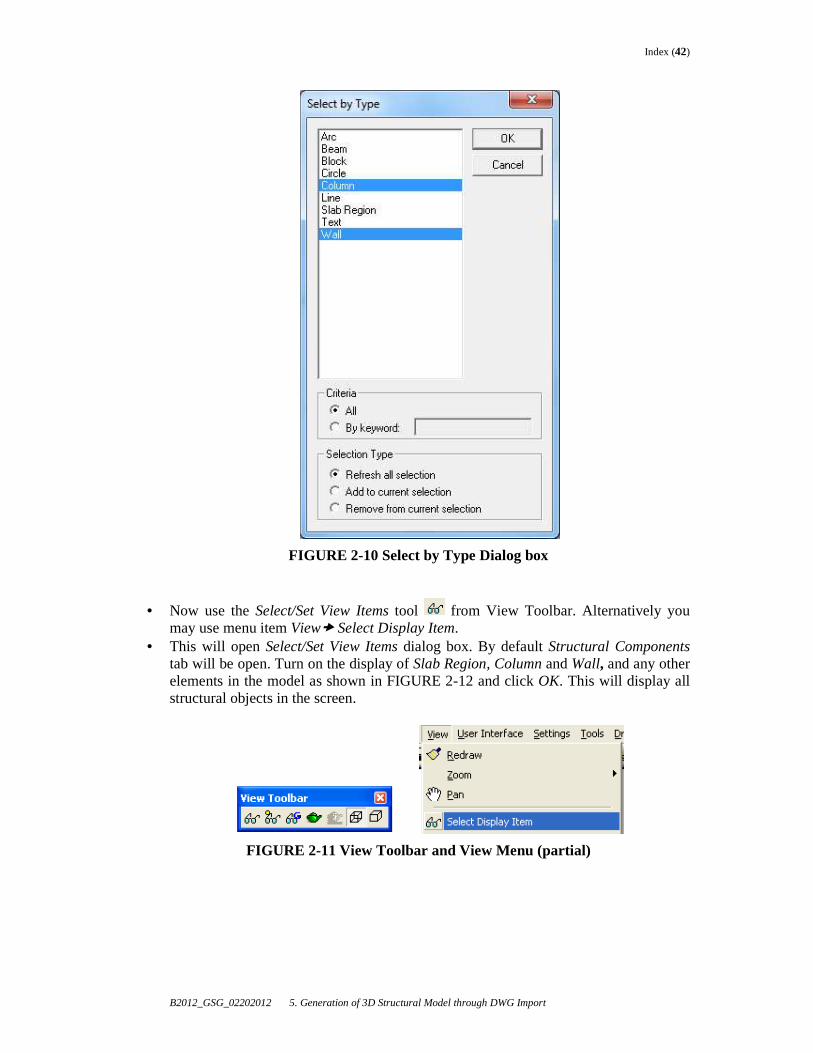
Index (42)
B2012_GSG_02202012 5. Generation of 3D Structural Model through DWG Import
FIGURE 2-10 Select by Type Dialog box
• Now use the Select/Set View Items tool from View Toolbar. Alternatively you may use menu item View� Select Display Item.
• This will open Select/Set View Items dialog box. By default Structural Components tab will be open. Turn on the display of Slab Region, Column and Wall, and any other elements in the model as shown in FIGURE 2-12 and click OK. This will display all structural objects in the screen.
FIGURE 2-11 View Toolbar and View Menu (partial)
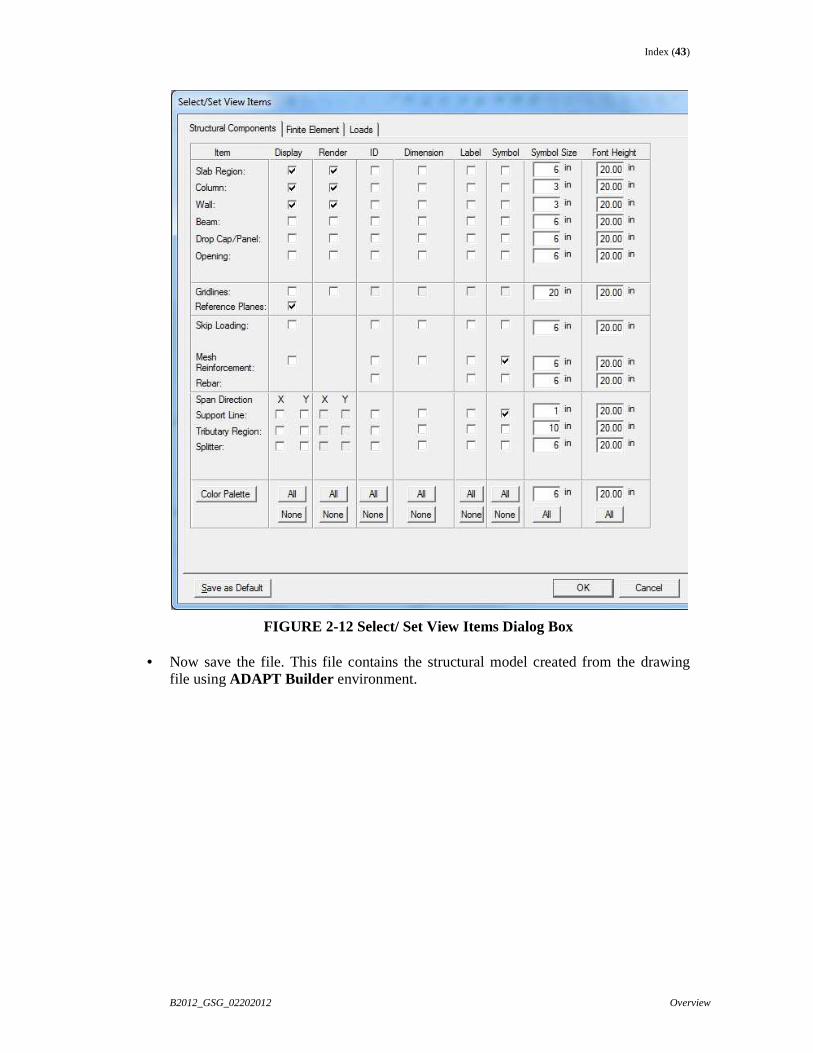
Index (43)
B2012_GSG_02202012 Overview
FIGURE 2-12 Select/ Set View Items Dialog Box
• Now save the file. This file contains the structural model created from the drawing file using ADAPT Builder environment.
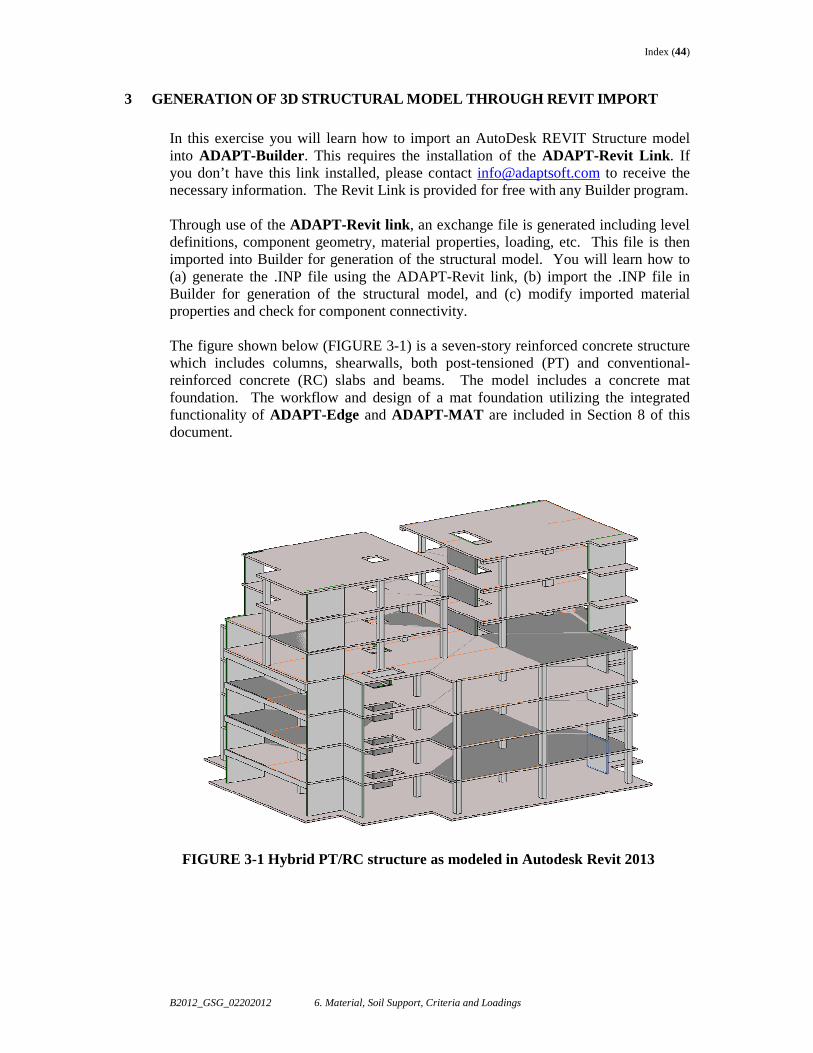
Index (44)
B2012_GSG_02202012 6. Material, Soil Support, Criteria and Loadings
3 GENERATION OF 3D STRUCTURAL MODEL THROUGH REVIT IMP ORT
In this exercise you will learn how to import an AutoDesk REVIT Structure model into ADAPT-Builder . This requires the installation of the ADAPT-Revit Link . If you don’t have this link installed, please contact [email protected] to receive the necessary information. The Revit Link is provided for free with any Builder program. Through use of the ADAPT-Revit link , an exchange file is generated including level definitions, component geometry, material properties, loading, etc. This file is then imported into Builder for generation of the structural model. You will learn how to (a) generate the .INP file using the ADAPT-Revit link, (b) import the .INP file in Builder for generation of the structural model, and (c) modify imported material properties and check for component connectivity. The figure shown below (FIGURE 3-1) is a seven-story reinforced concrete structure which includes columns, shearwalls, both post-tensioned (PT) and conventional-reinforced concrete (RC) slabs and beams. The model includes a concrete mat foundation. The workflow and design of a mat foundation utilizing the integrated functionality of ADAPT-Edge and ADAPT-MAT are included in Section 8 of this document.
FIGURE 3-1 Hybrid PT/RC structure as modeled in Autodesk Revit 2013
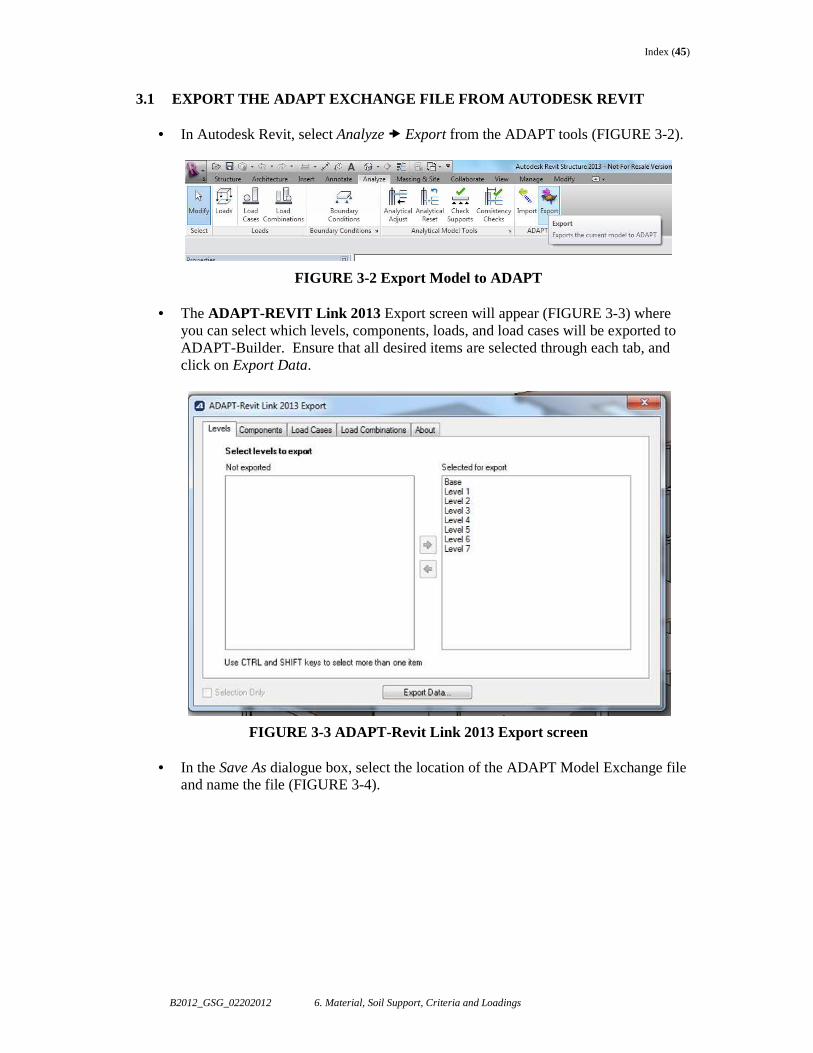
Index (45)
B2012_GSG_02202012 6. Material, Soil Support, Criteria and Loadings
3.1 EXPORT THE ADAPT EXCHANGE FILE FROM AUTODESK REVIT
• In Autodesk Revit, select Analyze � Export from the ADAPT tools (FIGURE 3-2).
FIGURE 3-2 Export Model to ADAPT
• The ADAPT-REVIT Link 2013 Export screen will appear (FIGURE 3-3) where you can select which levels, components, loads, and load cases will be exported to ADAPT-Builder. Ensure that all desired items are selected through each tab, and click on Export Data.
FIGURE 3-3 ADAPT-Revit Link 2013 Export screen
• In the Save As dialogue box, select the location of the ADAPT Model Exchange file and name the file (FIGURE 3-4).
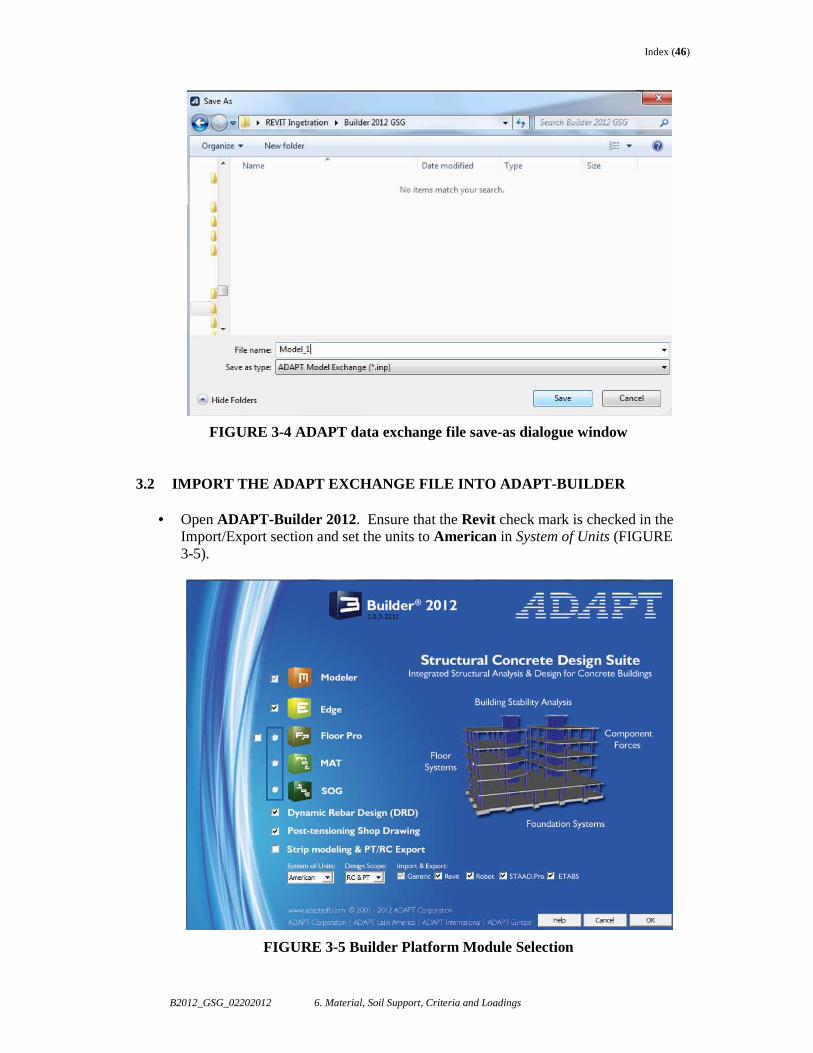
Index (46)
B2012_GSG_02202012 6. Material, Soil Support, Criteria and Loadings
FIGURE 3-4 ADAPT data exchange file save-as dialogue window
3.2 IMPORT THE ADAPT EXCHANGE FILE INTO ADAPT-BUILDER
• Open ADAPT-Builder 2012. Ensure that the Revit check mark is checked in the Import/Export section and set the units to American in System of Units (FIGURE 3-5).
FIGURE 3-5 Builder Platform Module Selection
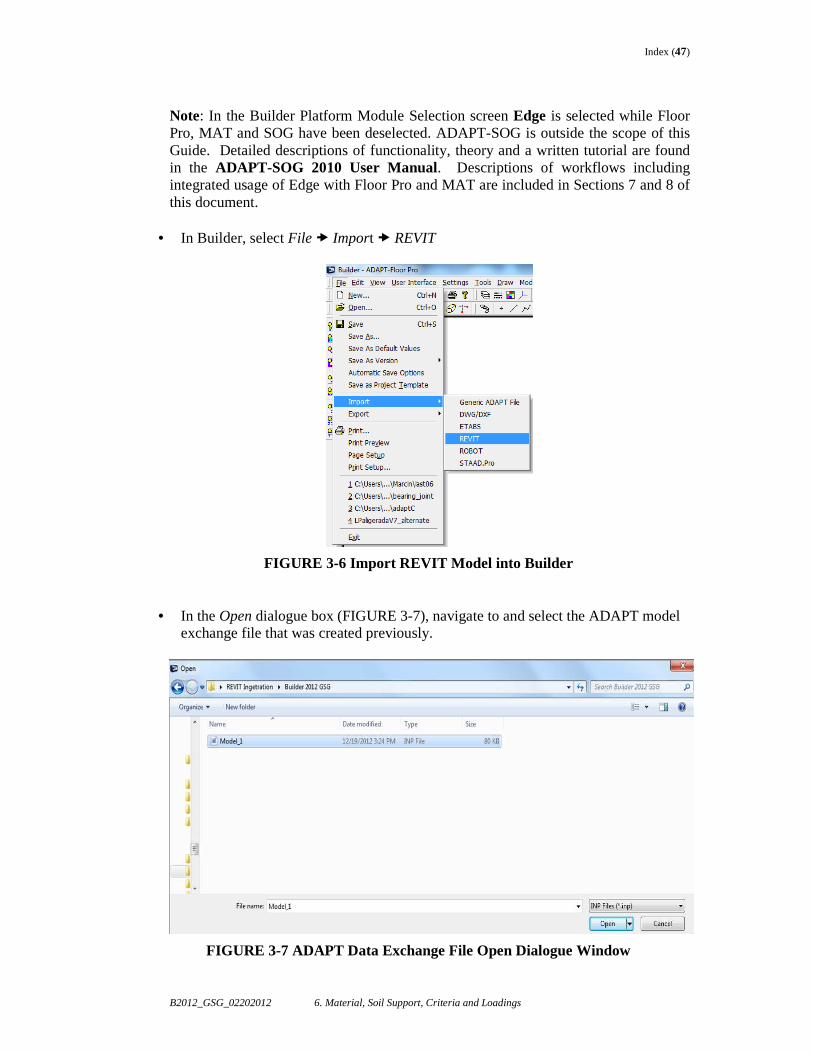
Index (47)
B2012_GSG_02202012 6. Material, Soil Support, Criteria and Loadings
Note: In the Builder Platform Module Selection screen Edge is selected while Floor Pro, MAT and SOG have been deselected. ADAPT-SOG is outside the scope of this Guide. Detailed descriptions of functionality, theory and a written tutorial are found in the ADAPT-SOG 2010 User Manual. Descriptions of workflows including integrated usage of Edge with Floor Pro and MAT are included in Sections 7 and 8 of this document.
• In Builder, select File � Import � REVIT
FIGURE 3-6 Import REVIT Model into Builder
• In the Open dialogue box (FIGURE 3-7), navigate to and select the ADAPT model
exchange file that was created previously.
FIGURE 3-7 ADAPT Data Exchange File Open Dialogue Window
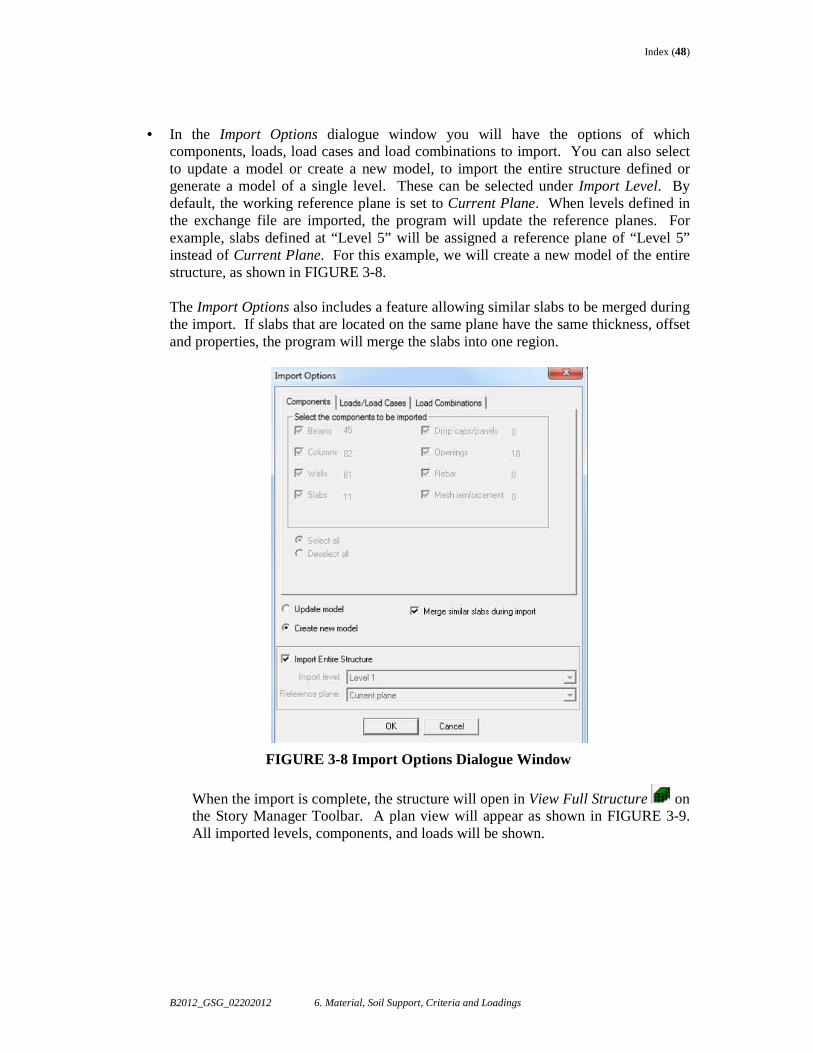
Index (48)
B2012_GSG_02202012 6. Material, Soil Support, Criteria and Loadings
• In the Import Options dialogue window you will have the options of which components, loads, load cases and load combinations to import. You can also select to update a model or create a new model, to import the entire structure defined or generate a model of a single level. These can be selected under Import Level. By default, the working reference plane is set to Current Plane. When levels defined in the exchange file are imported, the program will update the reference planes. For example, slabs defined at “Level 5” will be assigned a reference plane of “Level 5” instead of Current Plane. For this example, we will create a new model of the entire structure, as shown in FIGURE 3-8. The Import Options also includes a feature allowing similar slabs to be merged during the import. If slabs that are located on the same plane have the same thickness, offset and properties, the program will merge the slabs into one region.
FIGURE 3-8 Import Options Dialogue Window
When the import is complete, the structure will open in View Full Structure on the Story Manager Toolbar. A plan view will appear as shown in FIGURE 3-9. All imported levels, components, and loads will be shown.
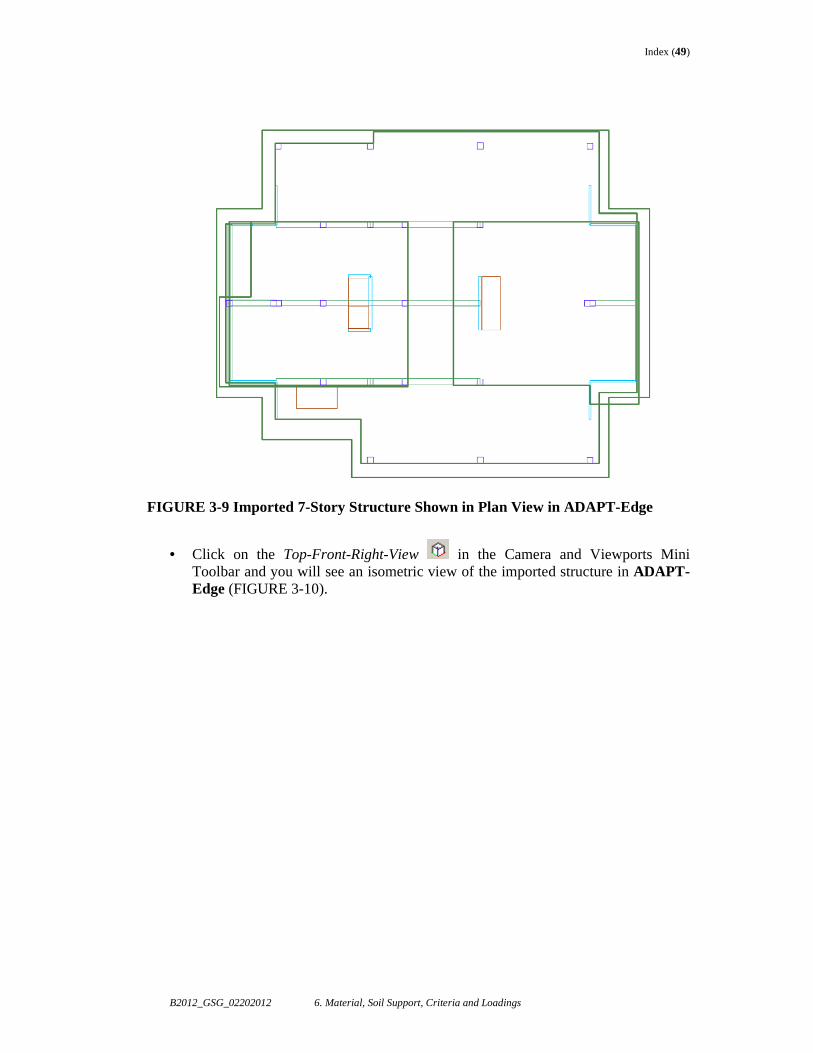
Index (49)
B2012_GSG_02202012 6. Material, Soil Support, Criteria and Loadings
FIGURE 3-9 Imported 7-Story Structure Shown in Plan View in ADAPT-Edge
• Click on the Top-Front-Right-View in the Camera and Viewports Mini Toolbar and you will see an isometric view of the imported structure in ADAPT-Edge (FIGURE 3-10).
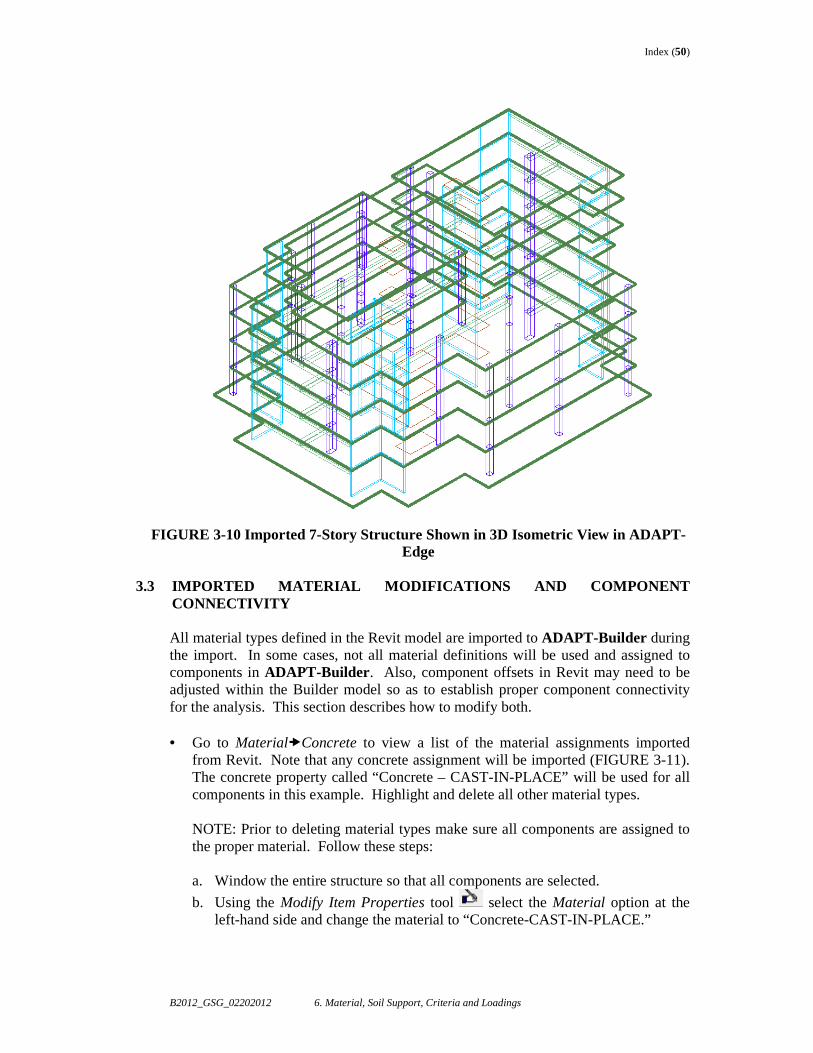
Index (50)
B2012_GSG_02202012 6. Material, Soil Support, Criteria and Loadings
FIGURE 3-10 Imported 7-Story Structure Shown in 3D Isometric View in ADAPT-Edge
3.3 IMPORTED MATERIAL MODIFICATIONS AND COMPONENT
CONNECTIVITY All material types defined in the Revit model are imported to ADAPT-Builder during the import. In some cases, not all material definitions will be used and assigned to components in ADAPT-Builder . Also, component offsets in Revit may need to be adjusted within the Builder model so as to establish proper component connectivity for the analysis. This section describes how to modify both. • Go to Material�Concrete to view a list of the material assignments imported
from Revit. Note that any concrete assignment will be imported (FIGURE 3-11). The concrete property called “Concrete – CAST-IN-PLACE” will be used for all components in this example. Highlight and delete all other material types.
NOTE: Prior to deleting material types make sure all components are assigned to the proper material. Follow these steps: a. Window the entire structure so that all components are selected.
b. Using the Modify Item Properties tool select the Material option at the left-hand side and change the material to “Concrete-CAST-IN-PLACE.”
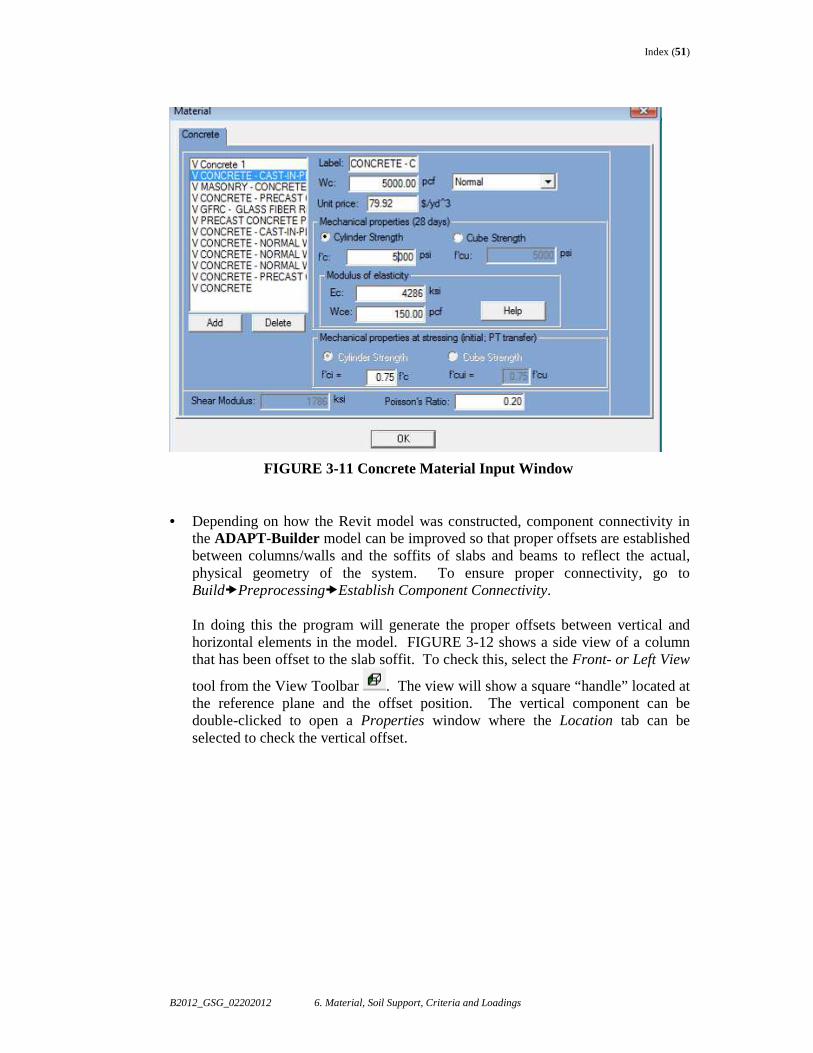
Index (51)
B2012_GSG_02202012 6. Material, Soil Support, Criteria and Loadings
FIGURE 3-11 Concrete Material Input Window
• Depending on how the Revit model was constructed, component connectivity in
the ADAPT-Builder model can be improved so that proper offsets are established between columns/walls and the soffits of slabs and beams to reflect the actual, physical geometry of the system. To ensure proper connectivity, go to Build�Preprocessing�Establish Component Connectivity. In doing this the program will generate the proper offsets between vertical and horizontal elements in the model. FIGURE 3-12 shows a side view of a column that has been offset to the slab soffit. To check this, select the Front- or Left View
tool from the View Toolbar . The view will show a square “handle” located at the reference plane and the offset position. The vertical component can be double-clicked to open a Properties window where the Location tab can be selected to check the vertical offset.
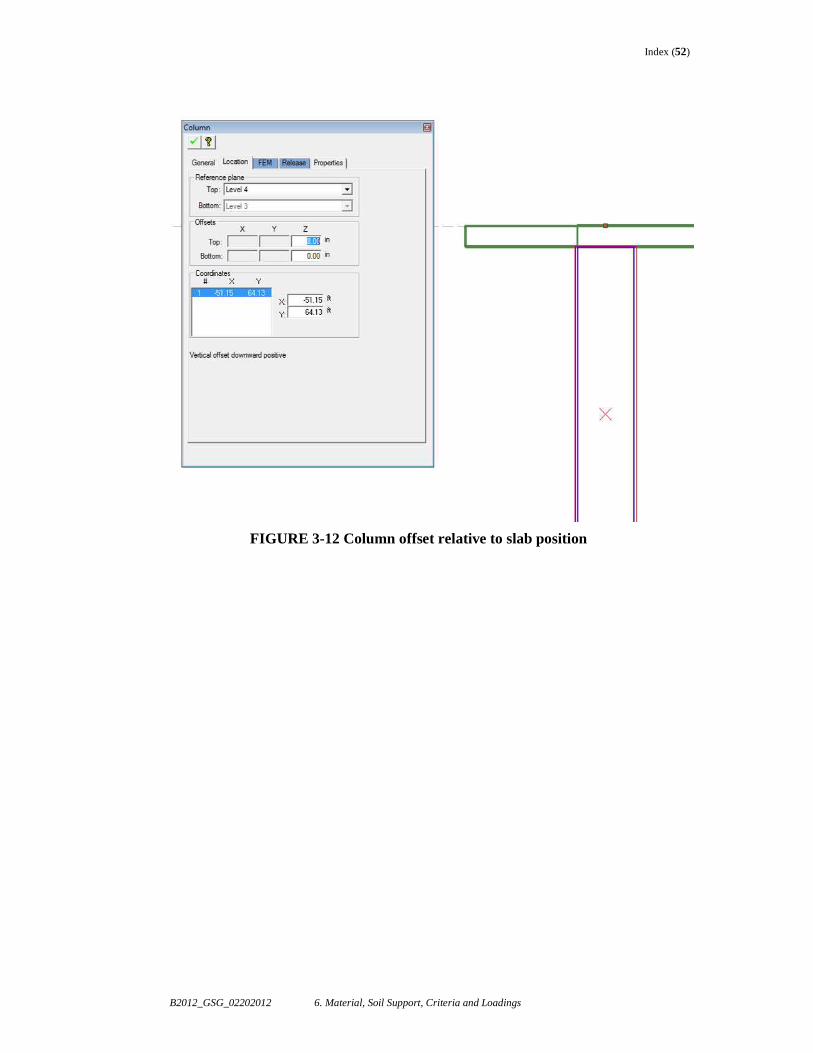
Index (52)
B2012_GSG_02202012 6. Material, Soil Support, Criteria and Loadings
FIGURE 3-12 Column offset relative to slab position
Index (53)
B2012_GSG_02202012 6. Material, Soil Support, Criteria and Loadings
4 GENERATION OF 3D STRUCTURAL MODEL USING OF ADAPT-BU ILDER MODELING TOOLS
In the previous chapters, we learned how to import a Revit model and convert this into an ADAPT-Builder model, represented by physical, object-oriented 3D components, as well as transforming a 2D CAD (DWG/DXF) file into a 3D ADAPT model. While this may lead to the most efficient and expedient method for generating your structural model, the user will typically find that some revisions or modifications must be made to the model which require the use of the modeling tools included within ADAPT-Builder . The use and functionality of the tools that will be described in this chapter also apply to the scenario where a model would be created entirely within the Builder interface without use of a Revit model or CAD drawing. Not all of the modeling tools associated with the software will be used and/or described in this chapter. It is strongly encouraged for the user to familiarize themselves with the entire set of modeling tools associated with the software. Several of these tools are described in Chapter 1 of this document. The user can also consult the ADAPT-Modeler 2012 User Manual as a separate reference. In this exercise, you will learn how to model or modify various structural components in the existing 7-story structure. These include:
o Adding multiple levels to the existing structure o Modeling tendons o Copying and assigning columns, walls, beams and slabs to new levels o Modifying existing slab regions and how to generate nested slab regions (i.e.
slabs of different thicknesses/stepped slabs) o Modifying existing beam sizes and properties o Regeneration of component offsets/connectivity
4.1 MANUAL ADDITION OF LEVELS TO AN EXISTING MODEL
The Level Assignment tool is used to create and edit level heights and labels in the program’s Reference Plane Manager. This tool can also be found on the Build Toolbar or from the BUILD menu. When a new model is created, the default story height is 10 ft (3 m) and the program generates top plane, current plane and bottom plane. When a model is imported from Revit, the program defaults are overwritten by the defined story heights and names from the Revit model. The example model contains 7 levels with varying story heights as shown in FIGURE 4-1. Three additional levels will be added to the existing level assignments by using the steps listed below.
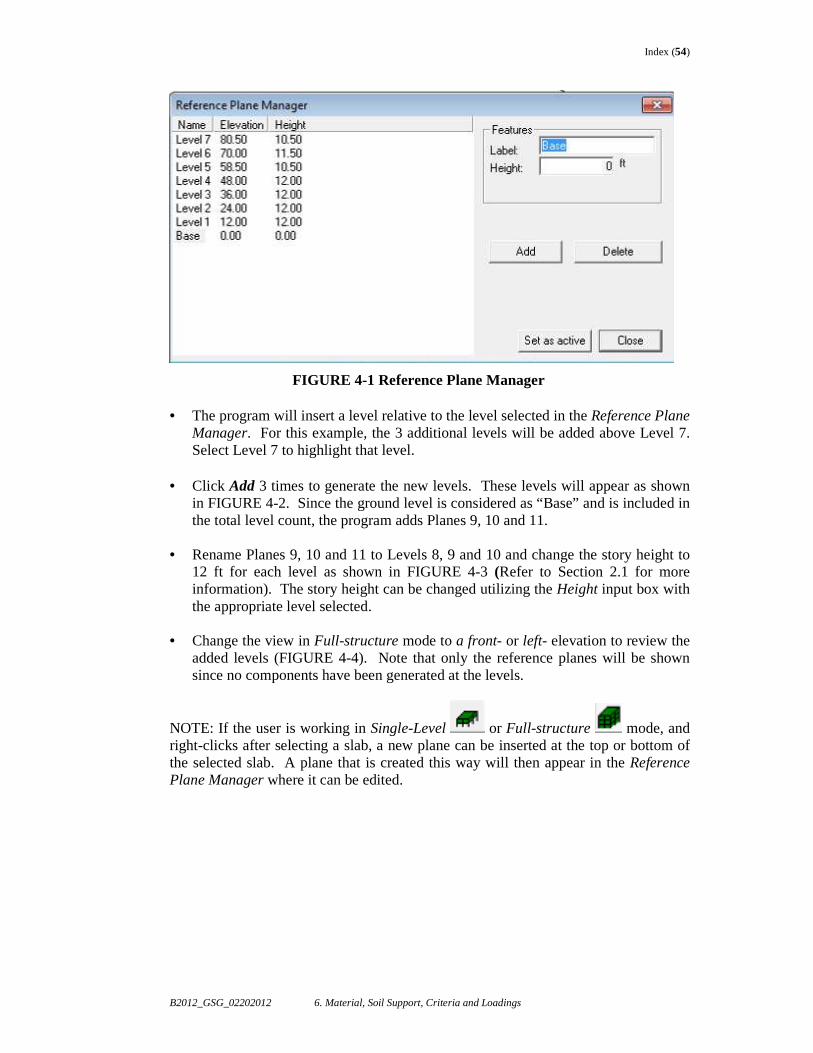
Index (54)
B2012_GSG_02202012 6. Material, Soil Support, Criteria and Loadings
FIGURE 4-1 Reference Plane Manager • The program will insert a level relative to the level selected in the Reference Plane
Manager. For this example, the 3 additional levels will be added above Level 7. Select Level 7 to highlight that level.
• Click Add 3 times to generate the new levels. These levels will appear as shown in FIGURE 4-2. Since the ground level is considered as “Base” and is included in the total level count, the program adds Planes 9, 10 and 11.
• Rename Planes 9, 10 and 11 to Levels 8, 9 and 10 and change the story height to
12 ft for each level as shown in FIGURE 4-3 (Refer to Section 2.1 for more information). The story height can be changed utilizing the Height input box with the appropriate level selected.
• Change the view in Full-structure mode to a front- or left- elevation to review the
added levels (FIGURE 4-4). Note that only the reference planes will be shown since no components have been generated at the levels.
NOTE: If the user is working in Single-Level or Full-structure mode, and right-clicks after selecting a slab, a new plane can be inserted at the top or bottom of the selected slab. A plane that is created this way will then appear in the Reference Plane Manager where it can be edited.
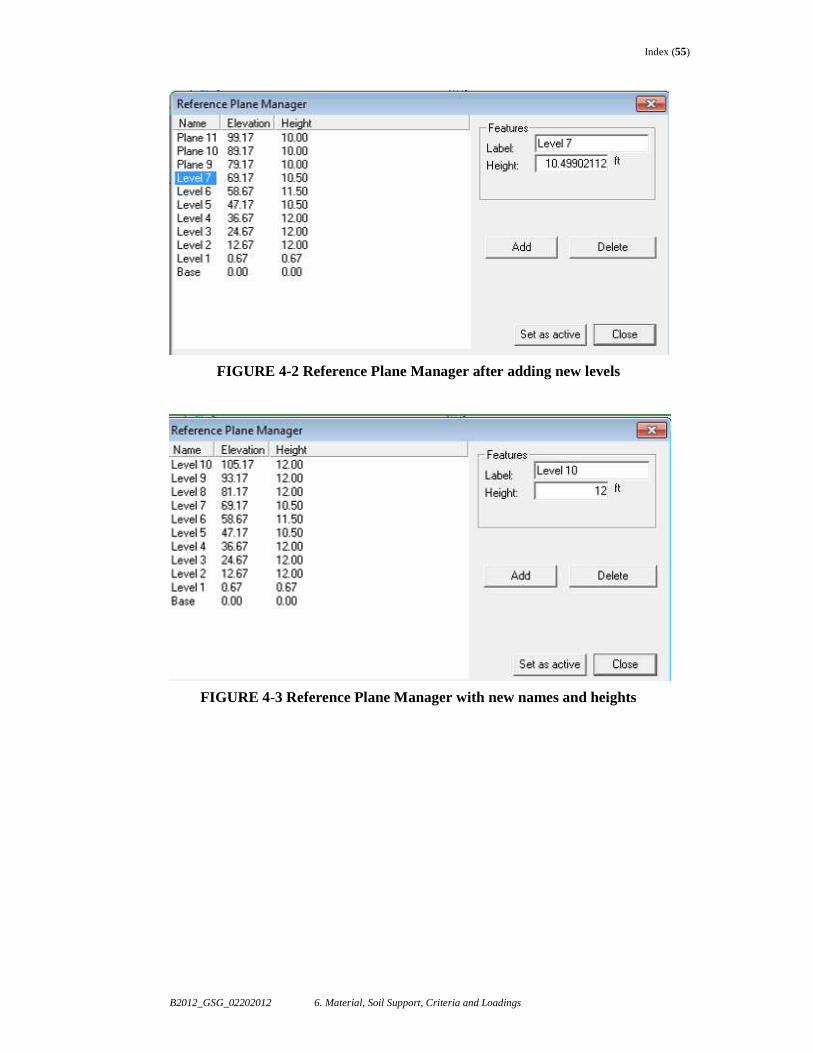
Index (55)
B2012_GSG_02202012 6. Material, Soil Support, Criteria and Loadings
FIGURE 4-2 Reference Plane Manager after adding new levels
FIGURE 4-3 Reference Plane Manager with new names and heights
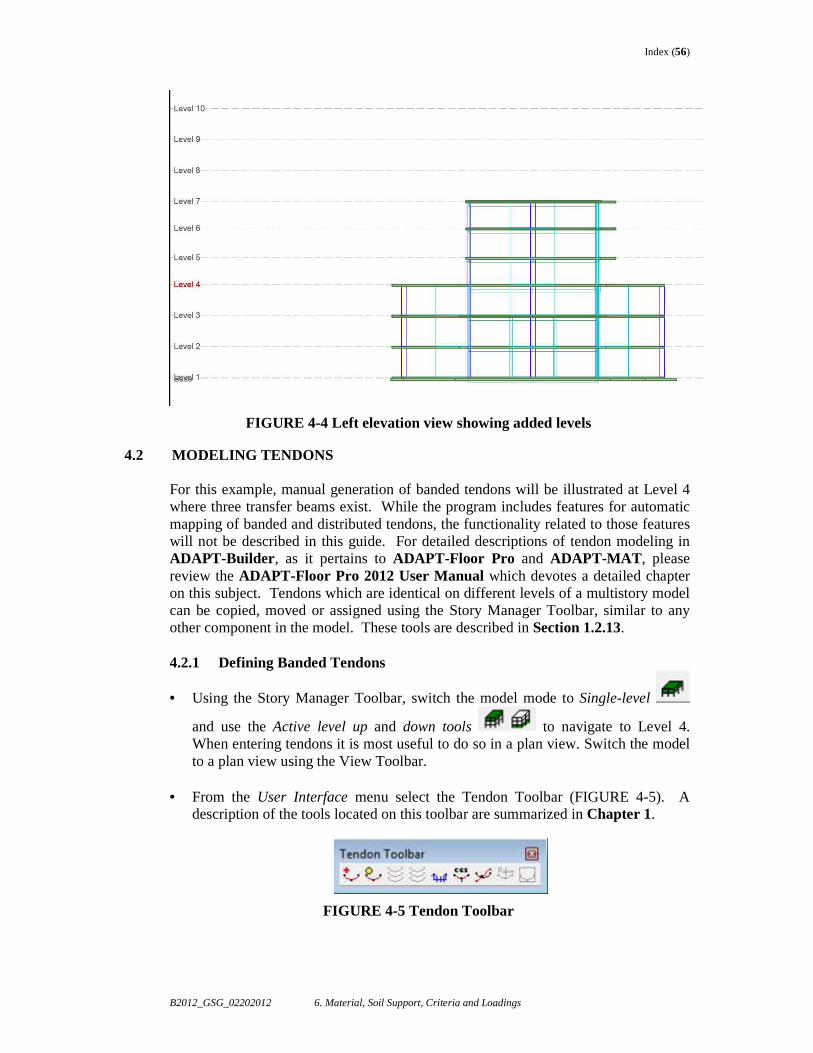
Index (56)
B2012_GSG_02202012 6. Material, Soil Support, Criteria and Loadings
FIGURE 4-4 Left elevation view showing added levels
4.2 MODELING TENDONS For this example, manual generation of banded tendons will be illustrated at Level 4 where three transfer beams exist. While the program includes features for automatic mapping of banded and distributed tendons, the functionality related to those features will not be described in this guide. For detailed descriptions of tendon modeling in ADAPT-Builder , as it pertains to ADAPT-Floor Pro and ADAPT-MAT , please review the ADAPT-Floor Pro 2012 User Manual which devotes a detailed chapter on this subject. Tendons which are identical on different levels of a multistory model can be copied, moved or assigned using the Story Manager Toolbar, similar to any other component in the model. These tools are described in Section 1.2.13. 4.2.1 Defining Banded Tendons
• Using the Story Manager Toolbar, switch the model mode to Single-level
and use the Active level up and down tools to navigate to Level 4. When entering tendons it is most useful to do so in a plan view. Switch the model to a plan view using the View Toolbar.
• From the User Interface menu select the Tendon Toolbar (FIGURE 4-5). A description of the tools located on this toolbar are summarized in Chapter 1.
FIGURE 4-5 Tendon Toolbar
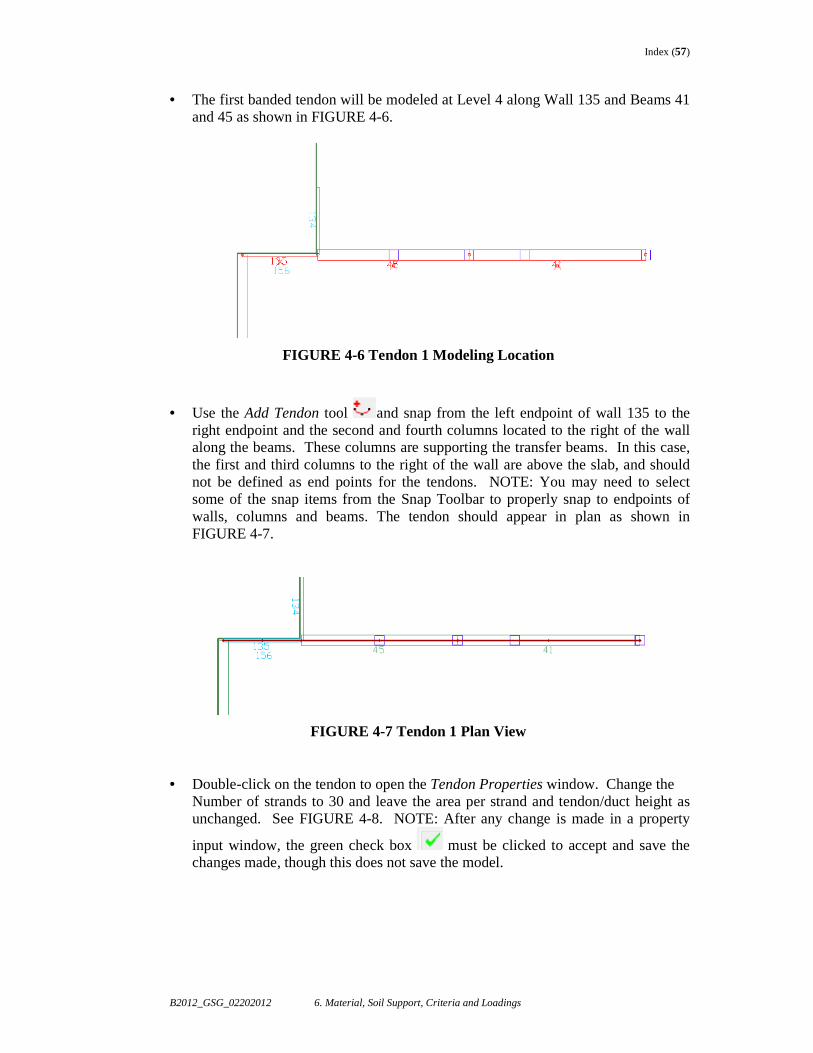
Index (57)
B2012_GSG_02202012 6. Material, Soil Support, Criteria and Loadings
• The first banded tendon will be modeled at Level 4 along Wall 135 and Beams 41 and 45 as shown in FIGURE 4-6.
FIGURE 4-6 Tendon 1 Modeling Location
• Use the Add Tendon tool and snap from the left endpoint of wall 135 to the right endpoint and the second and fourth columns located to the right of the wall along the beams. These columns are supporting the transfer beams. In this case, the first and third columns to the right of the wall are above the slab, and should not be defined as end points for the tendons. NOTE: You may need to select some of the snap items from the Snap Toolbar to properly snap to endpoints of walls, columns and beams. The tendon should appear in plan as shown in FIGURE 4-7.
FIGURE 4-7 Tendon 1 Plan View • Double-click on the tendon to open the Tendon Properties window. Change the
Number of strands to 30 and leave the area per strand and tendon/duct height as unchanged. See FIGURE 4-8. NOTE: After any change is made in a property
input window, the green check box must be clicked to accept and save the changes made, though this does not save the model.
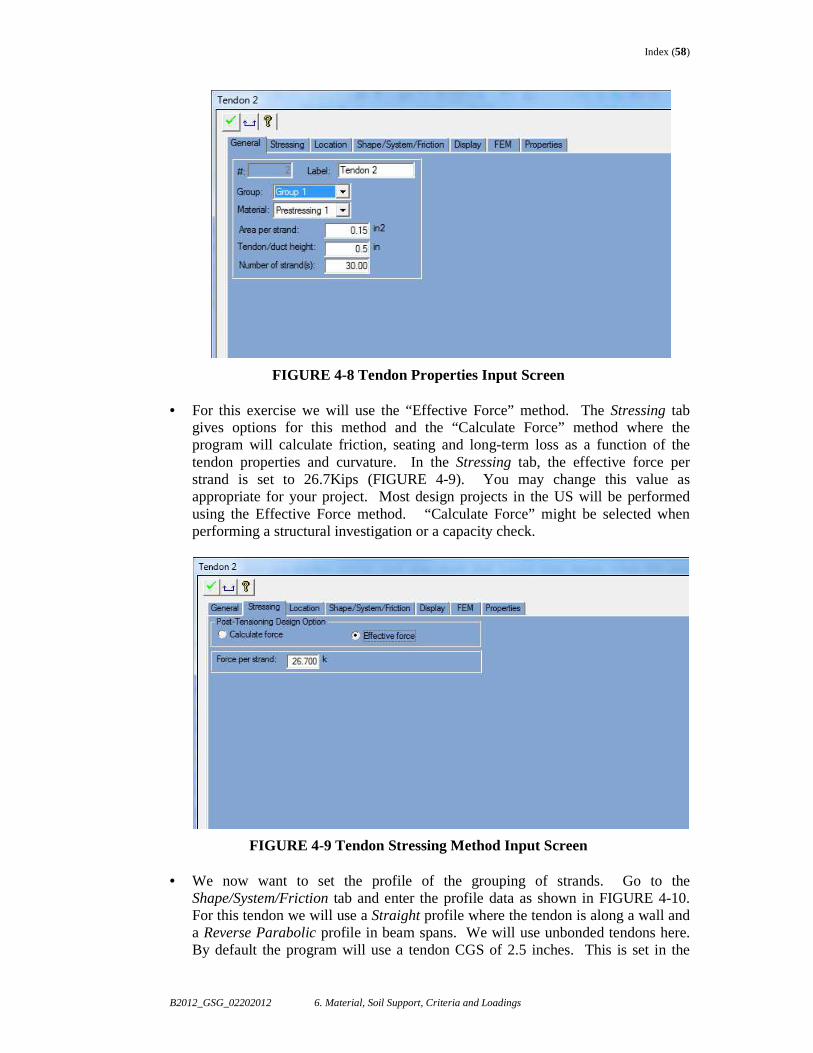
Index (58)
B2012_GSG_02202012 6. Material, Soil Support, Criteria and Loadings
FIGURE 4-8 Tendon Properties Input Screen
• For this exercise we will use the “Effective Force” method. The Stressing tab gives options for this method and the “Calculate Force” method where the program will calculate friction, seating and long-term loss as a function of the tendon properties and curvature. In the Stressing tab, the effective force per strand is set to 26.7Kips (FIGURE 4-9). You may change this value as appropriate for your project. Most design projects in the US will be performed using the Effective Force method. “Calculate Force” might be selected when performing a structural investigation or a capacity check.
FIGURE 4-9 Tendon Stressing Method Input Screen
• We now want to set the profile of the grouping of strands. Go to the Shape/System/Friction tab and enter the profile data as shown in FIGURE 4-10. For this tendon we will use a Straight profile where the tendon is along a wall and a Reverse Parabolic profile in beam spans. We will use unbonded tendons here. By default the program will use a tendon CGS of 2.5 inches. This is set in the
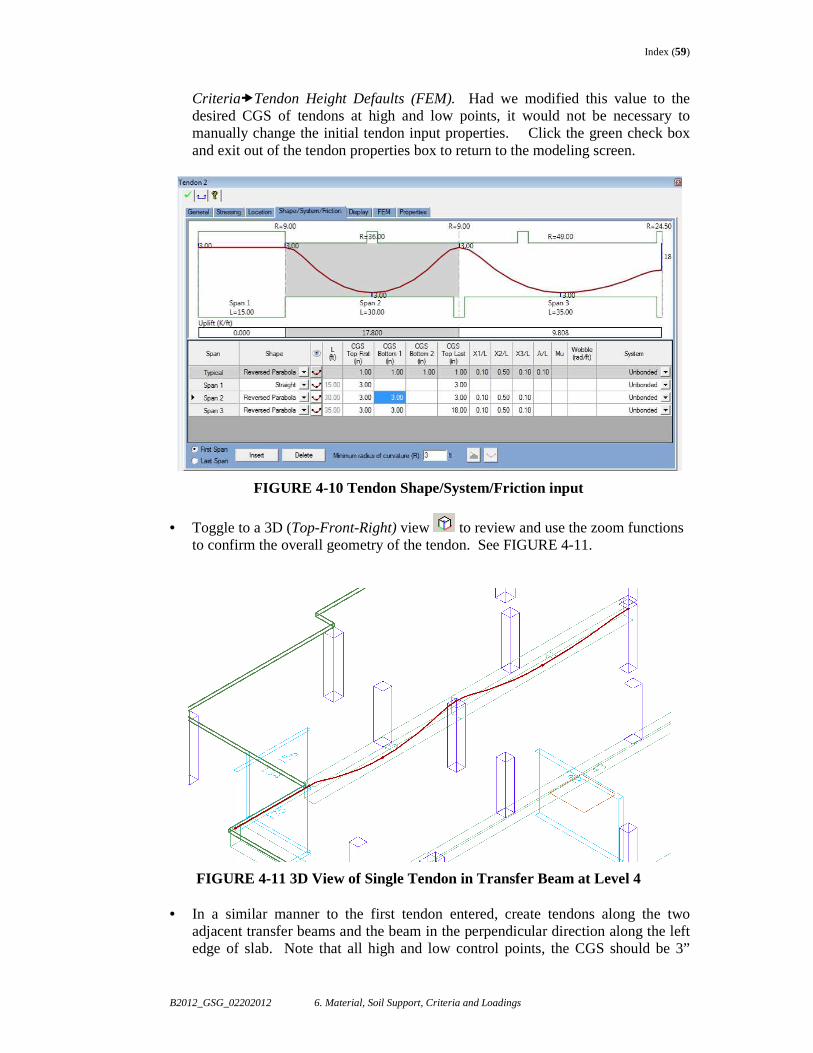
Index (59)
B2012_GSG_02202012 6. Material, Soil Support, Criteria and Loadings
Criteria�Tendon Height Defaults (FEM). Had we modified this value to the desired CGS of tendons at high and low points, it would not be necessary to manually change the initial tendon input properties. Click the green check box and exit out of the tendon properties box to return to the modeling screen.
FIGURE 4-10 Tendon Shape/System/Friction input
• Toggle to a 3D (Top-Front-Right) view to review and use the zoom functions to confirm the overall geometry of the tendon. See FIGURE 4-11.
FIGURE 4-11 3D View of Single Tendon in Transfer Beam at Level 4
• In a similar manner to the first tendon entered, create tendons along the two adjacent transfer beams and the beam in the perpendicular direction along the left edge of slab. Note that all high and low control points, the CGS should be 3”
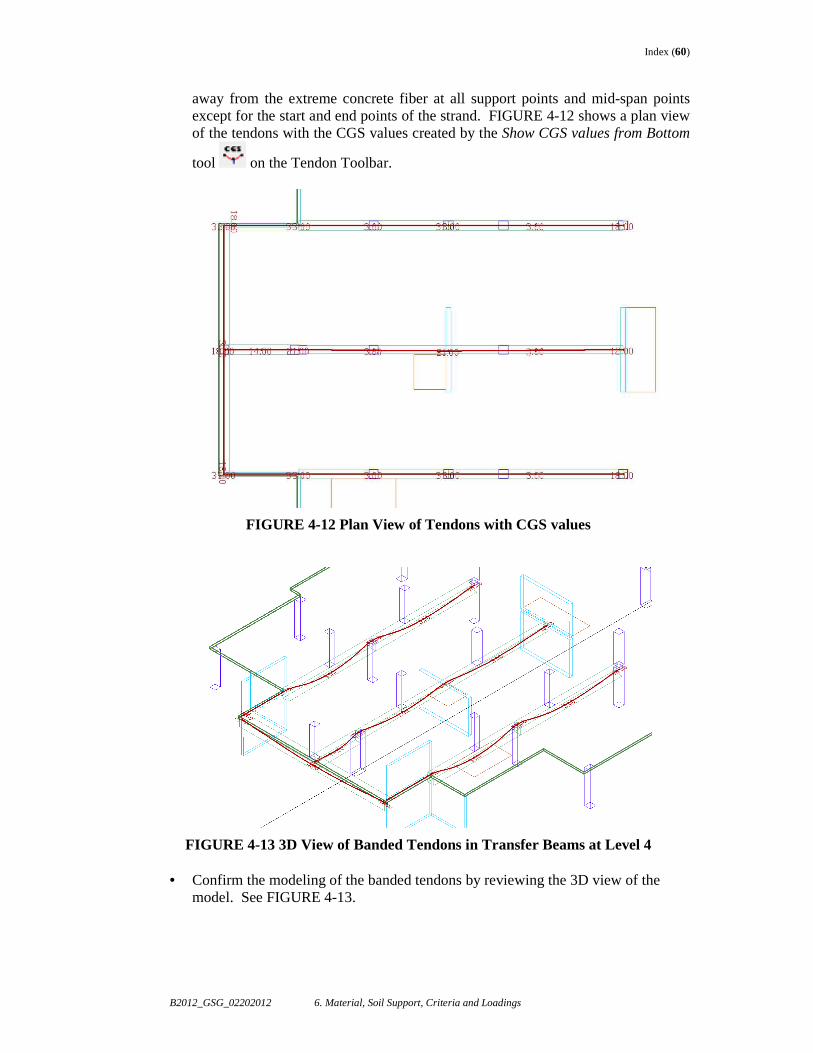
Index (60)
B2012_GSG_02202012 6. Material, Soil Support, Criteria and Loadings
away from the extreme concrete fiber at all support points and mid-span points except for the start and end points of the strand. FIGURE 4-12 shows a plan view of the tendons with the CGS values created by the Show CGS values from Bottom
tool on the Tendon Toolbar.
FIGURE 4-12 Plan View of Tendons with CGS values
FIGURE 4-13 3D View of Banded Tendons in Transfer Beams at Level 4 • Confirm the modeling of the banded tendons by reviewing the 3D view of the
model. See FIGURE 4-13.
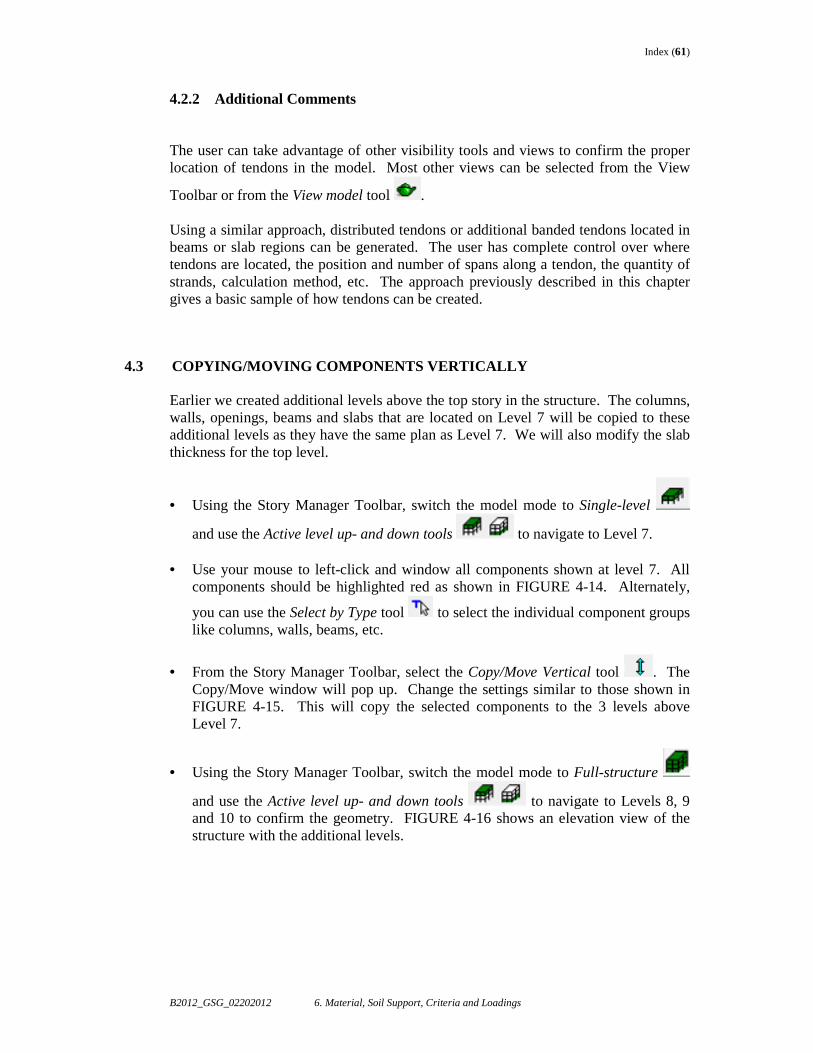
Index (61)
B2012_GSG_02202012 6. Material, Soil Support, Criteria and Loadings
4.2.2 Additional Comments The user can take advantage of other visibility tools and views to confirm the proper location of tendons in the model. Most other views can be selected from the View
Toolbar or from the View model tool . Using a similar approach, distributed tendons or additional banded tendons located in beams or slab regions can be generated. The user has complete control over where tendons are located, the position and number of spans along a tendon, the quantity of strands, calculation method, etc. The approach previously described in this chapter gives a basic sample of how tendons can be created.
4.3 COPYING/MOVING COMPONENTS VERTICALLY Earlier we created additional levels above the top story in the structure. The columns, walls, openings, beams and slabs that are located on Level 7 will be copied to these additional levels as they have the same plan as Level 7. We will also modify the slab thickness for the top level.
• Using the Story Manager Toolbar, switch the model mode to Single-level
and use the Active level up- and down tools to navigate to Level 7.
• Use your mouse to left-click and window all components shown at level 7. All components should be highlighted red as shown in FIGURE 4-14. Alternately,
you can use the Select by Type tool to select the individual component groups like columns, walls, beams, etc.
• From the Story Manager Toolbar, select the Copy/Move Vertical tool . The Copy/Move window will pop up. Change the settings similar to those shown in FIGURE 4-15. This will copy the selected components to the 3 levels above Level 7.
• Using the Story Manager Toolbar, switch the model mode to Full-structure
and use the Active level up- and down tools to navigate to Levels 8, 9 and 10 to confirm the geometry. FIGURE 4-16 shows an elevation view of the structure with the additional levels.
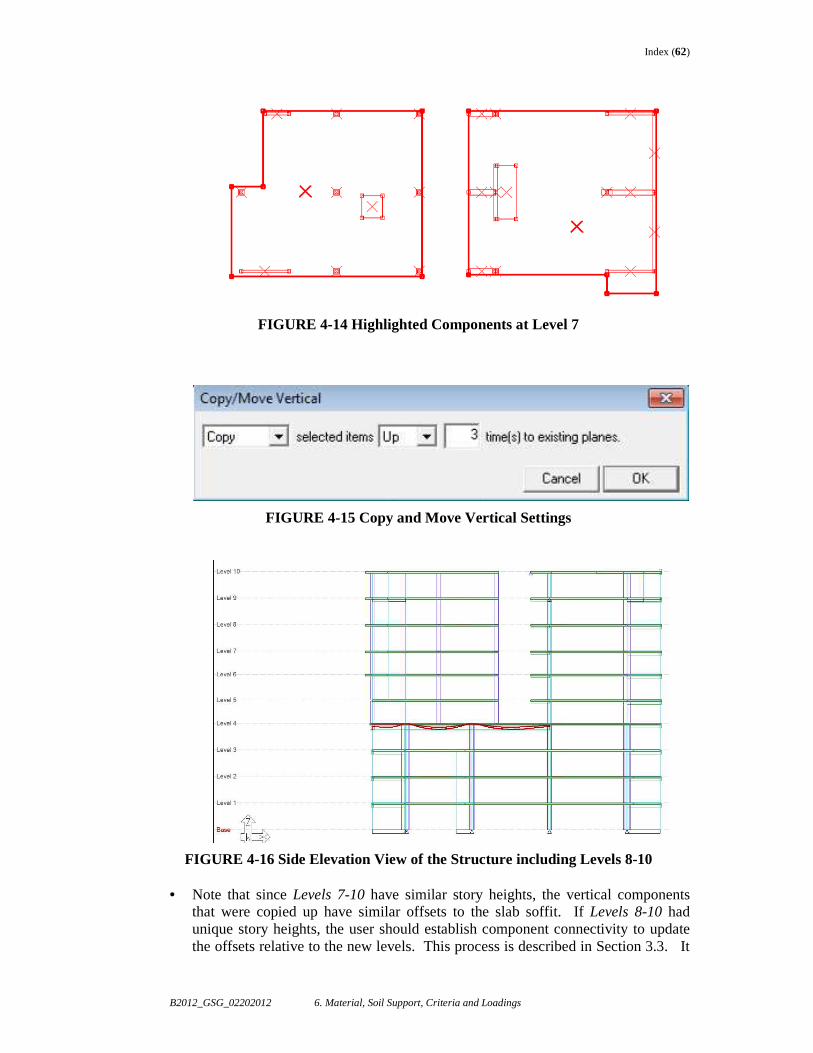
Index (62)
B2012_GSG_02202012 6. Material, Soil Support, Criteria and Loadings
FIGURE 4-14 Highlighted Components at Level 7
FIGURE 4-15 Copy and Move Vertical Settings
FIGURE 4-16 Side Elevation View of the Structure including Levels 8-10 • Note that since Levels 7-10 have similar story heights, the vertical components
that were copied up have similar offsets to the slab soffit. If Levels 8-10 had unique story heights, the user should establish component connectivity to update the offsets relative to the new levels. This process is described in Section 3.3. It
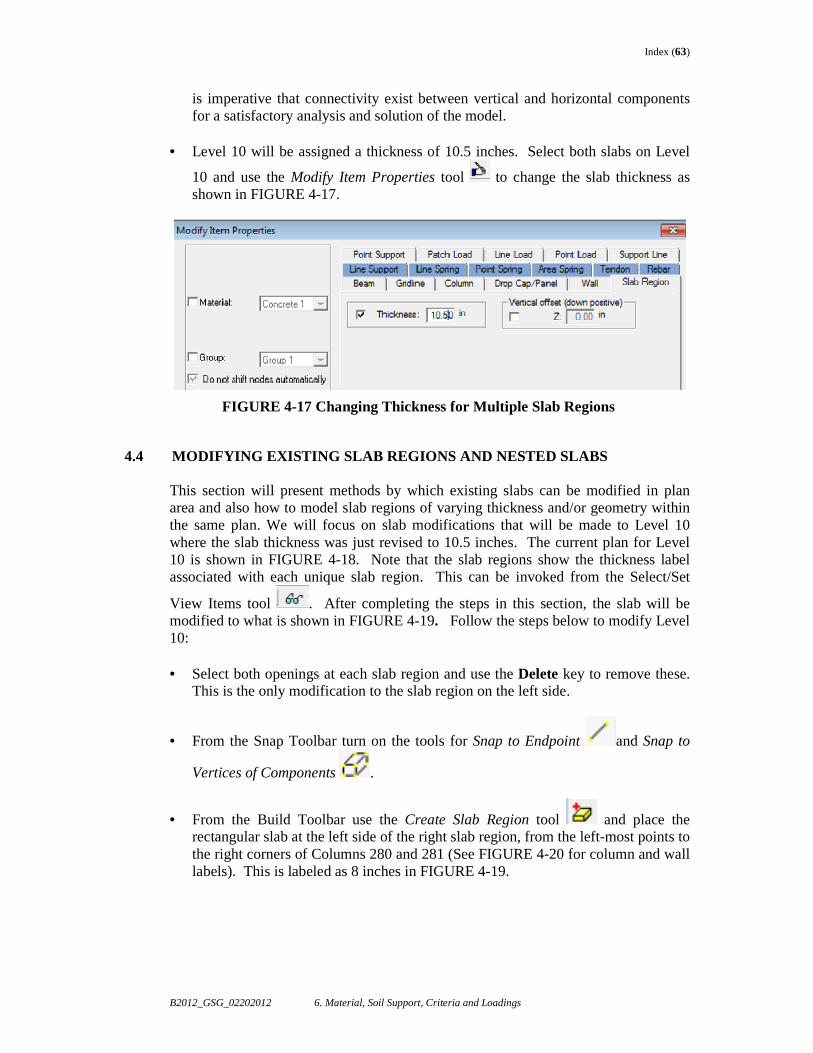
Index (63)
B2012_GSG_02202012 6. Material, Soil Support, Criteria and Loadings
is imperative that connectivity exist between vertical and horizontal components for a satisfactory analysis and solution of the model.
• Level 10 will be assigned a thickness of 10.5 inches. Select both slabs on Level
10 and use the Modify Item Properties tool to change the slab thickness as shown in FIGURE 4-17.
FIGURE 4-17 Changing Thickness for Multiple Slab Regions
4.4 MODIFYING EXISTING SLAB REGIONS AND NESTED SLABS This section will present methods by which existing slabs can be modified in plan area and also how to model slab regions of varying thickness and/or geometry within the same plan. We will focus on slab modifications that will be made to Level 10 where the slab thickness was just revised to 10.5 inches. The current plan for Level 10 is shown in FIGURE 4-18. Note that the slab regions show the thickness label associated with each unique slab region. This can be invoked from the Select/Set
View Items tool . After completing the steps in this section, the slab will be modified to what is shown in FIGURE 4-19. Follow the steps below to modify Level 10: • Select both openings at each slab region and use the Delete key to remove these.
This is the only modification to the slab region on the left side.
• From the Snap Toolbar turn on the tools for Snap to Endpoint and Snap to
Vertices of Components .
• From the Build Toolbar use the Create Slab Region tool and place the rectangular slab at the left side of the right slab region, from the left-most points to the right corners of Columns 280 and 281 (See FIGURE 4-20 for column and wall labels). This is labeled as 8 inches in FIGURE 4-19.
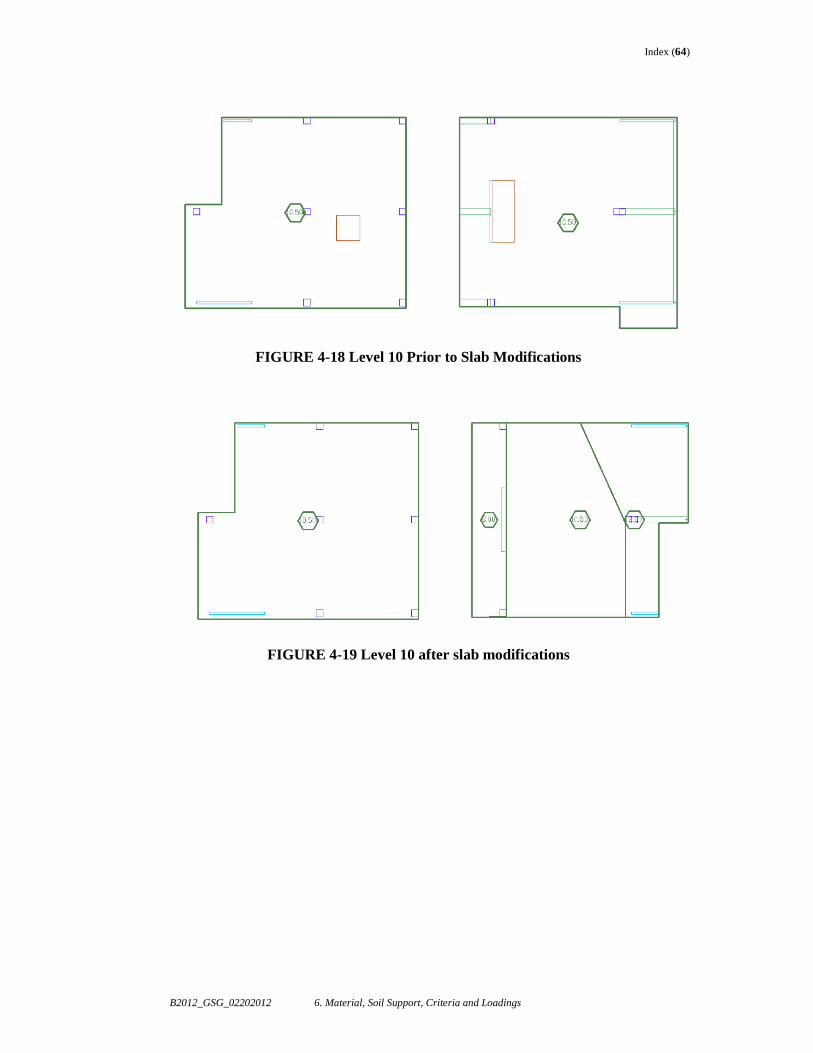
Index (64)
B2012_GSG_02202012 6. Material, Soil Support, Criteria and Loadings
FIGURE 4-18 Level 10 Prior to Slab Modifications
FIGURE 4-19 Level 10 after slab modifications
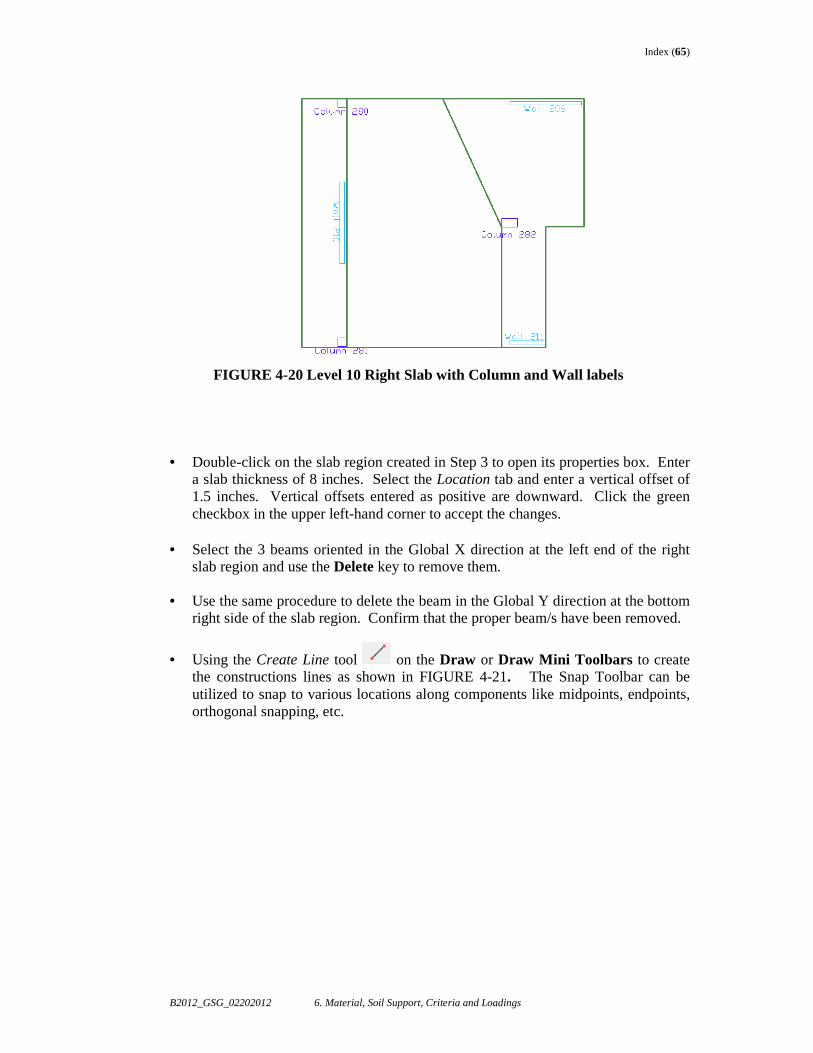
Index (65)
B2012_GSG_02202012 6. Material, Soil Support, Criteria and Loadings
FIGURE 4-20 Level 10 Right Slab with Column and Wall labels
• Double-click on the slab region created in Step 3 to open its properties box. Enter a slab thickness of 8 inches. Select the Location tab and enter a vertical offset of 1.5 inches. Vertical offsets entered as positive are downward. Click the green checkbox in the upper left-hand corner to accept the changes.
• Select the 3 beams oriented in the Global X direction at the left end of the right slab region and use the Delete key to remove them.
• Use the same procedure to delete the beam in the Global Y direction at the bottom
right side of the slab region. Confirm that the proper beam/s have been removed.
• Using the Create Line tool on the Draw or Draw Mini Toolbars to create the constructions lines as shown in FIGURE 4-21. The Snap Toolbar can be utilized to snap to various locations along components like midpoints, endpoints, orthogonal snapping, etc.
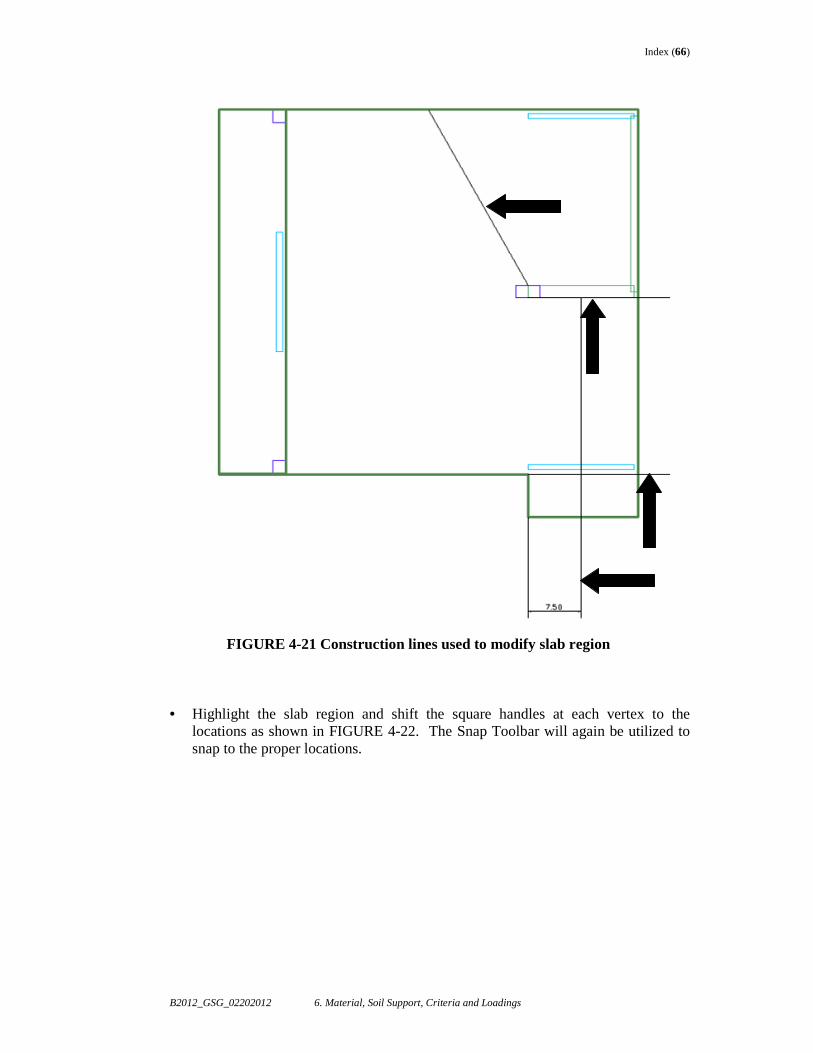
Index (66)
B2012_GSG_02202012 6. Material, Soil Support, Criteria and Loadings
FIGURE 4-21 Construction lines used to modify slab region
• Highlight the slab region and shift the square handles at each vertex to the locations as shown in FIGURE 4-22. The Snap Toolbar will again be utilized to snap to the proper locations.
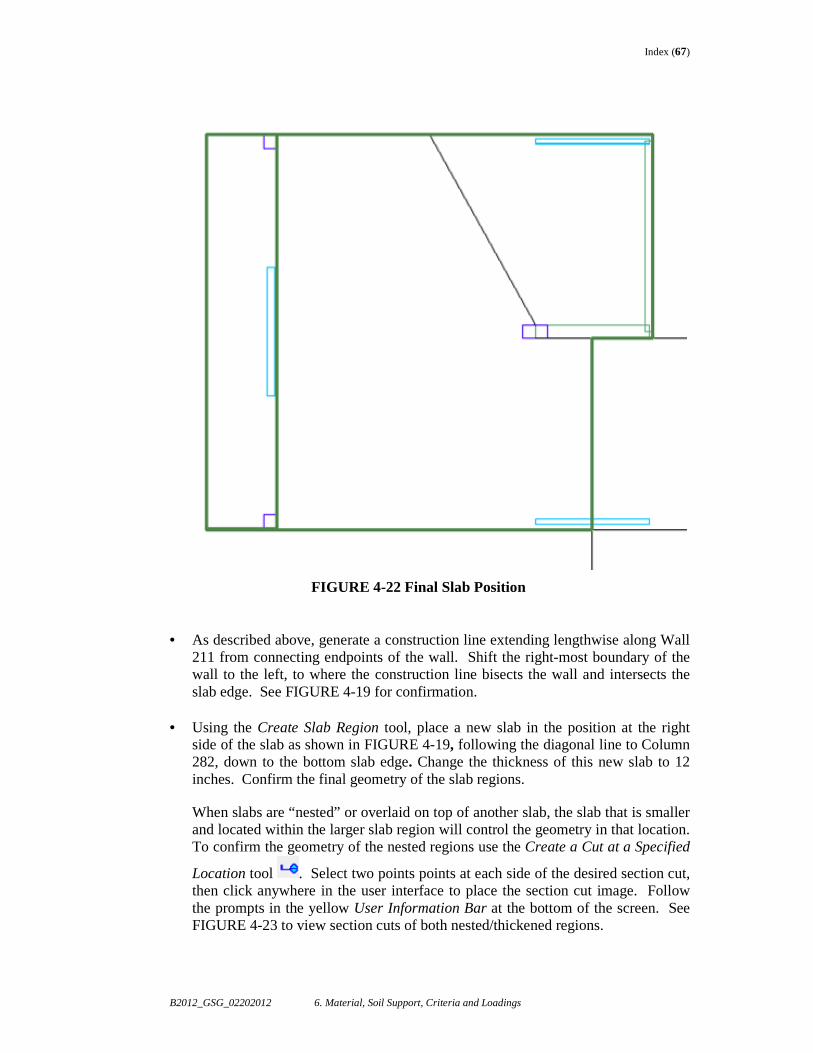
Index (67)
B2012_GSG_02202012 6. Material, Soil Support, Criteria and Loadings
FIGURE 4-22 Final Slab Position
• As described above, generate a construction line extending lengthwise along Wall
211 from connecting endpoints of the wall. Shift the right-most boundary of the wall to the left, to where the construction line bisects the wall and intersects the slab edge. See FIGURE 4-19 for confirmation.
• Using the Create Slab Region tool, place a new slab in the position at the right side of the slab as shown in FIGURE 4-19, following the diagonal line to Column 282, down to the bottom slab edge. Change the thickness of this new slab to 12 inches. Confirm the final geometry of the slab regions.
When slabs are “nested” or overlaid on top of another slab, the slab that is smaller and located within the larger slab region will control the geometry in that location. To confirm the geometry of the nested regions use the Create a Cut at a Specified
Location tool . Select two points points at each side of the desired section cut, then click anywhere in the user interface to place the section cut image. Follow the prompts in the yellow User Information Bar at the bottom of the screen. See FIGURE 4-23 to view section cuts of both nested/thickened regions.
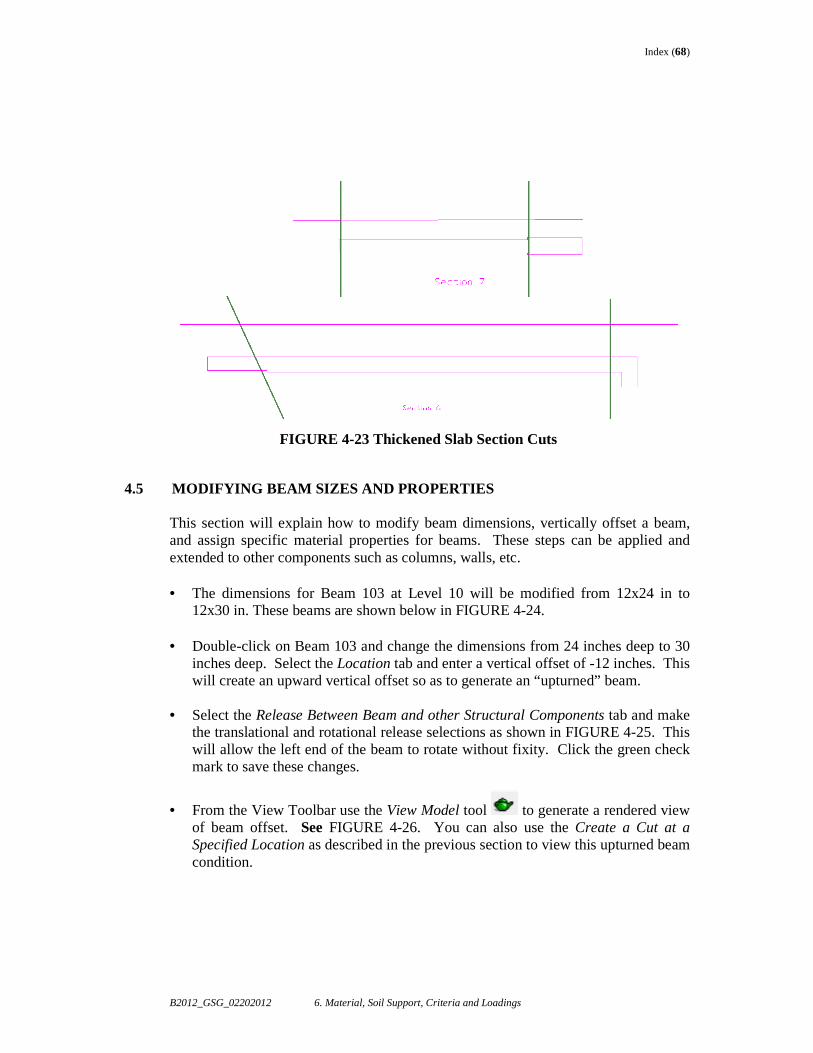
Index (68)
B2012_GSG_02202012 6. Material, Soil Support, Criteria and Loadings
FIGURE 4-23 Thickened Slab Section Cuts
4.5 MODIFYING BEAM SIZES AND PROPERTIES
This section will explain how to modify beam dimensions, vertically offset a beam, and assign specific material properties for beams. These steps can be applied and extended to other components such as columns, walls, etc. • The dimensions for Beam 103 at Level 10 will be modified from 12x24 in to
12x30 in. These beams are shown below in FIGURE 4-24.
• Double-click on Beam 103 and change the dimensions from 24 inches deep to 30 inches deep. Select the Location tab and enter a vertical offset of -12 inches. This will create an upward vertical offset so as to generate an “upturned” beam.
• Select the Release Between Beam and other Structural Components tab and make
the translational and rotational release selections as shown in FIGURE 4-25. This will allow the left end of the beam to rotate without fixity. Click the green check mark to save these changes.
• From the View Toolbar use the View Model tool to generate a rendered view of beam offset. See FIGURE 4-26. You can also use the Create a Cut at a Specified Location as described in the previous section to view this upturned beam condition.
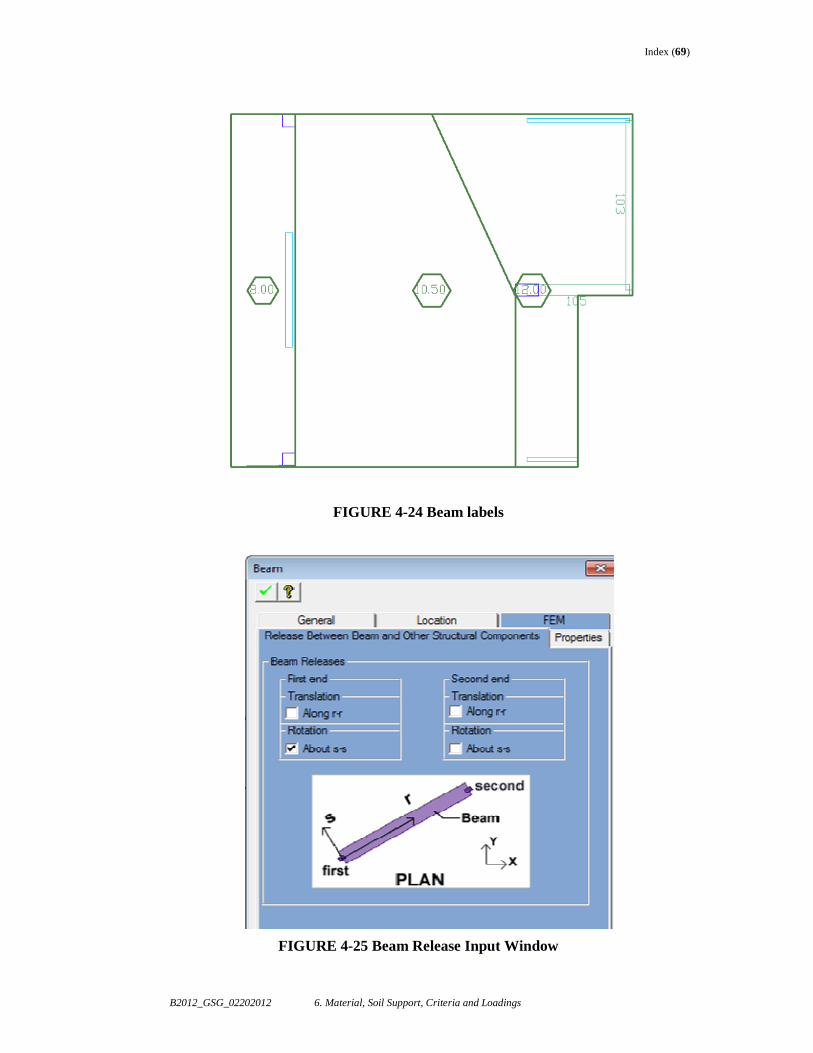
Index (69)
B2012_GSG_02202012 6. Material, Soil Support, Criteria and Loadings
FIGURE 4-24 Beam labels
FIGURE 4-25 Beam Release Input Window
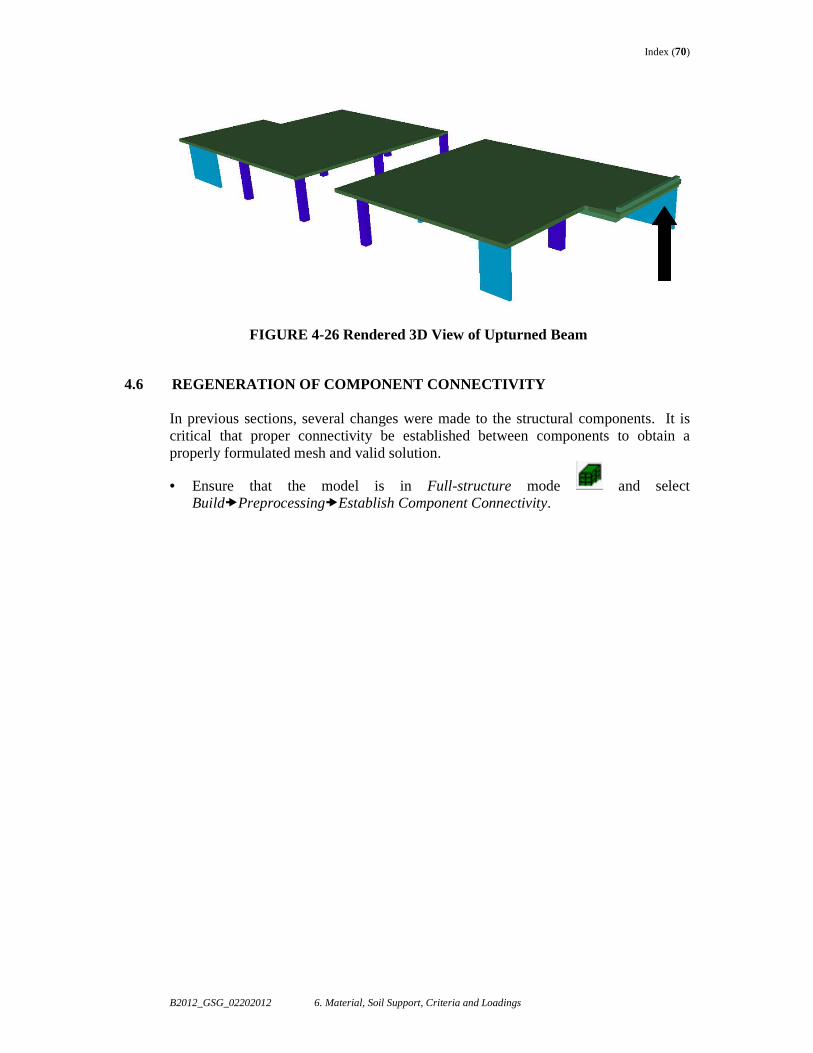
Index (70)
B2012_GSG_02202012 6. Material, Soil Support, Criteria and Loadings
FIGURE 4-26 Rendered 3D View of Upturned Beam
4.6 REGENERATION OF COMPONENT CONNECTIVITY
In previous sections, several changes were made to the structural components. It is critical that proper connectivity be established between components to obtain a properly formulated mesh and valid solution.
• Ensure that the model is in Full-structure mode and select Build�Preprocessing�Establish Component Connectivity.
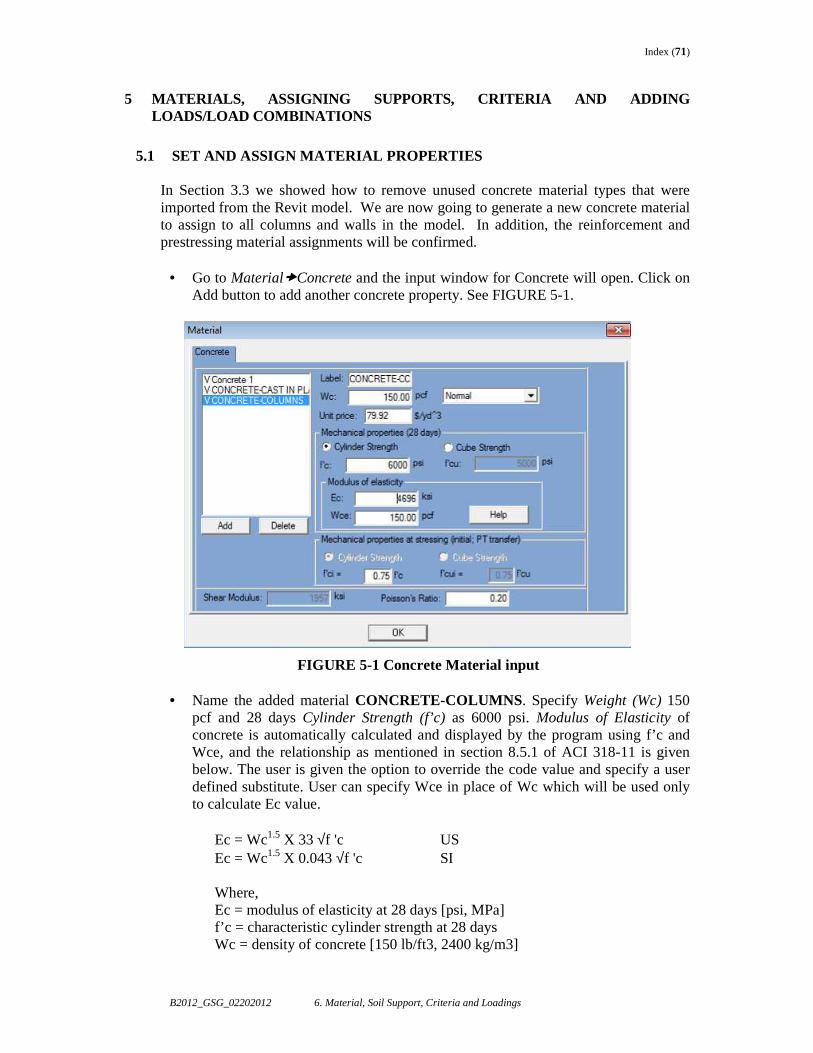
Index (71)
B2012_GSG_02202012 6. Material, Soil Support, Criteria and Loadings
5 MATERIALS, ASSIGNING SUPPORTS, CRITERIA AND ADDING LOADS/LOAD COMBINATIONS
5.1 SET AND ASSIGN MATERIAL PROPERTIES
In Section 3.3 we showed how to remove unused concrete material types that were imported from the Revit model. We are now going to generate a new concrete material to assign to all columns and walls in the model. In addition, the reinforcement and prestressing material assignments will be confirmed.
• Go to Material�Concrete and the input window for Concrete will open. Click on Add button to add another concrete property. See FIGURE 5-1.
FIGURE 5-1 Concrete Material input
• Name the added material CONCRETE-COLUMNS . Specify Weight (Wc) 150 pcf and 28 days Cylinder Strength (f’c) as 6000 psi. Modulus of Elasticity of concrete is automatically calculated and displayed by the program using f’c and Wce, and the relationship as mentioned in section 8.5.1 of ACI 318-11 is given below. The user is given the option to override the code value and specify a user defined substitute. User can specify Wce in place of Wc which will be used only to calculate Ec value.
Ec = Wc1.5 X 33 √f 'c US Ec = Wc1.5 X 0.043 √f 'c SI Where, Ec = modulus of elasticity at 28 days [psi, MPa] f’c = characteristic cylinder strength at 28 days Wc = density of concrete [150 lb/ft3, 2400 kg/m3]
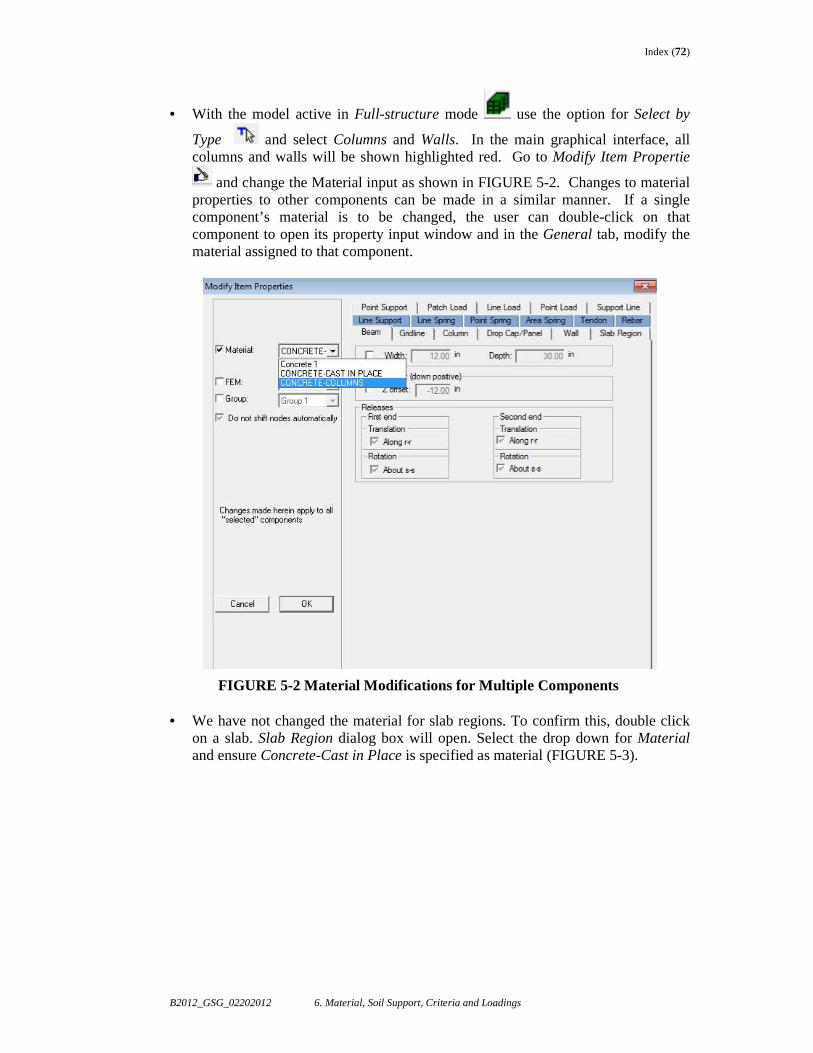
Index (72)
B2012_GSG_02202012 6. Material, Soil Support, Criteria and Loadings
• With the model active in Full-structure mode use the option for Select by
Type and select Columns and Walls. In the main graphical interface, all columns and walls will be shown highlighted red. Go to Modify Item Propertie
and change the Material input as shown in FIGURE 5-2. Changes to material properties to other components can be made in a similar manner. If a single component’s material is to be changed, the user can double-click on that component to open its property input window and in the General tab, modify the material assigned to that component.
FIGURE 5-2 Material Modifications for Multiple Comp onents
• We have not changed the material for slab regions. To confirm this, double click on a slab. Slab Region dialog box will open. Select the drop down for Material and ensure Concrete-Cast in Place is specified as material (FIGURE 5-3).
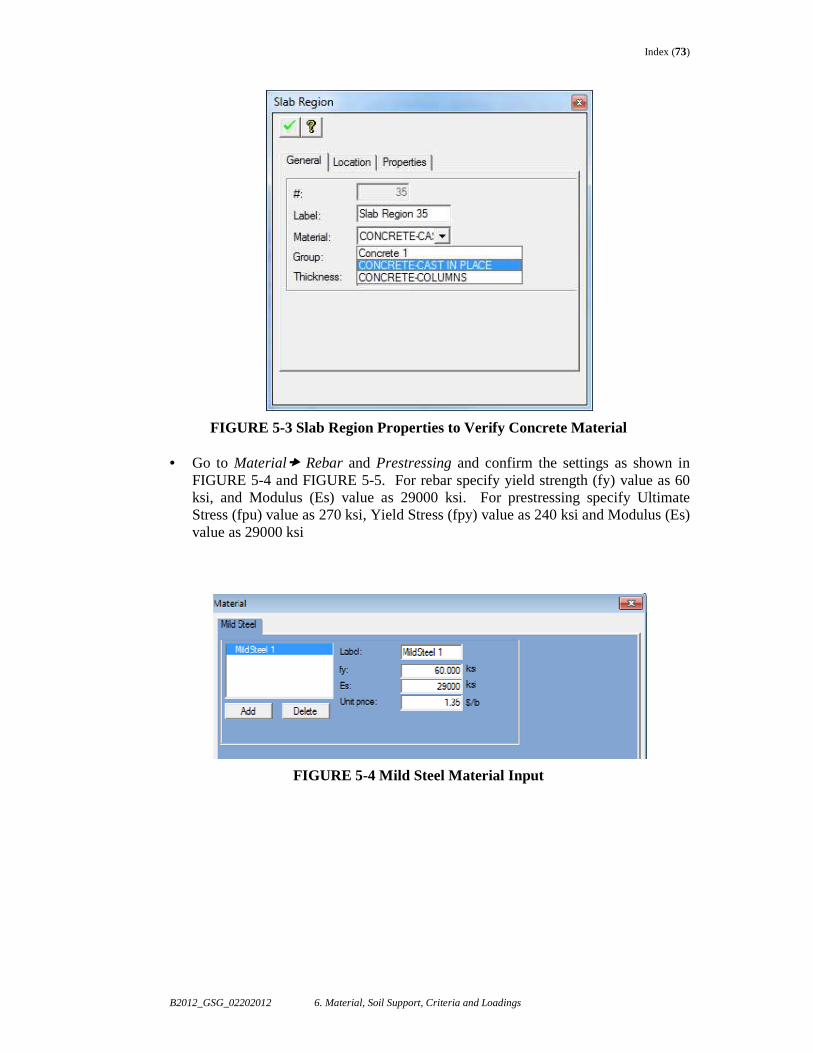
Index (73)
B2012_GSG_02202012 6. Material, Soil Support, Criteria and Loadings
FIGURE 5-3 Slab Region Properties to Verify Concrete Material • Go to Material� Rebar and Prestressing and confirm the settings as shown in
FIGURE 5-4 and FIGURE 5-5. For rebar specify yield strength (fy) value as 60 ksi, and Modulus (Es) value as 29000 ksi. For prestressing specify Ultimate Stress (fpu) value as 270 ksi, Yield Stress (fpy) value as 240 ksi and Modulus (Es) value as 29000 ksi
FIGURE 5-4 Mild Steel Material Input
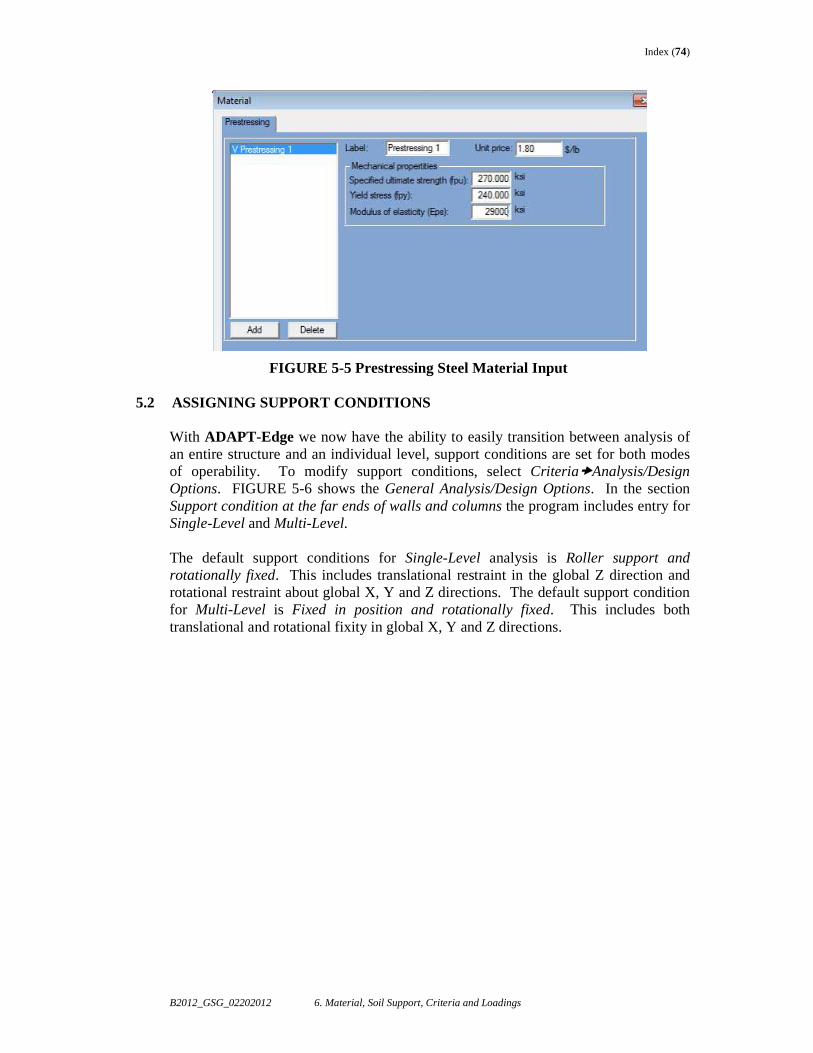
Index (74)
B2012_GSG_02202012 6. Material, Soil Support, Criteria and Loadings
FIGURE 5-5 Prestressing Steel Material Input
5.2 ASSIGNING SUPPORT CONDITIONS
With ADAPT-Edge we now have the ability to easily transition between analysis of an entire structure and an individual level, support conditions are set for both modes of operability. To modify support conditions, select Criteria�Analysis/Design Options. FIGURE 5-6 shows the General Analysis/Design Options. In the section Support condition at the far ends of walls and columns the program includes entry for Single-Level and Multi-Level. The default support conditions for Single-Level analysis is Roller support and rotationally fixed. This includes translational restraint in the global Z direction and rotational restraint about global X, Y and Z directions. The default support condition for Multi-Level is Fixed in position and rotationally fixed. This includes both translational and rotational fixity in global X, Y and Z directions.
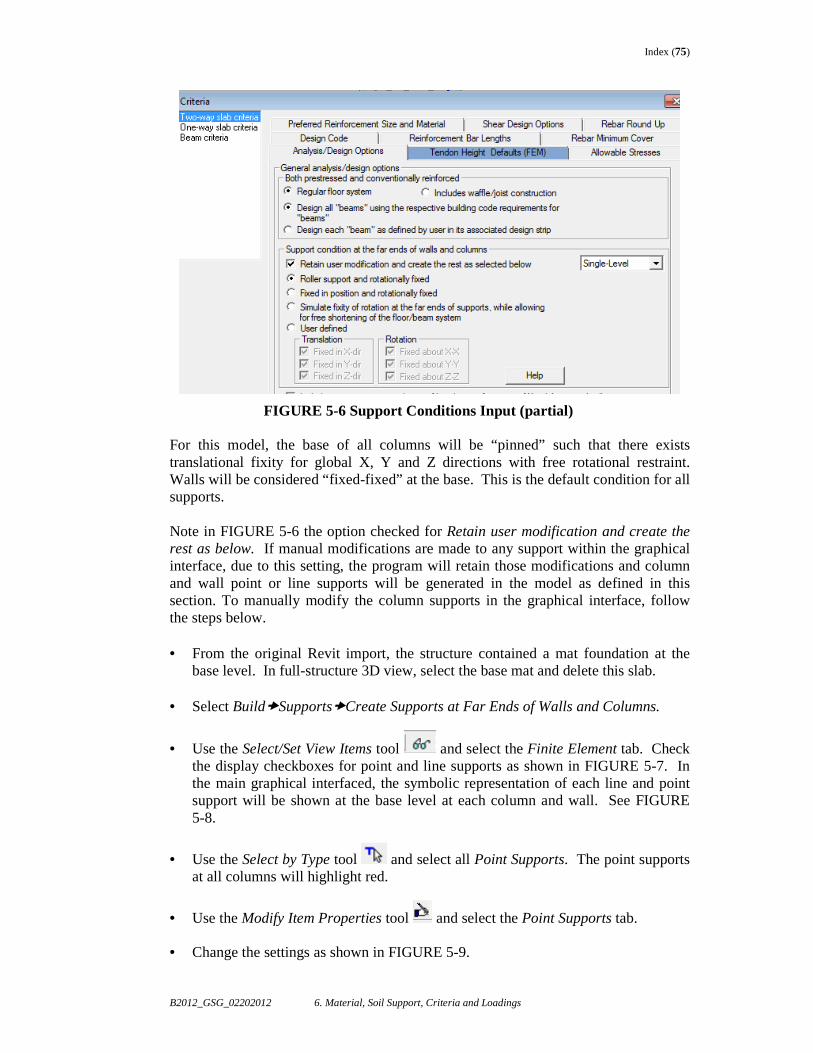
Index (75)
B2012_GSG_02202012 6. Material, Soil Support, Criteria and Loadings
FIGURE 5-6 Support Conditions Input (partial) For this model, the base of all columns will be “pinned” such that there exists translational fixity for global X, Y and Z directions with free rotational restraint. Walls will be considered “fixed-fixed” at the base. This is the default condition for all supports. Note in FIGURE 5-6 the option checked for Retain user modification and create the rest as below. If manual modifications are made to any support within the graphical interface, due to this setting, the program will retain those modifications and column and wall point or line supports will be generated in the model as defined in this section. To manually modify the column supports in the graphical interface, follow the steps below. • From the original Revit import, the structure contained a mat foundation at the
base level. In full-structure 3D view, select the base mat and delete this slab.
• Select Build�Supports�Create Supports at Far Ends of Walls and Columns.
• Use the Select/Set View Items tool and select the Finite Element tab. Check the display checkboxes for point and line supports as shown in FIGURE 5-7. In the main graphical interfaced, the symbolic representation of each line and point support will be shown at the base level at each column and wall. See FIGURE 5-8.
• Use the Select by Type tool and select all Point Supports. The point supports at all columns will highlight red.
• Use the Modify Item Properties tool and select the Point Supports tab. • Change the settings as shown in FIGURE 5-9.
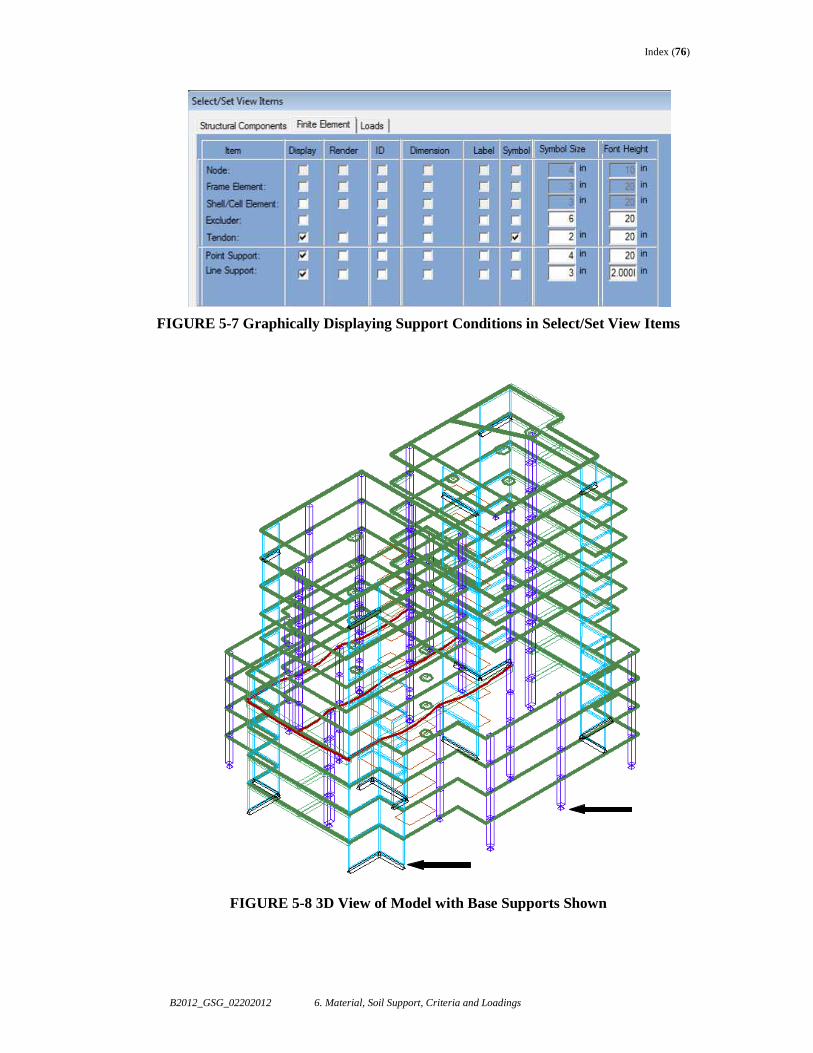
Index (76)
B2012_GSG_02202012 6. Material, Soil Support, Criteria and Loadings
FIGURE 5-7 Graphically Displaying Support Conditions in Select/Set View Items
FIGURE 5-8 3D View of Model with Base Supports Shown
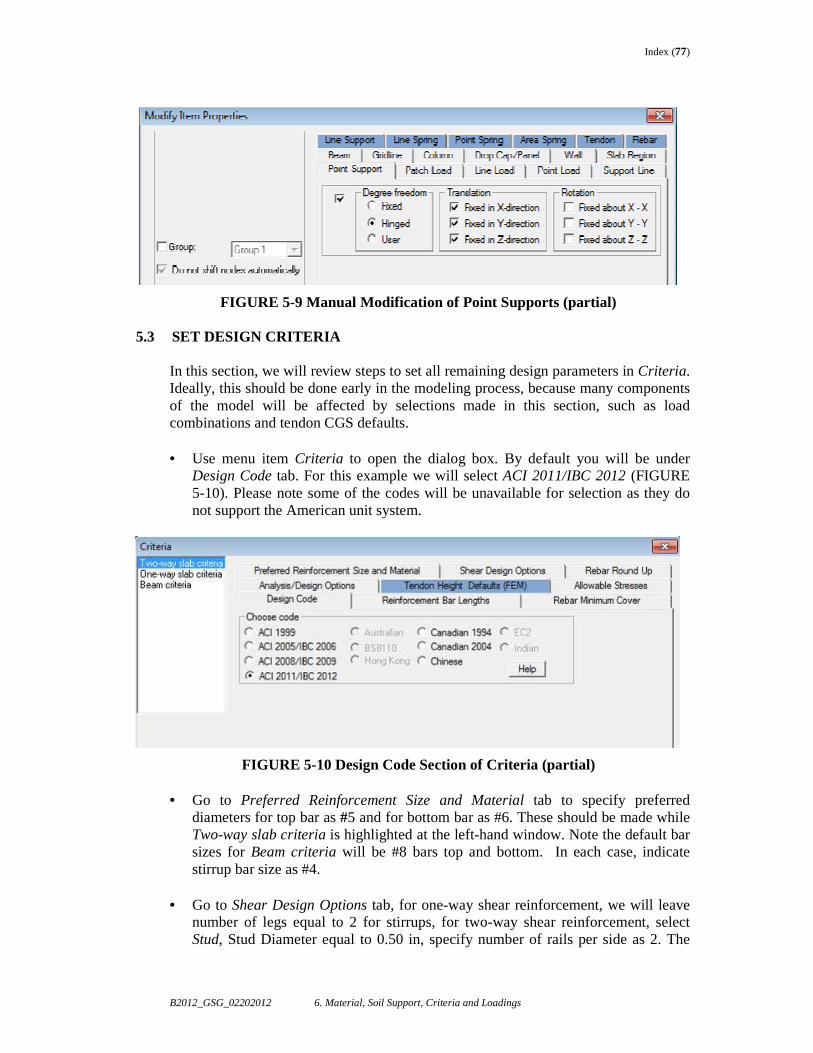
Index (77)
B2012_GSG_02202012 6. Material, Soil Support, Criteria and Loadings
FIGURE 5-9 Manual Modification of Point Supports (partial)
5.3 SET DESIGN CRITERIA
In this section, we will review steps to set all remaining design parameters in Criteria. Ideally, this should be done early in the modeling process, because many components of the model will be affected by selections made in this section, such as load combinations and tendon CGS defaults. • Use menu item Criteria to open the dialog box. By default you will be under
Design Code tab. For this example we will select ACI 2011/IBC 2012 (FIGURE 5-10). Please note some of the codes will be unavailable for selection as they do not support the American unit system.
FIGURE 5-10 Design Code Section of Criteria (partial)
• Go to Preferred Reinforcement Size and Material tab to specify preferred diameters for top bar as #5 and for bottom bar as #6. These should be made while Two-way slab criteria is highlighted at the left-hand window. Note the default bar sizes for Beam criteria will be #8 bars top and bottom. In each case, indicate stirrup bar size as #4.
• Go to Shear Design Options tab, for one-way shear reinforcement, we will leave number of legs equal to 2 for stirrups, for two-way shear reinforcement, select Stud, Stud Diameter equal to 0.50 in, specify number of rails per side as 2. The
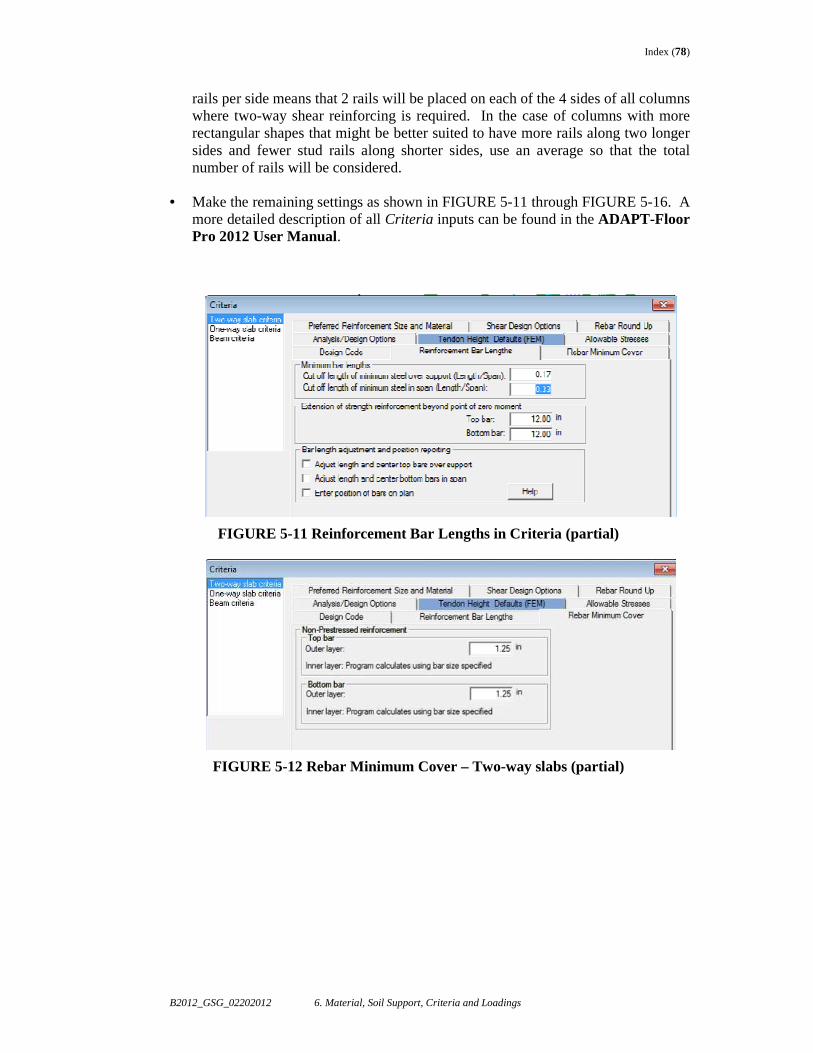
Index (78)
B2012_GSG_02202012 6. Material, Soil Support, Criteria and Loadings
rails per side means that 2 rails will be placed on each of the 4 sides of all columns where two-way shear reinforcing is required. In the case of columns with more rectangular shapes that might be better suited to have more rails along two longer sides and fewer stud rails along shorter sides, use an average so that the total number of rails will be considered.
• Make the remaining settings as shown in FIGURE 5-11 through FIGURE 5-16. A
more detailed description of all Criteria inputs can be found in the ADAPT-Floor Pro 2012 User Manual.
FIGURE 5-11 Reinforcement Bar Lengths in Criteria (partial)
FIGURE 5-12 Rebar Minimum Cover – Two-way slabs (partial)
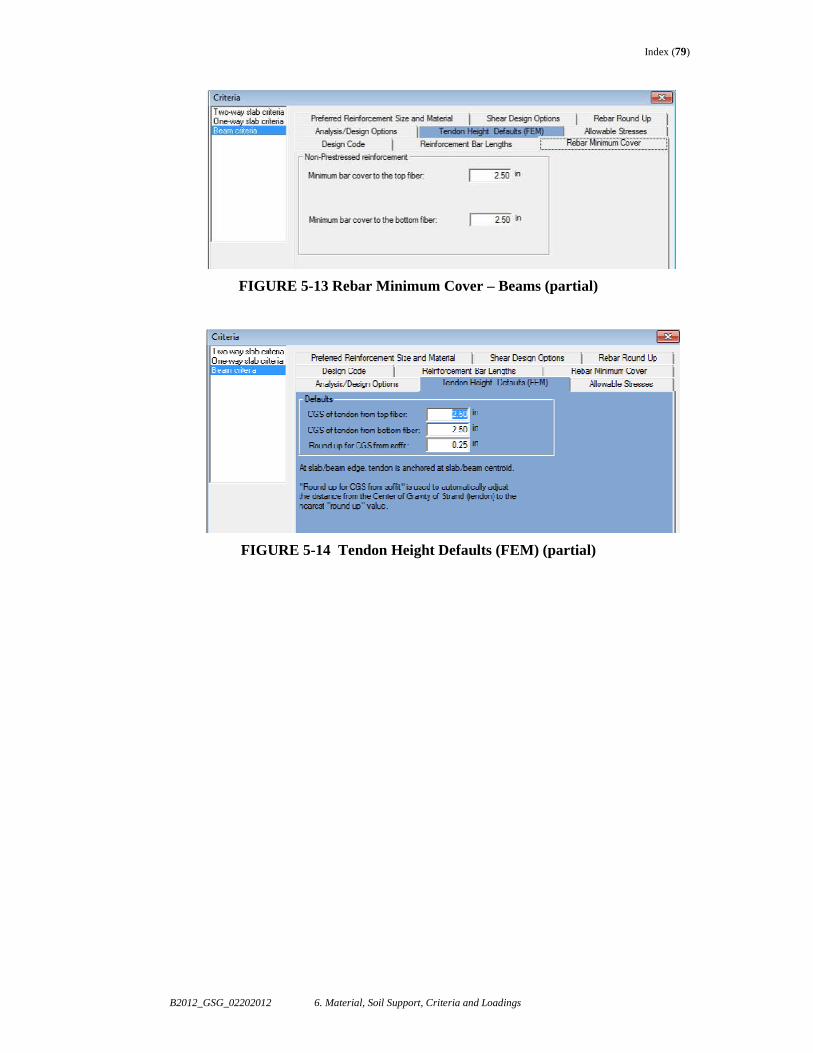
Index (79)
B2012_GSG_02202012 6. Material, Soil Support, Criteria and Loadings
FIGURE 5-13 Rebar Minimum Cover – Beams (partial)
FIGURE 5-14 Tendon Height Defaults (FEM) (partial)
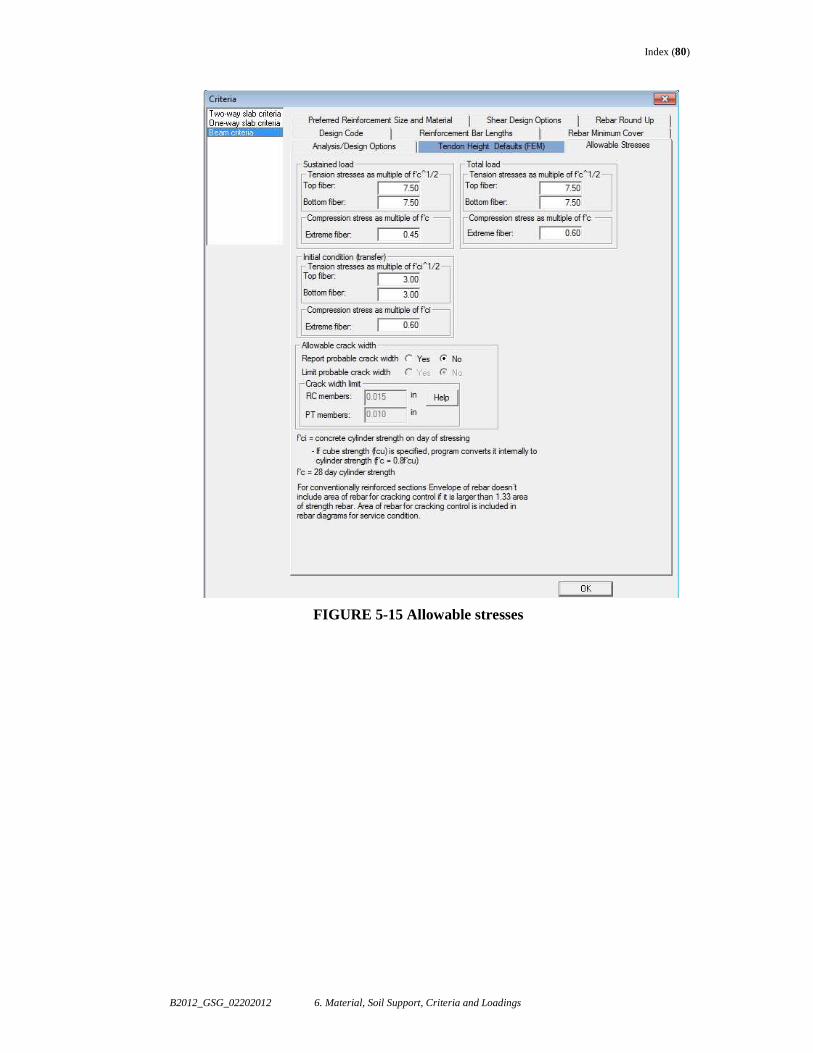
Index (80)
B2012_GSG_02202012 6. Material, Soil Support, Criteria and Loadings
FIGURE 5-15 Allowable stresses
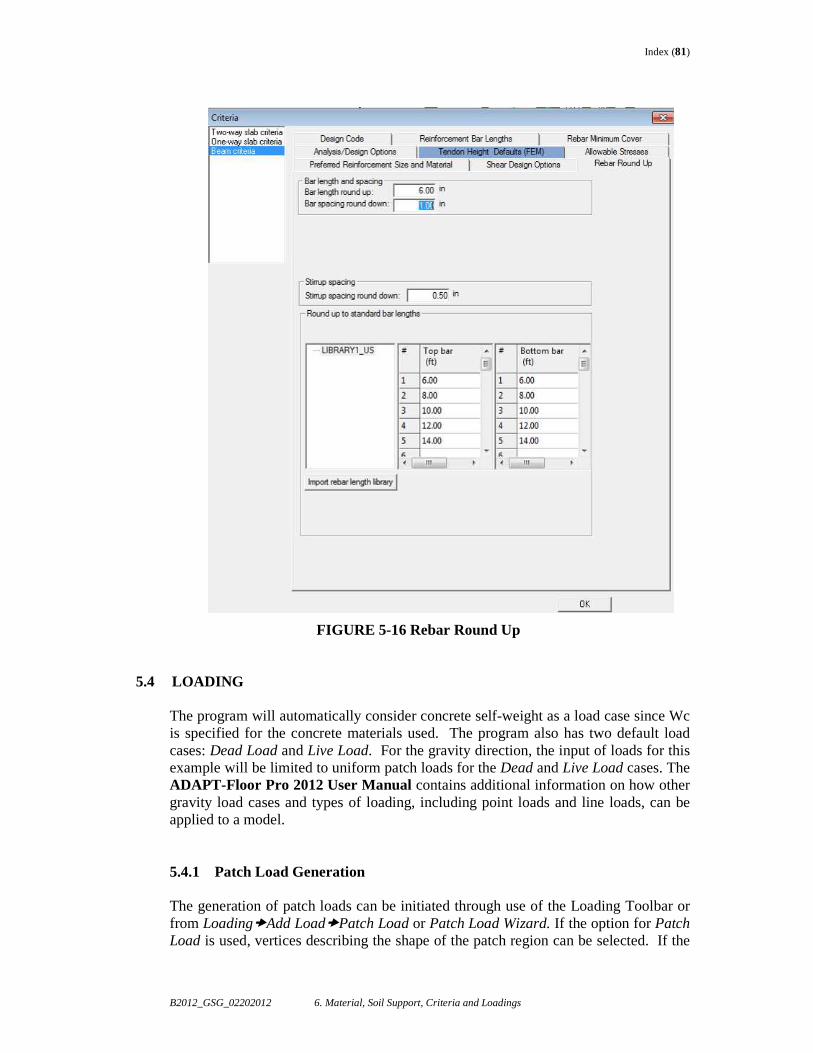
Index (81)
B2012_GSG_02202012 6. Material, Soil Support, Criteria and Loadings
FIGURE 5-16 Rebar Round Up
5.4 LOADING
The program will automatically consider concrete self-weight as a load case since Wc is specified for the concrete materials used. The program also has two default load cases: Dead Load and Live Load. For the gravity direction, the input of loads for this example will be limited to uniform patch loads for the Dead and Live Load cases. The ADAPT-Floor Pro 2012 User Manual contains additional information on how other gravity load cases and types of loading, including point loads and line loads, can be applied to a model.
5.4.1 Patch Load Generation
The generation of patch loads can be initiated through use of the Loading Toolbar or from Loading�Add Load�Patch Load or Patch Load Wizard. If the option for Patch Load is used, vertices describing the shape of the patch region can be selected. If the
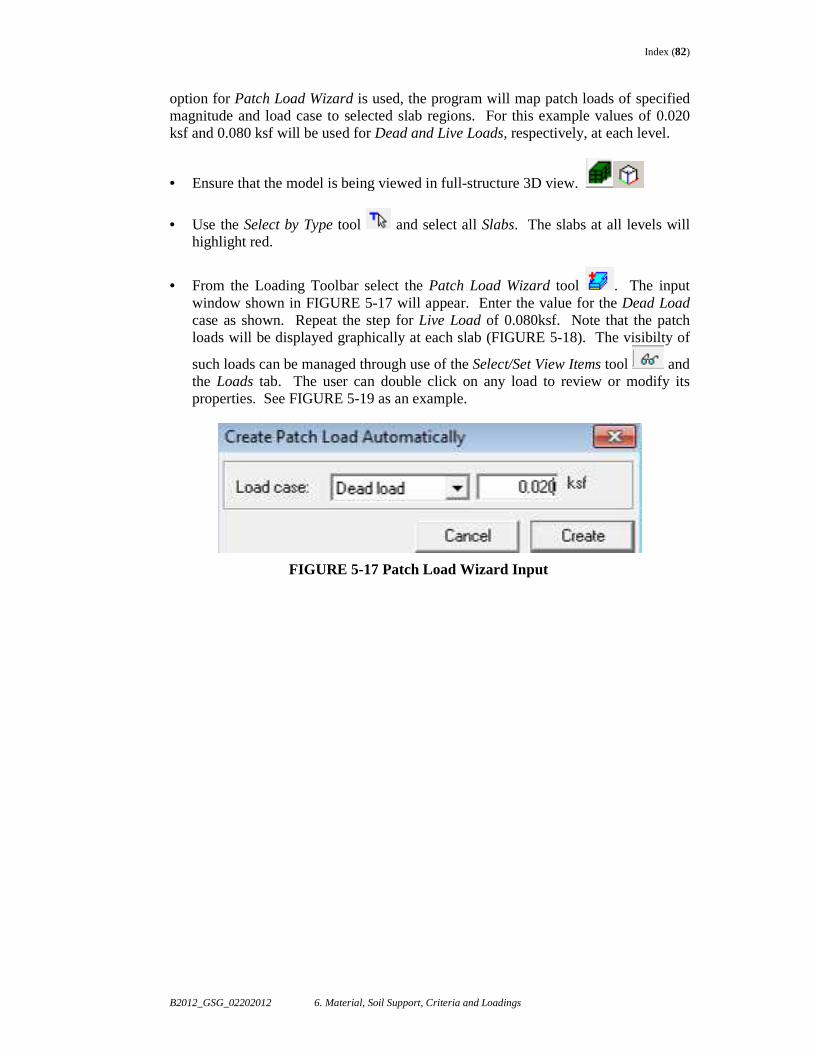
Index (82)
B2012_GSG_02202012 6. Material, Soil Support, Criteria and Loadings
option for Patch Load Wizard is used, the program will map patch loads of specified magnitude and load case to selected slab regions. For this example values of 0.020 ksf and 0.080 ksf will be used for Dead and Live Loads, respectively, at each level.
• Ensure that the model is being viewed in full-structure 3D view.
• Use the Select by Type tool and select all Slabs. The slabs at all levels will highlight red.
• From the Loading Toolbar select the Patch Load Wizard tool . The input window shown in FIGURE 5-17 will appear. Enter the value for the Dead Load case as shown. Repeat the step for Live Load of 0.080ksf. Note that the patch loads will be displayed graphically at each slab (FIGURE 5-18). The visibilty of
such loads can be managed through use of the Select/Set View Items tool and the Loads tab. The user can double click on any load to review or modify its properties. See FIGURE 5-19 as an example.
FIGURE 5-17 Patch Load Wizard Input
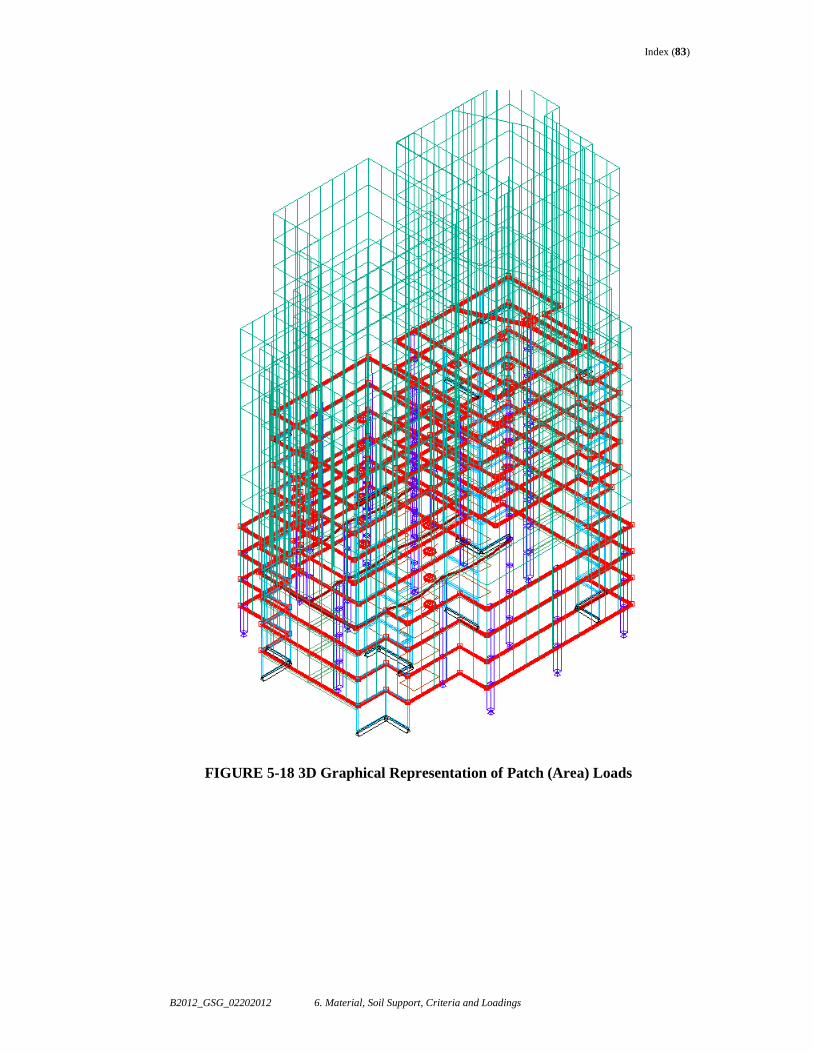
Index (83)
B2012_GSG_02202012 6. Material, Soil Support, Criteria and Loadings
FIGURE 5-18 3D Graphical Representation of Patch (Area) Loads
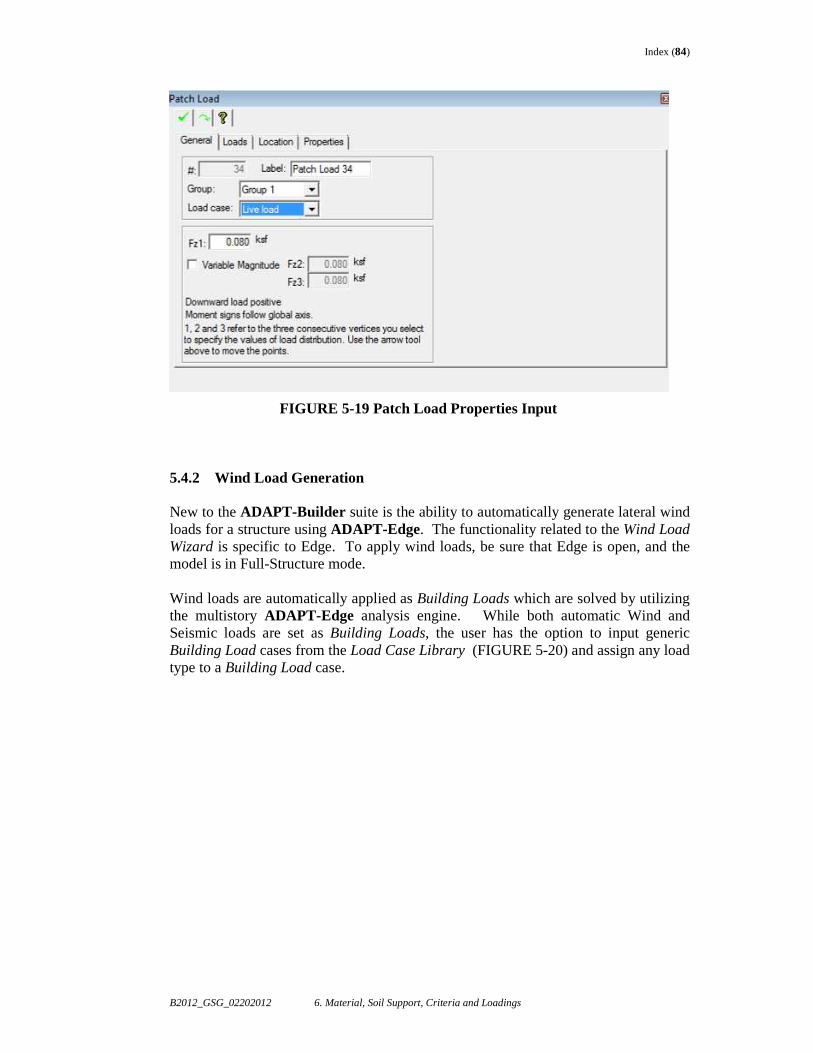
Index (84)
B2012_GSG_02202012 6. Material, Soil Support, Criteria and Loadings
FIGURE 5-19 Patch Load Properties Input 5.4.2 Wind Load Generation
New to the ADAPT-Builder suite is the ability to automatically generate lateral wind loads for a structure using ADAPT-Edge. The functionality related to the Wind Load Wizard is specific to Edge. To apply wind loads, be sure that Edge is open, and the model is in Full-Structure mode. Wind loads are automatically applied as Building Loads which are solved by utilizing the multistory ADAPT-Edge analysis engine. While both automatic Wind and Seismic loads are set as Building Loads, the user has the option to input generic Building Load cases from the Load Case Library (FIGURE 5-20) and assign any load type to a Building Load case.
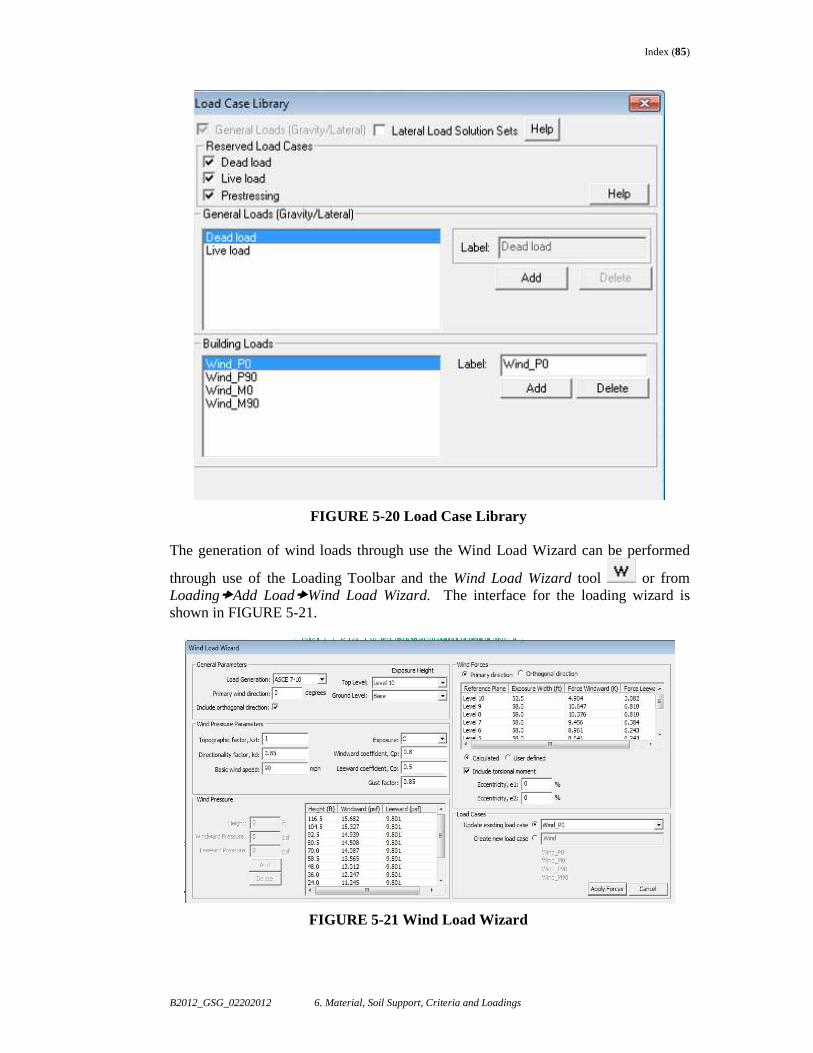
Index (85)
B2012_GSG_02202012 6. Material, Soil Support, Criteria and Loadings
FIGURE 5-20 Load Case Library The generation of wind loads through use the Wind Load Wizard can be performed
through use of the Loading Toolbar and the Wind Load Wizard tool or from Loading�Add Load�Wind Load Wizard. The interface for the loading wizard is shown in FIGURE 5-21.
FIGURE 5-21 Wind Load Wizard
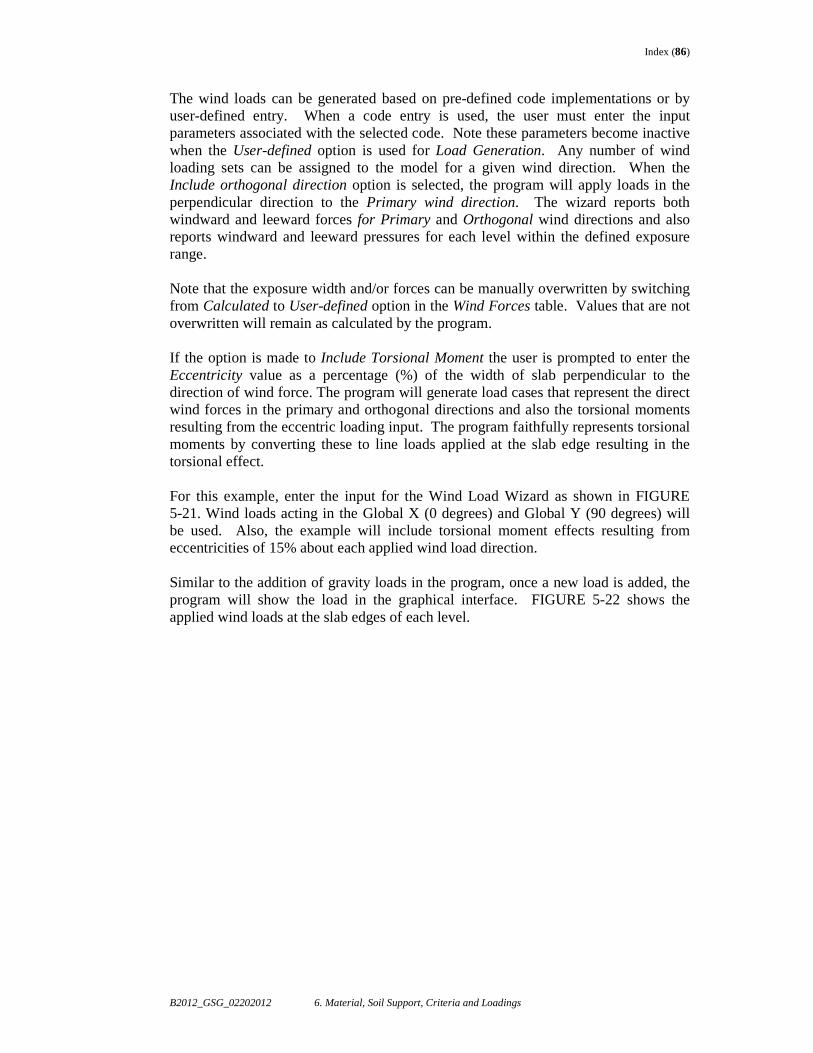
Index (86)
B2012_GSG_02202012 6. Material, Soil Support, Criteria and Loadings
The wind loads can be generated based on pre-defined code implementations or by user-defined entry. When a code entry is used, the user must enter the input parameters associated with the selected code. Note these parameters become inactive when the User-defined option is used for Load Generation. Any number of wind loading sets can be assigned to the model for a given wind direction. When the Include orthogonal direction option is selected, the program will apply loads in the perpendicular direction to the Primary wind direction. The wizard reports both windward and leeward forces for Primary and Orthogonal wind directions and also reports windward and leeward pressures for each level within the defined exposure range.
Note that the exposure width and/or forces can be manually overwritten by switching from Calculated to User-defined option in the Wind Forces table. Values that are not overwritten will remain as calculated by the program. If the option is made to Include Torsional Moment the user is prompted to enter the Eccentricity value as a percentage (%) of the width of slab perpendicular to the direction of wind force. The program will generate load cases that represent the direct wind forces in the primary and orthogonal directions and also the torsional moments resulting from the eccentric loading input. The program faithfully represents torsional moments by converting these to line loads applied at the slab edge resulting in the torsional effect. For this example, enter the input for the Wind Load Wizard as shown in FIGURE 5-21. Wind loads acting in the Global X (0 degrees) and Global Y (90 degrees) will be used. Also, the example will include torsional moment effects resulting from eccentricities of 15% about each applied wind load direction. Similar to the addition of gravity loads in the program, once a new load is added, the program will show the load in the graphical interface. FIGURE 5-22 shows the applied wind loads at the slab edges of each level.
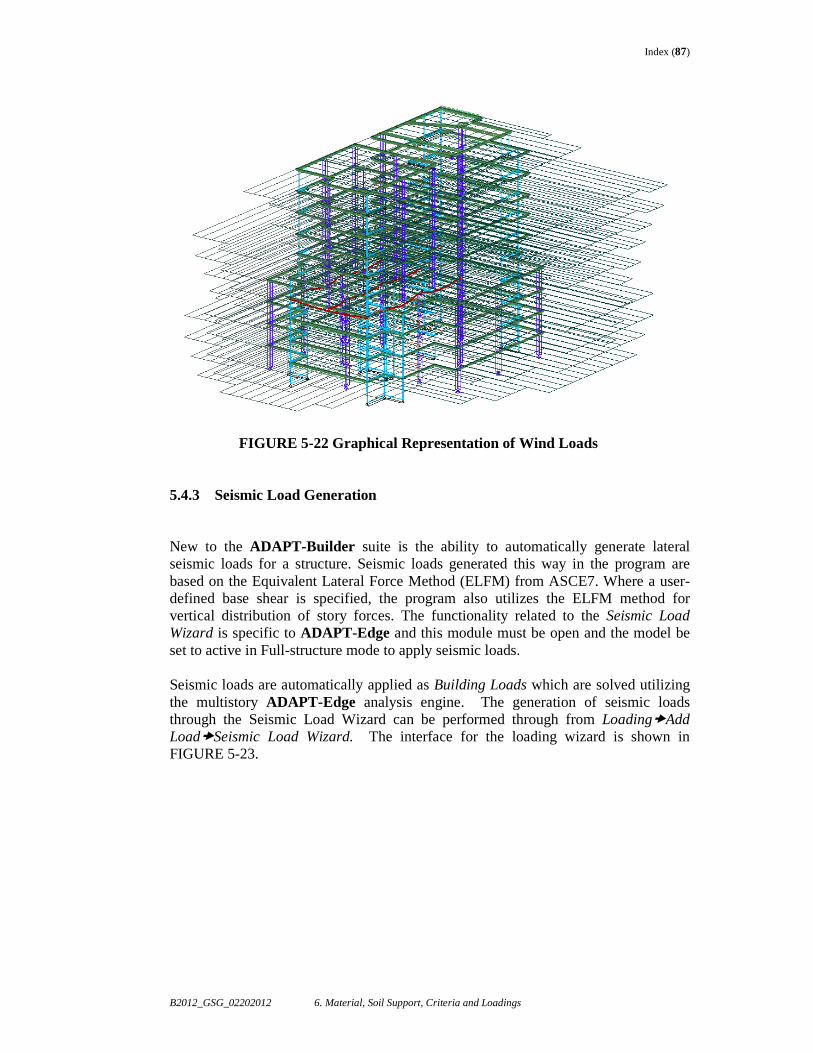
Index (87)
B2012_GSG_02202012 6. Material, Soil Support, Criteria and Loadings
FIGURE 5-22 Graphical Representation of Wind Loads 5.4.3 Seismic Load Generation
New to the ADAPT-Builder suite is the ability to automatically generate lateral seismic loads for a structure. Seismic loads generated this way in the program are based on the Equivalent Lateral Force Method (ELFM) from ASCE7. Where a user-defined base shear is specified, the program also utilizes the ELFM method for vertical distribution of story forces. The functionality related to the Seismic Load Wizard is specific to ADAPT-Edge and this module must be open and the model be set to active in Full-structure mode to apply seismic loads. Seismic loads are automatically applied as Building Loads which are solved utilizing the multistory ADAPT-Edge analysis engine. The generation of seismic loads through the Seismic Load Wizard can be performed through from Loading�Add Load�Seismic Load Wizard. The interface for the loading wizard is shown in FIGURE 5-23.
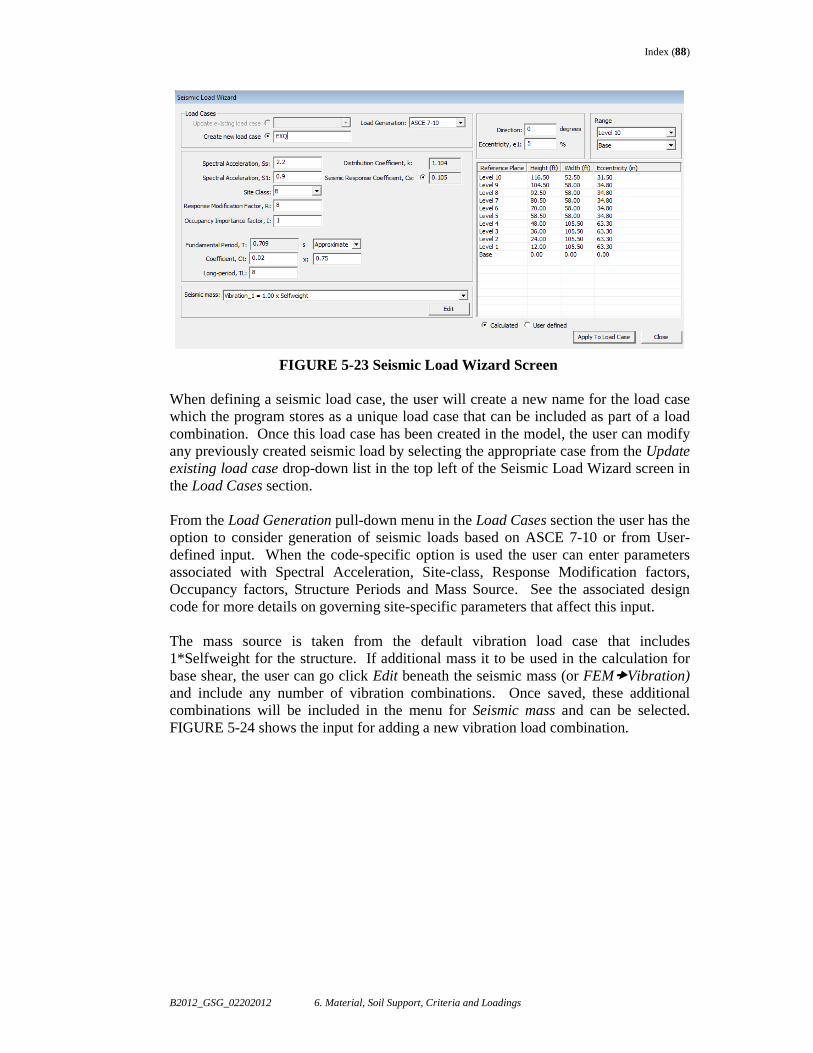
Index (88)
B2012_GSG_02202012 6. Material, Soil Support, Criteria and Loadings
FIGURE 5-23 Seismic Load Wizard Screen When defining a seismic load case, the user will create a new name for the load case which the program stores as a unique load case that can be included as part of a load combination. Once this load case has been created in the model, the user can modify any previously created seismic load by selecting the appropriate case from the Update existing load case drop-down list in the top left of the Seismic Load Wizard screen in the Load Cases section. From the Load Generation pull-down menu in the Load Cases section the user has the option to consider generation of seismic loads based on ASCE 7-10 or from User-defined input. When the code-specific option is used the user can enter parameters associated with Spectral Acceleration, Site-class, Response Modification factors, Occupancy factors, Structure Periods and Mass Source. See the associated design code for more details on governing site-specific parameters that affect this input. The mass source is taken from the default vibration load case that includes 1*Selfweight for the structure. If additional mass it to be used in the calculation for base shear, the user can go click Edit beneath the seismic mass (or FEM�Vibration) and include any number of vibration combinations. Once saved, these additional combinations will be included in the menu for Seismic mass and can be selected. FIGURE 5-24 shows the input for adding a new vibration load combination.
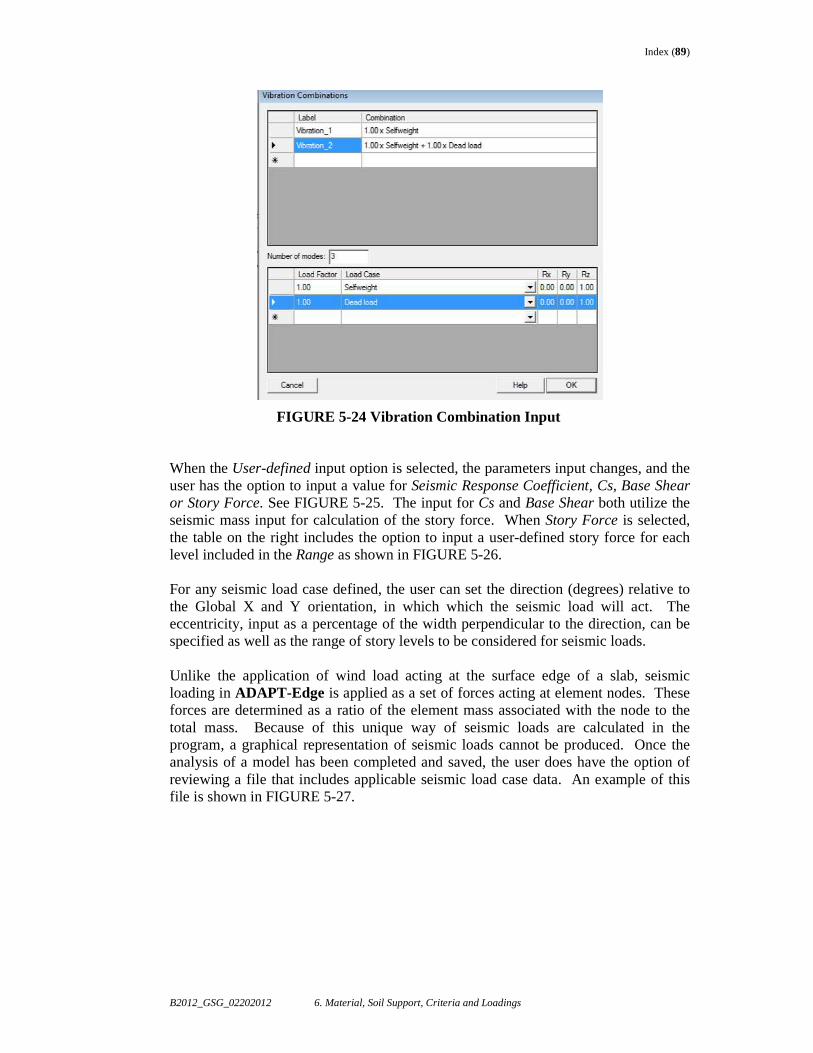
Index (89)
B2012_GSG_02202012 6. Material, Soil Support, Criteria and Loadings
FIGURE 5-24 Vibration Combination Input
When the User-defined input option is selected, the parameters input changes, and the user has the option to input a value for Seismic Response Coefficient, Cs, Base Shear or Story Force. See FIGURE 5-25. The input for Cs and Base Shear both utilize the seismic mass input for calculation of the story force. When Story Force is selected, the table on the right includes the option to input a user-defined story force for each level included in the Range as shown in FIGURE 5-26.
For any seismic load case defined, the user can set the direction (degrees) relative to the Global X and Y orientation, in which which the seismic load will act. The eccentricity, input as a percentage of the width perpendicular to the direction, can be specified as well as the range of story levels to be considered for seismic loads. Unlike the application of wind load acting at the surface edge of a slab, seismic loading in ADAPT-Edge is applied as a set of forces acting at element nodes. These forces are determined as a ratio of the element mass associated with the node to the total mass. Because of this unique way of seismic loads are calculated in the program, a graphical representation of seismic loads cannot be produced. Once the analysis of a model has been completed and saved, the user does have the option of reviewing a file that includes applicable seismic load case data. An example of this file is shown in FIGURE 5-27.
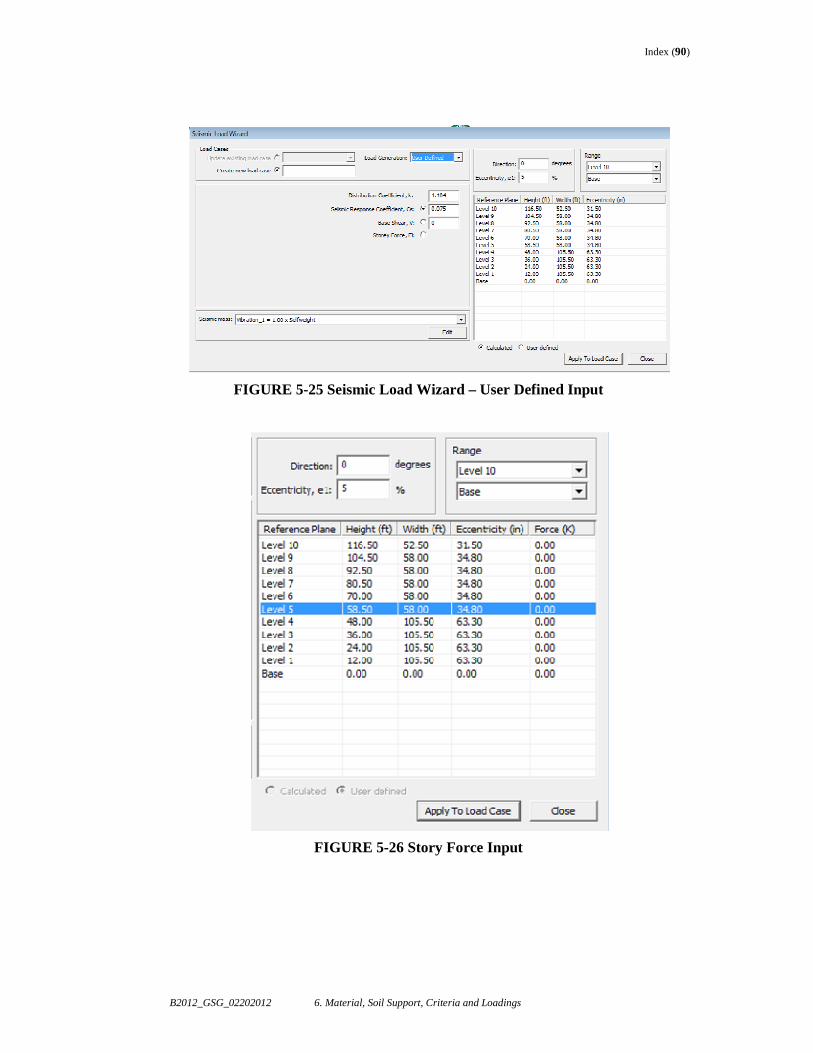
Index (90)
B2012_GSG_02202012 6. Material, Soil Support, Criteria and Loadings
FIGURE 5-25 Seismic Load Wizard – User Defined Input
FIGURE 5-26 Story Force Input
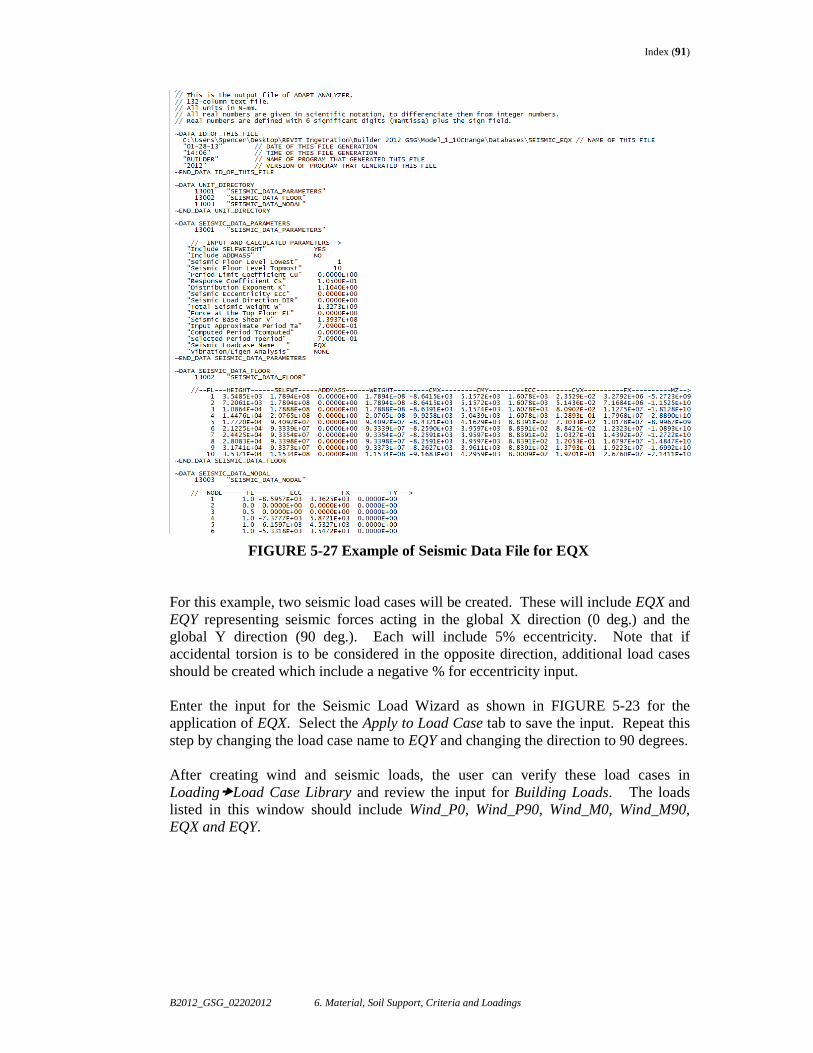
Index (91)
B2012_GSG_02202012 6. Material, Soil Support, Criteria and Loadings
FIGURE 5-27 Example of Seismic Data File for EQX For this example, two seismic load cases will be created. These will include EQX and EQY representing seismic forces acting in the global X direction (0 deg.) and the global Y direction (90 deg.). Each will include 5% eccentricity. Note that if accidental torsion is to be considered in the opposite direction, additional load cases should be created which include a negative % for eccentricity input. Enter the input for the Seismic Load Wizard as shown in FIGURE 5-23 for the application of EQX. Select the Apply to Load Case tab to save the input. Repeat this step by changing the load case name to EQY and changing the direction to 90 degrees. After creating wind and seismic loads, the user can verify these load cases in Loading�Load Case Library and review the input for Building Loads. The loads listed in this window should include Wind_P0, Wind_P90, Wind_M0, Wind_M90, EQX and EQY.

Index (92)
B2012_GSG_02202012 6. Material, Soil Support, Criteria and Loadings
5.4.4 Program Generated Loads
When a model is analyzed in Full-structure mode all load cases are solved for, both Gravity and Building (Lateral) loads. The program has multiple options for reporting graphical and tabular results for structural elements based on the global solution. In situations where load transfer occurs from a level to the level below through discontinuous columns or walls, the loads acting at the “transfer” elements (i.e. beams, thickened slabs) are automatically considered due to the global nature of the analysis. In other words, elements, loads, restraints, etc. are all considered when Full-structure mode is active. After analysis in Full-Structure mode, the user can utilize the global solution for a single level’s design so long as the single level has not been analyzed independently. Once the single level is analyzed in Single-Level mode, the solution is updated and any design would then be governed by the Single-level solution. When the objective is to design a transfer condition for one level and there are discontinuous colunms or walls at that level, two possible scenarios exist:
• If the previous global solution IS NOT overwritten by a new single-level analysis, the design can be performed directly without invoking Program Generated Loads.
• If the previous global solution IS overwritten by a new single-level analysis, the user can add Program Generated Loads to the level being anlalyzed to account for column and wall loads transferring to the level in question. Loading�Add Load�Program Generated Loads. This can be thought of as vertical load “takedown” and is necessary to correctly consider all loads in analysis.
The usefulness of being able to analyze an independent level from a multistory model may present itself often within the context of a project. In some cases, the objective may only to be to design a specfic level or range of levels within a larger model. In this instance, Single-level mode would be useful and practical from a design standpoint. In the event that a multilevel model is mostly complete, but there is a slight architectural change on one level, the user has the ability to update the analysis and design for a single-level while still incorporating lateral loads and load takedown from the global solution. The use of the Program Generated Loads tool is not limited to transfer levels. It can be utilized for any level when in Single-level mode.
For this example, Level 4 consists of several transfer beams which have load from 5 levels above affecting their design. Assuming the global analysis has occurred and we have a solution available, the steps below show how to use the Program Generated Loads.
• In Single-level mode navigate to Level 4.
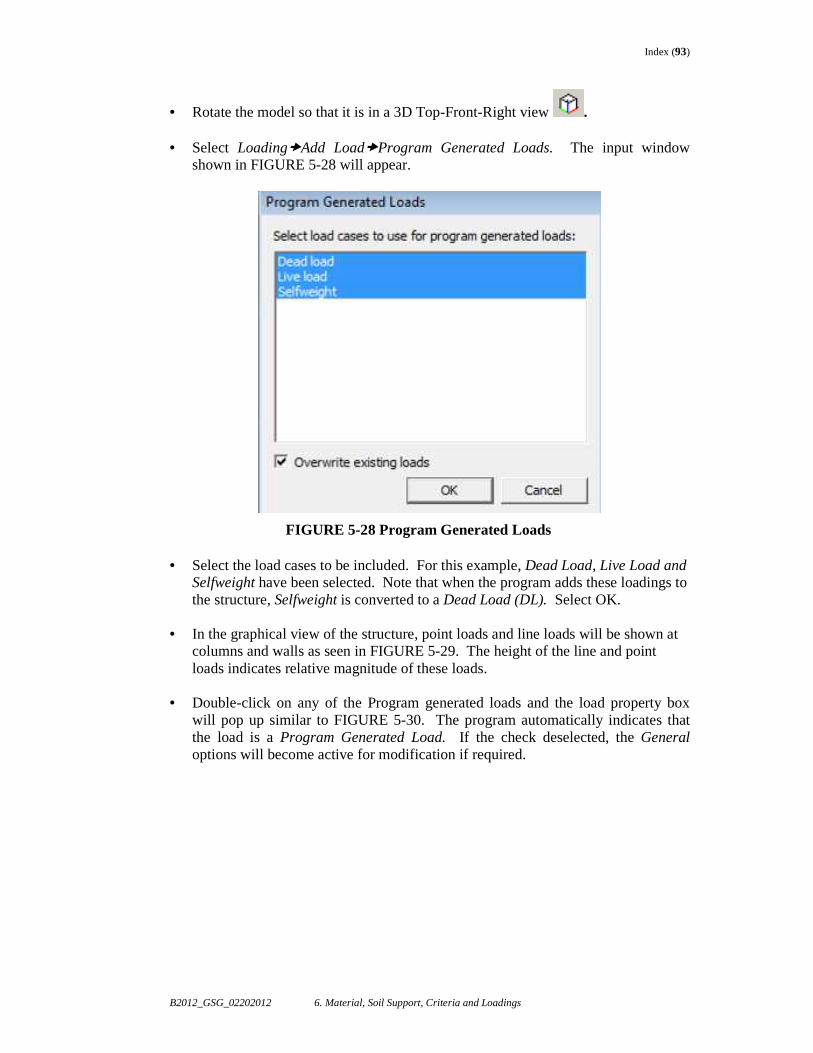
Index (93)
B2012_GSG_02202012 6. Material, Soil Support, Criteria and Loadings
• Rotate the model so that it is in a 3D Top-Front-Right view . • Select Loading�Add Load�Program Generated Loads. The input window
shown in FIGURE 5-28 will appear.
FIGURE 5-28 Program Generated Loads
• Select the load cases to be included. For this example, Dead Load, Live Load and Selfweight have been selected. Note that when the program adds these loadings to the structure, Selfweight is converted to a Dead Load (DL). Select OK.
• In the graphical view of the structure, point loads and line loads will be shown at
columns and walls as seen in FIGURE 5-29. The height of the line and point loads indicates relative magnitude of these loads.
• Double-click on any of the Program generated loads and the load property box
will pop up similar to FIGURE 5-30. The program automatically indicates that the load is a Program Generated Load. If the check deselected, the General options will become active for modification if required.
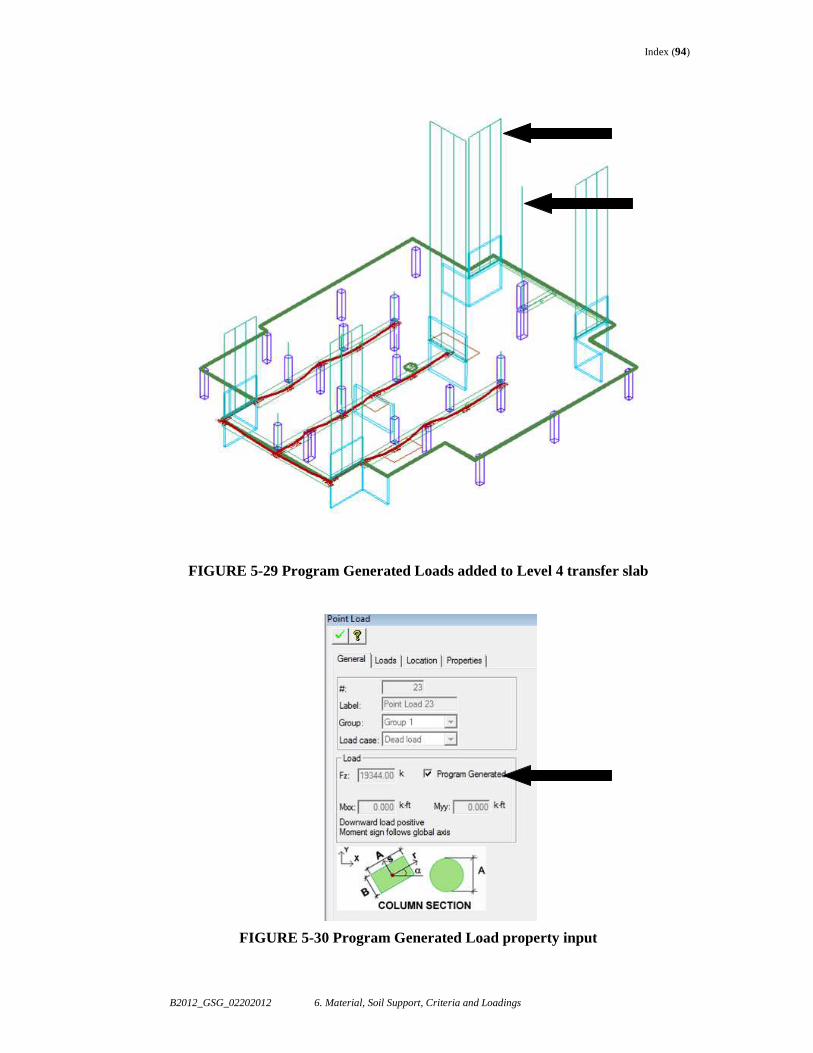
Index (94)
B2012_GSG_02202012 6. Material, Soil Support, Criteria and Loadings
FIGURE 5-29 Program Generated Loads added to Level 4 transfer slab
FIGURE 5-30 Program Generated Load property input
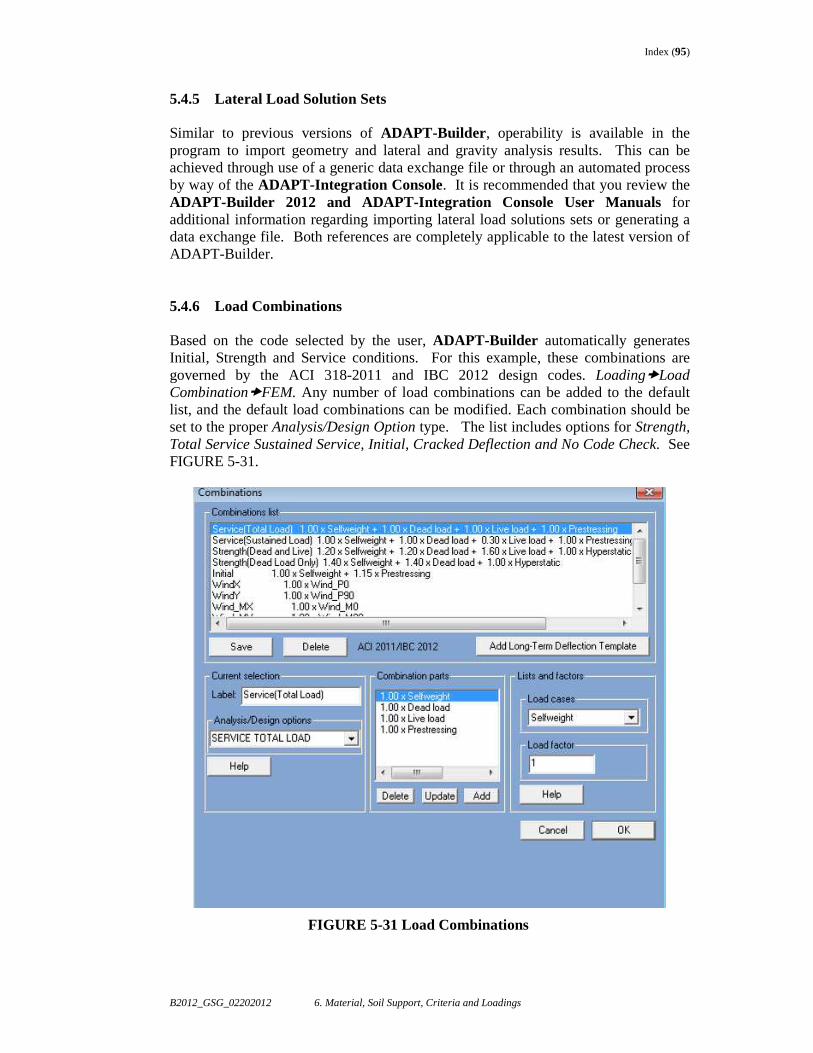
Index (95)
B2012_GSG_02202012 6. Material, Soil Support, Criteria and Loadings
5.4.5 Lateral Load Solution Sets Similar to previous versions of ADAPT-Builder , operability is available in the program to import geometry and lateral and gravity analysis results. This can be achieved through use of a generic data exchange file or through an automated process by way of the ADAPT-Integration Console. It is recommended that you review the ADAPT-Builder 2012 and ADAPT-Integration Console User Manuals for additional information regarding importing lateral load solutions sets or generating a data exchange file. Both references are completely applicable to the latest version of ADAPT-Builder. 5.4.6 Load Combinations
Based on the code selected by the user, ADAPT-Builder automatically generates Initial, Strength and Service conditions. For this example, these combinations are governed by the ACI 318-2011 and IBC 2012 design codes. Loading�Load Combination�FEM. Any number of load combinations can be added to the default list, and the default load combinations can be modified. Each combination should be set to the proper Analysis/Design Option type. The list includes options for Strength, Total Service Sustained Service, Initial, Cracked Deflection and No Code Check. See FIGURE 5-31.
FIGURE 5-31 Load Combinations
Index (96)
B2012_GSG_02202012 6. Material, Soil Support, Criteria and Loadings
Load combinations defined as Strength under Analysis/Design options will be designed for ultimate demand. The program will design and report flexural and shear reinforcement which provides enough capacity to satisfy the demand actions. The program does not check deflections for load combinations set to Strength when the Hyperstatic (Secondary actions) load case is included in a Strength combination. By default, when post-tensioning is included in a model, the Hyperstatic load case is included for ultimate design. When a load combination is set to Total or Sustained Service condition, the program designs reinforcement based on minimum/serviceability requirements per the design code selected. The program does not add reinforcement to satisfy demand actions resulting from service load combinations unless prescriptive code requirements stipulate that such a check be performed. The program calculates deflections for service combinations based on un-cracked, elastic material properties. The program also makes checks for allowable stresses, balanced loading and precompression for service combinations. When post-tensioning is included in a model, the Prestressing load case is included in Service load combinations. The Initial load combination is also considered a service condition. However, it is specific to post-tensioned design and generally is used for determination of stresses and deflections at force transfer of a post-tensioned slab. The program treats this combination similar to other service combinations with respect to reinforcement design, stress checks, deflections, etc. Many designs require that post-elastic, long-term behavior be evaluated for serviceability of the structure during its service life. This requires that cracked, long-term deflections accounting for the effects of creep, shrinkage and other parameters associated with time-dependent behavior of concrete be accounted for. The user can define load combinations to check for deflection based on an analysis which considers the post-elastic response from reduced stiffness of elements where cracking occurs by selecting the Cracked Deflection option under Analysis/Design options. In these cases, the program will solve for solutions of the load combination under both cracked and uncracked conditions, giving the user the ability to see the difference due to cracking of the structure. For this example, we will use the Long-term Deflection Template option to introduce an automated method to include such combinations into a design. However, the results of these combinations will not be investigated. The purpose is to display how the combinations can be included in a model. For a more in-depth description of the program’s capabilities with respect to cracked, long-term deflections, see the ADAPT-Builder 2012 User Manual. The option for No Code Check simply allows the user to obtain a solution for a specific combination. The program does not design reinforcement or perform any other design checks for the combination. Deflections are reported for the combination unless the Hyperstatic load case is included. This design/analysis option is generally used to isolate individual load cases for validation or to understand behavior. FIGURE 5-31 shows the Load Combination input window. The pull-down menu for Load cases includes a list of all gravity and building loads included in the model.
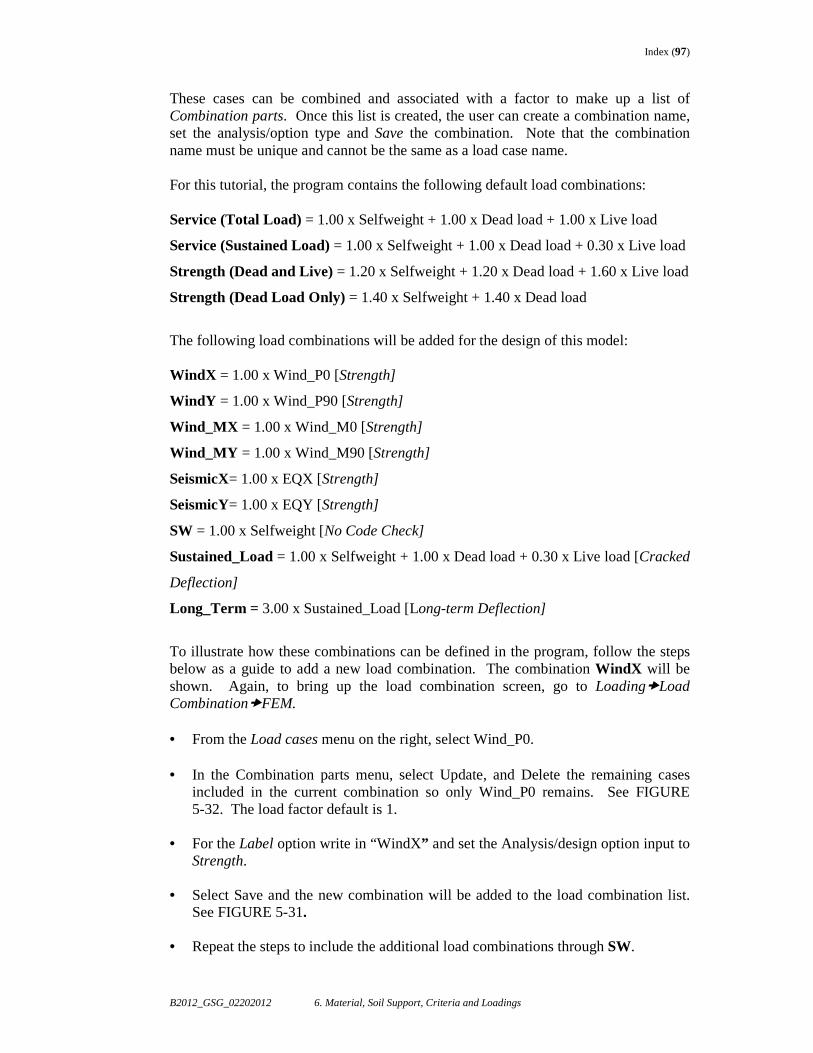
Index (97)
B2012_GSG_02202012 6. Material, Soil Support, Criteria and Loadings
These cases can be combined and associated with a factor to make up a list of Combination parts. Once this list is created, the user can create a combination name, set the analysis/option type and Save the combination. Note that the combination name must be unique and cannot be the same as a load case name.
For this tutorial, the program contains the following default load combinations:
Service (Total Load) = 1.00 x Selfweight + 1.00 x Dead load + 1.00 x Live load
Service (Sustained Load) = 1.00 x Selfweight + 1.00 x Dead load + 0.30 x Live load
Strength (Dead and Live) = 1.20 x Selfweight + 1.20 x Dead load + 1.60 x Live load
Strength (Dead Load Only) = 1.40 x Selfweight + 1.40 x Dead load
The following load combinations will be added for the design of this model: WindX = 1.00 x Wind_P0 [Strength]
WindY = 1.00 x Wind_P90 [Strength]
Wind_MX = 1.00 x Wind_M0 [Strength]
Wind_MY = 1.00 x Wind_M90 [Strength]
SeismicX= 1.00 x EQX [Strength]
SeismicY= 1.00 x EQY [Strength]
SW = 1.00 x Selfweight [No Code Check]
Sustained_Load = 1.00 x Selfweight + 1.00 x Dead load + 0.30 x Live load [Cracked
Deflection]
Long_Term = 3.00 x Sustained_Load [Long-term Deflection]
To illustrate how these combinations can be defined in the program, follow the steps below as a guide to add a new load combination. The combination WindX will be shown. Again, to bring up the load combination screen, go to Loading�Load Combination�FEM. • From the Load cases menu on the right, select Wind_P0.
• In the Combination parts menu, select Update, and Delete the remaining cases
included in the current combination so only Wind_P0 remains. See FIGURE 5-32. The load factor default is 1.
• For the Label option write in “WindX” and set the Analysis/design option input to
Strength. • Select Save and the new combination will be added to the load combination list.
See FIGURE 5-31. • Repeat the steps to include the additional load combinations through SW.
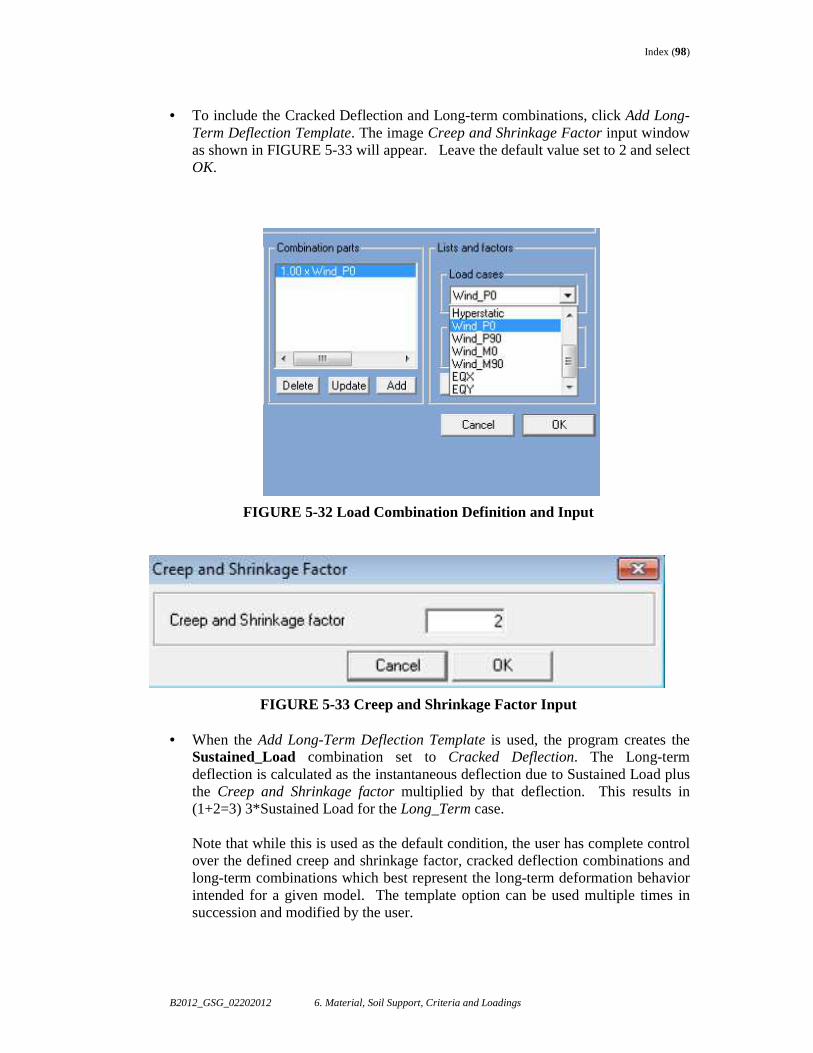
Index (98)
B2012_GSG_02202012 6. Material, Soil Support, Criteria and Loadings
• To include the Cracked Deflection and Long-term combinations, click Add Long-
Term Deflection Template. The image Creep and Shrinkage Factor input window as shown in FIGURE 5-33 will appear. Leave the default value set to 2 and select OK.
FIGURE 5-32 Load Combination Definition and Input
FIGURE 5-33 Creep and Shrinkage Factor Input • When the Add Long-Term Deflection Template is used, the program creates the
Sustained_Load combination set to Cracked Deflection. The Long-term deflection is calculated as the instantaneous deflection due to Sustained Load plus the Creep and Shrinkage factor multiplied by that deflection. This results in (1+2=3) 3*Sustained Load for the Long_Term case.
Note that while this is used as the default condition, the user has complete control over the defined creep and shrinkage factor, cracked deflection combinations and long-term combinations which best represent the long-term deformation behavior intended for a given model. The template option can be used multiple times in succession and modified by the user.
Index (99)
B2012_GSG_02202012 8. Generation of Support Lines and Use of Splitters
6 FINITE ELEMENT MESHING, ANALYSIS, AND VIEW RESULTS
6.1 GENERATION OF FINITE ELEMENT MESH
The modeling of structures in ADAPT-Builder represents an object-oriented modeling approach where the physical components are represented with their given dimension and orientation with respect to the global model. This approach allows flexible modeling of components which best describes how the components would actually be constructed and connected. The meshing algorithm within ADAPT-Builder is tuned to handle complex geometries and component arrangements by way of the Node Consolidation feature. Within the context of this guide, the objective is to show the user how to generate a suitable mesh that allows the global model analysis to be completed and a solution realized. A more comprehensive overview of meshing in ADAPT-Builder can be found in the ADAPT-Builder 2012 User Manual. Once a model has been completed and is ready for analysis, the meshing can be performed. Note that meshing formulation is similar for a global structure as compared to a single-level analysis. If errors occur during the meshing sequence, the program will report back the errors, regardless of what building mode you are working in. By default the program uses a Sparse Mesh composed of quadrilateral shell elements. Beams and columns are composed of frame elements along their length. At the onset of an analysis operation, the program generates the vertical wall mesh in which node compatibility is maintained with the horizontal set of analysis nodes representing at corners of shell elements. The wall mesh can only be viewed after the analysis has been completed. For a more consistent pattern of shell elements, the option for Uniform Mesh can be selected from Criteria�Analysis/Design Options�Meshing. This generally results in a mesh pattern which is more closely spaced containing smaller shell elements. Such a pattern will require longer computation times compared to a Sparse Mesh of the same model. If a mesh has been generated for a multi-level model, the mesh for any single level can be used for an independent level analysis. In other words, that level does not require a re-mesh unless components have been modified, loading has been added or removed or tendons have been added or removed. For this example, the Sparse option will be used. Follow the steps below to mesh the global model.
• Ensure that the model is being viewed in full-structure 3D view .
• Go to FEM�Automatic Mesh Generation. The meshing settings as shown in FIGURE 6-1 will be displayed.
• The default cell size for the mesh is 3 feet and the default node shift size is set to 1.5
feet. We will use the default values and select OK.
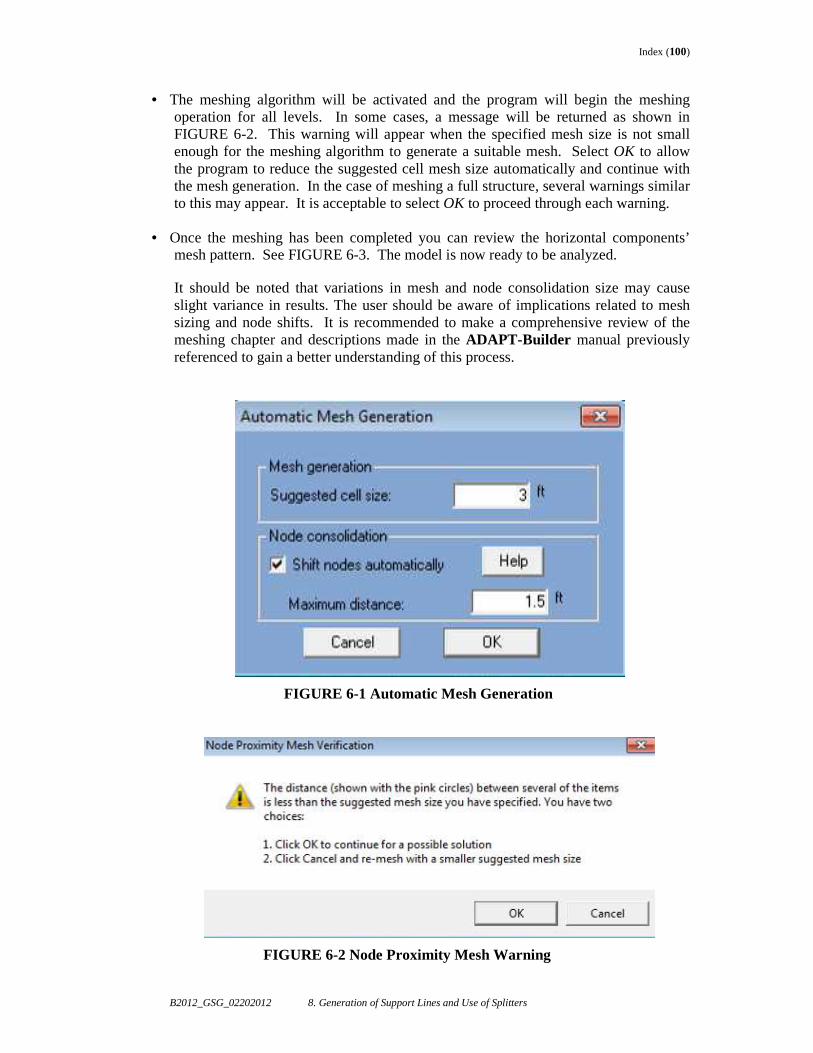
Index (100)
B2012_GSG_02202012 8. Generation of Support Lines and Use of Splitters
• The meshing algorithm will be activated and the program will begin the meshing operation for all levels. In some cases, a message will be returned as shown in FIGURE 6-2. This warning will appear when the specified mesh size is not small enough for the meshing algorithm to generate a suitable mesh. Select OK to allow the program to reduce the suggested cell mesh size automatically and continue with the mesh generation. In the case of meshing a full structure, several warnings similar to this may appear. It is acceptable to select OK to proceed through each warning.
• Once the meshing has been completed you can review the horizontal components’
mesh pattern. See FIGURE 6-3. The model is now ready to be analyzed. It should be noted that variations in mesh and node consolidation size may cause slight variance in results. The user should be aware of implications related to mesh sizing and node shifts. It is recommended to make a comprehensive review of the meshing chapter and descriptions made in the ADAPT-Builder manual previously referenced to gain a better understanding of this process.
FIGURE 6-1 Automatic Mesh Generation
FIGURE 6-2 Node Proximity Mesh Warning
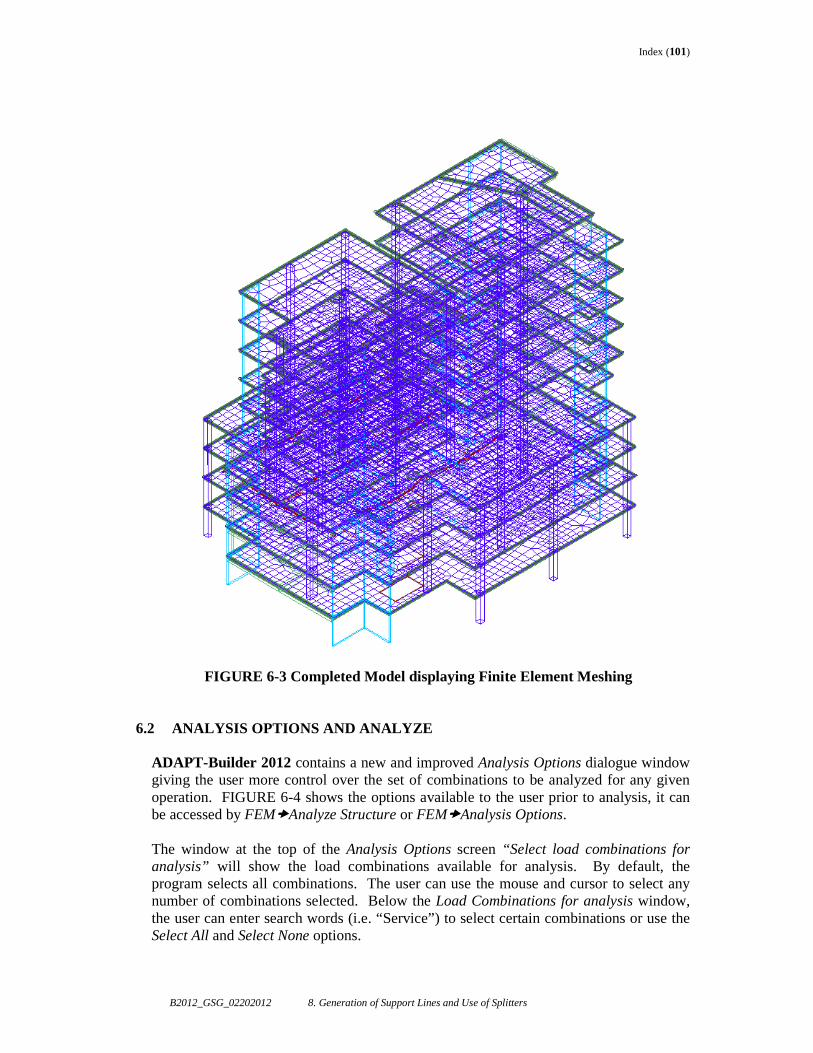
Index (101)
B2012_GSG_02202012 8. Generation of Support Lines and Use of Splitters
FIGURE 6-3 Completed Model displaying Finite Element Meshing
6.2 ANALYSIS OPTIONS AND ANALYZE ADAPT-Builder 2012 contains a new and improved Analysis Options dialogue window giving the user more control over the set of combinations to be analyzed for any given operation. FIGURE 6-4 shows the options available to the user prior to analysis, it can be accessed by FEM�Analyze Structure or FEM�Analysis Options. The window at the top of the Analysis Options screen “Select load combinations for analysis” will show the load combinations available for analysis. By default, the program selects all combinations. The user can use the mouse and cursor to select any number of combinations selected. Below the Load Combinations for analysis window, the user can enter search words (i.e. “Service”) to select certain combinations or use the Select All and Select None options.
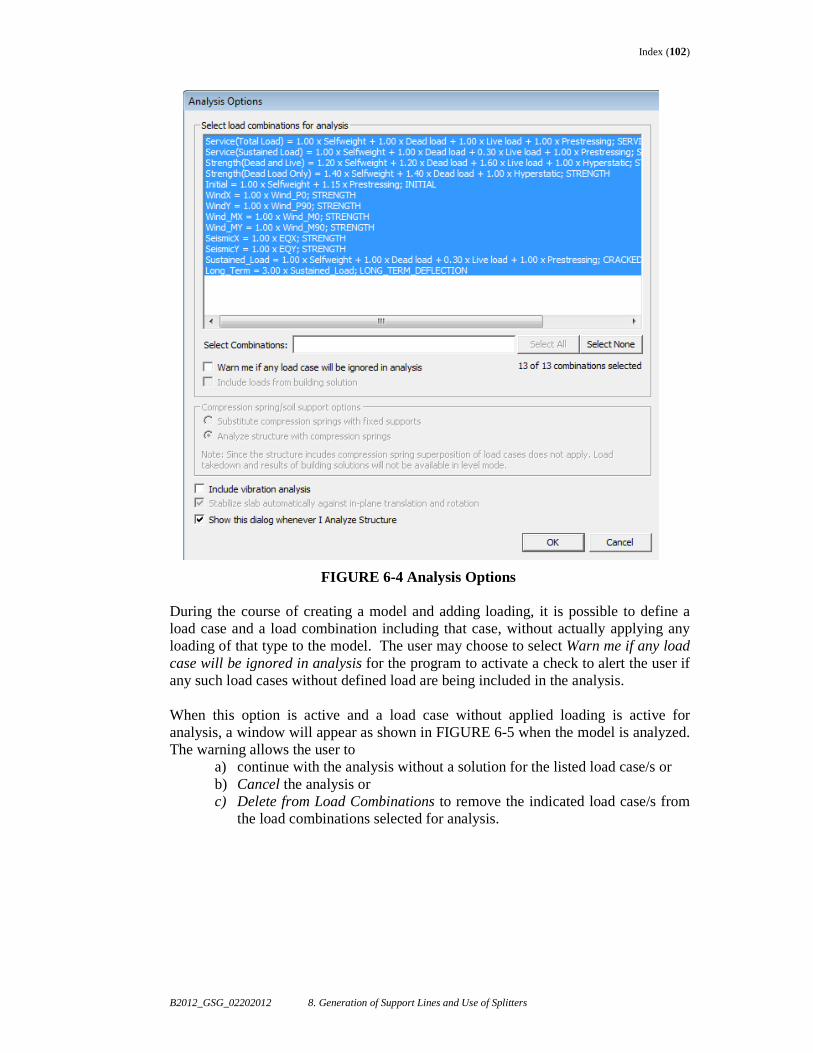
Index (102)
B2012_GSG_02202012 8. Generation of Support Lines and Use of Splitters
FIGURE 6-4 Analysis Options
During the course of creating a model and adding loading, it is possible to define a load case and a load combination including that case, without actually applying any loading of that type to the model. The user may choose to select Warn me if any load case will be ignored in analysis for the program to activate a check to alert the user if any such load cases without defined load are being included in the analysis. When this option is active and a load case without applied loading is active for analysis, a window will appear as shown in FIGURE 6-5 when the model is analyzed. The warning allows the user to
a) continue with the analysis without a solution for the listed load case/s or b) Cancel the analysis or c) Delete from Load Combinations to remove the indicated load case/s from
the load combinations selected for analysis.
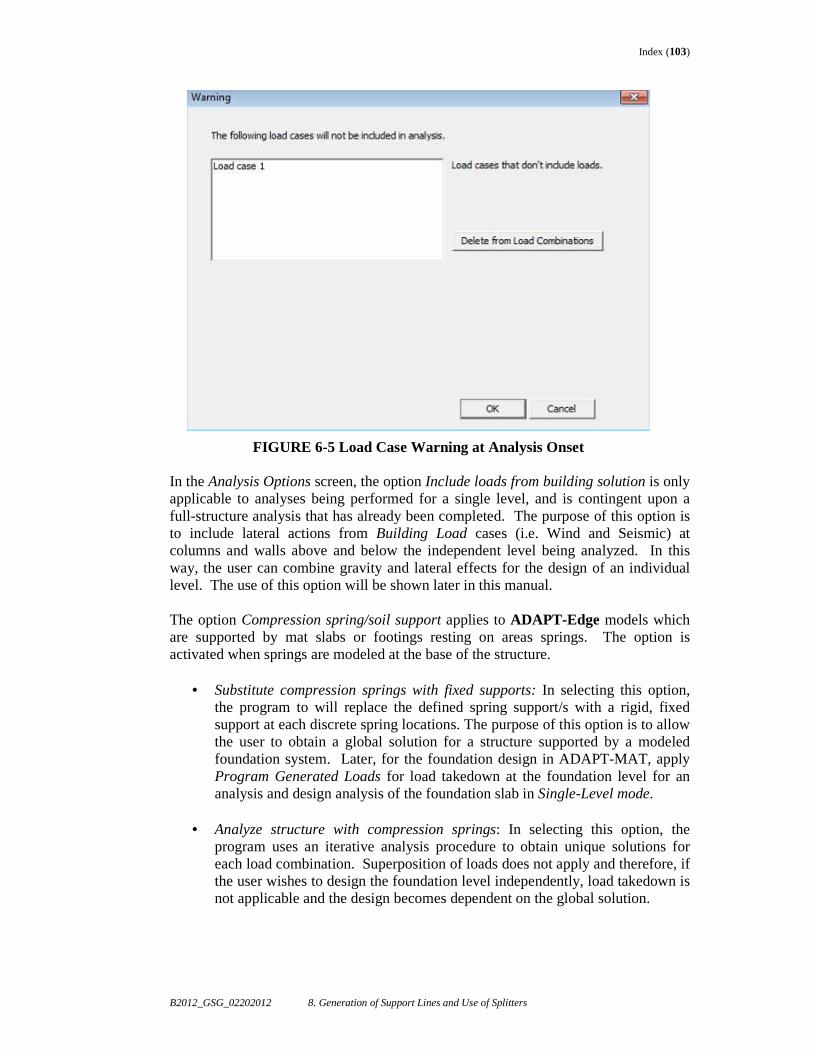
Index (103)
B2012_GSG_02202012 8. Generation of Support Lines and Use of Splitters
FIGURE 6-5 Load Case Warning at Analysis Onset In the Analysis Options screen, the option Include loads from building solution is only applicable to analyses being performed for a single level, and is contingent upon a full-structure analysis that has already been completed. The purpose of this option is to include lateral actions from Building Load cases (i.e. Wind and Seismic) at columns and walls above and below the independent level being analyzed. In this way, the user can combine gravity and lateral effects for the design of an individual level. The use of this option will be shown later in this manual. The option Compression spring/soil support applies to ADAPT-Edge models which are supported by mat slabs or footings resting on areas springs. The option is activated when springs are modeled at the base of the structure.
• Substitute compression springs with fixed supports: In selecting this option, the program to will replace the defined spring support/s with a rigid, fixed support at each discrete spring locations. The purpose of this option is to allow the user to obtain a global solution for a structure supported by a modeled foundation system. Later, for the foundation design in ADAPT-MAT, apply Program Generated Loads for load takedown at the foundation level for an analysis and design analysis of the foundation slab in Single-Level mode.
• Analyze structure with compression springs: In selecting this option, the
program uses an iterative analysis procedure to obtain unique solutions for each load combination. Superposition of loads does not apply and therefore, if the user wishes to design the foundation level independently, load takedown is not applicable and the design becomes dependent on the global solution.
Index (104)
B2012_GSG_02202012 8. Generation of Support Lines and Use of Splitters
If the intent is to analyze and design a foundation level, it is recommended the first option be used. A design workflow for these settings will be shown later in this manual.
Include Vibration Analysis initiates a vibration analysis for each level. If this option is invoked, the program will report mode frequency and period for each level. This data can be used to perform a vibration check. Vibration analysis is outside the scope of this guide. For additional information regarding this option see the ADAPT-Floor Pro 2012 User Manual. Stabilize slab automatically against in-plane translation and rotation is active only when an analyzing a single level, in which case the option is selected by default. The default support condition for Single-level mode is a fixed-roller, allowing for translational freedom in the global X and Y directions. This condition is meant to mimic an elevated level in a multistory model and to allow for free shortening of the slab when post-tensioning is used. The user has the flexibility to (a) modify the support conditions, as described earlier, and/or (b) to deactivate the stability option. The last option gives the user the option for the screen to be repeated when the Analyze Structure option is used from the FEM menu. The intent is to allow the user to review settings before analysis in the event Analysis Options have changed or were not set prior to the analysis. To analyze the model, go to FEM�Analyze Structure and change the settings as shown in FIGURE 6-4 and select OK. During the course of the analysis, several windows may appear providing a status of % completion and some solution statistics. Once the analysis has been completed, the program will prompt you to save the solution. See FIGURE 6-6. Select Yes.
FIGURE 6-6 Analysis Status
6.3 VIEWING ANALYSIS RESULTS
The following sections describe methods by which graphical or tabular analysis results can be viewed in ADAPT-Edge. The preceding sections described the modeling and analysis process in using Edge independently without having ADAPT-Floor Pro or ADAPT-MAT activated for integrated analysis and design. Hence, the results will be applicable only to the analysis solution. Design results will be discussed in Sections 7 and 8.
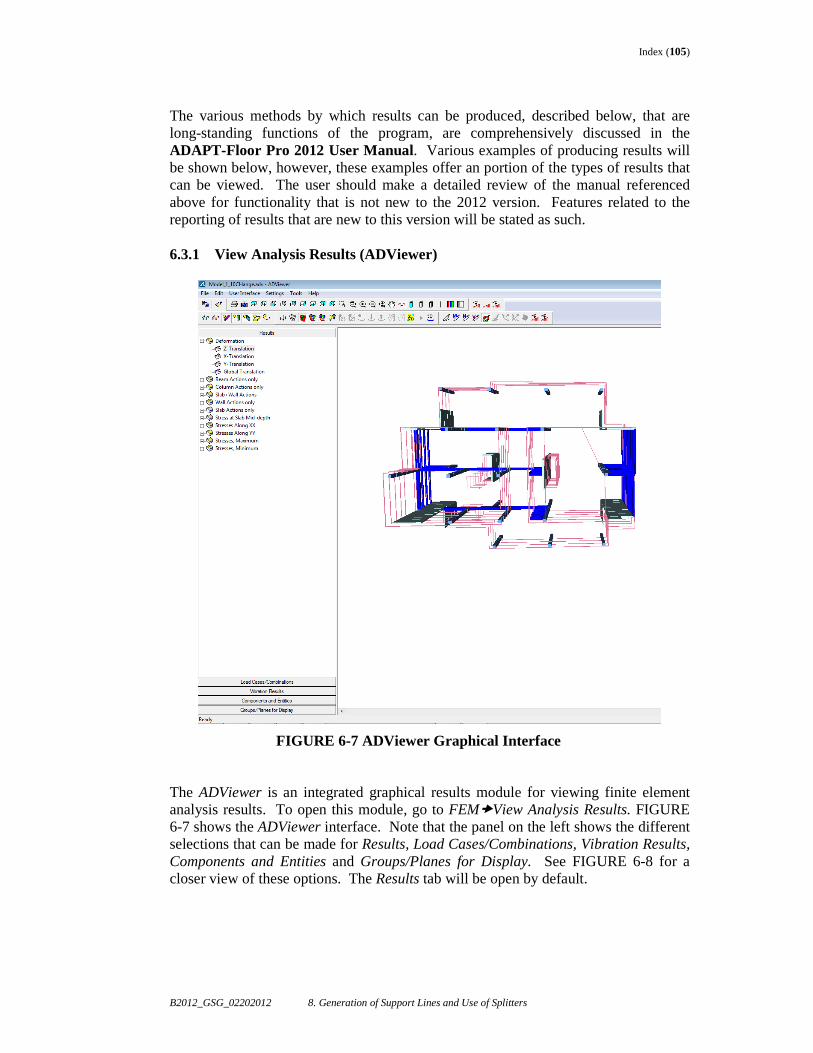
Index (105)
B2012_GSG_02202012 8. Generation of Support Lines and Use of Splitters
The various methods by which results can be produced, described below, that are long-standing functions of the program, are comprehensively discussed in the ADAPT-Floor Pro 2012 User Manual. Various examples of producing results will be shown below, however, these examples offer an portion of the types of results that can be viewed. The user should make a detailed review of the manual referenced above for functionality that is not new to the 2012 version. Features related to the reporting of results that are new to this version will be stated as such. 6.3.1 View Analysis Results (ADViewer)
FIGURE 6-7 ADViewer Graphical Interface The ADViewer is an integrated graphical results module for viewing finite element analysis results. To open this module, go to FEM�View Analysis Results. FIGURE 6-7 shows the ADViewer interface. Note that the panel on the left shows the different selections that can be made for Results, Load Cases/Combinations, Vibration Results, Components and Entities and Groups/Planes for Display. See FIGURE 6-8 for a closer view of these options. The Results tab will be open by default.
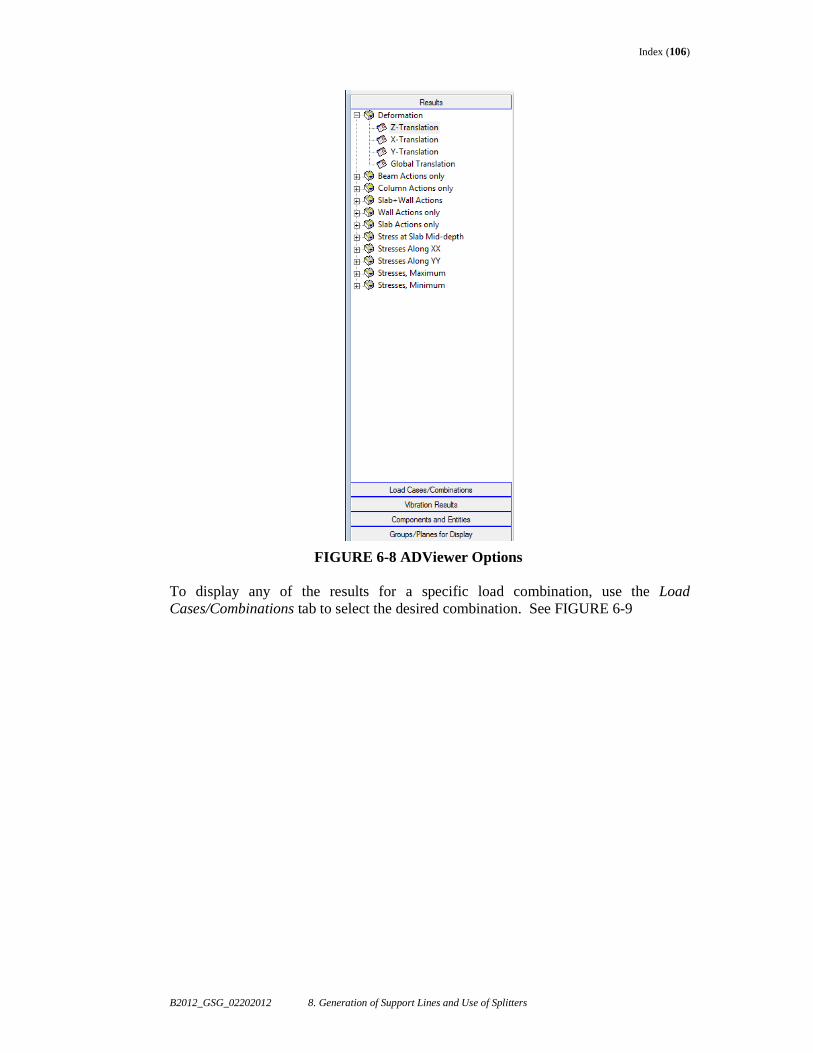
Index (106)
B2012_GSG_02202012 8. Generation of Support Lines and Use of Splitters
FIGURE 6-8 ADViewer Options To display any of the results for a specific load combination, use the Load Cases/Combinations tab to select the desired combination. See FIGURE 6-9
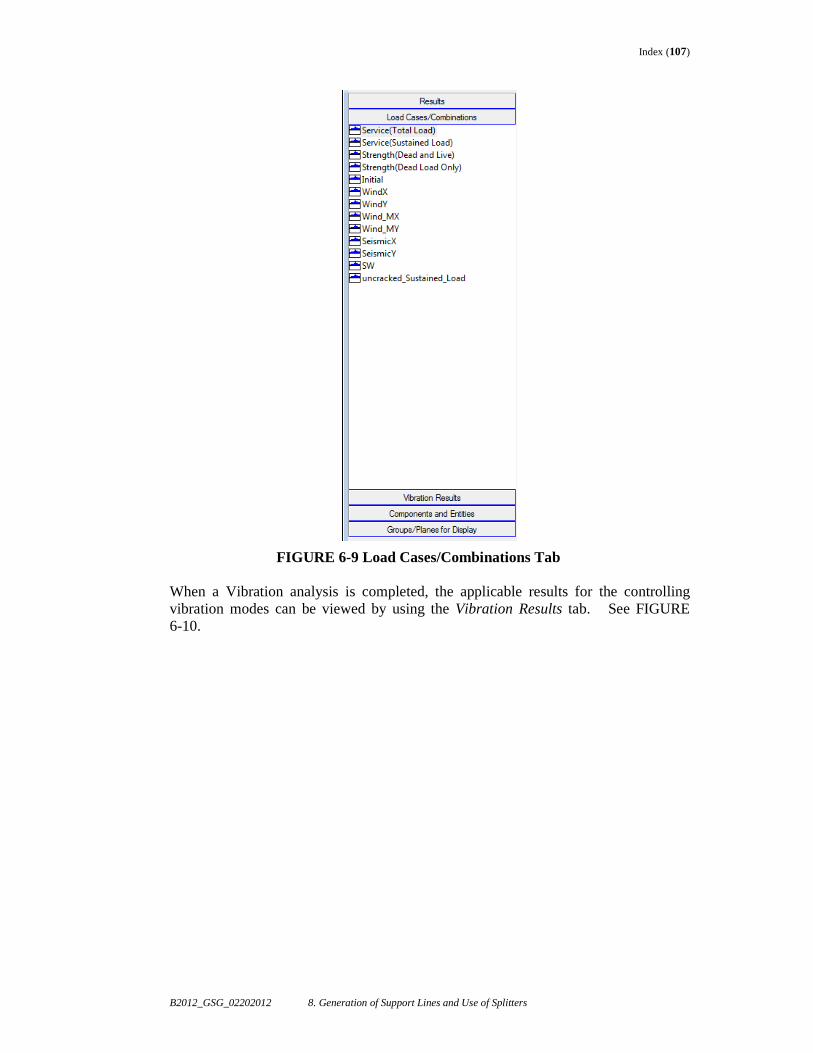
Index (107)
B2012_GSG_02202012 8. Generation of Support Lines and Use of Splitters
FIGURE 6-9 Load Cases/Combinations Tab When a Vibration analysis is completed, the applicable results for the controlling vibration modes can be viewed by using the Vibration Results tab. See FIGURE 6-10.
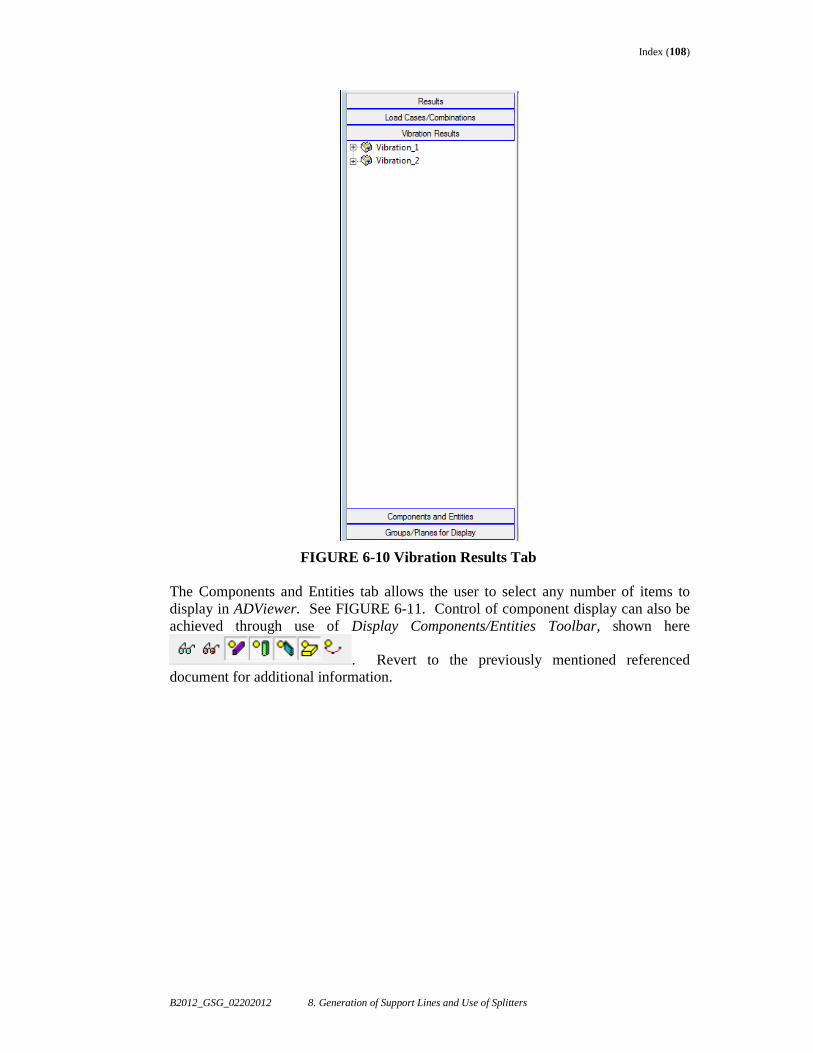
Index (108)
B2012_GSG_02202012 8. Generation of Support Lines and Use of Splitters
FIGURE 6-10 Vibration Results Tab The Components and Entities tab allows the user to select any number of items to display in ADViewer. See FIGURE 6-11. Control of component display can also be achieved through use of Display Components/Entities Toolbar, shown here
. Revert to the previously mentioned referenced document for additional information.
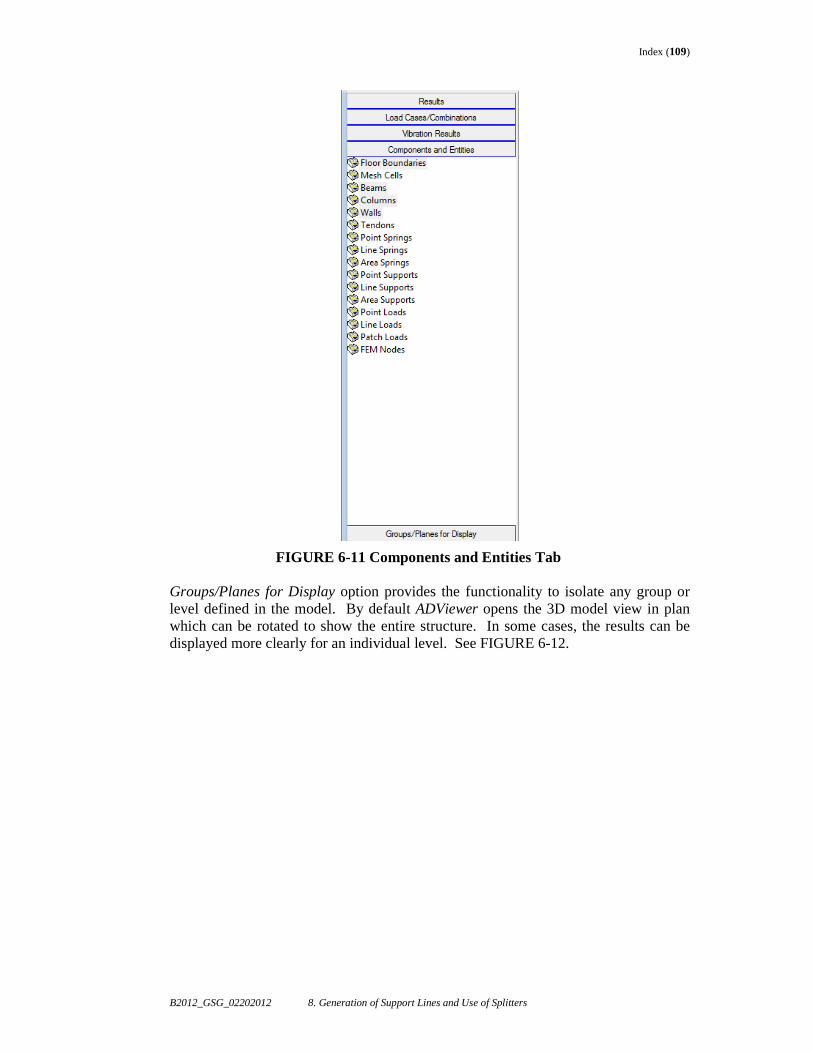
Index (109)
B2012_GSG_02202012 8. Generation of Support Lines and Use of Splitters
FIGURE 6-11 Components and Entities Tab Groups/Planes for Display option provides the functionality to isolate any group or level defined in the model. By default ADViewer opens the 3D model view in plan which can be rotated to show the entire structure. In some cases, the results can be displayed more clearly for an individual level. See FIGURE 6-12.
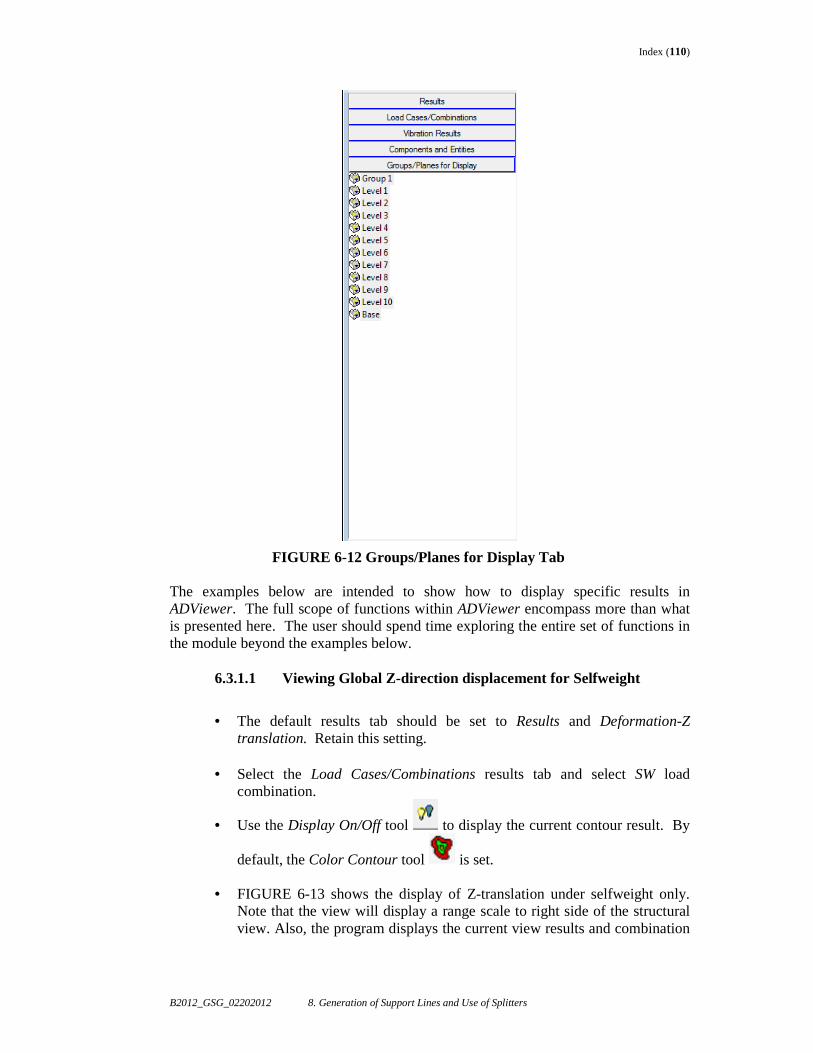
Index (110)
B2012_GSG_02202012 8. Generation of Support Lines and Use of Splitters
FIGURE 6-12 Groups/Planes for Display Tab The examples below are intended to show how to display specific results in ADViewer. The full scope of functions within ADViewer encompass more than what is presented here. The user should spend time exploring the entire set of functions in the module beyond the examples below.
6.3.1.1 Viewing Global Z-direction displacement for Selfweight
• The default results tab should be set to Results and Deformation-Z
translation. Retain this setting.
• Select the Load Cases/Combinations results tab and select SW load combination.
• Use the Display On/Off tool to display the current contour result. By
default, the Color Contour tool is set.
• FIGURE 6-13 shows the display of Z-translation under selfweight only. Note that the view will display a range scale to right side of the structural view. Also, the program displays the current view results and combination
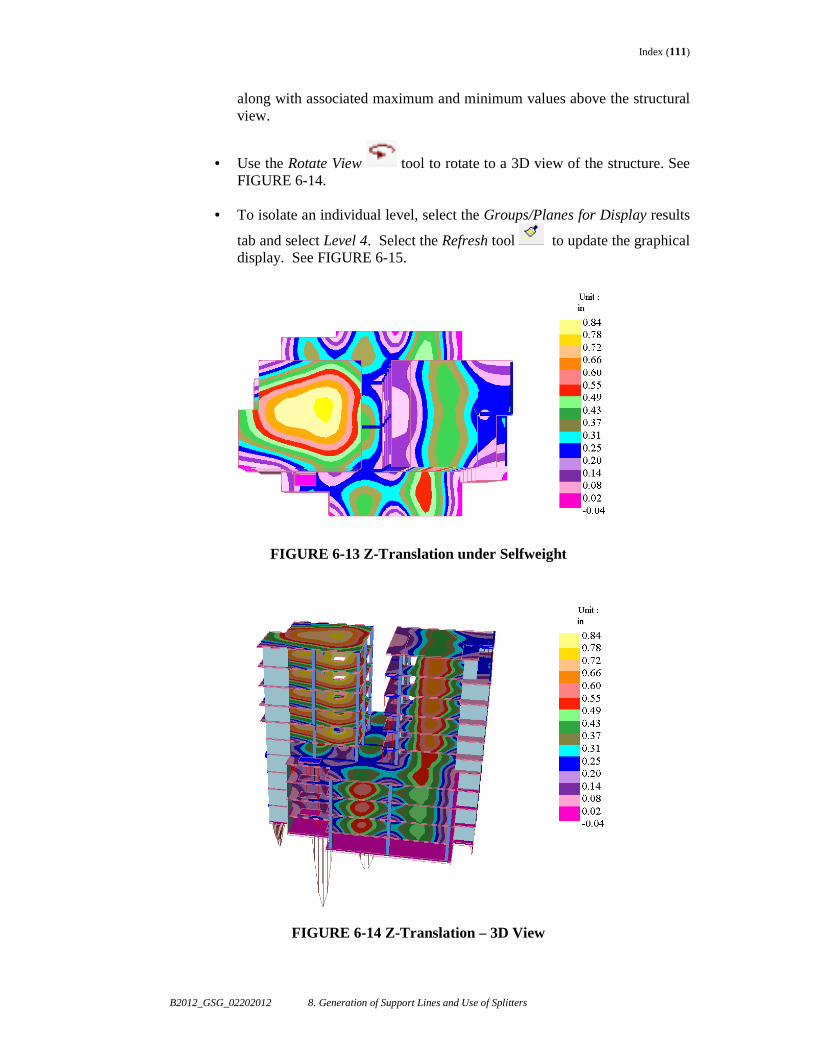
Index (111)
B2012_GSG_02202012 8. Generation of Support Lines and Use of Splitters
along with associated maximum and minimum values above the structural view.
• Use the Rotate View tool to rotate to a 3D view of the structure. See FIGURE 6-14.
• To isolate an individual level, select the Groups/Planes for Display results
tab and select Level 4. Select the Refresh tool to update the graphical display. See FIGURE 6-15.
FIGURE 6-13 Z-Translation under Selfweight
FIGURE 6-14 Z-Translation – 3D View
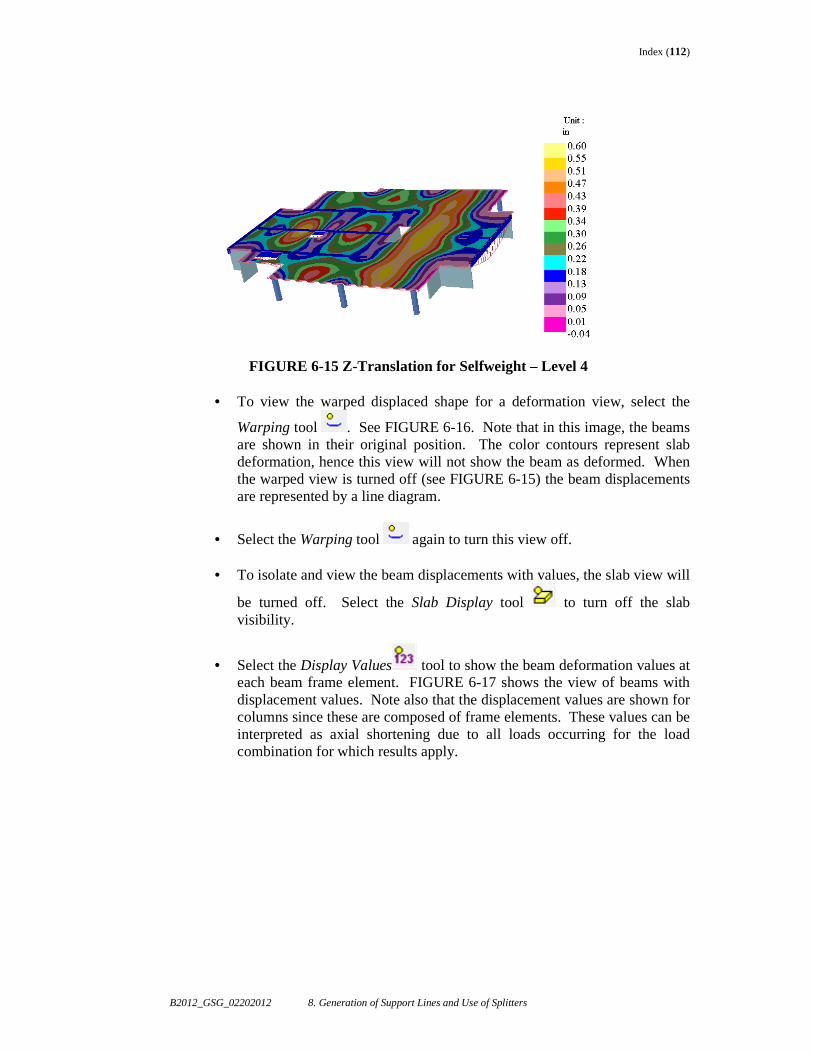
Index (112)
B2012_GSG_02202012 8. Generation of Support Lines and Use of Splitters
FIGURE 6-15 Z-Translation for Selfweight – Level 4
• To view the warped displaced shape for a deformation view, select the
Warping tool . See FIGURE 6-16. Note that in this image, the beams are shown in their original position. The color contours represent slab deformation, hence this view will not show the beam as deformed. When the warped view is turned off (see FIGURE 6-15) the beam displacements are represented by a line diagram.
• Select the Warping tool again to turn this view off.
• To isolate and view the beam displacements with values, the slab view will
be turned off. Select the Slab Display tool to turn off the slab visibility.
• Select the Display Values tool to show the beam deformation values at each beam frame element. FIGURE 6-17 shows the view of beams with displacement values. Note also that the displacement values are shown for columns since these are composed of frame elements. These values can be interpreted as axial shortening due to all loads occurring for the load combination for which results apply.
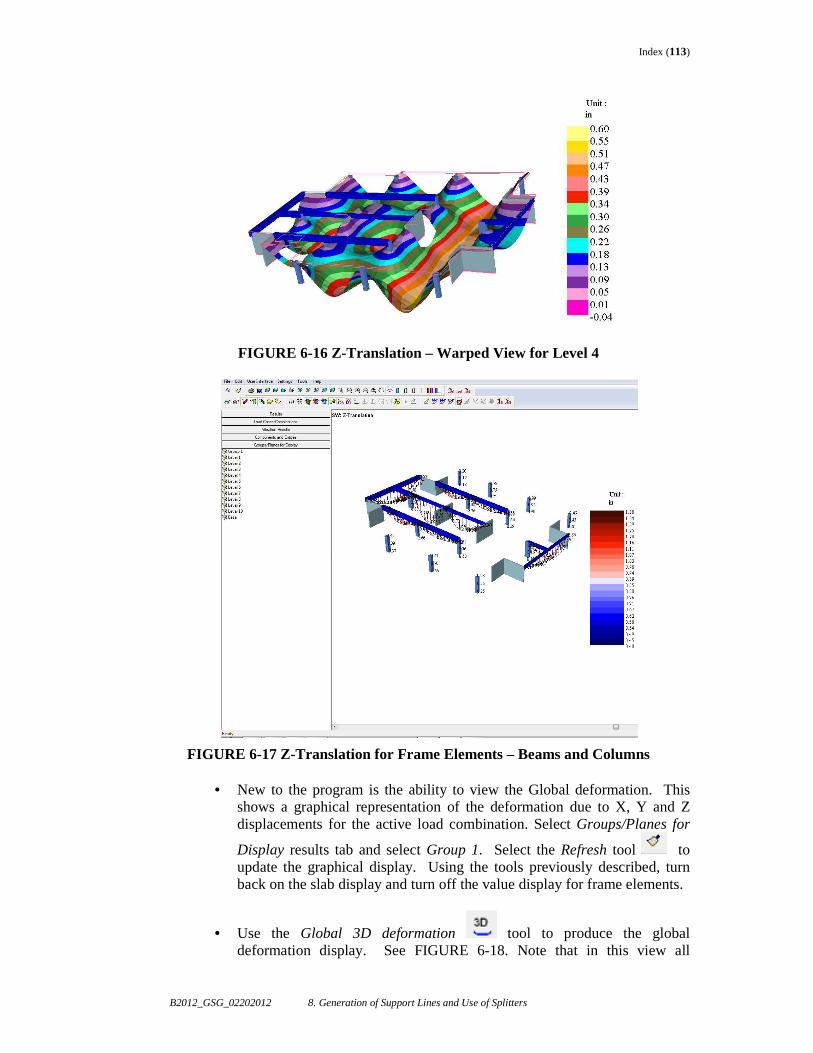
Index (113)
B2012_GSG_02202012 8. Generation of Support Lines and Use of Splitters
FIGURE 6-16 Z-Translation – Warped View for Level 4
FIGURE 6-17 Z-Translation for Frame Elements – Beams and Columns
• New to the program is the ability to view the Global deformation. This shows a graphical representation of the deformation due to X, Y and Z displacements for the active load combination. Select Groups/Planes for
Display results tab and select Group 1. Select the Refresh tool to update the graphical display. Using the tools previously described, turn back on the slab display and turn off the value display for frame elements.
• Use the Global 3D deformation tool to produce the global deformation display. See FIGURE 6-18. Note that in this view all
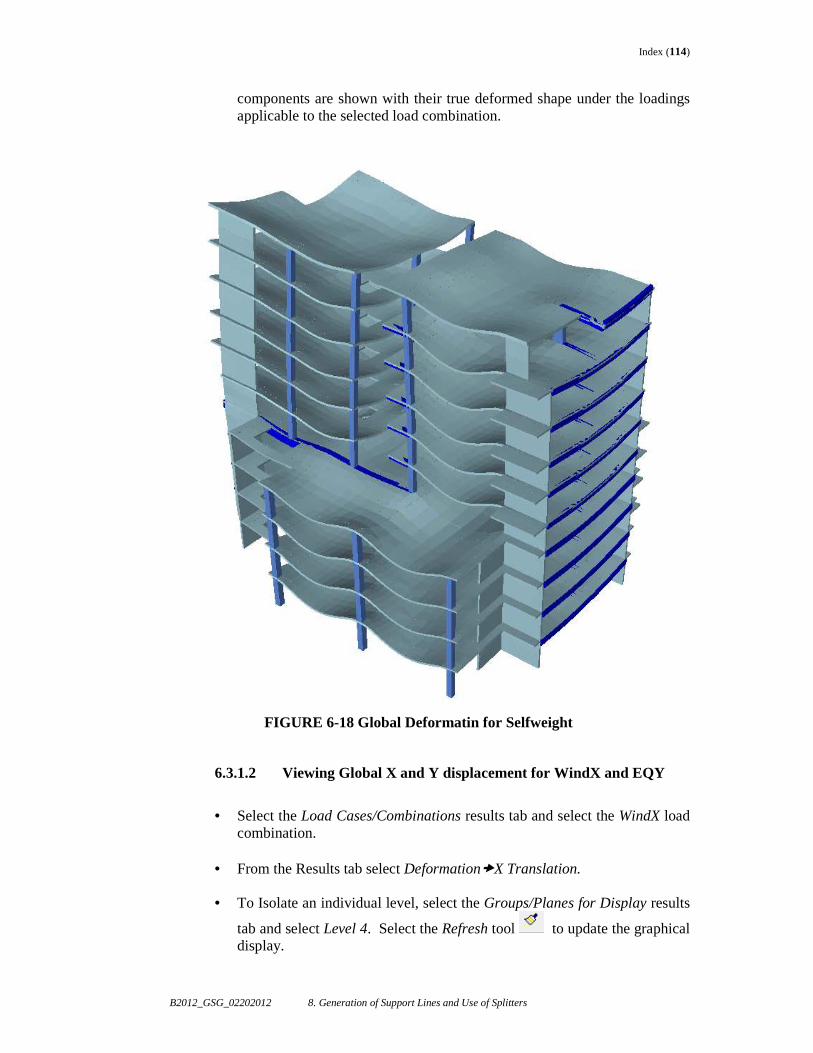
Index (114)
B2012_GSG_02202012 8. Generation of Support Lines and Use of Splitters
components are shown with their true deformed shape under the loadings applicable to the selected load combination.
FIGURE 6-18 Global Deformatin for Selfweight
6.3.1.2 Viewing Global X and Y displacement for WindX and EQY
• Select the Load Cases/Combinations results tab and select the WindX load
combination.
• From the Results tab select Deformation�X Translation.
• To Isolate an individual level, select the Groups/Planes for Display results
tab and select Level 4. Select the Refresh tool to update the graphical display.
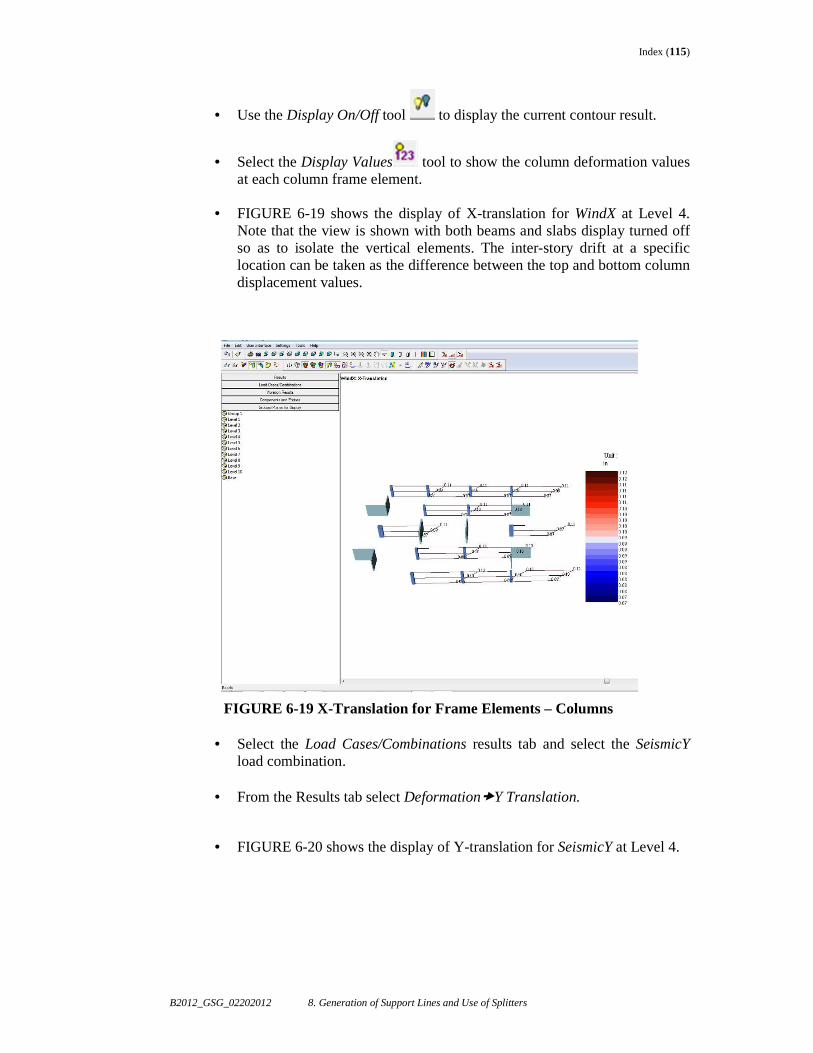
Index (115)
B2012_GSG_02202012 8. Generation of Support Lines and Use of Splitters
• Use the Display On/Off tool to display the current contour result.
• Select the Display Values tool to show the column deformation values at each column frame element.
• FIGURE 6-19 shows the display of X-translation for WindX at Level 4.
Note that the view is shown with both beams and slabs display turned off so as to isolate the vertical elements. The inter-story drift at a specific location can be taken as the difference between the top and bottom column displacement values.
FIGURE 6-19 X-Translation for Frame Elements – Columns
• Select the Load Cases/Combinations results tab and select the SeismicY load combination.
• From the Results tab select Deformation�Y Translation.
• FIGURE 6-20 shows the display of Y-translation for SeismicY at Level 4.
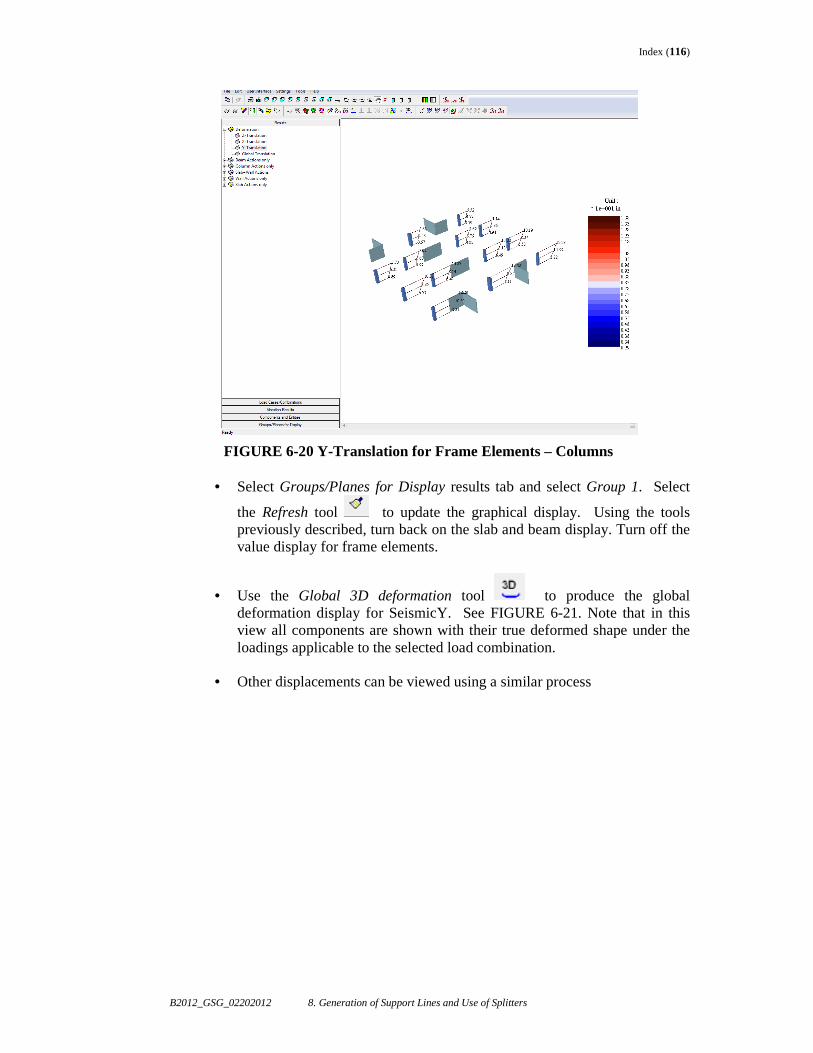
Index (116)
B2012_GSG_02202012 8. Generation of Support Lines and Use of Splitters
FIGURE 6-20 Y-Translation for Frame Elements – Columns
• Select Groups/Planes for Display results tab and select Group 1. Select
the Refresh tool to update the graphical display. Using the tools previously described, turn back on the slab and beam display. Turn off the value display for frame elements.
• Use the Global 3D deformation tool to produce the global deformation display for SeismicY. See FIGURE 6-21. Note that in this view all components are shown with their true deformed shape under the loadings applicable to the selected load combination.
• Other displacements can be viewed using a similar process
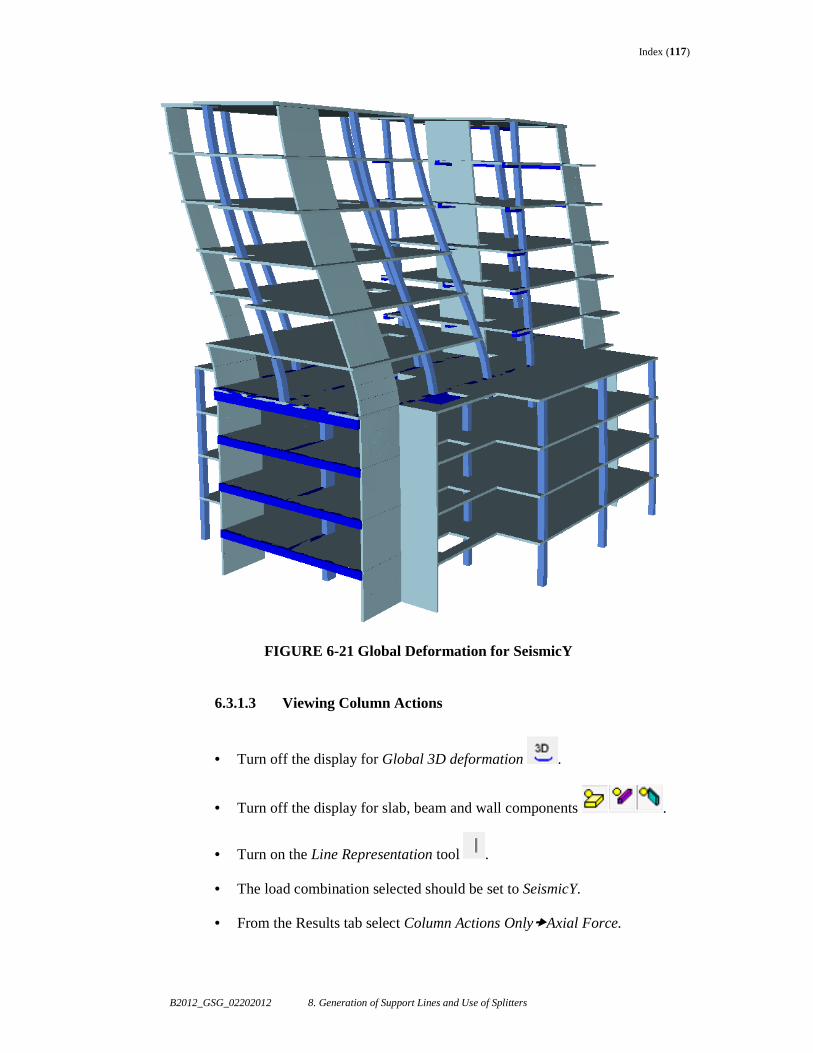
Index (117)
B2012_GSG_02202012 8. Generation of Support Lines and Use of Splitters
FIGURE 6-21 Global Deformation for SeismicY
6.3.1.3 Viewing Column Actions
• Turn off the display for Global 3D deformation .
• Turn off the display for slab, beam and wall components .
• Turn on the Line Representation tool .
• The load combination selected should be set to SeismicY.
• From the Results tab select Column Actions Only�Axial Force.
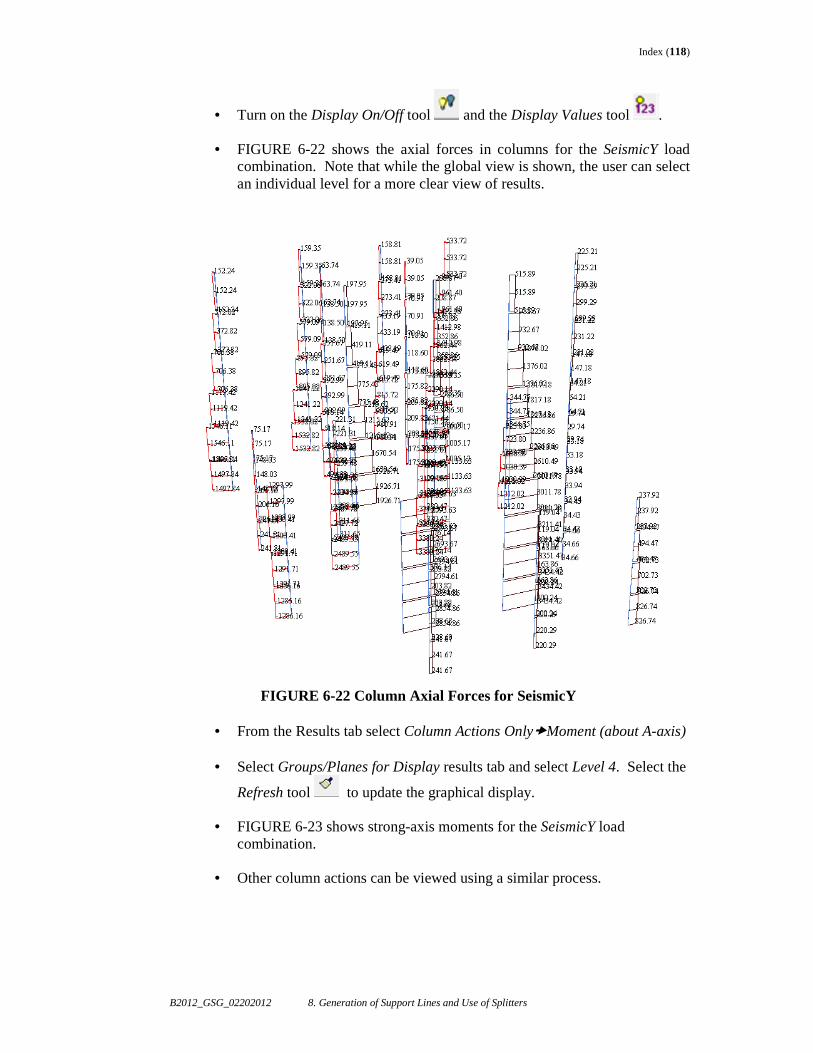
Index (118)
B2012_GSG_02202012 8. Generation of Support Lines and Use of Splitters
• Turn on the Display On/Off tool and the Display Values tool .
• FIGURE 6-22 shows the axial forces in columns for the SeismicY load combination. Note that while the global view is shown, the user can select an individual level for a more clear view of results.
FIGURE 6-22 Column Axial Forces for SeismicY
• From the Results tab select Column Actions Only�Moment (about A-axis)
• Select Groups/Planes for Display results tab and select Level 4. Select the
Refresh tool to update the graphical display.
• FIGURE 6-23 shows strong-axis moments for the SeismicY load combination.
• Other column actions can be viewed using a similar process.
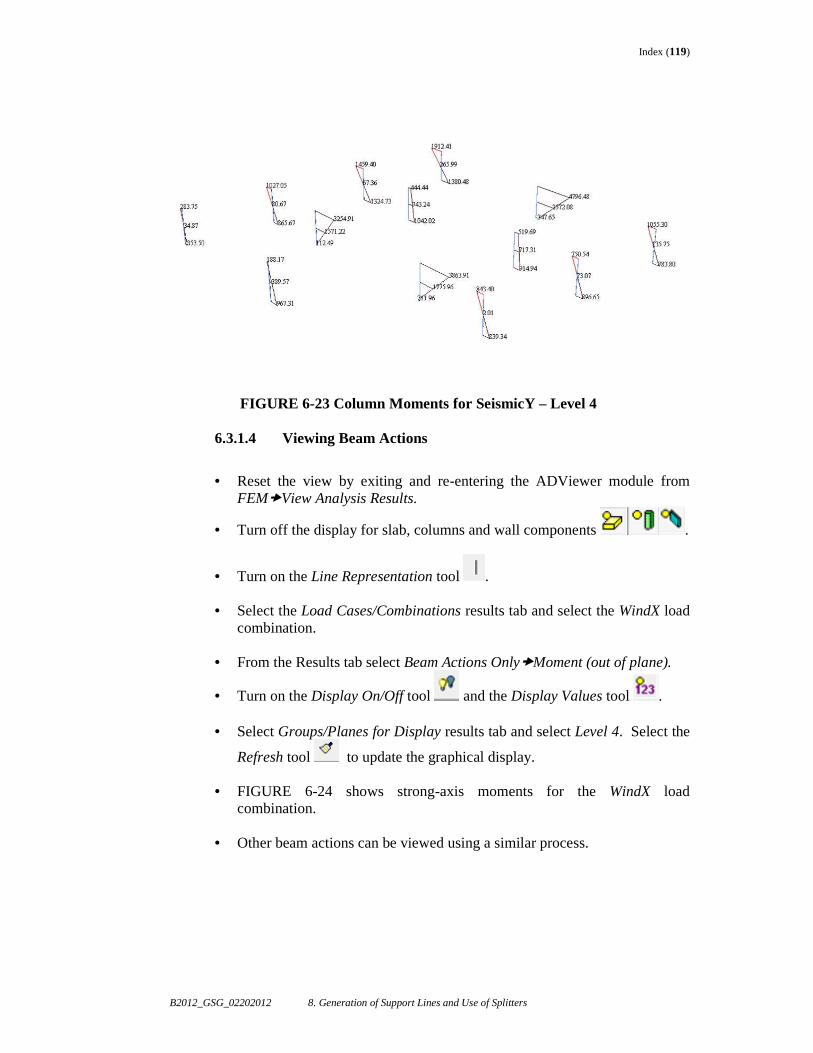
Index (119)
B2012_GSG_02202012 8. Generation of Support Lines and Use of Splitters
FIGURE 6-23 Column Moments for SeismicY – Level 4
6.3.1.4 Viewing Beam Actions
• Reset the view by exiting and re-entering the ADViewer module from
FEM�View Analysis Results.
• Turn off the display for slab, columns and wall components .
• Turn on the Line Representation tool .
• Select the Load Cases/Combinations results tab and select the WindX load combination.
• From the Results tab select Beam Actions Only�Moment (out of plane).
• Turn on the Display On/Off tool and the Display Values tool .
• Select Groups/Planes for Display results tab and select Level 4. Select the
Refresh tool to update the graphical display.
• FIGURE 6-24 shows strong-axis moments for the WindX load combination.
• Other beam actions can be viewed using a similar process.
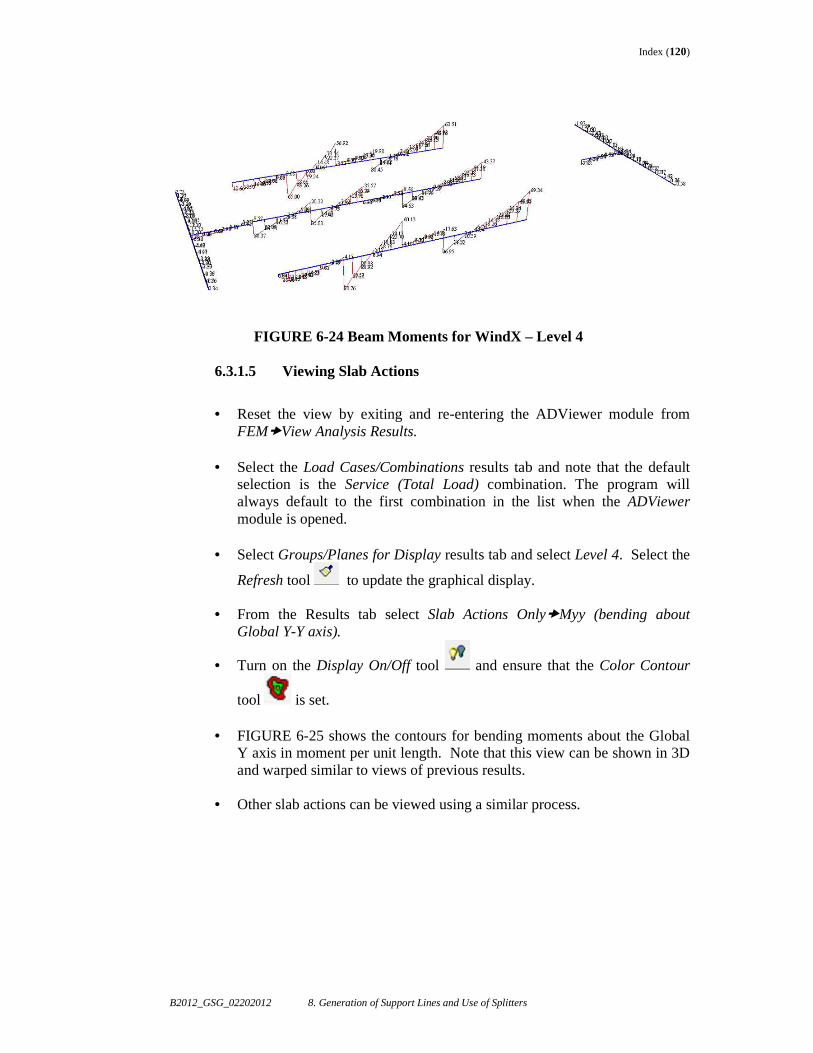
Index (120)
B2012_GSG_02202012 8. Generation of Support Lines and Use of Splitters
FIGURE 6-24 Beam Moments for WindX – Level 4
6.3.1.5 Viewing Slab Actions
• Reset the view by exiting and re-entering the ADViewer module from
FEM�View Analysis Results.
• Select the Load Cases/Combinations results tab and note that the default selection is the Service (Total Load) combination. The program will always default to the first combination in the list when the ADViewer module is opened.
• Select Groups/Planes for Display results tab and select Level 4. Select the
Refresh tool to update the graphical display.
• From the Results tab select Slab Actions Only�Myy (bending about Global Y-Y axis).
• Turn on the Display On/Off tool and ensure that the Color Contour
tool is set.
• FIGURE 6-25 shows the contours for bending moments about the Global Y axis in moment per unit length. Note that this view can be shown in 3D and warped similar to views of previous results.
• Other slab actions can be viewed using a similar process.
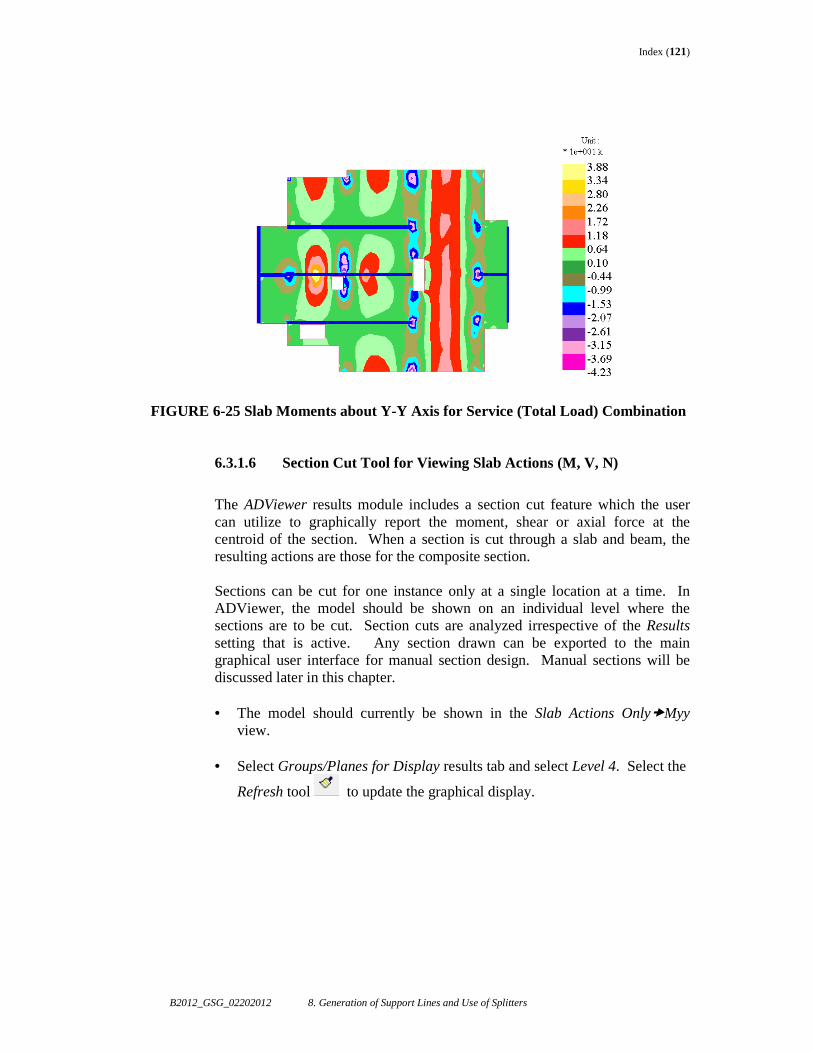
Index (121)
B2012_GSG_02202012 8. Generation of Support Lines and Use of Splitters
FIGURE 6-25 Slab Moments about Y-Y Axis for Service (Total Load) Combination
6.3.1.6 Section Cut Tool for Viewing Slab Actions (M, V, N)
The ADViewer results module includes a section cut feature which the user can utilize to graphically report the moment, shear or axial force at the centroid of the section. When a section is cut through a slab and beam, the resulting actions are those for the composite section.
Sections can be cut for one instance only at a single location at a time. In ADViewer, the model should be shown on an individual level where the sections are to be cut. Section cuts are analyzed irrespective of the Results setting that is active. Any section drawn can be exported to the main graphical user interface for manual section design. Manual sections will be discussed later in this chapter.
• The model should currently be shown in the Slab Actions Only�Myy
view.
• Select Groups/Planes for Display results tab and select Level 4. Select the
Refresh tool to update the graphical display.
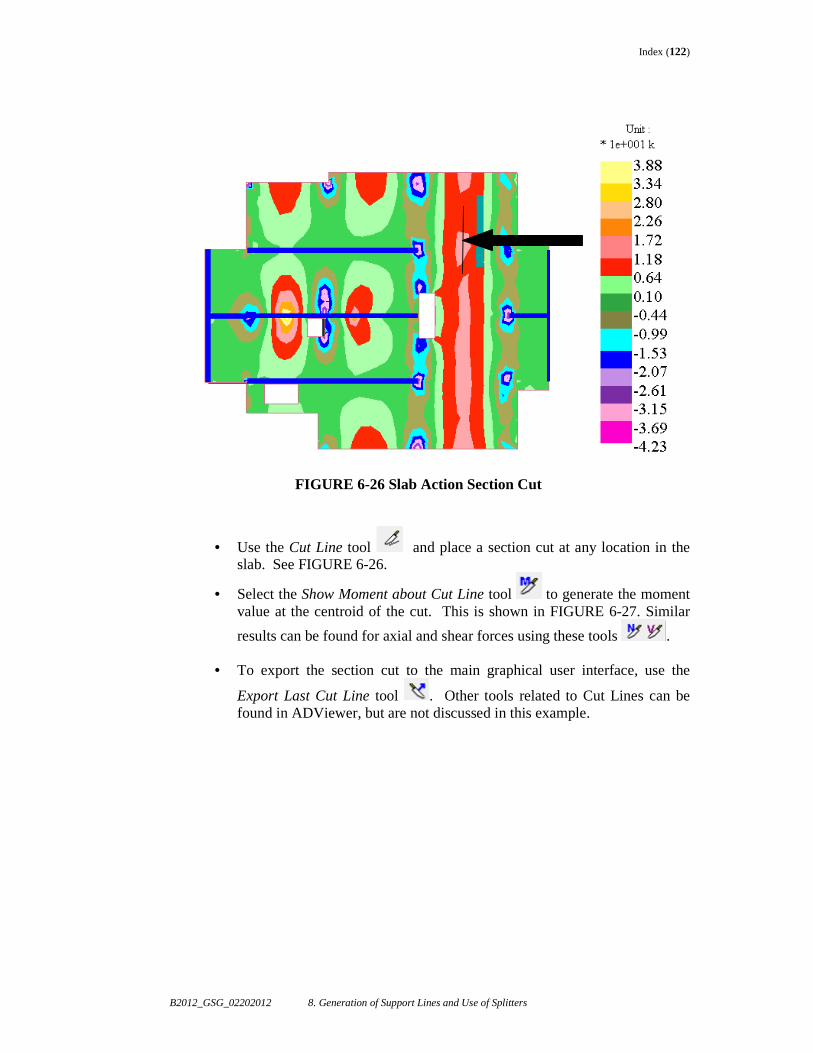
Index (122)
B2012_GSG_02202012 8. Generation of Support Lines and Use of Splitters
FIGURE 6-26 Slab Action Section Cut
• Use the Cut Line tool and place a section cut at any location in the slab. See FIGURE 6-26.
• Select the Show Moment about Cut Line tool to generate the moment value at the centroid of the cut. This is shown in FIGURE 6-27. Similar
results can be found for axial and shear forces using these tools .
• To export the section cut to the main graphical user interface, use the
Export Last Cut Line tool . Other tools related to Cut Lines can be found in ADViewer, but are not discussed in this example.
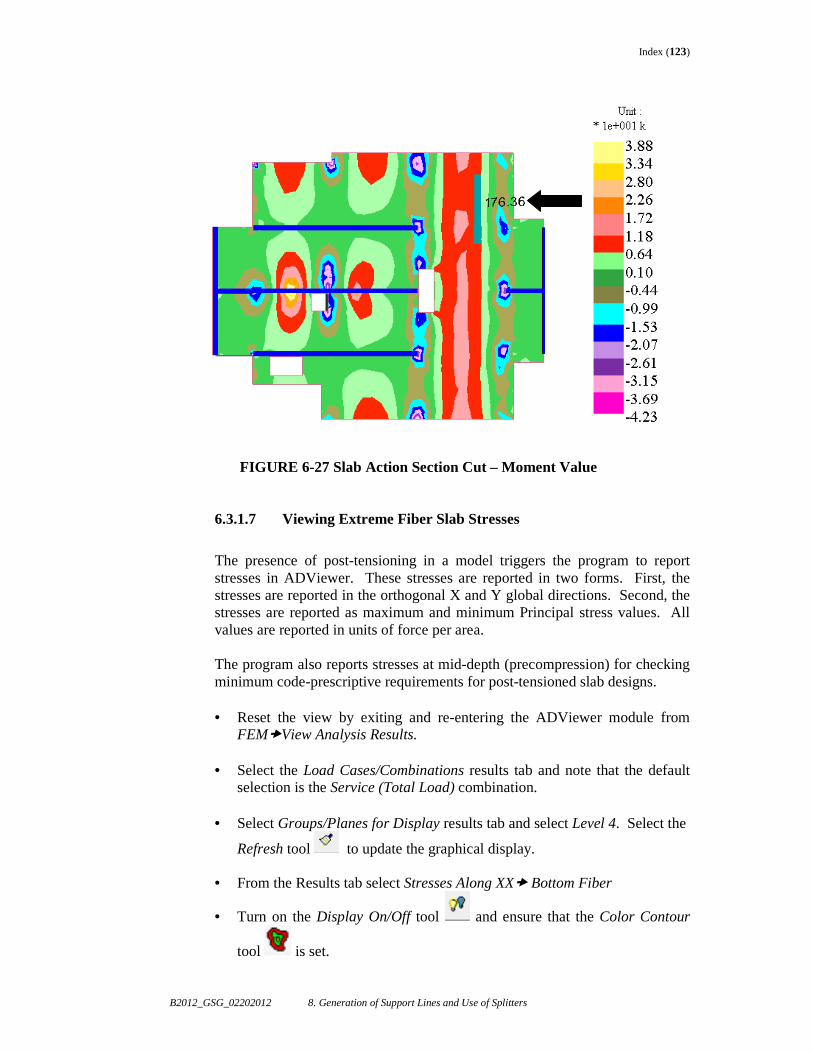
Index (123)
B2012_GSG_02202012 8. Generation of Support Lines and Use of Splitters
FIGURE 6-27 Slab Action Section Cut – Moment Value
6.3.1.7 Viewing Extreme Fiber Slab Stresses
The presence of post-tensioning in a model triggers the program to report stresses in ADViewer. These stresses are reported in two forms. First, the stresses are reported in the orthogonal X and Y global directions. Second, the stresses are reported as maximum and minimum Principal stress values. All values are reported in units of force per area.
The program also reports stresses at mid-depth (precompression) for checking minimum code-prescriptive requirements for post-tensioned slab designs.
• Reset the view by exiting and re-entering the ADViewer module from
FEM�View Analysis Results.
• Select the Load Cases/Combinations results tab and note that the default selection is the Service (Total Load) combination.
• Select Groups/Planes for Display results tab and select Level 4. Select the
Refresh tool to update the graphical display.
• From the Results tab select Stresses Along XX� Bottom Fiber
• Turn on the Display On/Off tool and ensure that the Color Contour
tool is set.
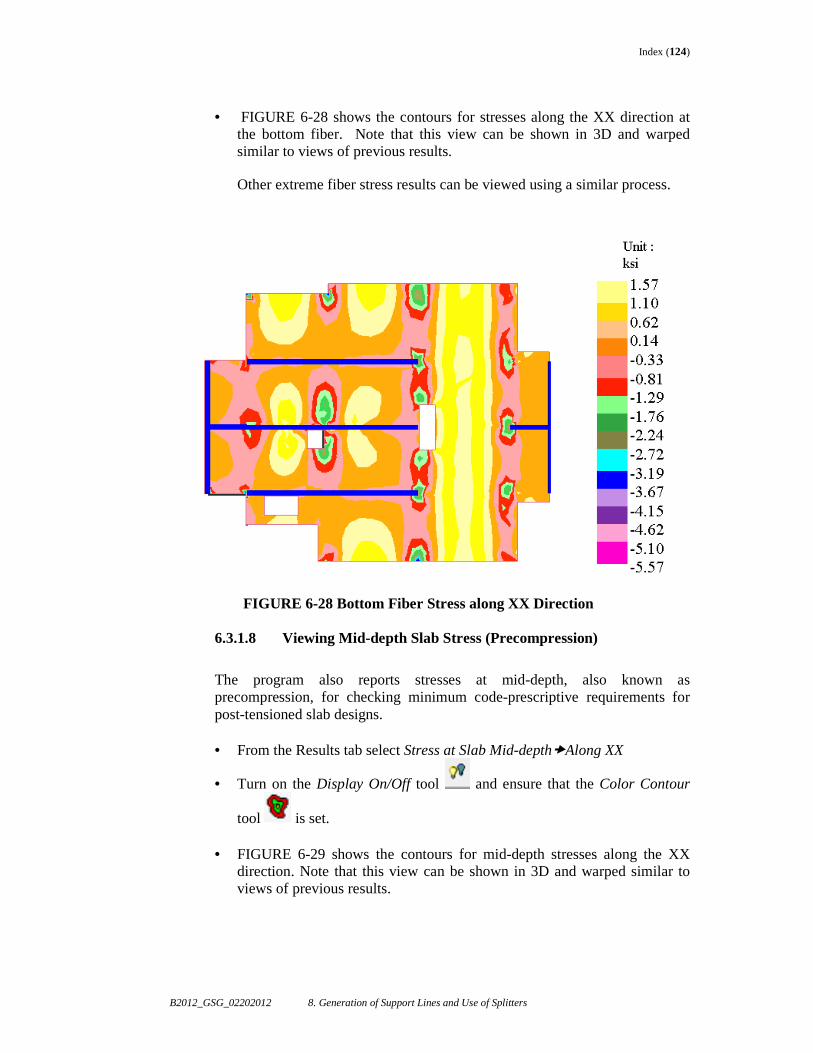
Index (124)
B2012_GSG_02202012 8. Generation of Support Lines and Use of Splitters
• FIGURE 6-28 shows the contours for stresses along the XX direction at
the bottom fiber. Note that this view can be shown in 3D and warped similar to views of previous results.
Other extreme fiber stress results can be viewed using a similar process.
FIGURE 6-28 Bottom Fiber Stress along XX Direction
6.3.1.8 Viewing Mid-depth Slab Stress (Precompression)
The program also reports stresses at mid-depth, also known as precompression, for checking minimum code-prescriptive requirements for post-tensioned slab designs.
• From the Results tab select Stress at Slab Mid-depth�Along XX
• Turn on the Display On/Off tool and ensure that the Color Contour
tool is set.
• FIGURE 6-29 shows the contours for mid-depth stresses along the XX direction. Note that this view can be shown in 3D and warped similar to views of previous results.
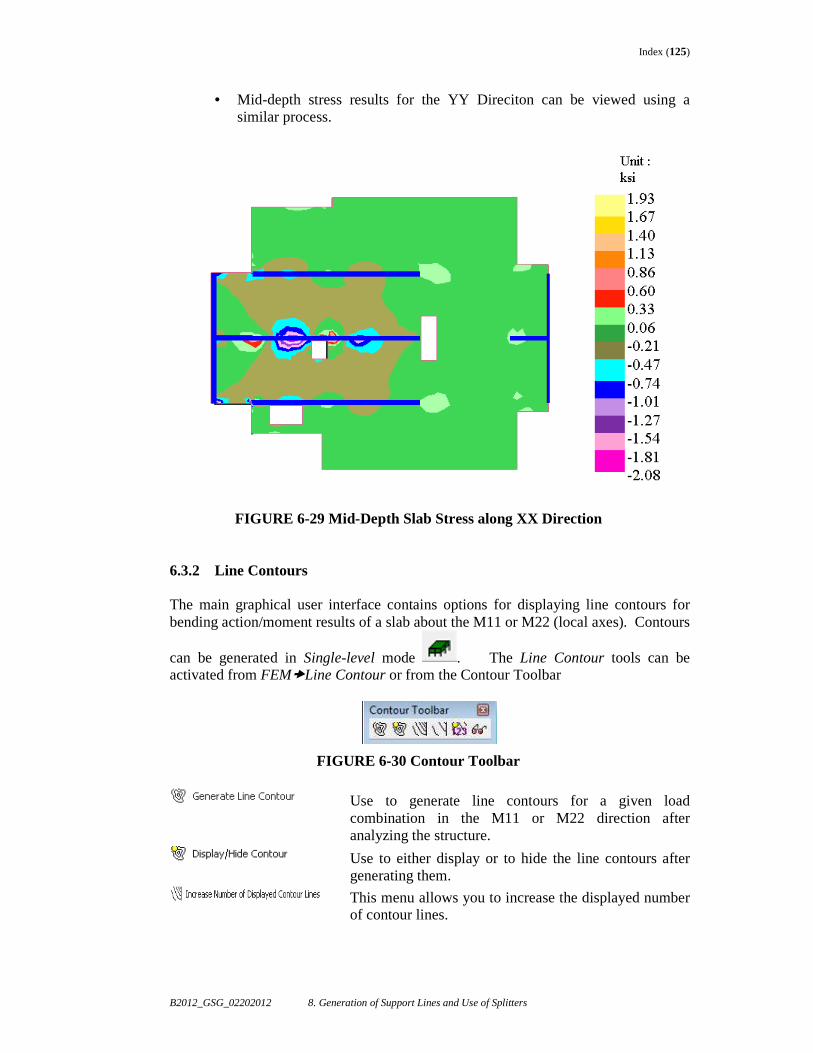
Index (125)
B2012_GSG_02202012 8. Generation of Support Lines and Use of Splitters
• Mid-depth stress results for the YY Direciton can be viewed using a similar process.
FIGURE 6-29 Mid-Depth Slab Stress along XX Direction
6.3.2 Line Contours The main graphical user interface contains options for displaying line contours for bending action/moment results of a slab about the M11 or M22 (local axes). Contours
can be generated in Single-level mode . The Line Contour tools can be activated from FEM�Line Contour or from the Contour Toolbar
FIGURE 6-30 Contour Toolbar
Use to generate line contours for a given load combination in the M11 or M22 direction after analyzing the structure.
Use to either display or to hide the line contours after generating them.
This menu allows you to increase the displayed number of contour lines.
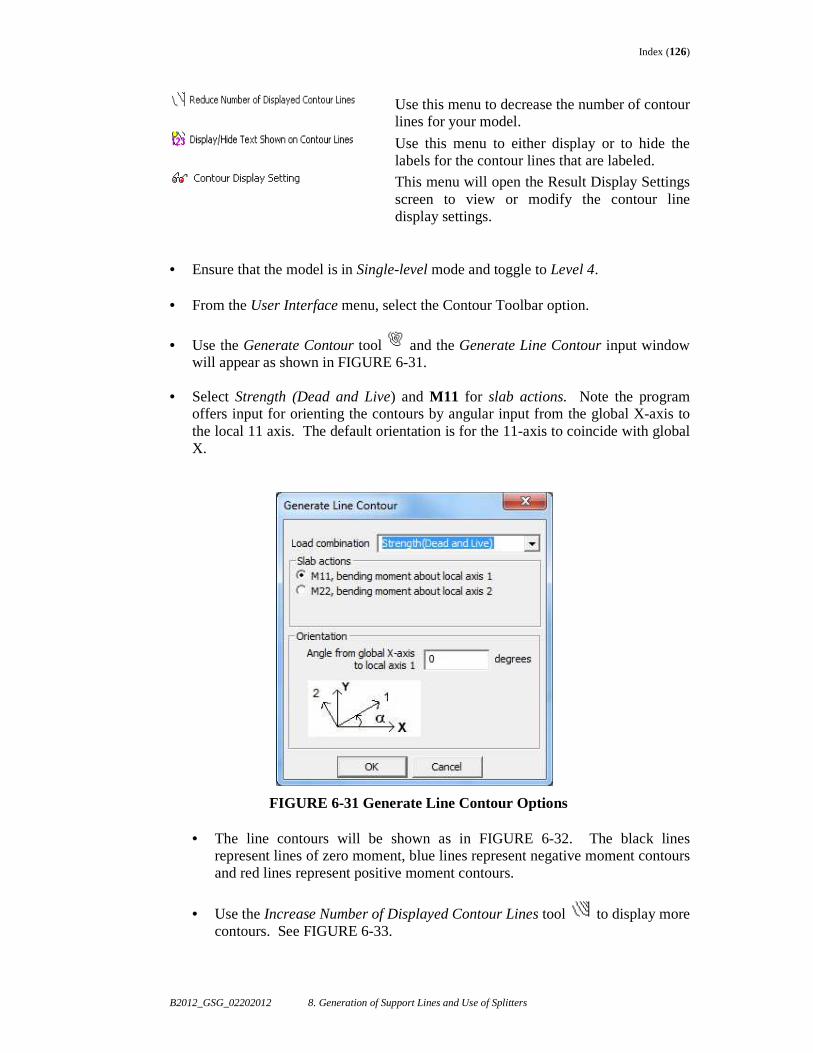
Index (126)
B2012_GSG_02202012 8. Generation of Support Lines and Use of Splitters
Use this menu to decrease the number of contour lines for your model.
Use this menu to either display or to hide the labels for the contour lines that are labeled.
This menu will open the Result Display Settings screen to view or modify the contour line display settings.
• Ensure that the model is in Single-level mode and toggle to Level 4.
• From the User Interface menu, select the Contour Toolbar option.
• Use the Generate Contour tool and the Generate Line Contour input window will appear as shown in FIGURE 6-31.
• Select Strength (Dead and Live) and M11 for slab actions. Note the program
offers input for orienting the contours by angular input from the global X-axis to the local 11 axis. The default orientation is for the 11-axis to coincide with global X.
FIGURE 6-31 Generate Line Contour Options
• The line contours will be shown as in FIGURE 6-32. The black lines represent lines of zero moment, blue lines represent negative moment contours and red lines represent positive moment contours.
• Use the Increase Number of Displayed Contour Lines tool to display more contours. See FIGURE 6-33.
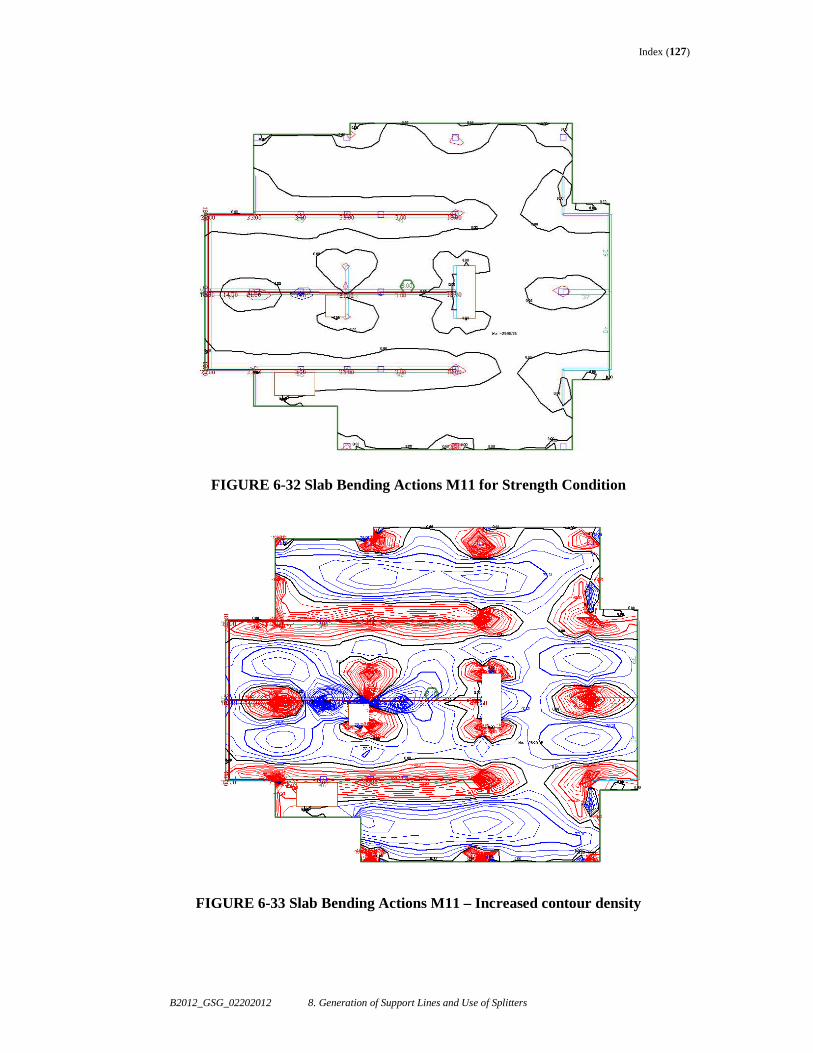
Index (127)
B2012_GSG_02202012 8. Generation of Support Lines and Use of Splitters
FIGURE 6-32 Slab Bending Actions M11 for Strength Condition
FIGURE 6-33 Slab Bending Actions M11 – Increased contour density
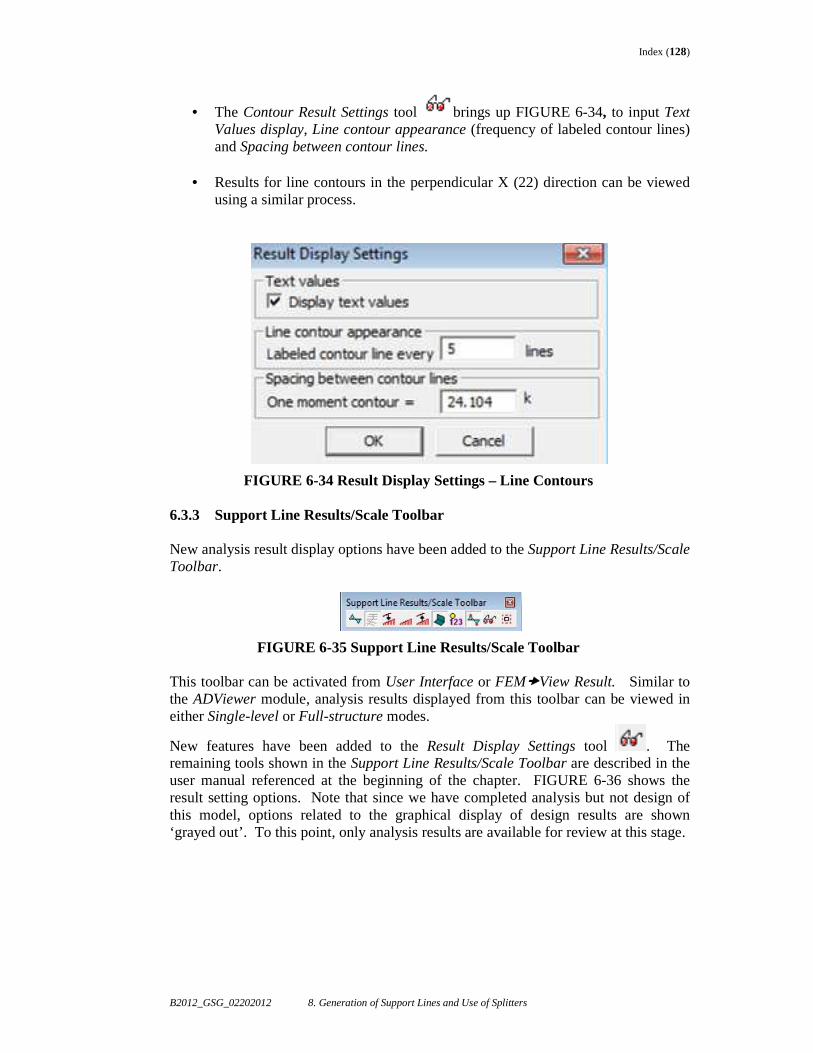
Index (128)
B2012_GSG_02202012 8. Generation of Support Lines and Use of Splitters
• The Contour Result Settings tool brings up FIGURE 6-34, to input Text Values display, Line contour appearance (frequency of labeled contour lines) and Spacing between contour lines.
• Results for line contours in the perpendicular X (22) direction can be viewed
using a similar process.
FIGURE 6-34 Result Display Settings – Line Contours 6.3.3 Support Line Results/Scale Toolbar New analysis result display options have been added to the Support Line Results/Scale Toolbar.
FIGURE 6-35 Support Line Results/Scale Toolbar This toolbar can be activated from User Interface or FEM�View Result. Similar to the ADViewer module, analysis results displayed from this toolbar can be viewed in either Single-level or Full-structure modes.
New features have been added to the Result Display Settings tool . The remaining tools shown in the Support Line Results/Scale Toolbar are described in the user manual referenced at the beginning of the chapter. FIGURE 6-36 shows the result setting options. Note that since we have completed analysis but not design of this model, options related to the graphical display of design results are shown ‘grayed out’. To this point, only analysis results are available for review at this stage.
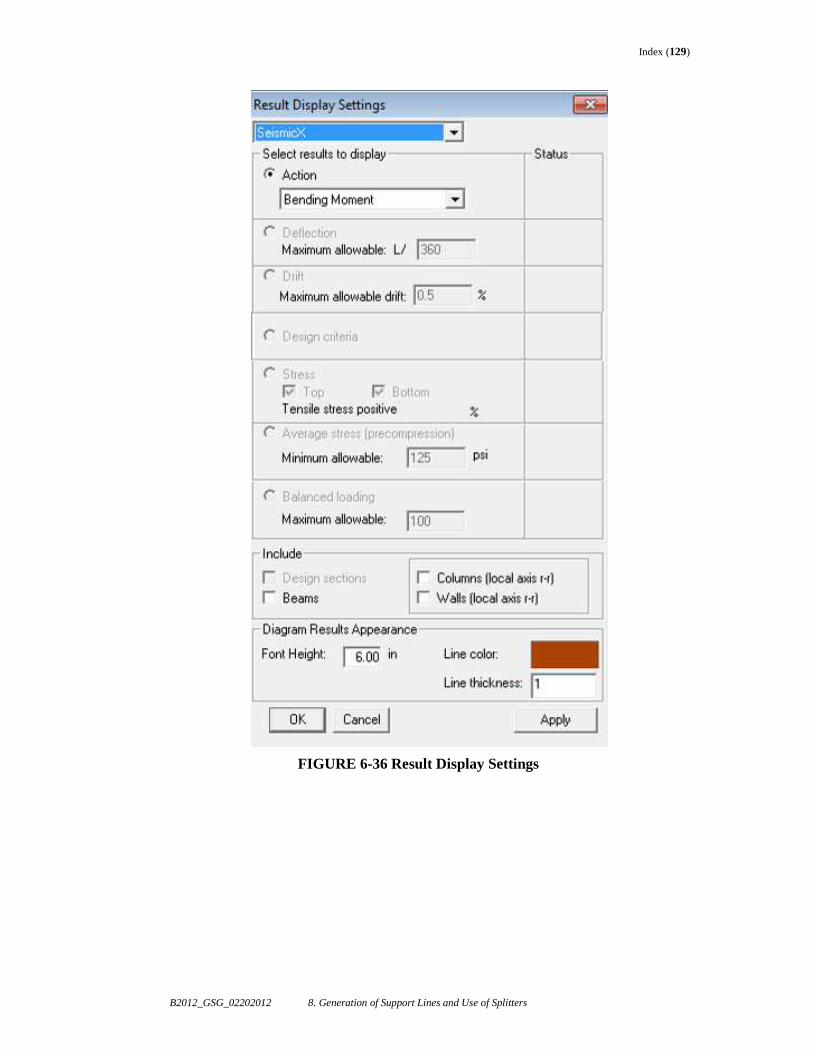
Index (129)
B2012_GSG_02202012 8. Generation of Support Lines and Use of Splitters
FIGURE 6-36 Result Display Settings
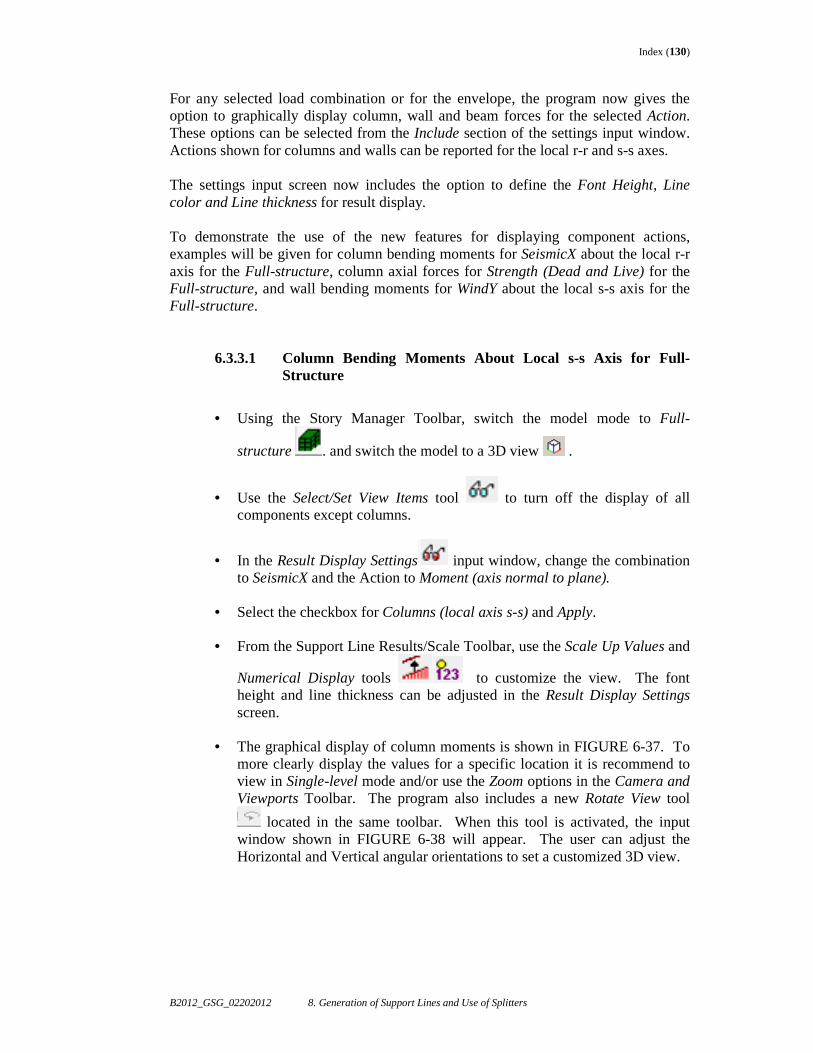
Index (130)
B2012_GSG_02202012 8. Generation of Support Lines and Use of Splitters
For any selected load combination or for the envelope, the program now gives the option to graphically display column, wall and beam forces for the selected Action. These options can be selected from the Include section of the settings input window. Actions shown for columns and walls can be reported for the local r-r and s-s axes. The settings input screen now includes the option to define the Font Height, Line color and Line thickness for result display. To demonstrate the use of the new features for displaying component actions, examples will be given for column bending moments for SeismicX about the local r-r axis for the Full-structure, column axial forces for Strength (Dead and Live) for the Full-structure, and wall bending moments for WindY about the local s-s axis for the Full-structure.
6.3.3.1 Column Bending Moments About Local s-s Axis for Full-Structure
• Using the Story Manager Toolbar, switch the model mode to Full-
structure . and switch the model to a 3D view .
• Use the Select/Set View Items tool to turn off the display of all components except columns.
• In the Result Display Settings input window, change the combination to SeismicX and the Action to Moment (axis normal to plane).
• Select the checkbox for Columns (local axis s-s) and Apply.
• From the Support Line Results/Scale Toolbar, use the Scale Up Values and
Numerical Display tools to customize the view. The font height and line thickness can be adjusted in the Result Display Settings screen.
• The graphical display of column moments is shown in FIGURE 6-37. To
more clearly display the values for a specific location it is recommend to view in Single-level mode and/or use the Zoom options in the Camera and Viewports Toolbar. The program also includes a new Rotate View tool
located in the same toolbar. When this tool is activated, the input window shown in FIGURE 6-38 will appear. The user can adjust the Horizontal and Vertical angular orientations to set a customized 3D view.
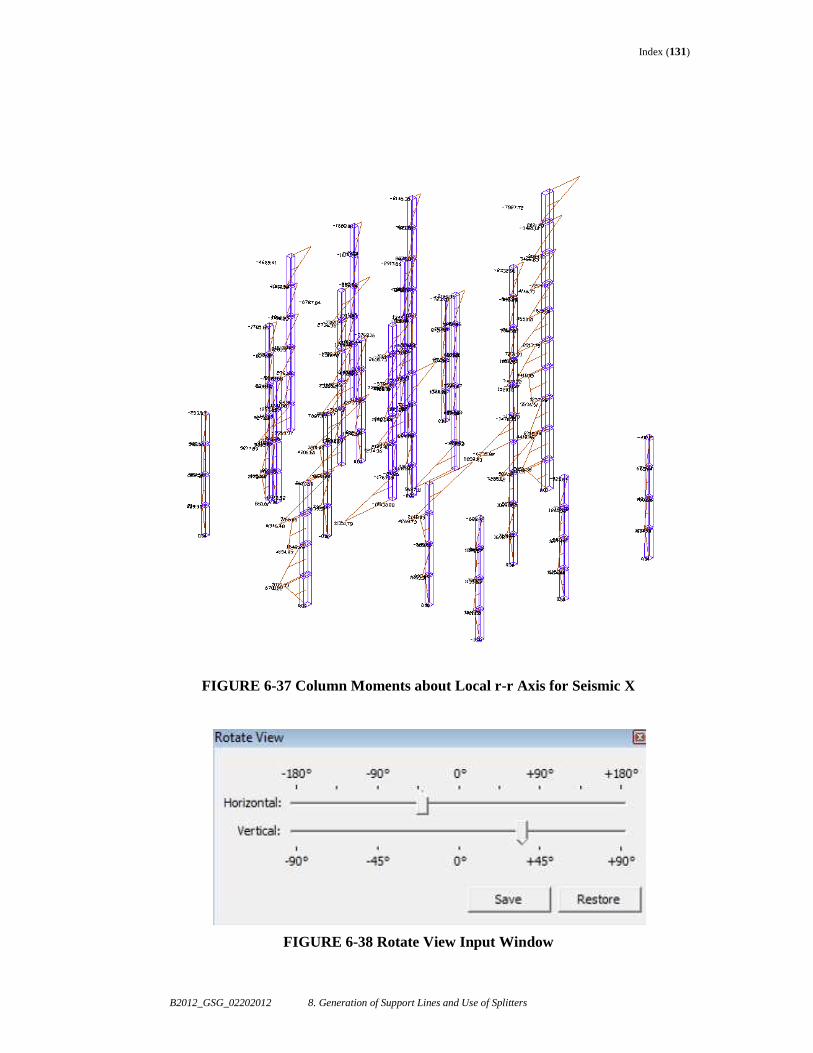
Index (131)
B2012_GSG_02202012 8. Generation of Support Lines and Use of Splitters
FIGURE 6-37 Column Moments about Local r-r Axis for Seismic X
FIGURE 6-38 Rotate View Input Window

Index (132)
B2012_GSG_02202012 8. Generation of Support Lines and Use of Splitters
6.3.3.2 Column Axial Forces for Full-structure
• The model should currently be shown in 3D view with display of columns
only. If the model view has been adjusted, revert back to the view in the previous example for Full-structure mode.
• In the Result Display Settings input window, change the combination to Strength (Dead and Live) and the Action to Axial Force.
• Select the checkbox for Columns and click Apply.
• From the Support Line Results/Scale Toolbar, use the Scale Up Values and
Numerical Display tools to customize the view. The font height and line thickness can be adjusted in the Result Display Settings screen.
• The graphical display of column axial forces is shown in FIGURE 6-39.
To more clearly display the values for a specific location it is recommend to view in Single-level mode and/or use the Zoom or Rotate View options in the Camera and Viewports Toolbar.
6.3.3.3 Wall Bending Moments about Local s-s Axis for Full-Structure
• The model should currently be shown in 3D view with display of columns
only. If the model view has been adjusted, revert back to the view in the previous example for Full-structure mode.
• Use the Select/Set View Items tool to turn off the display of all components except walls.
• In the Result Display Settings input window, change the combination to WindY and the Action to Moment (axis normal to plane).
• Select the checkbox for Walls (local axis s-s) and Apply.
• From the Support Line Results/Scale Toolbar, use the Scale Up Values and
Numerical Display tools to customize the view. The font height and line thickness can be used to adjust the value display.
• The graphical display of wall moments is shown in FIGURE 6-40. Note
that walls oriented global Y-direction report higher moment values due to their strong-axis orientation relative to the result being displayed for wind action in the global Y-direction.
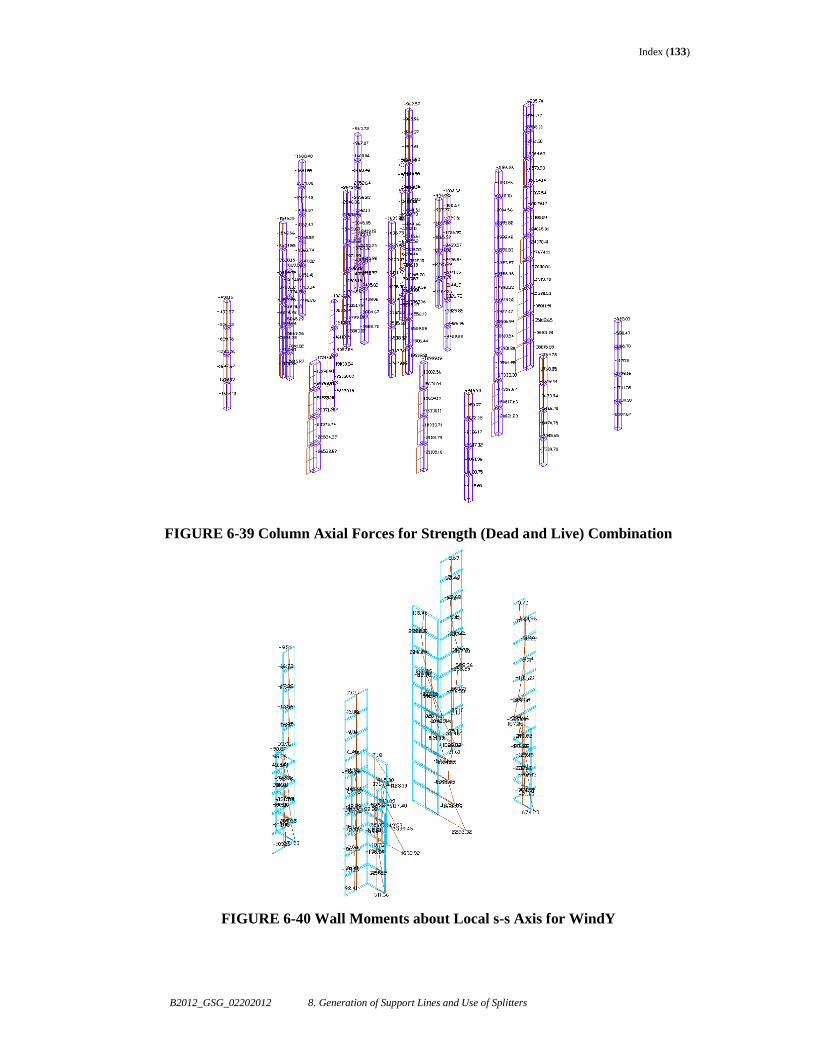
Index (133)
B2012_GSG_02202012 8. Generation of Support Lines and Use of Splitters
FIGURE 6-39 Column Axial Forces for Strength (Dead and Live) Combination
FIGURE 6-40 Wall Moments about Local s-s Axis for WindY
Index (134)
B2012_GSG_02202012 8. Generation of Support Lines and Use of Splitters
6.3.4 Graphical Column and Wall Reactions In Builder 2012, column and wall reactions can be graphically reported at the top or bottom of vertical elements in the main graphical user interface. This input can be activated from Reports�Single Default Reports�Graphical. Results can be customized to include any combination of the following actions: Fr, Fs, Fz, Mrr, Mss or Mzz. When a single load combination is selected, the actions listed above are reported as unique values associated with the combination. When more than 1 combination is selected, the user has the option to envelope results for a single action and report a corresponding result for that given envelope action. Results can be reported with respect to Local or Global axes.
• Using the Story Manager Toolbar, switch the model mode to Single-level .
and switch the model to a Top View .
• Using the Active level up- and down tools navigate to Level 1. • Select the options shown in Column Reactions settings as shown in FIGURE 6-41
and select OK. • The program will prompt the user to enter User’s comment. This input is used for
describing the view if the view is printed or combined as part of a results report. Leave the entry blank and select OK.
• The program will generate the graphical view of actions at each column as shown
in FIGURE 6-42.
• Using the Active level up- and down tools the user can navigate to different levels to investigate column or wall reactions.
• The same process can be used for generation of wall reactions.
Additional graphical reports can be generated from Reports�Single Default Reports�Graphical. These reports are described in more detail in the referenced document at the beginning of this chapter.
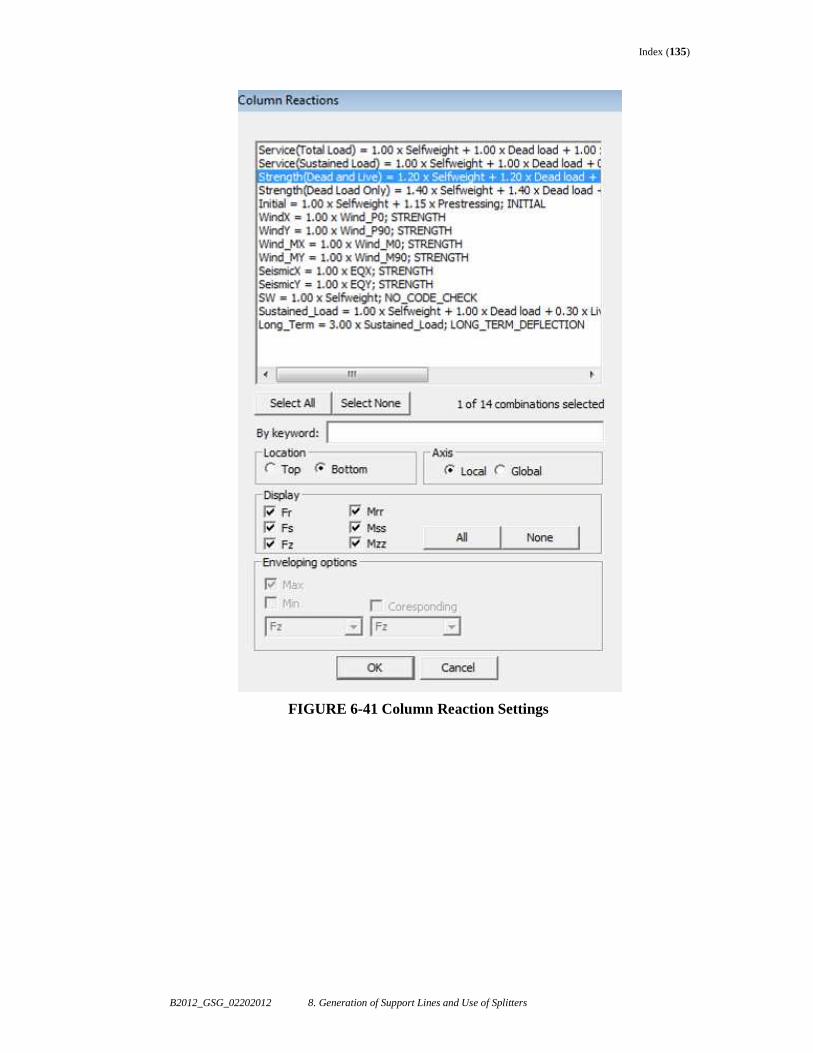
Index (135)
B2012_GSG_02202012 8. Generation of Support Lines and Use of Splitters
FIGURE 6-41 Column Reaction Settings
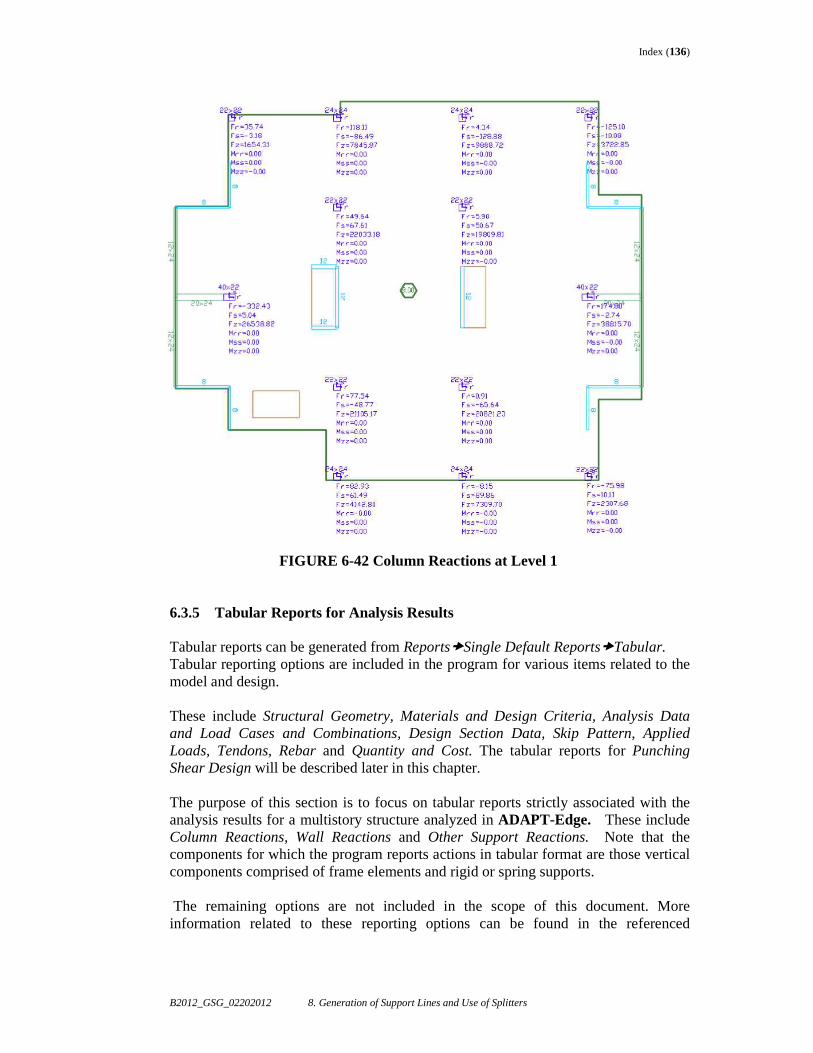
Index (136)
B2012_GSG_02202012 8. Generation of Support Lines and Use of Splitters
FIGURE 6-42 Column Reactions at Level 1
6.3.5 Tabular Reports for Analysis Results Tabular reports can be generated from Reports�Single Default Reports�Tabular. Tabular reporting options are included in the program for various items related to the model and design. These include Structural Geometry, Materials and Design Criteria, Analysis Data and Load Cases and Combinations, Design Section Data, Skip Pattern, Applied Loads, Tendons, Rebar and Quantity and Cost. The tabular reports for Punching Shear Design will be described later in this chapter. The purpose of this section is to focus on tabular reports strictly associated with the analysis results for a multistory structure analyzed in ADAPT-Edge. These include Column Reactions, Wall Reactions and Other Support Reactions. Note that the components for which the program reports actions in tabular format are those vertical components comprised of frame elements and rigid or spring supports. The remaining options are not included in the scope of this document. More information related to these reporting options can be found in the referenced
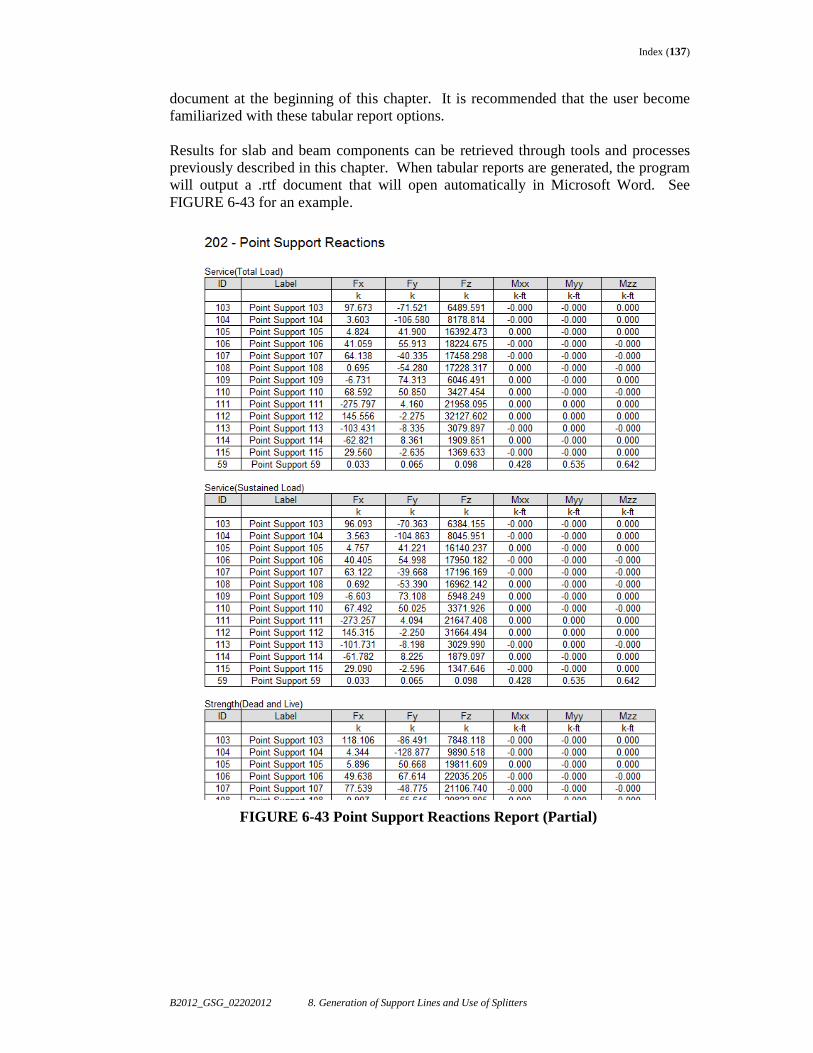
Index (137)
B2012_GSG_02202012 8. Generation of Support Lines and Use of Splitters
document at the beginning of this chapter. It is recommended that the user become familiarized with these tabular report options.
Results for slab and beam components can be retrieved through tools and processes previously described in this chapter. When tabular reports are generated, the program will output a .rtf document that will open automatically in Microsoft Word. See FIGURE 6-43 for an example.
FIGURE 6-43 Point Support Reactions Report (Partial)
Index (138)
B2012_GSG_02202012 8. Generation of Support Lines and Use of Splitters
6.3.6 Punching Shear Check The Punching Shear Check be performed after analysis of the full-structure or single-level. The calculations associated with the check are dependent on column reactions; hence, the design of the design strips does not need to be performed prior to this
check. It is prerequisite that the program be in Single-level mode for the punching shear check. This can only be carried out level-by-level. An extensive description and review of functions related to the Punching Shear Check in ADAPT-Builder can be found in the ADAPT-Builder 2012 User Manual. The purpose of this section is to describe the required steps to complete the check in the program and to produce punching shear results as it relates to this example.
• Using the Story Manager Toolbar, switch the model to Single-level mode
and switch the model to a Top View .
• Using the Active level up- and down tools navigate to Level 1.
• Go to FEM�Punching Shear Check. The execution will begin and when completed, the program will return a message stating that the Operation successfully completed. Click OK.
• To view a graphical summary of Punching Shear Check results, from the Support
Line Results/Scale toolbar, use the Display Punching Shear Design Outcome and
Numerical Display tools . See FIGURE 6-44. At column or wall locations where the check applies, the program will graphically report the check status and the controlling stress ratios (SR) with respect to the local bending axes. Where combined effects are considered as part of the Criteria input for Shear Design, the program will report separate axis stress ratios and a combined stress ratio.
The status indicators include: NA (Not Applicable) - This will be shown if the column is connected to a beam or wall endpoint or if a wall has a length/thickness ratio greater than 4.0. OK – This will be shown when the column or wall is subject to a shear check, does not exceed the code prescribed maximum allowable shear stress and does not require added shear reinforcement to meet demand. The shear check for both axes must satisfy these conditions for this status. Reinforce – This will be shown when the column or wall is subject to a shear check, does not exceed the code prescribed maximum allowable shear stress but reinforcement is required for shear capacity to meet demand.
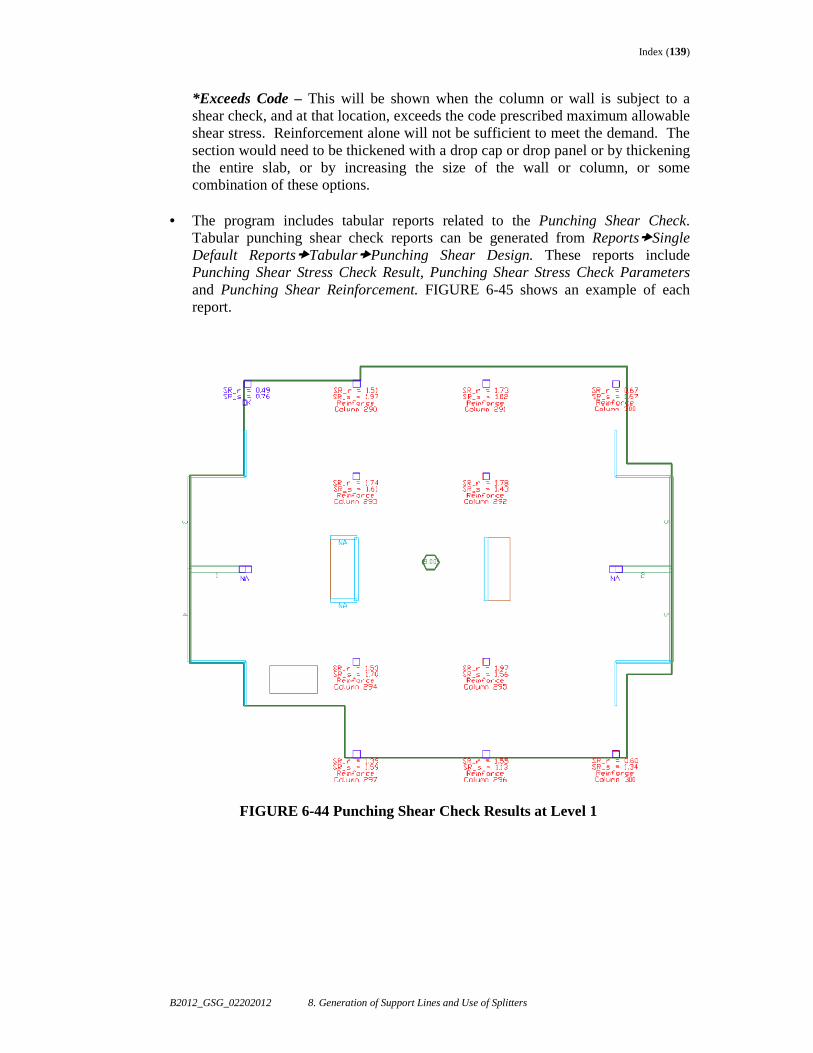
Index (139)
B2012_GSG_02202012 8. Generation of Support Lines and Use of Splitters
*Exceeds Code – This will be shown when the column or wall is subject to a shear check, and at that location, exceeds the code prescribed maximum allowable shear stress. Reinforcement alone will not be sufficient to meet the demand. The section would need to be thickened with a drop cap or drop panel or by thickening the entire slab, or by increasing the size of the wall or column, or some combination of these options.
• The program includes tabular reports related to the Punching Shear Check.
Tabular punching shear check reports can be generated from Reports�Single Default Reports�Tabular�Punching Shear Design. These reports include Punching Shear Stress Check Result, Punching Shear Stress Check Parameters and Punching Shear Reinforcement. FIGURE 6-45 shows an example of each report.
FIGURE 6-44 Punching Shear Check Results at Level 1
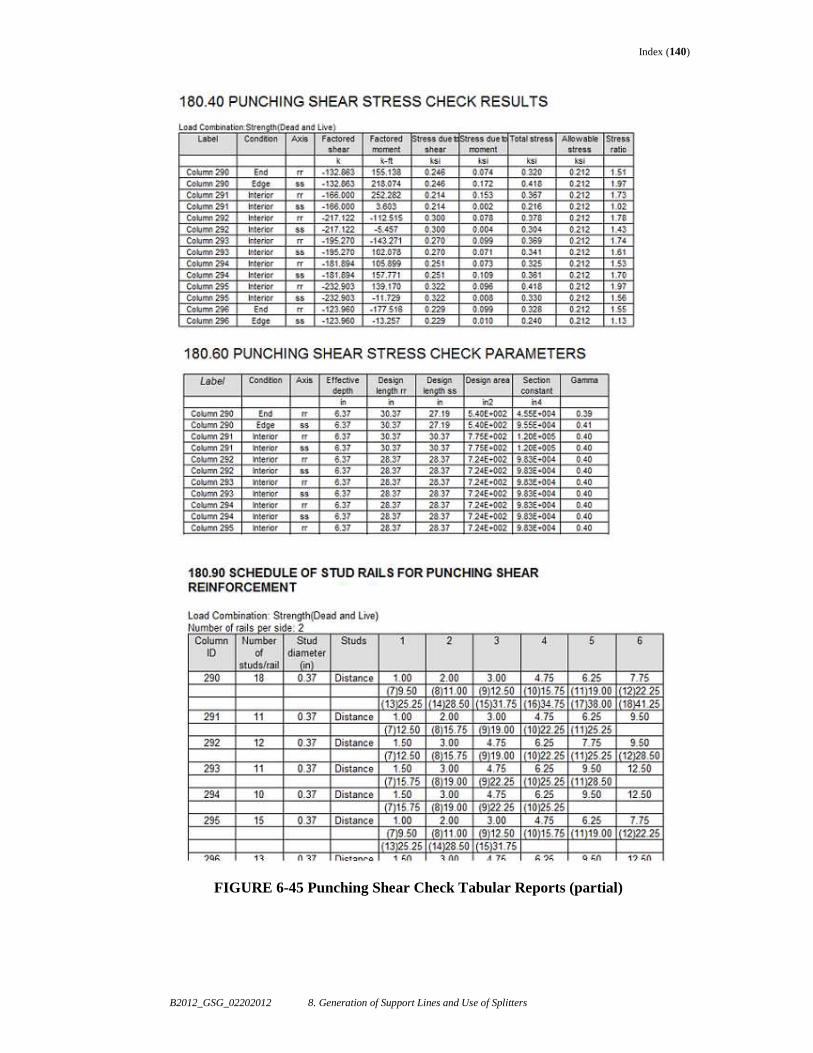
Index (140)
B2012_GSG_02202012 8. Generation of Support Lines and Use of Splitters
FIGURE 6-45 Punching Shear Check Tabular Reports (partial)
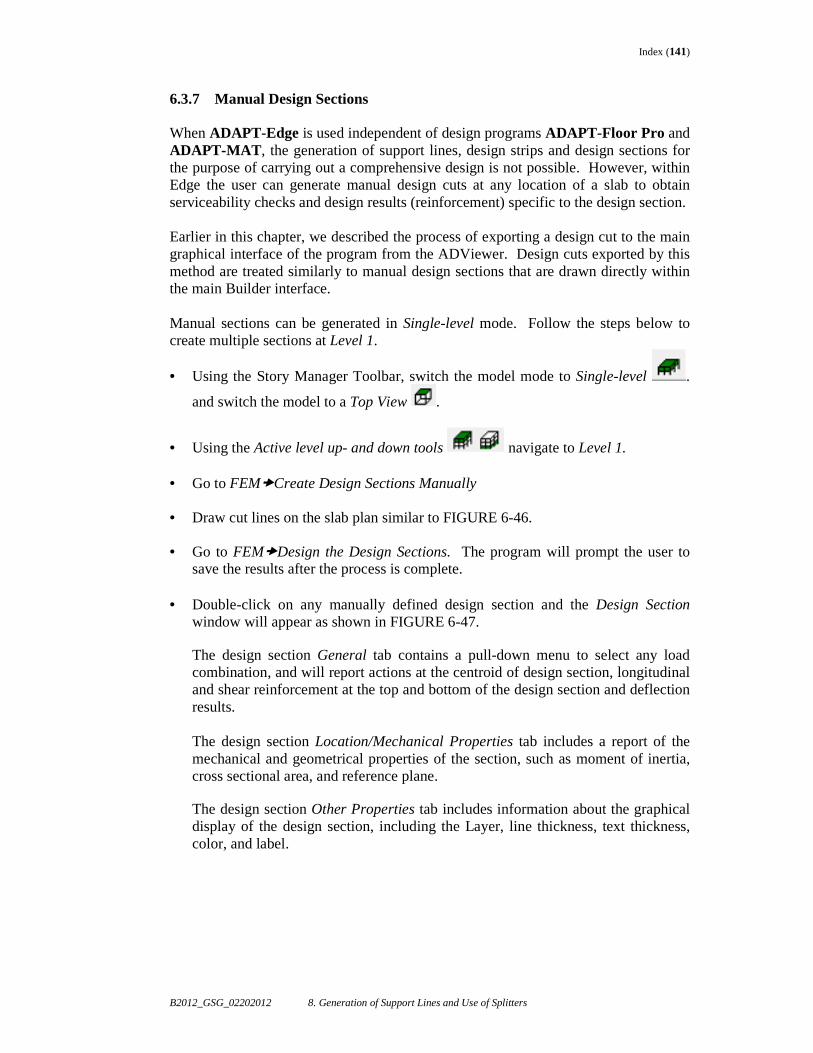
Index (141)
B2012_GSG_02202012 8. Generation of Support Lines and Use of Splitters
6.3.7 Manual Design Sections When ADAPT-Edge is used independent of design programs ADAPT-Floor Pro and ADAPT-MAT , the generation of support lines, design strips and design sections for the purpose of carrying out a comprehensive design is not possible. However, within Edge the user can generate manual design cuts at any location of a slab to obtain serviceability checks and design results (reinforcement) specific to the design section. Earlier in this chapter, we described the process of exporting a design cut to the main graphical interface of the program from the ADViewer. Design cuts exported by this method are treated similarly to manual design sections that are drawn directly within the main Builder interface.
Manual sections can be generated in Single-level mode. Follow the steps below to create multiple sections at Level 1.
• Using the Story Manager Toolbar, switch the model mode to Single-level .
and switch the model to a Top View .
• Using the Active level up- and down tools navigate to Level 1.
• Go to FEM�Create Design Sections Manually • Draw cut lines on the slab plan similar to FIGURE 6-46. • Go to FEM�Design the Design Sections. The program will prompt the user to
save the results after the process is complete. • Double-click on any manually defined design section and the Design Section
window will appear as shown in FIGURE 6-47.
The design section General tab contains a pull-down menu to select any load combination, and will report actions at the centroid of design section, longitudinal and shear reinforcement at the top and bottom of the design section and deflection results. The design section Location/Mechanical Properties tab includes a report of the mechanical and geometrical properties of the section, such as moment of inertia, cross sectional area, and reference plane.
The design section Other Properties tab includes information about the graphical display of the design section, including the Layer, line thickness, text thickness, color, and label.
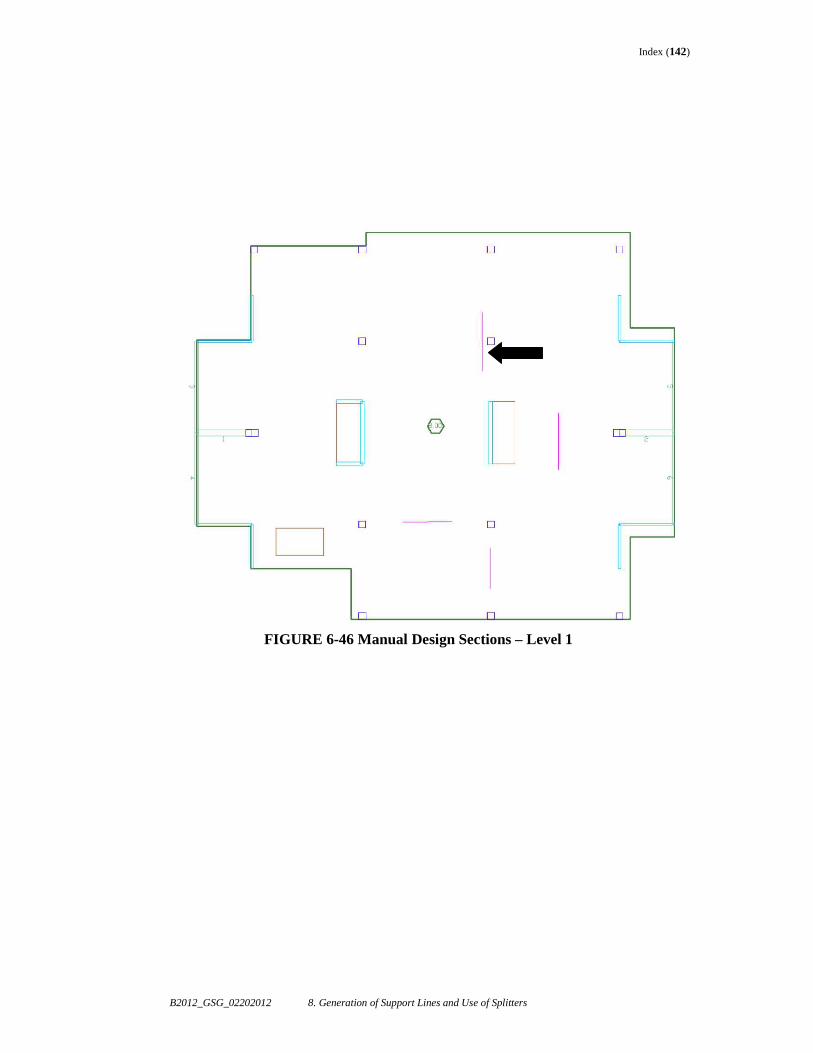
Index (142)
B2012_GSG_02202012 8. Generation of Support Lines and Use of Splitters
FIGURE 6-46 Manual Design Sections – Level 1
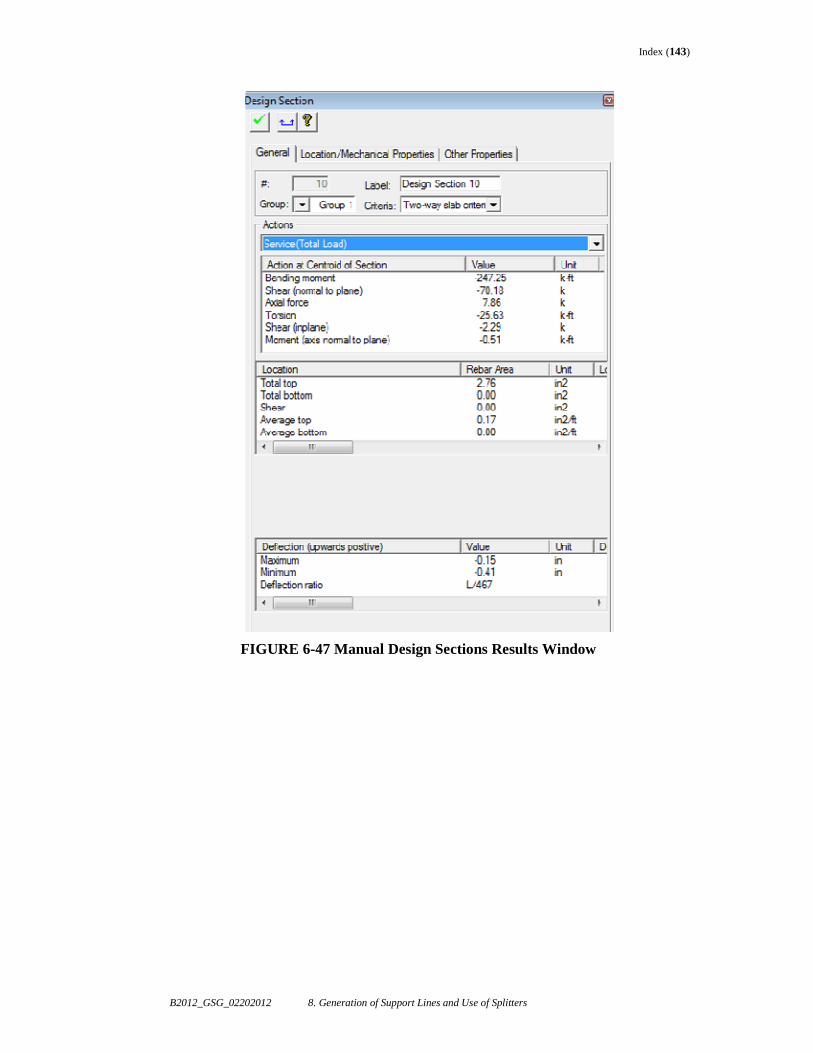
Index (143)
B2012_GSG_02202012 8. Generation of Support Lines and Use of Splitters
FIGURE 6-47 Manual Design Sections Results Window

Index (144)
B2012_GSG_02202012 8. Generation of Support Lines and Use of Splitters
7 ADAPT-FLOOR PRO – DESIGN OF SLAB SYSTEMS
The previous chapters described how a multistory or single-level model can be built or exported to ADAPT-Builder and how to use analytical and result tools for the purpose of analyzing the structure with ADAPT-Edge. ADAPT-Floor Pro is a program included in the ADAPT-Builder suite used for the design of concrete slab systems, both post-tensioned and conventional reinforced. This program can be launched independent of ADAPT-Edge. In this environment, the Story Manager tools are available if the user desires to build a multistory model within Floor Pro. However, when Floor Pro is opened independently, the ADAPT-Builder analysis engine will operate only in Single-level mode and designs of levels can be performed level-by-level. In other words, a global analysis does not apply when Floor Pro is used independently unless the multistory model has previously been analyzed in ADAPT-Edge. Any Edge model can be opened with ADAPT-Floor Pro and if a global solution has been saved, the user can include the Building Load solution in a single-level Floor Pro design. When a single-level model is built in ADAPT-Floor Pro , all of the modeling, analysis and results tools described in this document still apply. When ADAPT-Floor Pro is opened simultaneously with ADAPT-Edge, the user has the ability to analyze and design multiple levels at a time. The objective of this example is to describe the beginning process of designing a floor slab using the results obtained from the preceding multistory analysis. Level 4 will be used for this example as it has various intricacies including transfer beams, tendons, etc. Since the multistory model has been analyzed and a global solution exists, and in this case we are only designing one level, we will open ADAPT-Floor Pro only, as shown in FIGURE 7-1. Note that since ADAPT-Edge is not selected, the program restricts analysis and design to a single level. In this case, a re-analysis of Level 4 is not required because of the current global solution.
Index (145)
B2012_GSG_02202012 8. Generation of Support Lines and Use of Splitters
FIGURE 7-1 Builder Platform Module Selection – Floor Pro only
7.1 SUPPORT LINES AND SPLITTERS To expedite the design process in ADAPT-Floor Pro , each slab must be sub-divided into multiple design strips associated with a specific design criteria (two-way slab, one-way slab or beam) for each global direction of the slab, X and Y. These strips are further sub-divided into design sections for the purpose of determining design actions, stresses, reinforcement, etc. The user has complete flexibility and control over the location of design strips and density and distribution of design sections. The fundamental tools required for generation of design strips are Support Lines and Splitters. The ADAPT-Floor Pro 2012 User Manual contains a detailed description and purpose of these tools and others required for the generation of design strips. The intent of this section is to show how these tools are used specific to this example. Features that are new to ADAPT-Builder 2012 will be described in more detail.
7.1.1 X-Direction
• Ensure that the model is in Single-level mode , navigate to Level 4 and
switch the model to a Top View . Notice that while the program is open in Floor Pro without Edge, you are still able to scroll to all levels with the Story Manager Toolbar. If the Story Manager Toolbar is toggled to Full-structure mode and you select the FEM menu, FIGURE 7-2 shows several options that are inactive since Edge is not in use.
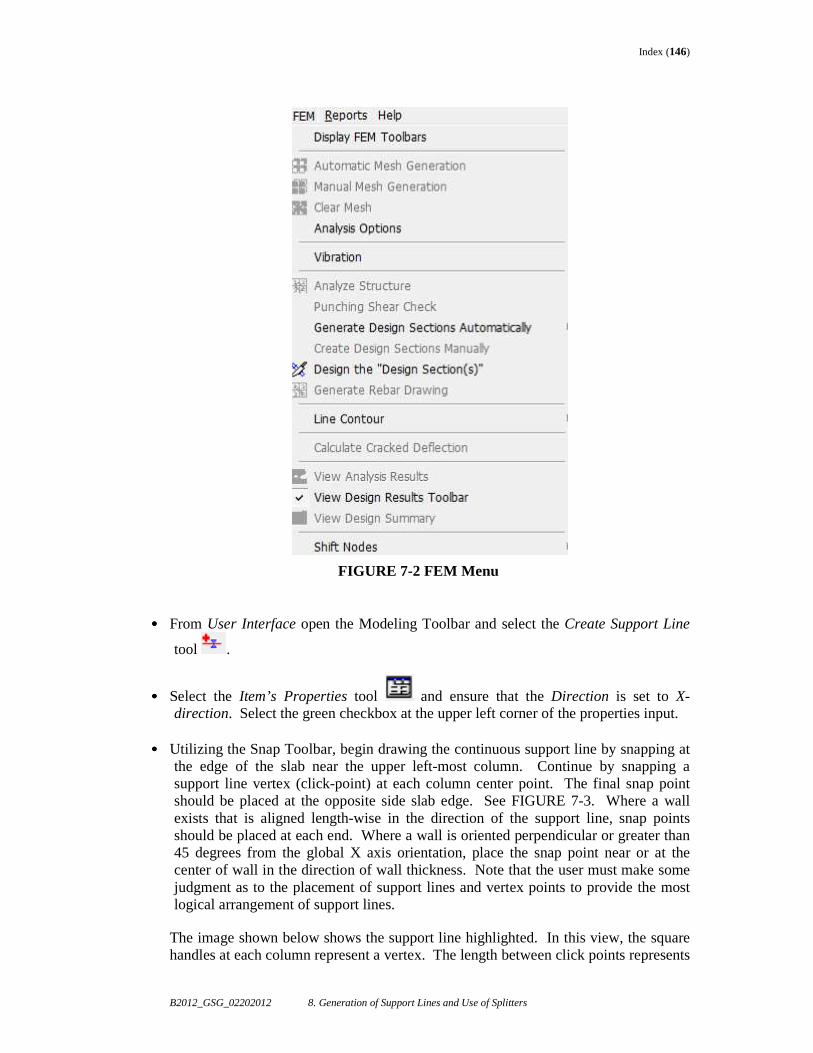
Index (146)
B2012_GSG_02202012 8. Generation of Support Lines and Use of Splitters
FIGURE 7-2 FEM Menu
•••• From User Interface open the Modeling Toolbar and select the Create Support Line
tool .
•••• Select the Item’s Properties tool and ensure that the Direction is set to X-direction. Select the green checkbox at the upper left corner of the properties input.
•••• Utilizing the Snap Toolbar, begin drawing the continuous support line by snapping at
the edge of the slab near the upper left-most column. Continue by snapping a support line vertex (click-point) at each column center point. The final snap point should be placed at the opposite side slab edge. See FIGURE 7-3. Where a wall exists that is aligned length-wise in the direction of the support line, snap points should be placed at each end. Where a wall is oriented perpendicular or greater than 45 degrees from the global X axis orientation, place the snap point near or at the center of wall in the direction of wall thickness. Note that the user must make some judgment as to the placement of support lines and vertex points to provide the most logical arrangement of support lines.
The image shown below shows the support line highlighted. In this view, the square handles at each column represent a vertex. The length between click points represents
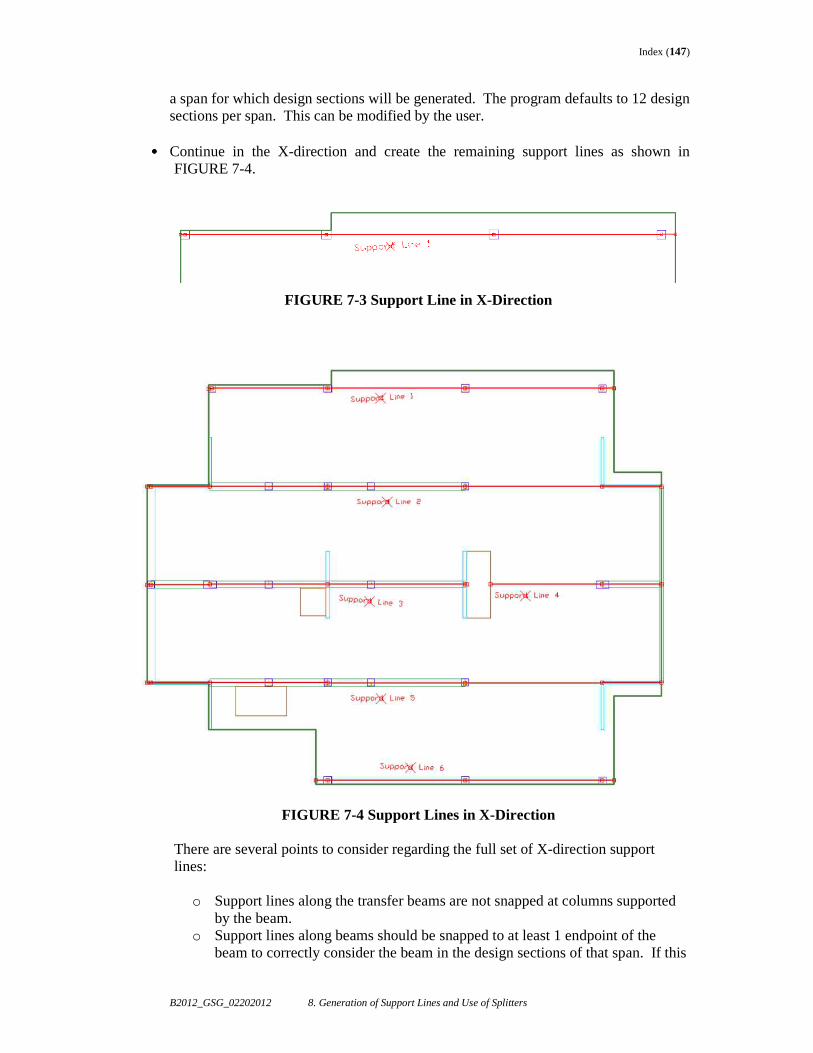
Index (147)
B2012_GSG_02202012 8. Generation of Support Lines and Use of Splitters
a span for which design sections will be generated. The program defaults to 12 design sections per span. This can be modified by the user.
•••• Continue in the X-direction and create the remaining support lines as shown in FIGURE 7-4.
FIGURE 7-3 Support Line in X-Direction
FIGURE 7-4 Support Lines in X-Direction There are several points to consider regarding the full set of X-direction support lines:
o Support lines along the transfer beams are not snapped at columns supported by the beam.
o Support lines along beams should be snapped to at least 1 endpoint of the beam to correctly consider the beam in the design sections of that span. If this
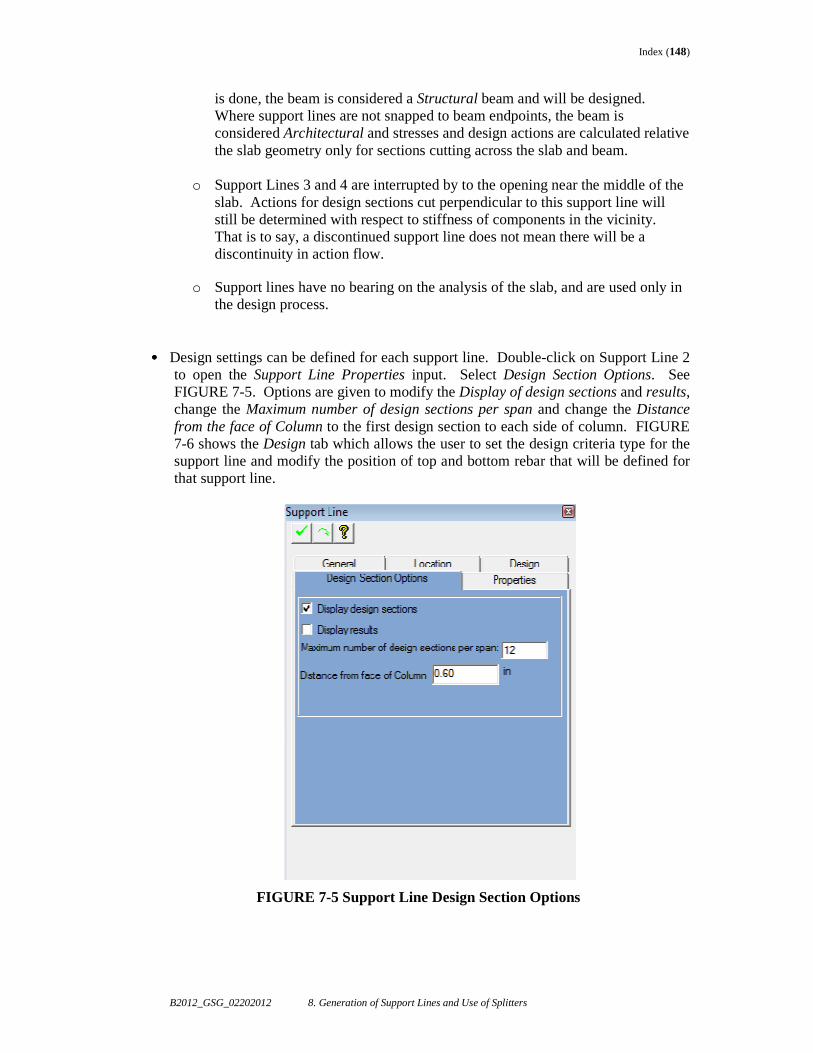
Index (148)
B2012_GSG_02202012 8. Generation of Support Lines and Use of Splitters
is done, the beam is considered a Structural beam and will be designed. Where support lines are not snapped to beam endpoints, the beam is considered Architectural and stresses and design actions are calculated relative the slab geometry only for sections cutting across the slab and beam.
o Support Lines 3 and 4 are interrupted by to the opening near the middle of the slab. Actions for design sections cut perpendicular to this support line will still be determined with respect to stiffness of components in the vicinity. That is to say, a discontinued support line does not mean there will be a discontinuity in action flow.
o Support lines have no bearing on the analysis of the slab, and are used only in
the design process.
•••• Design settings can be defined for each support line. Double-click on Support Line 2
to open the Support Line Properties input. Select Design Section Options. See FIGURE 7-5. Options are given to modify the Display of design sections and results, change the Maximum number of design sections per span and change the Distance from the face of Column to the first design section to each side of column. FIGURE 7-6 shows the Design tab which allows the user to set the design criteria type for the support line and modify the position of top and bottom rebar that will be defined for that support line.
FIGURE 7-5 Support Line Design Section Options
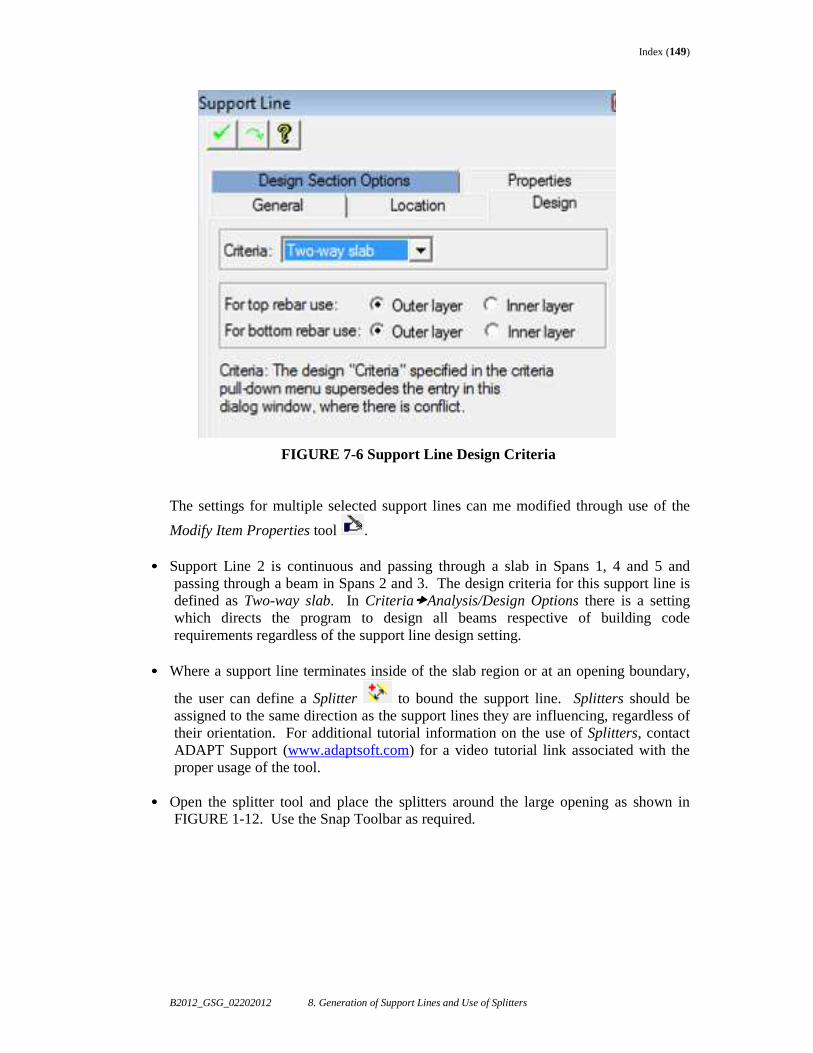
Index (149)
B2012_GSG_02202012 8. Generation of Support Lines and Use of Splitters
FIGURE 7-6 Support Line Design Criteria
The settings for multiple selected support lines can me modified through use of the
Modify Item Properties tool . •••• Support Line 2 is continuous and passing through a slab in Spans 1, 4 and 5 and
passing through a beam in Spans 2 and 3. The design criteria for this support line is defined as Two-way slab. In Criteria�Analysis/Design Options there is a setting which directs the program to design all beams respective of building code requirements regardless of the support line design setting.
•••• Where a support line terminates inside of the slab region or at an opening boundary,
the user can define a Splitter to bound the support line. Splitters should be assigned to the same direction as the support lines they are influencing, regardless of their orientation. For additional tutorial information on the use of Splitters, contact ADAPT Support (www.adaptsoft.com) for a video tutorial link associated with the proper usage of the tool.
•••• Open the splitter tool and place the splitters around the large opening as shown in
FIGURE 1-12. Use the Snap Toolbar as required.
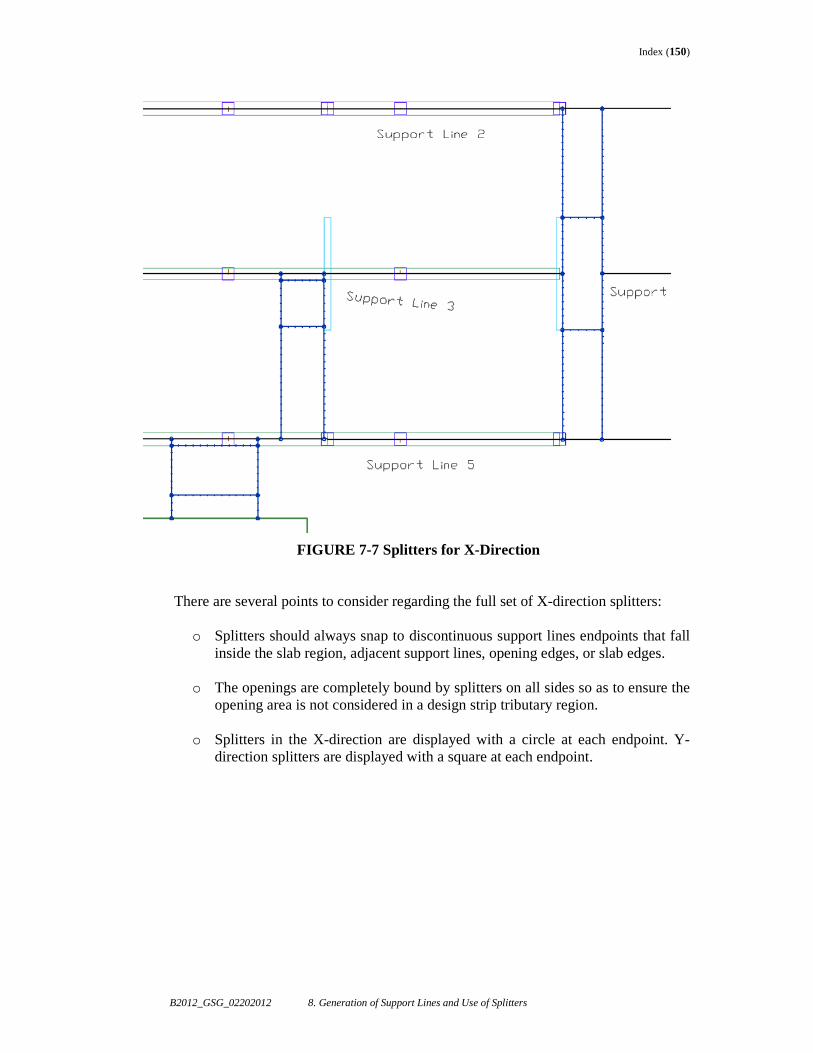
Index (150)
B2012_GSG_02202012 8. Generation of Support Lines and Use of Splitters
FIGURE 7-7 Splitters for X-Direction
There are several points to consider regarding the full set of X-direction splitters:
o Splitters should always snap to discontinuous support lines endpoints that fall inside the slab region, adjacent support lines, opening edges, or slab edges.
o The openings are completely bound by splitters on all sides so as to ensure the opening area is not considered in a design strip tributary region.
o Splitters in the X-direction are displayed with a circle at each endpoint. Y-direction splitters are displayed with a square at each endpoint.
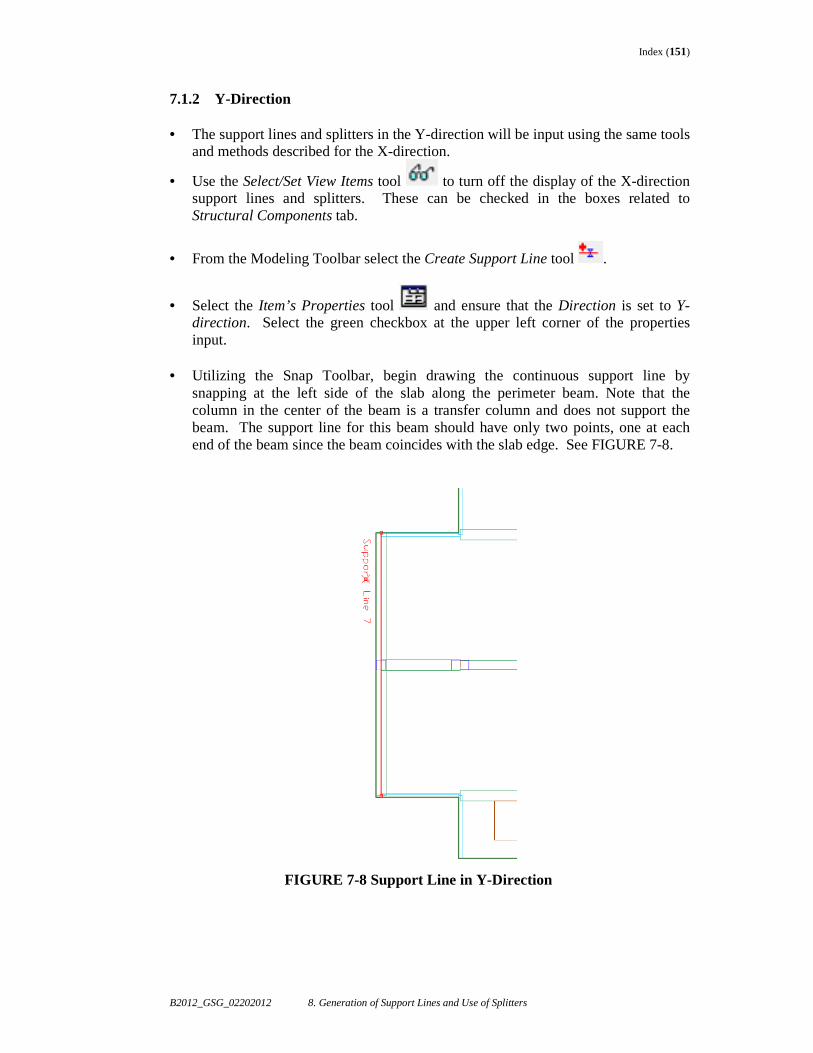
Index (151)
B2012_GSG_02202012 8. Generation of Support Lines and Use of Splitters
7.1.2 Y-Direction
• The support lines and splitters in the Y-direction will be input using the same tools and methods described for the X-direction.
• Use the Select/Set View Items tool to turn off the display of the X-direction support lines and splitters. These can be checked in the boxes related to Structural Components tab.
• From the Modeling Toolbar select the Create Support Line tool .
• Select the Item’s Properties tool and ensure that the Direction is set to Y-direction. Select the green checkbox at the upper left corner of the properties input.
• Utilizing the Snap Toolbar, begin drawing the continuous support line by
snapping at the left side of the slab along the perimeter beam. Note that the column in the center of the beam is a transfer column and does not support the beam. The support line for this beam should have only two points, one at each end of the beam since the beam coincides with the slab edge. See FIGURE 7-8.
FIGURE 7-8 Support Line in Y-Direction
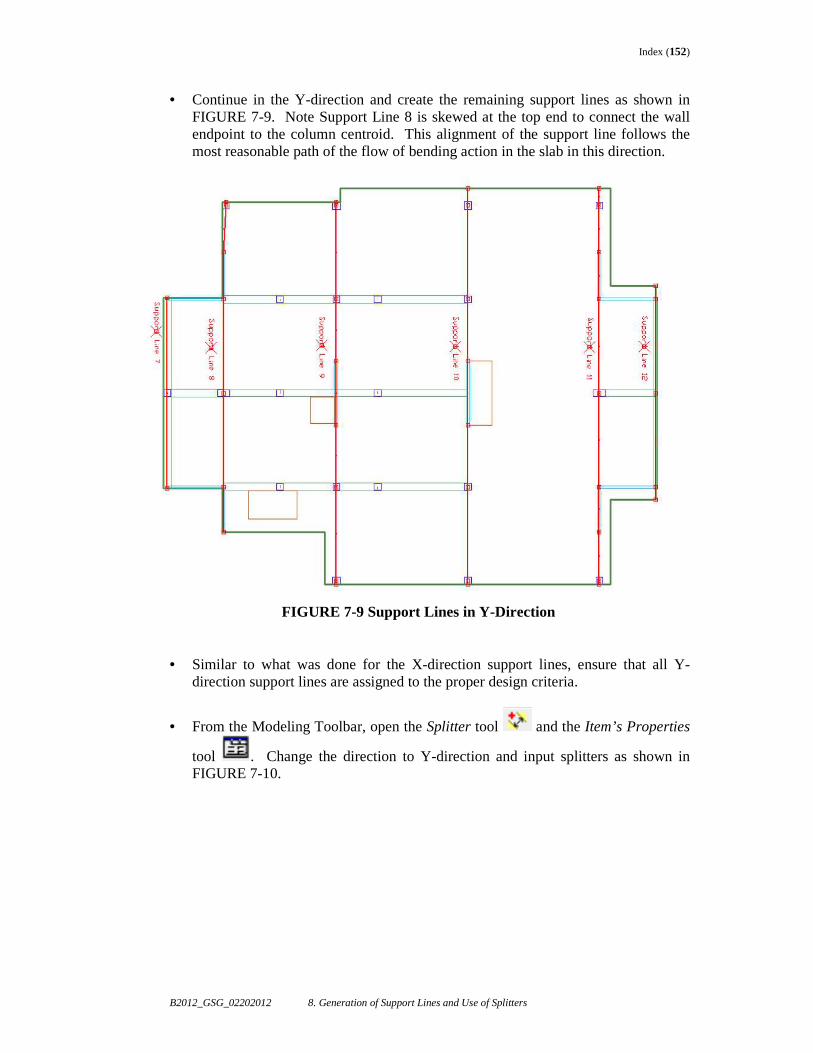
Index (152)
B2012_GSG_02202012 8. Generation of Support Lines and Use of Splitters
• Continue in the Y-direction and create the remaining support lines as shown in FIGURE 7-9. Note Support Line 8 is skewed at the top end to connect the wall endpoint to the column centroid. This alignment of the support line follows the most reasonable path of the flow of bending action in the slab in this direction.
FIGURE 7-9 Support Lines in Y-Direction
• Similar to what was done for the X-direction support lines, ensure that all Y-
direction support lines are assigned to the proper design criteria.
• From the Modeling Toolbar, open the Splitter tool and the Item’s Properties
tool . Change the direction to Y-direction and input splitters as shown in FIGURE 7-10.
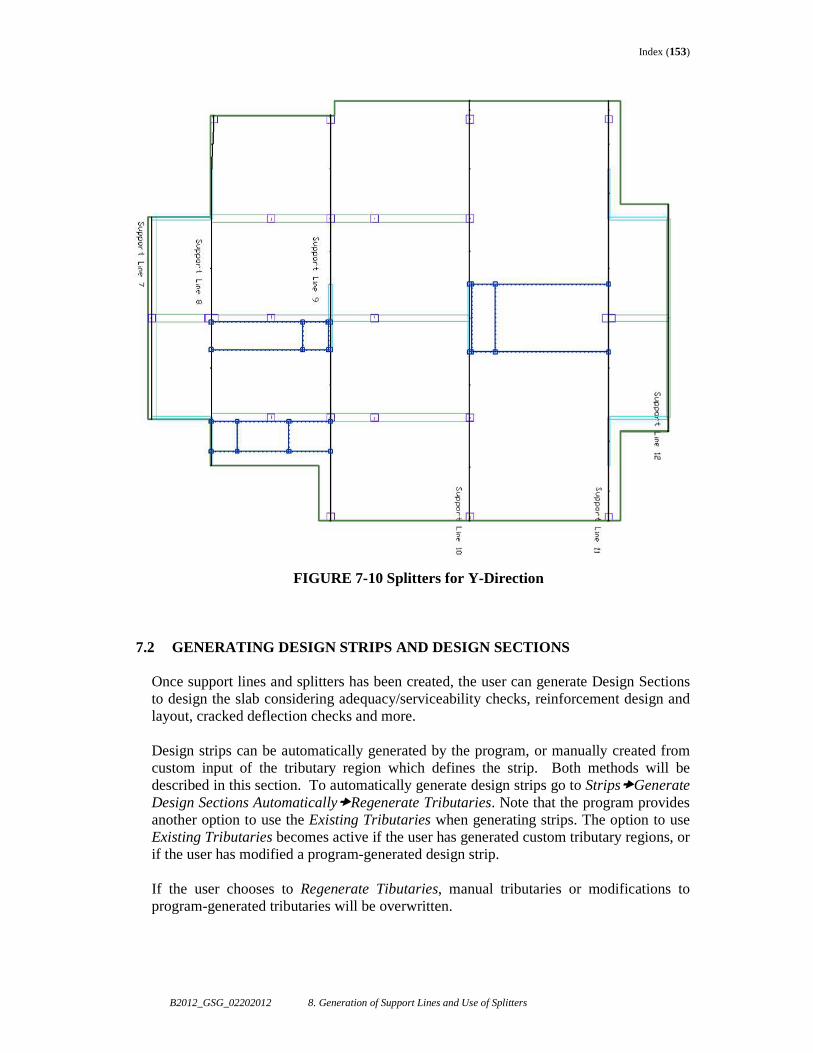
Index (153)
B2012_GSG_02202012 8. Generation of Support Lines and Use of Splitters
FIGURE 7-10 Splitters for Y-Direction
7.2 GENERATING DESIGN STRIPS AND DESIGN SECTIONS Once support lines and splitters has been created, the user can generate Design Sections to design the slab considering adequacy/serviceability checks, reinforcement design and layout, cracked deflection checks and more. Design strips can be automatically generated by the program, or manually created from custom input of the tributary region which defines the strip. Both methods will be described in this section. To automatically generate design strips go to Strips�Generate Design Sections Automatically�Regenerate Tributaries. Note that the program provides another option to use the Existing Tributaries when generating strips. The option to use Existing Tributaries becomes active if the user has generated custom tributary regions, or if the user has modified a program-generated design strip. If the user chooses to Regenerate Tibutaries, manual tributaries or modifications to program-generated tributaries will be overwritten.
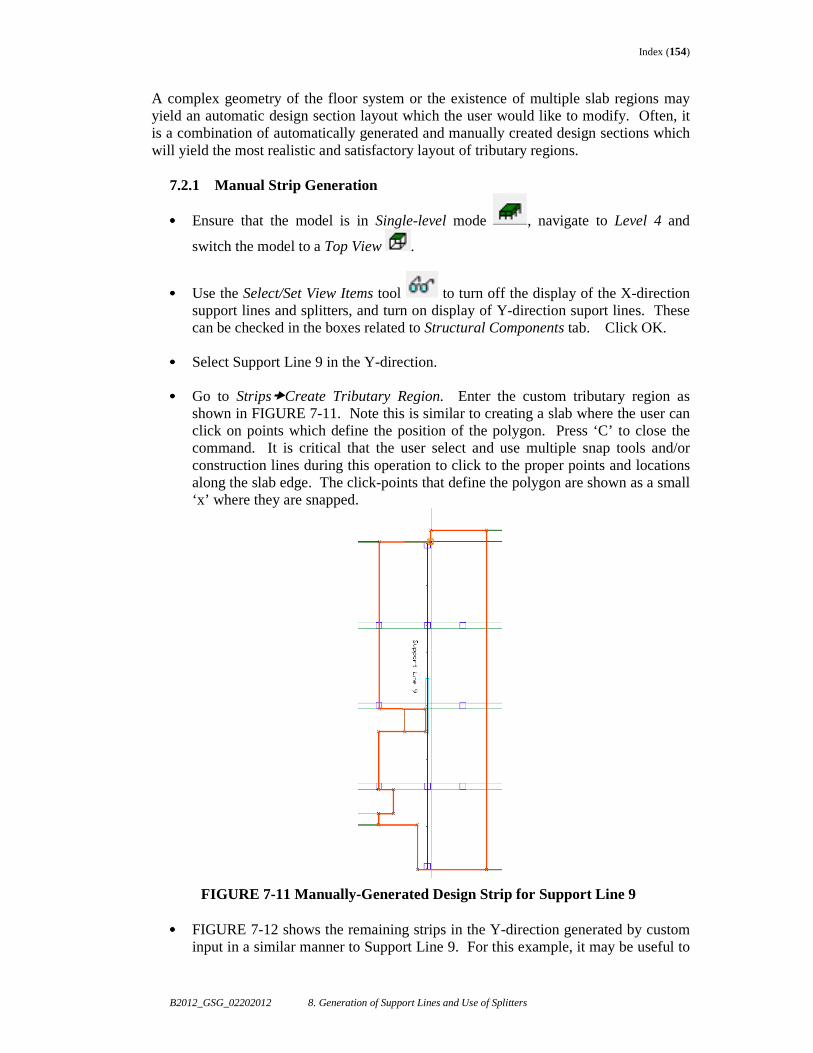
Index (154)
B2012_GSG_02202012 8. Generation of Support Lines and Use of Splitters
A complex geometry of the floor system or the existence of multiple slab regions may yield an automatic design section layout which the user would like to modify. Often, it is a combination of automatically generated and manually created design sections which will yield the most realistic and satisfactory layout of tributary regions.
7.2.1 Manual Strip Generation
•••• Ensure that the model is in Single-level mode , navigate to Level 4 and
switch the model to a Top View .
•••• Use the Select/Set View Items tool to turn off the display of the X-direction support lines and splitters, and turn on display of Y-direction suport lines. These can be checked in the boxes related to Structural Components tab. Click OK.
•••• Select Support Line 9 in the Y-direction. •••• Go to Strips�Create Tributary Region. Enter the custom tributary region as
shown in FIGURE 7-11. Note this is similar to creating a slab where the user can click on points which define the position of the polygon. Press ‘C’ to close the command. It is critical that the user select and use multiple snap tools and/or construction lines during this operation to click to the proper points and locations along the slab edge. The click-points that define the polygon are shown as a small ‘x’ where they are snapped.
FIGURE 7-11 Manually-Generated Design Strip for Support Line 9
•••• FIGURE 7-12 shows the remaining strips in the Y-direction generated by custom input in a similar manner to Support Line 9. For this example, it may be useful to
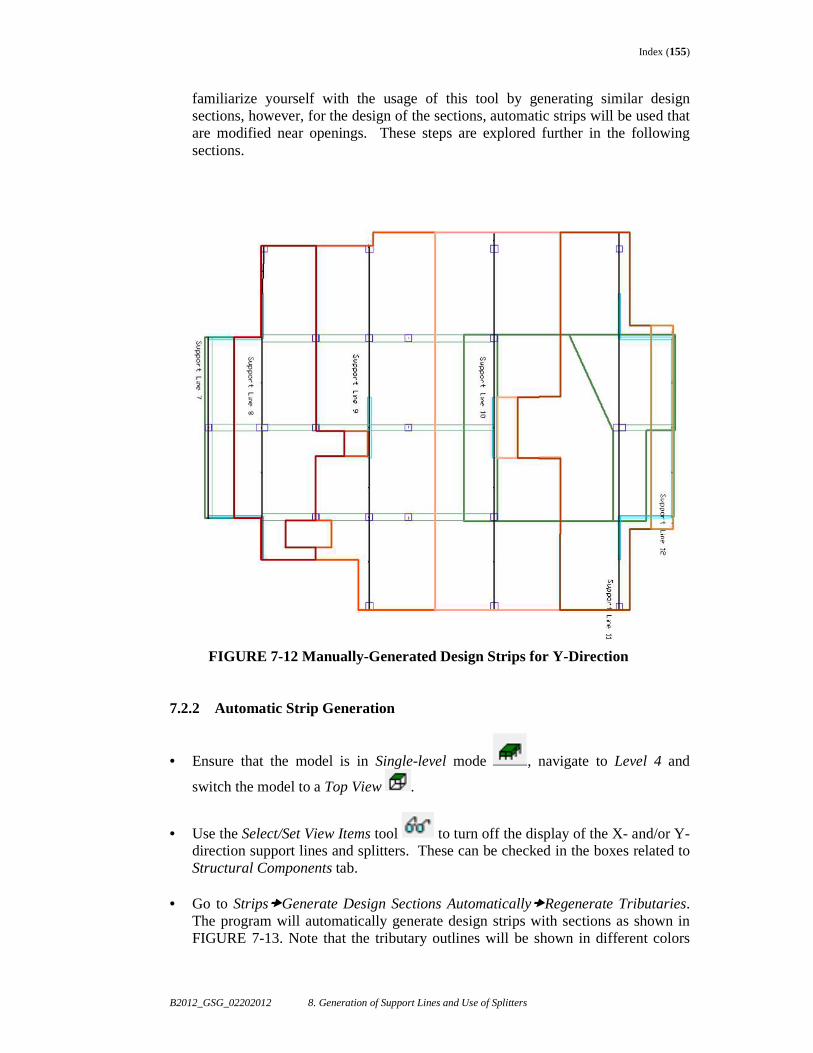
Index (155)
B2012_GSG_02202012 8. Generation of Support Lines and Use of Splitters
familiarize yourself with the usage of this tool by generating similar design sections, however, for the design of the sections, automatic strips will be used that are modified near openings. These steps are explored further in the following sections.
FIGURE 7-12 Manually-Generated Design Strips for Y-Direction
7.2.2 Automatic Strip Generation
• Ensure that the model is in Single-level mode , navigate to Level 4 and
switch the model to a Top View .
• Use the Select/Set View Items tool to turn off the display of the X- and/or Y-direction support lines and splitters. These can be checked in the boxes related to Structural Components tab.
• Go to Strips�Generate Design Sections Automatically�Regenerate Tributaries. The program will automatically generate design strips with sections as shown in FIGURE 7-13. Note that the tributary outlines will be shown in different colors
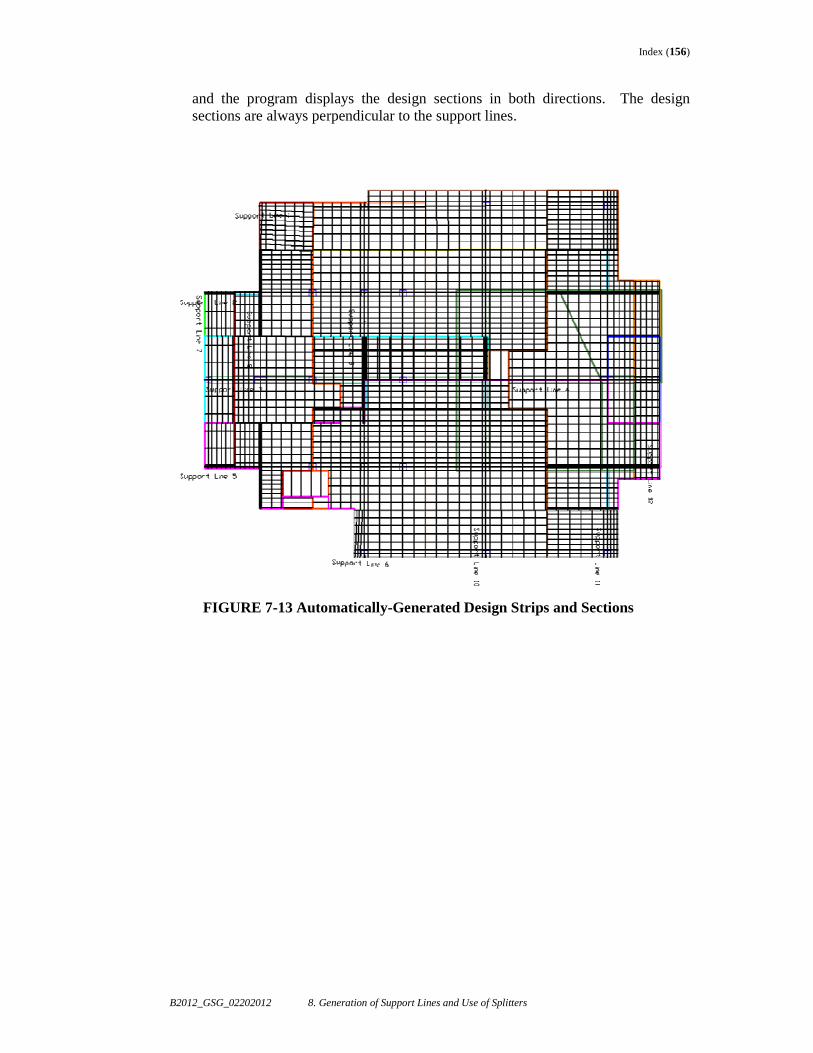
Index (156)
B2012_GSG_02202012 8. Generation of Support Lines and Use of Splitters
and the program displays the design sections in both directions. The design sections are always perpendicular to the support lines.
FIGURE 7-13 Automatically-Generated Design Strips and Sections
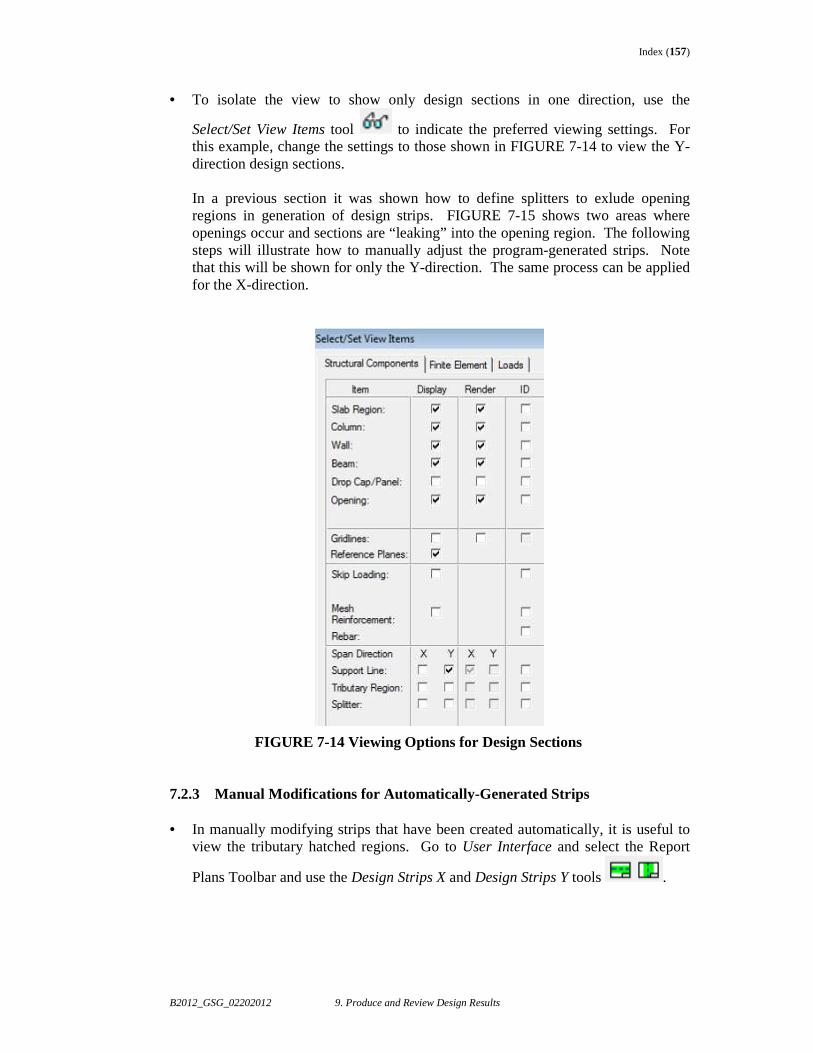
Index (157)
B2012_GSG_02202012 9. Produce and Review Design Results
• To isolate the view to show only design sections in one direction, use the
Select/Set View Items tool to indicate the preferred viewing settings. For this example, change the settings to those shown in FIGURE 7-14 to view the Y-direction design sections.
In a previous section it was shown how to define splitters to exlude opening regions in generation of design strips. FIGURE 7-15 shows two areas where openings occur and sections are “leaking” into the opening region. The following steps will illustrate how to manually adjust the program-generated strips. Note that this will be shown for only the Y-direction. The same process can be applied for the X-direction.
FIGURE 7-14 Viewing Options for Design Sections
7.2.3 Manual Modifications for Automatically-Generated Strips • In manually modifying strips that have been created automatically, it is useful to
view the tributary hatched regions. Go to User Interface and select the Report
Plans Toolbar and use the Design Strips X and Design Strips Y tools .
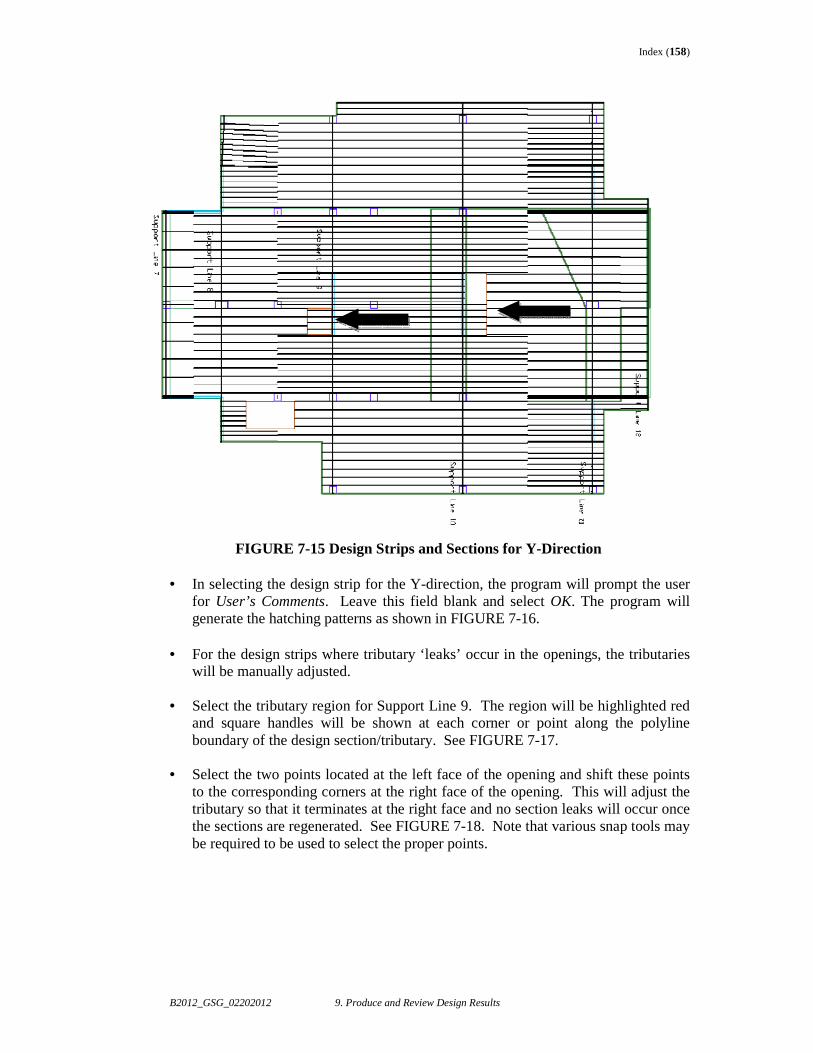
Index (158)
B2012_GSG_02202012 9. Produce and Review Design Results
FIGURE 7-15 Design Strips and Sections for Y-Direction
• In selecting the design strip for the Y-direction, the program will prompt the user for User’s Comments. Leave this field blank and select OK. The program will generate the hatching patterns as shown in FIGURE 7-16.
• For the design strips where tributary ‘leaks’ occur in the openings, the tributaries
will be manually adjusted. • Select the tributary region for Support Line 9. The region will be highlighted red
and square handles will be shown at each corner or point along the polyline boundary of the design section/tributary. See FIGURE 7-17.
• Select the two points located at the left face of the opening and shift these points
to the corresponding corners at the right face of the opening. This will adjust the tributary so that it terminates at the right face and no section leaks will occur once the sections are regenerated. See FIGURE 7-18. Note that various snap tools may be required to be used to select the proper points.
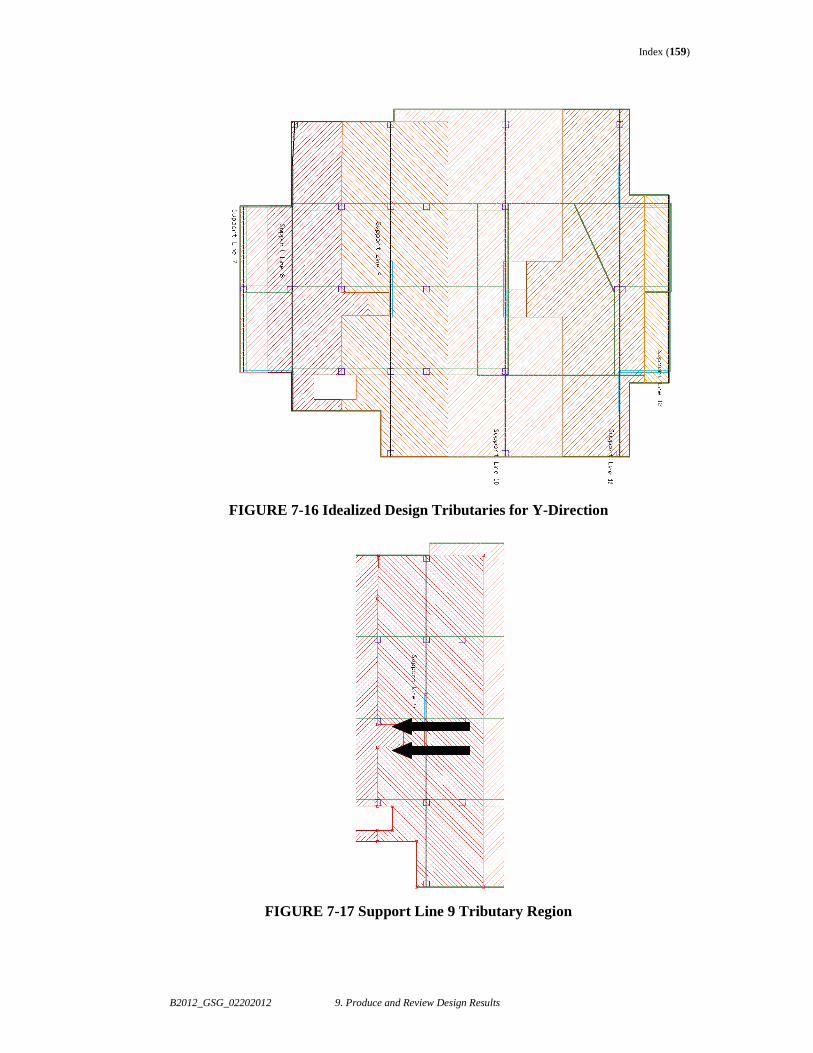
Index (159)
B2012_GSG_02202012 9. Produce and Review Design Results
FIGURE 7-16 Idealized Design Tributaries for Y-Direction
FIGURE 7-17 Support Line 9 Tributary Region
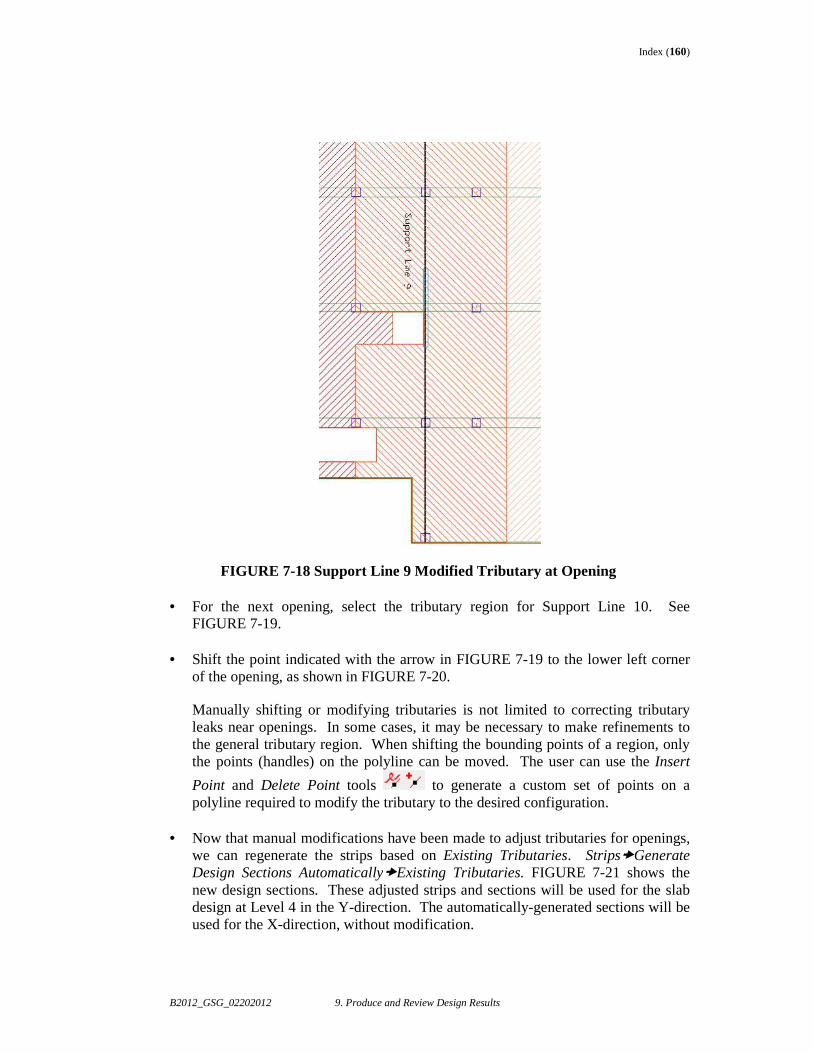
Index (160)
B2012_GSG_02202012 9. Produce and Review Design Results
FIGURE 7-18 Support Line 9 Modified Tributary at Op ening
• For the next opening, select the tributary region for Support Line 10. See FIGURE 7-19.
• Shift the point indicated with the arrow in FIGURE 7-19 to the lower left corner
of the opening, as shown in FIGURE 7-20.
Manually shifting or modifying tributaries is not limited to correcting tributary leaks near openings. In some cases, it may be necessary to make refinements to the general tributary region. When shifting the bounding points of a region, only the points (handles) on the polyline can be moved. The user can use the Insert
Point and Delete Point tools to generate a custom set of points on a polyline required to modify the tributary to the desired configuration.
• Now that manual modifications have been made to adjust tributaries for openings,
we can regenerate the strips based on Existing Tributaries. Strips�Generate Design Sections Automatically�Existing Tributaries. FIGURE 7-21 shows the new design sections. These adjusted strips and sections will be used for the slab design at Level 4 in the Y-direction. The automatically-generated sections will be used for the X-direction, without modification.
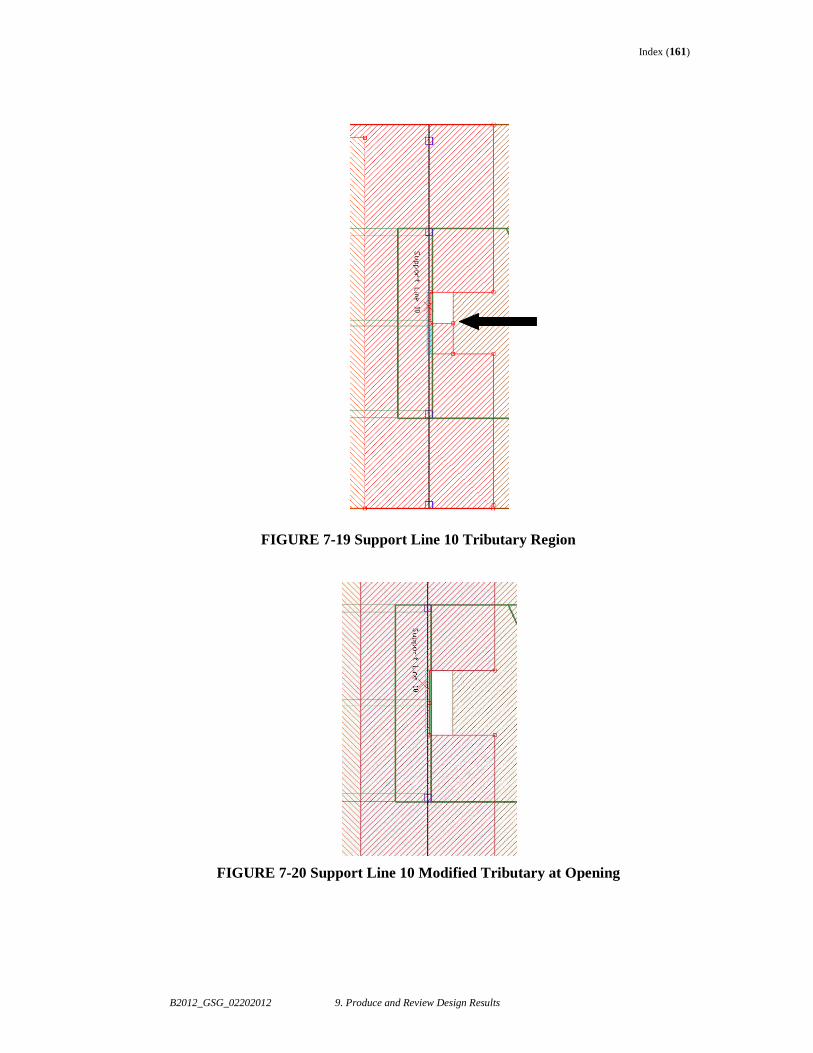
Index (161)
B2012_GSG_02202012 9. Produce and Review Design Results
FIGURE 7-19 Support Line 10 Tributary Region
FIGURE 7-20 Support Line 10 Modified Tributary at Opening
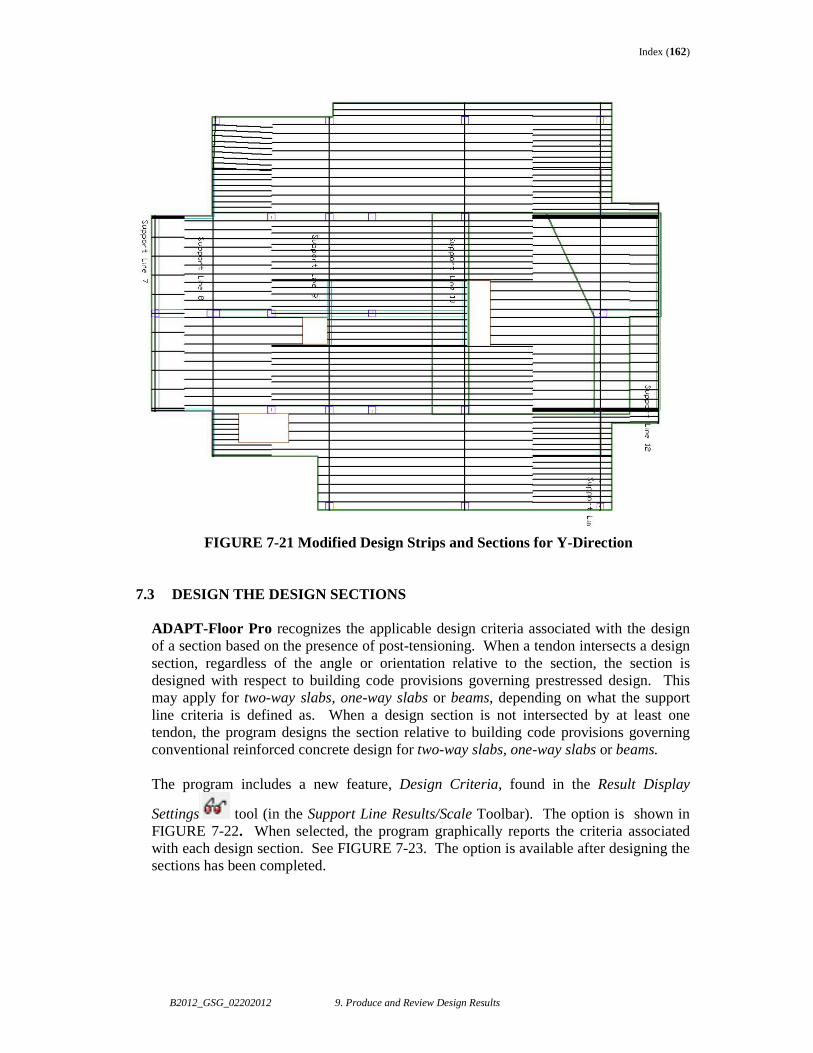
Index (162)
B2012_GSG_02202012 9. Produce and Review Design Results
FIGURE 7-21 Modified Design Strips and Sections for Y-Direction
7.3 DESIGN THE DESIGN SECTIONS ADAPT-Floor Pro recognizes the applicable design criteria associated with the design of a section based on the presence of post-tensioning. When a tendon intersects a design section, regardless of the angle or orientation relative to the section, the section is designed with respect to building code provisions governing prestressed design. This may apply for two-way slabs, one-way slabs or beams, depending on what the support line criteria is defined as. When a design section is not intersected by at least one tendon, the program designs the section relative to building code provisions governing conventional reinforced concrete design for two-way slabs, one-way slabs or beams. The program includes a new feature, Design Criteria, found in the Result Display
Settings tool (in the Support Line Results/Scale Toolbar). The option is shown in FIGURE 7-22. When selected, the program graphically reports the criteria associated with each design section. See FIGURE 7-23. The option is available after designing the sections has been completed.
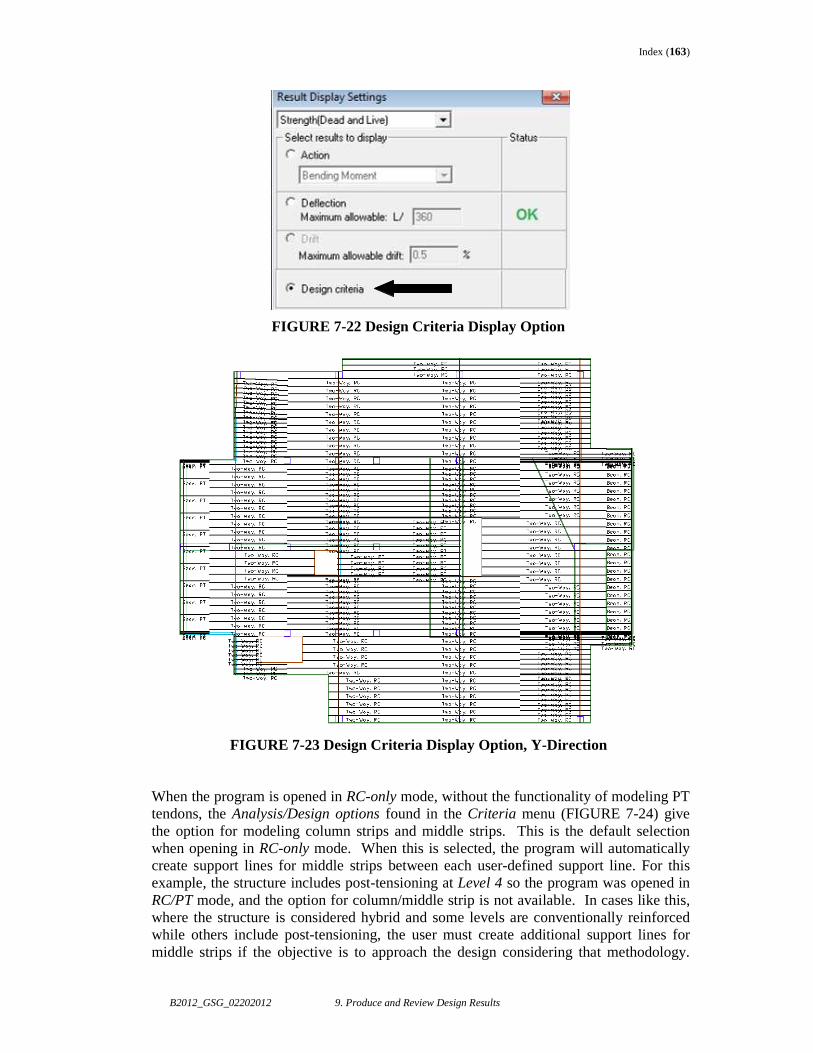
Index (163)
B2012_GSG_02202012 9. Produce and Review Design Results
FIGURE 7-22 Design Criteria Display Option
FIGURE 7-23 Design Criteria Display Option, Y-Direction
When the program is opened in RC-only mode, without the functionality of modeling PT tendons, the Analysis/Design options found in the Criteria menu (FIGURE 7-24) give the option for modeling column strips and middle strips. This is the default selection when opening in RC-only mode. When this is selected, the program will automatically create support lines for middle strips between each user-defined support line. For this example, the structure includes post-tensioning at Level 4 so the program was opened in RC/PT mode, and the option for column/middle strip is not available. In cases like this, where the structure is considered hybrid and some levels are conventionally reinforced while others include post-tensioning, the user must create additional support lines for middle strips if the objective is to approach the design considering that methodology.
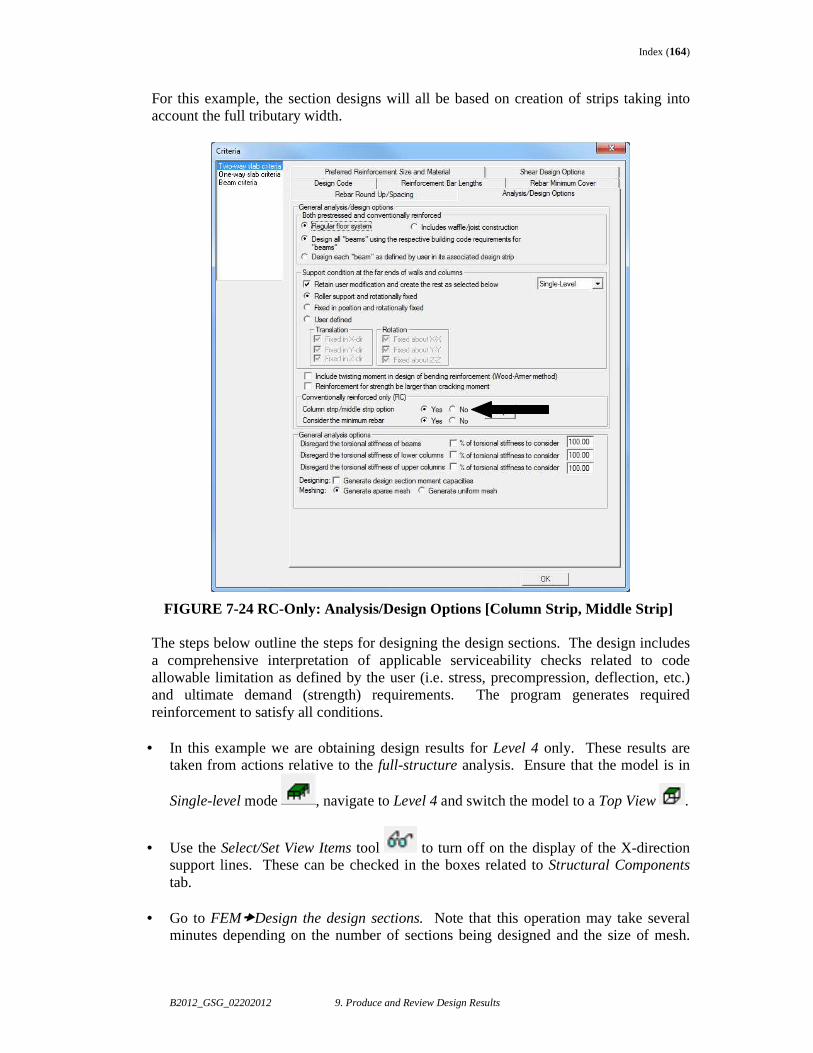
Index (164)
B2012_GSG_02202012 9. Produce and Review Design Results
For this example, the section designs will all be based on creation of strips taking into account the full tributary width.
FIGURE 7-24 RC-Only: Analysis/Design Options [Column Strip, Middle Strip] The steps below outline the steps for designing the design sections. The design includes a comprehensive interpretation of applicable serviceability checks related to code allowable limitation as defined by the user (i.e. stress, precompression, deflection, etc.) and ultimate demand (strength) requirements. The program generates required reinforcement to satisfy all conditions.
• In this example we are obtaining design results for Level 4 only. These results are taken from actions relative to the full-structure analysis. Ensure that the model is in
Single-level mode , navigate to Level 4 and switch the model to a Top View .
• Use the Select/Set View Items tool to turn off on the display of the X-direction support lines. These can be checked in the boxes related to Structural Components tab.
• Go to FEM�Design the design sections. Note that this operation may take several
minutes depending on the number of sections being designed and the size of mesh.
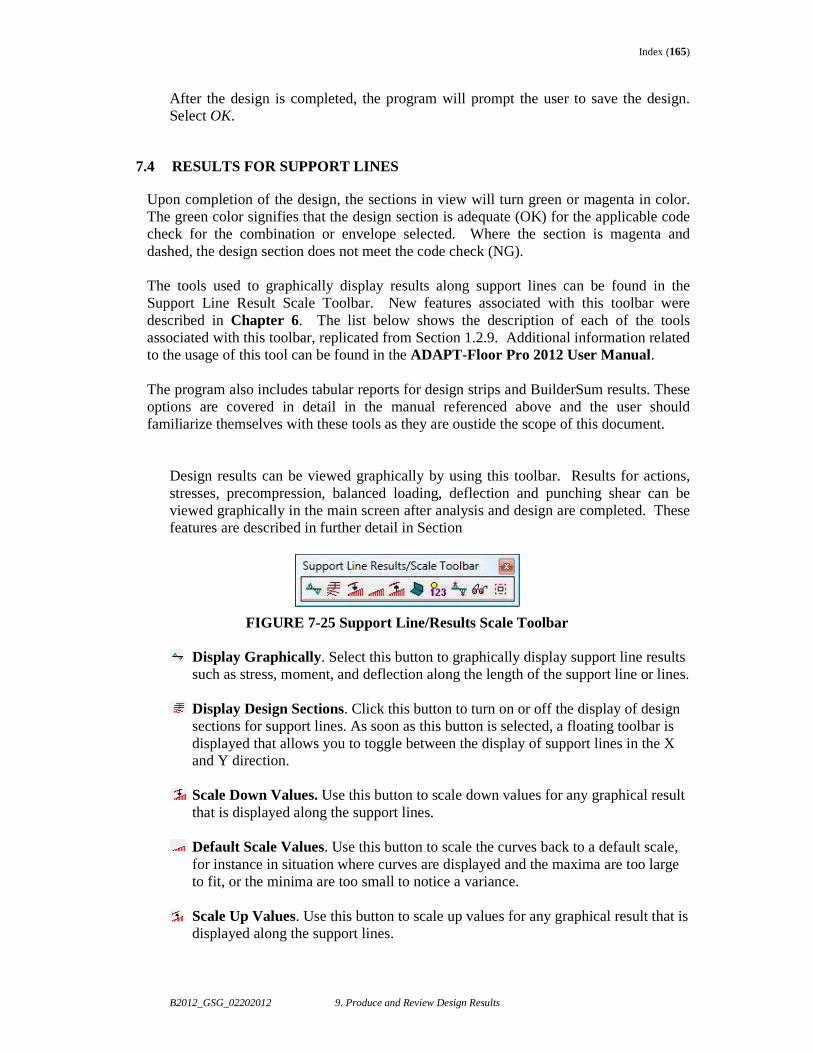
Index (165)
B2012_GSG_02202012 9. Produce and Review Design Results
After the design is completed, the program will prompt the user to save the design. Select OK.
7.4 RESULTS FOR SUPPORT LINES
Upon completion of the design, the sections in view will turn green or magenta in color. The green color signifies that the design section is adequate (OK) for the applicable code check for the combination or envelope selected. Where the section is magenta and dashed, the design section does not meet the code check (NG). The tools used to graphically display results along support lines can be found in the Support Line Result Scale Toolbar. New features associated with this toolbar were described in Chapter 6. The list below shows the description of each of the tools associated with this toolbar, replicated from Section 1.2.9. Additional information related to the usage of this tool can be found in the ADAPT-Floor Pro 2012 User Manual. The program also includes tabular reports for design strips and BuilderSum results. These options are covered in detail in the manual referenced above and the user should familiarize themselves with these tools as they are oustide the scope of this document.
Design results can be viewed graphically by using this toolbar. Results for actions, stresses, precompression, balanced loading, deflection and punching shear can be viewed graphically in the main screen after analysis and design are completed. These features are described in further detail in Section
FIGURE 7-25 Support Line/Results Scale Toolbar
Display Graphically. Select this button to graphically display support line results such as stress, moment, and deflection along the length of the support line or lines.
Display Design Sections. Click this button to turn on or off the display of design sections for support lines. As soon as this button is selected, a floating toolbar is displayed that allows you to toggle between the display of support lines in the X and Y direction.
Scale Down Values. Use this button to scale down values for any graphical result that is displayed along the support lines.
Default Scale Values. Use this button to scale the curves back to a default scale, for instance in situation where curves are displayed and the maxima are too large to fit, or the minima are too small to notice a variance.
Scale Up Values. Use this button to scale up values for any graphical result that is
displayed along the support lines.
Index (166)
B2012_GSG_02202012 9. Produce and Review Design Results
Perpendicular Projection. By default, all curves are displayed perpendicular to the slab surface, in the XY plane, and this icon is selected. De-select this to flip the curves into the Z plane. This option is generally used when viewing results in a 3D view.
Numerical Display. Select this button to display the numerical result values for each design section along the support lines.
Display Min/Max Values. Select this button to only display the minimum and maximum result values along the support lines.
Result Display Settings. Select this button to open the “Result Display Settings” window, to select the desired results to be displayed and to show general adequacy status for serviceability limits.
Display Punching Shear Design Outcome. Once you have executed the punching shear design (FEM ->Punching Shear Check), the results can be reviewed in the model by clicking on this button. The design outcome and stress ratios for columns and walls checked for two way punching shear will be displayed.
7.4.1 Result Display Settings
FIGURE 7-26 shows the selections that can be made in the Result Display Settings
tool as they apply to generating graphical results for design sections. An example of each item that can be displayed graphically is shown as it pertains to the X-direction support lines for Level 4 of this example. Note the first option in the menu allows the user to select a load combination or the envelope. For this example, the Service (Total Load) combination is selected for display.
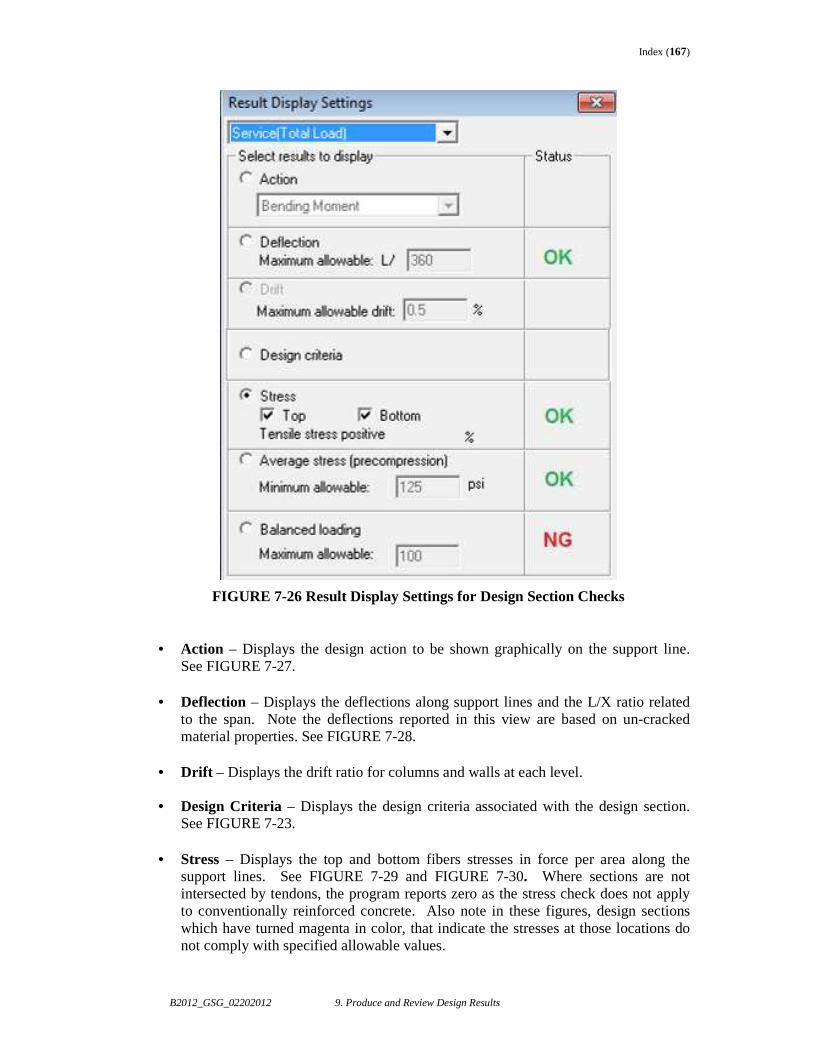
Index (167)
B2012_GSG_02202012 9. Produce and Review Design Results
FIGURE 7-26 Result Display Settings for Design Section Checks
• Action – Displays the design action to be shown graphically on the support line.
See FIGURE 7-27.
• Deflection – Displays the deflections along support lines and the L/X ratio related to the span. Note the deflections reported in this view are based on un-cracked material properties. See FIGURE 7-28.
• Drift – Displays the drift ratio for columns and walls at each level.
• Design Criteria – Displays the design criteria associated with the design section.
See FIGURE 7-23.
• Stress – Displays the top and bottom fibers stresses in force per area along the support lines. See FIGURE 7-29 and FIGURE 7-30. Where sections are not intersected by tendons, the program reports zero as the stress check does not apply to conventionally reinforced concrete. Also note in these figures, design sections which have turned magenta in color, that indicate the stresses at those locations do not comply with specified allowable values.
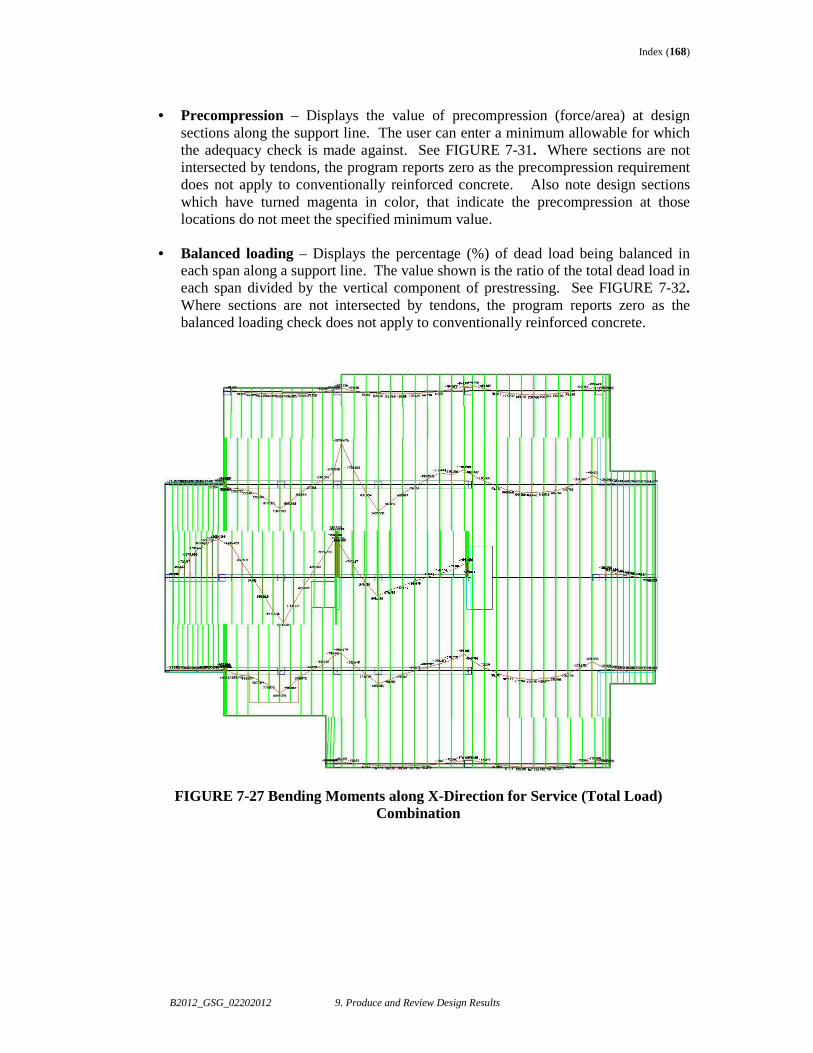
Index (168)
B2012_GSG_02202012 9. Produce and Review Design Results
• Precompression – Displays the value of precompression (force/area) at design
sections along the support line. The user can enter a minimum allowable for which the adequacy check is made against. See FIGURE 7-31. Where sections are not intersected by tendons, the program reports zero as the precompression requirement does not apply to conventionally reinforced concrete. Also note design sections which have turned magenta in color, that indicate the precompression at those locations do not meet the specified minimum value.
• Balanced loading – Displays the percentage (%) of dead load being balanced in
each span along a support line. The value shown is the ratio of the total dead load in each span divided by the vertical component of prestressing. See FIGURE 7-32. Where sections are not intersected by tendons, the program reports zero as the balanced loading check does not apply to conventionally reinforced concrete.
FIGURE 7-27 Bending Moments along X-Direction for Service (Total Load) Combination
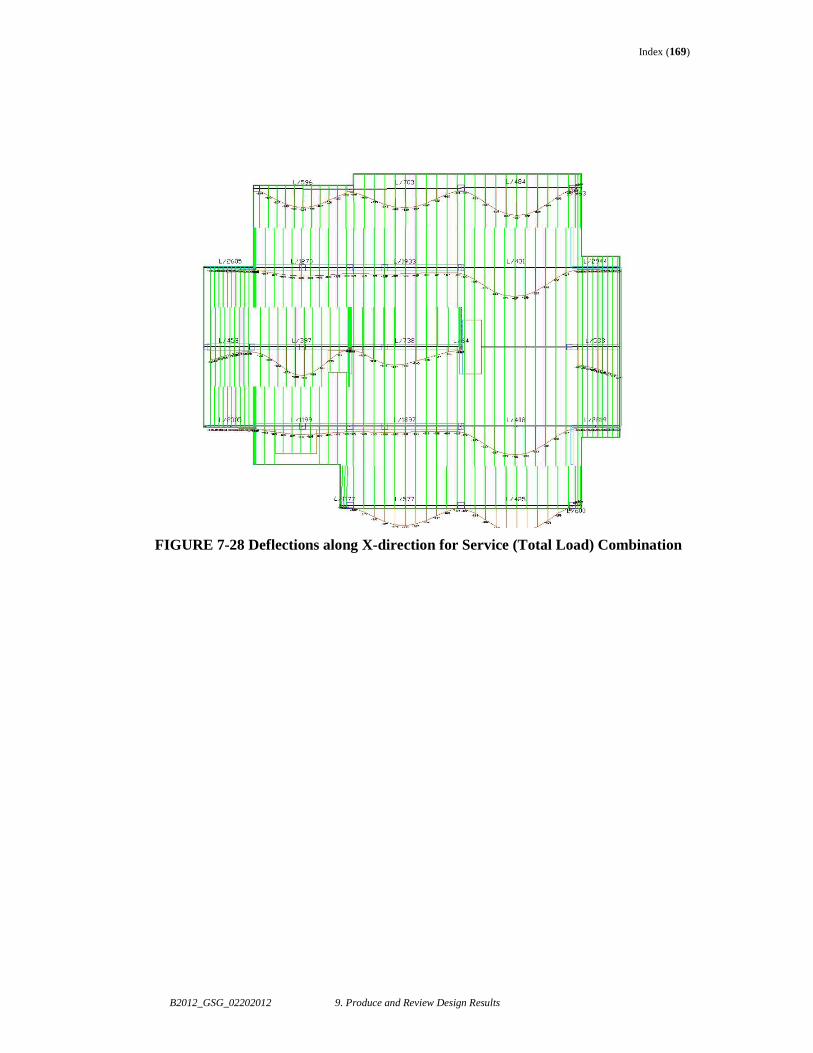
Index (169)
B2012_GSG_02202012 9. Produce and Review Design Results
FIGURE 7-28 Deflections along X-direction for Service (Total Load) Combination
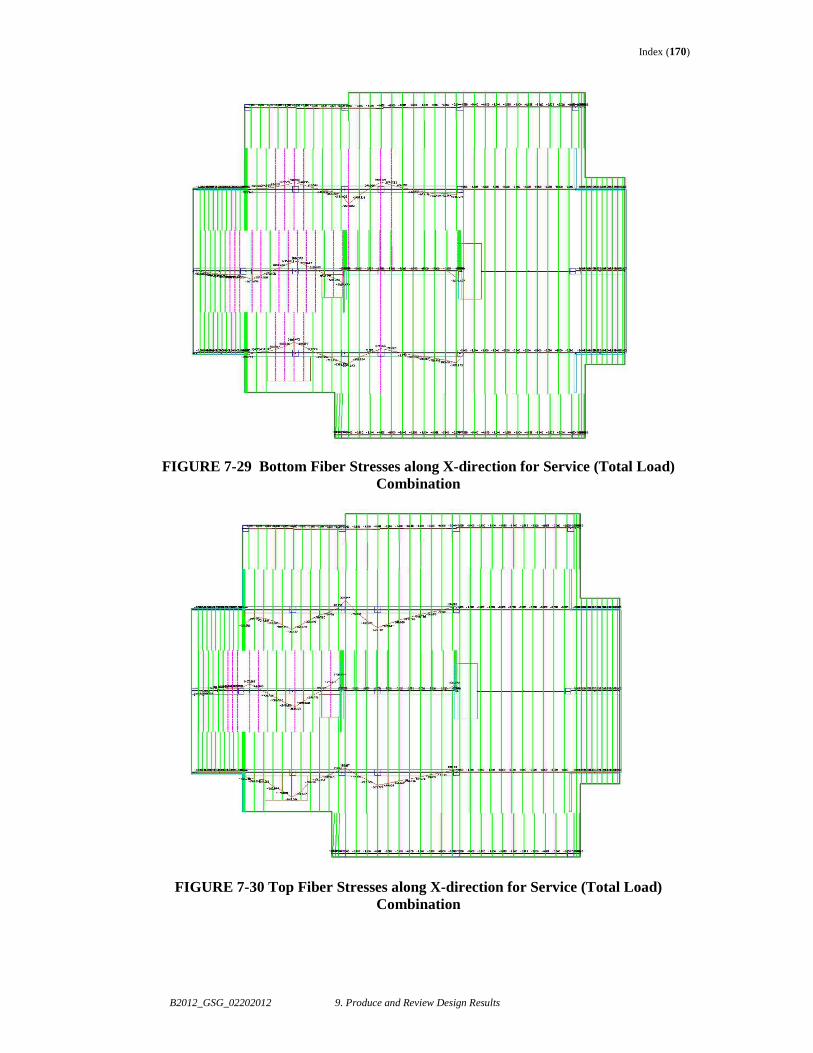
Index (170)
B2012_GSG_02202012 9. Produce and Review Design Results
FIGURE 7-29 Bottom Fiber Stresses along X-direction for Service (Total Load) Combination
FIGURE 7-30 Top Fiber Stresses along X-direction for Service (Total Load) Combination
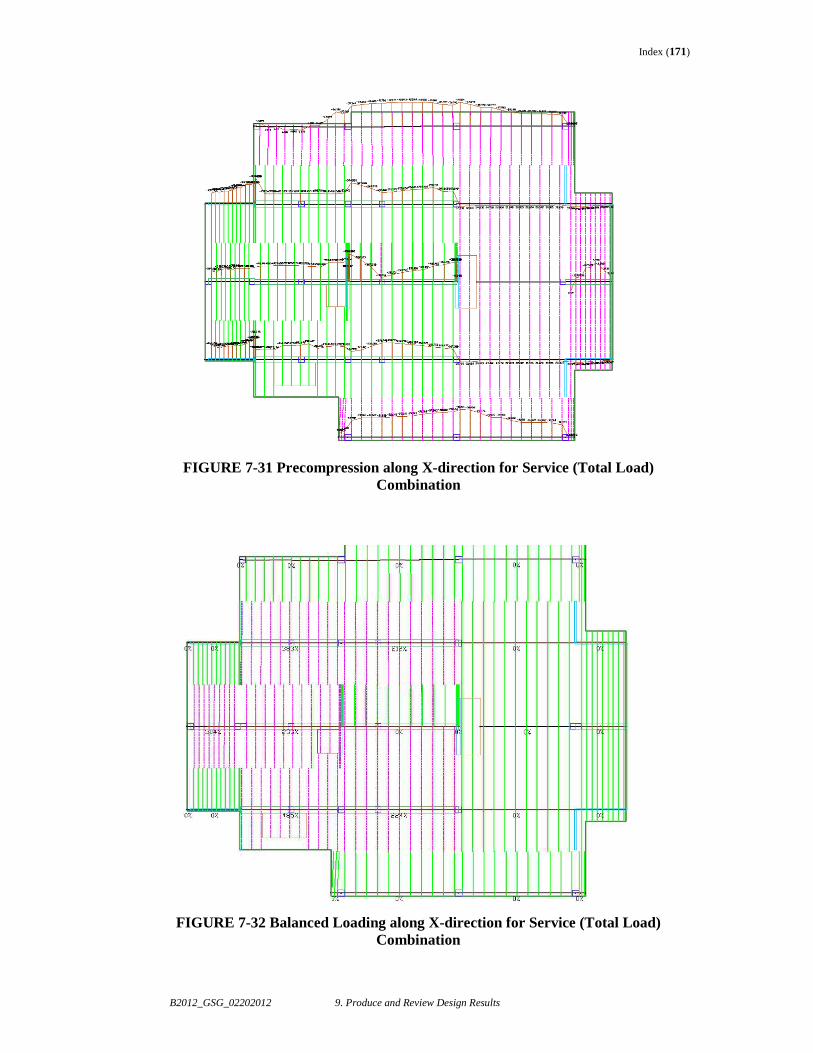
Index (171)
B2012_GSG_02202012 9. Produce and Review Design Results
FIGURE 7-31 Precompression along X-direction for Service (Total Load) Combination
FIGURE 7-32 Balanced Loading along X-direction for Service (Total Load) Combination
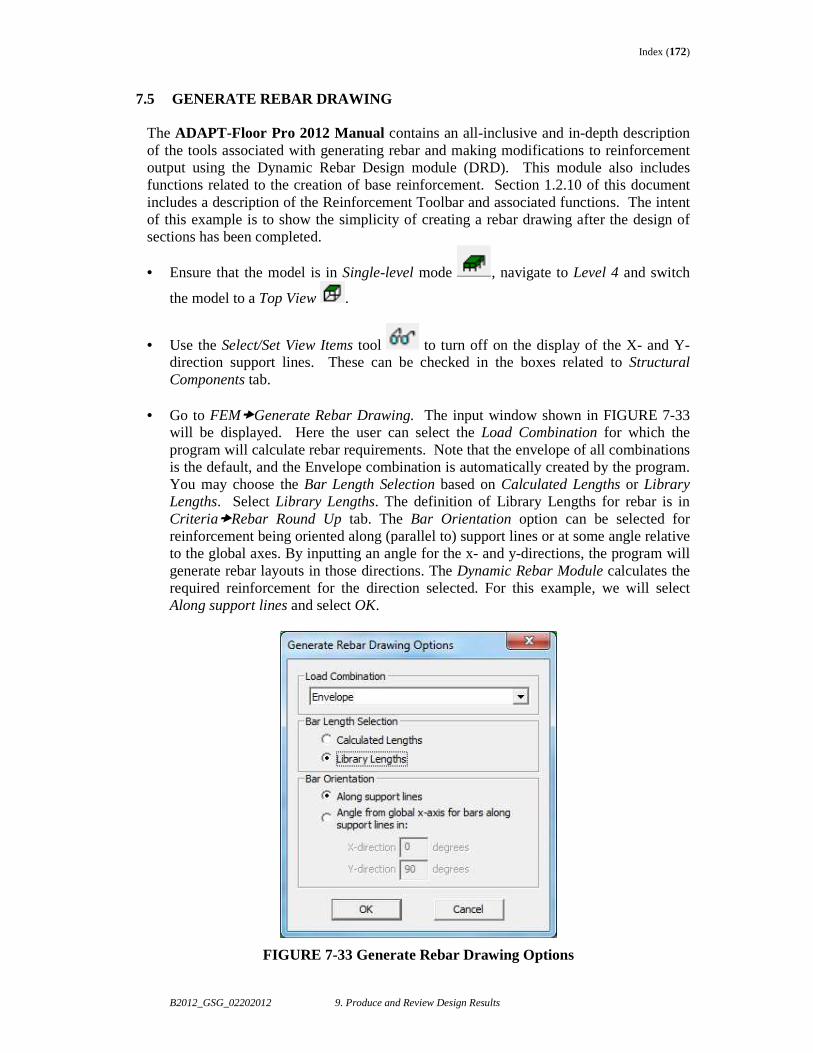
Index (172)
B2012_GSG_02202012 9. Produce and Review Design Results
7.5 GENERATE REBAR DRAWING The ADAPT-Floor Pro 2012 Manual contains an all-inclusive and in-depth description of the tools associated with generating rebar and making modifications to reinforcement output using the Dynamic Rebar Design module (DRD). This module also includes functions related to the creation of base reinforcement. Section 1.2.10 of this document includes a description of the Reinforcement Toolbar and associated functions. The intent of this example is to show the simplicity of creating a rebar drawing after the design of sections has been completed.
• Ensure that the model is in Single-level mode , navigate to Level 4 and switch
the model to a Top View .
• Use the Select/Set View Items tool to turn off on the display of the X- and Y-direction support lines. These can be checked in the boxes related to Structural Components tab.
• Go to FEM�Generate Rebar Drawing. The input window shown in FIGURE 7-33
will be displayed. Here the user can select the Load Combination for which the program will calculate rebar requirements. Note that the envelope of all combinations is the default, and the Envelope combination is automatically created by the program. You may choose the Bar Length Selection based on Calculated Lengths or Library Lengths. Select Library Lengths. The definition of Library Lengths for rebar is in Criteria�Rebar Round Up tab. The Bar Orientation option can be selected for reinforcement being oriented along (parallel to) support lines or at some angle relative to the global axes. By inputting an angle for the x- and y-directions, the program will generate rebar layouts in those directions. The Dynamic Rebar Module calculates the required reinforcement for the direction selected. For this example, we will select Along support lines and select OK.
FIGURE 7-33 Generate Rebar Drawing Options
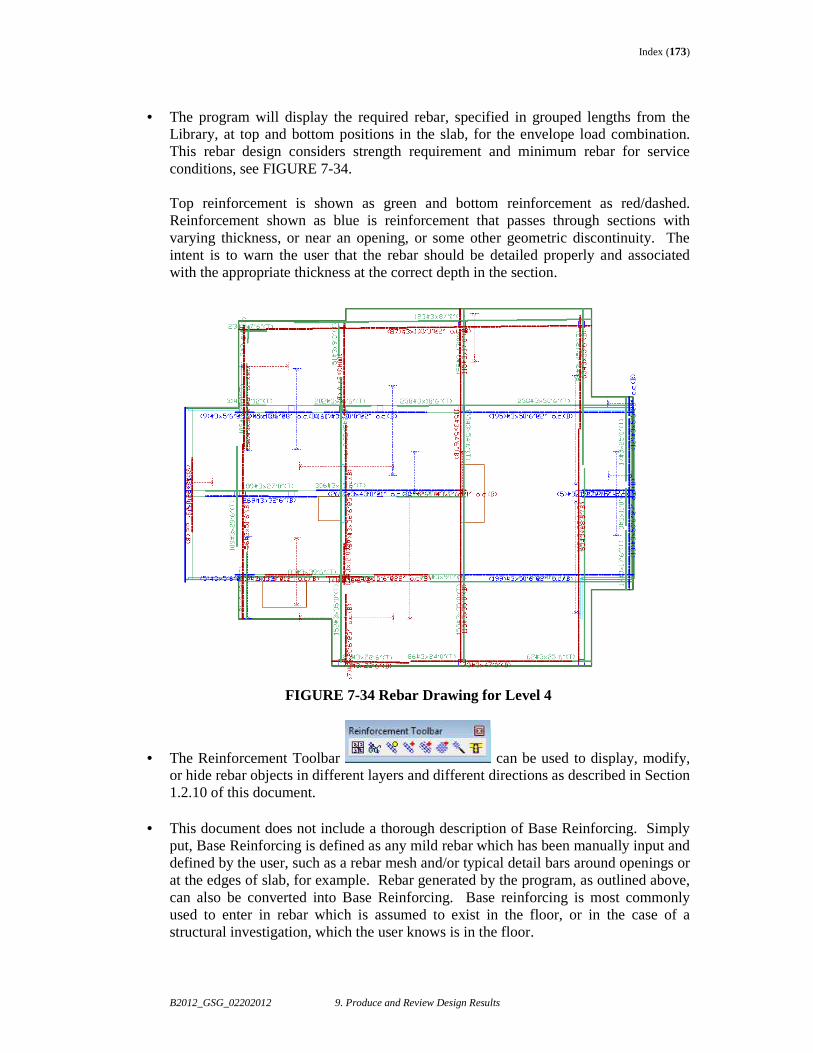
Index (173)
B2012_GSG_02202012 9. Produce and Review Design Results
• The program will display the required rebar, specified in grouped lengths from the
Library, at top and bottom positions in the slab, for the envelope load combination. This rebar design considers strength requirement and minimum rebar for service conditions, see FIGURE 7-34. Top reinforcement is shown as green and bottom reinforcement as red/dashed. Reinforcement shown as blue is reinforcement that passes through sections with varying thickness, or near an opening, or some other geometric discontinuity. The intent is to warn the user that the rebar should be detailed properly and associated with the appropriate thickness at the correct depth in the section.
FIGURE 7-34 Rebar Drawing for Level 4
• The Reinforcement Toolbar can be used to display, modify, or hide rebar objects in different layers and different directions as described in Section 1.2.10 of this document.
• This document does not include a thorough description of Base Reinforcing. Simply
put, Base Reinforcing is defined as any mild rebar which has been manually input and defined by the user, such as a rebar mesh and/or typical detail bars around openings or at the edges of slab, for example. Rebar generated by the program, as outlined above, can also be converted into Base Reinforcing. Base reinforcing is most commonly used to enter in rebar which is assumed to exist in the floor, or in the case of a structural investigation, which the user knows is in the floor.
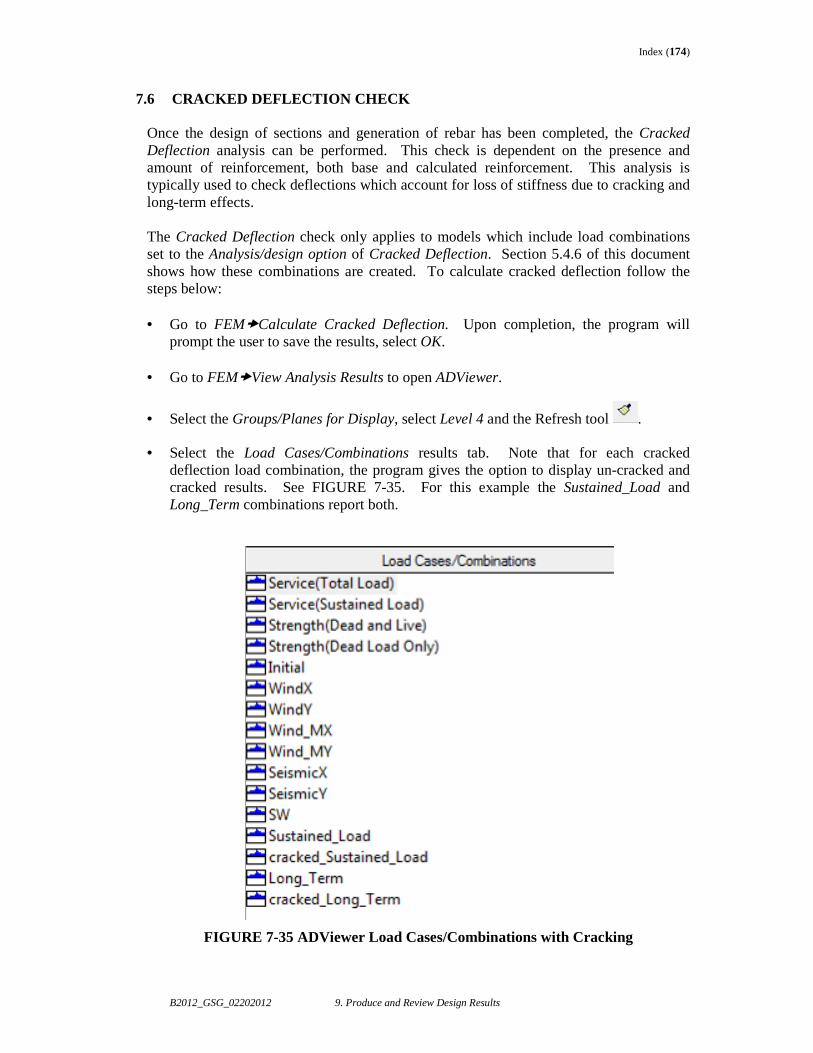
Index (174)
B2012_GSG_02202012 9. Produce and Review Design Results
7.6 CRACKED DEFLECTION CHECK Once the design of sections and generation of rebar has been completed, the Cracked Deflection analysis can be performed. This check is dependent on the presence and amount of reinforcement, both base and calculated reinforcement. This analysis is typically used to check deflections which account for loss of stiffness due to cracking and long-term effects. The Cracked Deflection check only applies to models which include load combinations set to the Analysis/design option of Cracked Deflection. Section 5.4.6 of this document shows how these combinations are created. To calculate cracked deflection follow the steps below: • Go to FEM�Calculate Cracked Deflection. Upon completion, the program will
prompt the user to save the results, select OK.
• Go to FEM�View Analysis Results to open ADViewer.
• Select the Groups/Planes for Display, select Level 4 and the Refresh tool .
• Select the Load Cases/Combinations results tab. Note that for each cracked deflection load combination, the program gives the option to display un-cracked and cracked results. See FIGURE 7-35. For this example the Sustained_Load and Long_Term combinations report both.
FIGURE 7-35 ADViewer Load Cases/Combinations with Cracking
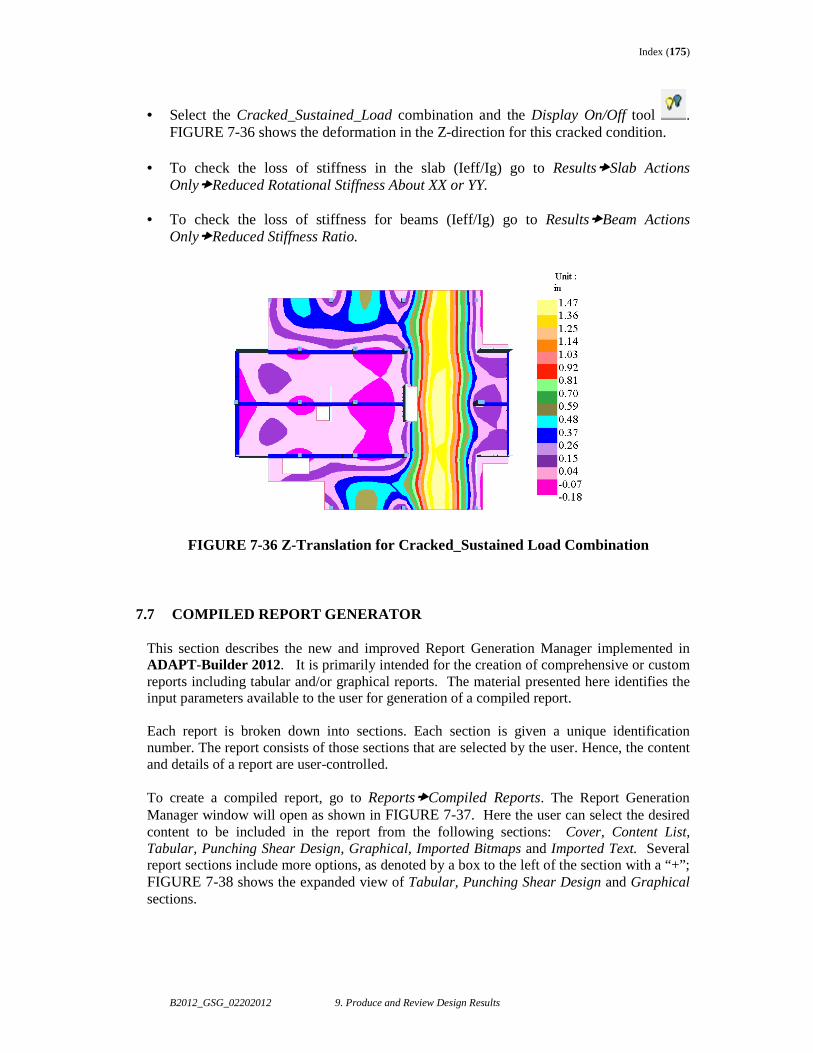
Index (175)
B2012_GSG_02202012 9. Produce and Review Design Results
• Select the Cracked_Sustained_Load combination and the Display On/Off tool . FIGURE 7-36 shows the deformation in the Z-direction for this cracked condition.
• To check the loss of stiffness in the slab (Ieff/Ig) go to Results�Slab Actions Only�Reduced Rotational Stiffness About XX or YY.
• To check the loss of stiffness for beams (Ieff/Ig) go to Results�Beam Actions Only�Reduced Stiffness Ratio.
FIGURE 7-36 Z-Translation for Cracked_Sustained Load Combination
7.7 COMPILED REPORT GENERATOR
This section describes the new and improved Report Generation Manager implemented in ADAPT-Builder 2012. It is primarily intended for the creation of comprehensive or custom reports including tabular and/or graphical reports. The material presented here identifies the input parameters available to the user for generation of a compiled report. Each report is broken down into sections. Each section is given a unique identification number. The report consists of those sections that are selected by the user. Hence, the content and details of a report are user-controlled. To create a compiled report, go to Reports�Compiled Reports. The Report Generation Manager window will open as shown in FIGURE 7-37. Here the user can select the desired content to be included in the report from the following sections: Cover, Content List, Tabular, Punching Shear Design, Graphical, Imported Bitmaps and Imported Text. Several report sections include more options, as denoted by a box to the left of the section with a “+”; FIGURE 7-38 shows the expanded view of Tabular, Punching Shear Design and Graphical sections.
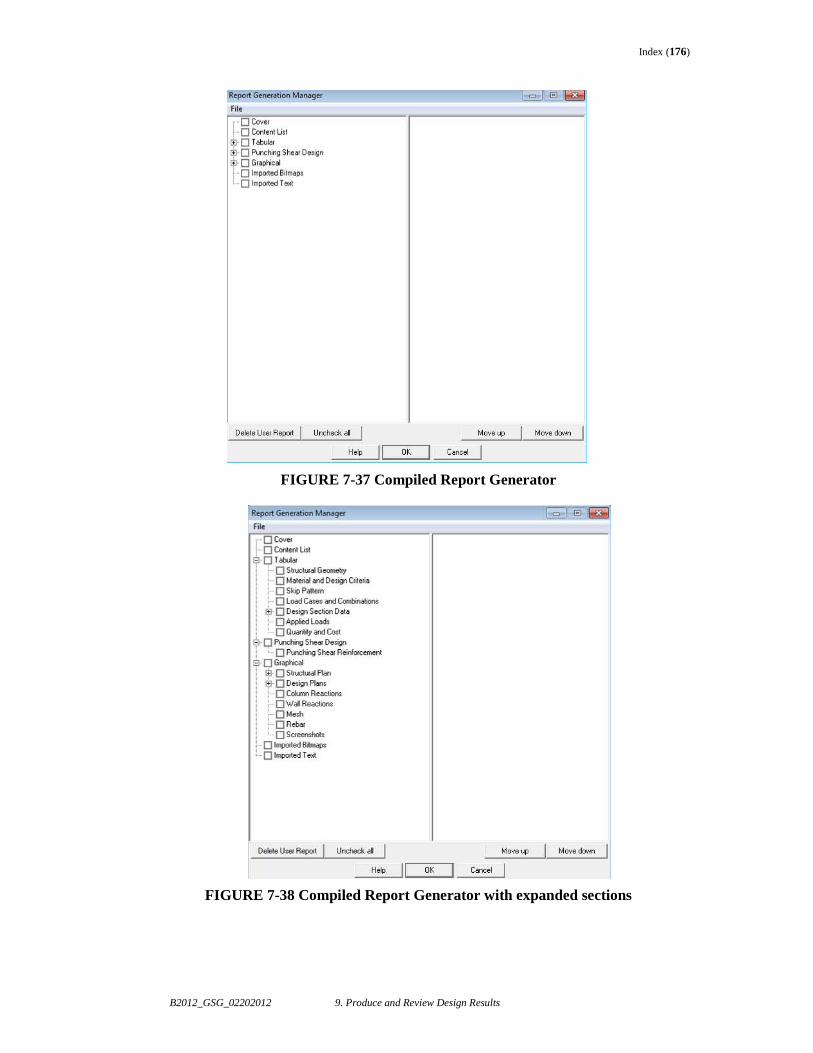
Index (176)
B2012_GSG_02202012 9. Produce and Review Design Results
FIGURE 7-37 Compiled Report Generator
FIGURE 7-38 Compiled Report Generator with expanded sections
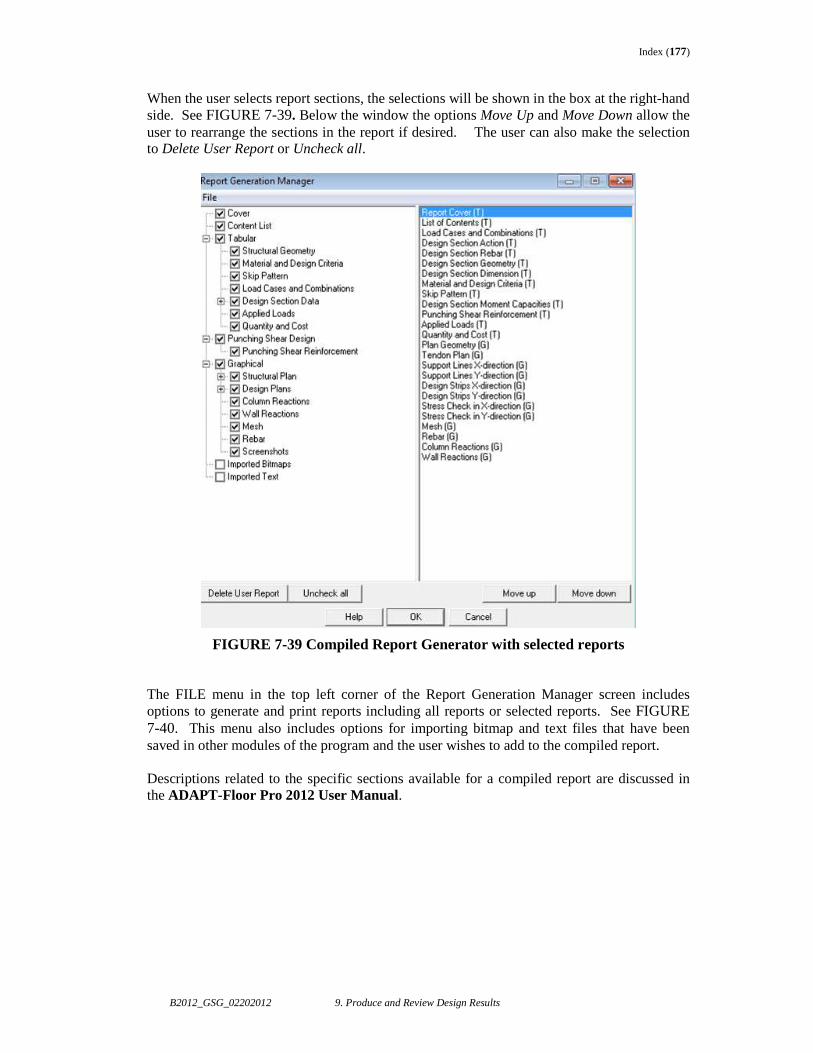
Index (177)
B2012_GSG_02202012 9. Produce and Review Design Results
When the user selects report sections, the selections will be shown in the box at the right-hand side. See FIGURE 7-39. Below the window the options Move Up and Move Down allow the user to rearrange the sections in the report if desired. The user can also make the selection to Delete User Report or Uncheck all.
FIGURE 7-39 Compiled Report Generator with selected reports The FILE menu in the top left corner of the Report Generation Manager screen includes options to generate and print reports including all reports or selected reports. See FIGURE 7-40. This menu also includes options for importing bitmap and text files that have been saved in other modules of the program and the user wishes to add to the compiled report. Descriptions related to the specific sections available for a compiled report are discussed in the ADAPT-Floor Pro 2012 User Manual.
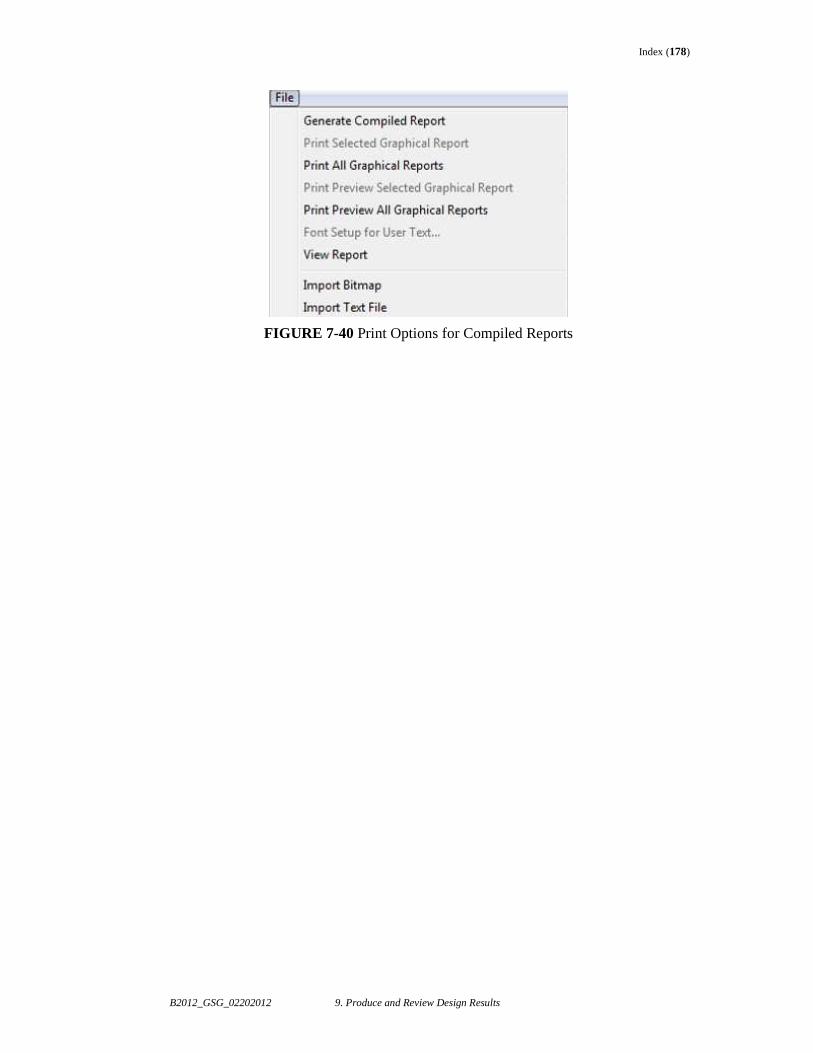
Index (178)
B2012_GSG_02202012 9. Produce and Review Design Results
FIGURE 7-40 Print Options for Compiled Reports
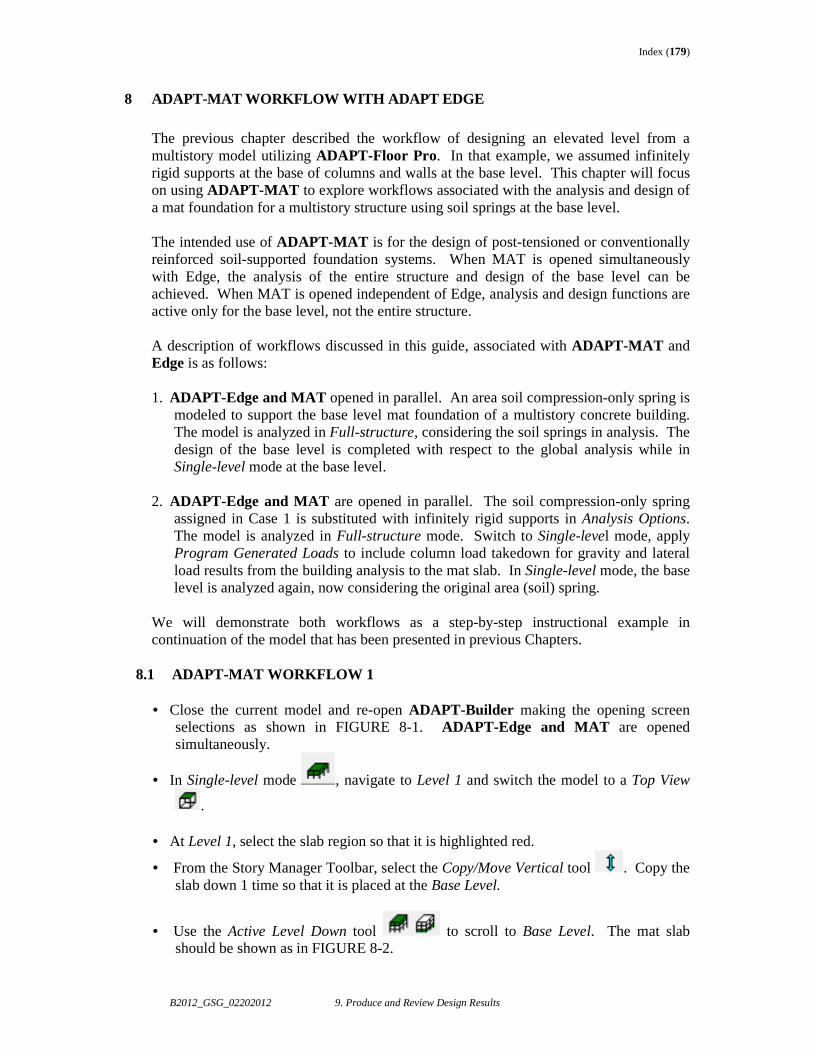
Index (179)
B2012_GSG_02202012 9. Produce and Review Design Results
8 ADAPT-MAT WORKFLOW WITH ADAPT EDGE
The previous chapter described the workflow of designing an elevated level from a multistory model utilizing ADAPT-Floor Pro . In that example, we assumed infinitely rigid supports at the base of columns and walls at the base level. This chapter will focus on using ADAPT-MAT to explore workflows associated with the analysis and design of a mat foundation for a multistory structure using soil springs at the base level. The intended use of ADAPT-MAT is for the design of post-tensioned or conventionally reinforced soil-supported foundation systems. When MAT is opened simultaneously with Edge, the analysis of the entire structure and design of the base level can be achieved. When MAT is opened independent of Edge, analysis and design functions are active only for the base level, not the entire structure. A description of workflows discussed in this guide, associated with ADAPT-MAT and Edge is as follows: 1. ADAPT-Edge and MAT opened in parallel. An area soil compression-only spring is
modeled to support the base level mat foundation of a multistory concrete building. The model is analyzed in Full-structure, considering the soil springs in analysis. The design of the base level is completed with respect to the global analysis while in Single-level mode at the base level.
2. ADAPT-Edge and MAT are opened in parallel. The soil compression-only spring assigned in Case 1 is substituted with infinitely rigid supports in Analysis Options. The model is analyzed in Full-structure mode. Switch to Single-level mode, apply Program Generated Loads to include column load takedown for gravity and lateral load results from the building analysis to the mat slab. In Single-level mode, the base level is analyzed again, now considering the original area (soil) spring.
We will demonstrate both workflows as a step-by-step instructional example in continuation of the model that has been presented in previous Chapters.
8.1 ADAPT-MAT WORKFLOW 1 • Close the current model and re-open ADAPT-Builder making the opening screen
selections as shown in FIGURE 8-1. ADAPT-Edge and MAT are opened simultaneously.
• In Single-level mode , navigate to Level 1 and switch the model to a Top View
.
• At Level 1, select the slab region so that it is highlighted red.
• From the Story Manager Toolbar, select the Copy/Move Vertical tool . Copy the slab down 1 time so that it is placed at the Base Level.
• Use the Active Level Down tool to scroll to Base Level. The mat slab should be shown as in FIGURE 8-2.
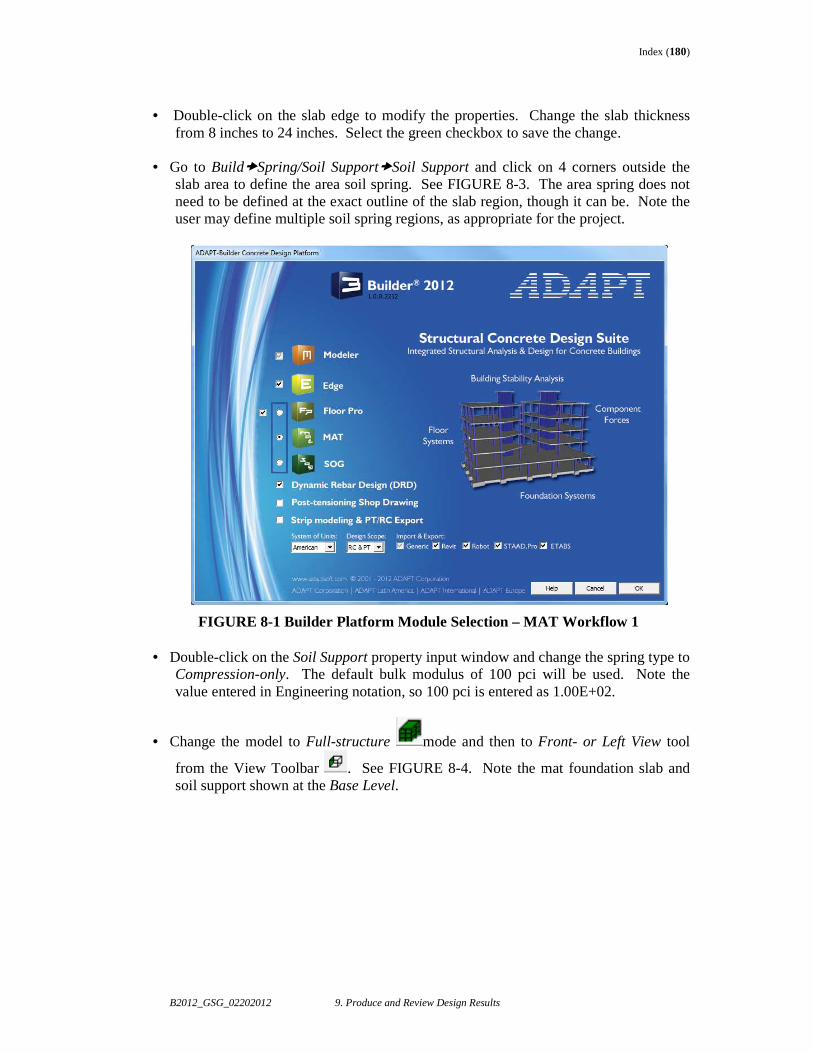
Index (180)
B2012_GSG_02202012 9. Produce and Review Design Results
• Double-click on the slab edge to modify the properties. Change the slab thickness
from 8 inches to 24 inches. Select the green checkbox to save the change.
• Go to Build�Spring/Soil Support�Soil Support and click on 4 corners outside the slab area to define the area soil spring. See FIGURE 8-3. The area spring does not need to be defined at the exact outline of the slab region, though it can be. Note the user may define multiple soil spring regions, as appropriate for the project.
FIGURE 8-1 Builder Platform Module Selection – MAT Workflow 1 • Double-click on the Soil Support property input window and change the spring type to
Compression-only. The default bulk modulus of 100 pci will be used. Note the value entered in Engineering notation, so 100 pci is entered as 1.00E+02.
• Change the model to Full-structure mode and then to Front- or Left View tool
from the View Toolbar . See FIGURE 8-4. Note the mat foundation slab and soil support shown at the Base Level.
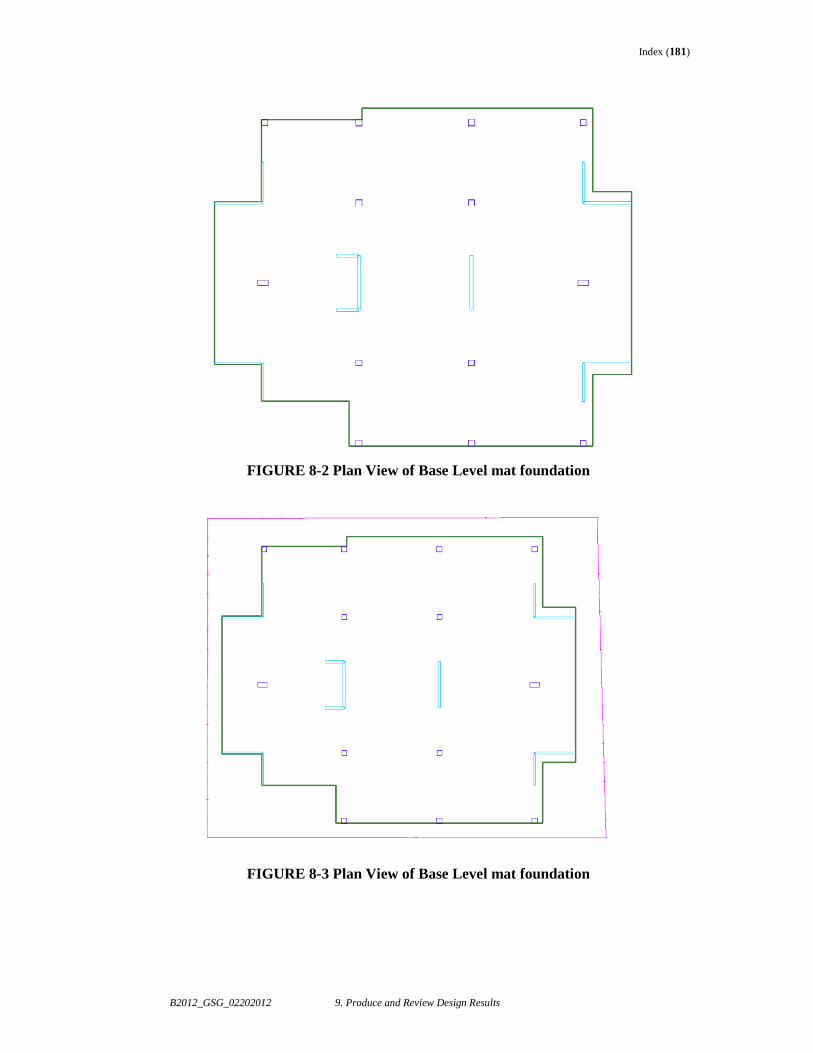
Index (181)
B2012_GSG_02202012 9. Produce and Review Design Results
FIGURE 8-2 Plan View of Base Level mat foundation
FIGURE 8-3 Plan View of Base Level mat foundation
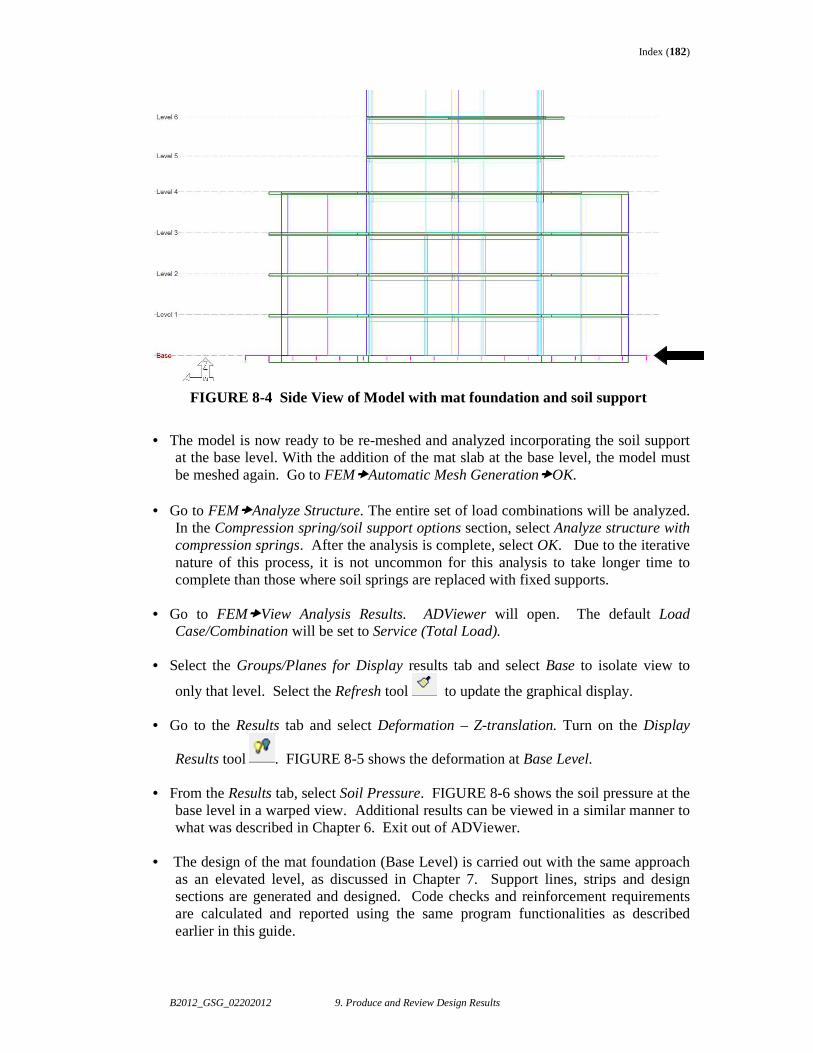
Index (182)
B2012_GSG_02202012 9. Produce and Review Design Results
FIGURE 8-4 Side View of Model with mat foundation and soil support
• The model is now ready to be re-meshed and analyzed incorporating the soil support
at the base level. With the addition of the mat slab at the base level, the model must be meshed again. Go to FEM�Automatic Mesh Generation�OK.
• Go to FEM�Analyze Structure. The entire set of load combinations will be analyzed. In the Compression spring/soil support options section, select Analyze structure with compression springs. After the analysis is complete, select OK. Due to the iterative nature of this process, it is not uncommon for this analysis to take longer time to complete than those where soil springs are replaced with fixed supports.
• Go to FEM�View Analysis Results. ADViewer will open. The default Load
Case/Combination will be set to Service (Total Load).
• Select the Groups/Planes for Display results tab and select Base to isolate view to
only that level. Select the Refresh tool to update the graphical display.
• Go to the Results tab and select Deformation – Z-translation. Turn on the Display
Results tool . FIGURE 8-5 shows the deformation at Base Level.
• From the Results tab, select Soil Pressure. FIGURE 8-6 shows the soil pressure at the base level in a warped view. Additional results can be viewed in a similar manner to what was described in Chapter 6. Exit out of ADViewer.
• The design of the mat foundation (Base Level) is carried out with the same approach
as an elevated level, as discussed in Chapter 7. Support lines, strips and design sections are generated and designed. Code checks and reinforcement requirements are calculated and reported using the same program functionalities as described earlier in this guide.
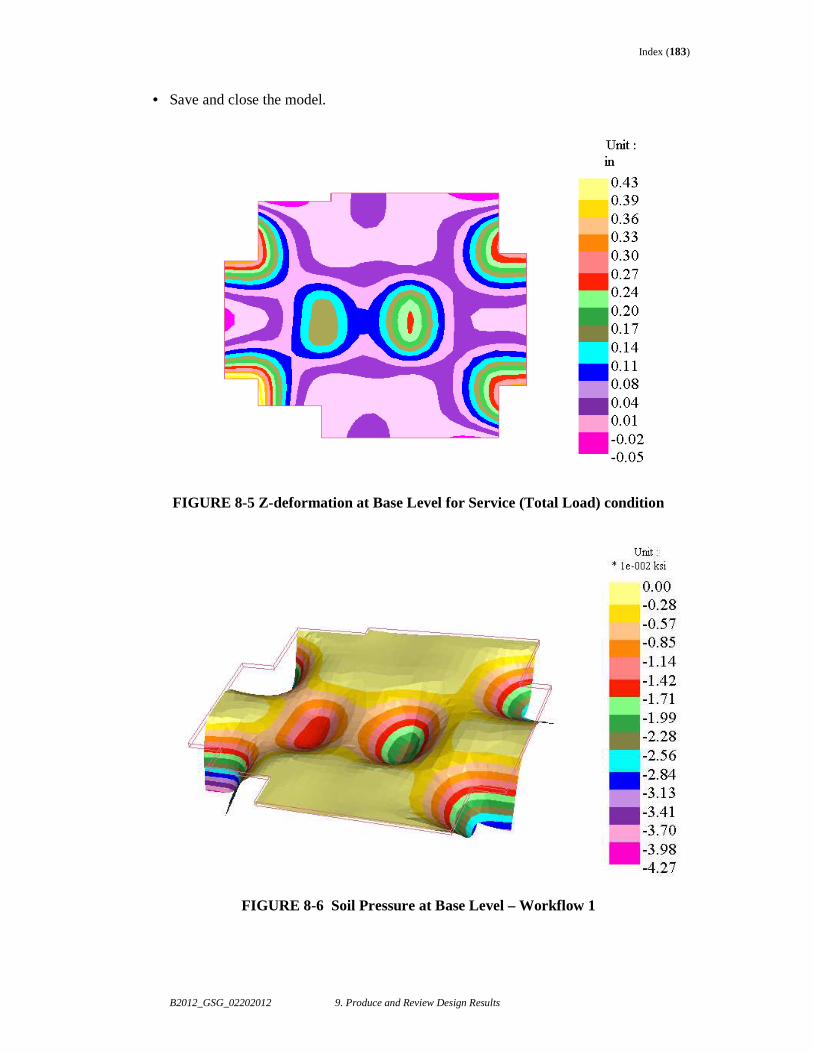
Index (183)
B2012_GSG_02202012 9. Produce and Review Design Results
• Save and close the model.
FIGURE 8-5 Z-deformation at Base Level for Service (Total Load) condition
FIGURE 8-6 Soil Pressure at Base Level – Workflow 1

Index (184)
B2012_GSG_02202012 9. Produce and Review Design Results
8.2 ADAPT-MAT WORKFLOW 2
• The model should still be in Full Structure mode. Go to FEM�Analyze Structre. The
entire set of load combinations will be analyzed. In the Compression spring/soil support options section, select Substitute compression springs with fixed supports. After the analysis is complete, select OK.
• Toggle the model to Single-level mode , navigate to Base Level and switch the
model to a Top-Front-Right-View
• Select Loading�Add Load�Program Generated Loads. The input window shown in FIGURE 5-28 will appear. Select all gravity load cases and select OK to apply the load takedown values at the Base Level. When a MAT model is analyzed with this approach, superposition of loads is applicable. The user can make changes to the base level while still retaining the load take-down from the global solution.
• Go to FEM�Analyze Structure. The entire set of load combinations will be analyzed.
In the Compression spring/soil support options note that the program automatically uses the option for Analyze structure with compression springs. Select the option to Include loads from building solution. By selecting this, the program will consider actions due to lateral loads in columns and walls at the base level for a comprehensive design of the foundation. See FIGURE 8-7. After the analysis is complete, select OK. In this step, we are analyzing only the base level since we are in Single-level mode.
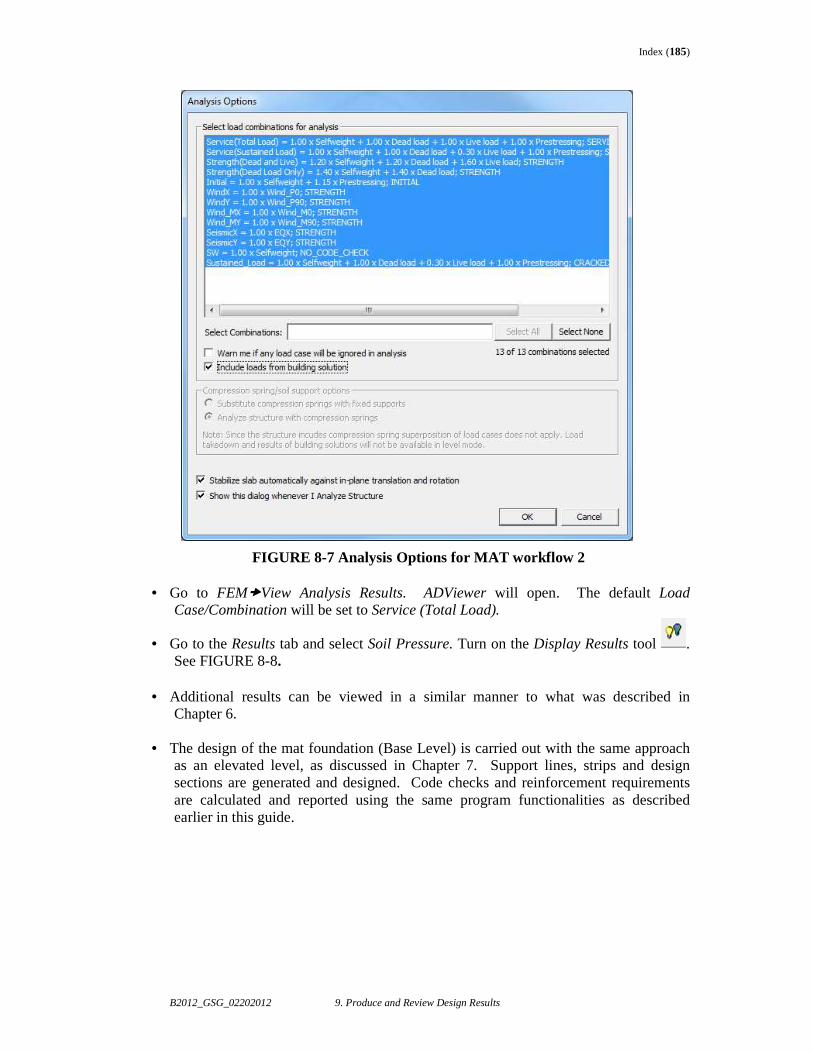
Index (185)
B2012_GSG_02202012 9. Produce and Review Design Results
FIGURE 8-7 Analysis Options for MAT workflow 2
• Go to FEM�View Analysis Results. ADViewer will open. The default Load Case/Combination will be set to Service (Total Load).
• Go to the Results tab and select Soil Pressure. Turn on the Display Results tool . See FIGURE 8-8.
• Additional results can be viewed in a similar manner to what was described in Chapter 6.
• The design of the mat foundation (Base Level) is carried out with the same approach
as an elevated level, as discussed in Chapter 7. Support lines, strips and design sections are generated and designed. Code checks and reinforcement requirements are calculated and reported using the same program functionalities as described earlier in this guide.
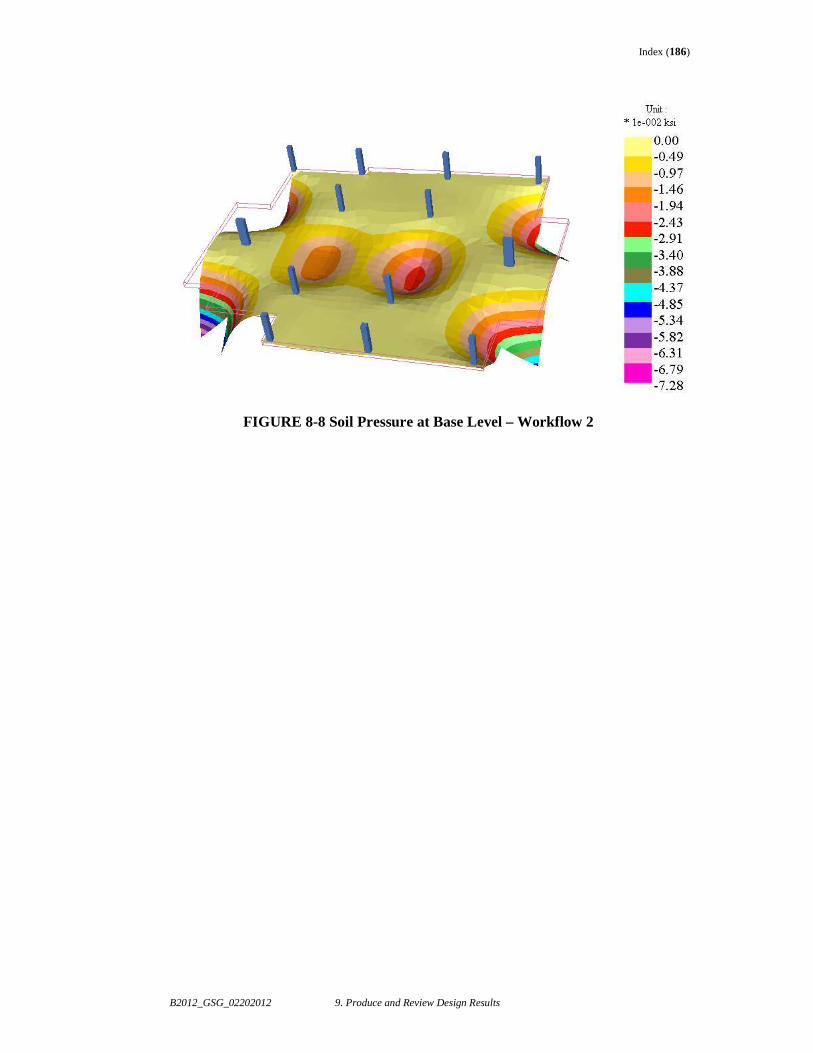
Index (186)
B2012_GSG_02202012 9. Produce and Review Design Results
FIGURE 8-8 Soil Pressure at Base Level – Workflow 2