Embed Size (px)
Citation preview
Adam KunsSteve Jordan
CIS 660Summer 2016Project Report
For our project we decided to use multiple components of the Apache Hadoop Ecosystem to store data, pre-process the data, perform text mining on said data, and then visualize our results using Tableau.
Selecting a PlatformFirst thing we needed to do was to select a platform to run Hadoop on. We decided on Cloudera and their QuickStart Virtual Machine due to the ease of installation, the availability of components, and general familiarity. Using VirtualBox virtualization software, we were able to setup a Cloudera CDH 5.7 QuickStart VM pretty quickly.
We did run into some hiccups with the VM, mainly Steve’s laptop did not have sufficient RAM to run the VM. Once he was able to procure more RAM, his VM was running smoothly.
DataFor our data, we used the State of the Union Addresses data linked in the project list document. We decided to use Bash shell scripting to do the initial pull of all the website data and do some pre-pre-processing.
First we used the bash shell command wget to pull in the html files. The URL’s for all of the State Union Addresses are in the following format:
https://http://www.infoplease.com/t/hist/state-of-the-union/<#>.html
Where <#> is the number of the State of the Union in chronological order, from 1 to 221, i.e:
https://http://www.infoplease.com/t/hist/state-of-the-union/1.html
Would be the first State of the Union address done by George Washington.
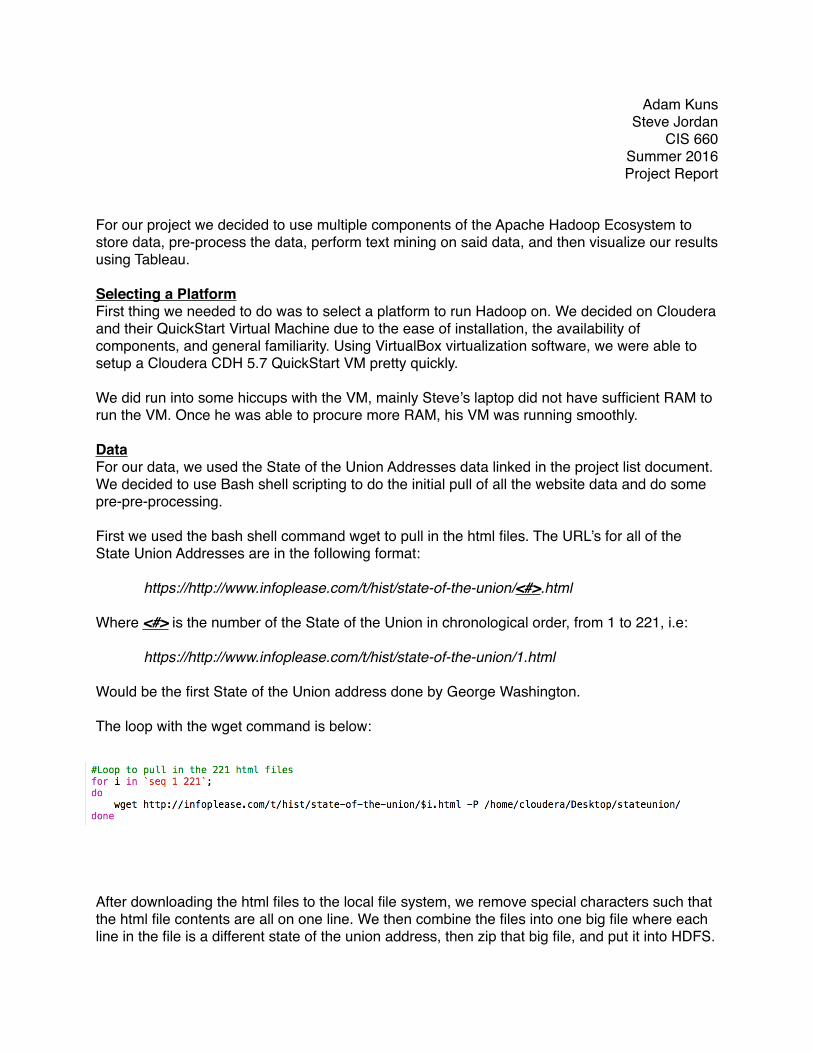
The loop with the wget command is below:
After downloading the html files to the local file system, we remove special characters such that the html file contents are all on one line. We then combine the files into one big file where each line in the file is a different state of the union address, then zip that big file, and put it into HDFS.

Pre-Process Data
After the zipped file is available on HDFS, we can call our PySpark script to finish pre-processing the data. Using PySpark allows us to perform preprocessing on Hadoop and take advantage of the parallel execution, along with the in-memory processing that Spark provides.
First thing we need to do in our PySpark script is to create a Spark Context. With the Spark Context we can then create Resilient Distributed Datasets(RDD) for our zip file we put into HDFS. Once we have the data in an RDD we can perform some functional programming methods, such as map(), where we pass in a function as a parameter and each record in the RDD is passed into that function.
The parse_all function is the main driver for calling the parse functions to create our speech_meta file, which is a tab-delimited file containing the columns: President, Year, Me Count, We Count, and total words.
We Count is a count of the words within each speech that are first-person plural, such as ‘we','us','our','ours',and ‘ourselves’. Me Count is a count of the words within each speech that

are first-person singular, such as ‘i’,'me','my','mine', and ‘myself’. These metrics can then be used to create ratios for each speech to see which Presidents use more we’s to me’s, etc.
Below is are the parsing functions used to create the speech_meta file:
Using these functions, we end up creating our tab delimited file and saving that resulting file to HDFS:
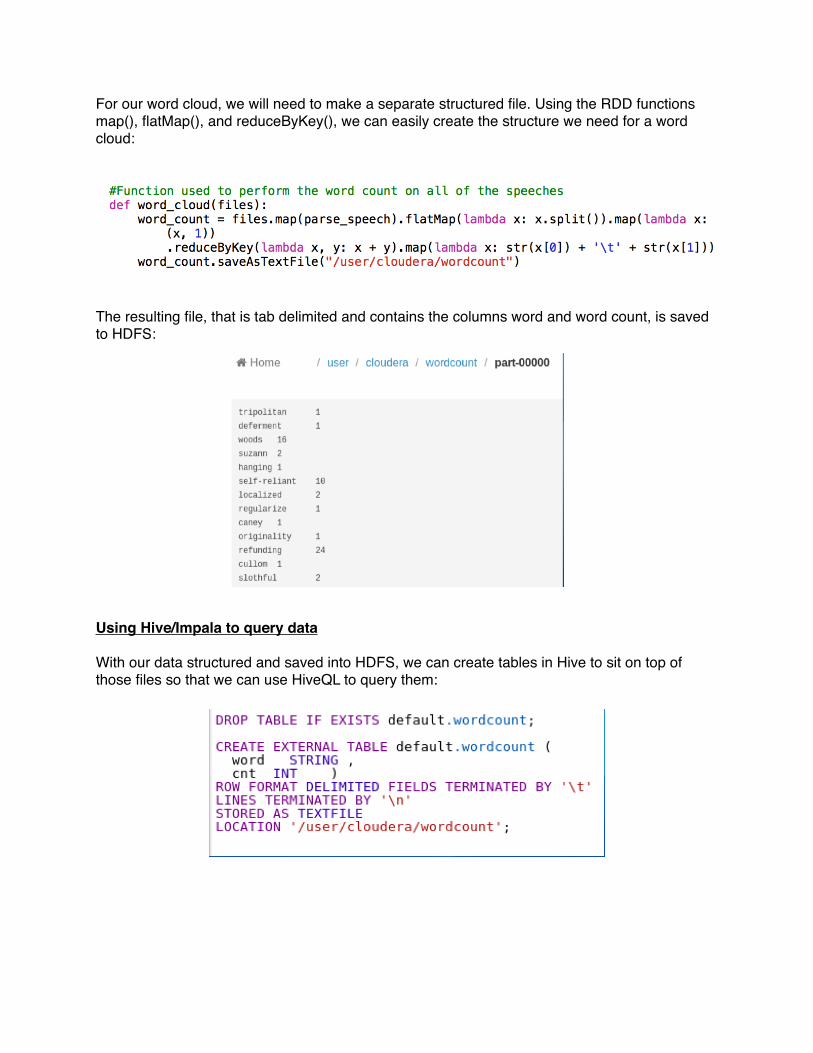
For our word cloud, we will need to make a separate structured file. Using the RDD functions map(), flatMap(), and reduceByKey(), we can easily create the structure we need for a word cloud:
The resulting file, that is tab delimited and contains the columns word and word count, is saved to HDFS:
Using Hive/Impala to query data
With our data structured and saved into HDFS, we can create tables in Hive to sit on top of those files so that we can use HiveQL to query them:

With our tables created we can now perform querying using HiveQL:
Visualizing Results
Now that our data tables are created in Hive, we can now create an ODBC connection to connect Tableau to Hive.
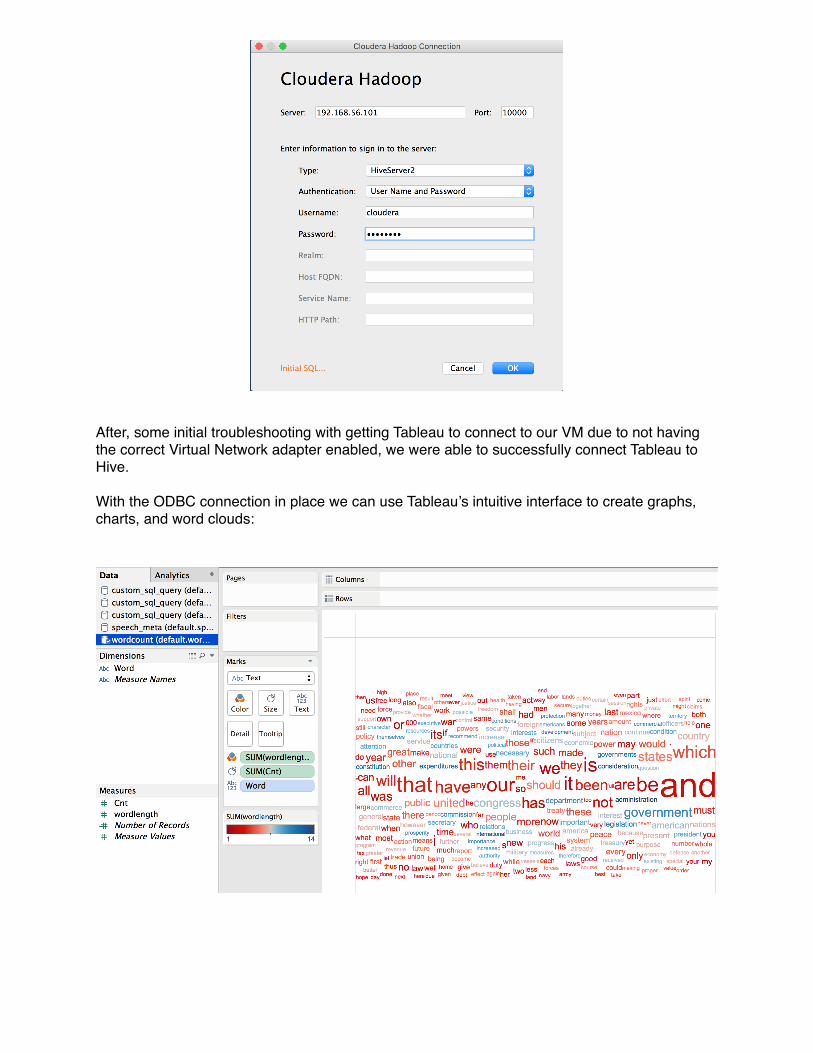
After, some initial troubleshooting with getting Tableau to connect to our VM due to not having the correct Virtual Network adapter enabled, we were able to successfully connect Tableau to Hive.
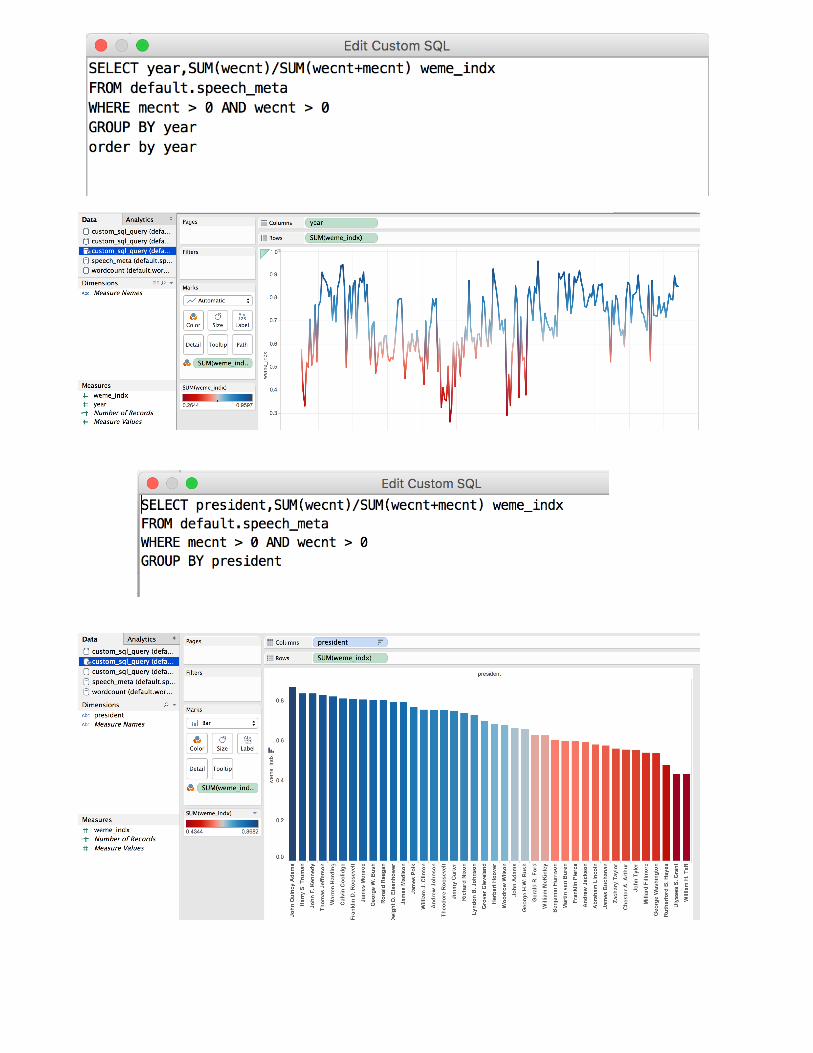
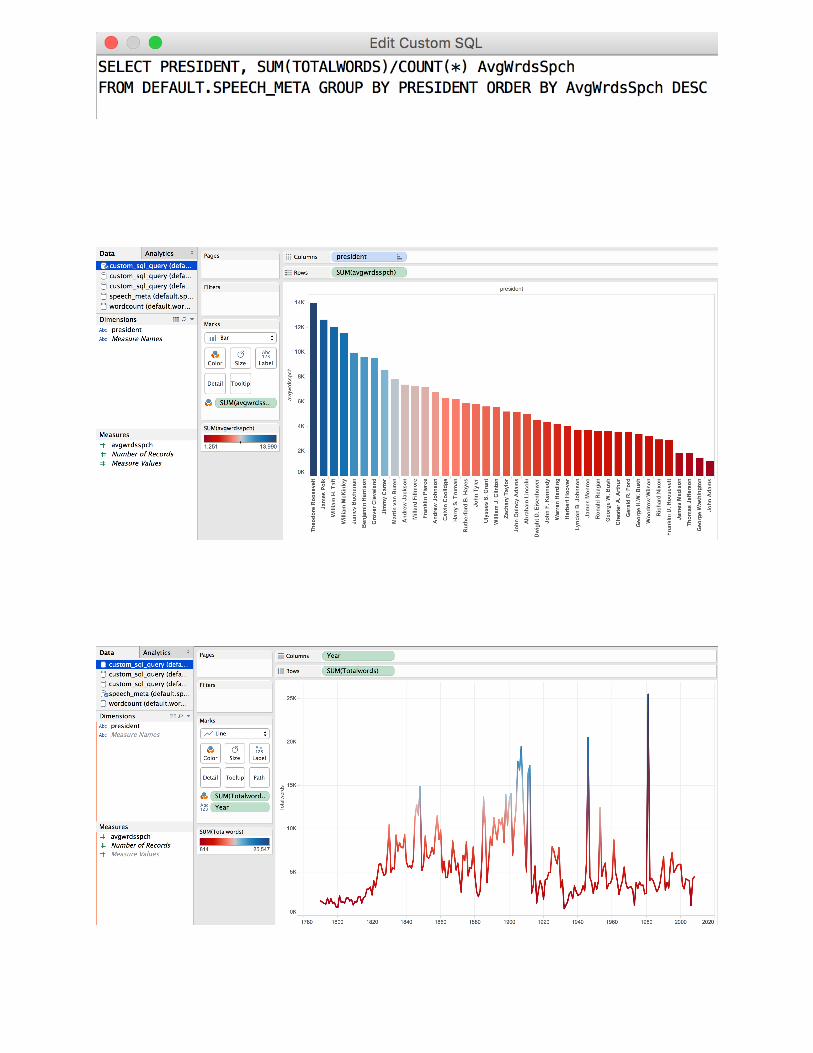
With the ODBC connection in place we can use Tableau’s intuitive interface to create graphs, charts, and word clouds:
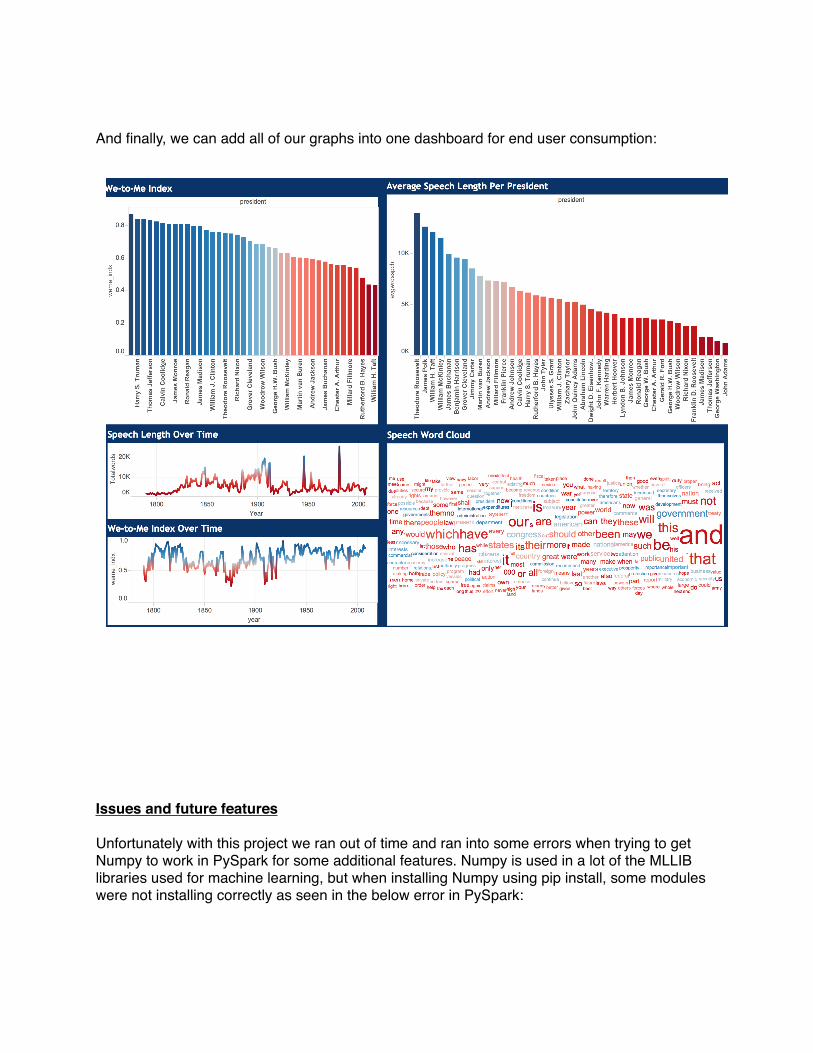
And finally, we can add all of our graphs into one dashboard for end user consumption:
Issues and future features
Unfortunately with this project we ran out of time and ran into some errors when trying to get Numpy to work in PySpark for some additional features. Numpy is used in a lot of the MLLIB libraries used for machine learning, but when installing Numpy using pip install, some modules were not installing correctly as seen in the below error in PySpark:

Eventually if we get Numpy working, we would want to perform some more advanced data mining techniques, such as Term Frequency-inverse document frequency using PySpark to determine term importance within the all of the speeches.
With five lines of PySpark code we could easily calculate term frequency-inverse document frequency:

Additionally, many more examples such as Word2Vec, Standard Scalar, ChiSqrSelector, etc. are easily implemented in PySpark (give Numpy installs correctly). Code examples of these methods and the above tf-idf code can be found at the following Apache website:
http://spark.apache.org/docs/latest/mllib-feature-extraction.html#tf-idf