Embed Size (px)
Citation preview
AD/A-004 002
MODIFIED CENTRIFUGAL COMPRESSOR
Gary B. Reeves, et al
Pratt and Whitney Aircraft
Prepared for:
Army Air Mobility Research and Development Laboratory
November 1974
DISTRIBUTED BY:
urn National Technical Information Service U. S. DEPARTMENT OF COMMERCE

'i0iinflHURMMMHMMMiiMi3'WMIM^Wi<^
UNCLASSIFIED SECURITY CLASSIFICATION OF THIS PAGE (Wtwn Omit Snlmtmi)
REPORT DOCUMENTATION PAGE I. HEPORT NUMBER
USAAMRDL-TR-74-96 2. GOVT ACCESSION NO.
«. TITLE fand Sukllll«)
MODIFIED CENTRIFUGAL COMPRESSOR
7. AuTHORf«;
Gary B. Reeves, Jeffrey K. Schweitzer
*. PERFORMING ORGANIZATION NAME AND ADDRESS
Pratt 6 Whitney Aircraft Division/United Aircraft Corporation/Florida Research and Development Center West Palm Beach, Florida 33402
I CONTROLLING OFFICE NAME AND ADDRESS
Eustis DirectorateAJ.S. Army Air Mobility Research and Development Laboratory Fort Eustis. Virginia 23604
14. MONITORING AGENCY NAME 1 ADORESSff/dlf/crMit from Control/In« Otlict)
READ INSTRUCTIONS BEFORE COMPLETING FORM
I. RECIPIENT'S CATALOG NUMBER
AD/A -00 (4MA TYPE Of REPORT * PERIOD COVERED 5. TYPE Of REPORT * PERIOD COVERED
Final 23 October 1973 to 23 July 1974 6. PERFORMING ORG. REPORT NUMbER FR-6583 8. CONTRACT OR GRANT NUMBERfiJ
DAAJ02-74-C-0003
10. PROGRAM ELEMENT, PROJECT, TASK AREA * WORK UNIT NUMBERS
Task 1G262207AH8901
12. REPORT DATE
November 197*» II. NUMBER OF PAGES u. IS. SECURITY CLASS, (ol thlt report;
Unclassified IS«. OECLASSIFICAT|->N/DOWNCRAOING
SCHEDULE
16. DISTRIBUTION STATEMENT (ol thlt Rtporl)
Approved for public release; distribution unlimited.
17. DISTRIBUTION STATEMENT (ol fflo mbtlimcl onlmd In Block 20, II dllloiml from Roporl) D C (nUPraPuDJIia
It. SUPPLEMENTARY NOTES ±hh
. I , i! I
U
"^THSTT _!Ta-E
19. KEY WORDS (Conllnuo on revant aldm il nocottmry and tdontlly by block numbtt)
Centrifugal Compressor Inducer Diffuser Performance Impeller
-Q.
Reproduced by
NATIONAL TECHNICAL INFORMATION SERVICE
U S Department of Commatc« Sptingfwld. VA. 22ISI
20. ABSTRACT fContinu« on rovort« tide II ntcmaamry and Idantily by block numbai)
A single-stage centrifugal compressor designed to produce a 10:1 pressure ratio at a flow rate of 3.2 lb/sec was tested. An earlier version of this compressor was tested under USAAMRDL Contract DAAJ02-70-C-0006 and was found to have excessive losses in the tandem inducer. In addition, diffuser damage was incurred during that testing, which also prevented the achievement of the full design potential. The objective of this follow-on program was therefore to demonstrate improved
PRICES SUBJEQ TO CHANGE OD I JAN 71 1^73 EDITION Of 1 NOV »5 IS OBSOLETE
/ UNCLASSIFIED
SECURITY CLASSIFICATION OF THIS PAGE (Wban Data Enlaiad)
EUSTIS DIRECTORATE POSITION STATEMENT
The objectives cited In this report are founded In the larger effort of the U. S. Army to Improve the effectiveness of propulsion systems for future military applications. The stated performance goals and reported achieve- ments are applicable engine technology which have the potential for providing lighter, more efficient, simpler, and more rugged qas turbine engines than are now In the field. The Immediate results are only partially usable, In that the efficiency of the demonstrated compressor peaks at the surge line and any practical engine using this hardware would necessarily operate with some surge margin and at lower-than-peak efficiency.
This report has been reviewed by technical personnel from this Directorate, and the conclusions and recommendations contained herein are concurred in by this Directorate. The project engineer for this contract was Mr. Robert A. Langworthy, Propulsion Technical Area, Technology Applications Division.
\ BY.. DKTIIIUTIOI/AUIIUIIITY MOES
DISCLAIMERS
The finding* in this report are not to be construed as an official Department of the Army position unless so designated by other authorized documents.
When Government drawings, specifications, or other data are used for any purpose other than in connection with a definitely related Government procurement operation, the United States Government thereby incurs no responsibility nor any obligation whatsoever; and the fact that the Government may have formulated, furnished, or in any way supplied the said drawings, specifications, or other data is not to be regarded by implication or Otherwise as in any manner licensing the holder or any other person or corporation, or conveying any rights or permission, to manufacture, use, or sell any patented invention that may In any way be related thereto.
Trade names cited in this report do not constitute an official endorsement or approval of the use of such commercial hardware or software.
DISPOSITION INSTRUCTIONS
Destroy this report when no longer nui-ded. Do not return it to the originator.
Ill
UNCLASSIFIED jICUWTV CLAMIFICATIOM Of TMIt PMVWhm PI« Mnfnä)
Block 20 (Continue^
performance for the 10:1 pressure ratio single-stage centrifugal compressor with a modified Inducer and a new (undamaged) diffuser. Modifications to the design of the Inducer were made to Improve Its high-speed (Mach number) performance and to de- crease the required inlet prewhirl, and a test program was conducted to obtain overall and Inducer performance data.
A total-to-static pressure ratio of 10.07:1 and a corresponding adlabatlc effi- ciency of 78.4% were recorded at design prewhirl and 99% of design speed. This performance exceeded the original 10:1 pressure ratio single-stage centrifugal com- pressor goal of 75% by 3.4 points and substantiated the design modlflcaclon to the Inducer and the matching of the diffuser to the Improved compressor performance expected to reeult from the altered Inducer. The entire test sequence was conducted at sea level conditions without mechanical difficulty, and all contract data require- ments were fulfilled.
The results at this program are applicable to small gas turbine engines. The compressor design centered on this application and Included some compromise to permit a front-drive turboshaft configuration. The efficiency demonstrated is comparable to existing small engine compressor performance, but generally at a higher pressure ratio and in a single-stage rather than in a multistage machine.
'
UNCLASSIFIED // StCimiTV CLAUIFICATION Of THIS PAOCrVhMl Dmtm BnlamO
^"■" '.>Wi^nT^'-'■*:i^^"' WHMMVHMM
PREFACE
This report is the Final Technical Report to fulfill the data requirements of Contract DAAJ02-74-C-0003 with the Eustis Directorate« U.S. Army Air Mobility Research and Development Laboratory, Fort Eustis, Virginia.
The principal investigator and Program Manager of this effort was Gary B. Reeves. The U.S. Army Project Engineer was Mr. Robert A. Langworthy, Technology Applications Division. The authors wish to acknowledge Pratt & Whitney personnel E. T. Singleton (Inducer Design), L. L. Coons (Design Co- ordination), J. K. Schweitzer (Data Reduction and Analysis), and J. D. Goodrum (Assembly and Test) for their participation and contributions to the program and W. J. McAnally, III, for overall and administrative guidance and support.
*
i

CONTENTS
SECTION
I
II
m
IV
VI
vn
vni
IX
INTRODUCTION
DESIGN
Inducer Diffuser
TEST EQUIPMENT
INSTRUMENTATION
Overall Performance Instrumentatton .. Component Performance Instrumentation Special Instrumentation Data Readout and Recording System. ...
PROCEDURES
Test Procedures Data Reduction Procedures
Overall Performance Inlet Guide Vane Performance ... Inducer Performance Rotor Performance
VALIDATION OF TEST DATA
RESULTS AND DISCUSSION
Overall Performance , Inlet Guide Vane Temperature Traverses, Component Performance ,
CONCLUSIONS
RECOMMENDATIONS ,
APPENDIX A - Traverse Data ,
LIST OF SYMBOLS
PAGE
8
9
9 16
20
27
27 32 35 35
36
36 38
38 40 40 43
44
51
51 56 57
65
66
67
77
Preceding page blank
ILLUOTRATIONS
FIGURE PAGE
1
2
3
5
6
7
8
9
10
11
12
13
14
15
16
17
18
19
20
Inducer Modifications 10
Multiple Circular Arc Airfoil Definitions 11
Modified Inducer Design; Low Aspect Ratio and High Solidity (Sheet 1 of 2) 12
Modified Inducer Design; Low Aspect Ratio and High Solidity (Sheet 2 of 2) 13
Reconstructed Time - Average Holograms Showing Nodal Patterns 17
Modified Inducer Vlbratlonal Characteristics 18
Pipe Diffuser Design 19
Rotor Assembly 20
Modified Centrifugal Compressor Mounted on FRDC Drive Turbine 21
High-Speed Compressor Test Stand 22
Shroud Clearance Measurements 23
Maximum Bearing IE Acceleration 24
Bearing Outer Race Temperatures 25
Impeller and Diffuser Alignment 26
Compressor Flow Path and Instrumentation Station Locations 28
Modified Centrifugal Compressor Test Instrumentation. . . 29
IGV Exit Temperature Traverse Probe 31
Collector Instrumentation Locations 32
Traverse Probes 34
Impeller Tip Static Pressure Passage . . > 35
Schematic of 8204 Streamline Analysis Program Flow Path 41
1 ■
ILLUSTRATIONS (Continued)
FIGURE PAGE
21 Inlet Orifice Flow Measurement Uncertainty 46
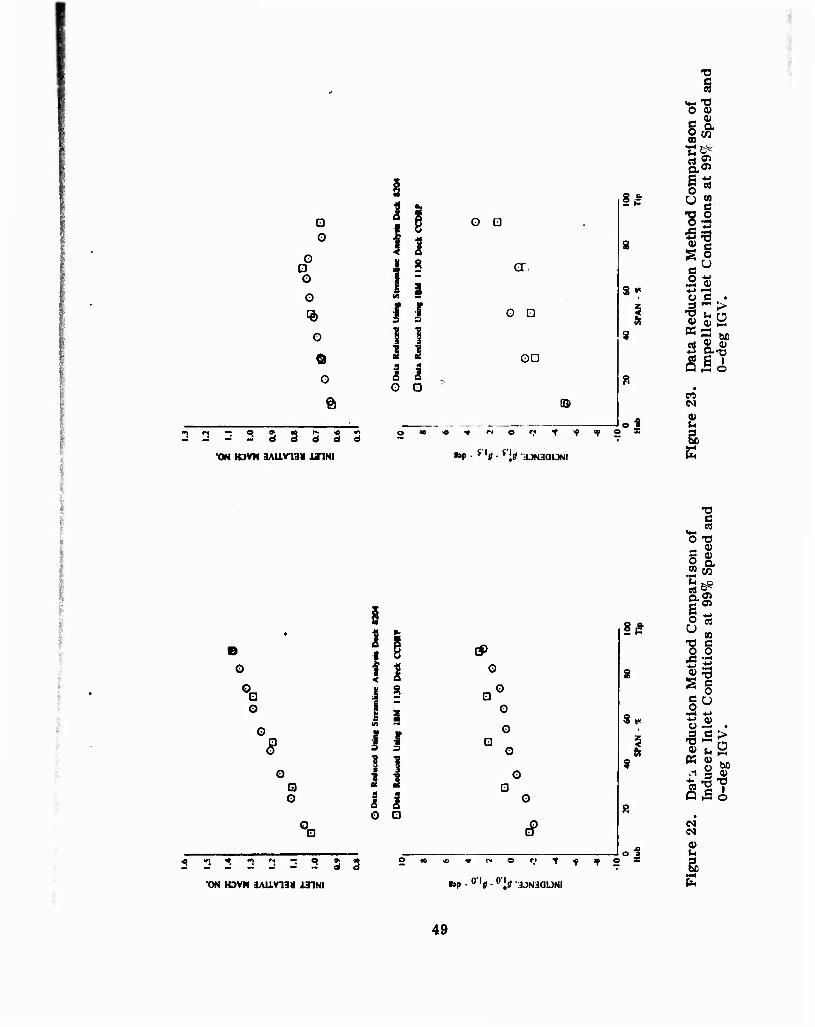
22 ' Data Reduction Method Comparison of Inducer Inlet Conditions at 99% Soeed and O-dea IGV 49
23 Data Reduction Method Comparison of Impeller Inlet Conditions at 99% Soeed and O-dea IGV 49
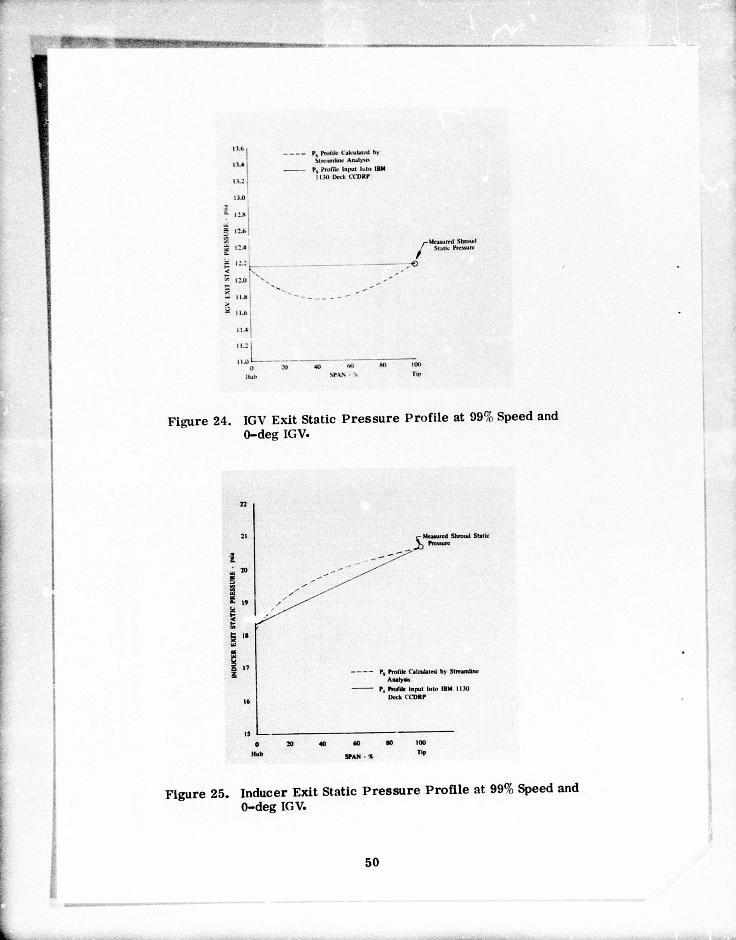
24 IGV Exit Static Pressure Profile at 99% Speed and 0-dee IGV 50
29 Pressure Ratio Characteristics at 30% Speed 55
30 Choke Point Flow Comparison 56
31 Modified Inducer Performance 58
32 Inducer Loss Comparison 59
33 Inducer Performance Comparison (Reduced Using Inlet Plenum Temperature Instead of Inlet Traverses for Comparison) 60
34 Inducer Inlet Conditions at 99% Speed and 0-deg IGV 62
35 Inducer Inlet mdltions Comparison 62
36 Inducer Exit Air Angle Profile at 99% Speed and 0-deg IGV 63
37 Impeller Inlet Conditions at 99% Speed and 0-deg IGV 63
38 Impeller Inlet Conditions Comparison 64
25 Inducer Exit Static Pressure Profile at 99% Speed and 0-deg IGV 50
26 Overall Performance 51
27 Overall Performance Comparison (Efficiency Calculated Using Plenum Temperature Ignoring Preheating Effect) 54
28 Surge Pressure Ratio Comparison of the Modified Centrifugal Compressor and the 10:1 Program 54
P1**',*' 'i>»M»»«l*»«MMi««»W^»~«»~-...-T-|-.rrri,l,) ii.-.,r„. „ ,,
ILLUSTRATIONS (Continued)
FIGURE
A-l IGV Exit Total Temperature Profile; 85% Speed, 20-deg TOY
A-2 IGV Exit Total Ttmperature Profile; 94% Speed, 15-deg IGV (Data Obtained With Probe Parttally in an IGV Wake)
A-3 IGV Exit Total Temferature Profile; 94% Speed, 20-deg IGV (Data Obtained With Probe Partially In an IGV Wake)
A-4 IGV Exit Total Temperature Profile; 99% Speed, 0-deg IGV
A-5 IGV Exit Total Temperature Profile; 99.3% Speed, 5-deg IGV
A-6 IGV Exit Total Temperature Profile; 99.4% Speed, 0-deg IGV
A-7 Inducer Exit Traverse; 85% Speed, 20-deg IGV, Run 9.02
A-8 Inducer Exit Traverse; 94% Speed, 15-deg IGV, Run 9.03
A-9 Inducer Exit Traverse; 94% Speed, 20-deg IGV, Run 9.03
A-10 Inducer Exit Traverse; 99% Speed, 0-deg IGV, Run 9.03
A-ll Inducer Exit Traverse; 99.3% Speed, 5-deg IGV, Run 9.03 ,
A-12 Inducer Exit Traverse; 99.4% Speed, 0-deg IGV, Run 9.02 ,
PAGE
68
68
69
69
70
70
71
72
73
74
75
76
>«.;;■:. *m msmmmmm. ^'■■''•^'mmmmmmm
TABLE
1
2
3
4
5
6
7
8
9
10
11
TABLES
PAGE
Summary of Aerodynamic Component Modifications 9
Inducer Aerodynamic Design Point Information 14
Modified Inducer Stress Summary 15
Compressor Overall Performance instrumenta- tion Summary 30
Location of Collector Instrumentation 33
Compressor Component Performance Instrumentation Summary 34
Data Summary 37
Analysis of Instrumentation Accuracy 45
99% Speed, 0-deg IGV, Steady-State Printout 47
Overall Performance Tabulation 52
Modified Inducer Performance 59
SECTION 1
INTRODUCTION
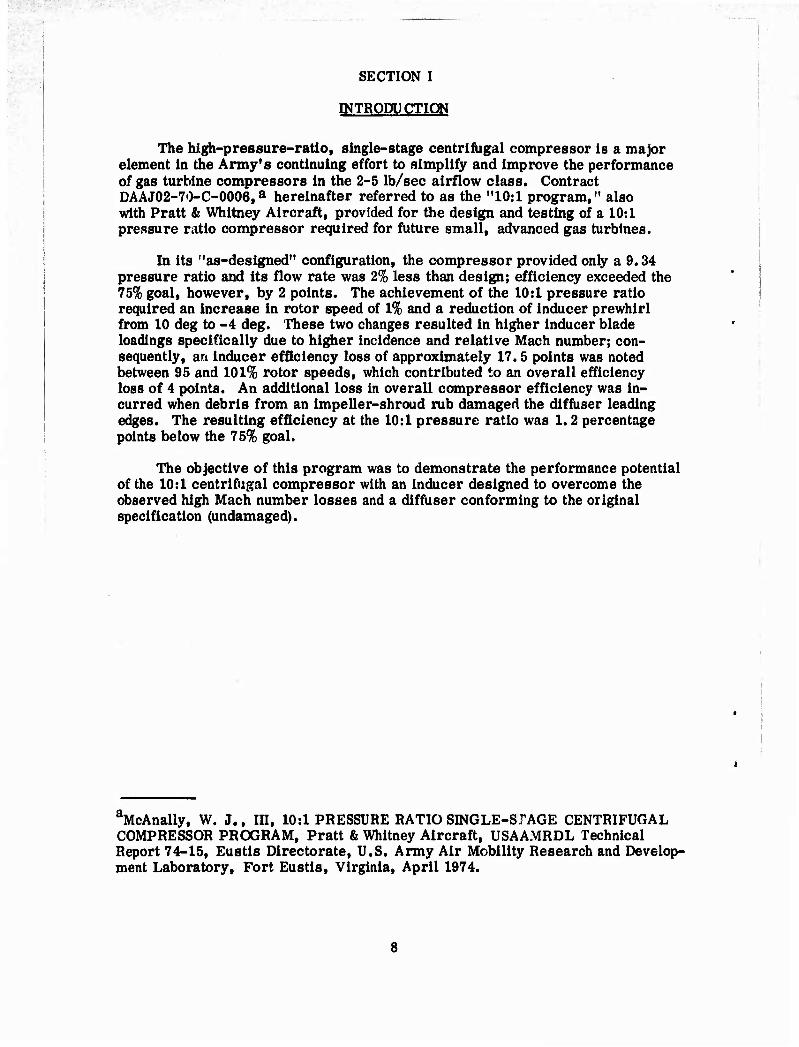
The high-p res sure-ratio, single-stage centrifugal compressor is a major element in the Army's continuing effort to simplify and improve the performance of gas turbine compressors in the 2-5 lb/sec airflow class. Contract DAAJ02-7i3-C-0006t
a hereinafter referred to as the "10:1 program," also with Pratt & Whitney Aircraft, provided for the design and testing of a 10:1 pressure ratio compressor required for future small, advanced gas turbines.
In its "as-designed" configuration, the compressor provided only a 9.34 pressure ratio and its flow rate was 2% less than design; efficiency exceeded the 75% goal, however, by 2 points. The achievement of the 10:1 pressure ratio required an increase in rotor speed of 1% and a reduction of inducer prewhirl from 10 deg to -4 deg. These two changes resulted in higher inducer blade loadings specifically due to higher incidence and relative Mach number; con- sequently, an inducer efficiency loss of approximately 17.5 points was noted between 95 and 101% rotor speeds, which contributed to an overall efficiency loss of 4 points. An additional loss in overall compressor efficiency was in- curred when debris from an impeller-shroud rub damaged the diffuser leading edges. The resulting efficiency at the 10:1 pressure ratio was 1.2 percentage points below the 75% goal.
The objective of this program was to demonstrate the performance potential of the 10:1 centrifugal compressor with an inducer designed to overcome the observed high Mach number losses and a diffuser conforming to the original specification (undamaged).
aMcAnally, W. J., Ill, 10:1 PRESSURE RATIO SINGLE-Sf AGE CENTRIFUGAL COMPRESSOR PROGRAM, Pratt & Whitney Aircraft, USAAMRDL Technical Report 74-15, Eustis Directorate, U.S. Army Air Mobility Research and Develop- ment Laboratory, Fort Eustis, Virginia, April 1974.
Wtttnmmm*»*
SECTION II
DESIGN
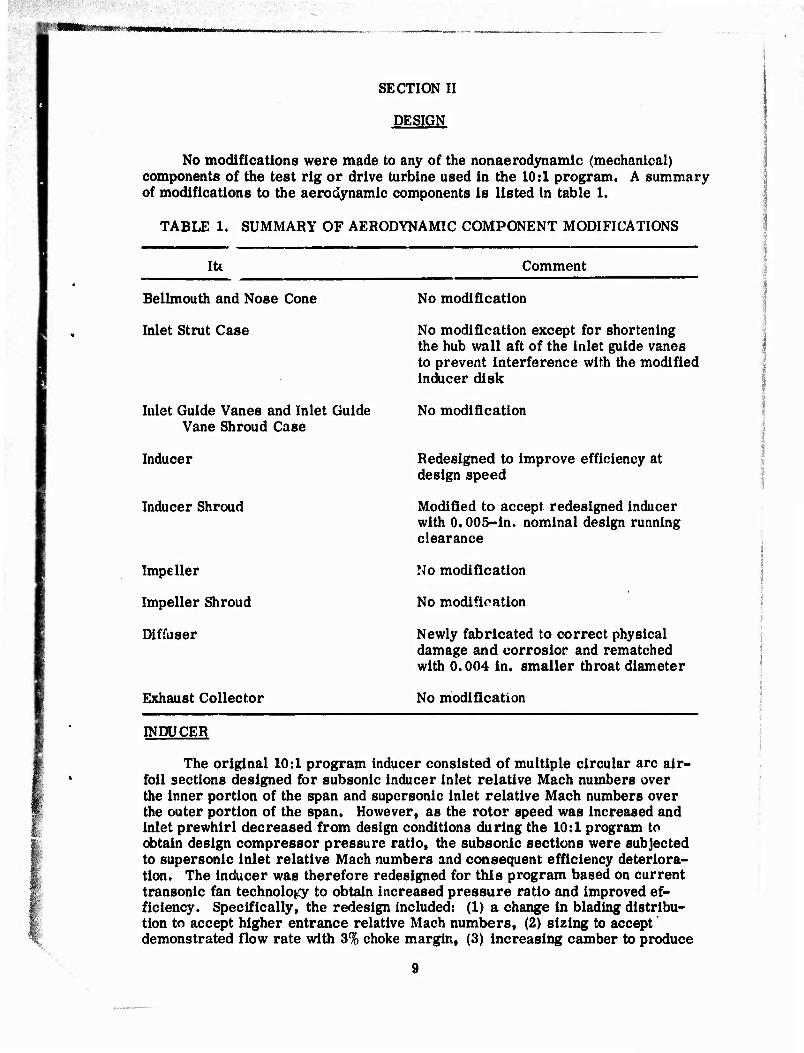
No modifications were made to any of the nonaerodynamic (mechanical) components of the test rig or drive turbine used in the 10:1 program. A summary of modifications to the aerodynamic components is listed in table 1.
TABLE 1. SUMMARY OF AERODYNAMIC COMPONENT MODIFICATIONS
Itt Comment
Bellmouth and Nose Cone
Inlet Strut Case
Met Guide Vanes and Inlet Guide Vane Shroud Case
Inducer
Inducer Shroud
Impeller
Impeller Shroud
Diffuser
Exhaust Collector
No modification
No modification except for shortening the hub wall aft of the inlet guide vanes to prevent interference with the modified inducer disk
No modification
Redesigned to improve efficiency at design speed
Modified to accept redesigned inducer with 0.005-in. nominal design running clearance
No modification
No modification
Newly fabricated to correct physical damage and corrosion and rematched with 0.004 in. smaller throat diameter
No modification
INDUCER
The original 10:1 program inducer consisted of multiple circular arc air- foil sections designed for subsonic inducer inlet relative Mach numbers over the inner portion of the span and supersonic inlet relative Mach numbers over the outer portion of the span. However, as the rotor speed was increased and inlet prewhirl decreased from design conditions during the 10:1 program to obtain design compressor pressure ratio, the subsonic sections were subjected to supersonic inlet relative Mach numbers and consequent efficiency deteriora- tion. The inducer was therefore redesigned for this program based on current transonic fan technology to obtain increased pressure ratio and improved ef- ficiency. Specifically, the redesign included: (1) a change in blading distribu- tion to accept higher entrance relative Mach numbers, (2) sizing to accept demonstrated flow rate with 3% choke margin, (3) increasing camber to produce
9
***>*)!*■■'■■ t
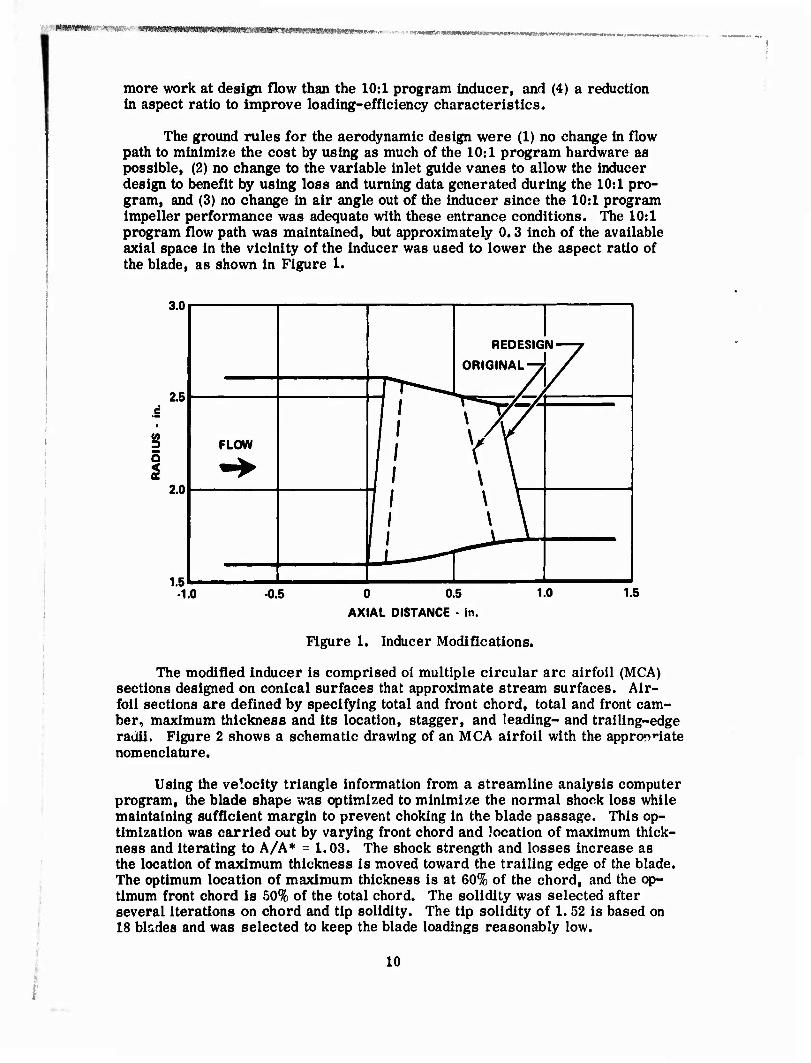
more work at design flow than the 10:1 program inducer, and (4) a reduction in aspect ratio to improve loading-efficiency characteristics.
The ground rules for the aerodynamic design were (1) no change in flow path to minimize the cost by using as much of the 10:1 program hardware as possible, (2) no change to the variable inlet guide vanes to allow the inducer design to benefit by using loss and turning data generated during the 10:1 pro- gram, and (3) no change in air angle out of the inducer since the 10:1 program impeller performance was adequate with these entrance conditions. The 10:1 program flow path was maintained, but approximately 0.3 inch of the available axial space in the vicinity of the inducer was used to lower the aspect ratio of the blade, as shown in Figure 1.
3.0
2.5
s 2
2.0
REDESIGN—7
ORIGINAL-7! /
"l i ^^^^^^ r f
FLOW
( 1 1
1 J 1 1 1 \ r"
1 \ \ 1
1.5 •1.0 -0.5 0 0.5 1.0 1.5
AXIAL DISTANCE • in.
Figure 1. Inducer Modifications.
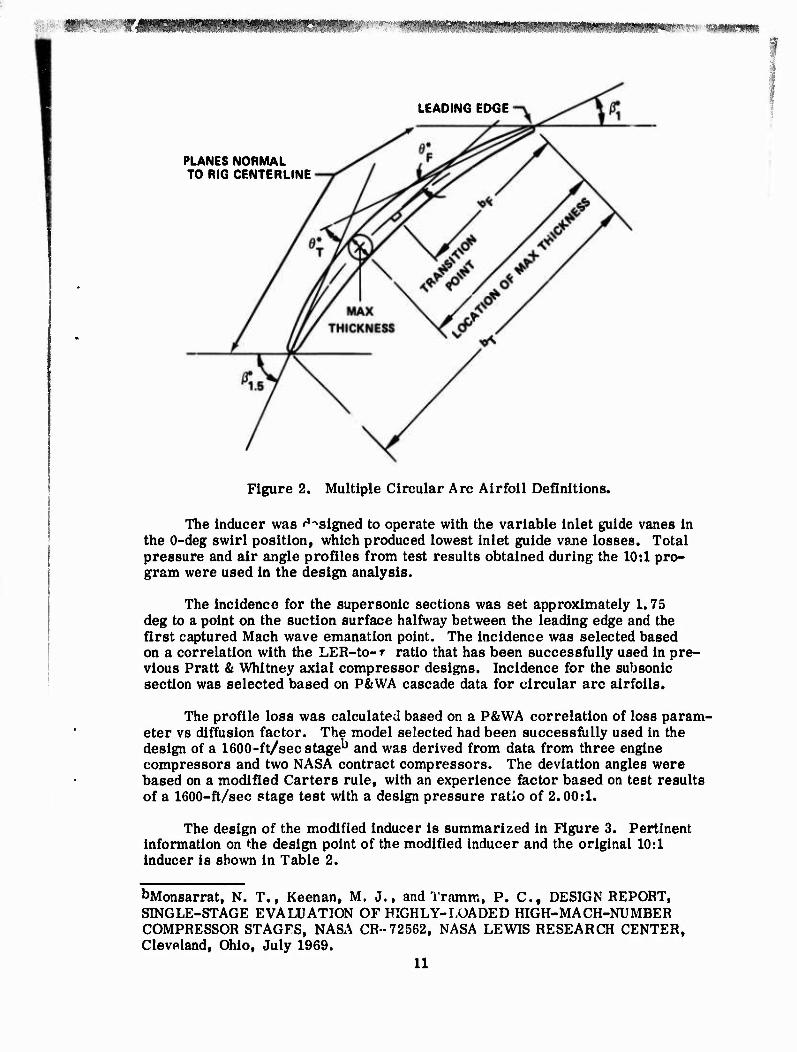
The modified inducer is comprised oi multiple circular arc airfoil (MCA) sections designed on conical surfaces that approximate stream surfaces. Air- foil sections are defined by specifying total and front chord, total and front cam- ber, maximum thickness and its location, stagger, and leading- and trailing-edge radii. Figure 2 shows a schematic drawing of an MCA airfoil with the approrWate nomenclature.
Using the velocity triangle information from a streamline analysis computer program, the blade shape was optimized to minimize the normal shook loss while maintaining sufficient margin to prevent choking in the blade passage. This op- timization was carried out by varying front chord and location of maximum thick- ness and iterating to A/A* = 1.03. The shock strength and losses increase as the location of maximum thickness is moved toward the trailing edge of the blade. The optimum location of maximum thickness is at 60% of the chord, and the op- timum front chord is 50% of the total chord. The solidity was selected after several iterations on chord and tip solidity. The tip solidity of 1. 52 is based on 18 blades and was selected to keep the blade loadings reasonably low.
10
LEADING EDGE
PLANES NORMAL TO RIG CENTERLINE
Figure 2. Multiple Circular Arc Airfoil Definitions.
The inducer was ^signed to operate with the variable inlet guide vanes in the 0-deg swirl position, which produced lowest inlet guide vane losses. Total pressure and air angle profiles from test results obtained during the 10:1 pro- gram were used in the design analysis.
The incidence for the supersonic sections was set approximately 1.75 deg to a point on the suction surface halfway between the leading edge and the first captured Mach wave emanation point. The incidence was selected based on a correlation with the LER-to-r ratio that has been successfully used in pre- vious Pratt & Whitney axial compressor designs. Incidence for the subsonic section was selected based on P&WA cascade data for circular arc airfoils.
The profile loss was calculated based on a P&WA correlation of loss param- eter vs diffusion factor. The model selected had been successfully used in the design of a 1600-ft/sec stage" and was derived from data from three engine compressors and two NASA contract compressors. The deviation angles were based on a modified Carters rule, with an experience factor based on test results of a 1600-ft/sec stage test with a design pressure ratio of 2.00:1.
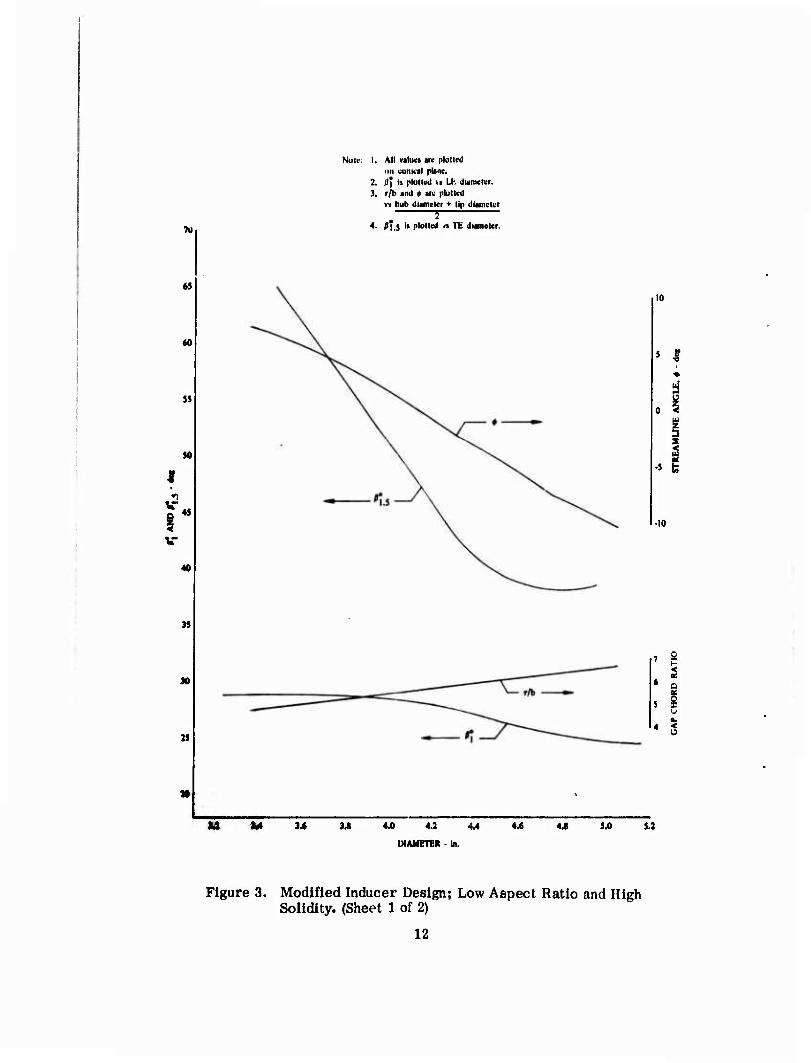
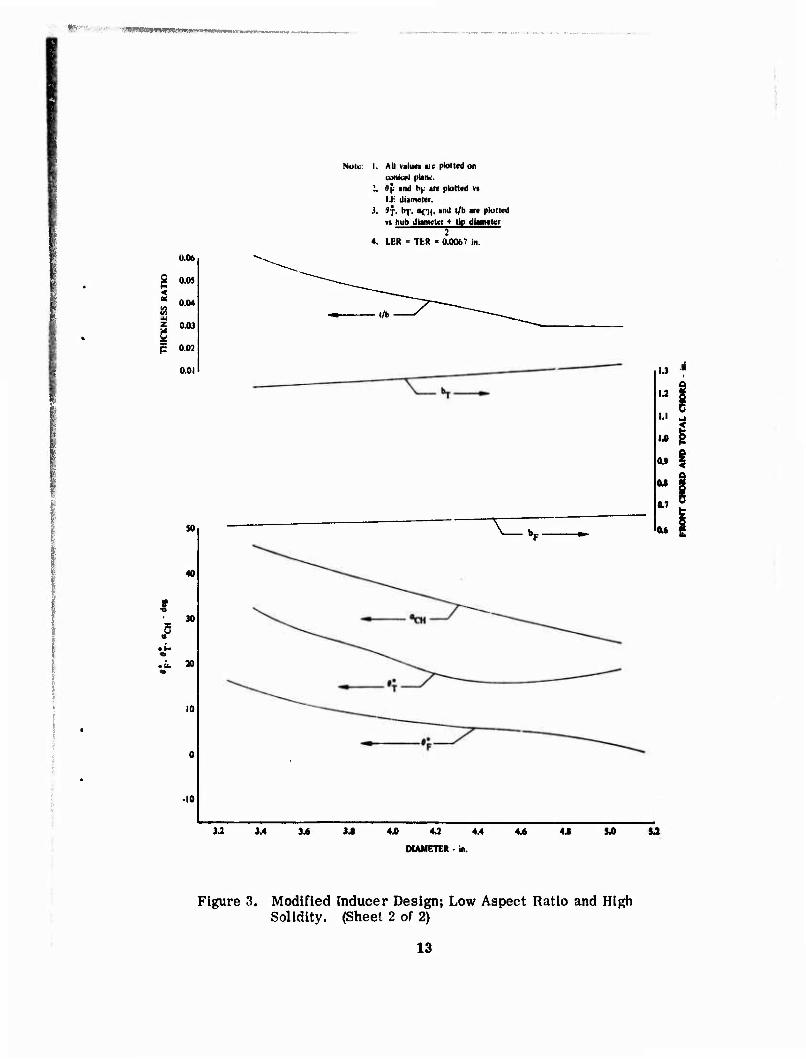
The design of the modified inducer is summarized in Figure 3. Pertinent information on the design point of the modified inducer and the original 10:1 inducer is shown in Table 2.
bMonsarrat, N. T., Keenan, M. J., and Tramm, P. C, DESIGN REPORT, SINGLE-STAGE EVALUATION OF HIGHLY-LOADED HIGH-MACH-NXJMBER COMPRESSOR STAGFS, NASA CR-72562, NASA LEWIS RESEARCH CENTER, Cleveland, Ohio, July 1969.
11
TU
6$
60
5J
M
I vr
v
35
M
Noti- I. All valiKi arc plollcd im conical plane.
2. iJ* H plolted vi Ll. dianiclcr. 3. r/h anü t arv plotted
v« hub diameter + tip diameter ,
4. f'.s it plotted a TE dianetcr.
M M 34 U *ja 4.2 4.4 4.6
DIAMETER - in.
44 5.0
10
5 1
-10
< i
s £
5.:
Figure 3. Modified Inducer Design; Low Aspect Ratio and High Solidity. (Sheet 1 of 2)
12
'*'" rmtmmmimomm»
0.06
B 0.05 < SI 004
is z 0.0.1 Ö (5: 0.02
0.01
so
I 30
.0. 20
10
•10
Nulv: I. All viluo «a- plolleii on omic»! plain.'.
\ »f aiul h(. ire plotted vi \X. dumelw.
i. of, I»]. ofn. >nd l/b in plotted vi hub dlMiietef ♦ Up dlwwlcf
] 4. LER - TtR ' 0.0067 in.
l/b-
14
1.2
I.I
\A
0.9
M
017
at
3.2 3.4 34 3.1 4.0 4.2 4.4 4.6 4.S S.0 S.2
DUMGTER - in.
Figure 3. Modified Inducer Design; Low Aspect Ratio and High Solidity. (Sheet 2 of 2)
13
MMMRU jiiLuwn wmmmmmm
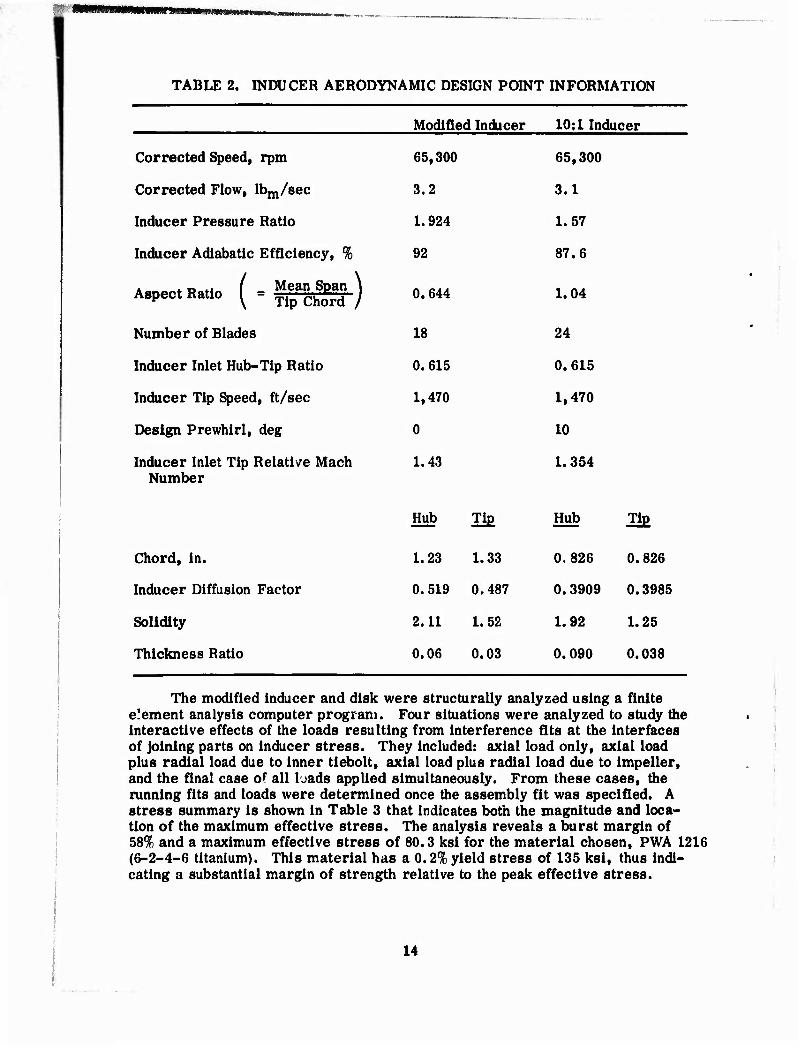
TABLE 2. INDUCER AERODYNAMIC DESIGN POINT INFORMATION
Corrected Speed, rpm
Corrected Flow, Ibm/sec
Inducer Pressure Ratio
Inducer Adiabatlc Efficiency, %
(Mean Span ] Tip Chord / Aspect Ratio
Number of Blades
Inducer Inlet Hub-Tip Ratio
Inducer Tip Speed, ft/sec
Design Prewhirl, deg
Inducer Inlet Tip Relative Mach Number
Chord, in.
Inducer Diffusion Factor
Solidity
Thickness Ratio
Modified Inducer 10:1 Inducer
65,300 65,300
3.2 3.1
1.924 1.57
92 87.6
0.644 1.04
18 24
0.615 0.615
1,470 1,470
0 10
1.43 1.354
Hub HE Hub Tiß
1.23 1.33 0.826 0.826
0.519 0.487 0.3909 0.3985
2.11 1.52 1.92 1.25
0.06 0.03 0.090 0.038
The modified inducer and disk were structurally analyzed using a finite element analysis computer program. Four situations were analyzed to study the interactive effects of the loads resulting from interference fits at the interfaces of joining parts on inducer stress. They included: axial load only, axial load plus radial load due to inner tiebolt, axial load plus radial load due to impeller, and the final case of all Iuads applied simultaneously. From these cases, the running fits and loads were determined once the assembly fit was specified. A stress summary is shown in Table 3 that indicates both the magnitude and loca- tion of the maximum effective stress. The analysis reveals a burst margin of 58% and a maximum effective stress of 80.3 ksi for the material chosen, PWA 1216 (6-2-4-6 titanium). This material has a 0.2% yield stress of 135 ksi, thus indi- cating a substantial margin of strength relative to the peak effective stress.
14

■
mmm Wmrnl-* ' > mmmmmmmmmm mrmmmm^ wm»mm
TABLE 3. MODIFIED INDUCER STRESS SUMMARY
Outer Snap Load « 15,000 lb
Axial Load» 18»496 lb-
Point of Maximum Effective Stress of 80.276 ksi
Inner Snap Load = 12,000 lb
Material: Temperature: Ultimate Tensile Stress: 0.2% Yield Stress: Coefflcient of Thermal
Expansion: Elastic Modulus:
PWA 1216 200oF 159 ksi 135 ksi
4.78 x lO-6 in./in. 16.1 x 10⁶ p8i
Operating Speed: 65,300 rpm Blade Pull: 23,139 lb Material Utilization Factor: 0.75
Average Tangential Stress: Burst Margin: Maximum Effective Stress:
47.68 ksi 1.58 80.276 ksi at point*
15
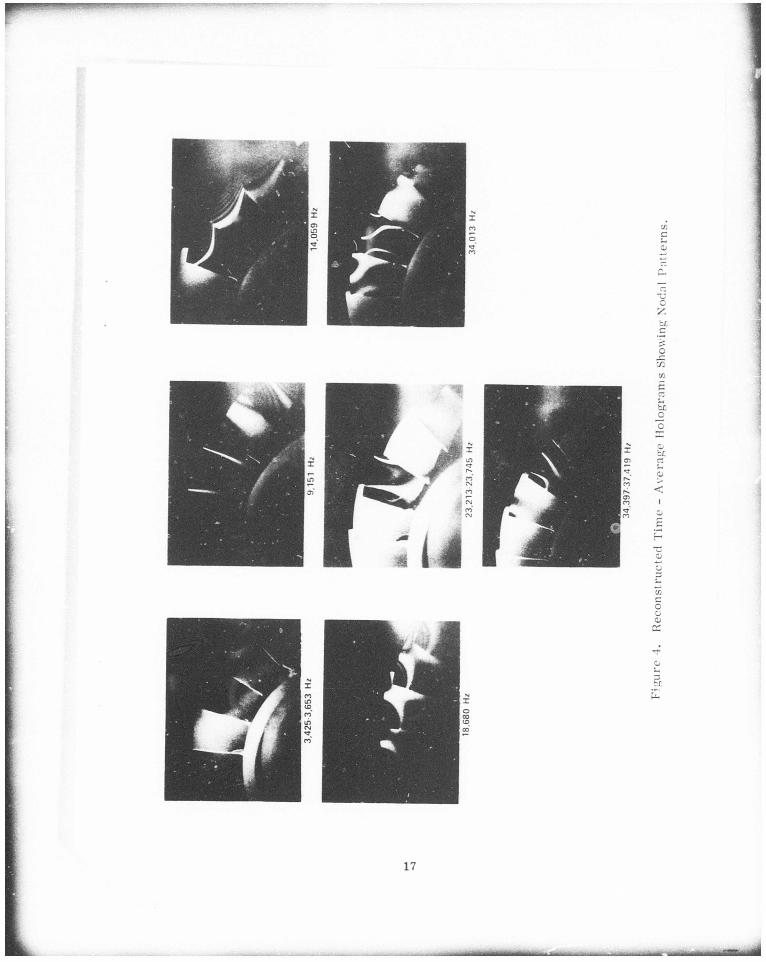
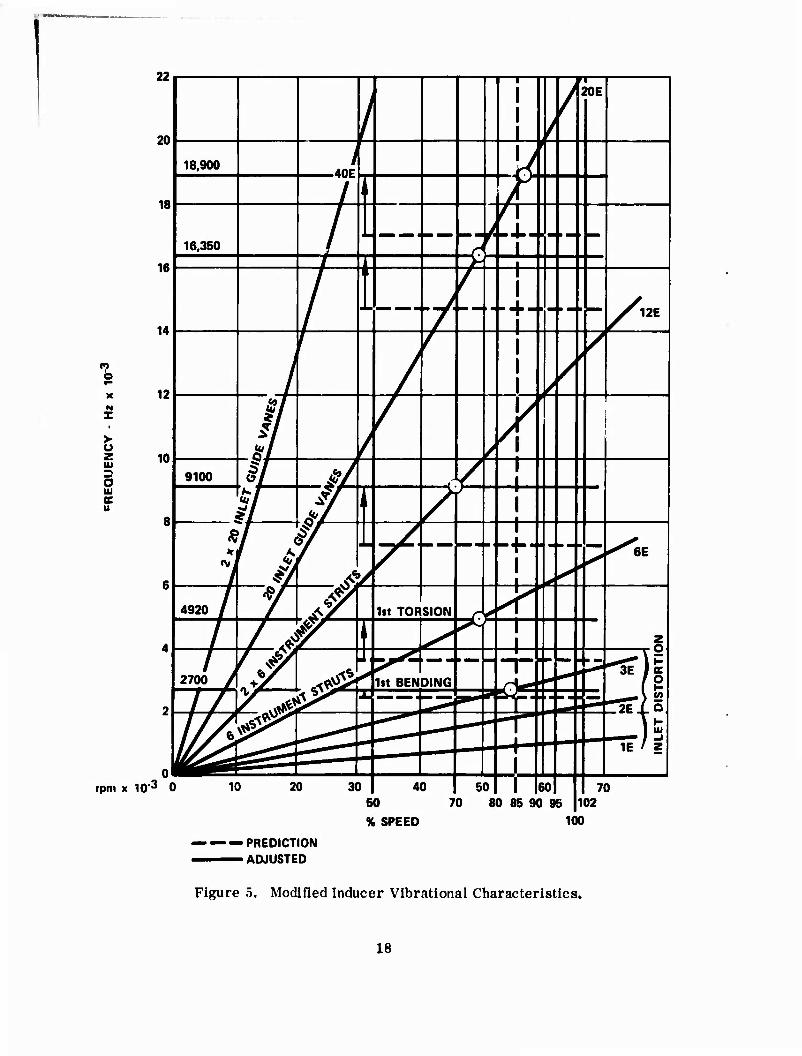
Analytical resonance predictions were made for the modified Inducer and were adjusted to reflect the differences between the predicted and measured natural frequencies of the original 10:1 program inducer. The measured natural frequencies are shown as reconstructed time-average holograms in Figure 4. The adjustment is based on the similarity of analysis techniques and component configuration. The predicted and measured vibrational characteristics are shown in Figure 5. The inducer was analyzed as a cantilevered airfoil with a constant cross section.
The analysis shows that the modified Inducer with a 3% thickness/chord at the tip has no critical resonance modes predicted. The potential for a vibra- tional failure is also greatly reduced by the low steady-state stresses in the air- foil. The maximum steady-state stress is 31 ksi at the trailing edge of the air- foil root, which is only 21% of the allowable stress and results in a fatigue strength of approximately 60 ksi.
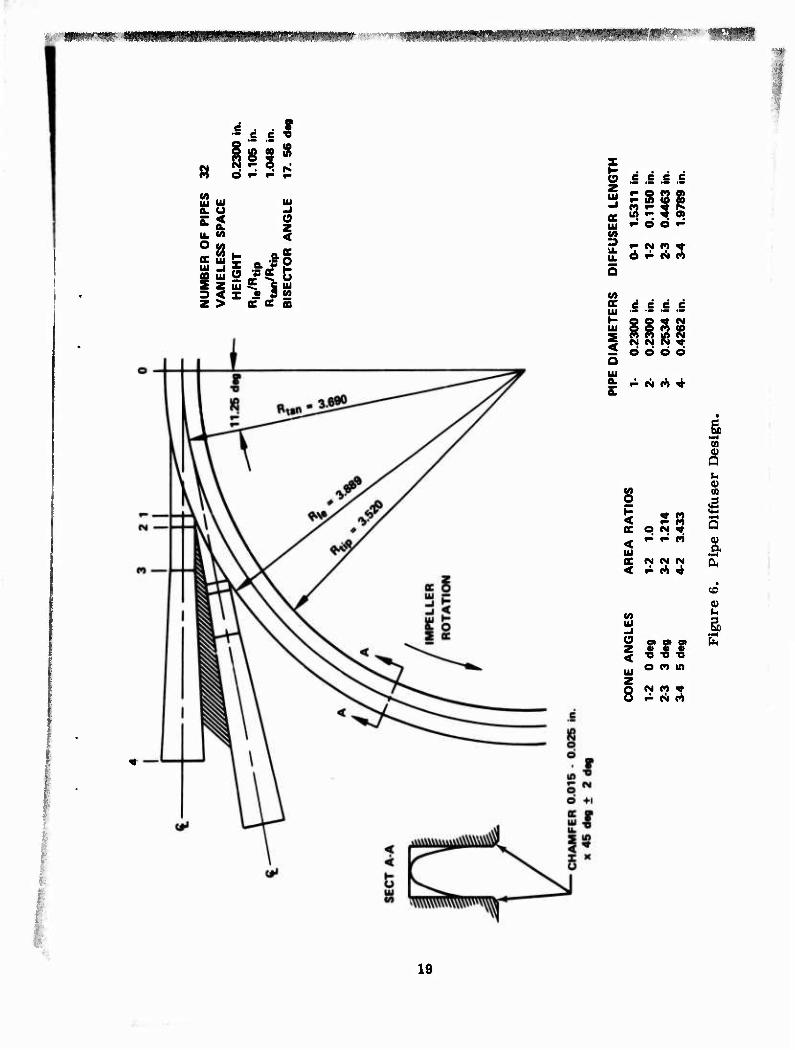
DIFFUSER
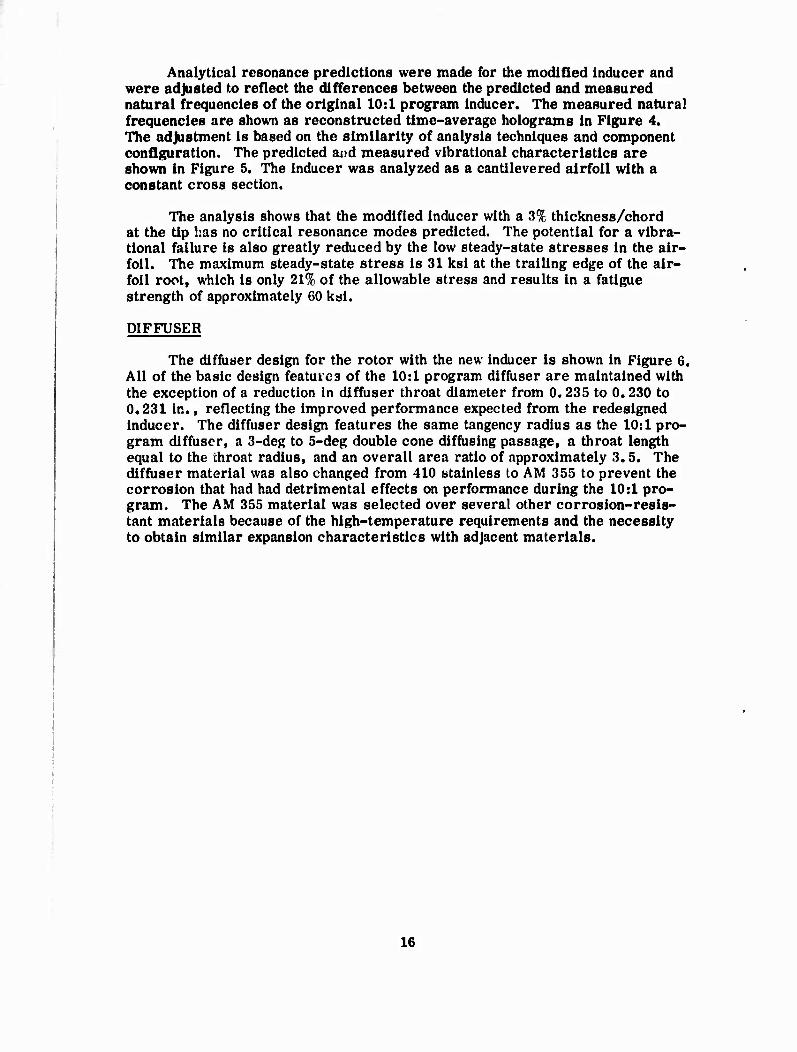
The diffuser design for the rotor with the new inducer is shown in Figure 6. All of the basic design features of the 10:1 program diffuser are maintained with the exception of a reduction in diffuser throat diameter from 0.235 to 0.230 to 0,231 in,, reflecting the improved performance expected from the redesigned inducer. The diffuser design features the same tangency radius as the 10:1 pro- gram diffuser, a 3-deg to 5-deg double cone diffusing passage, a throat length equal to the throat radius, and an overall area ratio of approximately 3,5. The diffuser material was also changed from 410 stainless to AM 355 to prevent the corrosion that had had detrimental effects on performance during the 10:1 pro- gram. The AM 355 material was selected over several other corrosion-resis- tant materials because of the high-temperature requirements and the necessity to obtain similar expansion characteristics with adjacent materials.
16
22
20
18
16
14
12
10
8
6
4
2
o
, /
i
1 1
20E
18,900 Ü /
i /
16.350 /
■ wmm MMB ■
"c f J
... -•- -
/ > J^ ^^
/I m a^ «MM ■
/
f ■--
... -.- - ^r 12E
n b
r y r , /
^
N X
i 1 s /
/
1
A /
ID
o 9100 f »V, k. 1 i
UJ BE u
« 4;/ V
&/ /\
j - i ■
«/ < .^/ — -¥- .'
^E
t f i V
/
4920 / ^y^ is 1$t TOR SION —Tt, y
% / / ^ f ^^ A'
2700 /
/ £/ ^K * Ist BENDING
•— ■ -■ '.Z. - it
"'SEX5 1 / ̂ - ^s 't*?^i ■ — — > __i
-■ '
'.'~ ■■■
M£ ^
l — - __5
IE ' z
rpm x 10-3 C » 10 2
— — — PREDICT
0 30
ION D
4 SO
% SPEED
0 7
50 0
1 6 30 85 90 95
KM
7 02 )
9
Figure 5. Modified Inducer Vibrational Characteristics.
18
wm*^ ■v.vm^^.w^f'^v^ ^i^sm* im * ^- turn m ^m ^^^flifci^l *1mdä*ä*- iV*«r •■ *
«ä ■ • I — c c ^
l< 0 J2 K Ui
§3 8
i Z
O r- >- ^
UI .J o z <
ee ec S
z (9 e e e
oc LU
2 o z ü
5 ^ N n * Jt 6 »i Ki rt
M OC e e c c IU — — •- — •" O O S «M ui 5 5 m <o 5 m m ia CM
S o o o o
t- M « <■
• s. •^ 09
S IN 0)
2 (0
<3 < ?8
83 ■«4
Q KON«
Ul ipe
OC N (M N di < ^ rt 4 •
CD
0)
Ui -i
sin E
Uj o w « z O N P> V 8 ^ c<i rt
19

SKCTION III
TKST KQU1PMKNT
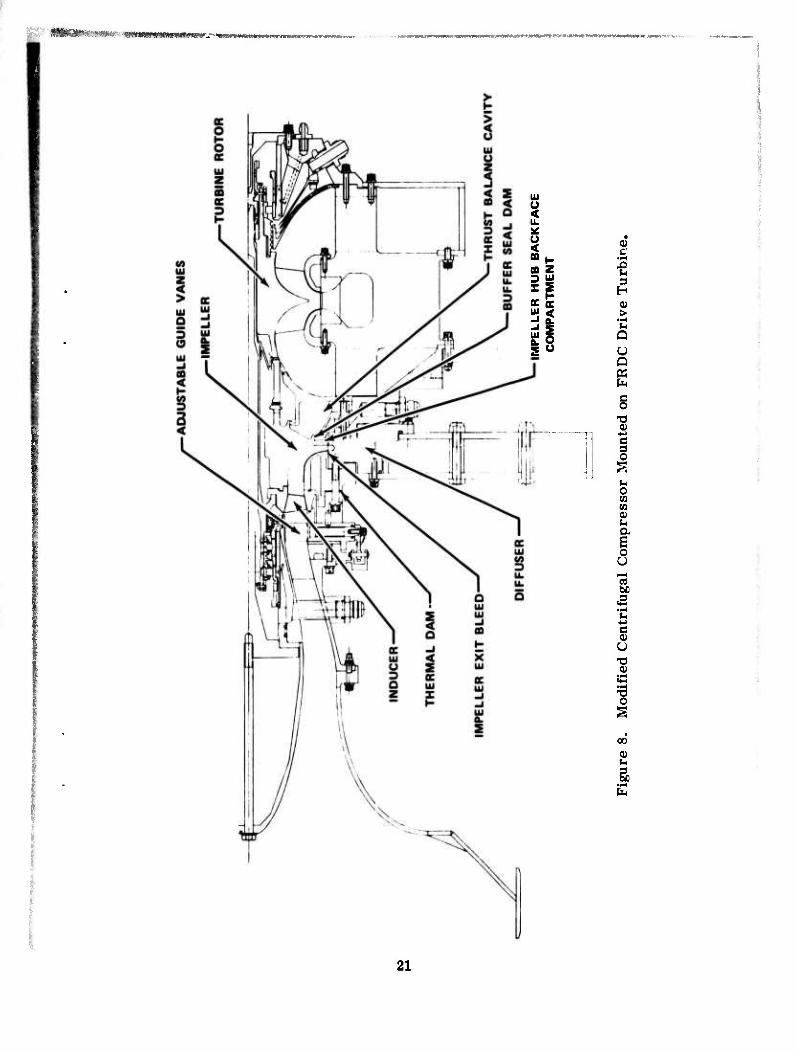
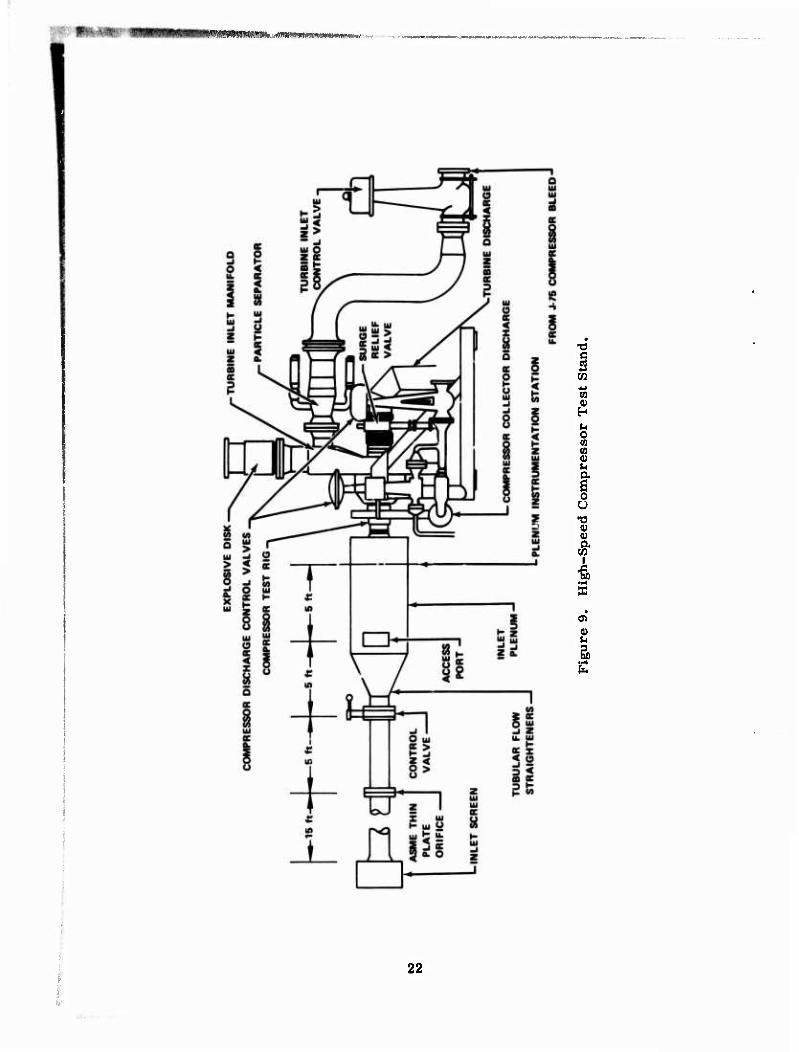
The compressor research rig incorporated both the compressor and drive turbine assembled as a single rotor, as shown in Figure 7. The radial inflow drive turbine had an integral, single-entry, double-exit configuration, thus forming a back-to-back, thrust-balanced arrangement. A schematic of the compressor rig is shown in Figures. It is the same aerodynamic configuration as that used in the 10:1 program except for the modified inducer, inducer shroud, and new diffuser. The rig was mounted in the high-speed compressor test stand, schematically illustrated in Figure 9. Sufficient horsepower is available for testing at sea level inlet conditions.
Figure 7. Rotor Assembly.
A bleed system was installed in the impeller exit shroud static pressure communicating groove, as shown in Figure 8. The bleed system could be con-trolled by the use of valves installed between the communicating groove and the scavenge pump. The thermal barr ier machined between the impeller and inducer shroud, which was purged with nitrogen throughout the test to retard heat trans-fer , is also si own in Figure 8.
20
;- m'ntm-*;-«ti--.-<:-#»t>..:v_ »tW^«MW«t*«M'SWM»l"(V*^V'»t*
tu o < u. it
< ? CO Z 3 IU 3 I^ H ec oc « "i < > ■J a. •-i -1 5
So u P
s ü U
§ (U
c 3 o
U o CO ca 0) u
I o U
c 0) U XI 0)
«Ö
o
00 a» hi
&
21
W^WSIS«#»5SV ..■fflKSNBvw.VMWM««,,
c s en
co 0) H u o m v u 0. B o u -o (U
4 £
0)
EH
22
S»*W«w*««W-»¥«WJ«ll«lW
The impeller and inducer were detail-balanced by material removal. The final residual unbalance of the inducer after detail balance was 0.0016 oz-in. The impeller was detail-balanced to 0.0012 oz-in. in the front plane and 0.0020 oz- in. in the rear plane. The as-assembled and final residual rotor unbalances, which were obtained by insertion of pins and rivets, are as follows:
As Assembled Final
Front Plane
0.012 oz-in. 0.001 oz-in.
Rear Plane
0.013 oz-in. 0.0015 oz-in.
The final balance maximum unbalance limit in both the front and rear planes was 0.002 oz-in.
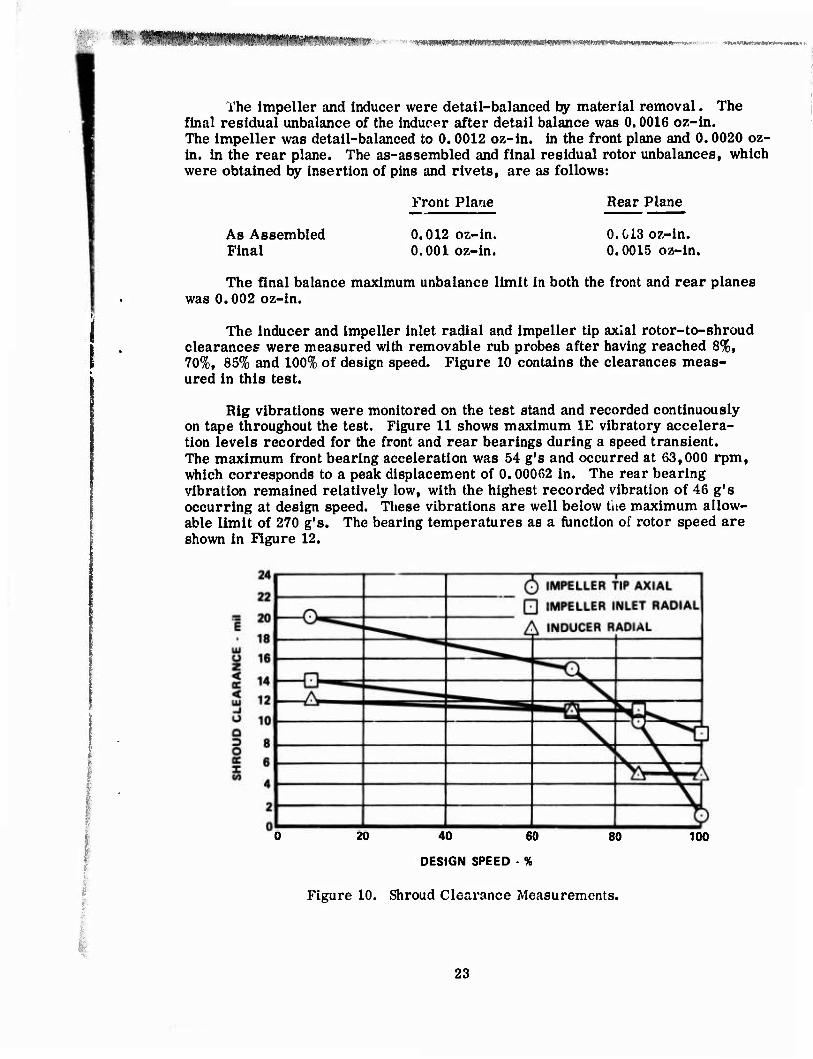
The inducer and impeller inlet radial and impeller tip axial rotor-to-shroud clearances were measured with removable rub probes after having reached 8%, 70%, 85% and 100% of design speed. Figure 10 contains the clearances meas- ured in this test.
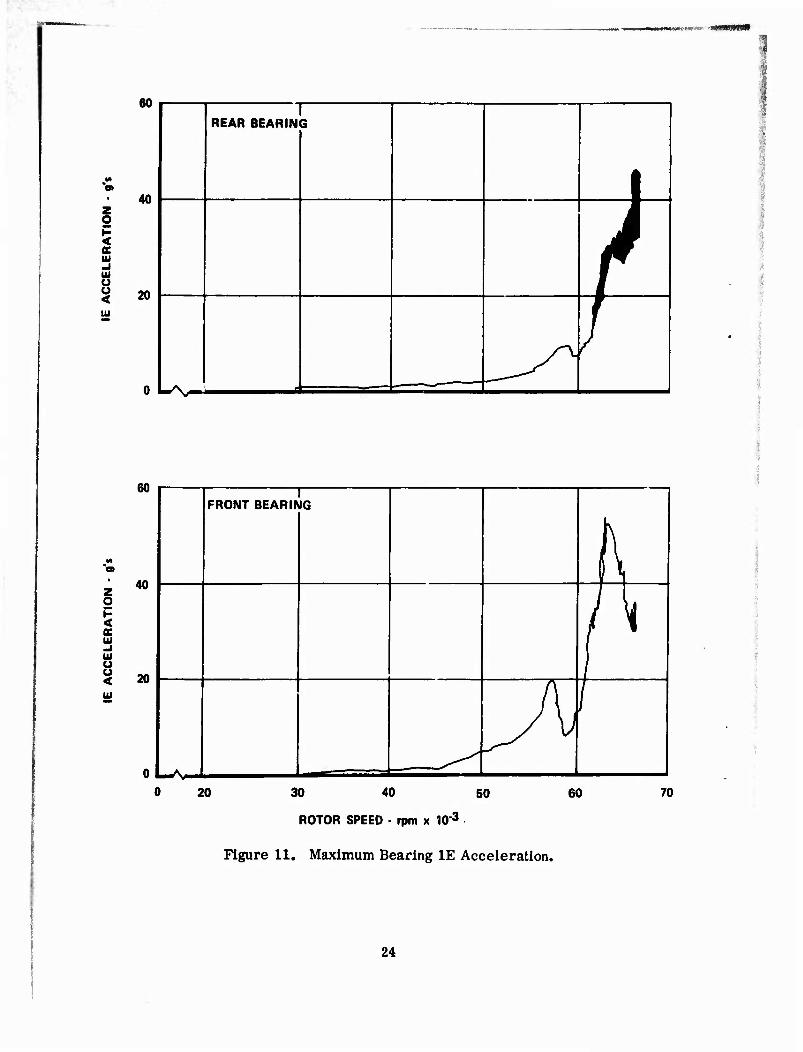
Rig vibrations were monitored on the test stand and recorded continuously on tape throughout the test. Figure 11 shows maximum IE vibratory accelera- tion levels recorded for the front and rear bearings during a speed transient. The maximum front bearing acceleration was 54 g's and occurred at 63,000 rpm, which corresponds to a peak displacement of 0.00062 in. The rear bearing vibration remained relatively low, with the highest recorded vibration of 46 g's occurring at design speed. These vibrations are well below tae maximum allow- able limit of 270 g's. The bearing temperatures as a fimctlon of rotor speed are shown In Figure 12.
40 60
DESIGN SPEED - %
Figure 10. Shroud Clearance Measurements.
100
23
40
< K 111
8 < 20
REAR BEARIN 3
1
/
Uv^.
/
60
40
<
g »
FRONT BEARir 1 IG
il\i r
^
/
20 30 40 50
ROTOR SPEED • rpm x lO'3
Figure 11. Maximum Bearing IE Acceleration.
60 70
24

UwfllMSMtWw.v. .• MM
I
50 55
ROTOR SPEED - rpm x ICT3
Figure 12. Bearing Outer Race Temperatures.
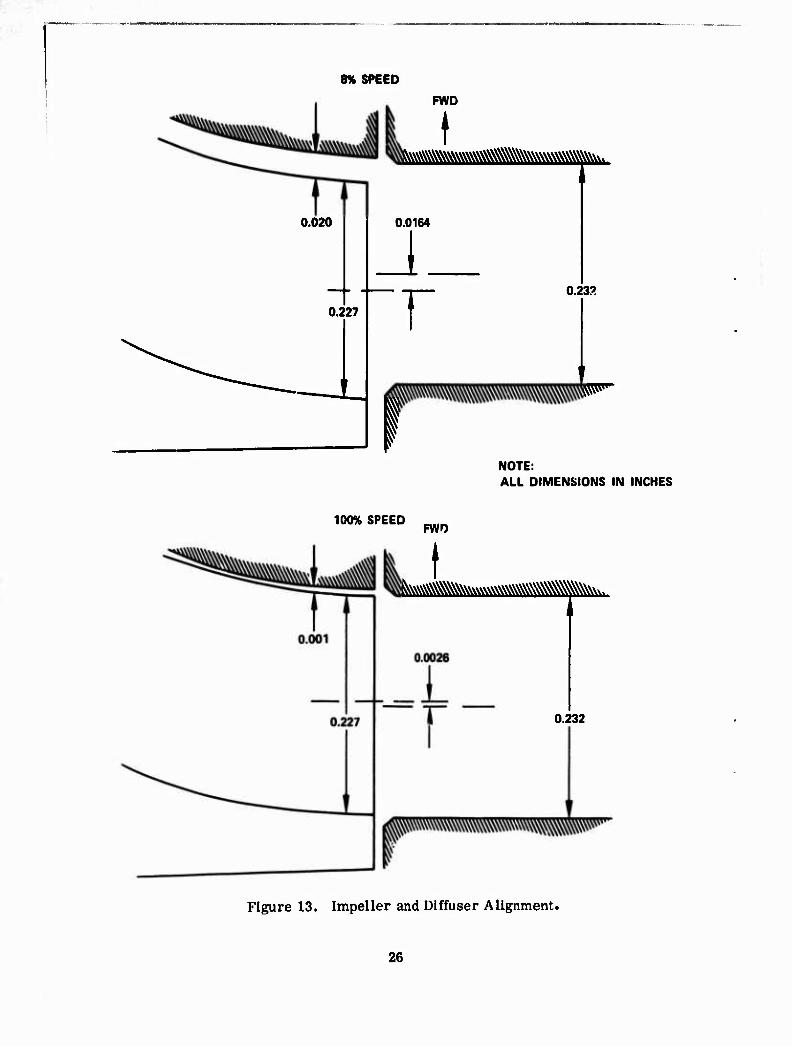
The impeller exit-to-diffuser entrance alignment is shown in Figure 13 and was calculated from build measurements obtained during compressor rig assembly and impeller-to-shroud clearances measured during the checkout test. The desired des^n speed alignment was such that the impeller blade exit and diffuser vcneless space cmiterlines were in line. At design speed, this alignment was essentially obtained within 0.0026 in. The small difference in alignment can be considered negligible since no forward-facing step was created, as the shroud sides of the impeller blades are in line with the diffuser vaneless space wall. An additional margin is allowed by tbe chamfer at vaneless space entrance.
I
25
8% SPEED
FWD
^MiMSS^fc^M^
0.020
0.227
0.0164
J r 0.232
i pww ww
NOTE: ALL DIMENSIONS IN INCHES
100% SPEED FWD
^Mtoas^^Sl^fc
0.232
Figure 13. Impeller and Diffuser Alignment.
26
SECTION IV
INSTRUMENTATION
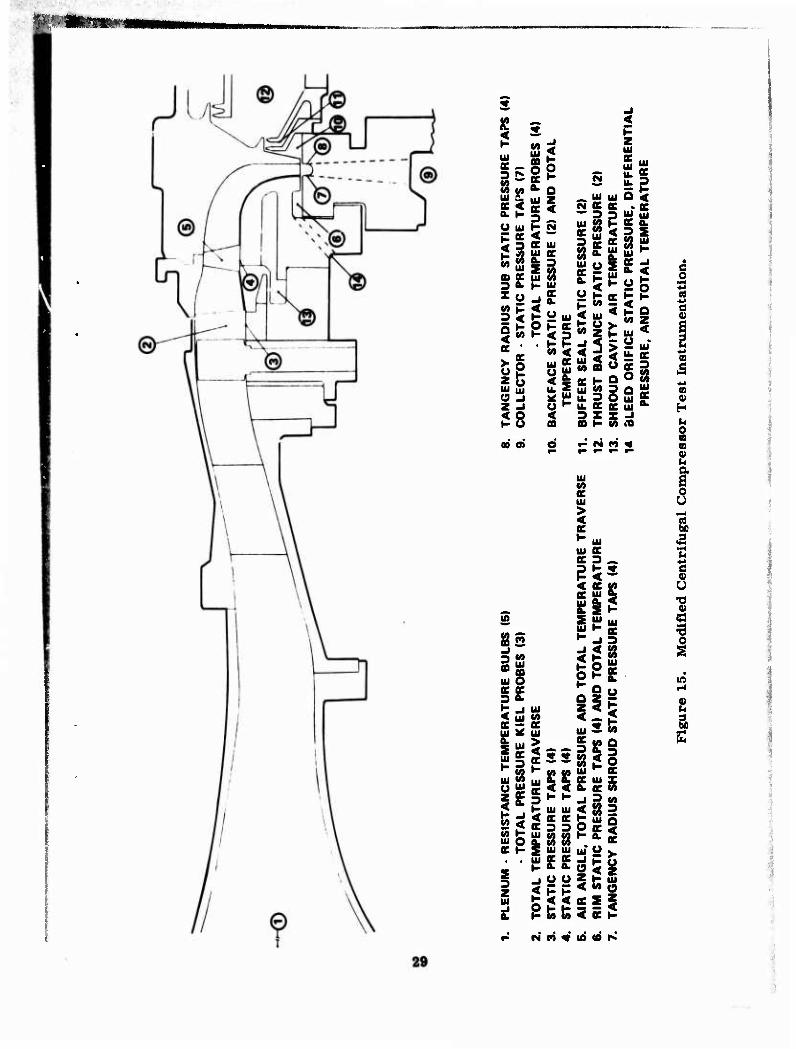
Instrumentation provided to permit evaluation of stage overall and inducer performance and to monitor rig operation is described below. Major instrumenta- tion stations for the test compressor are defined in Figure 14, and an overall instrumentation schematic is shown in Figure 15.
OVERALL PERFORMANCE INSTRUMENTATION
Instrumentation was provided to obtain inlet flow rate, bleed flow rate, inlet guide vane position, impeller speed, and compressor inlet and discharge tem- perature and pressure. Overall performance instrumentation is described in detail below and is also summarized in Table 4.
Compressor inlet flow rate was calculated from data obtained from a 5.270-in.-diameter thin plate orifice installed upstream of the inlet plenum in a 12.5-in.-diameter inlet duct. The orifice was installed in accordance with ASME standards. Orifice upstream static pressure was measured by three static pressure taps, each sensed by a 0- to 15-psia transducer. Three orifice differential static pressures were each sensed by a 5-psid transducer. The temperature for the flow measurement was obtained by the inlet plenum instru- mentation, which consisted of five Rosemount repistance thermometers installed at various radial positions in the inlet plenum to provide an area-averaged temperature.
Impeller rotational speed was obtained from two electromagnetic pickups mounted adjacent to a 6-tooth gear on the rear of the drive turbine rotor shaft. Inlet guide vane position was determined from measurements obtained from a potentiometer connected to the IGV actuator, which is calibrated based on physical actuator position vs vane stagger angle measurements obtained during assembly. Compressor inlet total pressure was measured with three Kiel-type total pressure probes located in the inlet plenum and connected to 0- to 15-psia pressure transducers.
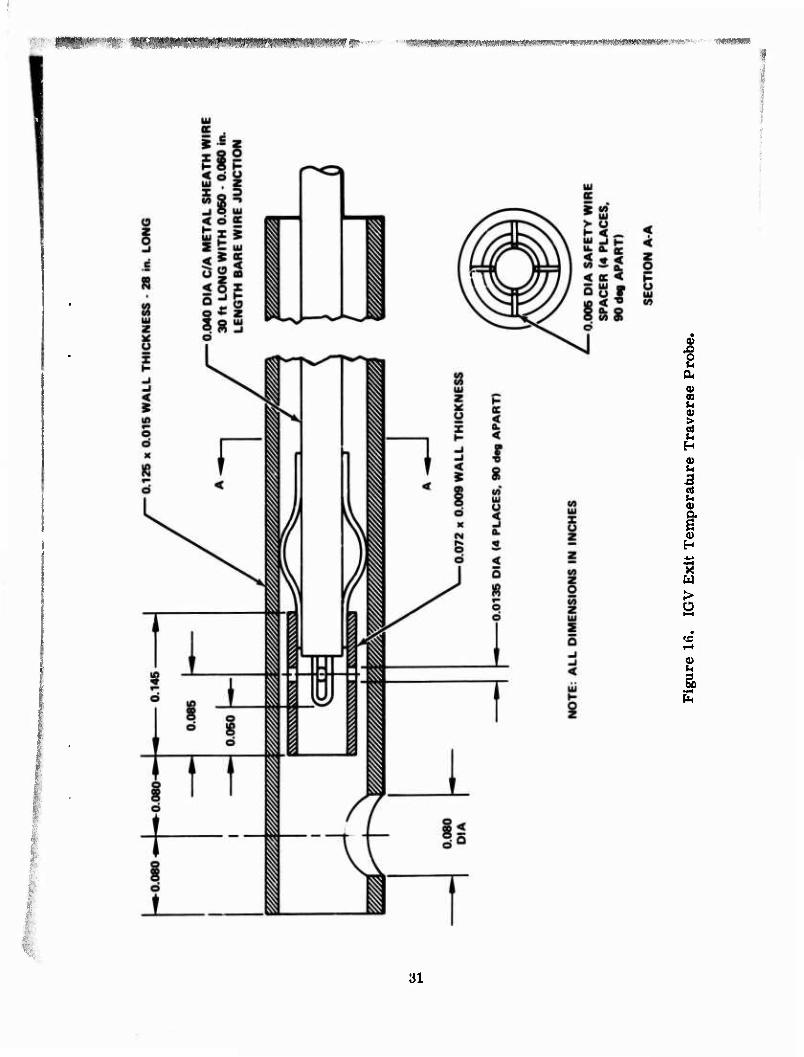
A traverse probe was installed behind the inlet guide vanes to determine the radial total temperature distribution across the flow path at the rotor inlet station. The design of this probe is shown in Figure 16. The probe was aspirated and designed to eliminate conduction from the rig cases through the stem of the probe. The thermocouple leads were continuous to the uniform temperature reference to eliminate error from connectors and the lower quality wire that is generally used as extension wire. Data from this probe were used to determine the inlet temperature required in performance calculations, such as corrected weight flow, speed, and overall temperature ratio. The standard plenum instrumentation was used where inlet traverse temperature was not available.
27
■ .

u < w a
<
<
CO
§ *-> cd u
e o •»< *J a <4->
cn c o CD
c
s 2 4-» (0 e
T3 e es
■s Hi
I O m co 0)
a S o O
0) u
•«• • smava
28
<
111 K -.
K < a. H U ut P|
£g CD K
xu IS AC '
z Ü Ui ut (S J Z -I < O H O
» o>
ui 2 o P S o UJ Z ec < 3 -, »- CM < ~ ec u ui a;
<0- H Uiu P H C •- < 3
. K H M < iij AC Ü UI
Ik 2 w 111
< eo
CM
N K " 3
I« is in o
p M < UI
^3 UI < M CO
C H u! 3 U. K 3 I _ CD H CO I»
<
Z UI
UL K
s^ Ui O < K . ec 3 U ui t- ec a. < 2 2 ff » uf
S E -I
•" = 5 < K O ^ «O Z >lu< — o * > — ui < t « ü « i => o 1Ü cc ui "•
o r- r* n <t
2 Ui >
JO
8« 3«« m UI cog ui O K ec 3 O- S-« ^üf u * |ui
ui M U Ui
< ec s z Ui
ec 3 .-
ec jp ui 5b Z •- 111 uj
CO ec Ui
hi »
H H
J2< M t ui O ec H
S 3 Z ui
ec 3 H ui m < ec ec c 3 3
2 ui ui |ü££ _l o o
O 3
ec ui x a. oc eo -> S S5
fe ^ Q
»<z lag < ec H
c o
e 0) a 2 -to* QQ
S *J OD 0) H
o «D (0 V
i u
c u
I I m .-i
i- N n « ie <o r«

■ ^JwSfl'fliWWNfljW'^^
TABLE 4. COMPRESSOR OVERALL PERFORMANCE INSTRUMENTATION SUMMARY
Location Flow Variable Instrument Type Quantity
Inlet Duct Ps AP8
Oriflce Wall Tap Orifice Wall Tap
3 3
Plenum Pt T
Kiel Head Rosemount
3 5
Inlet Guide Vane a Potentiometer I
IGV Exit T Aspirated Traverse Thermocouple
1
Bleed Orifice Ps ^Ps T
Wall Tap Upstream-Downstream C/A Thermocouple
1 1 1
Collector Ps T
Wall Tap Aspirated Thermocouple
7 4
Rotor Speed Speed Electromagnetic Pickup 2
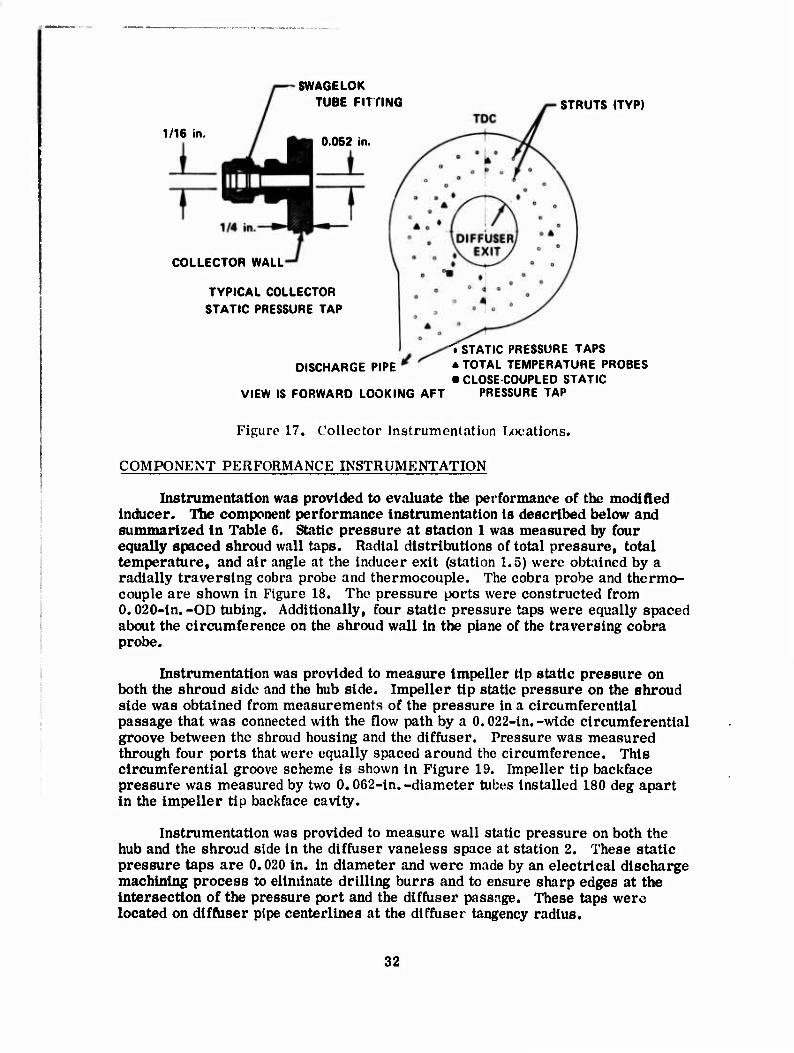
Compressor exit static pressure was measured by seven static pressure taps in the collector: six connected to a pressure-scanning system using a 0- to 150-psia transducer, and one connected to a 0-200 psia close-coupled transducer for fast response during surges. The taps were located on the shroud-side wall so that neither diffuser discharge velocity nor the collector struts Interfere with the measurements. The design and location of these taps are shown In Figure 17. Compressor exit total temperature was measured with four chromel-alumel (C/A) thermocouples In the discharge collector aligned on diffuser pipe centerllnes. A tabulation of the pressure tap and thermocouple locations Is given In Table 5. To increase the accuracy of the temperature measurements, the thermocouples were constructed such that the sensor was located In a flow stream that was aspirated to ambient. Placement of the sensor In the high-velocity flow reduced measurement errors caused by thermal conduction. In addition, the thermocouples werp constructed from a single batch of calibrated, spedal-llmlts-of-error wire similar to the IGV exit probe. This wire was also continuous from the thermo- couple junction to the reference junction.
?J
I^flr'r: l«»PI^^W!M»M'flW6»-
2
I £ I I Q>
H ^-> ■a
>
re
u
31
1/16 in
SWAGELOK TUBE FITTING
0.052 in.
COLLECTOR WALL
TYPICAL COLLECTOR STATIC PRESSURE TAP
DISCHARGE PIPE
STRUTS (TYP)
»STATIC PRESSURE TAPS A TOTAL TEMPERATURE PROBES ■ CLOSE-COUPLED STATIC
VIEW IS FORWARD LOOKING AFT PRESSURE TAP
Figure 17. Collector Instrumentation Locations.
COMPONENT PERFORMANCE INSTRUMENTATION
Instrumentation was provided to evaluate the performance of the modified inducer. The component performance instrumentation is described below and summarized In Table 6. Static pressure at station 1 was measured by four equally spaced shroud wall taps. Radial distributions of total pressure, total temperature, and air angle at the inducer exit (station 1.5) were obtained by a radially traversing cobra probe and thermocouple. The cobra probe and thermo- couple are shown in Figure 18. The pressure ports were constructed from 0.020-in. -OD tubing. Additionally, four static pressure taps were equally spaced about the circumference on the shroud wall in the plane of the traversing cobra probe.
Instrumentation was provided to measure impeller tip static pressure on both the shroud side and the hub side. Impeller tip static pressure on the shroud side was obtained from measurements of the pressure In a circumferential passage that was connected with the flow path by a 0.022-in.-wide circumferential groove between the shroud housing and the diffuser. Pressure was measured through four ports that were equally spaced around the circumference. This circumferential groove scheme is shown in Figure 19. Impeller tip backface pressure was measured by two 0.062-in.-diameter tubes installed 180 deg apart in the impeller tip backface cavity.
Instrumentation was provided to measure wall static pressure on both the hub and the shroud side in the diffuser vaneless space at station 2. These static pressure taps are 0.020 in. in diameter and were made by an electrical discharge machining process to eliminate drilling burrs and to ensure sharp edges at the intersection of the pressure port and the diffuser passage. These taps were located on diffuser pipe centerlines at the diffuser tangency radius.
32
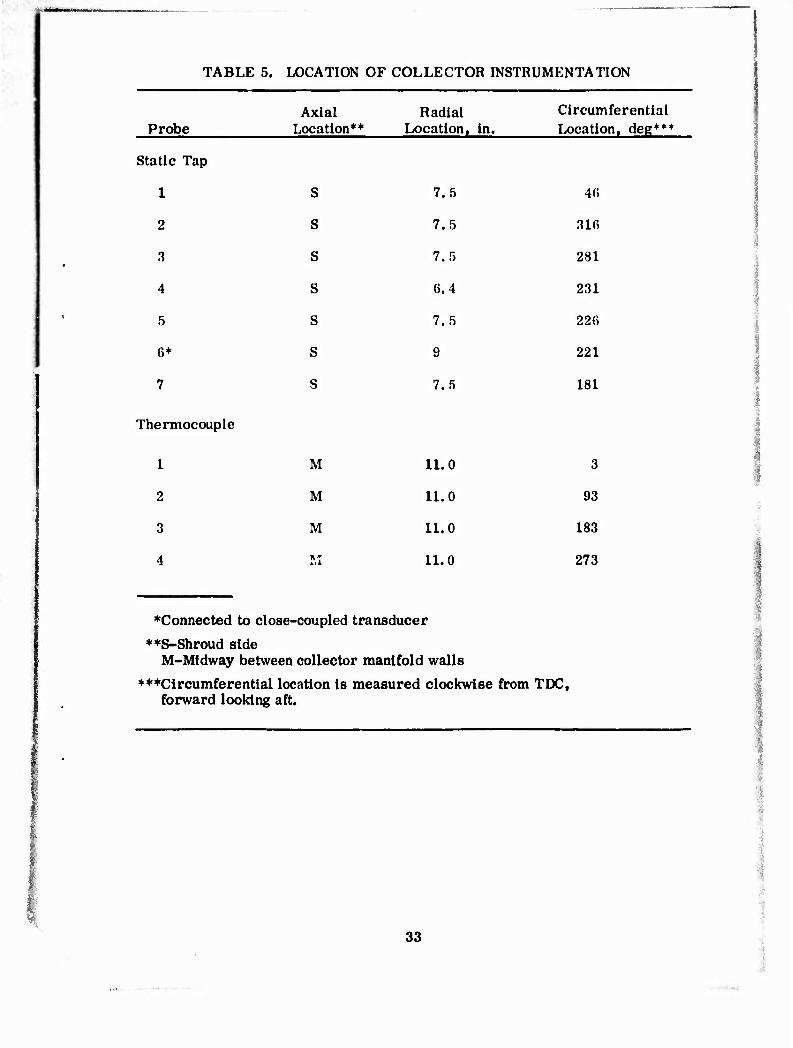
TABLE 5. LOCATION OF COLLECTOR INSTRUMENTATION
Axial Radial Circumferential Probe Location** Location, in. Location, deg***
Static Tap
1 S 7.5 4(5
2 S 7.5 316
3 s 7.5 281
4 s 6.4 231
5 s 7.5 226
6* s 9 221
7 s 7.5 181
Thermocouple
1 M 11.0 3
2 M 11.0 93
3 M 11.0 183
4 M 11.0 273
♦Connected to close-coupled transducer
**S-Shroud side M-Midway between collector manifold walls
♦♦♦Circumferential location is measured clockwise from TDC, forward looking aft.
33
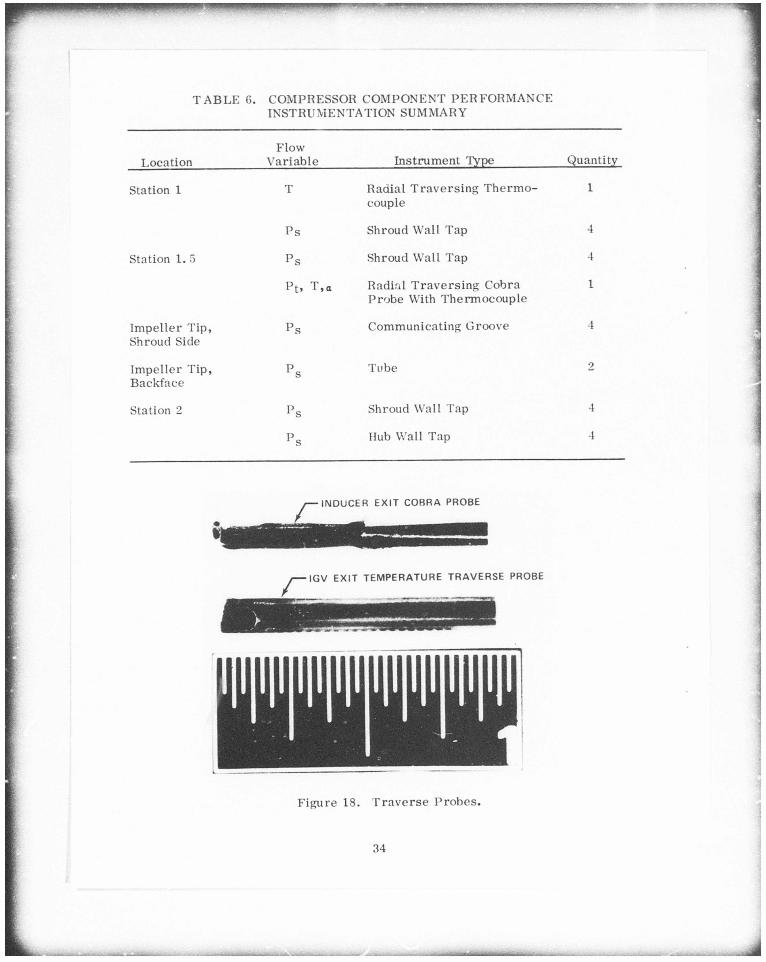
T A B L E 6. COMPRESSOR COMPONENT PERFORMANCE INSTRUMENTATION SUMMARY
Location Flow
Var iab le Ins t rument Type Quantity
Station 1 T Radial T r a v e r s i n g T h e r m o -couple
1
P s Shroud Wall Tap 4
Station 1. 5 P s Shroud Wall Tap 4
P t . T , a Radial T r a v e r s i n g Cobra P robe With Thermocouple
1
Impe l le r Tip , Shroud Side
P s Communicat ing Groove 4
Impel le r Tip, Backface
P s Tube 2
Station 2 P s Shroud Wall Tap 4
P S Hub Wall Tap 4
y — I N D U C E R EXIT COBRA PROBE
^—IGV EXIT TEMPERATURE TRAVERSE PROBE
Figure 18. T r a v e r s e P r o b e s .

1- x^ffl^mypw tfl m ^
FOUR PORTS EQUALLY SPACED
I I 0.022-in.-WIDE STATIC PRESSURE COMMUNICATING GROOVE
Figure 19. Impeller Tip Static Pressure Passage.
SPECIAL INSTRUMENTATION
Total pressure in the plenum and static pressure in the collector manifold were measured with close-coupled transducers to achieve the fast response required to define overall performance as the compressor surged.
DATA READOUT AND RECORDING SYSTEM
All compressor rig data were recorded with an automatic digital magnetic tape reorder. Information needed for safe operation of the rig and for setting data points was displayed in the control room. Control room data readouts included rotor speed, rig vibration levels, bearing temperatures, oil pressure, inlet orifice differential pressure, impeller thrust balance pressure, rig inlet pressure, and rig discharge pressure. When cobra probe data were being obtained, the total pressure measured by the cobra probe was displayed on an X-Y plotter located adjacent to the traverse actuator controls. This allowed changing the speed or stopping the cobra probe actuator to allow the probe to respond to changes in the airflow angle.
35
SECTION V
PROCEDURES
TEST PROCEDURES
A checkout test was conducted to: (1) verify satisfactory compressor rig mechanical operation, (2) check the Instrumentation and the data acquisition system, ar ' (3) provide preliminary overall performance information.
The compressor rig operated satisfactorily over its entire range of opera- tion. During the checkout test, bearing vibrations and temperatures, bearing oil flow pressure, rotor thrust balance preusure, and rotor clearances were monitored, and no problems were observed. The Instrumentation and data acquisition system operated properly during the checkout test. Minor Instrumenta- tion changes were made prior to performance data acquisition.
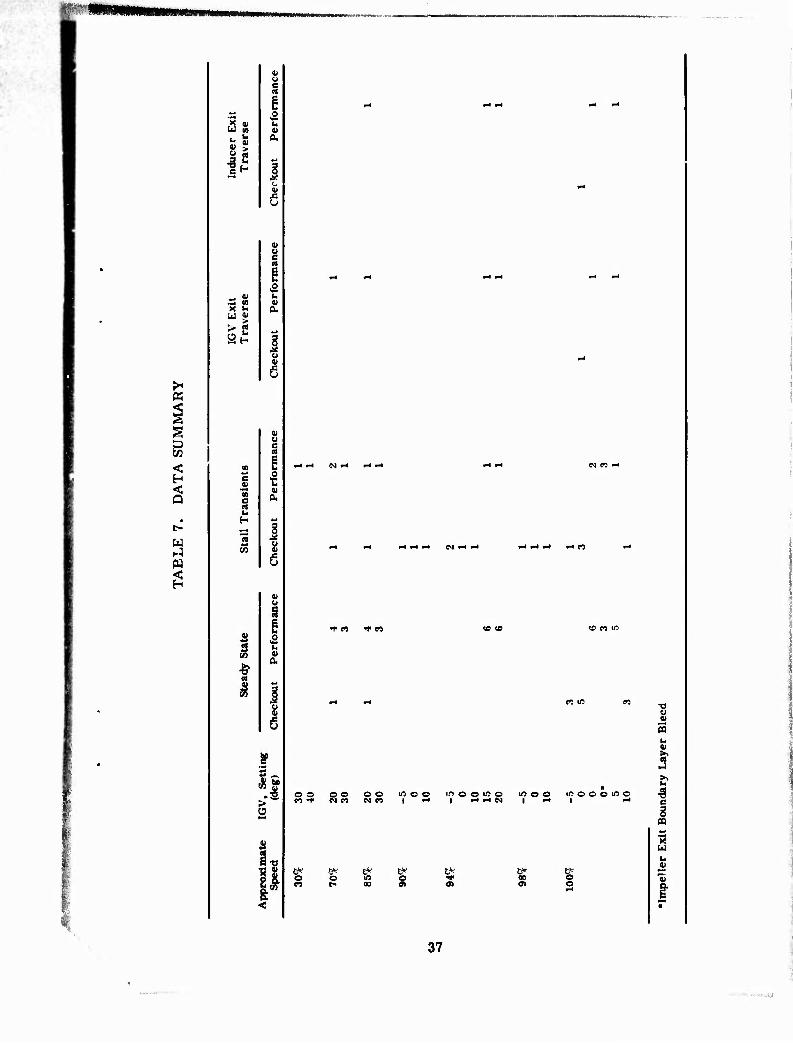
Preliminary overall performance was obtained at 70% speed, 85% speed, and a matrix of speed and IGV settings from 90% to 100% speed and -5 deg to 10 deg IGV settings. This matrix of data enabled the choosing of speeds and IGV settings required to obtain optimum 10:1 and 8:1 pressure ratio speed lines. A summary of the data points acquired In the checkout and performance tests Is given In Table 7.
Performance tests were conducted to obtain overall compressor and com- ponent Inducer performance. Overall compressor performance was defined by speed-line stall transients and by steady-state points at near-stall, wide-open discharge, and several intermediate points. Slow-stall transients were flrst performed by recording data at a rate of 1 scan/sec while closing the compressor discharge valve from Its wide-open position (thus Increasing backpressure) until the rig surged. During the transient, adjustments to the turbine Inlet control valves were made to hold the rotor rpm constant. A near-stall point was then set, based on the collector static pressure, and the compressor was again operated into stall while recording data at 10 scans/sec. Steady-state data points were distributed along a speed line based on the collector static pressure range recorded during the first slow^stall transient. A steady-state point consisted of cycling the pressure scanning units twice at a rate of 2 ports/sec, followed by the recording of the rest of the rig instrumentation for 10 sec at a rate of 10 scans/sec. Inlet guide vane temperature traverse data were obtained at near-stall points for four different speeds.
Induuer component performance data were obtained by radially traversing an air angle, total pressure, and total temperature probe behind the inducer. These traverses were performed by running the probe into its limit and then recording data while slowly retracting the probe out of the flow path. The data recording rate for all traverses was 1 scan/sec. Total pressure vs radial travel data were monitored in the control room on an X-Y plotter, and the traverse rate was governed, as required, to obtain good profile definition.
36
"MWJWiwmtai
2 4)
41 H
9 >
1^
•- <B X >- W 9
an
<
2
w
e a
a
CO
3 w
t
r-* ~* (N ^t
*f w ^* w
OS o o oo moo in o o «5 o m o o mooomo
r* V r^ o o U5 m r- 00
s s
•o
2 t •3 c
« 3 u «
■«>
37
DATA REDUCTION PROCEDURES
Overall Performance
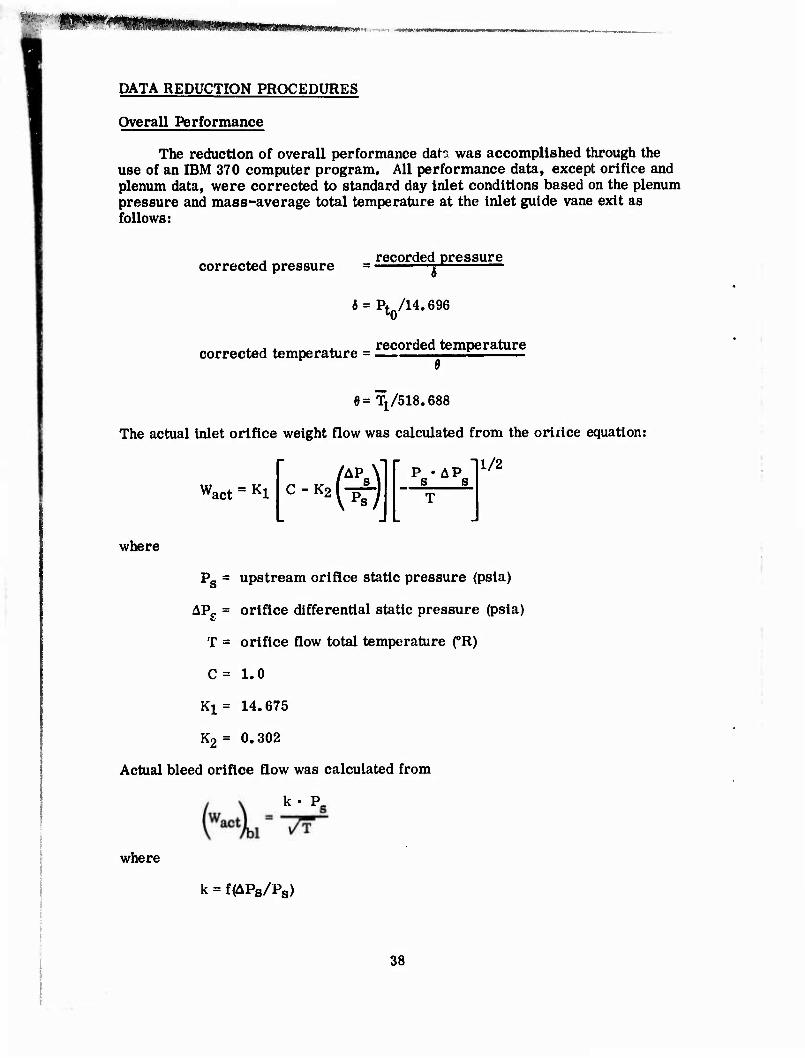
The reduction of overall performance date was accomplished through the use of an IBM 370 computer program. All performance data, except orifice and plenum data, were corrected to standard day inlet conditions based on the plenum pressure and mass-average total temperature at the inlet guide vane exit as follows:
. . recorded pressure corrected pressure = r*
6 = Pt0/14.696
. , . . recorded temperature corrected temperature = s-
e= ^/sis.ess
The actual inlet orifice weight flow was calculated from the oriiice equation:
1/2
Wact = Kl C-K2(% )
P • AP s s
where
Ps = upstream orifice static pressure (psia)
APg = orifice differential static pressure (psia)
T = orifice flow total temperature fR)
C= 1.0
K1= 14.675
Kg = 0.302
Actual bleed orifice flow was calculated from
k • P.
where
k = f(APs/Ps)
38
■ ■^v.^,,v'«'^,v--.y.c*^^ .mtmoiimmrm^
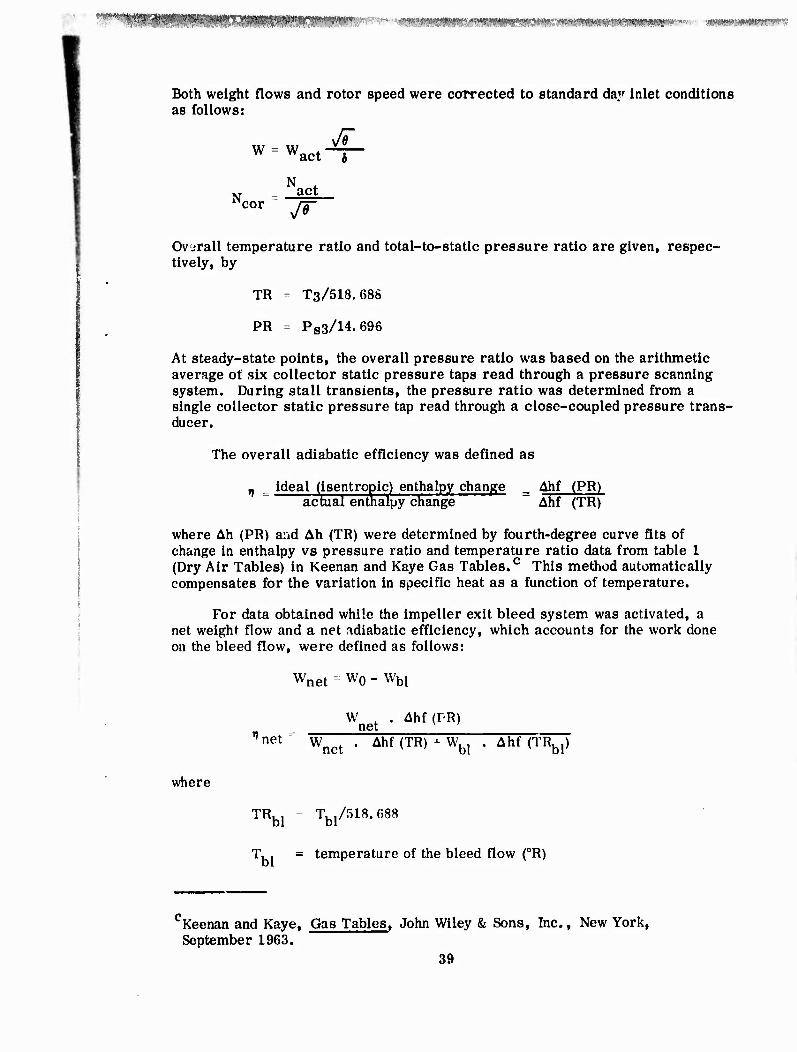
Both weight flows and rotor speed were coirected to standard day Inlet conditions as follows:
W^act-V
M _ act
Overall temperature ratio and total-to-static pressure ratio are given, respec- tively, by
TR - T3/518.688
PR = PS3/14.696
At steady-state points, the overall pressure ratio was based on the arithmetic average ot six collector static pressure taps read through a pressure scanning system. During stall transients, the pressure ratio was determined from a single collector static pressure tap read through a close-coupled pressure trans- ducer.
The overall adiabatic efficiency was defined as
_ _ ideal (isentropic) enthalpy change _ Ahf (PR) actual entnalpy change ~~" " Ahf (TR)
where Ah (PR) aiid Ah (TR) were determined by fourth-degree curve fits of change in enthalpy vs pressure ratio and temperature ratio data from table 1 (Dry Air Tables) in Keenan and Kaye Gas Tables.0 This method automatically compensates for the variation in specific heat as a function of temperature.
For data obtained while the impeller exit bleed system was activated, a net weight flow and a net adiabatic efficiency, which accounts for the work done on the bleed flow, were defined as follows:
Wnet = Wo - Wbl
Wnet . Ahf (PR) Wnet ' Ahf(TR)+Wbl . Ahf (TRbl)
where
TRbl T../518.688
T,. = temperature of the bleed flow (0R)
cKeenan and Kaye, Gas Tables, John Wiley & Sons, Inc., New York, September 1963.
39
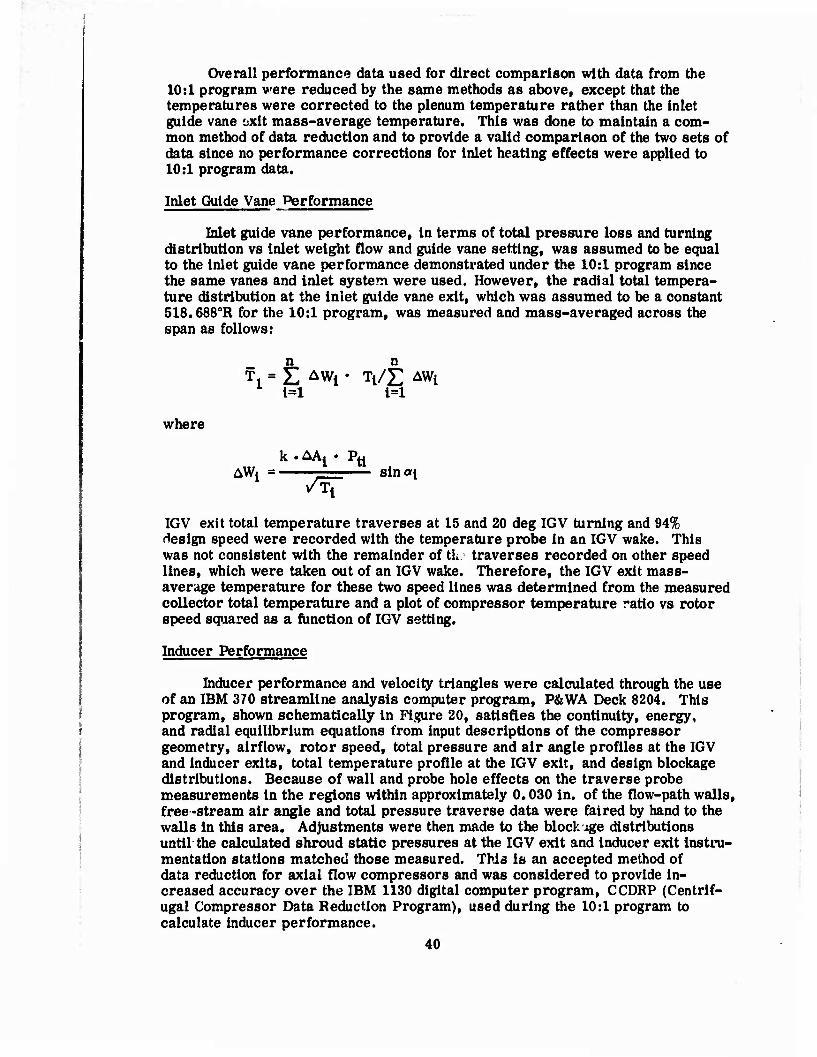
Overall performance data used for direct comparison with data from the 10:1 program were reduced by the same methods as above, except that the temperatures were corrected to the plenum temperature rather than the inlet guide vane oxit mass-average temperature. This was done to maintain a com- mon method of data reduction and to provide a valid comparison of the two sets of data since no performance corrections for inlet heating effects were applied to 10:1 program data.
Inlet Guide Vane Performance
Inlet guide vane performance, in terms of total pressure loss and turning distribution vs Inlet weight flow and guide vane setting, was assumed to be equal to the inlet guide vane performance demonstrated under the 10:1 program since the same vanes and inlet system were used. However, the radial total tempera- ture distribution at the inlet guide vane exit, which was assumed to be a constant 518.6880R for the 10:1 program, was measured and mass-averaged across the span as follows:
n
1=1 1=1
where
^Wi = k .AA i* ^ti
/rj" sin»!
IGV exit total temperature traverses at 15 and 20 deg IGV turning and 94% design speed were recorded with the temperature probe in an IGV wake. This was not consistent with the remainder of tL traverses recorded on other speed lines, which were taken out of an IGV wake. Therefore, the IGV exit mass- average temperature for these two speed lines was determined from the measured collector total temperature and a plot of compressor temperature ratio vs rotor speed squared as a function of IGV setting.
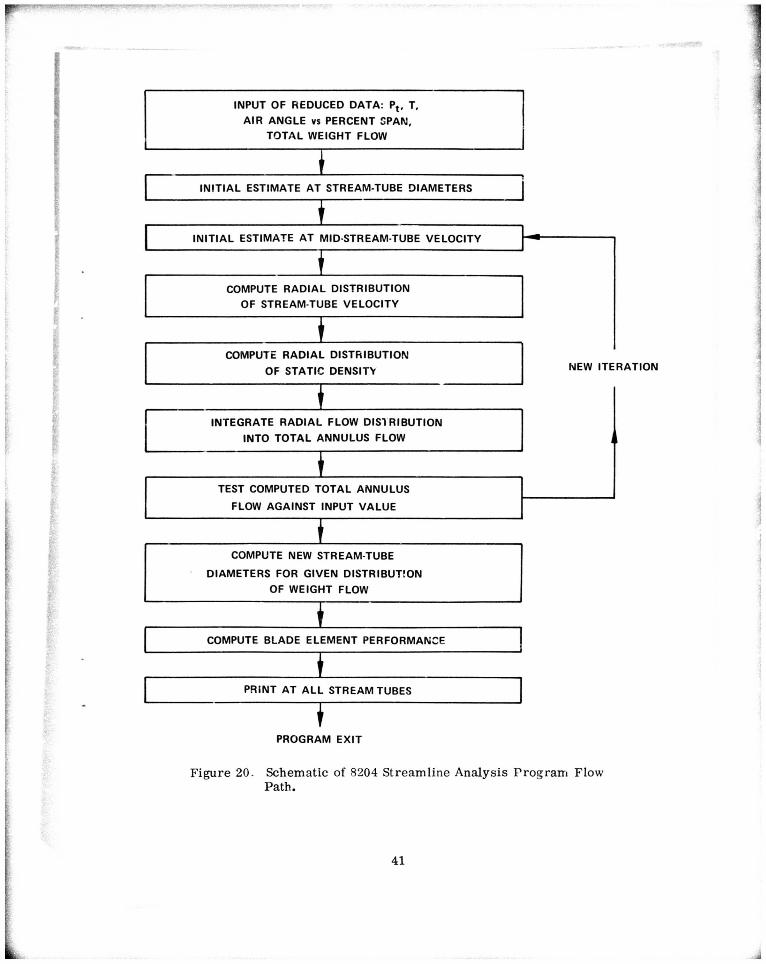
Inducer Performance
Inducer performance and velocity triangles were calculated through the use of an IBM 370 streamline analysis computer program, P&WA Deck 8204. This program, shown schematically in Figure 20, satisfies the continuity, energy, and radial equilibrium equations from input descriptions of the compressor geometry, airflow, rotor speed, total pressure and air angle profiles at the IGV and inducer exits, total temperature profile at the IGV exit, and design blockage distributions. Because of wall and probe hole effects on the traverse probe measurements in the regions within approximately 0.030 in. of the flow-path walls, free «stream air angle and total pressure traverse data were faired by hand to the walls in this area. Adjustments were then made to the block ige distributions until the calculated shroud static pressures at the IGV exit and inducer exit instru- mentation stations matched those measured. This is an accepted method of data reduction for axial flow compressors and was considered to provide in- creased accuracy over the IBM 1130 digital computer program, CCDRP (Centrif- ugal Compressor Data Reduction Program), used during the 10:1 program to calculate inducer performance.
40
NEW ITERATION
COMPUTE BLADE ELEMENT PERFORMANCE
PRINT AT ALL STREAM TUBES
INITIAL ESTIMATE AT MIDSTREAM-TUBE VELOCITY
INITIAL ESTIMATE AT STREAM-TUBE DIAMETERS
TEST COMPUTED TOTAL ANNULUS FLOW AGAINST INPUT VALUE
COMPUTE RADIAL DISTRIBUTION OF STATIC DENSITY
INTEGRATE RADIAL FLOW DISTRIBUTION INTO TOTAL ANNULUS FLOW
COMPUTE RADIAL DISTRIBUTION OF STREAM-TUBE VELOCITY
COMPUTE NEW STREAM-TUBE
DIAMETERS FOR GIVEN DISTRIBUT!ON OF WEIGHT FLOW
INPUT OF REDUCED DATA: P t , T, AIR ANGLE vs PERCENT SPAN,
TOTAL WEIGHT FLOW
PROGRAM EXIT
Figure 20. Schematic of 8204 Streamline Analysis Program Flow Path.
41
vWtfWliW*,VW rmstpn'xv'Vt**
Again, as was done for overall performance data, inducer performance data to be used for comparison with data obtained during the 10:1 program were reduced by the same methods to provide a valid comparison. Total pres- sure, total temperature, air angle, and radial travel data from each inducer traverse were input into the CCDRP IBM 1130 program. A linear approxima- tion of the static pressure distribution calculated by the streamline analyses program was used.
The ratio of specific heats (>) was determined from a curve fit of y vs static temperature (Ts) data and involved an iteration on the value of T8 to satisfy the following at each percentage of span:
7
Pt/Ps W -' The absolute Mach number (M) was calculated from the relationship
M =
1/2
The local speed of sound was calculated by
1/2 fGRTs) Total temperature measurements were corrected for Mach number effects by dividing the recorded temperatures by a probe recovery factor. The recovery factor used in the calculations was based on the actual probe recovery factor vs Mach number calibration data. Total pressure and total temperature were then mass-averaged across the span.
The sum of the incremental weight flows from the mass-averaging routine was checked against the corresponding inlet orifice How, and an iteration was performed on the air angle values until the two fiow calculations agreed. Final mass-average total pressure (Ptl. 5) an^ total temperature (Tl.s) values were then calculated, based on the adjusted air angle profile. Inducer pressure ratio and temperature ratio were calculated as follows:
PR (1-1.5) ^1. 5' tl
TR (1-1. 5) T. -/518.688 1. r>
Inducer efficiency was calculated by the same methods as the overall efficiency and is given by
ind Ahf (TR1_1 5)
42

^.ip^MpNp^^^ mmmmrnmmmrmrm: ■»0«.
'
From M, a, and a, the components of the velocity triangles, as defined below, at each percentage of span were then calculated.
Impeller Incidence (i) was determined at each percentage of span by
where ß* is the impeller leading-edge metal angle at the corresponding percentage of span.
Rotor Performance
Combined inducer-impeller performance was determined through the use of an internal flow analysis computer program, which involves the solution of the equations of continuity and momentum. Input for the analysis consisted of overall static pressure ratio and total temperature ratio, rotor speed, mass flow, impeller exit static pressure, configuration geometry, flow factors at the leading edge of the inlet guide vanes and impeller exit, and a calculated tempera- ture rise due to shroud friction, based on. rotor speed, density, surface area, and friction coefficient for bladed disks.
43
SECTION VI
VALIDATION OF TEST DATA
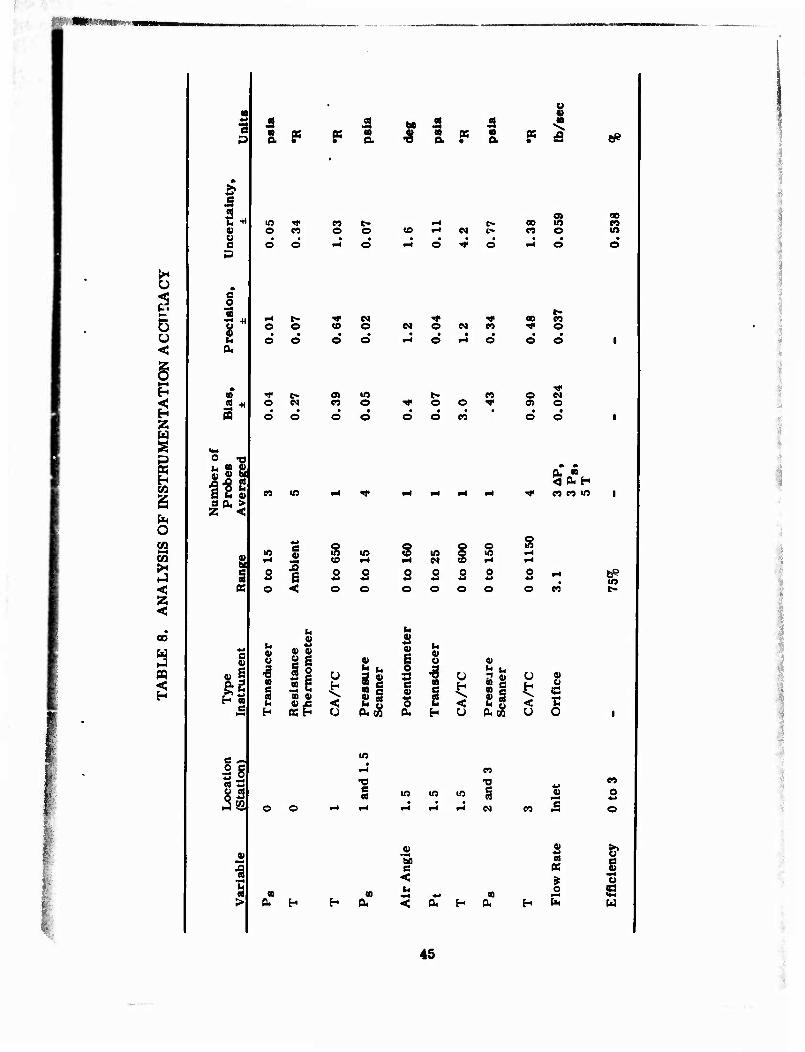
Estimates of the uncertainty of the data acquired from the test rig are presented in Table 8. These estimates include the uncertainty of both the sensor and the recording device. Uncertainty of air angle assumes no alignment error. Both bias (constant error) and precision errors (precision errors are two standard deviations from the mean) were used to determine the potential un- certainty, and are presented in Table 8. When multiple probes were available for redundant measurement, the precision error was calculated by statistically averaging individual measurements, as illustrated below.
e u = c*r where
u = overall uncertainty of flow variable
e = uncertainty of individual sensor
n s number of sensors recording the same flow variable
Table 8 also includes the effect of the data uncertainty on the uncertainty of the overall efficiency performance calculation. This performance uncertainty estimate was calculated by the method of partial derivatives for error analysis of a complex function. The uncertainty of the efficiency value at the design point was 0.54 percentage point.
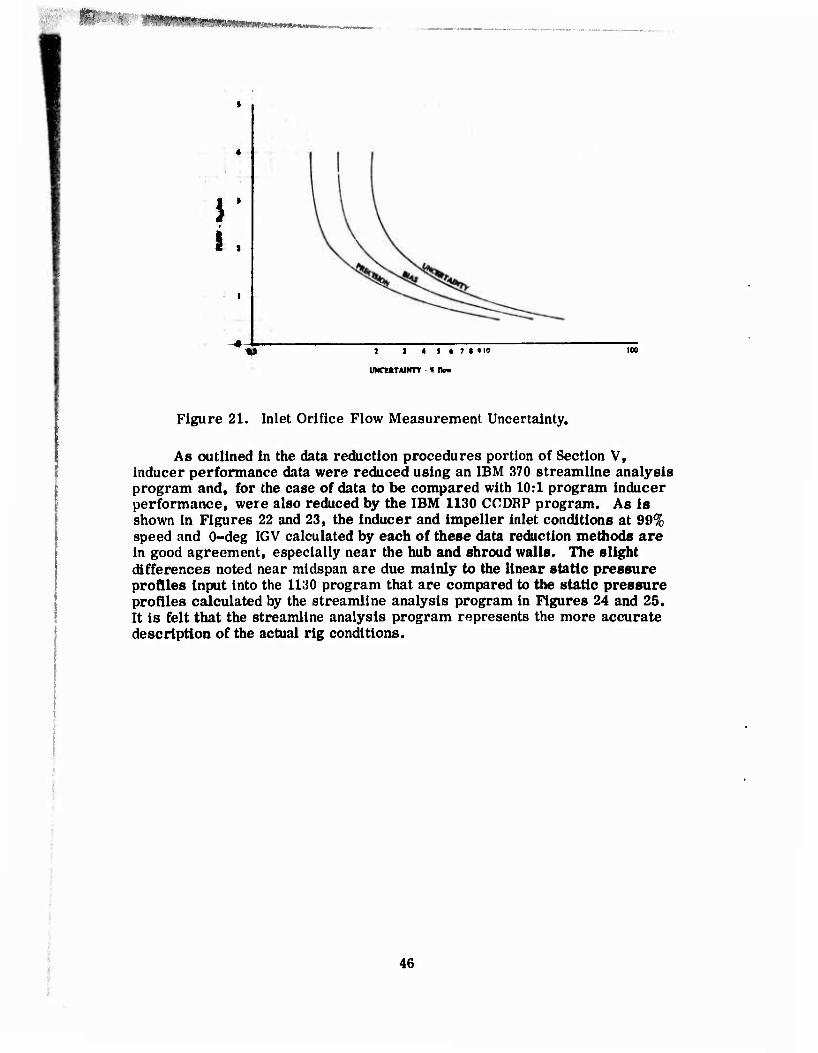
An estimate of the uncertainty of the inlet orifice flow measurement is shown in Figure 21 as a function of inlet orifice flow rate and was ±1.84% at design flow. The uncertainty of the Impeller exit bleed flow measurement is estimated to be approximately 4.0% of the measured flow rate.
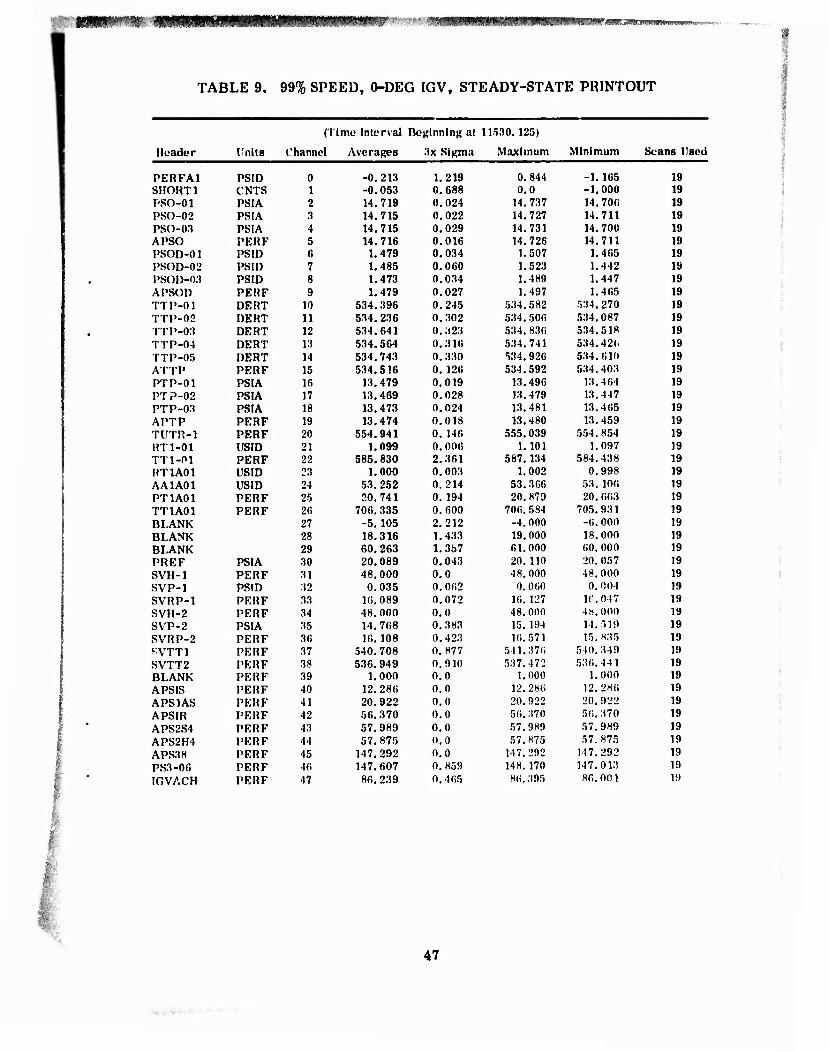
At each steady-state point, approximately 20 scans of data recorded over a 2-sec interval were averaged. A typical printout from a near-stall, steady- state point at 99% design speed and 0-deg inlet guide vane setting is shown in Table 9. A 2-sec average value, the maximum and the minimum values recorded, and a 3-sigma value (three standard deviations from the mean) are also listed for each instrumentation. These provide a measure of the actual scatter in the data due both to the uncertainty in measurement and to slight speed and flow variations that may have occurred while recording the steady state.
44
s
5 W
P K H CO
O en •—i
a <
00
W
m
f. v o e 3
e o
eu
n
a gg a
Ml * SB «4
•s ex • a a
I F a
o C5 o o 00 in
o 00 eo to
o o
o CO CM o M o
00 « o
fc, «0 4»
S i M
IIS S d, > Z <
e « »I
o 0> es o
d o o
CO
o
n m
■<i«
O
Qu CO
3 & H es « in
5 o
u
e CD u H
e v
I <
u
|S
s CO
2 o
u H <
m
2 o
V ^ u
a. w
T3 C es
s m o m
2 0 0 0 4* j» a
o o o o
8 1-1
o « in
2
i c o 0.
c 2
u
< u
0) Si *-
CUM
u
<
o
o
in in in
to
0) -^ be e
n ? 4-k
ä ü N es £
2 « »
CO (X
I
CO
o
& e 2 o S w
45
I
r ! .
: I 4 > * 7 • «10
UMCEKTAINTY • 1 llo»
Figure 21. Inlet Orifice Flow Measurement Uncertainty.
As outlined in the data reduction procedures portion of Section V, inducer performance data were reduced using an IBM 370 streamline analysis program and, for the case of data to be compared with 10:1 program inducer performance, were also reduced by the IBM 1130 CCDRP program. As is shown in Figures 22 and 23, the inducer and impeller inlet conditions at 99% speed and 0-deg IGV calculated by each of these data reduction methods are in good agreement, especially near the hub and shroud walls. The slight differences noted near midspan are due mainly to the linear static pressure profiles Input into the 1130 program that are compared to the static pressure profiles calculated by the streamline analysis program in Figures 24 and 25. It is felt that the streamline analysis program represents the more accurate description of the actual rig conditions.
46
mmj-' "^ ^^f^^m^im^^ ^^p^RWRWWf?^^
TABLE 9. 99% SPEED, O-DEG IGV, STEADY-STATE PRINTOUT
Header Vnlts
(Time Interval Benlnnlnt? at 115.10. 125)
Channel Averages 3x Sigma
PERFA1 PSID 0 SHORT1 CNTS 1 T'SO-01 PSIA 2 PSO-02 PSIA 3 PSO-03 PSIA 4 APSO PERF 5 PSOD-01 PSID 6 PSOD-02 PSID 7 psou-o:» PSID 8 APSOD PERF 9 TTP-01 DERT 10 TTP-02 DERT 11 TTP-03 DERT 12 TTP-04 DERT 13 TTP-05 DERT 14 ATTP PERF 15 PTP-01 PSIA 10 PT P-02 PSIA 17 PTP-O;I PSIA 18 APTP PERF 19 TUTR-1 PERF 20 RT1-01 USID 21 TT1-01 PERF 22 RT1A01 USID 23 AA1A01 USID 24 PT1A01 PERF 25 TT1A01 PERF 26 BLANK 27 BLANK 28 BLANK 29 PREF PSIA 30 SVH-1 PERF 31 SVP-1 PSID 32 SVRP-1 PERF 33 SVH-2 PERF 34 SVP-2 PSIA 35 SVRP-2 PERF 36 KVTT1 PERF 37 SVTT2 PERF 38 BLANK PERF 39 APSIS PERF 40 APS IAS PERF 41 APSIR PERF 42 APS2S4 PERF 43 APS2H4 PERF 44 APS38 PERF 45 PS3-06 PERF 4f. IGVACH PERF 47
-0.213 1.219 -0.053 0.688 14.719 0.024 14.715 0.022 14.715 0.029 14.716 0.016 1,479 0.034 1.485 0.060 1.473 0.034 1.479 0.027
534.396 0.245 534.236 0.302 534.641 0.;423 534.564 0.316 534.743 0.330 534.516 0. 126
13.479 0.019 13.469 0.028 13,473 0.024 13.474 0.018
554.941 0. 146 1.099 0. 006
585.830 2.361 1.000 0.003
53.252 0.214 20.741 0.194
706. 335 0. 600 -5. 105 2.212 18.316 1.433 60. 263 1.357 20.089 0.043 48.000 0.0 0.035 0.062
l(i.089 0.072 48.000 0.0 14.768 0.383 16.108 0.423
540.708 0.877 53G. 949 0.910
1.000 0.0 12.286 0.0 20.922 0.0 56.370 0.0 57.989 0.0 57. 875 0.0
147.292 0.0 147.607 0. 859 86. 239 0.465
laxlmum Minimum Scans Used
0.844 -1. 165 19 0.0 -1.000 19
14,737 14.706 19 14.727 14.711 19 14.731 14.700 19 14.726 14.711 19 1.507 1. 465 19 1.523 1.442 1» 1.489 1.447 19 1.497 1.465 19
534.582 534.270 19 534.506 534.087 19 534.836 534.518 19 534.741 534. 42(. 19 5;!4.926 534.610 19 534.592 534.403 19
13,496 13.464 19 13, 479 13.447 19 13,481 13.465 19 13,480 13.459 19
555,039 554.854 19 1,101 1.097 19
587,134 584.438 19 1.002 0.998 19
53.366 53.106 19 20.879 20.663 19
706.584 705.931 19 -4.000 -6.000 19 19.000 18.000 19 61.000 60. 000 19 20.110 20.057 19 48.000 48.000 19 0.060 0. 004 19
16. 127 1('.047 19 48.000 48.000 19 15. 194 14.519 19 16.571 15. 835 19
541.376 540.349 19 537.472 536.441 19
1.000 1.000 19 12. 286 12.286 19 20 922 20.922 19 56, 370 56.370 19 57,989 57.989 19 57,875 57.875 19
147.292 147.292 19 148. 170 147,013 19 86.395 86.001 1»
47
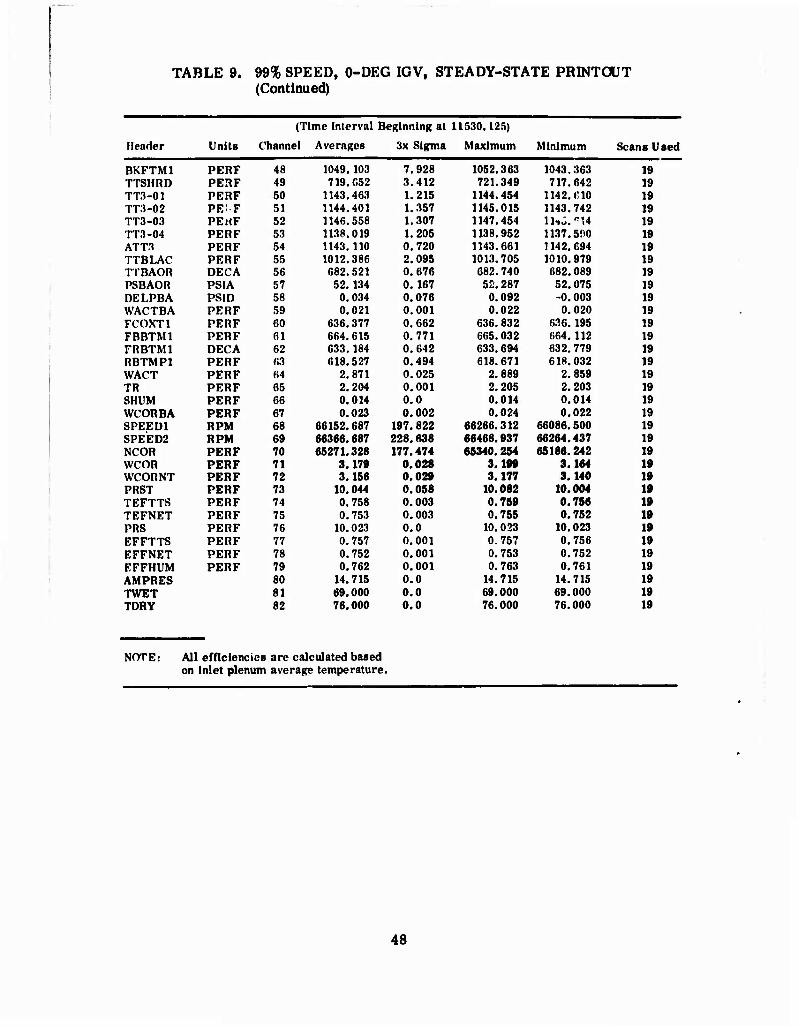
TABLE 9. 99% SPEED, O-DEG IGV, STEADY-STATE PRINTOUT (Continued)
(Time Interval Beginning at 11330.125)
Header Units Channel Averages 3x Sigma Maximum Minimum Scans Used
BKFTM1 PERF 48 1049.103 7.928 1052.363 1043.363 19 TTSHRD PERF 49 719.052 3.412 721.349 717.642 19 TT3-01 PERF 50 1143.463 1.215 1144.454 1142.610 19 TT3-02 PE: F 51 1144.401 1.357 1145.015 1143.742 19 TT3-03 PErtF 52 1146.558 1.307 1147.454 lltJ^U 19 TT3-04 PERF 53 1138.019 1.205 1138.952 1137.5!)0 19 ATT1 PERF 54 1143. 110 0.720 1143.661 1142. 694 19 TTBLAC PERF 55 1012.386 2.095 1013.705 1010.979 19 TTBAOR DECA 56 682.521 0.676 682. 740 682.089 19 PSBAOR PSIA 57 52. 134 0.167 52.287 52. 075 19 DELPBA PSID 58 0.034 0.076 0.092 -0.003 19 WACTBA PERF 59 0.021 0.001 0.022 0.020 19 FCOXT1 PERF 60 636.377 0.662 636. 832 636. 195 19 FBBTM1 PERF 61 664.615 0.771 665. 032 664. 112 19 FRBTM1 DECA 62 633. 184 0.642 633. 694 632. 779 19 RBTMP1 PERF 63 618.527 0.494 618.671 618.032 19 WACT PERF 64 2.871 0.025 2.889 2.859 19 TR PERF 65 2.204 0.001 2.205 2.203 19 SHUM PERF 66 0.014 0.0 0.014 0.014 19 WCORBA PERF 67 0.023 0.002 0.024 0.022 19 SPEED1 RPM 68 66152.687 197. 822 66266.312 66086.500 19 SPEED2 RPM 69 66366.687 228.638 66468.937 66264.437 19 NCOR PERF 70 65271.328 177.474 65340.254 65186.242 19 WCOR PERF 71 3.17» 0.028 3.199 3.164 19 WCORNT PERF 72 3.156 0.029 3,177 3.140 19 PRST PERF 73 10.044 0.058 10.082 10.004 19 TEFTTS PERF 74 0.758 0.003 0.759 0.756 19 TEFNET PERF 75 0.753 0.003 0.755 0.752 19 PRS PERF 76 10.023 0.0 10.023 10.023 19 EFFTTS PERF 77 0.757 0.001 0.757 0.756 19 EFFNET PERF 78 0.752 0.001 0.753 0.752 19 EFFHUM PERF 79 0.762 0.001 0.763 0.761 19 AMPRES 80 14.715 0.0 14.715 14.715 19 TWET 81 69.000 0.0 69.000 69.000 19 TORY 82 76.000 0.0 76.000 76.000 19
NOTE: All efftclenc es are calculated based on Inlet plenum average temperature
48
□ o
o D O
O
o
©
G Q
a.
o a
oa
— O » «o r- •« »rt - - d d d d d
-ON IUVN aAUvia« laiNi
8«« z <
^ r* O c» ^f ^ «p O X
it- x) o ib - $ S <« CO
a01
| «
si du
5 « Ü c •
^ — bC
Si &
s
0Q o
§
□ o
vj ^ !•) r] ** Q( * 5 «._ M IM «■ *« 90
ON urn« aAunan laiNi
1 1 p n cP 1 0 i
1 s Ü0 1
1 s 0 I
1 f O |
Q O i
1 1 i i
Dat
a
Dau
o i 0 □
#
Iff
S «x
i
f 2 z
c . w
o -o - « S g.
if o U
O •s
c o
« c o
■4-»
'S c O u
K S bo vi 5 Q)
% -Ü "^
top-olo0'ltf ajNaauNi
49
•eSUESewweewewr-*
13.6 j
. M
i » . ; j
13.0
1 !" '--8i i l i b |
2 i:.4
s n : h < \ * 12.0
x - M . b
- 11.6
M . 4 :
P„ Pro f i le «. j U uUtv-U by S i tv i tu l t tu - A n j l y w
P 4 Prof i le I n p u t I n t o I B M 1130 Deck C C D R P
r Measured Sh roud Sia l ic PWMI IV
"•:L 11.0 1 1011
r i p
Figure 24. IGV Exit Static P ressu re Profile at 99% Speed and 0-deg IGV.
2 2
Measured Sh roud Sta t ic . P r rwu re
21
2 0
19
I S
17 P , Prof i le Calcu la ted by Streaml ine
Analy«*»
P , Prof i le Inpu t I Deck C C D R P
I n t o I B M 1130
16
IS
100 8 0 6 0 2 0 4 0
Figure 25. Inducer Exit Static P ressu re Profile at 99% Speed and 0-deg IGV.
50

SECTION VII
R E SU LTS A N I) DIS CT.) SSI ON
OVERALL PKRj^ORMANCE
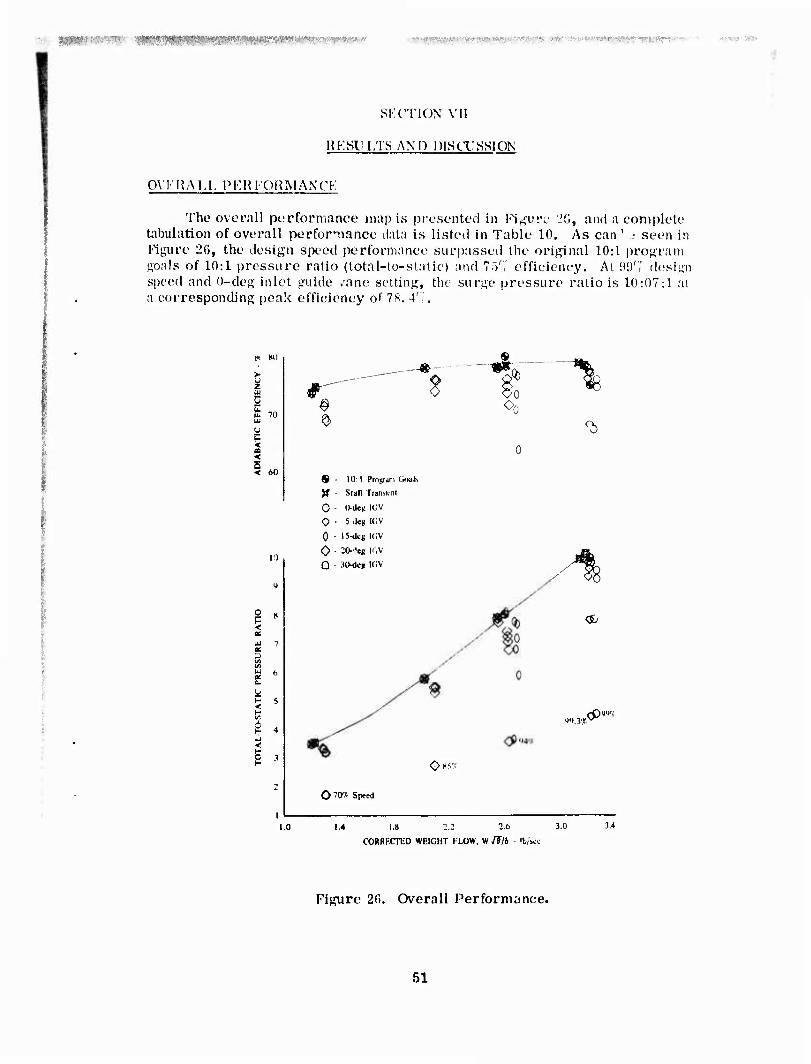
The overall performance map is presented in Figure 2(j, ami a complete tabulation of overall performance data is listet! in Table 10. As can be seen in Figure 26, the design speed performance surpassed the original 10:1 program goals of 10:1 pressure ratio (total-to-static) and 75^,' efficiency. At [)<)'', design speed and 0-deg inlet guide vane setting, the surge pressure ratio is 10:07:1 at a corresponding peak efficiency of 78. 4%.
e* Mil
70
<
60
10
5
P S <
<
■r ^ ^
^ - 10:1 Program (Kjal*.
X - Stall Transient
O - O-iltH ICV
O - S-dcg ICV
0 - 15-dcg 1GV
O - 2tWcg IfiV
O - '.«Meg IGV
Oo VJ
Jty (£>
W.3»
<$m
O 8.W
O 70% Spetd
i.o i.4 I.» :.: 2.o 3.o
CORRECTED WEIGHT FLOW. W /fib b/sct
Figure 26. Overall Performance.
51
e»,* ■ • ■ "^„iT-r-
SECTION VII
MKSULTS ANJ2 DISa.'SSlON
OVKHALL PERTORMANCK
The overall performance map is presented in Figure 'iö, and a complete tabulation of overall performance data is listed in Table 10. As can ' .■ seen in Figure 26, the design speed performance surpassed the original 10:1 program goals of 10:1 pressure ratio (total-to-static) and 7."/,' efficiency. At 99',' design speed and 0-deg inlet guide /ane setting, the surge pressure ratio is 1.0:07:1 at a corresponding peak efficiency o*' 7«. 4',.
z
E 70
y
10
3
< I 3
1.0
--«•-
# ^
ft 8o Oo
« 10:1 I'mgrjm (ioals
X Stall Tramicnl
0 D-deu ICV
O 5 JCK ICV
0 15-dcg i(;v
0 iO-'cg H.V
Ü 3lVdc|i KiV
O7** Speed
0^r:
Cb
/ o
<3b
4'i.3T
1.4 1.8 2.2 2.0 3.0
CORRECTED WEIGHT FLOW, W /F/» Ib/wc
Figure 20. Overall Performance.
51
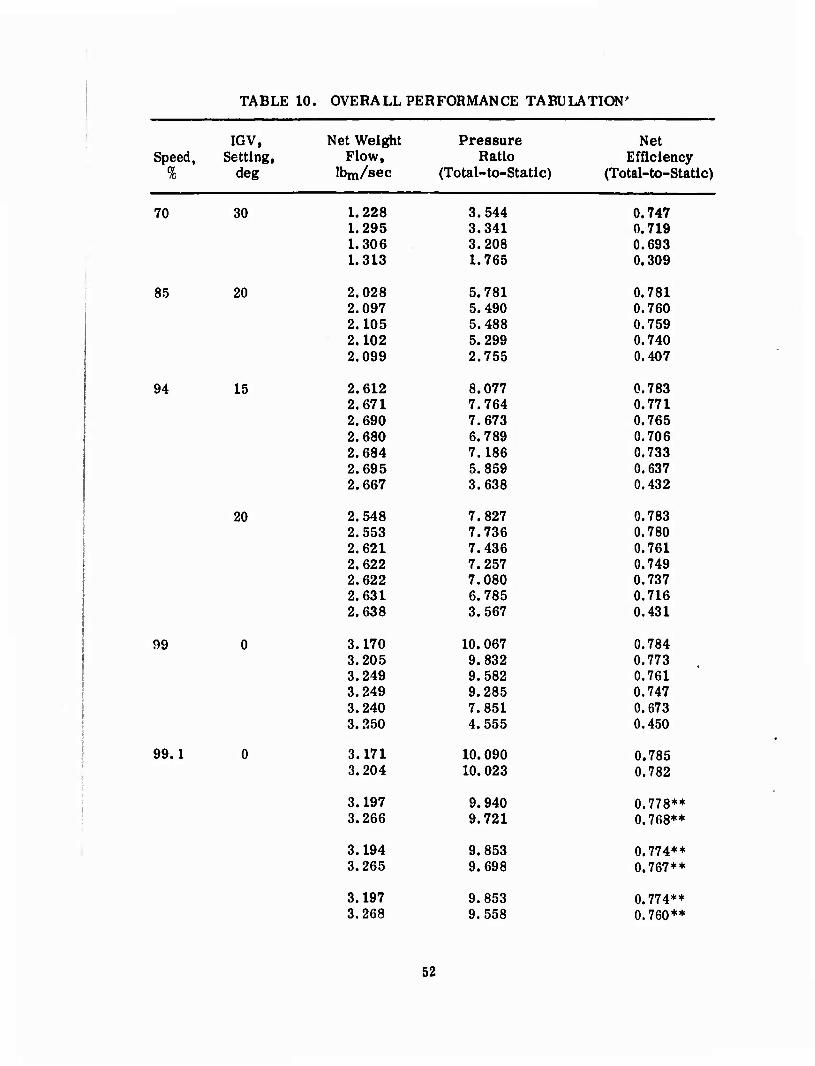
TABLE 10. OVERALL PERFORMANCE TABULATION'
IGV, Net Weight Pressure Net Speed, Setting, Flow, Ratio Efficiency
% deg lbm/sec (Total-to-Static) (Total-to-Static)
70 30 1.228 3.544 0.747 1.295 3.341 0.719 1.306 3.208 0.693 1.313 1.765 0.309
85 20 2.028 5.781 0.781 2.097 5.490 0.760 2.105 5.488 0.759 2.102 5.299 0.740 2.099 2.755 0.407
94 15 2.612 8.077 0.783 2.671 7.764 0.771 2.690 7.673 0.765 2.680 6.789 0.706 2.684 7.186 0.733 2.695 5.859 0.637 2.667 3.638 0.432
20 2.548 7.827 0.783 2.553 7.736 0.780 2.621 7.436 0.761 2.622 7.257 0.749 2.622 7.080 0.737 2.631 6.785 0.716 2.638 3.567 0.431
99 0 3.170 10.067 0.784 3.205 9.832 0.773 3.249 9.582 0.761 3.249 9.285 0.747 3.240 7.851 0.673 3.250 4.555 0.450
99.1 0 3.171 10.090 0.785 3.204 10.023 0.782
3.197 9.940 0.778** 3.266 9.721 0.768**
3.194 9.853 0.774** 3.265 9.698 0.767**
3.197 9.853 0.774** 3.268 9.558 0.760**
52
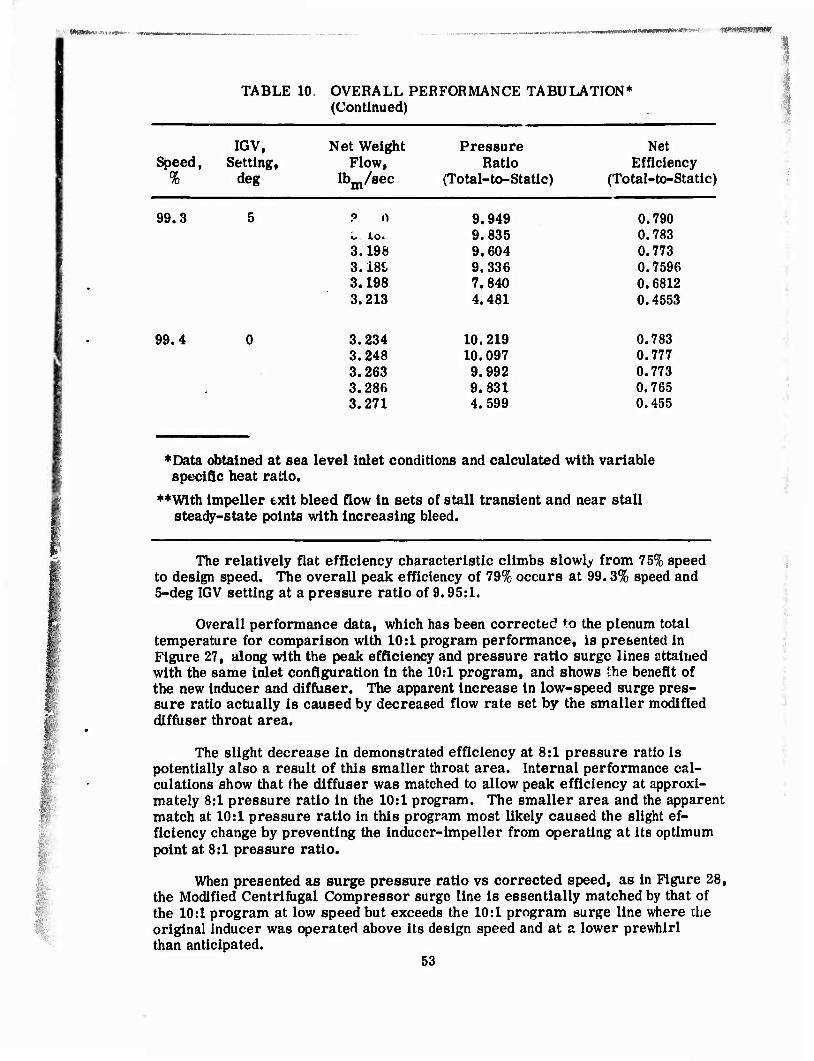
TABLE 10 OVERALL PERFORMANCE TABULATION* (Continued)
IGV, Net Weight Pressure Net Speed, Setting, Flow, Ratio Efficiency
% deg lbm/8ec (Total-to-Static) (Total-to-Static)
99.3 5 ? n 9.949 0.790 o io. 9.835 0.783 3.198 9.604 0.773 3.181 9.336 0.7596 3.198 7.840 0.6812 3.213 4.481 0.4553
99.4 0 3.234 10.219 0.783 3.248 10.097 0.777 3.263 9.992 0.773 3.286 9.831 0.765 3.271 4.599 0.455
'TVf*IVf.!<'-y**f
;■
'"Data obtained at sea level inlet conditions and calculated with variable specific heat ratio.
**With impeller exit bleed flow in sets of stall transient and near stall steady-state points with increasing bleed.
The relatively flat efficiency characteristic climbs slowly from 75% speed to design speed. The overall peak efficiency of 79% occurs at 99.3% speed and 5-deg IGV setting at a pressure ratio of 9.95:1.
Overall performance data, which has been corrected ^o the plenum total temperature for comparison with 10:1 program performance, is presented in Figure 27, along with the peak efficiency and pressure ratio surge lines attained with the same inlet configuration in the 10:1 program, and shows the benefit of the new inducer and diffuser. The apparent increase in low-speed surge pres- sure ratio actually is caused by decreased flow rate set by the smaller modified diffuser throat area.
The slight decrease in demonstrated efficiency at 8:1 pressure ratio is potentially also a result of this smaller throat area. Internal performance cal- culations show that the diffuser was matched to allow peak efficiency at approxi- mately 8:1 pressure ratio in the 10:1 program. The smaller area and the apparent match at 10:1 pressure ratio in this program most likely caused the slight ef- ficiency change by preventing the inducer-impeller from operating at its optimum point at 8:1 pressure ratio.
When presented as surge pressure ratio vs corrected speed, as in Figure 28, the Modified Centrifugal Compressor surge line is essentially matched by that of the 10:1 program at low speed but exceeds the 10:1 program surge line where the original inducer was operated above its design speed and at a lower prewhirl than anticipated.
53

-3rw»!w«»m»»v«»,-WW!«»^^ ■mvm
p
Xx
\ 1 o
s ^\ P i ? >. ' -. -. " *: s: a a ^ V '1 If 1 Ö111
-' ■ o ■ >oa ■'.
1 ^ 1 \
A. J OliVH IMISSIMJ >1LV1S-«)IIV101 (WlllS
T3 C CO
SH
o (/} a> IM a 6 a o
Eu o ^_ u « ^ So
« ^ ^ c ^u m a» -:
iv «a t-4 ^ o • •
3 tn
E <x u M O
0) 0)
00
<?
l<j><S>
H. i ü a a ü
x o Oo<C>a o
S e 8 « ' AJNMIJiH JUVWKly
i
ouvx wntiuiM niviMuiviai
U g I o >-> £ gj W 3
5 ^ O Oi .2 a 2 S af- 6 ^
c cu rt be C b£ C P C —H «-S "a ^ " S
*-> cu
0) — JH ^ ro o
(M
3 bO
54
vm** m VV^vHftKtKi
The 99',' speed and O-de^; prewhirl efficiency was not improved by activating the shroud side impeller exit bleed. Pressure ratio fell off as the bleed was increased, indicating that overall performance suffered as additional flow through the inducer caused losses to increase as if the inducer were operating at a "choked" incidence.
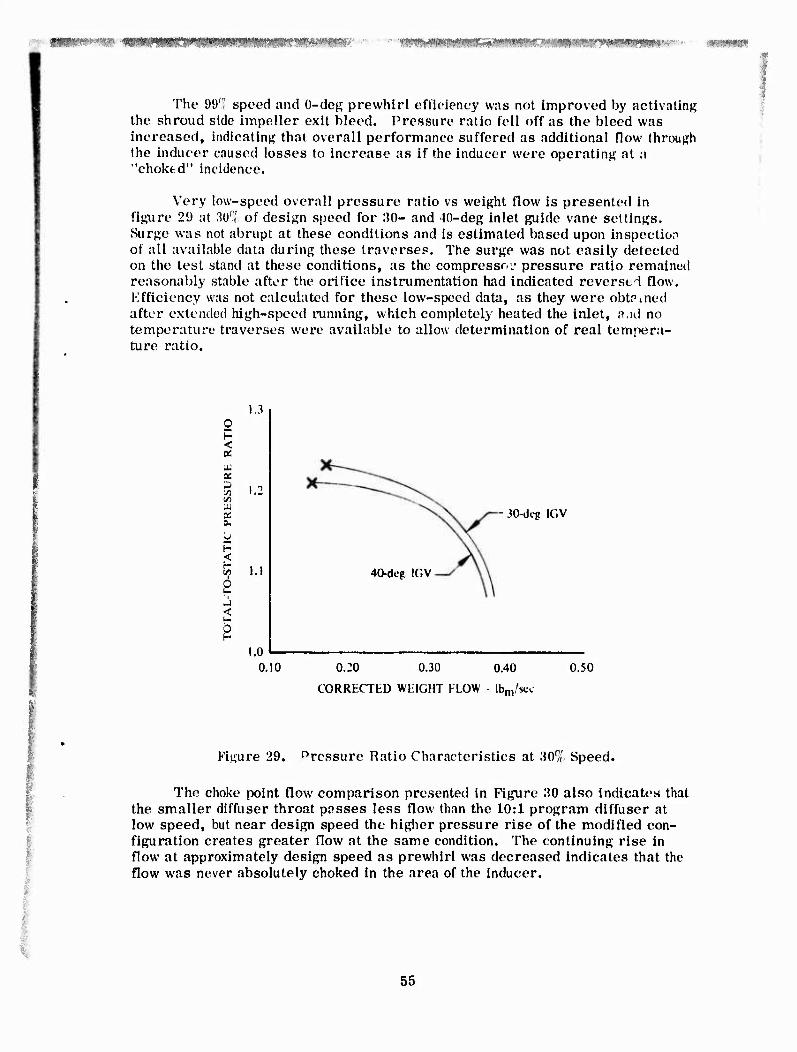
Very low-speed overall pressure ratio vs weight flow is presented in figure 29 at 30% of design speed for 30- and 40-deg inlet guide vane settings. Surge was not abrupt at these conditions and is estimated based upon inspection of all available data during these traverses. The surge was not easily detected on the test stand at these conditions, as the compressr..1 pressure ratio remained reasonably stable after the orifice instrumentation had indicated reversed flow, efficiency was not calculated for these low-speed data, as they were obtained after extended high-speed running, which completely heated the inlet, n.id no temperature traverses were available to allow determination of real tempera- ture ratio.
1.3
<
■M X
C/5 u a.
< H 6 H
< o
1.1
30-dcg IGV
40-deg !GV
1.0 0.10 0.20 0.30 0.40
CORRECTED WLiGHT FLOW - \bmfxc
0.50
Figure 29. "rcssure Ratio Characteristics at 30% Speed.
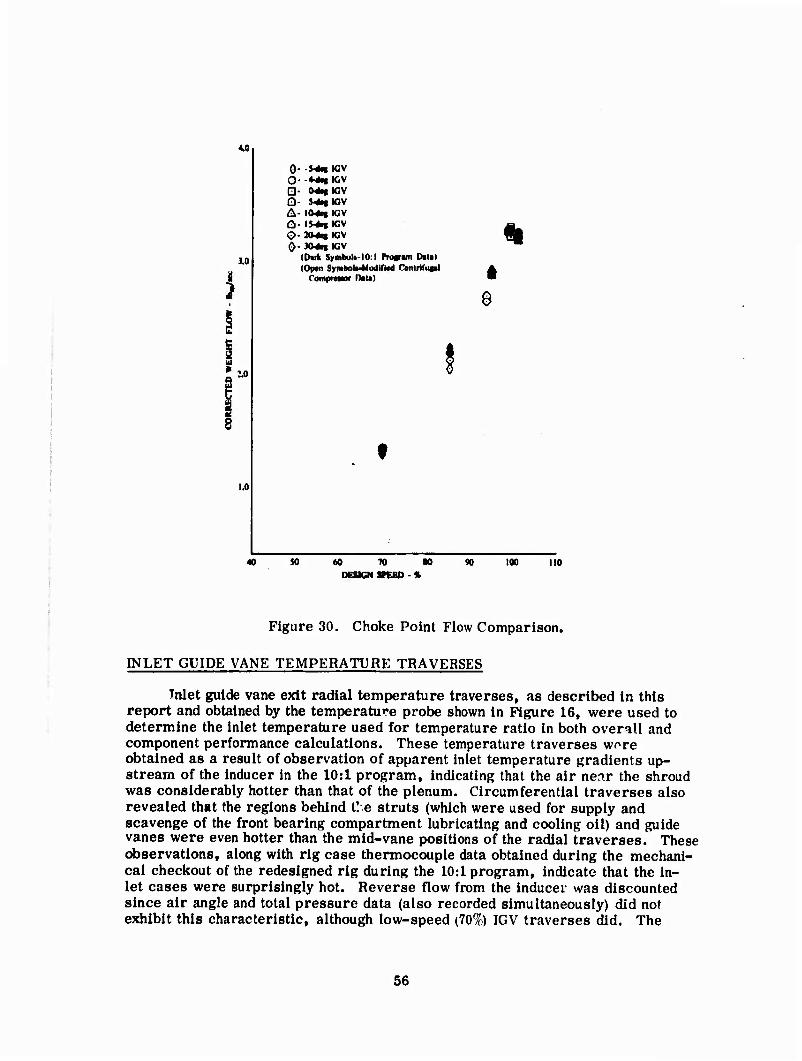
The choke point flow comparison presented in Figure 30 also indicates that the smaller diffuser throat passes less flow than the 10:1 program diffuser at low speed, but near design speed the higher pressure rise of the modified con- figuration creates greater flow at the same condition. The continuing rise in flow at approximately design speed as prewhirl was decreased indicates that the flow was never absolutely choked in the area of the inducer.
55
4.0
3.0
10
1.0
0- -S^tf IGV O- ♦^etlGV □ - M«ICV O- s^iicv A- \04H KiV Ü- 1$-*!» IGV
0- JMtg ICV (Duk Symboli-IO: I Propun Dalai (Optn SymholfModified C«nlrifu(il
CompreiKX DiUI
*
$
f
SO 60 70 DESIGN SPEED
80 90 100 110
Figure 30. Choke Point Flow Comparison.
INLET GUIDE VANE TEMPERATURE TRAVERSES
Inlet guide vane exit radial temperature traverses, as described in this report and obtained by the temperature probe shown in Figure 16, were used to determine the inlet temperature used for temperature ratio in both overall and component performance calculations. These temperature traverses wore obtained as a result of observation of apparent inlet temperature gradients up- stream of the inducer in the 10:1 program, indicating that the air near the shroud was considerably hotter than that of the plenum. Circumferential traverses also revealed that the regions behind t! e struts (which were used for supply and scavenge of the front bearing compartment lubricating and cooling oil) and guide vanes were even hotter than the mid-vane positions of the radial traverses. These observations, along with rig case thermocouple data obtained during the mechani- cal checkout of the redesigned rig during the 10:1 program, indicate that the in- let cases were surprisingly hot. Reverse flow from the inducer was discounted since air angle and total pressure data (also recorded simultaneously) did not exhibit this characteristic, although low-speed (70%) IGV traverses did. The
56
K.Wm**m**nm**»*»*>
reverse flow characteristics were obvious and very different from the tempera- ture gradients observed. Inlet case temperatures continued to rise after com- plete rig shutdowns, which also led to the conclusion that secondary flows from the Inducer were not responsible.
A very accurate and responsive traverse probe was constructed and used to measure these temperature gradients for this program. The resultant radial temperature traverses are shown in Appendix A. These traverses were obtained out of the hot wakes observed in the 10:1 program data to be conservative, and the profiles were nearly the same as seen in the previous 10:1 program data. The apparent accuracy of the probe is substantiated, as the free-stream tempera- tures reach the corrected standard day plenum temperature. Response of the probe is such that temperature changes of approximately 100 deg were sensed in the same 0.1 sec that the other instrumentation signaled that a surge had occurred.
An analysis of the heat transfer necessary to cause the levels of inlet pre- heating and the potential heat transfer paths observed from hot regions of the diffuser collector and turbine has not fully substantiated the experimentally measured heat input. However, temperatures of up to 7C0oR have been recorded by the inlet probe withdrawn into the wall but not in contact with any metal during the present test.
COMPONENT PERFORMANCE
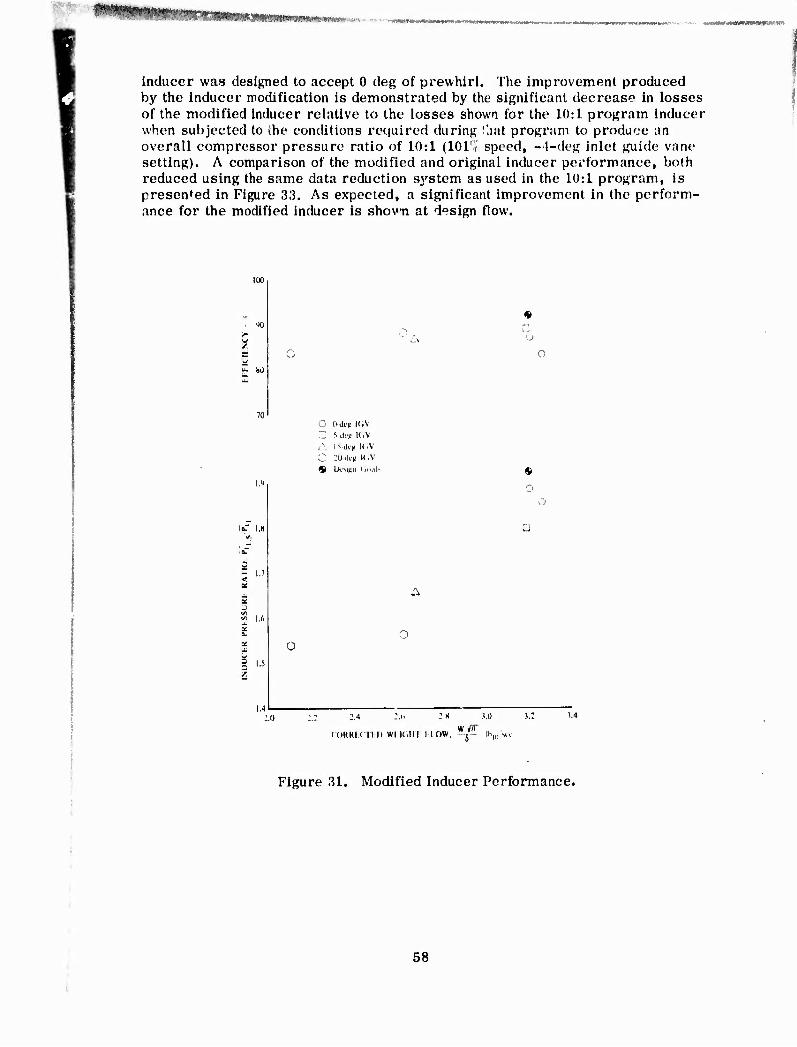
The performance map for the modified inducer is presented in Figure 31, and the modified inducer performance data are listed in Table 11. The inducer performance fell slightly below its predicted design pressure ratio of 1.924:1 and 92% efficiency at 3.2 lb of flow. At 99% speed and 0-deg IGV, the modified inducer obtained a pressure ratio of 1. 886 at an efficiency of 87.22% and 3.205 lb of flow. The actual characteristics of the inducer with speed at a constant in- let guide vane setting are difficult to determine due to the inlet guide schedule used in this test; however, trends are distlngu shable. The high-speed, 0-deg data seem to indicate that the inducer is operating on the choke or negative incidence angle side of its characteristic. This trend was observed on the test stand when the 20-deg inlet guide vane point at 2.62 lb of flow was obtained. During the traverse, the rig stalled and the point was reset slightly down the speed line. The absolute pressure level of the new inducer traverse point was also reduced, indicating that the inducer characteristic was steep at this point.
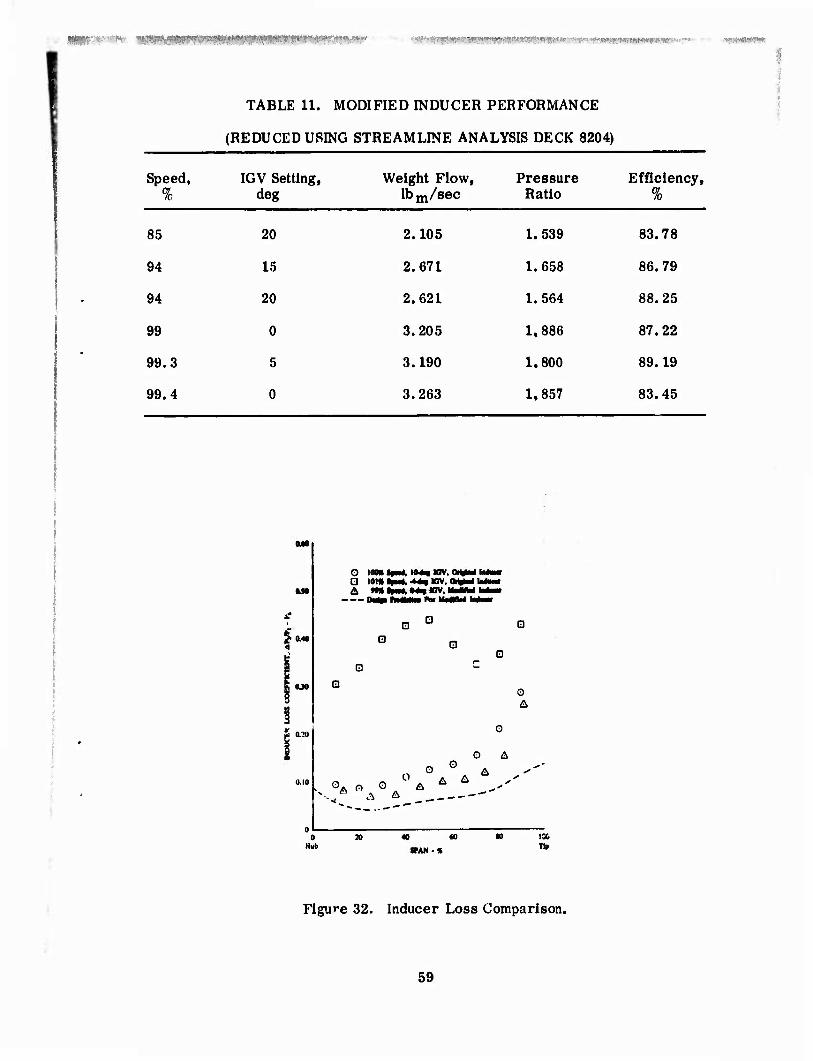
The losses of the modified inducer calculated using the measured inlet and exit profiles, as described in the inducer performance section, are compared to the design loss distribution in Figure 32. The measured losses are slightly higher than those predicted over most of the span, with a rapid increase in the measured losses relative to the prediction occurring near the shroud wall. These loss levels are compatible with the inducer performance data, which showed that the inducer was not up to design pressure ratio and efficiency at this condition. Loss distributions of the original 10:1 program inducer are also presented in Fig- ure 32 for comparison. The losses of the modified inducer are slightly lower across the span as compared to the original when each is operating at its particular design condition, even though it produces a considerably higher pressure ratio. The original inducer was designed to accept 10 deg of prewhirl, and the modified
57
■•^m^ (■»«fK'-- w^wmy.'^-^i-wiT- ■•, -*i*trWCt^rtW^-aiW WW^r^-^-^yywmi
inducer was designed to accept 0 deg of prewhirl. The improvement produced by the inducer irodification is demonstrated by the significant decrease in losses of the modified inducer relative to the losses shown for the 10:1 program inducer when subjected to the conditions required during t'aat program to produce an overall compressor pressure ratio of 10:1 (101'"; speed, -4-deg inlet guide vane setting). A comparison of the modified and original inducer performance, both reduced using the same data reduction system as used in the 10:1 program, is presented in Figure 33. As expected, a significant improvement in the perform- ance for the modified inducer is shown at design flow.
'10
I.'I
loT l,K
<* 1.6
i 1.5
1.4
* □
~ 5 des 'UV A ivdi-i! icv C yy^-n itiv
* o
0 o
:.a t.o ).: x* (OKRicn i) WIK.HI now, =• ibm.v
Figure 31. Modified Inducer Performance.
58
''- «Mri; - m9MmmM.mmm\ «tfmmimmsmmmmm
I TABLE 11. MODIFIED INDUCER PERFORMANCE
(REDUCED USING STREAMLINE ANALYSIS DECK 8204)
Speed, %
IGV Setting, deg
Weight Flow, lb m/8ec
Pressure Ratio
Efficiency, %
85 20 2.105 1.539 83.78
94 15 2.671 1.658 86.79
94 20 2.621 1.564 88.25
99 0 3.205 1,886 87.22
99.3 5 3.190 1.800 89.19
99.4 0 3.263 1,857 83.45
4
•JO
O 100» ifi, IO*| KJV. OTWMI Maw Q Ml« IpM*. ■44« IGV. ~ & *f» tut, •*§ wv. i
0
o
0
O Ä
-^ A A —'
o Hub
40 M
»AM-«
IX
Figure 32. Inducer Loss Comparison.
59
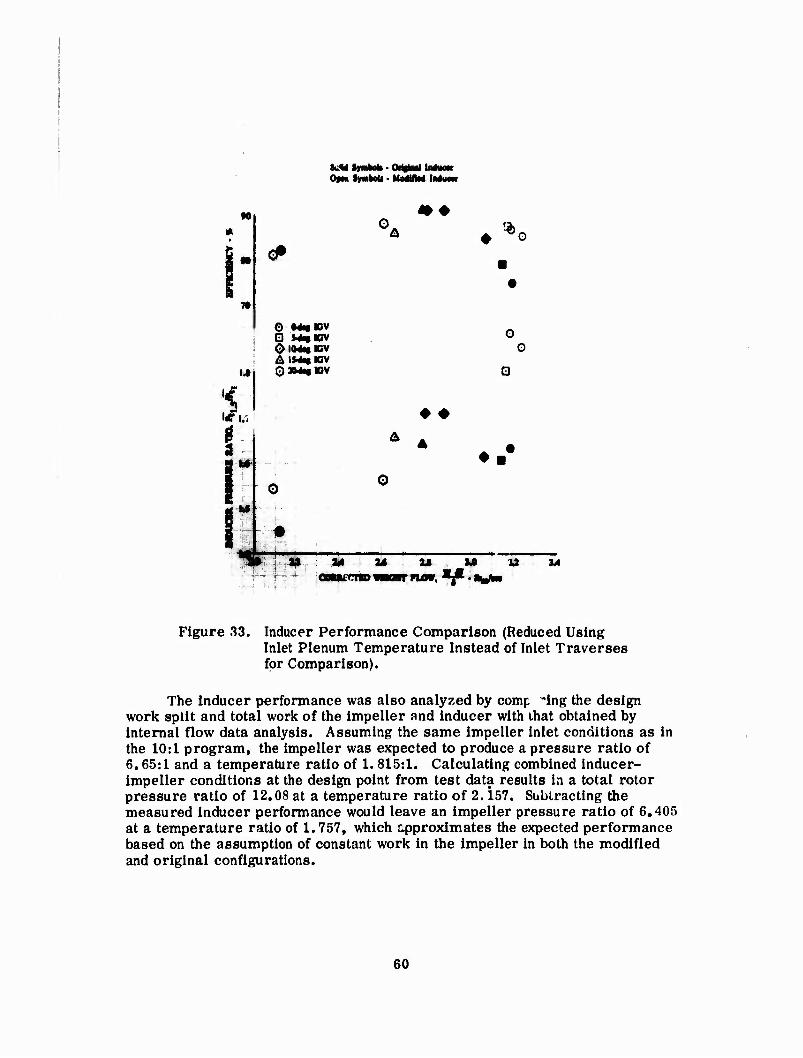
fcM Symbob - CMflail Muotr Opni SynkoU - IMHtad inducn
I !
I
*♦ ♦ '*o
0 M«BV □ 5*«ICV
A IM« «cv
♦ ♦
0 - i ■
i ■;■#
♦.
yf& 3B - ü M t» u» M
Figure 33. Inducer Performance Comparison (Reduced Using Inlet Plenum Temperature Instead of Inlet Traverses for Comparison).
The inducer performance was also analyzed by comp ^ing the design work split and total work of the impeller and inducer with that obtained by internal flow data analysis. Assuming the same impeller inlet conditions as in the 10:1 program, the impeller was expected to produce a pressure ratio of 6.65:1 and a temperature ratio of 1. 815:1. Calculating combined inducer- impeller conditions at the design point from test data results in a total rotor pressure ratio of 12.08 at a temperature ratio of 2.157. Subtracting the measured inducer performance would leave an impeller pressure ratio of 6.405 at a temperature ratio of 1.757, which approximates the expected performance based on the assumption of constant work in the impeller in both the modified and original configurations.
60
The inducer inlet relative Mach number and spanwlse distributions of incidence angle at design conditions and at 99% speed and 0-deg IGV setting, reduced by the streamline analysis method, are shown in Figure 34. The choked incidence relative to design can be attributed to the slightly lower speed of the measured point. Comparable data, reduced in common with build 6 of the 10:1 program, are shown in Figure 35. The modified inducer ran more choked than at either the 10:1 program design point or the 10:1 program condition required to obtain 10:1 pressure ratio. The choked incidences exhibited in these figures by the modified inducer are also compatible with the inducer performance and loss data. ;
The inlet and exit air angle distributions and resulting turning are shown in Figure 36. The inducer inlet and exit relative air angles are both slightly high due to the underspeed of the reduced point, but resultant turning is very close to design, as the inducer overturned at the hub and underturned at the tip by a few degrees.
Inducer exit total pressure, air angle, and total temperature traverse data are presented in Appendix A for all data points recorded.
Impeller inlet conditions generated by the modified inducer at 99% speed and 0-deg inlet guide vane setting are shown in Figure 37, along with the design distribution. Inlet relative Mach number level and distribution were much as expected, except for the reduced Mach number caused by the previously noted Ugher-than-design inducer losses at the tip. The impeller leading-edge incidence is significantly more choked (6.5 deg at 10% span) than design at the hub. This difference decreases as the tip is approached, until at 90% span from the hub the design incidence is nearly matched. We must assume that the incidence change must have resulted in increased impeller losses. The impeller inlet conditions are compared in Figure 38 with 10:1 program data, reduced by the same method as in the 10:1 program. The k..peller inlet relative Mach number is considerably reduced in the modified configuration over the span; however, the modified inducer created a more choked inlet condition to the impeller.
•
61
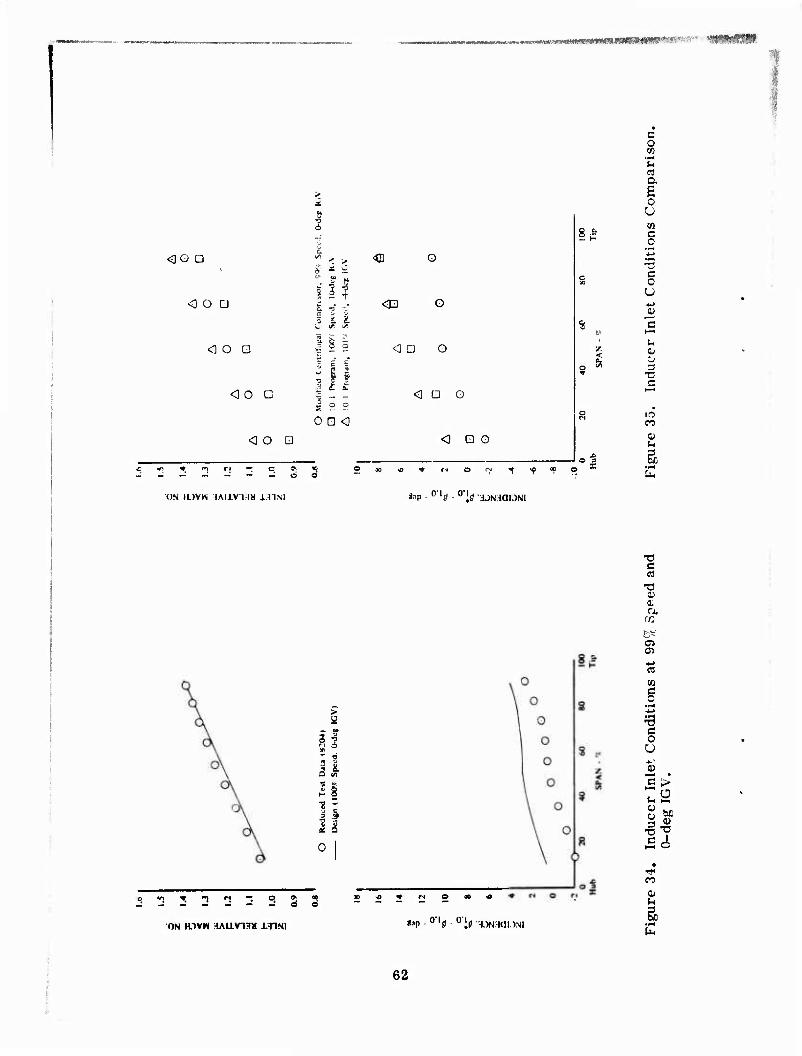
wrmrnvwrnm^mm'to-mf?'*-' *■" yfflß$r%w
<]0 □
O O Q
<i o a
oo □
o o □
* - ^
1 ■7
s ■p "^
5 L t L ■x y
u. \ 5
e c E :^ N
"= | & ^ c £ ": — —
6 o 7
o a <]
<© o
<ID o
<i a o
<] a o
o □ o
8H&
O oo « CM O !-< ^ ^1 Sf
c o
I U CO c o
§ u
Si c
»—t
o ■a
CO
0)
ON M.)VW 1AU.V1.I« 1 J INI top-0'1«- 0'i£l ■iUNHCIUNI
n ^i -. s
11
Q en
1;
0
T3
T3
a
ro
OS en *-> rt to
I *-> =3 c o u
•Si
ON aww SAUviaa ISINI «»P - 0'ltf - 0'irf'S-TNaauMi • PH
PH
62
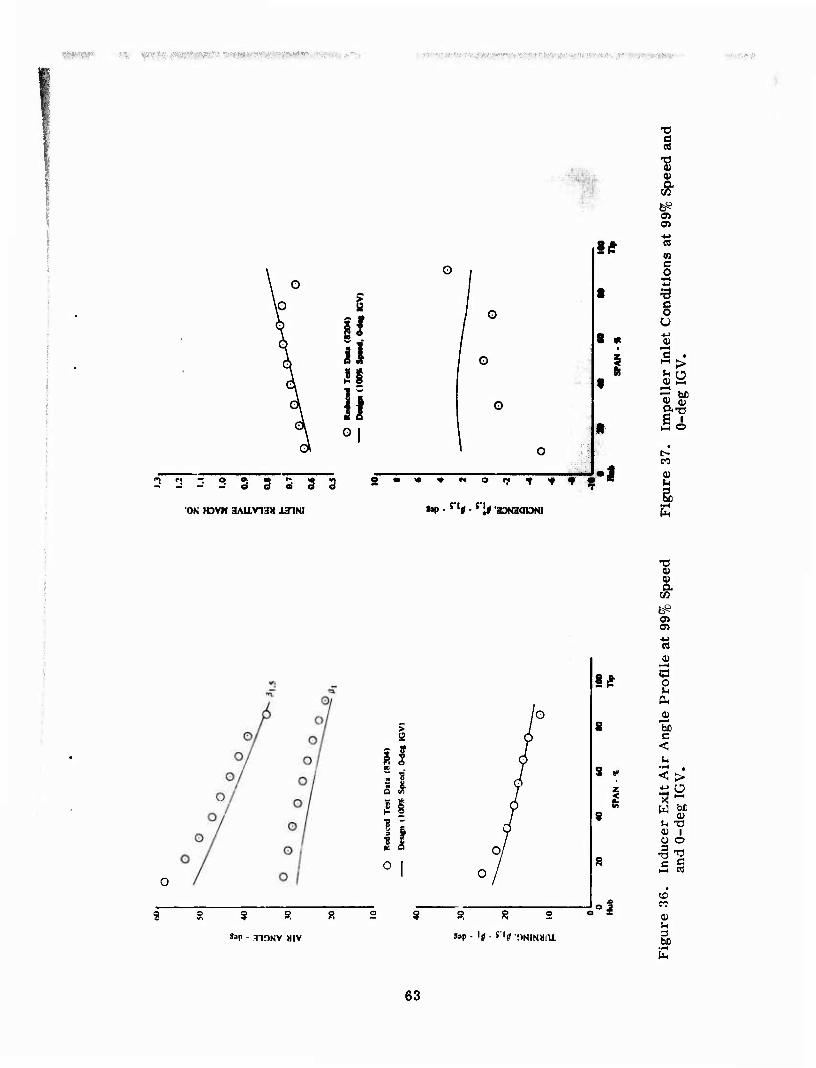
' ■ I
■
....
II il n II
12 2 3 3 3 3 3
'ON H3vw aAuna» ISINI
S • ««MO t f f a ■
a
8 «
a i
05 05 0)
«
c o 4-1
=3 a o u
-'>
* ^
a^ Ä o
t>
f»p. s'i((. rji aoNaai^Ht
O
il a t/i
«'P - IIONV MIV
« a» a
CO
b^ os o> ■M rt 1)
-M
§ * o
jo 8
c <
X S *
xit A
i IG
V.
O LJ OC
j % <U 1 o o
0 8 •a 'S c S
o / Ht TO
•§ « s S 2 > X
0)
8»p 'j- *■'«'oNimifti 3 bD
63
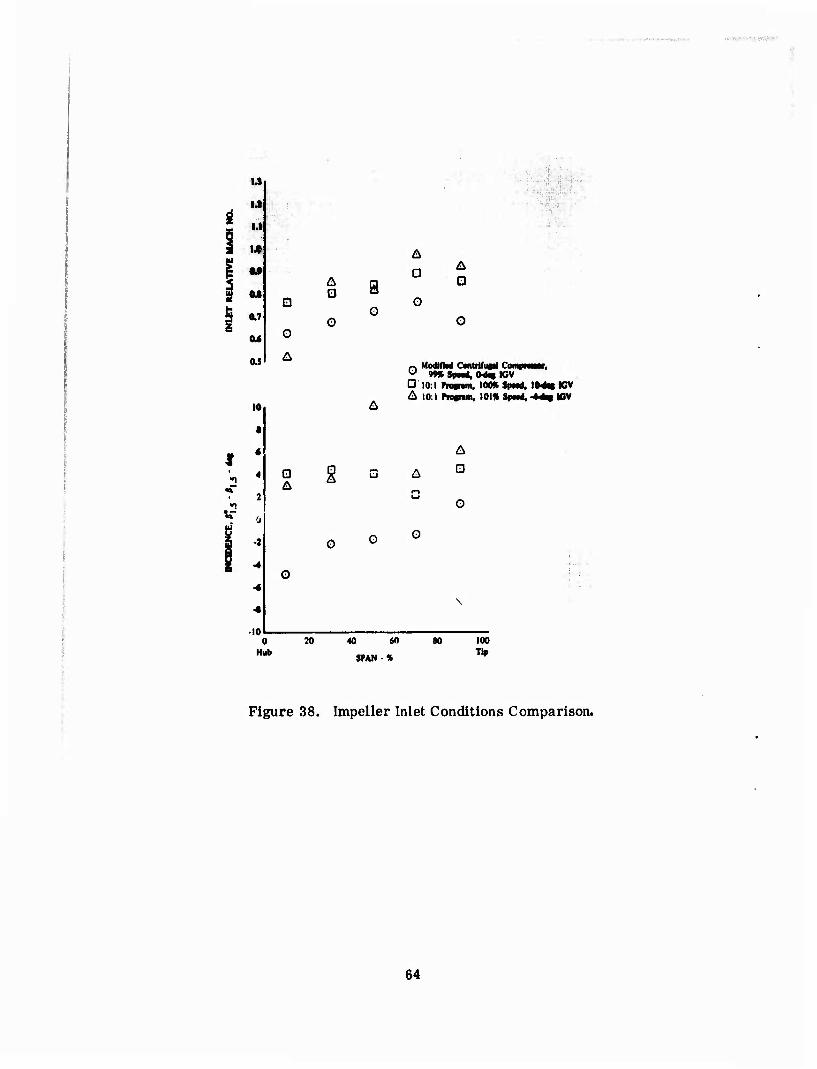
. ,- -,
2
LI
14
14
«*
M
a?
a«
o.s
10
*
4
2
0
-2
•4
4
■I
-10
O
o Hub
o
g
S o
D a
i.
/-i ModUM Centrif u|al Compnmr. u 99% Spart, OM WV O 10:1 Provun, 100» SpMri. IM« KV A 10:1 Piofram. 101« Spn«. ■44« IDV
A
D
20 40 60
SPAN -%
80 100 Tip
Figure 38. Impeller Inlet Conditions Comparison.
64
'''"'''^"'''''^(WäawWtl«*»«»»^^ . ,—.„....„..„„„„.„.j^»^,,.—^.„..^„„.m^nn.m-imw-.mammnio.i^' -.«MmWWWtWW*
SECTION vin
CONCLUSIONS
The program objective of improving the performance of the 10:1 pressure ratio single-stage centrifugal compressor as a result of modifications to the inducer was achieved. An efficiency of 78.4% was obtained at 10.07:1 total-to- static pressure ratio. This is 3.4 points greater than the design goal and has verified that high-pressure-ratio, high-efficiency, single-stage centrifugal compressors can be developed.
The successful modification to the inducer shows that transonic fan design technology can be used in other applications. The inducer performance also demonstrates the use of rugged, low-aspect blading in order to operate efficiently at higher blade loadings.
The sensitivity of the performance to diffuser sizing was demonstrated by the slight loss in efficiency at the 8:1 pressure ratio condition due to the diffuser size required to match at the design point.
This program was conducted with freedom from mechanical difficulty throughout the entire test sequence, and complete performance data were obtained. Axial impeller-to-shroud clearance was 0.001 in. at design speed (65,300 rpm), but no rub occurred and vibrations remained low throughout the test. The available horsepower of the test rig permitted the test to be conducted at sea level inlet conditions, eliminating the need for Reynolds number corrections to the measured performance.
65
SECTION IX
RECOMMENDATIONS
This test program has demonstrated the performance capability of a high- pressure-ratio, single-stage centrifugal compressor; however, analysis of this information has resulted in the following recommendations to define and improve the performance of simplified compressors fur small gas turbine engines:
1. Now that the original design performance goal of 75% efficiency at a total-to-static pressure ratio of 10:1 has been surpassed, means for improvement of the range characteristics should be examined so that this performance potential can be of greater benefit in engine or gas generator applications. The Impeller exit/diffuser entrance region is apparently the area that has the greatest influence on the range from choke to surge, but no effort to investigate this area or to increase the flow range was included in this limited-effort program. Thus, it is recommended that research be conducted to determine the factors influencing range, and that these results be used to provide a demonstration of improved range or surge margin by application of this Information.
2. The slight loss in efficiency from the 10:1 program at 8:1 pressure ratio as a result of accurate diffuser matching at the 10:1 pressure ratio design condition points out the sensi- tivity of the compressor to small changes in diffuser geometry. This area should be more fully investigated and techniques or devices developed to allow adaptive matching or alleviation from the present sensitivity in order to develop optimum performance over a greater operating envelope. Even though the diffuser was accurately sized for tfie design condition in this program, the sensitivity of performance to diffuser size «vould make it advisable to modify the test rig so that diffuser changes can be made in the test mount without extensive dis- assembly and reassembly requirements.
3. Inlet preheating measurements obtained in this program demonstrate the need for more investigation into the effect of environment and configuration on apparent rig performance. Metal and air temperatures should be measured in future programs to allow farther definition of any tendency of test configuration or extraneous sources to influence performance calculations. Data should be obtained to create standard or baseline performance, and environmental or operational condi- tions should be estimated and applied to this standard per- formance for gas generator or engine studies.
66

,rwmmK^wrm''i'mmmmmmmmumm*''mmmm ■ - mmmmmmmmmmmmmmmmmmmr***^ *m
APPENDIX A
TRAVERSE DATA
Plots of inlet guide vane exit total temperature traverse data (Figures A-l through A-6) and inducer exit total pressure, air angle, and total temperature traverse data (Figures A-7 through A-12) are presented. Total pressure and total temperature are ratioed to standard day plenum conditions but are other- wise uncorrected. Inlet guide vane exit total temperature traverses recorded at 94% speed, Figures A-2 and A-3, were obtained with the traverse probe in an inlet guide vane wake and were not used In performance calculations. The tempera- ture sensor on the inducer exit traverse probe is offset 0.045 in. from the pres- sure sensing ports. Both the inlet guide vane exit and inducer exit traverse probes were stopped prior to the hub wall and traversed into recesses in the shroud wall.
67
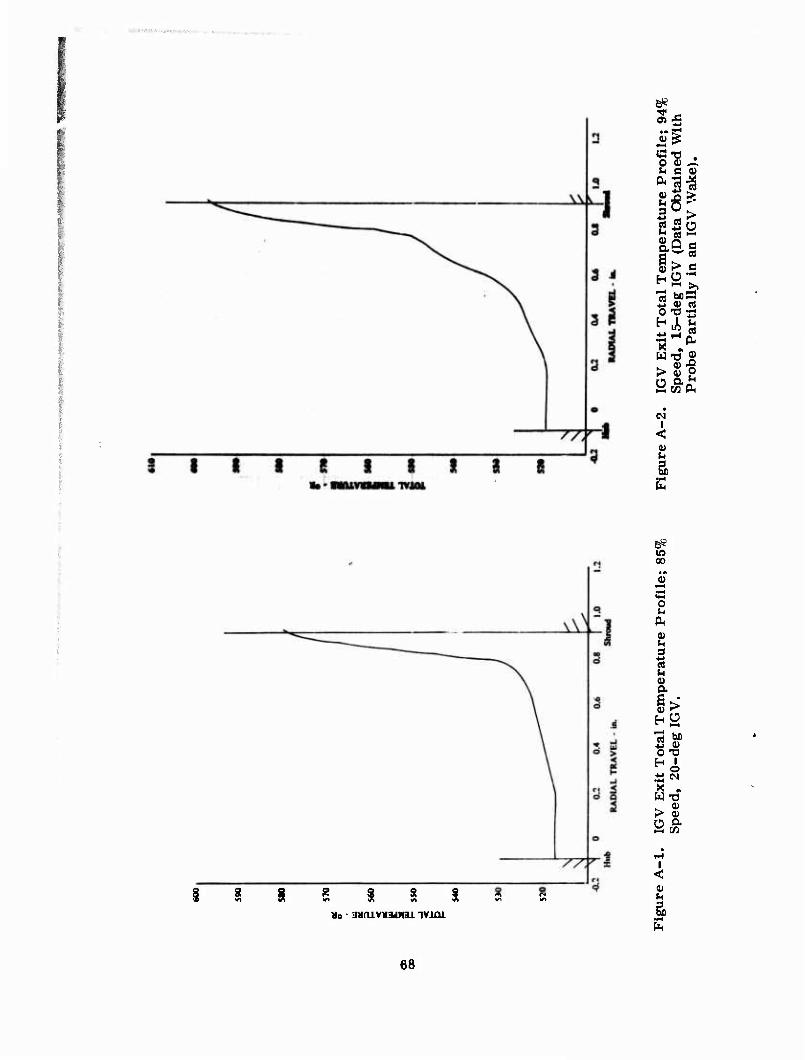
■
C-o , U C Q)
ho"
i> c _] ^ >> ^ « cd O -Ü —
>||
I <
g,
oo
0)
8 1*1 vt tf( vi tn
ao - Huaivaajwai ivixu
o (■i
(X a) bi a d
a i>
o "O ^i
> <u Ü Ö. !5 M
I < a«
5
68

O)
NNW
777^
-1
S 5 < 5
1! 2
g s s 1 «A in IA tn
Mo - 3HniVa3dW31 IViOl
0 u
3
a
k t-H I—C
2 be O 0)
> « n a
1 <
Mo - auruvuiUNai. ivxox
,2 ^ G t3 . O "i ^ u e v ^|
a «,-1
_. :""' " 0) CO
h 1 M
X ^ WtT«
S CO (X
I <
ä
69
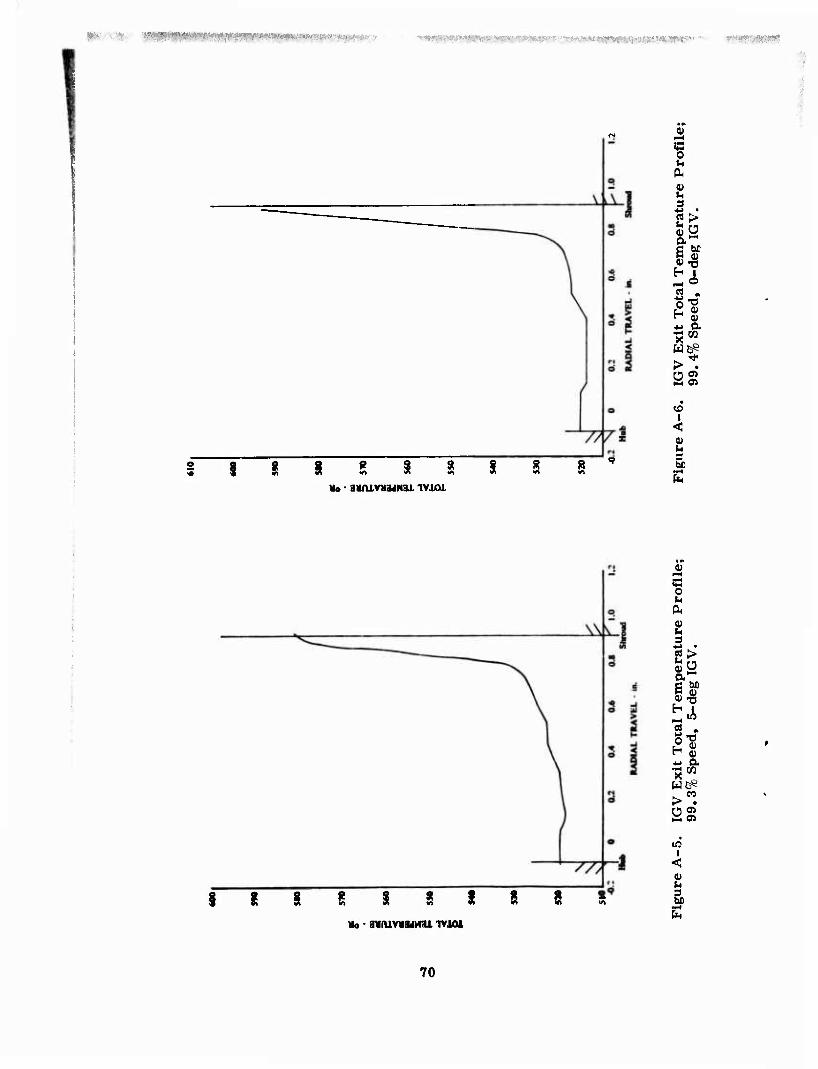
I iiWiWIM«illW!ipf^^ ■ ■ «""W^W?
u ft (U
3 *> • a > So a"
<?•« h i
« .
•pen
i <
ft m in vt
Mo - aaoLwuNax ivixu
he
w» * irt *
«o - avruwuMai vtun
a
«a 0 u (X V ti 3
■*-> * P5 >
a 0
S bo (I) 0) -n
h .A rt fi "V H (0 *J a en w^ > • Ü
• in
< QJ ^4
W) ..H
(*
70
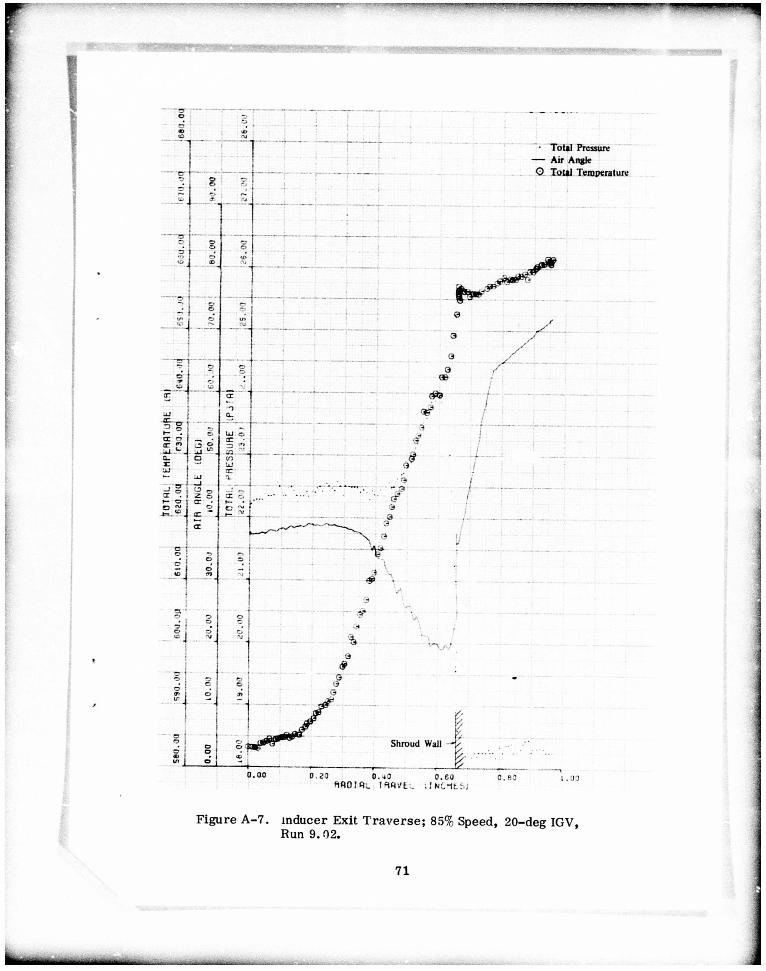
• ToUl Pressure — Air Angle O Totll Temperature
Shroud Wall
O.OO 0 . 2 0 0 . -49 HAOIRL TSKVl
0 . 6 0 i lUCIES l
0 . HO
Figure A-7. inducer Exit Traverse ; 85% Speed, 20-deg IGV, Run 9.02.
71
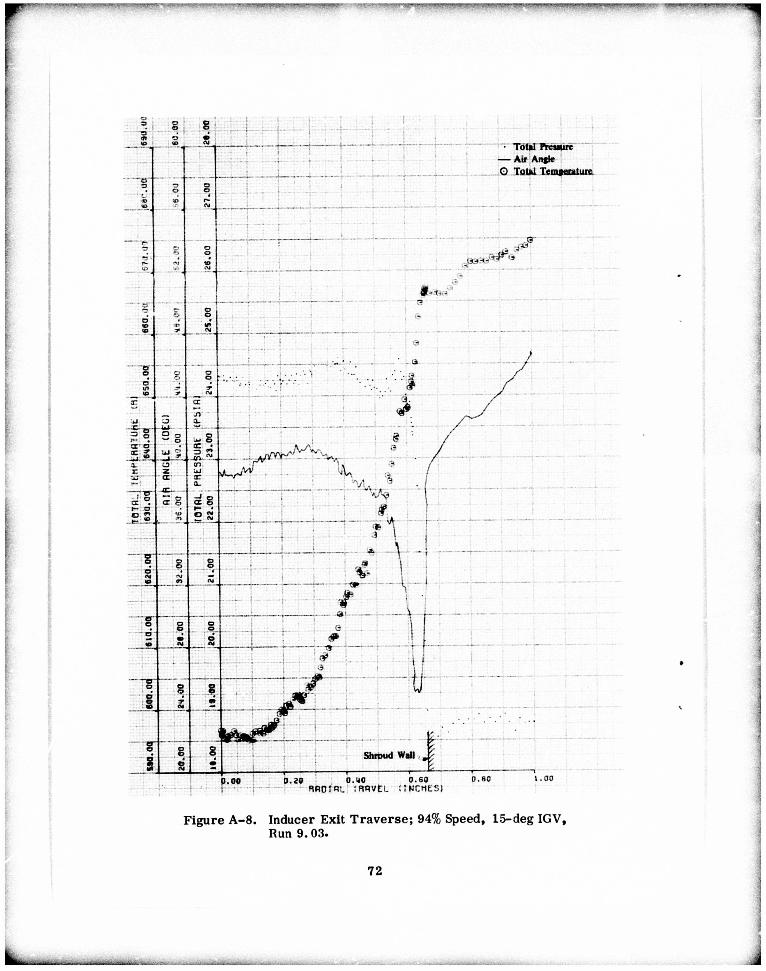
1
Shroud Wall
• Total Preuurt — Air Angle O Total Temtejoduie
1 .00 0 . 2 0 0. KO 0 . 6 0 BR0ie»t. ' RAVEL : !NCHtSl
Figure A-8. Inducer Exit Traverse ; 94% Speed, 15-deg IGV, Run 9.03.
72
i
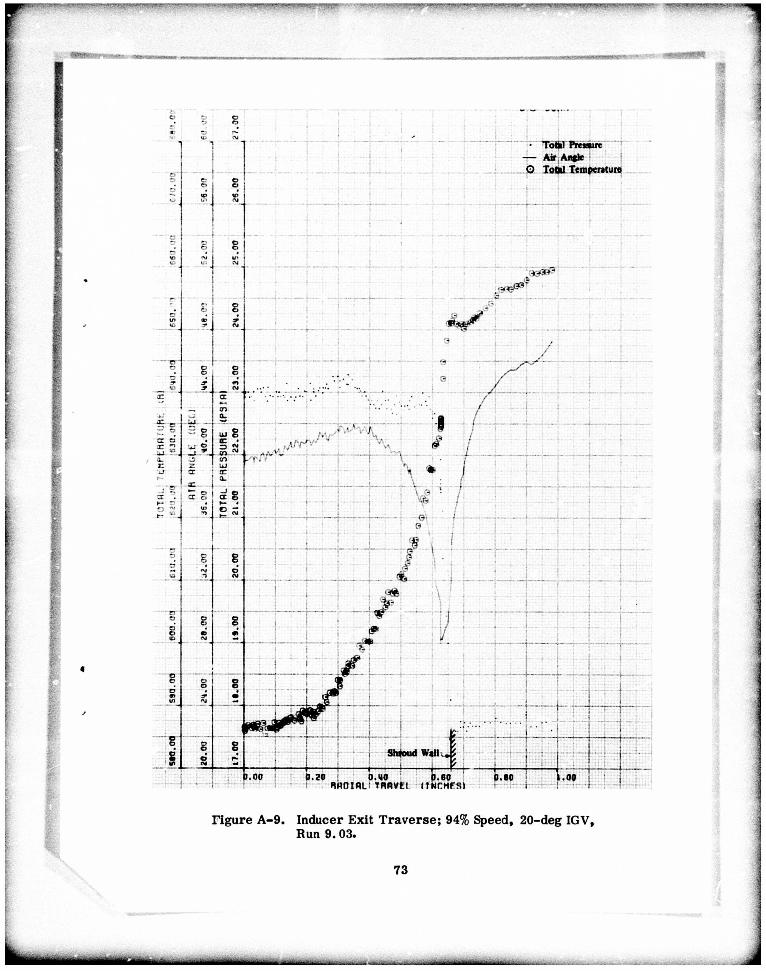
PPWJBRU'.J1 'J —
9
• Totfc! Pressirr — Air Antle O Total Temperature
I
I
i
Wall Ls $
).00 1.20 : o.uo HH01HIJ THRVtt I t
).S0 arMFSi
Tigure A-9. Inducer Exit Traverse; Bun 9. 03.
Speed, 20-deg IGV,
73
immrn -

" " " * V F W > * * . « • - « ? » ....
1
TotU Prerurc Air Angle
O Tofcl temperature
. ,/•
>.00 D.20 0.M0 ^ 0.80 HHOIflL TWWfct ITMCMfSI
Tigure A-9. Inducer Exit Traverse; 94% Speed, 20-deg IGV, Run 9.03.
73
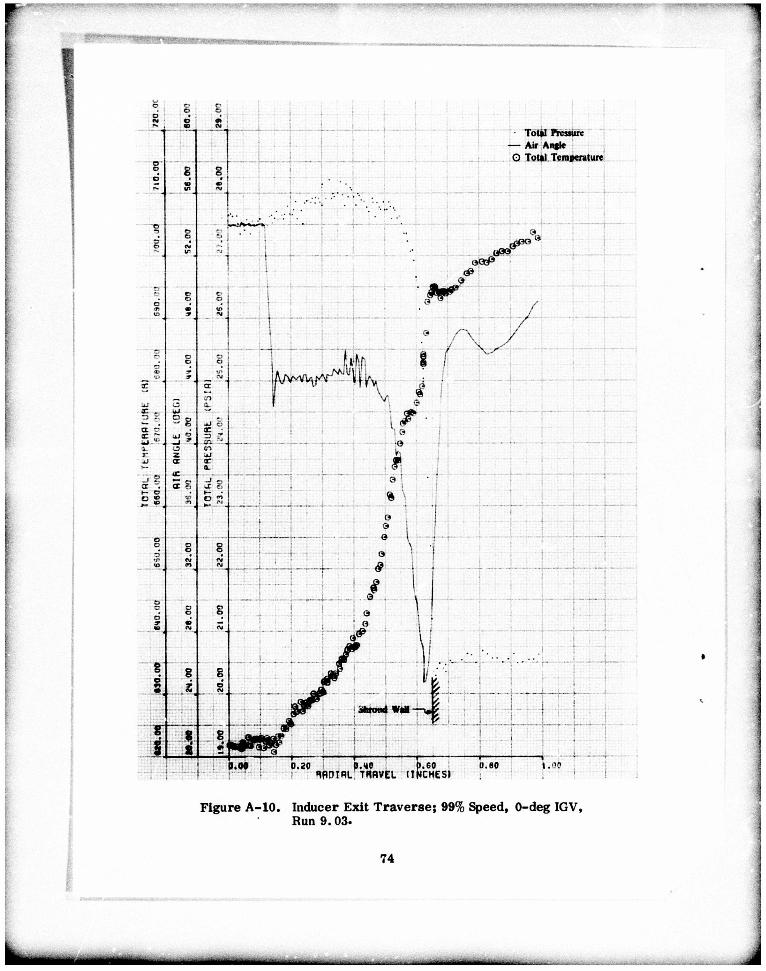
• Total Pressure — Air Angk O Total Temperature
__i_
m jhrond Watt -
20 P.MO ipoim. THRVEL CHESI
Figure A-10. Inducer Exit Traverse; 99% Speed, 0-deg IGV, Run 9. 03.
74
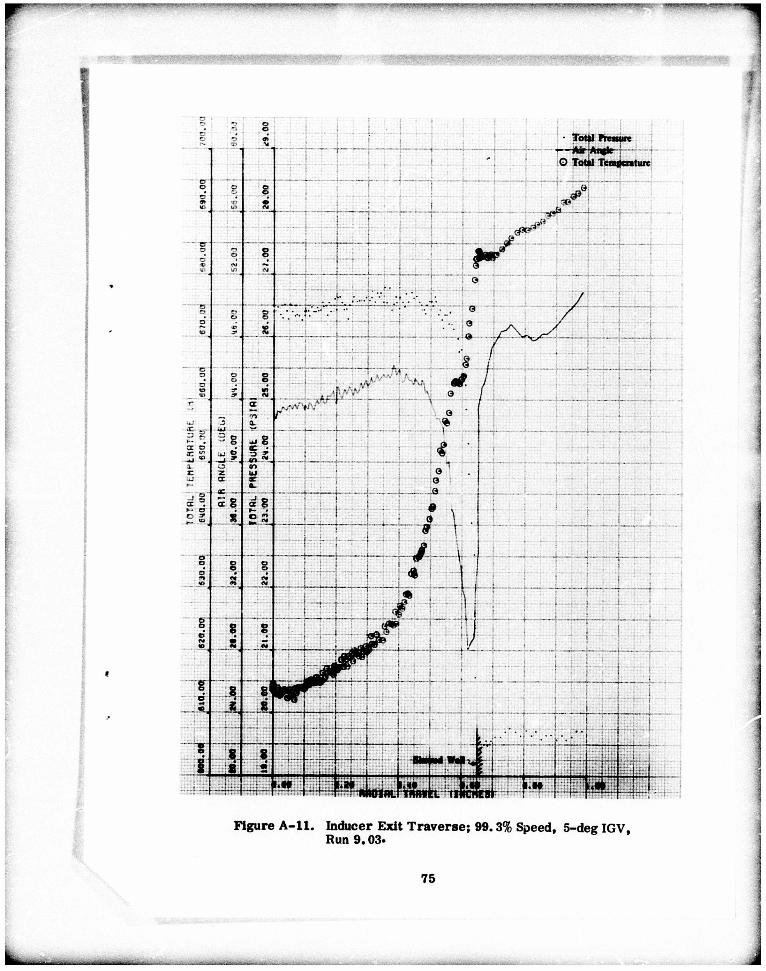
Figure A- l l . Inducer Exit Traverse; 99.3% Speed, 5-deg IGV, Bun 9.03*
75
. -

a
A
A*
b
C
G
E
e
h
i
k
Kl &K2
LER
M
n
N
P8
Pt
PR
Rle
^n
Rt
R
t
ltip
UST OF SYMBOLS
Speed of sound, ft/sec
Area, in. 2
Critical area, in.
Chord, in.
Orifice equation constant o
Gravitational constant = 32.174 lb -ft/lb--sec m t
Rotor frequency = N ./öO
Uncertainty of an individual sensor
Enthalpy/unit mass, Btu/lbm
Incidence, deg" 0* -0
f (Mach No.) = MWllL (i + -ZILM2)"
2 ^'^
Orifice equation constants
Leading-edge radius, in.
Absolute Mach number
Number of sensors
Rotor speed, rpm
Static pressure, psia
Total pressure, psia
Pressure ratic
Diffuser leading-edge radius, in.
Diffuser tangency radius. In.
Impeller tip radiu % in.
Gas constant = 53.345 ft-ibf/lbm-^R
Inducer blade maximum thickness, in.
77
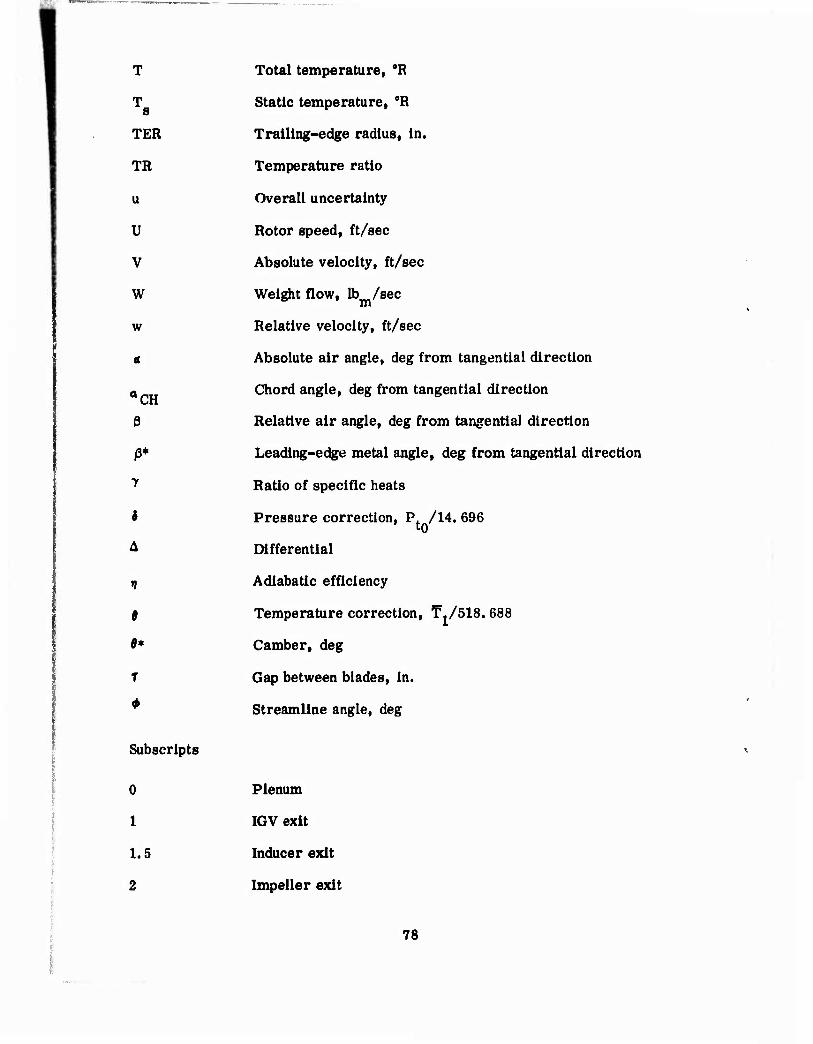
T Total temperature, 0R
T Static temperature, 8R
TER Trailing-edge radius, in.
TR Temperature ratio
u Overall uncertainty
U Rotor speed, ft/sec
V Absolute velocity, ft/sec
W Weight flow, lbm/8ec
w Relative velocity, ft/sec
« Absolute air angle, deg from tangential direction
ft Chord angle, deg from tangential direction CH
6 Relative air angle, deg from tangential direction
ß* Leading-edge metal angle, deg from tangential direction
"* Ratio of specific heats
i Pressure correction, P. /14. 696
A Differential
if Adiabatic efficiency
9 Temperature correction, T./518.688
9* Camber, deg
T Gap between blades, in.
* Streamline angle, deg
Subscripts
0 Plenum
1 IGV exit
1.5 Inducer exit
2 Impeller exit
78
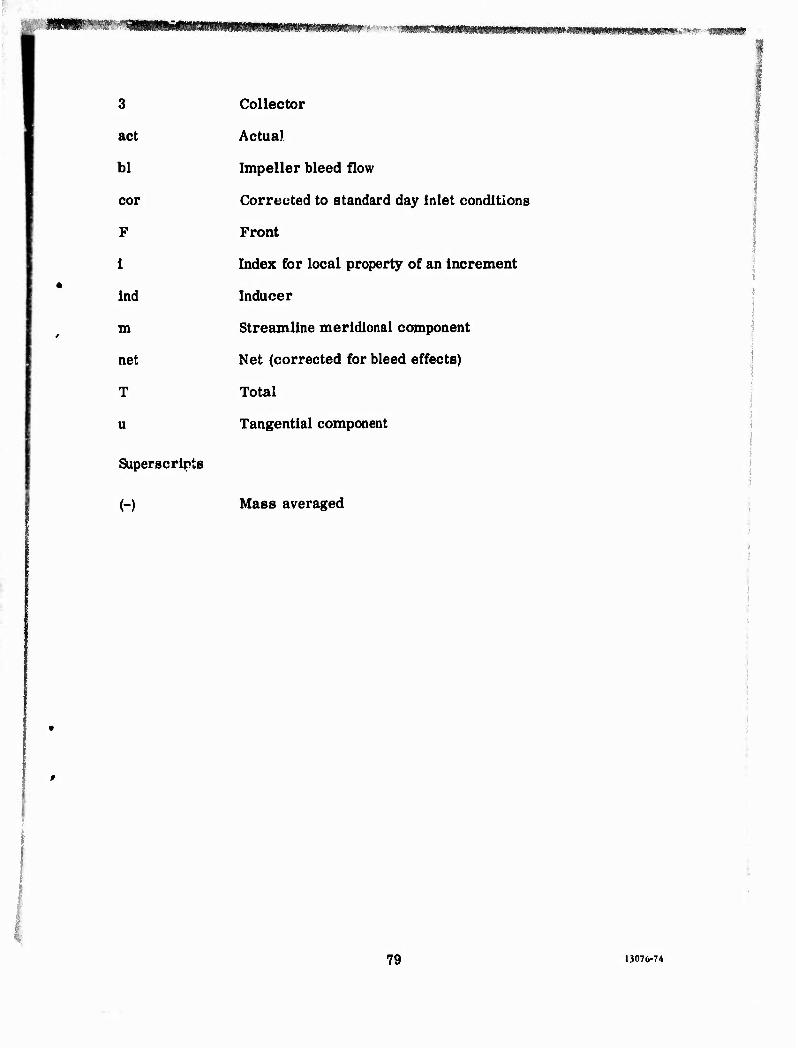
mmff*'WiM0Mmy*^ww&!m'*tif jwrmm*«mm!m& wr?««-. - ■
3 Collector
act Actual
bl Impeller bleed flow
cor Corrected to standard day inlet conditions
F Front
1 Index for local properly of an increment
Ind Inducer
m Streamline meridional component
net Net (corrected for bleed effects)
T Total
u Tangential component
Superscripts
(-) Mass averaged
79 13076-74