Embed Size (px)
Citation preview
E BMT-TWA/Maize/2/3 Add. ORIGINAL: English DATE: December 3, 2007
INTERNATIONAL UNION FOR THE PROTECTION OF NEW VARIETIES OF PLANTS GENEVA
AD HOC CROP SUBGROUP ON MOLECULAR TECHNIQUES FOR MAIZE
Second Session Chicago, United States of America, December 3, 2007
ADDENDUM TO DOCUMENT BMT-TWA/MAIZE/2/3
ANALYSIS OF PVPD INBREDS WITH PUBLIC SNP MARKERS TO ESTIMATE EQUIVALENT EDV THRESHOLDS COMPARED WITH SSR MARKERS
Document prepared by experts from Pioneer Hi-Bred International
This document is an addendum to document BMT-TWA/Maize/2/3 “Analysis of PVPd Inbreds with Public SNP Markers to Estimate Equivalent EDV Thresholds Compared with SSR Markers” and contains a copy of the presentation made by experts from Pioneer Hi-Bred International at the second session of the Ad Hoc Crop Subgroup on Molecular Techniques for Maize.
BMT-TWA/Maize/2/3 Add. page 2
Slide 1
Estimating EDV Estimating EDV boundaries for maize boundaries for maize measured by Single measured by Single
Nucleotide Nucleotide Polymorphisms (SNPs) Polymorphisms (SNPs)
Liz Jones, Barry Nelson, WenLiz Jones, Barry Nelson, Wen--Chy Chy Chu, Deb Phillips, Stephen SmithChu, Deb Phillips, Stephen Smith
Slide 2
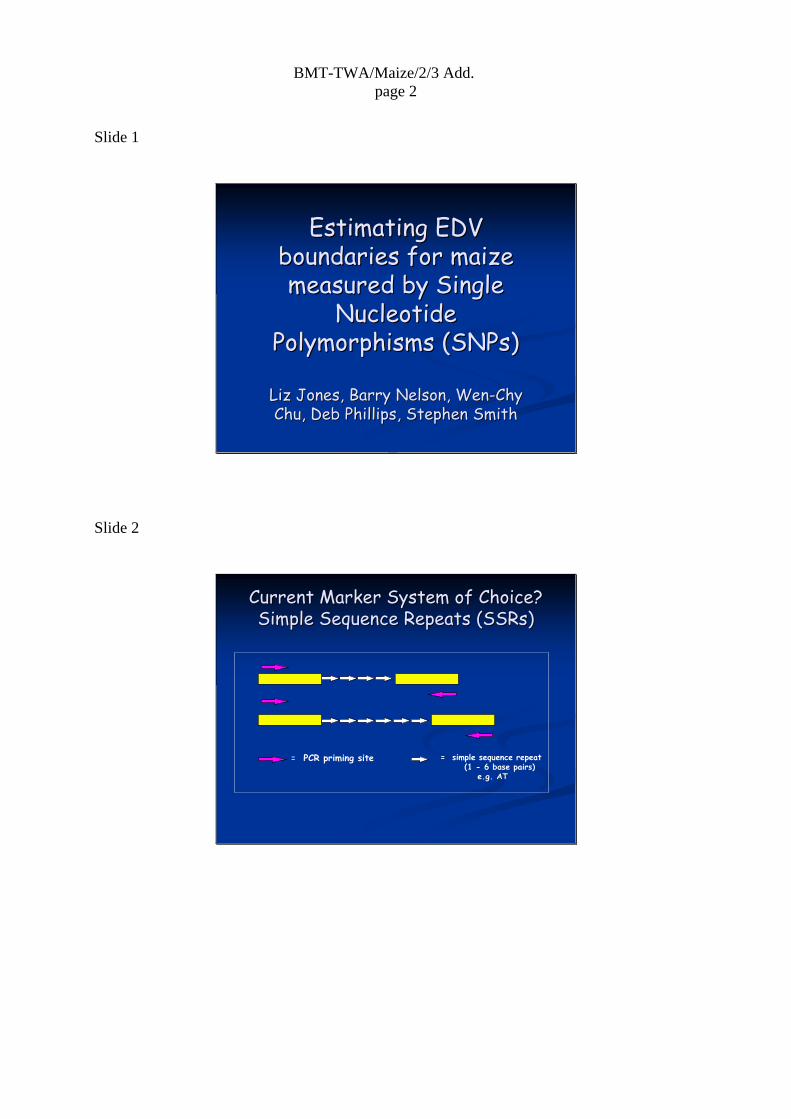
Current Marker System of Choice?Current Marker System of Choice?Simple Sequence Repeats (SSRs)Simple Sequence Repeats (SSRs)
= simple sequence repeat (1 - 6 base pairs)
e.g. ATAT
= PCR priming site
BMT-TWA/Maize/2/3 Add. page 3
Slide 3
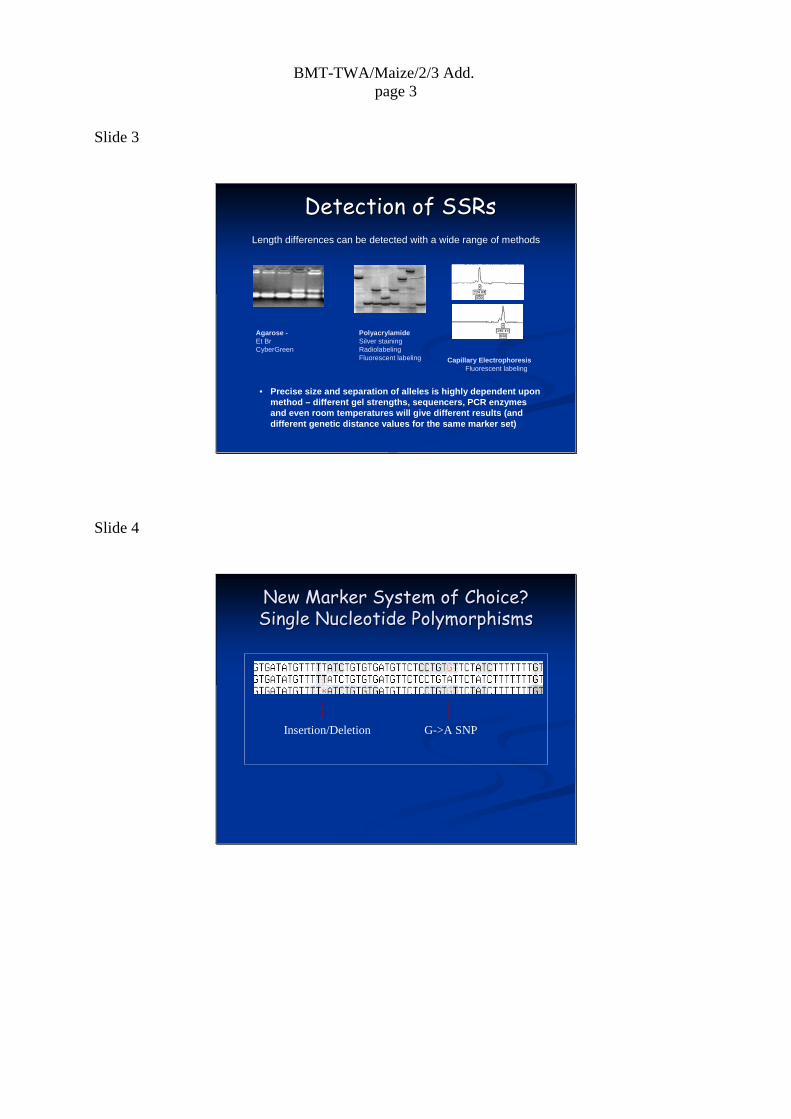
Detection of SSRsDetection of SSRs
Agarose -Et BrCyberGreen
• Precise size and separation of alleles is highly dependent upon method – different gel strengths, sequencers, PCR enzymes and even room temperatures will give different results (and different genetic distance values for the same marker set)
PolyacrylamideSilver stainingRadiolabelingFluorescent labeling Capillary Electrophoresis
Fluorescent labeling
Length differences can be detected with a wide range of methods
Slide 4
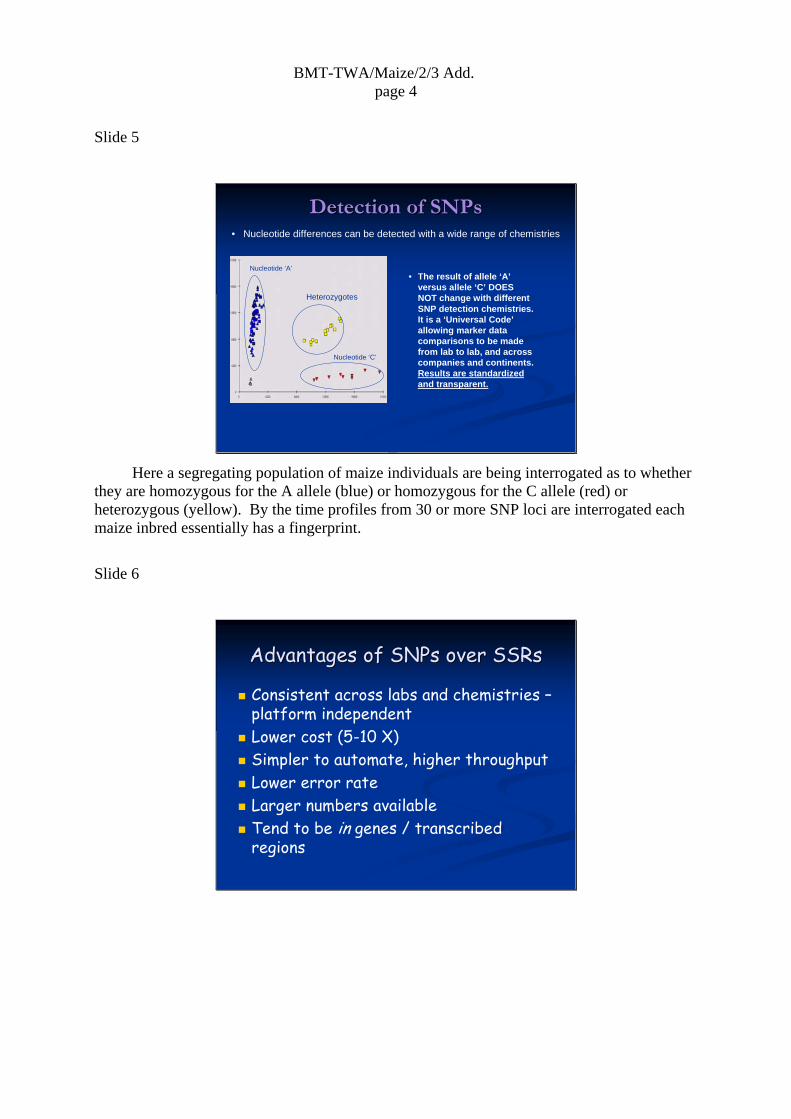
Insertion/Deletion G->A SNP
New Marker System of Choice?New Marker System of Choice?Single Nucleotide PolymorphismsSingle Nucleotide Polymorphisms
BMT-TWA/Maize/2/3 Add. page 4
Slide 5
Detection of SNPsDetection of SNPs
Heterozygotes
Nucleotide ‘A’
Nucleotide ‘C’
• The result of allele ‘A’versus allele ‘C’ DOES NOT change with different SNP detection chemistries. It is a ‘Universal Code’allowing marker data comparisons to be made from lab to lab, and across companies and continents. Results are standardized and transparent.
• Nucleotide differences can be detected with a wide range of chemistries
Here a segregating population of maize individuals are being interrogated as to whether
they are homozygous for the A allele (blue) or homozygous for the C allele (red) or heterozygous (yellow). By the time profiles from 30 or more SNP loci are interrogated each maize inbred essentially has a fingerprint.
Slide 6
Advantages of SNPs over SSRsAdvantages of SNPs over SSRs
Consistent across labs and chemistries –platform independentLower cost (5-10 X)Simpler to automate, higher throughputLower error rateLarger numbers availableTend to be in genes / transcribed regions
BMT-TWA/Maize/2/3 Add. page 5
Slide 7
Availability of Public SNPsAvailability of Public SNPs
Public SNP projectEd Buckler (Cornell), Steve Kresovich(Cornell), John Doebley (Wisc), Mike McMullen (Mo), Brandon Gaut (UC), Major Goodman (NCSU)http://www.panzea.orgPioneer contributed 640 validated SNPs (‘PHM’) 7,000 SNPs
3,000 validated in assays
Slide 8
Information Content of SNPs and Information Content of SNPs and SSRsSSRs
SNPs have lower information contentSSRs – multiple allelesSNPs – usually 2 alleles
Compensate by:Increasing the number of SNPs ?Examining a series of variants at several linked SNPs – haplotype ?
BMT-TWA/Maize/2/3 Add. page 6
Slide 9
UsingUsing SNPsSNPs inin GeneticGenetic DistanceDistanceAnalysisAnalysis
How many SNPs?How do SNPs compare with measures of pedigree relatedness in comparison with SSRs?What are equivalent thresholds for determining EDV?
Slide 10
MarkerMarker SetsSets TestedTested -- SSRsSSRsSEPROMA SSRs
163 recommended, only had data for 90 SSRsStandard set of Pioneer SSRs used for fingerprinting
314 SSRsGood genome coverageGood quality data under high throughput conditionsAll public
Sub-set of above marker set that meet recommended criteria ISF
Distance > 5 cM> 80% genome coverage PIC > 0.3
Average PIC across all markers > 0.6= 177 SSRs
BMT-TWA/Maize/2/3 Add. page 7
Slide 11
MarkerMarker SetsSets TestedTested -- SNPsSNPs
Outsourced marker design for 768 public SNP plex to Illumina
674 SNP markers gave good quality dataSub-set PIC > 0.3, good genome distribution
301 SNPsFurther sub-set PIC > 0.4, good genome distribution
212 SNPs
Slide 12
Germplasm Set testedGermplasm Set tested
195 Pioneer inbreds with US PVP protection
Relevant to commercial US germplasm105 have EU PVP protection
BMT-TWA/Maize/2/3 Add. page 8
Slide 13
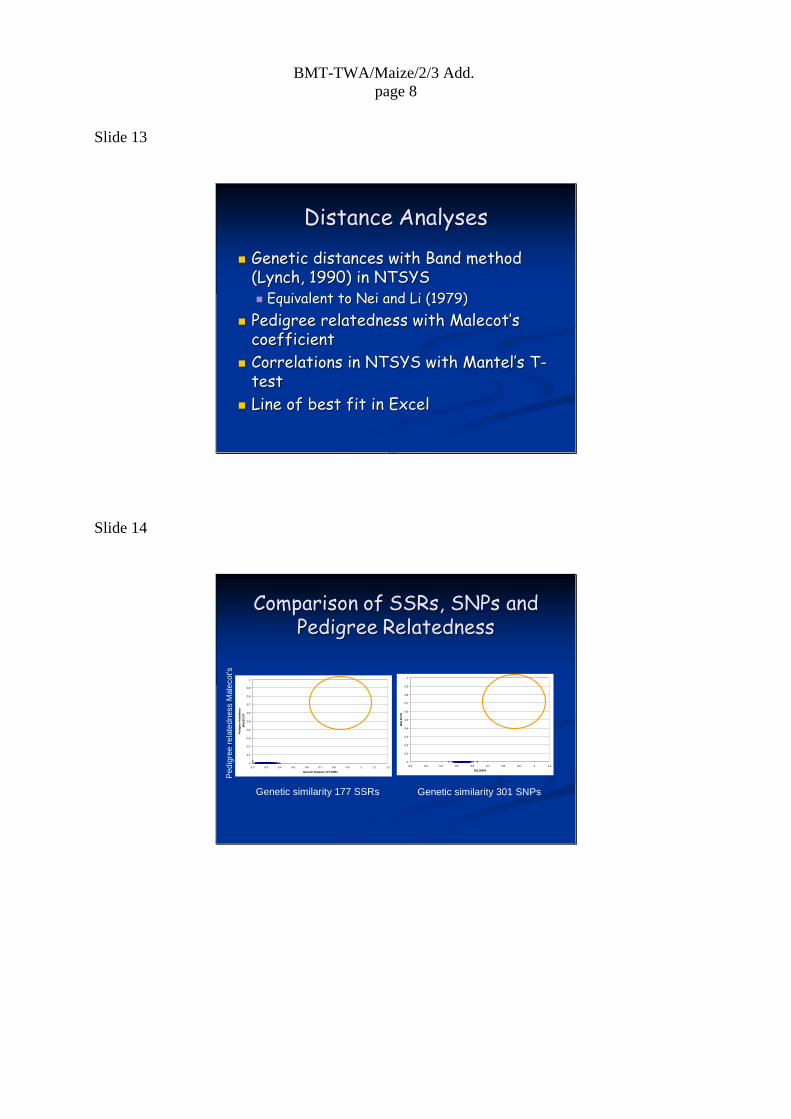
DistanceDistance AnalysesAnalyses
Genetic distances with Band method Genetic distances with Band method (Lynch, 1990) in NTSYS(Lynch, 1990) in NTSYS
Equivalent to Equivalent to NeiNei and Li (1979)and Li (1979)Pedigree relatedness with Pedigree relatedness with MalecotMalecot’’sscoefficientcoefficientCorrelations in NTSYS with MantelCorrelations in NTSYS with Mantel’’s Ts T--testtestLine of best fit in ExcelLine of best fit in Excel
Slide 14
ComparisonComparison ofof SSRs, SNPs andSSRs, SNPs andPedigreePedigree RelatednessRelatedness
0
0.1
0.2
0.3
0.4
0.5
0.6
0.7
0.8
0.9
1
0.2 0.3 0.4 0.5 0.6 0.7 0.8 0.9 1 1.1 1.2
Genetic Distance 177 SSRs
Pedi
gree
Rel
ated
ness
MA
LEC
OT
Genetic similarity 177 SSRs
Ped
igre
e re
late
dnes
s M
alec
ot’s
0
0.1
0.2
0.3
0.4
0.5
0.6
0.7
0.8
0.9
1
0.2 0.3 0.4 0.5 0.6 0.7 0.8 0.9 1 1.1
301 SNPS
MA
LEC
OT
Genetic similarity 301 SNPs

BMT-TWA/Maize/2/3 Add. page 9
Slide 15
R values for Correlations between R values for Correlations between SSRSSR andand SNP Marker SetsSNP Marker Sets
SSRSSR--177177
SNPSNP--301301
SNPSNP--674674
SSRSSR--314314
SSRSSR--SEPROSEPROMAMA--9090
SNPSNP--212212SNPSNP--301301SNPSNP--674674SSRSSR--177177SSRSSR--314314
Slide 16
R values for Correlations between R values for Correlations between SSRSSR andand SNP Marker SetsSNP Marker Sets
SSRSSR--177177
SNPSNP--301301
SNPSNP--674674
0.990.99SSRSSR--314314
0.930.930.940.94SSRSSR--SEPROSEPROMAMA--9090
SNPSNP--212212SNPSNP--301301SNPSNP--674674SSRSSR--177177SSRSSR--314314
BMT-TWA/Maize/2/3 Add. page 10
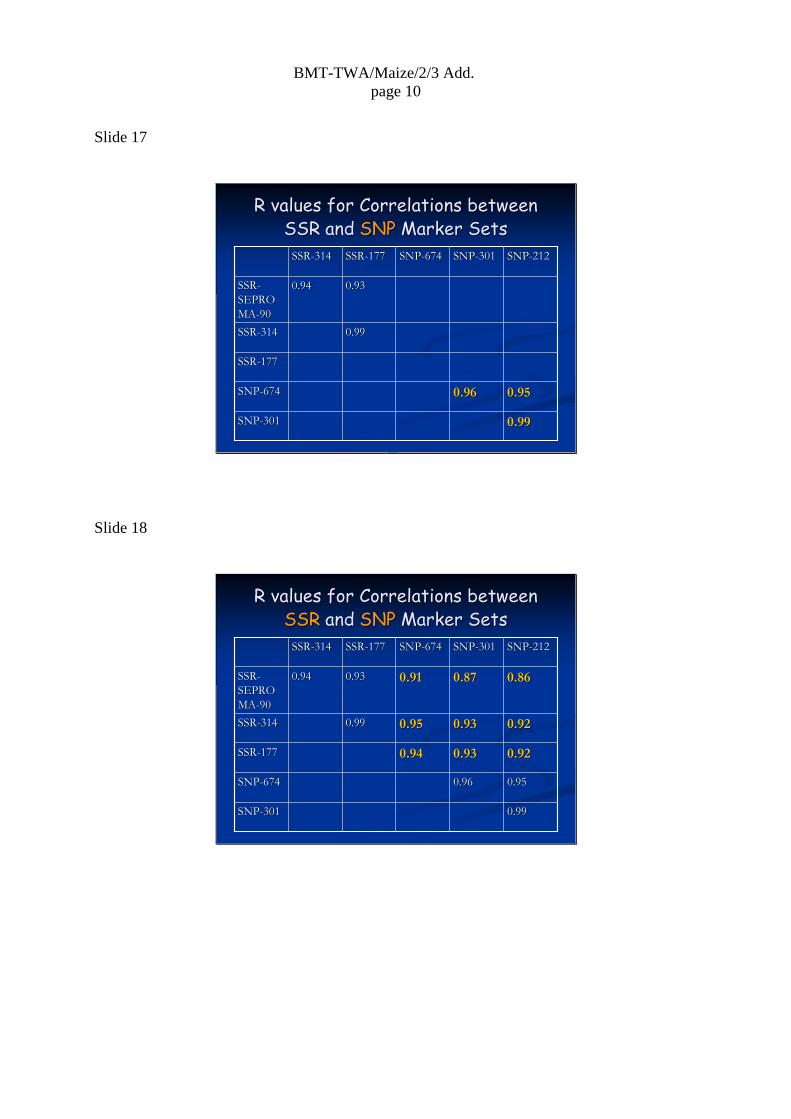
Slide 17
R values for Correlations between R values for Correlations between SSRSSR andand SNPSNP Marker SetsMarker Sets
SSRSSR--177177
0.990.99SNPSNP--301301
0.950.950.960.96SNPSNP--674674
0.990.99SSRSSR--314314
0.930.930.940.94SSRSSR--SEPROSEPROMAMA--9090
SNPSNP--212212SNPSNP--301301SNPSNP--674674SSRSSR--177177SSRSSR--314314
Slide 18
R values for Correlations between R values for Correlations between SSRSSR andand SNPSNP Marker SetsMarker Sets
0.920.920.930.930.940.94SSRSSR--177177
0.990.99SNPSNP--301301
0.950.950.960.96SNPSNP--674674
0.920.920.930.930.950.950.990.99SSRSSR--314314
0.860.860.870.870.910.910.930.930.940.94SSRSSR--SEPROSEPROMAMA--9090
SNPSNP--212212SNPSNP--301301SNPSNP--674674SSRSSR--177177SSRSSR--314314
BMT-TWA/Maize/2/3 Add. page 11
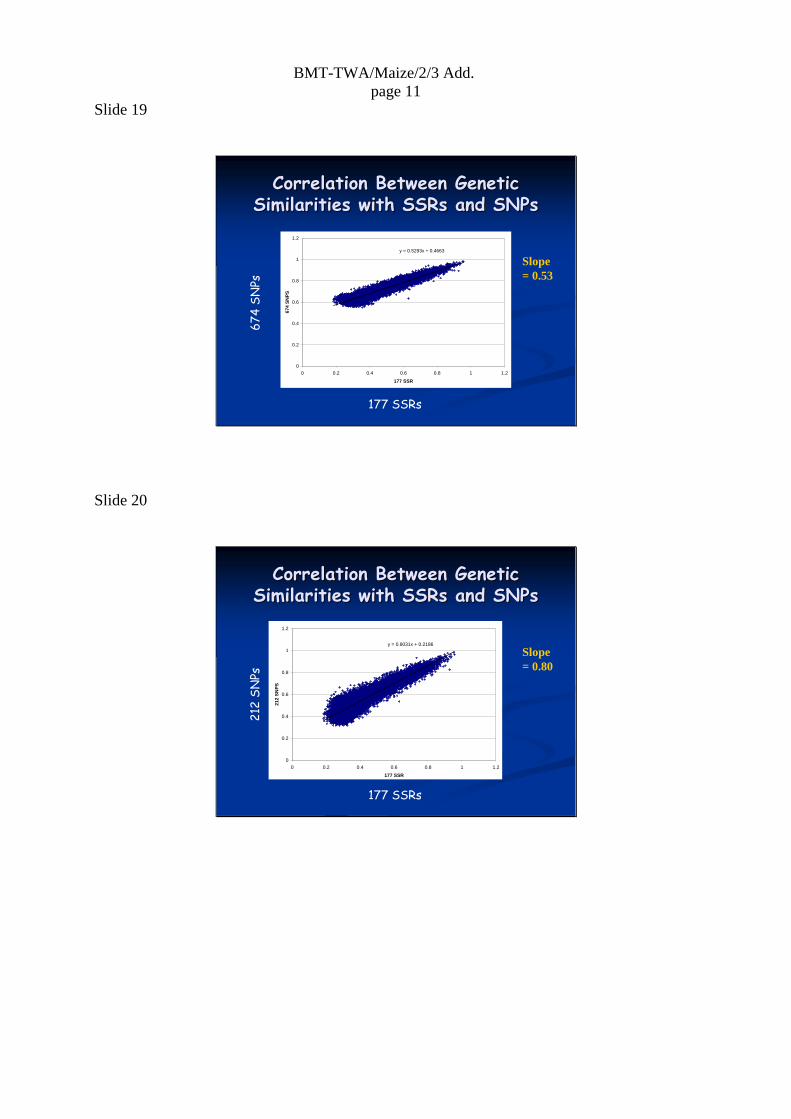
Slide 19
Correlation Between Genetic Correlation Between Genetic Similarities with SSRs and SNPsSimilarities with SSRs and SNPs
y = 0.5293x + 0.4663
0
0.2
0.4
0.6
0.8
1
1.2
0 0.2 0.4 0.6 0.8 1 1.2
177 SSR
674
SNPS
674
SNPs
177 SSRs
Slope = 0.53
Slide 20
Correlation Between Genetic Correlation Between Genetic Similarities with SSRs and SNPsSimilarities with SSRs and SNPs
212
SNPs
177 SSRs
Slope = 0.80
y = 0.8031x + 0.2186
0
0.2
0.4
0.6
0.8
1
1.2
0 0.2 0.4 0.6 0.8 1 1.2
177 SSR
212
SNPS

BMT-TWA/Maize/2/3 Add. page 12
Slide 21
Equivalent Thresholds for SNPs Equivalent Thresholds for SNPs Using Equation for Line of Best FitUsing Equation for Line of Best Fit
212 SNPS 301 SNPS 674 SNPS 1100.00% 102.12% 100.99% 99.85%99.50% 101.69% 100.58% 99.56%92.00% 95.16% 94.42% 95.22%91.50% 94.73% 94.01% 94.93%91.00% 94.29% 93.59% 94.64%90.50% 93.86% 93.18% 94.35%90.00% 93.42% 92.77% 94.06%89.50% 92.99% 92.36% 93.77%89.00% 92.55% 91.95% 93.48%88.50% 92.12% 91.54% 93.19%88.00% 91.68% 91.13% 92.90%87.50% 91.25% 90.72% 92.61%87.00% 90.81% 90.31% 92.32%86.50% 90.38% 89.90% 92.03%86.00% 89.94% 89.49% 91.74%85.50% 89.51% 89.08% 91.45%85.00% 89.07% 88.66% 91.16%84.50% 88.64% 88.25% 90.87%84.00% 88.20% 87.84% 90.58%83.50% 87.77% 87.43% 90.29%83.00% 87.34% 87.02% 90.00%82.50% 86.90% 86.61% 89.71%82.00% 86.47% 86.20% 89.42%81.50% 86.03% 85.79% 89.13%81.00% 85.60% 85.38% 88.85%80.50% 85.16% 84.97% 88.56%
314 SSR % similarity Level
Slide 22
Equivalent Thresholds for SNPs Equivalent Thresholds for SNPs Using Equation for Line of Best FitUsing Equation for Line of Best Fit
93-9490
87-9082.5
SNP threshold % SNP threshold % similaritysimilarity
SSR threshold % SSR threshold % similaritysimilarity
BMT-TWA/Maize/2/3 Add. page 13
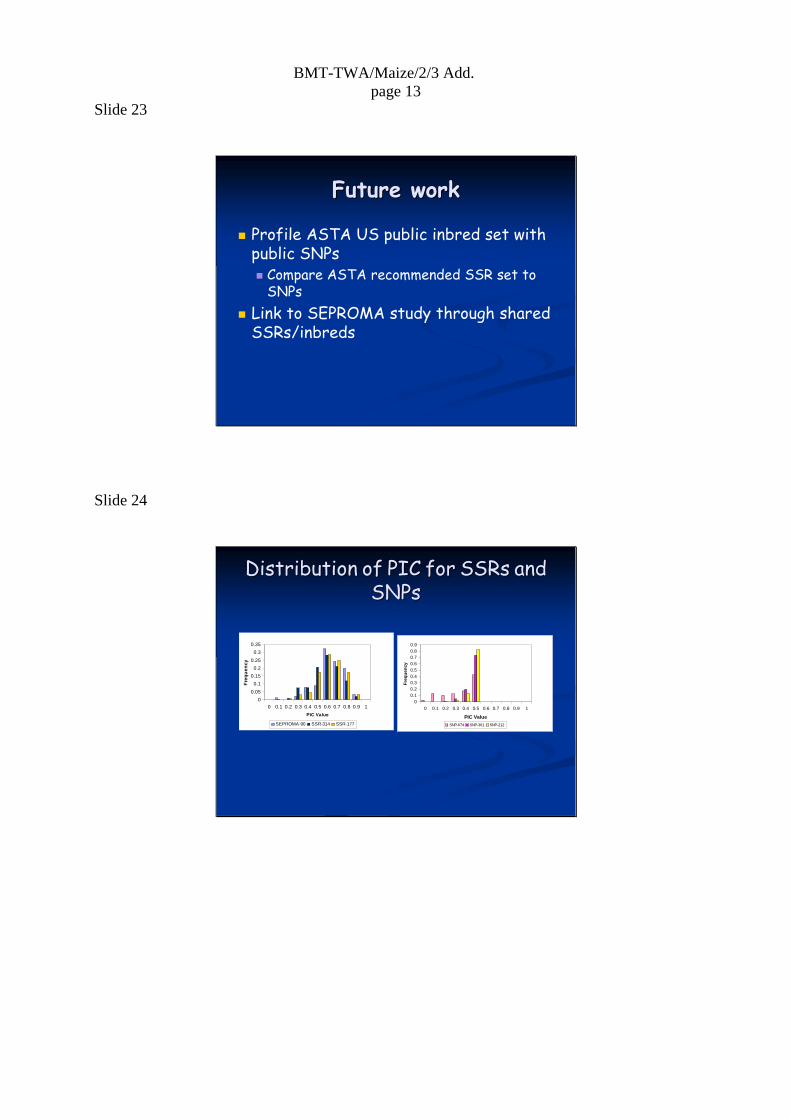
Slide 23
Future workFuture work
Profile ASTA US public inbred set with public SNPs
Compare ASTA recommended SSR set to SNPs
Link to SEPROMA study through shared SSRs/inbreds
Slide 24
DistributionDistribution ofof PICPIC forfor SSRsSSRs andandSNPsSNPs
00.05
0.10.15
0.20.25
0.30.35
0 0.1 0.2 0.3 0.4 0.5 0.6 0.7 0.8 0.9 1PIC Value
Freq
uenc
y
SEPROMA-90 SSR-314 SSR-177
00.10.20.30.40.50.60.70.80.9
0 0.1 0.2 0.3 0.4 0.5 0.6 0.7 0.8 0.9 1
PIC Value
Freq
uenc
y
SNP-674 SNP-301 SNP-212
BMT-TWA/Maize/2/3 Add. page 14
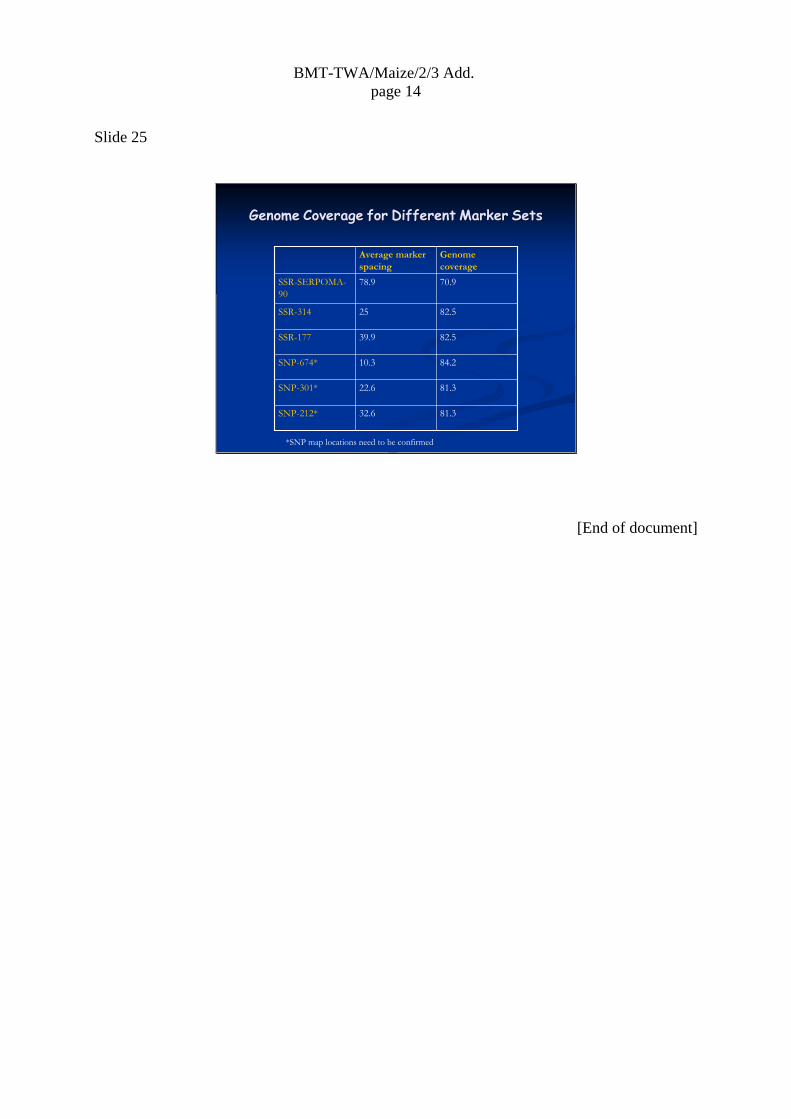
Slide 25
GenomeGenome CoverageCoverage forfor DifferentDifferent MarkerMarker SetsSets
81.332.6SNP-212*
81.322.6SNP-301*
84.210.3SNP-674*
82.539.9SSR-177
82.525SSR-314
70.978.9SSR-SERPOMA-90
Genome coverage
Average marker spacing
*SNP map locations need to be confirmed
[End of document]