Embed Size (px)
Citation preview

8/14/2013
1
Ad Hoc Committee on Student
Assignment
August 14, 2013
1
Presentation Outline
• Revising areas of the city with the lowest
average test scores (CTIP1)
• Demographic Trends and Enrollment Forecasts
• Middle School Feeders for Bryant and Webster
• Enrollment Update
• Future Meetings
2
8/14/2013
2
REVISING CTIP1
Areas of the City With the Lowest Average Test Scores
3
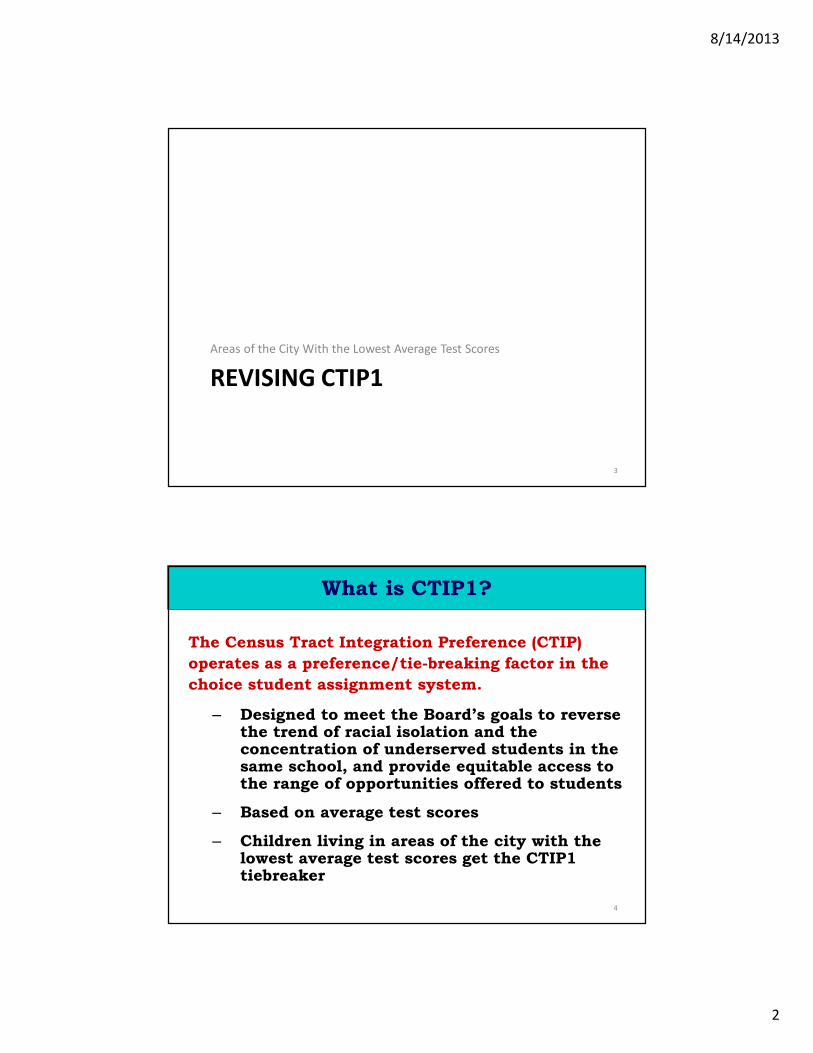
The Census Tract Integration Preference (CTIP)
operates as a preference/tie-breaking factor in the
choice student assignment system.
– Designed to meet the Board’s goals to reverse the trend of racial isolation and the concentration of underserved students in the same school, and provide equitable access to the range of opportunities offered to students
– Based on average test scores
– Children living in areas of the city with the lowest average test scores get the CTIP1 tiebreaker
What is CTIP1?
4

8/14/2013
3
Racial/ethnic breakdown of K/6/9 students in
2012-13 who received the CTIP1 tie-breaker
Analysis of impact included in two annual reports
– 2012-13 SY – pages 23-36
– 2011-12 SY – pages 35-44
What is CTIP1?
5
African
American
24%
Chinese
9%
Latino
44%
Other
Asian
6%
Other
12%
White
5%
Always recognized that CTIP classifications would have to be reviewed as additional test score data became available.
We have concluded that the CTIP1 areas in use 2010-13 should be modified a bit (but not much):
– To take advantage of the more granular Census 2010 tract geography, and
– To account for the fact that students in one CTIP1 area have improved test scores substantially more than in other areas.
Updating CTIP1 Areas
6

8/14/2013
4
The number of Census tracts in San Francisco increased from 176 in 2000 to 197 in 2010.
Most of the “new” tracts are subdivisions of 2000 tracts that had large populations
– The new tracts tend to be more homogeneous, permitting us to group students with similar characteristics (such as average test scores).
– There were only minor changes in outer tract boundaries.
For CTIP analyses, we combined some 2010 tracts to increase student numbers and to reduce random variation in average test scores from year to year.
Census 2010 Tract Geography
7
Tract 230.03
Citywide, test scores have improved. One CTIP1
area’s test scores improved a lot, moving the
tract out of the CTIP1 category
We should continue to monitor these trends.
Average CST-ELA Score
CTIP area 2006-10 2011-12 Improvement
CTIP1 319 332 14
CTIP2 340 351 11
CTIP3 350 361 10
CTIP4 369 381 12
CTIP5 384 395 12
All areas 353 365 12
Tract 230.03 333 352 18
8

8/14/2013
5
Changes in numbers of residents of all CTIP
areas
Changes in number of K-12 residents of each 2013 CTIP area, fall 2006 - fall 2012
Before CTIP used CTIP used Average students/year
CTIP Area 2006 2007 2008 2009 2010 2011 2012 pre-CTIP under CTIP Change
CTIP1 10,715 10,334 10,266 10,350 10,431 10,262 10,247 10,419 10,255 -165
CTIP2 9,819 9,833 9,937 9,957 10,157 9,875 9,861 9,941 9,868 -73
CTIP3 10,187 10,216 10,458 10,630 10,755 10,746 10,772 10,449 10,759 310
CTIP4 10,542 10,299 10,170 10,098 9,931 9,919 9,870 10,208 9,895 -314
CTIP5 10,340 10,214 10,293 10,541 10,201 10,419 10,595 10,318 10,507 189
Total 51,603 50,896 51,124 51,576 51,475 51,221 51,345 51,335 51,283 -52
• Numbers of residents of CTIP 4, 1, and 2 shrunk
• Numbers of residents of CTIP 3 and 5 have grown
9
0
500
1,000
1,500
2,000
2,500
3,000
3,500
4,000
4,500
5,000
African
American
Chinese Other
Asian
Hispanic Samoan White Other
Av
era
ge
nu
mb
er
of
K-1
2 r
esi
de
nts
pe
r y
ea
r, C
TIP
1 a
rea
s
before CTIP1 (fall 2006-fall 2010)
CTIP1 used (fall 2011 & fall 2012)
Minor changes in
the resident
student
racial/ethnic mix
Changes in ethnic mix of residents of all CTIP1 areas
10

8/14/2013
6
11
12

8/14/2013
7
Detail
13
Detail (northern areas that are changing)
14

8/14/2013
8
Detail (southern area that is changing)
15
Tract 230.03
Questions explored about the Southern Area
that is moving from CTIP1 to CTIP2
Have enrollment patterns changed?
Has the number of students living in this area increased or decreased?
Are there changes in the racial/ethnic mix of students living in this area?
16

8/14/2013
9
Southern Area: Enrollment Patterns
Number enrolled in schools:
School Year
Number of
K+6+9 Students
Bayview
Zone
Mission
Zone Intensive Strategic Benchmark Challenge Other
2009-10 127 27 5 19 20 26 17 13
2010-11 129 21 5 19 26 25 21 12
2011-12 120 9 1 17 14 43 26 10
2012-13 135 7 4 24 21 42 24 13
Percentages enrolled in schools:
2009-10 21% 4% 15% 16% 20% 13% 10%
2010-11 16% 4% 15% 20% 19% 16% 9%
2011-12 8% 1% 14% 12% 36% 22% 8%
2012-13 5% 3% 18% 16% 31% 18% 10%
Tract 230.03
The share of this area’s K/6/9 residents enrolled in Bayview and Mission Zone schools dropped dramatically beginning in Fall 2011, while the shares in some other categories (especially Benchmark) have grown. 17
Southern Area: Number of Students
Tract 230.03
GRADE 2006 2007 2008 2009 2010 2011 2012
K 47 44 42 37 51 35 42
1 49 57 45 36 33 61 32
2 47 49 56 47 38 31 60
3 32 46 47 51 41 43 27
4 37 35 45 47 52 41 38
5 36 39 33 44 43 51 42
6 48 41 36 32 38 42 53
7 56 56 39 33 31 43 47
8 50 52 55 41 38 32 40
9 78 74 68 58 40 43 40
10 50 53 51 56 47 44 46
11 39 39 44 42 41 46 46
12 36 39 33 39 38 43 46
Total 605 624 594 563 531 555 559
18

8/14/2013
10
Southern Area: Race/Ethnic Mix of Students
Tract 230.03
Before CTIP1 CTIP1 Comparison
Group 2006 2007 2008 2009 2010 2011 2012
fall 2009 +
fall 2010
fall 2011 +
fall 2012
African American 192 173 162 135 116 107 87 23% 17%
Chinese 194 195 192 183 184 193 208 34% 36%
Other Asian 40 37 43 44 48 50 52 8% 9%
Hispanic 123 152 148 151 138 163 174 26% 30%
Samoan 9 9 8 8 5 3 2 1% 0%
White 9 10 8 10 12 10 9 2% 2%
Other 38 48 33 32 28 29 27 5% 5%
Total 605 624 594 563 531 555 559 100% 100%
The share of this area’s residents that is African American has been falling over time, while the Hispanic share has been growing.
19
• Update CTIP areas for 2014-15 enrollment cycle
– Update online maps and enrollment systems
– Include information in the Enrollment Guide for the 2014-15 school year
• Continue to monitor closely and think intentionally about ways to achieve the Board’s policy goals
Next Steps
20

8/14/2013
11
ENROLLMENT FORECASTS
Demographic Trends and
21
San Francisco Unified School District
Demographic Trends and
Enrollment Forecasts
Shelley Lapkoff, Ph.D.
Lapkoff & Gobalet Demographic
Research, Inc.
www.demographers.com
August 14, 2013
22
90% interval
67% interval
Forecast avg
Actual
0
10,000
20,000
30,000
40,000
50,000
60,000
70,000
80,000
1981 1985 1989 1993 1997 2001 2005 2009 2013 2017 2021
Num
ber of Stu
dents
Year
Stochastic Forecast of Total Enrollment 2013-2021Assuming constant births at 2011 level
8/14/2013
12
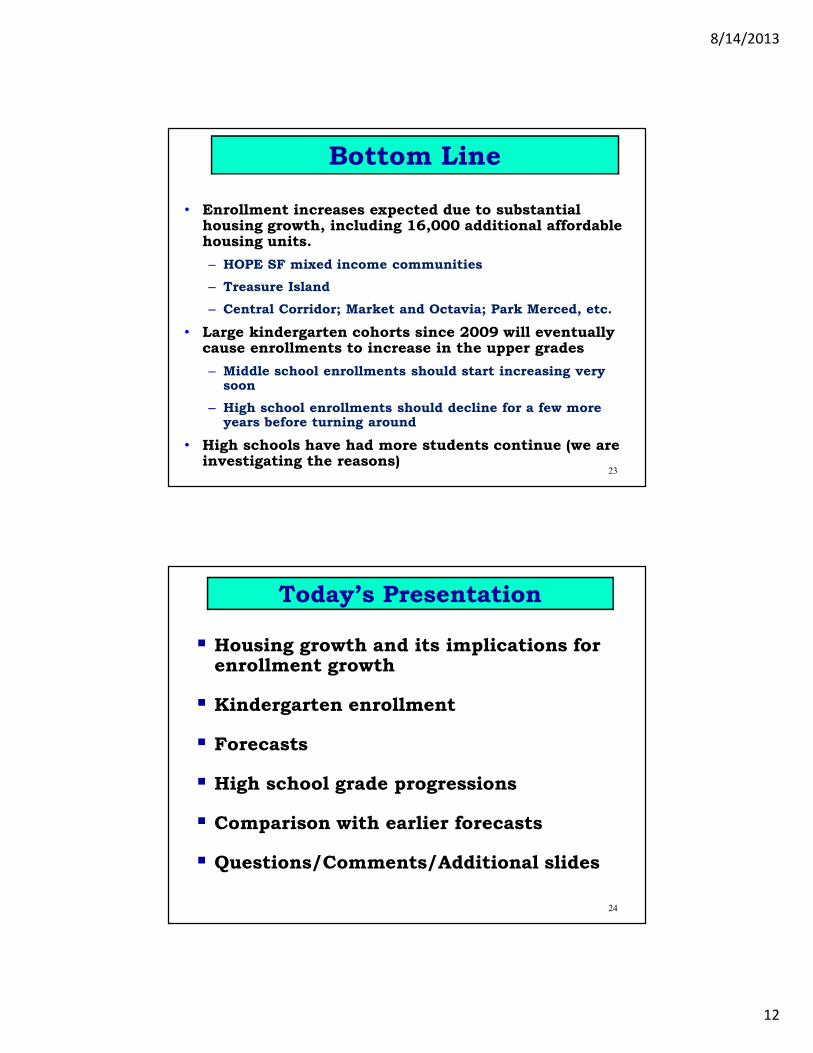
Bottom Line
• Enrollment increases expected due to substantial housing growth, including 16,000 additional affordable housing units.
– HOPE SF mixed income communities
– Treasure Island
– Central Corridor; Market and Octavia; Park Merced, etc.
• Large kindergarten cohorts since 2009 will eventually cause enrollments to increase in the upper grades
– Middle school enrollments should start increasing very soon
– High school enrollments should decline for a few more years before turning around
• High schools have had more students continue (we are investigating the reasons)
23
Today’s Presentation
� Housing growth and its implications for enrollment growth
� Kindergarten enrollment
� Forecasts
� High school grade progressions
� Comparison with earlier forecasts
� Questions/Comments/Additional slides
24

8/14/2013
13
Housing Growth
• Housing growth slowed in recent years, due to the recession
• Planners anticipate large numbers of new units in the next few years as developers “catch up”
• In the long run, a large amount of housing is anticipated
– More than 70,000 units have been suggested, many large projects already approved
– When built, the City’s housing inventory will grow by about 25 percent
25
26
0
1,000
2,000
3,000
4,000
5,000
6,000
7,000
8,000
9,000
10,000
20
13
20
14
20
15
20
16
20
17
20
18
20
19
20
20
20
21
20
22
20
23
20
24
20
25
20
26
20
27
20
28
20
29
20
30
20
31
20
32
20
33
20
34
20
35
20
36
20
37
20
38
20
39
Nu
mb
er
of
Stu
de
nts
Pro
ject
ed
Year
Projected Enrollments from Major New Housing
Develoments

8/14/2013
14
How we forecast the number of
students from new housing
• Enrollments from new housing equal the number of housing units multiplied by the “student yield,” or the average number of expected students per housing unit.
• Student yields vary by the characteristics of the housing, especially whether the housing is below-market-rate (BMR), also called “affordable.”
27
Name Completion Unit Type
Total
Units
Affordable
Units 2006 2007 2008 2009 2010 2011 2012
2012
Yield
2012 Yield in Affordable
Units, if all students live
in the affordable units
Rich Sorro Commons 2002 rental 100 100 58 52 57 63 54 54 50 0.50 0.50
Beacon 2004 condos 595 27 3 7 6 8 6 10 9 0.02 0.33
Mission Bay Apts - Crescent Cove 2007 rental 236 236 0 25 39 45 44 46 51 0.22 0.22
SFRA Affordable Home Ownership 2009 condos 131 131 0 0 0 0 9 24 28 0.21 0.21
Avalon II 2006 rental 313 19 0 3 3 2 3 4 3 0.01 0.16
Avalon I 2003 rental 250 21 3 0 1 1 2 4 1 0.00 0.05
Campus Housing 2005 rental 431 431 0 3 4 9 12 13 8 0.02 0.02
Signature II-235 Berry Street 2006 condos 99 0 0 0 0 0 1 1 2 0.02 no affordable units
Park Terrace 2007 condos 110 0 0 0 0 1 1 1 1 0.01 no affordable units
Strata - Urban Housing Group Apts 2009 rental 192 0 0 0 0 0 3 1 1 0.01 no affordable units
Radiance 2008 condos 99 0 0 0 0 0 0 0 2 0.02 no affordable units
Glassworks 2003 condos 39 0 1 1 1 0 0 0 0 0.00 no affordable units
Channel Park (Signature I) - 255 Berry St 2004 condos 100 0 0 0 1 1 0 0 0 0.00 no affordable units
355 Berry Street-Edgewater Apts 2007 rental 193 0 0 0 0 0 0 0 0 0.00 no affordable units
Arterra 2008 condos 269 0 0 0 0 1 0 0 0 0.00 no affordable units
Madrone at Mission Bay by BOSA 2012 condos 329 0 0 0 0 0 0 0 0 0.00 no affordable units
Avalon III 2009 260 0 0 0 0 2 2 0 0 0.00 no affordable units
Mission Creek Senior 2006 n.a. 140 n.a. n.a. no affordable units
Total 3,886 965 65 91 112 133 137 158 156 0.04 0.16
Total, excluding Campus Housing 3,455 534 65 88 108 124 125 145 148 0.28
K-12 Enrollments
Mission Bay Projects
Example of Student Yields, Mission Bay Area
28

8/14/2013
15
Housing Forecast
29
All Units Affordable Units # Students Expected
HOPE SF Projects
Bayview/Hunters Pt/Candlestick 11,690 4,320 2,532
Sunnydale 915 307 138
Potrero 910 307 155
Westside Courts n.a. n.a. n.a.
Treasure Island and Yerba Buena Is 7,387 1,732 1,078
Central Corridor 11,715 2,343 586
Market and Octavia 5,960 1,192 566
Park Merced 5,679 1,420 525
Mission Bay 3,411 46 515
Executive Park 1,600 192 448
Transbay 3,400 927 472
Visitacion Valley/Schlage Lock 1,250 313 391
Eastern Neighborhoods 9,000 1,350 304
Transit Center District 1,200 327 167
Western SOMA 2,900 580 145
Balboa Park Station 1,780 445 111
5M Project 750 188 47
Rincon Hill 2,200 266 67
Pier 70 Area 1,000 200 50
Mission Rock 800 200 50
Total 73,546 16,655 8,346
Housing Unit Forecast
30

8/14/2013
16
Kindergarten Enrollment
• Between 2000 and 2007, kindergarten
enrollment was particularly low. These cohorts
are now in 5th – 12th grades. Since 2009,
kindergarten enrollments have grown. As these
larger cohorts progress through the grades, they
will increase enrollments -- first in the
elementary schools, then in the middle schools,
and finally in the high schools.
• We expect the Fall 2013 kindergarten class to be
large, followed by smaller classes in Fall 2014
through Fall 2016.
31
0
1,000
2,000
3,000
4,000
5,000
6,000
1981
1982
1983
1984
1985
1986
1987
1988
1989
1990
1991
1992
1993
1994
1995
1996
1997
1998
1999
2000
2001
2002
2003
2004
2005
2006
2007
2008
2009
2010
2011
2012
Num
ber
of S
tudents
Year
Kindergarten Enrollment, 1981 - 2012
32

8/14/2013
17
0
1,000
2,000
3,000
4,000
5,000
6,000
1981
1982
1983
1984
1985
1986
1987
1988
1989
1990
1991
1992
1993
1994
1995
1996
1997
1998
1999
2000
2001
2002
2003
2004
2005
2006
2007
2008
2009
2010
2011
2012
Num
ber
of S
tudents
Year
Kindergarten Enrollment, 1981 - 2012
K
87
65
4
3 2 1
12 11109
Initial cohort size of students in current grade
33
Stochastic Forecasts
• Assumed housing growth as indicated earlier
• Ran 1,000 simulations picking different historical
changes in grade progressions and kindergarten-
to-birth ratios
• Applied stochastic processes when forecasting
enrollment (a new application)
• The Median of the stochastic forecasts is very
similar to results using the more traditional
forecasting method
34

8/14/2013
18
35
90% interval
67% interval
Forecast avg
Actual
0
10,000
20,000
30,000
40,000
50,000
60,000
70,000
80,000
1981 1985 1989 1993 1997 2001 2005 2009 2013 2017 2021
Num
ber of Stu
dents
Year
Stochastic Forecast of Total Enrollment 2013-2021Assuming constant births at 2011 level
36
90% interval
67% interval
Forecast avg
Actual
0
5,000
10,000
15,000
20,000
25,000
30,000
35,000
1981
1983
1985
1987
1989
1991
1993
1995
1997
1999
2001
2003
2005
2007
2009
2011
2013
2015
2017
Num
ber of Stu
dents
Year
Stochastic Forecast of Elementary School Enrollment 2013-2017

8/14/2013
19
37
90% interval
67% interval
Forecast avg
Actual
0
2,000
4,000
6,000
8,000
10,000
12,000
14,000
16,000
18,000
20,000
1981
1983
1985
1987
1989
1991
1993
1995
1997
1999
2001
2003
2005
2007
2009
2011
2013
2015
2017
2019
2021
Num
ber of S
tudents
Year
Stochastic Forecast of Middle-School Enrollment 2013-2021
Forecast of middle school enrollments
2012 2013 2014 2015 2016 2017 2018 2019 2020 2021
5% 11,516 11,524 11,642 11,717 11,665 11,526 11,315 11,116 10,765 10,370
16.5% 11,516 11,769 11,936 12,195 12,303 12,293 12,203 12,191 11,999 11,737
50% (median) 11,516 11,833 12,260 12,825 13,191 13,438 13,604 13,846 13,895 13,857
83.5% 11,516 12,037 12,605 13,379 14,022 14,566 15,072 15,734 16,173 16,541
95% 11,516 12,165 12,807 13,709 14,507 15,283 16,040 17,045 17,814 18,565
38
90% interval
67% interval
Forecast avg
Actual
0
5,000
10,000
15,000
20,000
25,000
30,000
35,000
1981
1983
1985
1987
1989
1991
1993
1995
1997
1999
2001
2003
2005
2007
2009
2011
2013
2015
2017
2019
2021
2023
2025
Num
ber
of Stu
dents
Year
Stochastic Forecast of High-School Enrollment 2013-2025
8/14/2013
20
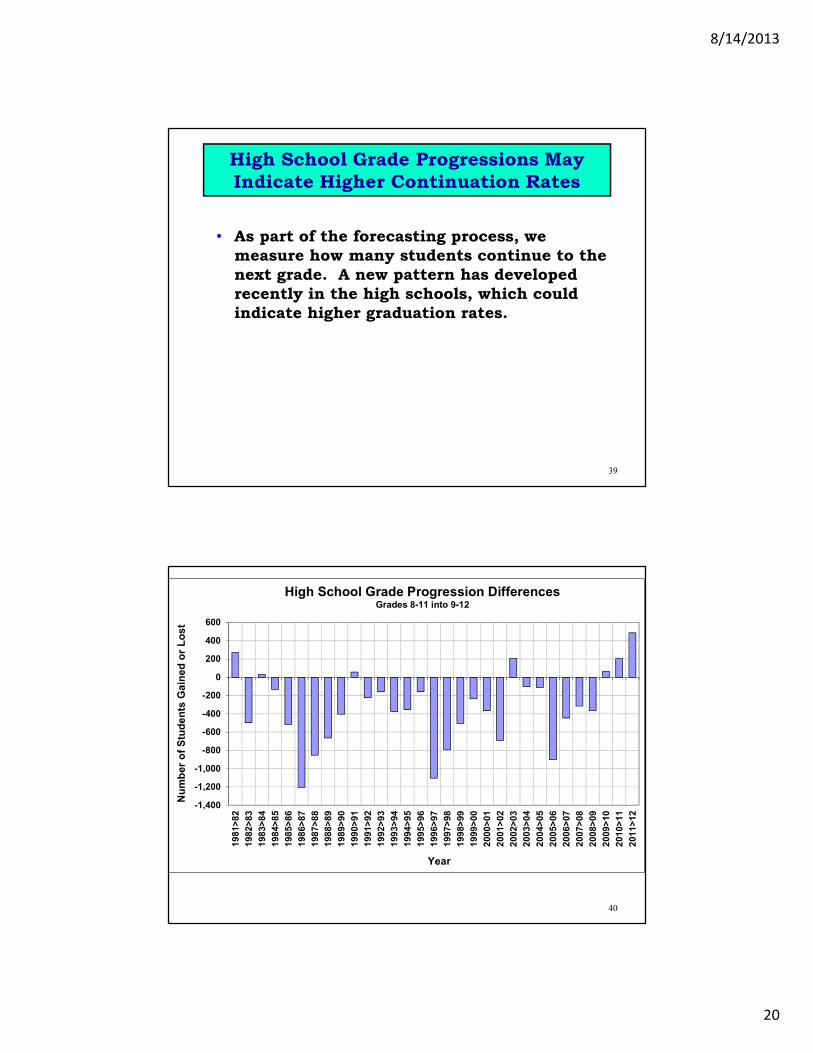
High School Grade Progressions May
Indicate Higher Continuation Rates
• As part of the forecasting process, we
measure how many students continue to the
next grade. A new pattern has developed
recently in the high schools, which could
indicate higher graduation rates.
39
-1,400
-1,200
-1,000
-800
-600
-400
-200
0
200
400
600
1981>82
1982>83
1983>84
1984>85
1985>86
1986>87
1987>88
1988>89
1989>90
1990>91
1991>92
1992>93
1993>94
1994>95
1995>96
1996>97
1997>98
1998>99
1999>00
2000>01
2001>02
2002>03
2003>04
2004>05
2005>06
2006>07
2007>08
2008>09
2009>10
2010>11
2011>12
High School Grade Progression DifferencesGrades 8-11 into 9-12
Year
Num
ber
of S
tudents
Gain
ed o
r Lost
40

8/14/2013
21
Repeaters 2008>09 2009>10 2010>11 2011>2012
9>9 7% 6% 4% 4%
10>10 7% 6% 4% 5%
11>11 3% 4% 3% 4%
12>12 5% 4% 4% 5%
Denominator is same grade, prior year
continuing from
previous grade 2008>09 2009>10 2010>11 2011>2012
8>9 88% 89% 88% 89%
9>10 77% 83% 85% 87%
10>11 75% 80% 81% 84%
11>12 80% 82% 84% 86%
Left 2008>09 2009>10 2010>11 2011>2012
8>9 12% 11% 12% 11%
9>10 16% 11% 10% 10%
10>11 18% 14% 15% 11%
11>12 17% 14% 13% 10%
New (excludes
repeaters) 2008>09 2009>10 2010>11 2011>12
8>9 23% 26% 26% 21%
9>10 7% 11% 10% 10%
10>11 12% 9% 7% 7%
11>12 11% 8% 7% 8%
Denominator is prior grade, prior year41
Fewer
students
repeating
grades
Fewer
students
leaving the
District
Comparison with earlier forecast:
Actual Fall 2012 enrollments were very
similar to 2009 forecasts
42
Actuals 2009 Forecast
Difference:
Forecast - Actuals Percent Difference
K to 5 27,318 27,416 98 0.4%
6 to 8 11,516 11,520 4 0.0%
Comparison of 2009 Forecast with Actuals

8/14/2013
22
Comparison with 2009 forecast:
High school difficult to evaluate because of
variations in reported Five Keys enrollments
43
Year Enrollment
2004 226
2005 223
2006 1,042
2007 239
2008 549
2009 7
2010 642
2011 698
2012 1,058
Five KeysEvaluation of High School Enrollment Forecasts
2009 Forecast, including Five Keys 18,230
2012 Actual, excluding Five Keys 17,867
Difference: Forecast - Actual 363
2009 Forecast, excluding Five Keys 17,172
2012 Actual, excluding Five Keys 17,867
Difference: Forecast - Actual -695
2009 Forecast and New Forecast
• Both forecasts show future enrollment increases
• 2009 forecast shows higher enrollments in 2020
for elementary and middle school than new
forecast because:
– Housing construction is delayed
– More housing growth expected now, but smaller
percentage of affordable units
– Lower student yields assumed than earlier forecast
• New forecast: higher 2020 high school enrollments
– Higher high school grade progressions cause high school
forecast to be above our 2009 forecast levels
44

8/14/2013
23
Final Considerations
• Much of the City’s housing growth will occur after
2025. There will be enrollment growth beyond the
forecasted period.
• Virtually all of the enrollment gains from new
housing will be from affordable units.
• The forecasts are highly sensitive to the student
yield assumed for the new housing.
• Further research is recommended on the impact of
high school students staying in District schools
longer.
45
Additional Slides for Q & A
(Appendix)
46

8/14/2013
24
BRYANT AND WEBSTER
Middle School Feeders for
47
Outline
• Context for Change
• Superintendent’s Recommendations
• Next Steps
48

8/14/2013
25
Context for Change
• ISA transitioning from 6-12 to 9-12 school
– ISA is the middle school feeder for Bryant and
Webster elementary schools
– Need to identify new middle school feeder for 5th
graders transitioning to 6th grade in fall 2014 (i.e.,
by fall 2013)
49
Superintendent’s Recommendations
• Enrollment forecasts being reviewed for first time tonight
• Need to digest enrollment forecasts and incorporate into an exploration of all factors to be considered as outlined in Board Policy P5101– current enrollment patterns and expected future
enrollment changes
– balancing the size of enrollment at various schools
– the diversity of enrollment in various schools
– the availability of facilities
– the locations of programs and schools
– the coherence of elementary to middle school pathways
50

8/14/2013
26
Superintendent’s Recommendations
1. Immediate Term
– For the 2014-15 school year, give 5th graders
exiting Bryant and Webster a middle school tie-
breaker to attend the school listed as a first
choice on their application form (one year only)
51
Superintendent’s Recommendations
2. Short-Term by spring 2014 to go into effect starting with the 2015-16 SY
– Evaluate the current portfolio of middle schools
– Identify middle school feeder for Bryant and Webster
– Identify elementary feeders for Brown middle school
3. Long-Term
– Define the portfolio of schools needed in the long-term to meet projected growths in enrollment
52
8/14/2013
27
Immediate Next Steps
2014-15 Enrollment Information
• Share information with Bryant and Webster and all stakeholders (e.g., PAC, PPS, Mission Graduates)
• Incorporate information into the enrollment materials for the 2014-15 school year (e.g., Enrollment Guide, letters to exiting 5th graders…)
Demographic Report
• Share full report with community and create opportunities for staff to discuss findings and observations with the community
53
Additional Next Steps
• Convene a staff working group to evaluate the current portfolio of middle schools and develop recommendations for the 2015-16 school year– Middle school feeder for Bryant and Webster
– Elementary feeders for Brown Middle School
• Convene a staff working group to study the implications of the enrollment forecasts and develop a long-term plan to meet the needs of the expected enrollment increases
• Develop a community engagement infrastructure to gather input and keep key stakeholders informed as staff work evolves
54

8/14/2013
28
ENROLLMENT UPDATE
2014-15 School Year
55
Complete 2013-14 Cycle
• Students who do not attend within the first 3
days of school will be withdrawn and openings
will be filled from the waiting pool.
• Waiting pool process will end on Friday, Sept.
6th
– Waiting pools will be dissolved, and a “No Transfer
Period” will be implemented.
– Requests for Spring Transfers will be accepted
beginning on September 9
56

8/14/2013
29
2014-15 Key Dates
Saturday, November 2 Public School Enrollment Fair
Tuesday, January 21 Application Deadline for March
Placement Period (Round 1)
Friday, March 14 March Placement notification letters
mailed
Friday, April 11 Application Deadline for May Placement
Period (Round 2)
Registration deadline at schools,
Appeals due
Friday, May 9 Notification for May Placement Period
Friday, May 23 Waiting pool request deadline (Round 3)
Wednesday, June 11 Available School Assignment Period-
ASAP
(formerly known as Open Enrollment)57
FUTURE MEETINGS
Ad Hoc Committee on Student Assignment
58

8/14/2013
30
September 11, 2013
• Follow-up on any open items from tonight’s
discussion
• Share and discuss findings from Stanford’s
research questions investigating how district
policies shape the distribution of students
among K12 schools in SFUSD
• Update on the Pre-K Enrollment Process
59
Appendix
Demographic Trends and
Enrollment Forecasts
Additional Slides for Q & A
60

8/14/2013
31
Housing Growth
61
Recession Effect Started in 2010
0
500
1,000
1,500
2,000
2,500
3,000
3,500
4,000
4,500
19
91
19
92
19
93
19
94
19
95
19
96
19
97
19
98
19
99
20
00
20
01
20
02
20
03
20
04
20
05
20
06
20
07
20
08
20
09
20
10
20
11
20
12
Nu
mb
er
of
Un
its
Bu
ilt
Year
Number of Housing Units Built, 1991 - 2012
62

8/14/2013
32
Existing Student Yields,
Rincon South
Total Units
Affordable
Units
Type of
Housing
Affordability
status 2006 2007 2008 2009 2010 2011 2012 Avg Yield
Affordable Yield,
assuming all students
live in affordable units
Brannan Square 240 51 condos inclusionary 20 22 18 17 19 17 14 18 0.08 0.36
Steamboat Point 108 108 apts stand-alone 19 18 19 21 19 14 11 17 0.16 0.16
South Beach Marina 414 86 apts inclusionary 6 4 7 6 6 8 6 6 0.01 0.07
Bayside Village 868 173 apts inclusionary 11 11 14 18 12 14 20 14 0.02 0.08
Rincon Center 320 64 apts inclusionary 1 1 1 2 1 0 0 1 0.00 0.01
301 Bryant 38 7 condos inclusionary 0 0 0 0 0 0 0 0 0.00 0.00
Cape Horn Warehouse 16 0 condos all market 0 0 0 0 0 0 0 0 0.00 na
Oriental Warehouse 66 0 condos all market 0 0 0 0 0 0 0 0 0.00 na
Brannan Towers 338 0 condos all market 0 1 0 2 2 2 3 1 0.00 na
One Embarcadero South 233 0 condos all market 0 0 0 1 2 3 3 1 0.01 na
Total 2641 489 57 57 59 67 61 58 57 59 0.02 0.12
Rincon South New HousingK-12 Enrollments
63
Existing Student Yields, SFHA Units
BLDG_NAME Units 2006 2007 2008 2009 2010 2011 2012 Avg Yield
Alice Griffith 254 265 276 278 247 226 204 214 0.96
Westbrook 225 193 199 191 200 228 226 211 0.92
Hunters View 148 146 149 123 136 119 114 94 0.85
Potrero Annex 137 114 105 103 98 117 133 123 0.83
Bernal Dwellings Apts (Hope VI) 160 138 124 120 125 125 122 113 0.77
Robert B. Pitts Apts. 203 120 123 132 133 160 151 154 0.68
North Beach Place (Hope VI) 341 236 232 237 234 226 201 186 0.65
Sunnydale/Velasco 785 546 455 480 498 536 535 515 0.65
Plaza East Apts (Hope VI) 193 148 130 125 120 124 104 125 0.65
Bayview Commons Apts 30 19 22 17 16 18 18 22 0.63
Alemany 164 109 90 109 107 100 98 94 0.62
Hayes Valley Apts (Hope VI) 195 130 119 108 99 109 102 108 0.57
200 Randolph St/409 Head St 26 17 16 14 14 16 13 12 0.56
Potrero Terrace 469 255 231 231 252 264 274 289 0.55
Hunters Point East/WEst 213 102 111 95 104 109 115 128 0.51
Valencia Gardens (Hope VI) 260 40 131 143 150 143 134 137 0.48
Holly Courts 118 51 48 53 55 62 54 47 0.45
Ping Yuen 234 72 64 68 63 63 67 75 0.29
Westside Courts 136 36 34 32 36 38 38 40 0.27
Ping Yuen North 194 27 25 31 35 39 39 37 0.17
430 Turk St (mainly studios) 89 6 5 4 2 2 2 2 0.04
Woodside Gardens (mainly studios) 110 2 0 0 0 0 0 0 0.00
Total 4,684 2,772 2,689 2,694 2,724 2,824 2,744 2,726 0.58
San Francisco Housing Authority Family Housing, Students and Student Yields
64

8/14/2013
33
65
SF Housing Authority
• About 2/3 of SFHA served residents live in housing via vouchers, only 1/3 live in public housing
• We do not have address information on voucher holders
66

8/14/2013
34
Monitoring Housing Growth
• Monitor the timing of individual housing developments – sometimes developers are overly optimistic
• Monitor whether the number of housing units changes
• As new housing is built, monitor the student yields to evaluate the validity of the forecast assumptions
• Monitor whether new housing projects are proposed
• Our work can provide the basis for updating information
67
Kindergarten Forecasts
68

8/14/2013
35
0
2,000
4,000
6,000
8,000
10,000
12,000
1973
1974
1975
1976
1977
1978
1979
1980
1981
1982
1983
1984
1985
1986
1987
1988
1989
1990
1991
1992
1993
1994
1995
1996
1997
1998
1999
2000
2001
2002
2003
2004
2005
2006
2007
2008
2009
2010
2011
Num
ber
of B
irth
s
Year of Birth
San Francisco County Births: 1973 - 2011
69
0
1,000
2,000
3,000
4,000
5,000
6,000
7,000
8,000
9,000
10,000
11,000
0
1,000
2,000
3,000
4,000
5,000
6,000
7,000
8,000
9,000
10,000
11,000
1981
1983
1985
1987
1989
1991
1993
1995
1997
1999
2001
2003
2005
2007
2009
2011
2013
2015
Kindgergartners
Births 5 years before
Births and Subsequent Kindergarten Enrollment 1981-2012
Year of enrollment
Num
ber
of K
inderg
art
ners
Num
ber o
f Birth
s
70
8/14/2013
36
45%
47%
49%
51%
53%
55%
57%
59%
1990
1991
1992
1993
1994
1995
1996
1997
1998
1999
2000
2001
2002
2003
2004
2005
2006
2007
2008
2009
2010
2011
2012
Year of Kindergarten Enrollment
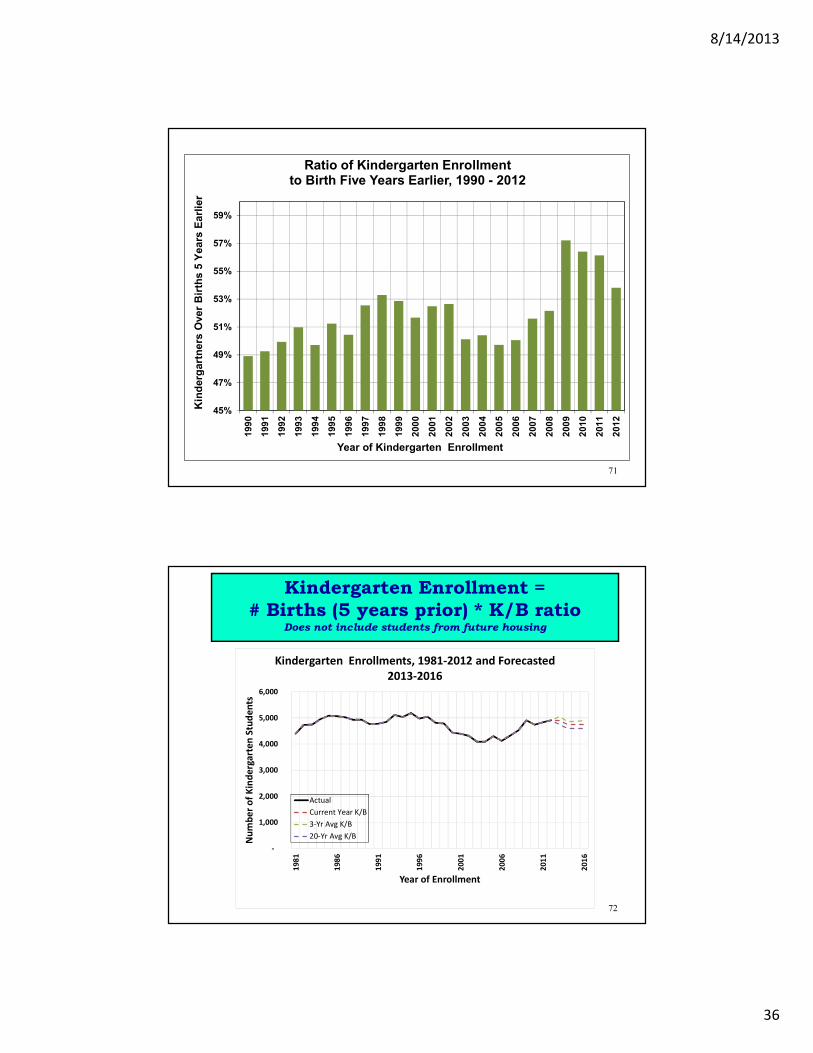
Ratio of Kindergarten Enrollmentto Birth Five Years Earlier, 1990 - 2012
Kin
derg
art
ners
Over
Bir
ths 5
Years
Earlie
r
71
Kindergarten Enrollment =
# Births (5 years prior) * K/B ratioDoes not include students from future housing
72
-
1,000
2,000
3,000
4,000
5,000
6,000
19
81
19
86
19
91
19
96
20
01
20
06
20
11
20
16
Nu
mb
er
of
Kin
de
rga
rte
n S
tud
en
ts
Year of Enrollment
Kindergarten Enrollments, 1981-2012 and Forecasted
2013-2016
Actual
Current Year K/B
3-Yr Avg K/B
20-Yr Avg K/B

8/14/2013
37
Grade Progressions
73
Grade Progressions
• The forecast advances students to the next grade,
but sometimes the cohort numbers rise or fall as
the students move to the following grade.
• The change in cohort size as students progress to
the next grade is called the “grade progression.”
• We measure historical grade progressions (for
each set of grades) and use historical levels to
guide assumptions about future grade
progressions.
74

8/14/2013
38
Start with today’s students by grade, then
age the students one grade
K
1
2
3
4
etc.
1
2
3
4
5
etc.
some students
leave, others
enter
75
Following a Cohort Over Time
0
1,000
2,000
3,000
4,000
5,000
6,000
2000-K
2001-1
2002-2
2003-3
2004-4
2005-5
2006-6
2007-7
2008-8
2009-9
2010-1
0
2011-1
1
2012-1
2
Num
ber of Stu
dents
Year - Grade
Kindergarten Cohort of 2000 as It Progressed Through the Grades
76
8/14/2013
39
-300
-200
-100
0
100
200
300
400
500
600
700
K>1
1>2
2>3
3>4
4>5
5>6
6>7
7>8
8>9
9>10
10>11
11>12
Change in N
um
ber
of S
tudents
Grade from > to
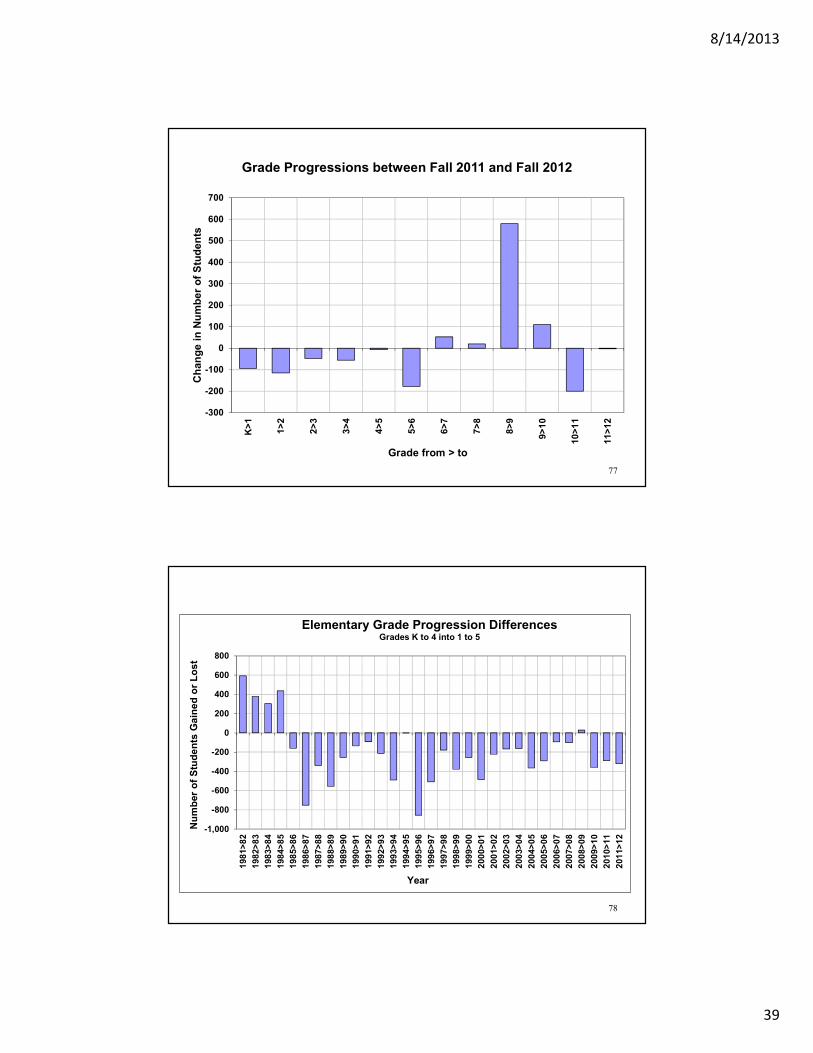
Grade Progressions between Fall 2011 and Fall 2012
77
-1,000
-800
-600
-400
-200
0
200
400
600
800
1981>82
1982>83
1983>84
1984>85
1985>86
1986>87
1987>88
1988>89
1989>90
1990>91
1991>92
1992>93
1993>94
1994>95
1995>96
1996>97
1997>98
1998>99
1999>00
2000>01
2001>02
2002>03
2003>04
2004>05
2005>06
2006>07
2007>08
2008>09
2009>10
2010>11
2011>12
Num
ber
of S
tudents
Gain
ed o
r Lost
Elementary Grade Progression DifferencesGrades K to 4 into 1 to 5
Year
78

8/14/2013
40
-600
-400
-200
0
200
400
600
800
1981>82
1982>83
1983>84
1984>85
1985>86
1986>87
1987>88
1988>89
1989>90
1990>91
1991>92
1992>93
1993>94
1994>95
1995>96
1996>97
1997>98
1998>99
1999>00
2000>01
2001>02
2002>03
2003>04
2004>05
2005>06
2006>07
2007>08
2008>09
2009>10
2010>11
2011>12
Middle School Grade Progression DifferencesGrades 5-7 into 6-8
Year
Num
ber
of S
tudents
Gain
ed o
r Lost
79
-1,400
-1,200
-1,000
-800
-600
-400
-200
0
200
400
600
1981>82
1982>83
1983>84
1984>85
1985>86
1986>87
1987>88
1988>89
1989>90
1990>91
1991>92
1992>93
1993>94
1994>95
1995>96
1996>97
1997>98
1998>99
1999>00
2000>01
2001>02
2002>03
2003>04
2004>05
2005>06
2006>07
2007>08
2008>09
2009>10
2010>11
2011>12
High School Grade Progression DifferencesGrades 8-11 into 9-12
Year
Num
ber
of S
tudents
Gain
ed o
r Lost
80

8/14/2013
41
Grade Progression Assumptions
• Elementary and middle school grade progressions have been relatively stable; forecast is not particularly sensitive to choice of any assumption based on historical experience.
• High school grade progressions have changed a lot. Using this year’s grade progression or even the average of the last three years makes a big difference in the forecast (compared with using a longer historical average).
• If high school continuation patterns are expected to continue, we should use the more recent grade progressions.
81
Private School Enrollment
• The number of students attending private
schools located in San Francisco has remained
fairly stable
• Poor reporting to the state in recent years
resulted in the incorrect conclusion that SF’s
private school enrollments declined. This is not
true.
82

8/14/2013
42
Private School Rates
• The U.S. Census Bureau’s American Community
Survey (ACS) provides estimates of private
school enrollment rates in San Francisco.
• Private school rates between 2007-2011:
– Grades 1-4: 27.5%, +-2.5% error margin
– Grades 5-8: 26.5%, +-2.5% error margin
– Grades 9-12: 20% +-2.0% error margin
• These rates are lower than in 2000 (U.S. Census)
for elementary and middle school; higher for
high school.
83
Alternative Enrollment Forecasts
• Three Different Scenarios
– Current year rates continue
– 3-year average rates continue
– 20-year average rates continue
• Future housing growth included
• Very similar results to Median of stochastic
forecasts
84

8/14/2013
43
85
0
5,000
10,000
15,000
20,000
25,000
30,000
35,000
19
81
19
83
19
85
19
87
19
89
19
91
19
93
19
95
19
97
19
99
20
01
20
03
20
05
20
07
20
09
20
11
20
13
20
15
20
17
20
19
20
21
20
23
20
25
Nu
mb
er
of
Stu
de
nts
Year
Elementary Enrollment Forecasts,
Includes Housing Growth
Using 3-yr avg rates
Using current yr rates
Using 20-yr avg rates
Actual
86
0
2,000
4,000
6,000
8,000
10,000
12,000
14,000
16,000
19
81
19
83
19
85
19
87
19
89
19
91
19
93
19
95
19
97
19
99
20
01
20
03
20
05
20
07
20
09
20
11
20
13
20
15
20
17
20
19
20
21
20
23
20
25
Nu
mb
er
of
Stu
de
nts
Year
Middle School Enrollment Forecasts,
Includes Housing Growth
Using 3-yr avg rates
Using current yr rates
Using 20-yr avg rates
Actual

8/14/2013
44
87
0
5,000
10,000
15,000
20,000
25,000
19
81
19
83
19
85
19
87
19
89
19
91
19
93
19
95
19
97
19
99
20
01
20
03
20
05
20
07
20
09
20
11
20
13
20
15
20
17
20
19
20
21
20
23
20
25
Nu
mb
er
of
Stu
de
nts
Year
High School Enrollment Forecasts,
Includes Housing Growth
Using 3-yr avg rates
Using current yr rates
Using 20-yr avg rates
Actual


![[ AD Hoc Networks ] by: Farhad Rad 1. Agenda : Definition of an Ad Hoc Networks routing in Ad Hoc Networks IEEE 802.11 security in Ad Hoc Networks Multicasting](https://img.pdfslide.us/doc/110x75/56649d305503460f94a0832b/-ad-hoc-networks-by-farhad-rad-1-agenda-definition-of-an-ad-hoc-networks.jpg)