Embed Size (px)
Citation preview
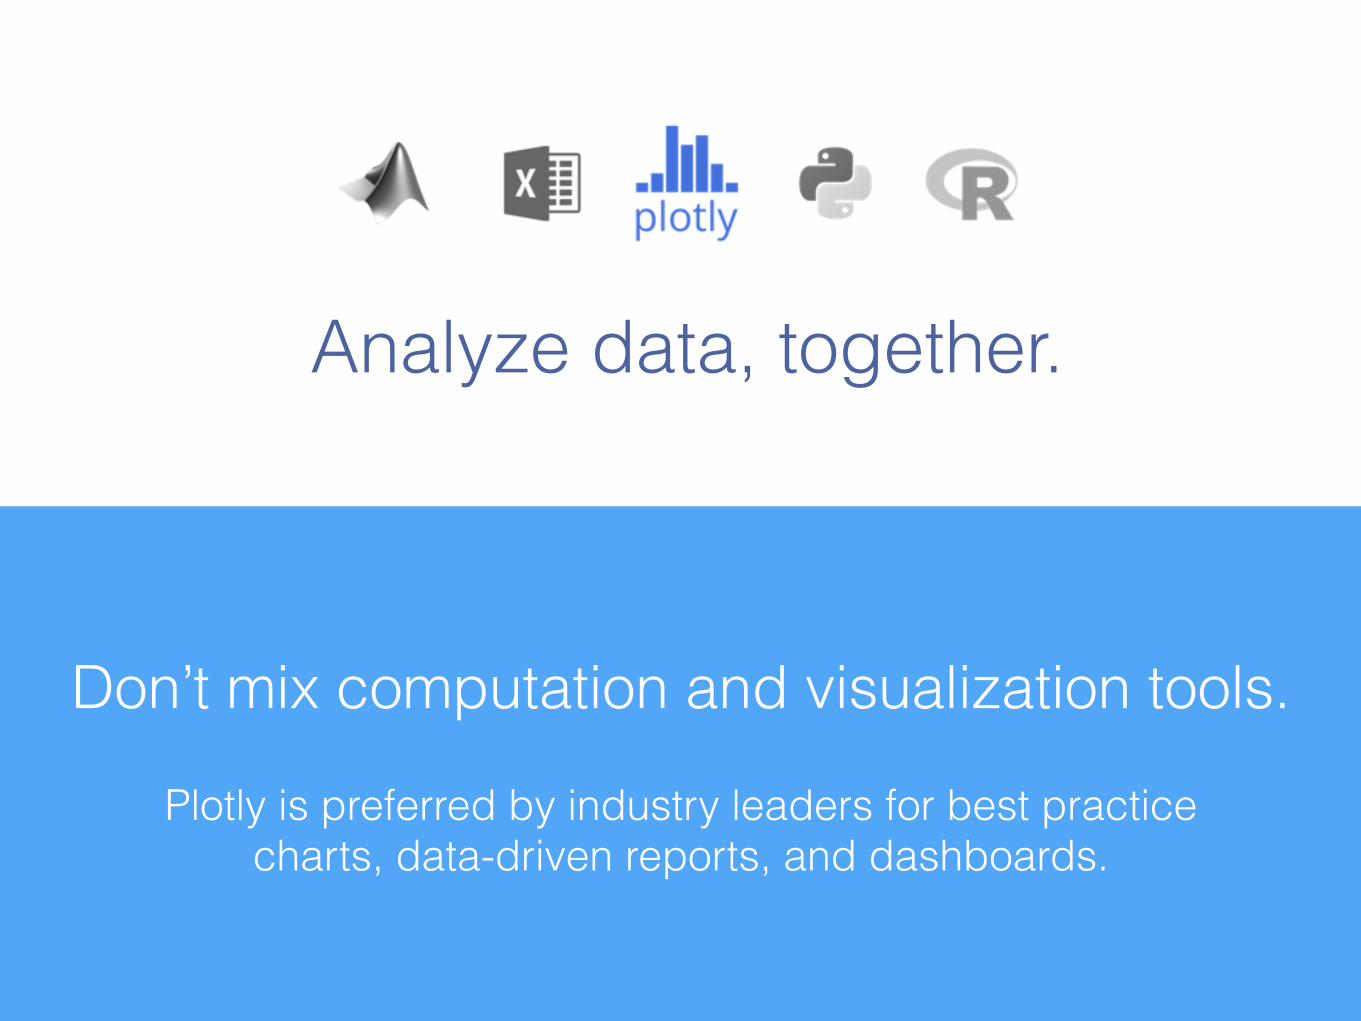
Analyze data, together.
Don’t mix computation and visualization tools.
Plotly is preferred by industry leaders for best practice charts, data-driven reports, and dashboards.
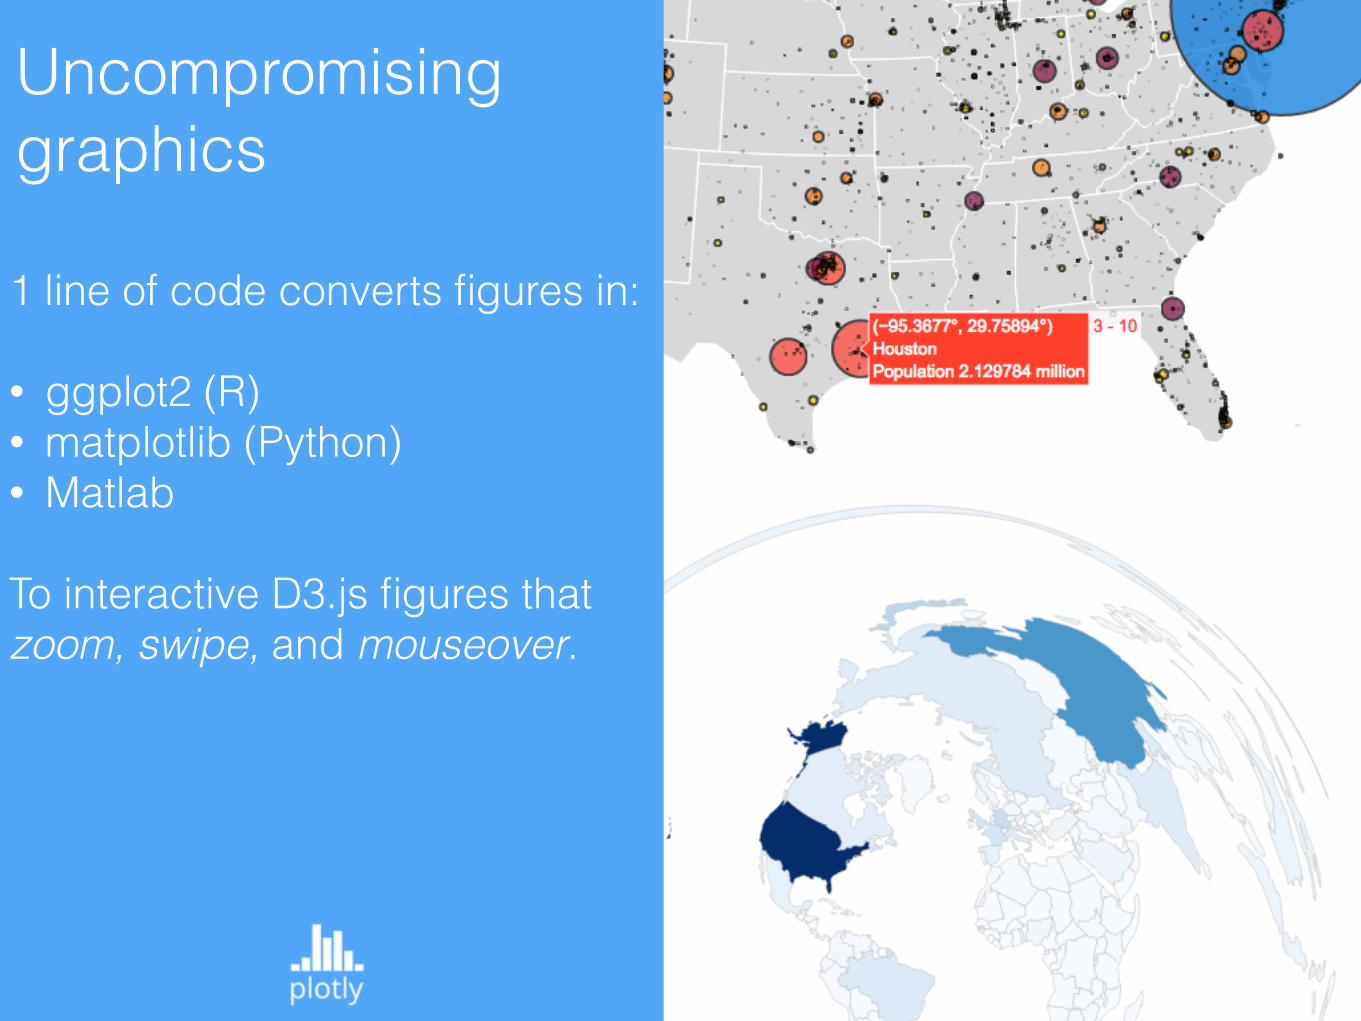
Uncompromising graphics
1 line of code converts figures in:
• ggplot2 (R) • matplotlib (Python) • Matlab
To interactive D3.js figures that zoom, swipe, and mouseover.
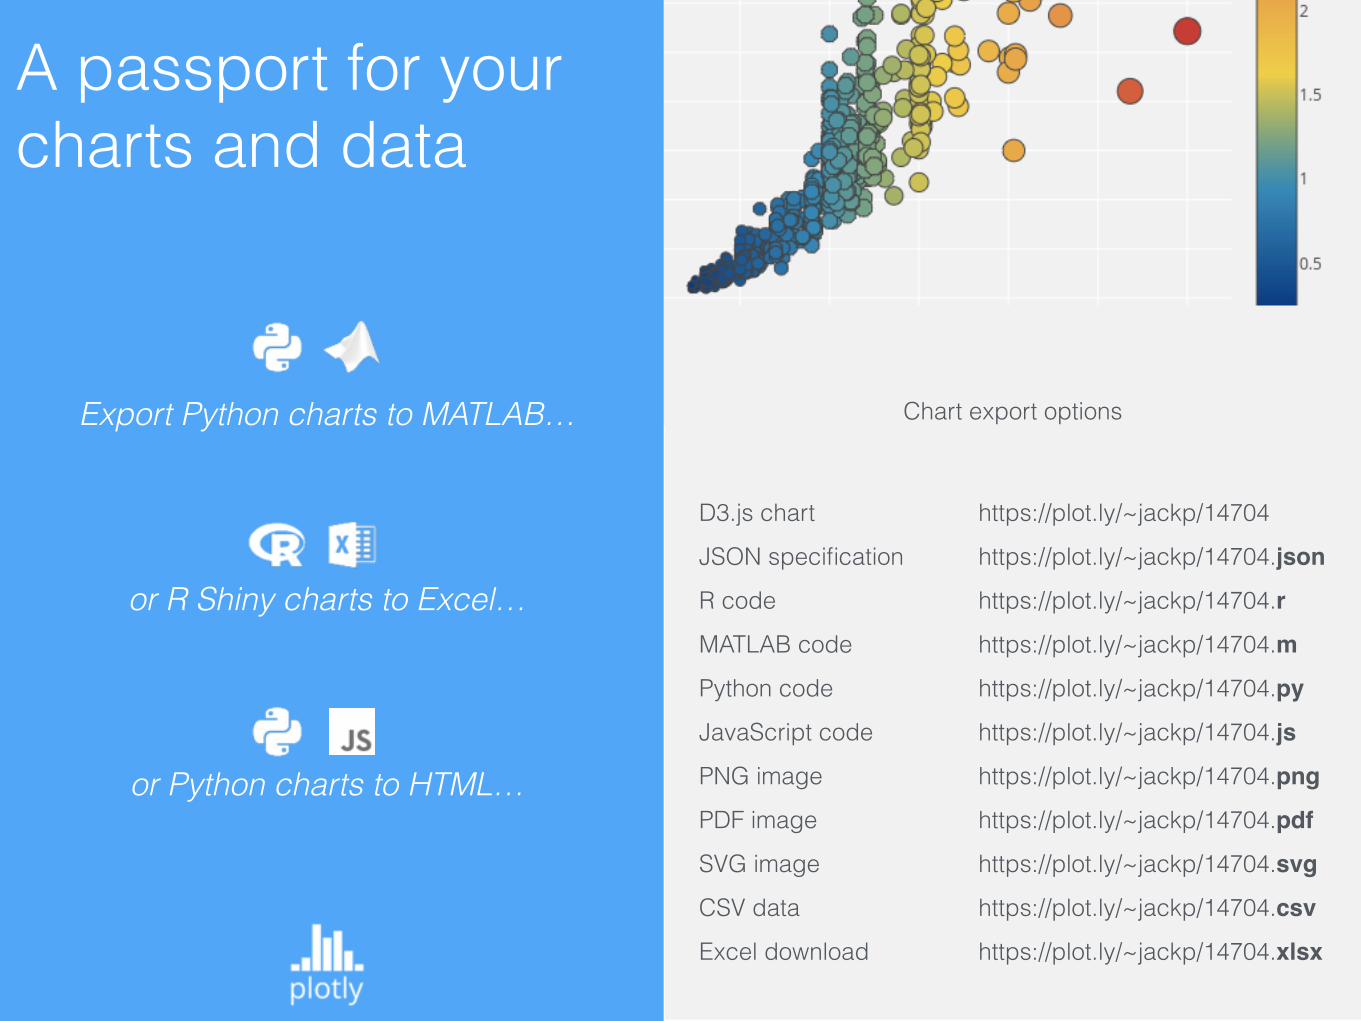
A passport for your charts and data
https://plot.ly/~jackp/14704
https://plot.ly/~jackp/14704.json
https://plot.ly/~jackp/14704.r
https://plot.ly/~jackp/14704.m
https://plot.ly/~jackp/14704.py
https://plot.ly/~jackp/14704.js
https://plot.ly/~jackp/14704.png
https://plot.ly/~jackp/14704.pdf
https://plot.ly/~jackp/14704.svg
https://plot.ly/~jackp/14704.csv
https://plot.ly/~jackp/14704.xlsx
D3.js chart
JSON specification
R code
MATLAB code
Python code
JavaScript code
PNG image
PDF image
SVG image
CSV data
Excel download
Export Python charts to MATLAB…
or R Shiny charts to Excel…
or Python charts to HTML…
Chart export options
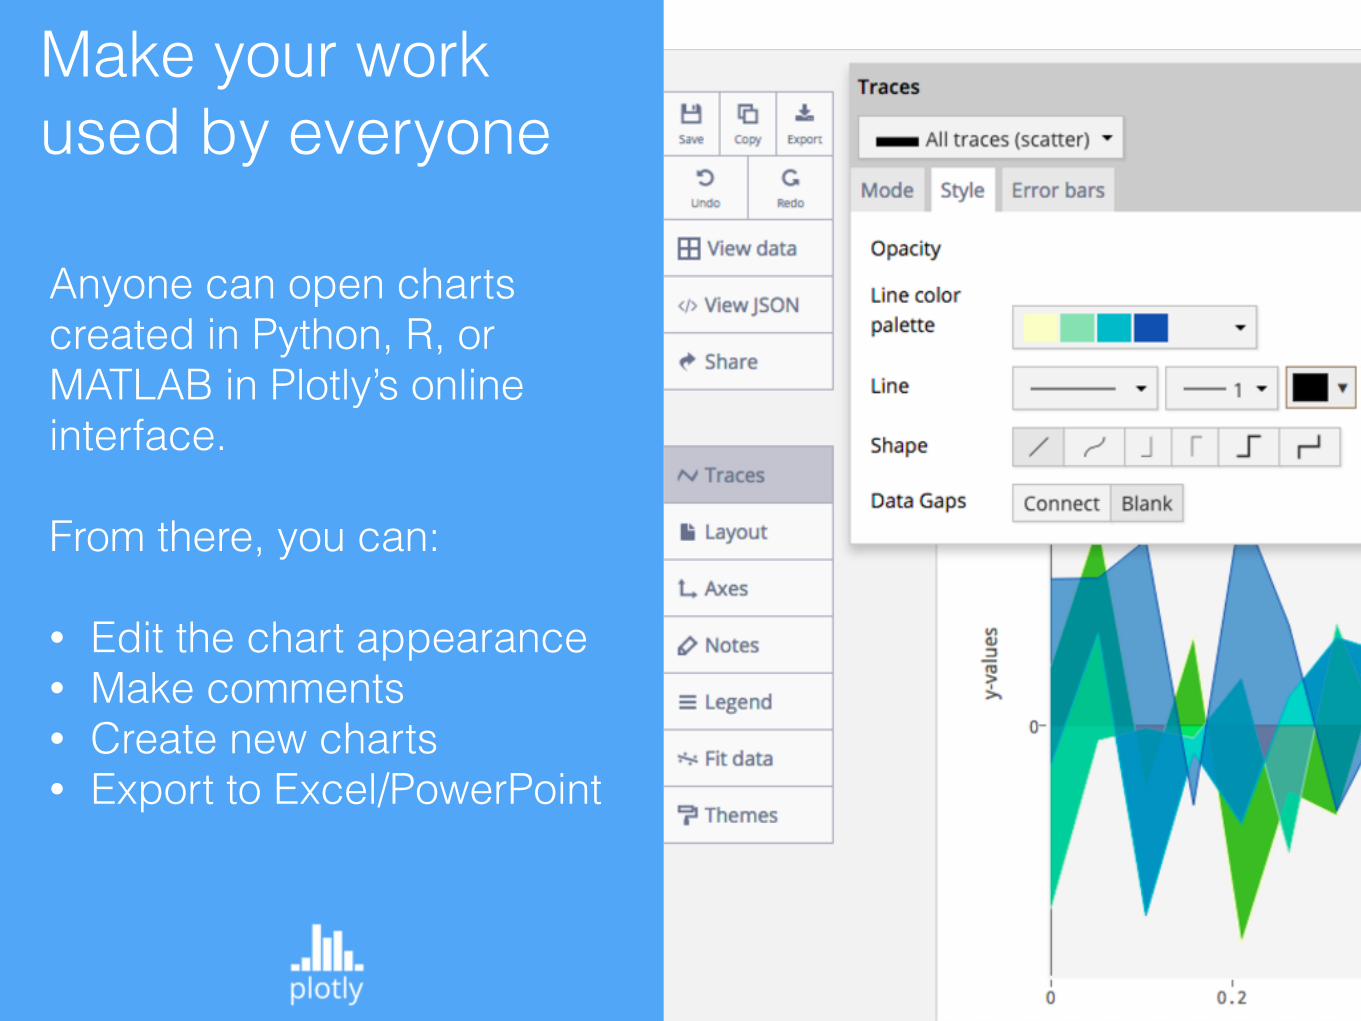
Make your work used by everyone
Anyone can open charts created in Python, R, or MATLAB in Plotly’s online interface.
From there, you can:
• Edit the chart appearance • Make comments • Create new charts • Export to Excel/PowerPoint
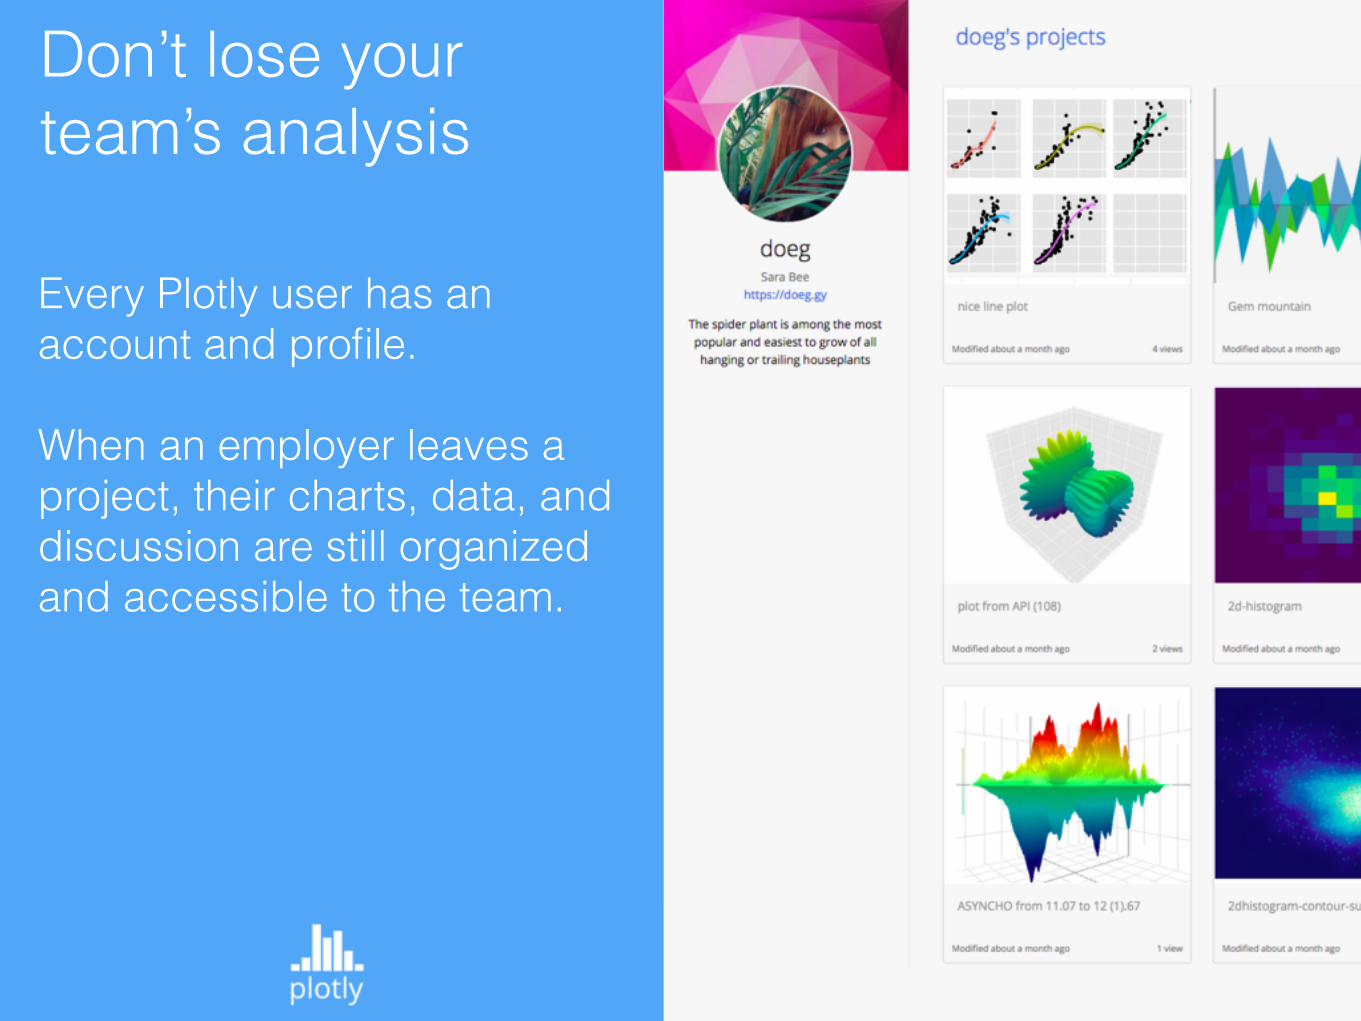
Don’t lose your team’s analysis
Every Plotly user has an account and profile.
When an employer leaves a project, their charts, data, and discussion are still organized and accessible to the team.
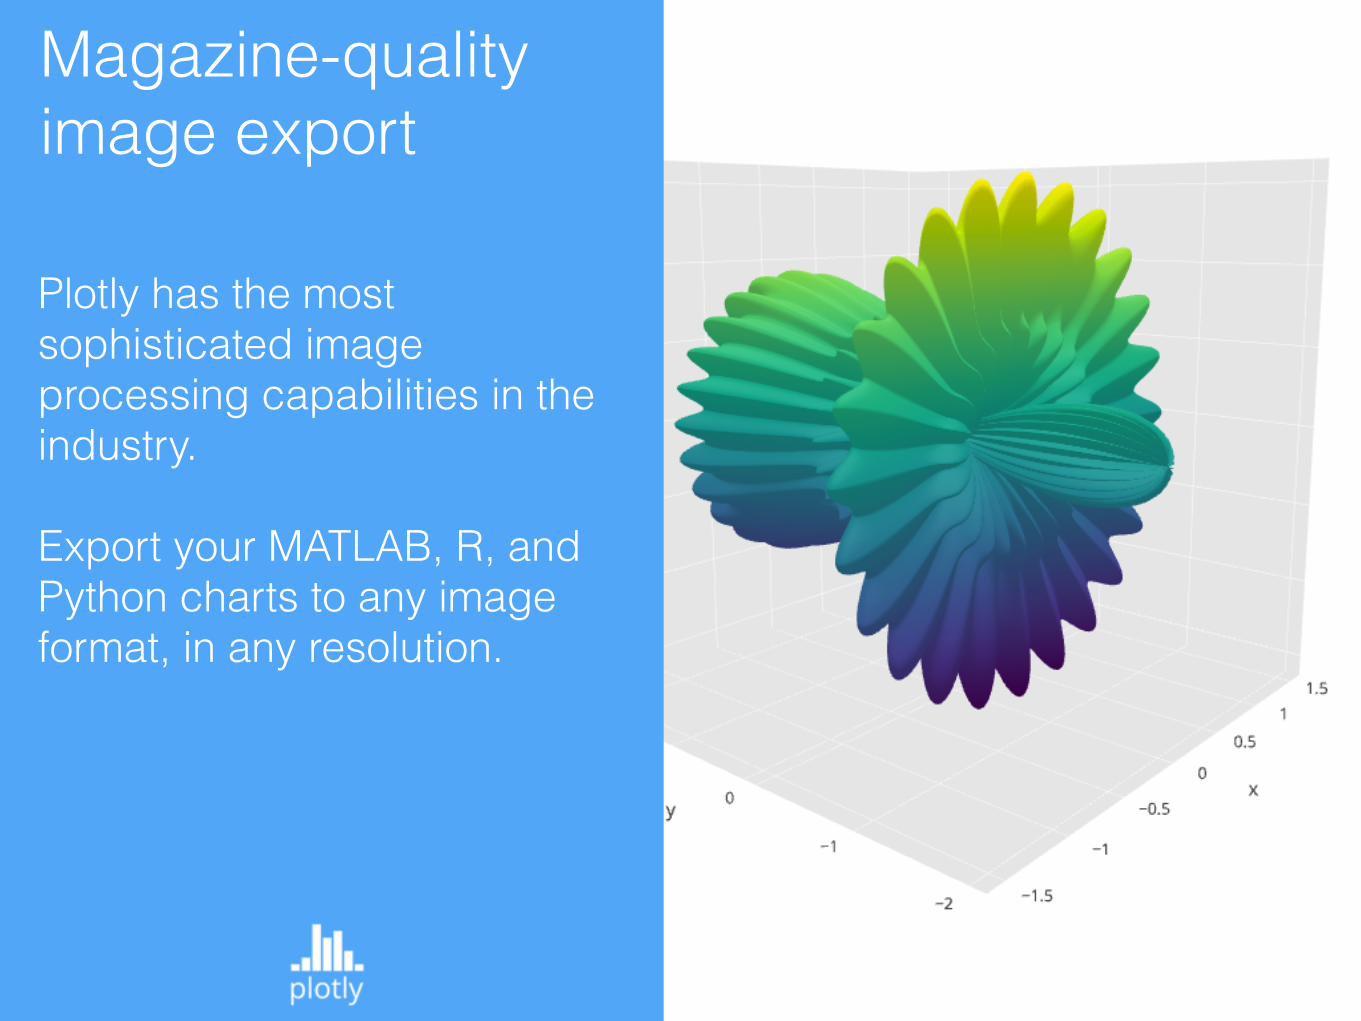
Magazine-quality image export
Plotly has the most sophisticated image processing capabilities in the industry.
Export your MATLAB, R, and Python charts to any image format, in any resolution.
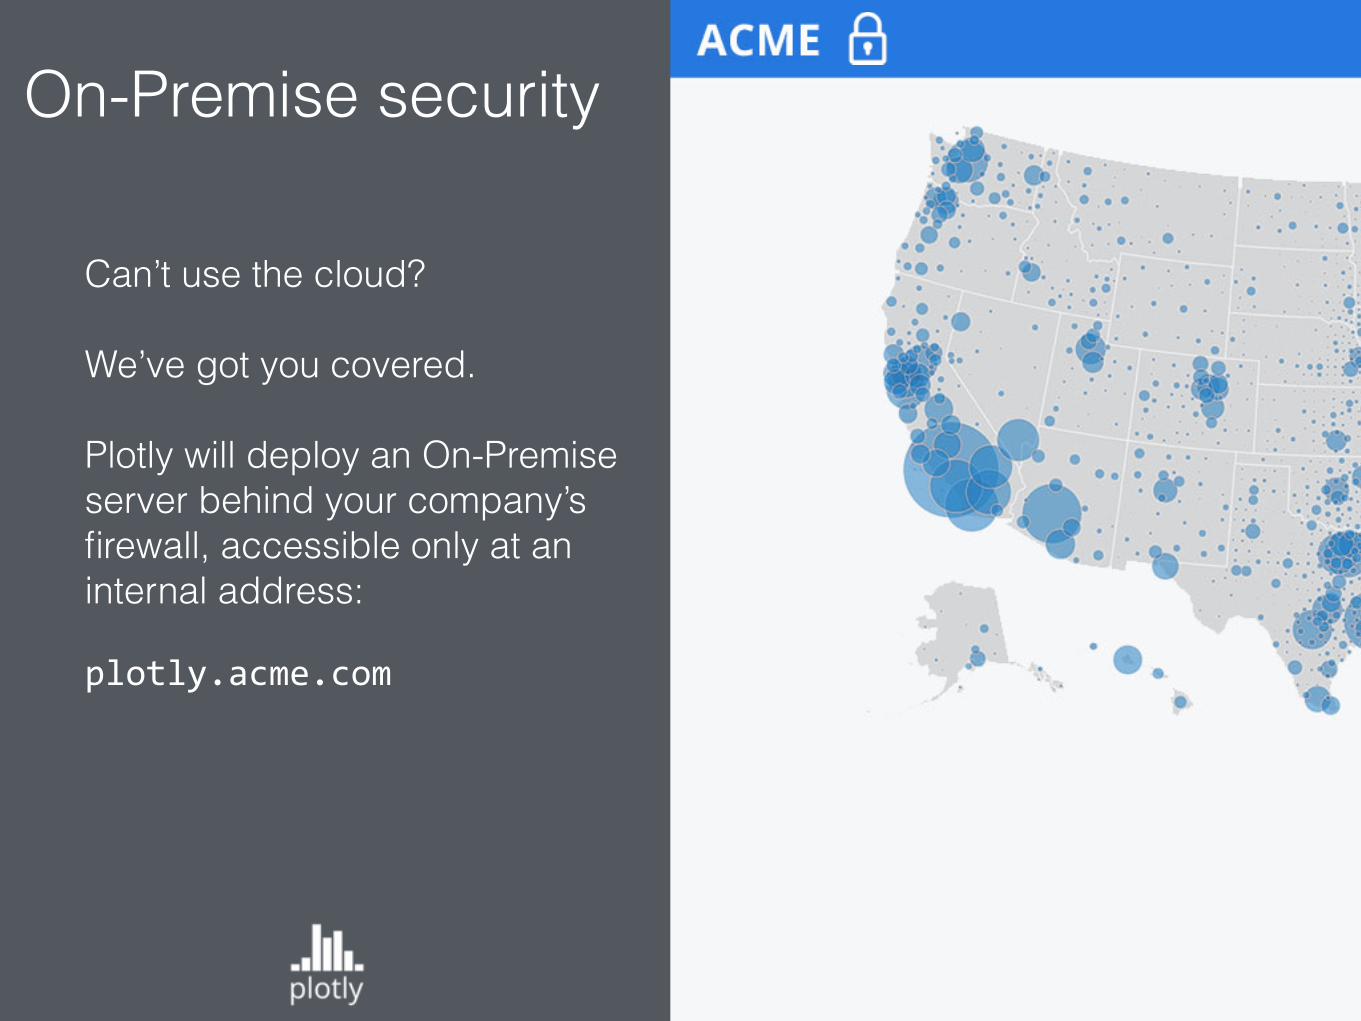
On-Premise security
Can’t use the cloud?
We’ve got you covered.
Plotly will deploy an On-Premise server behind your company’s firewall, accessible only at an internal address:
plotly.acme.com


![[ AD Hoc Networks ] by: Farhad Rad 1. Agenda : Definition of an Ad Hoc Networks routing in Ad Hoc Networks IEEE 802.11 security in Ad Hoc Networks Multicasting](https://img.pdfslide.us/doc/110x75/56649d305503460f94a0832b/-ad-hoc-networks-by-farhad-rad-1-agenda-definition-of-an-ad-hoc-networks.jpg)