Embed Size (px)
Citation preview
I AD-A±65 454 R COST COMPARISON OF AVIATION PERSONNEL: ACTIVE VERSUS 1/1I L6 RESERVE(U) NAVAL POSTGRADUATE SCHOOL MONTEREY CAI N P RISHEL DEC 95
UNCLSSIFIED F/ 5/9 NL
1. W(I11 15
.25 111111-4
MICROCOPY RESOLUTION TEST CHART
-. 74
* .....-. . . .
Ln
NAVAL POSTGRADUATE SCHOOL _
Monterey, California
.LECTE
M)AR2O0
- *A-
THESISA COST COMPARISON OF AVIATION PERSONNEL:
ACTIVE VS. RESERVE
by
Michael Paul Rishel
December 1985
Thesis Advisor: Roger D. Evered
Approved for public release; distribution is unlimited
86 3 19 044
SECURITY CLASSIFICATION Or- THIS PAGE RREPORT DOCUMENTATION PAGE ..
la REPORT SECURITY CLASSiFICATION lb. RESTRICTIVE MARKINGS
UNCLASSIFIED "_-_"-_2a SECURITY CLASSIFICATION AUTHORITY 3 DISTRIBUTION/AVAILABILITY OF REPORT
2b DECLASSIFICATION/DOWNGRADING SCHEDULE Approved for public release;distribution unlimited
4 PERFORMING ORGANIZATION REPORT NUMBER(S) S MONITORING ORGANIZATION REPORT NUMBER(S)
4__%___ _
6a. NAME OF PERFORMING ORGANIZATION 6b OFFICE SYMBOL 7a. NAME OF MONITORING ORGANIZATION(If applicable) J
Naval Postgraduate School Code 54 Naval Postgraduate School6c ADDRESS (City, State, and ZIP Code) 7b. ADDRESS (City, State, and ZIP Code)
Monterey, California 93943-5100 Monterey, California 93943-5100
Ba. NAME OF FUNDING/SPONSORING r Sb. OFFICE SYMBOL 9. PROCUREMENT INSTRUMENT IDENTIFICATION NUMBER .
ORGANIZATION (If applicable)
Bc ADDRESS(City, State, and ZIP Code) 10 SOURCE OF FUNDING NUMBERSPROGRAM PROJECT TASK WORK UNITELEMENT NO NO NO ACCESSION NO
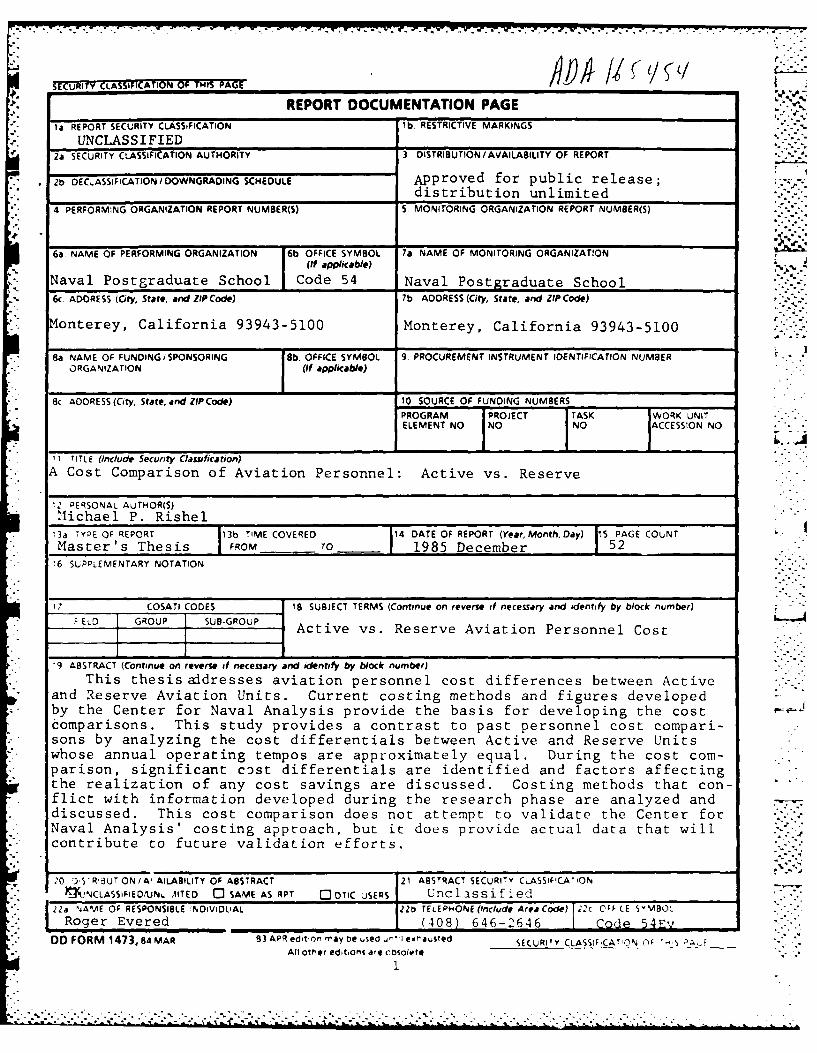
1 TITLE (Include Security Classification)A Cost Comparison of Aviation Personnel: Active vs. Reserve
2 PERSONAL AUTHOR(S)Michael P. Rishel
1 3a YPE OF REPORT 13b TIME COVERED 14 DATE OF REPORT (Year, Month. Day) IS PAGE COUNTMaster's Thesis FROM TO 1985 December 52
16 SLPPLEMENTARY NOTATION
17 COSATI CODES 18 SUBJECT TERMS Continue on reverse if necessary and identify by block number)SELD GROUP SUB-GR UP
Active vs. Reserve Aviation Personnel Cost
"9 ABSTRACT (Continue on reverse if necessary and identify by block number)This thesis aidresses aviation personnel cost differences between Active
and Reserve Aviation Units. Current costing methods and figures developedby the Center for Naval Analysis provide the basis for developing the costcomparisons. This study provides a contrast to past personnel cost compari-sons by analyzing the cost differentials between Active and Reserve Unitswhose annual operating tempos are approximately equal. During the cost com-parison, significant cost differentials are identified and factors affectingthe realization of any cost savings are discussed. Costing methods that con-flict with information developed during the research phase are analyzed anddiscussed. This cost comparison does not attempt to validate the Center forNaval Analysis' costing approach, but it does provide actual data that willcontribute to future validation efforts. "-..
2D'S-R'3UTiON/Al AILABILITY OF ABSTRACT 21 ABSTRACT SECURITY CLASSIFICATION '
)"--kL1NCLASSIFIE01UN. ,1ITED 0-' SAME AS RPT 0--]TIC uSERS Unclassified ' .:
* 2 Roger Evered ( 0 ) 6 6 2 4 o e 5 E
DO FORM 1473, 84 MAR 83 APR edition r'ay be used ur, I exi'austed SECURITY CLASSIFCAT0%NC) -. , 0 -__All other edt,oms are cosolete
1
Approved for public release: distribution unlimited
A Cost Comparison of Aviation Personnel:Active vs. Reserve
by
Michael Paul RishelCommander, United States Naval Reserve .B.S., United States Naval Academy, 1969
Submitted in partial fulfillment of the
requirements for the degree of"--
MASTER OF SCIENCE IN MANAGEMENT
from the
NAVAL POSTGRADUATE SCHOOLDecember 1985 &_
Author: " iKMichael P. Rishel
Approved by:r ve ed,/hesis Advisor.---.
LsIieDarb ond Re ader
¢j
1 i ris P, Greer, Jr.\Cha rman,
--
prtment f Admin stra *ve Sciences
, ./ K ea l e - . ...
Dean of Information and P Sciences
22 2 - -~~- -% ,
e s b n A e ad R e A. Cu
ft. ..
ABSTRACT
This thesis addresses aviation personnel cost differ- ii~-l
*-ences between Active and Reserve Aviation Units. Current . '-
costing methods and figures developed by the Center for
Naval Analysis provide the basis for developing the cost
comparisons. The study provides a contrast to past per-
sonnel cost comparisons by analyzing the cost differentials
between Active and Reserve Units whose annual operating
tempos are approximately equal. During the cost comparison,
significant cost differentials are identified and factors
affecting the realization of any cost savings are discussed.
Costing methods that conflict with information developed
during the research phase are analyzed and discussed. The
cost comparison does not attempt to validate the Center for
Naval Analysis' costing approach, but it does provide actual
data that will contribute to future validation efforts.
3
................. .S .. -.. * ...S ..... ....
. . . . . . ... . . . ..5
.s .. . . . . . . . ..- -.- S .
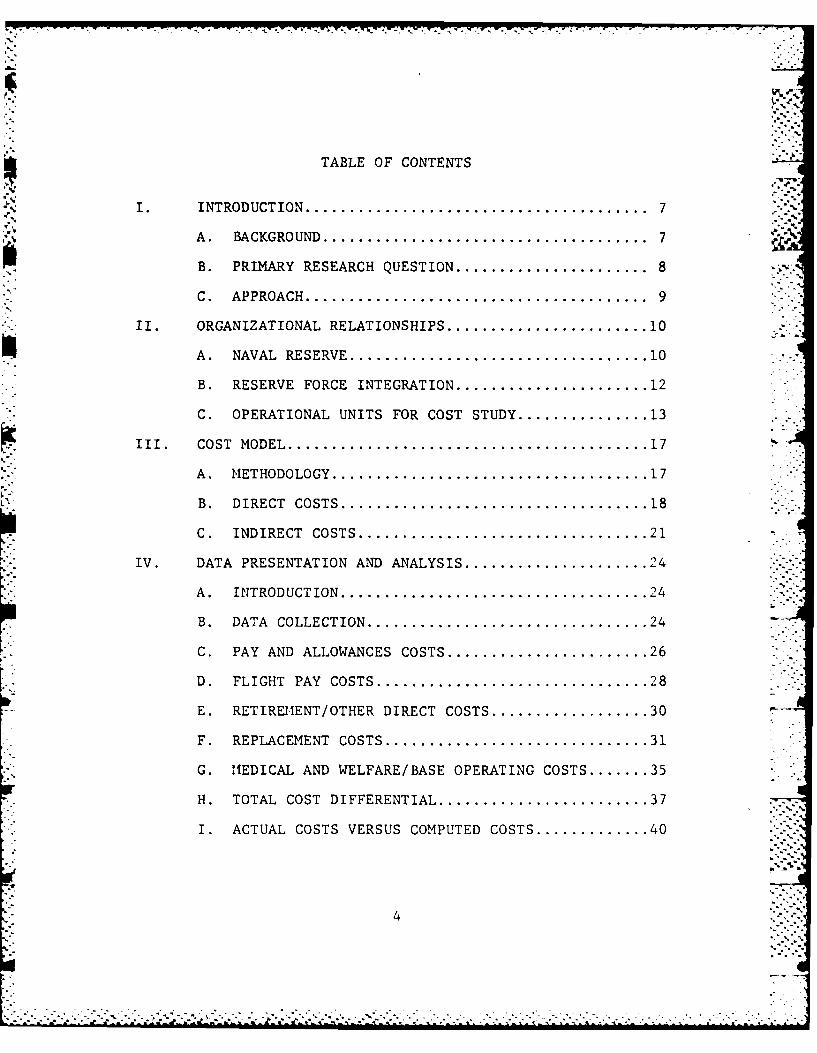
TABLE OF CONTENTS
I. INTRODUCTION . . . . . . . . . . . . . . . . . . .. 7
A. BACKGROUND....................................... 7
B. PRIMARY RESEARCH QUESTION....................... 8
C. APPROACH......................................... 9
ii. ORGANIZATIONAL RELATIONSHIPS........................ 10
SA. NAVAL RESERVE................................... 10
B. RESERVE FORCE INTEGRATION....................... 12
C. OPERATIONAL UNITS FOR COST STUDY................ 13
III. COST MODEL........................................... 17
A. METHODOLOGY..................................... 17
B. DIRECT COSTS.................................... 18
C. INDIRECT COSTS.................................. 21
IV. DATA PRESENTATION AND ANALYSIS...................... 24
A. INTRODUCTION.................................... 24
B. DATA COLLECTION................................. 24
C. PAY AND ALLOWANCES COSTS........................ 26L~D. FLIGHT PAY COSTS................................ 28
E. RETIREMENT/OTHER DIRECT COSTS................... 30
F. REPLACEMENT COSTS............................... 31
G. MEDICAL AND WELFARE/BASE OPERATING COSTS ....... 35
H. TOTAL COST DIFFERENTIAL......................... 37
I. ACTUAL COSTS VERSUS COMPUTED COSTS ..............40
4
V. SUMMARY, CONCLUSIONS, AND RECOMMENDATIONS .......... 44
A. SUMMARY......................................... 44
B. CONCLUSION...................................... 45
C. RECOM1.ENDATIONS................................. 46
GLOSSARY.................................................... 48
LIST OF REFERENCES......................................... 49
INITIAL DISTRIBUTION LIST.................................. 51
AccesionFo
F NTIS CRA&ID TIC TAB 0U.ianinounced 0Jastitecatiofl - -
By ........... ....... . ..
Di.A. ibutionI
Availability Codes
Avi and I or
5
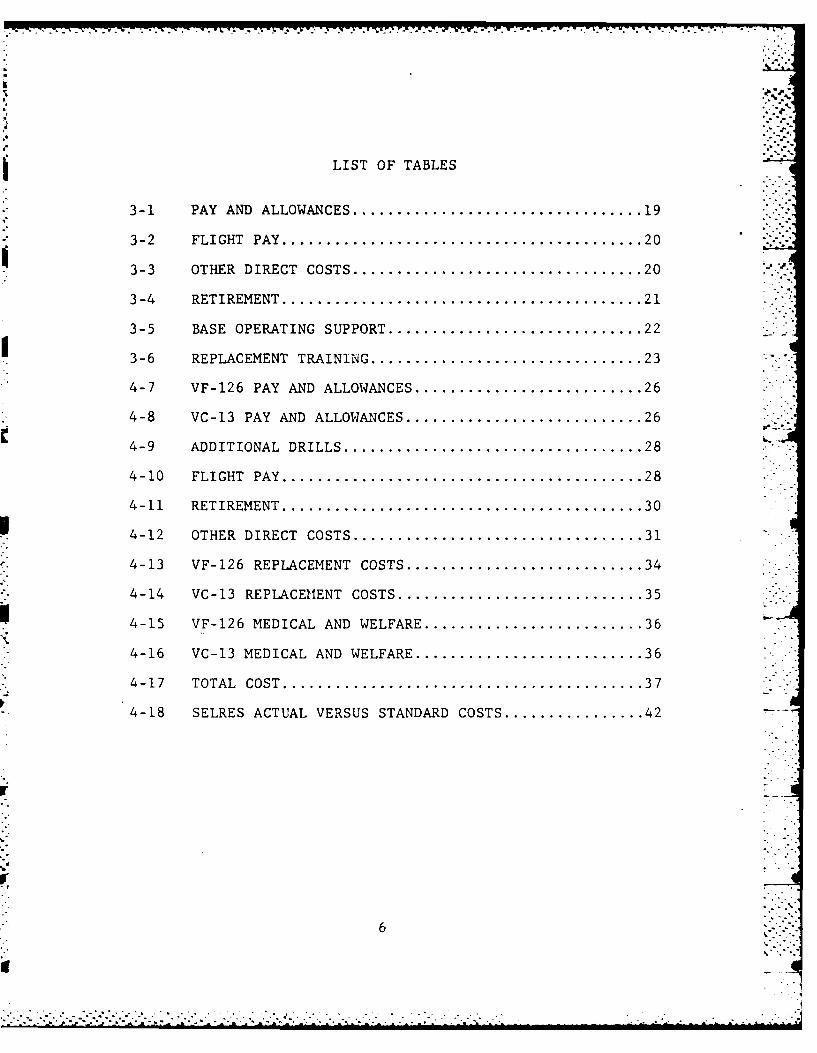
LIST OF TABLES
3-1 PAY AND ALLOWANCES.................................. 19
3-2 FLIGHT PAY........................................... 20
3-3 OTHER DIRECT COSTS.................................. 20; :
3-4 RETIREMENT........................................... 21
3-5 BASE OPERATING SUPPORT.............................. 22
I3-6 REPLACEMENT TRAINING................................ 23
4-7 VF-126 PAY AND ALLOWANCES........................... 26
4-8 VC-13 PAY AND ALLOWANCES............................ 26
4-9 ADDITIONAL DRILLS................................... 28
4-10 FLIGHT PAY........................................... 28
4-11 RETIREMENT........................................... 30
4-12 OTHER DIRECT COSTS.................................. 31
I-4-13 VF-126 REPLACEMENT COSTS............................ 34
4-14 VC-13 REPLACEMENT COSTS............................. 35
U4-15 VF-126 MEDICAL AND WELFARE.......................... 36
4-16 VC-13 MEDICAL AND WELFARE........................... 36
4-17 TOTAL COST........................................... 37
4-18 SELRES ACTUAL VERSUS STANDARD COSTS................. 42
Ir
6
I. INTRODUCTION
A. BACKGROUND
Congress is attempting to curb defense spending while
the United States Navy is increasing in size to support a
projected 600 ship fleet. These two initiatives, which
appear to be in direct opposition to each other, may find
a common source for insuring each success. To accomplish
this difficult task, both have turned to the United States
Naval Reserve for assistance.
Beginning in 1983, Congress directed that each service
provide for greater Reserve participation in the Active duty
mission. Past efforts to integrate Reserve forces had proven
very successful. Reserve logistics squadrons have provided
the majority of all logistic transport service for many years.
Active duty surface and airborne units are becoming increas-
ingly dependent on air support services provided by two
Reserve Fleet Composite Squadrons. Major Naval surface ship
exercises now utilize Reserve forces for planning, support
and coordination. [1]
Augmenting Active forces with Reserve manpower and
material has allowed the Active Navy to retain established
missions and shift its critical Active manpower assets to
new roles and responsibilities. While the ability to expand
the scope of the U.S. Navy through the use of Reserve forces
7
remains an important incentive for pursuing this policy, a
new incentive is rapidly gaining significance.
It has long been recognized that some cost savings have
been realized when Reserve forces assume Active duty mis-
sions. Only recently under the dark cloud of increasing
defense spending and its contribution to very large deficits
has the significance of these savings received much attention.
B. PRIMARY RESEARCH QUESTION
In the past, cost savings resulting from the transfer of
Active units to Reserve status had been attributed to a cor-
responding reduction in operating tempo. While the mission
may have remained the same, the part time status of Reserve
personnel could not allow for the same level of output.
Many cost studies have been conducted to verify the extent
of these cost reductions. Most have compared units which
have had significant differences in workload and productivity
levels. [2]
The idea of identifying, for cost comparison, an Active
and Reserve unit with identical workloads appeared to con-
trast with past studies. While identifying two units that
are mirror images of each other would prove extremely diffi-
cult, identifying two units that are close in size and func-
tion seemed within reasonable limits. In developing the
cost comparison, several qualifying assumptions wer2 required.
First, there could be no degradation in quality of work per-
formed between the two units. While some controversy exists
8
..1
over this issue, recent studies have indicated that Reserve
forces perform extremely well when measured against their
Active counterparts. [3] The second assumption is that if
units could be identified that were close in size, function,
location, and material assets, then significant cost varia-
tions would be restricted to differences in personnel costs.
[4] Given these conditions, the primary research question
is, "What are the personnel cost differences between an
Active and Reserve aircraft squadron who operate within the
same environment, at the same level of intensity, and with
the same mission?"
C. APPROACH
The methodology for this cost analysis will be to use
current costing methods as developed by the Center for Naval
Analysis together with inputs from other professional organi-
zations. After establishing a theoretical basis for cost
comparison, as many actual costs as are practicable to
measure, will be identified for additional evaluation. This
cost comparison will not attempt to validate the Center for
Naval Analysis' costing approach, but it will provide evidence
that will contribute to future validation efforts. Cost
differences that show significant variations or methods that
conflict with information developed during the research phase
will be analyzed and discussed.
9. . .' .- .
. . . . . . . . . .-.. ... . . . .
II. ORGANIZATIONAL RELATIONSHIPS
A. NAVAL RESERVEThe Naval Reserve was established on March 3, 1915.
From World War I to the present the Naval Reserve has played
a key role in both peacetime and periods of conflict. "In
World War II, approximately seventy-five percent of the
Officers and Enlisted men who served on Active duty with the
Navy were Reservists." [1:2-1] Today, the Naval Reserve has
grown to more than 384,000 men and women.
The Reserve Force structure is comprised of two major
groups. The largest of these is the Ready Reserve, while
the second group consists of those individuals who are Re-
tired or Standby Reservists. The Ready Reserve can be further
broken down into Active Duty Reservists and Inactive Duty
Reservists. Active Duty Reservists are those individuals who
are serving full time with regular Naval forces or as TAR's
(Training and Administration of Reserves). TAR's are full-
time career officers who are assigned the responsibility of
administering the Reserve program on a daily basis. The In-
active duty segment of the Ready Reserve is comprised of
three key groups: drilling Selected Reserve (SELRES) per-U
sonnel, students in the training pipelines for NROTC, and
those in the Individual Ready Reserve. Il]
10
I..
From the TAR and Selected Reserve categories come the
personnel who comprise the cost factors for the Reserve half
of the cost analysis. The Selected Reserve personnel are the
heart of the entire reserve program. These individuals are
the so-called "weekend warriors". They are required to per-
form four drills (four hour work period) per month and at
least two weeks of Active Duty for Training (ACDUTRA) per
year. "Most of the SELRES are Navy Veterans who continue
their affilliation with the Navy while, at the same time,
pursuing their civilian careers." [1:2-4]
Many reservists serve much more time than the minimums
describe. Drills, in addition to the minimum four per month
requirement, are authorized for those who require more time
to maintain proficiency in high skill areas. Reserve pilots
often perform up to 72 additional drills per year. Special
Active Duty, which is active duty performed in excess of the
two week requirement, is often used by these same individuals.
The fact that most SELRES are veterans will be a signifi-
cant factor affecting the Indirect costs of Reservists as
opposed to those of Active personnel.
During the periods when the SELRES are active in their
civilian careers, TAR personnel keep the programs and machinery
operating. They are analagous to a highly trained skeleton
crew who provide continuity and expert skills to the Reserve
Program. They are the administrators and custodians of the
Reserve Navy.
111
. . . - .. . . . . . . . . . . . . . . . . . . . . .
Important to note is the planned expansion of these two
groups. SELRES personnel strengths are planned to grow from
110,000 in October 1985 to 132,600 by the end of 1990. TAR
personnel are programed to grow from approximately 15,000 in
FY84 to approximately 25,000 in FY90. This planned expansion
coincides with the increasing pressure from Congress to trans- -fer more missions to the Reserve Forces. [11
B. RESERVE FORCE INTEGRATION
"The Conference Report on the FY84 Defense Authorization
Bill asked the Services to provide the Armed Services Commit-
tees of the Senate and House of Representatives with an annual [
report outlining changes that will be accomplished to provide
the Guard and the Reserves with: new missions, more modern
equipment, and greater integration with the active forces." k
[5] In this statement, Secretary John Lehman refers to Congress' . -2
increasing interest in reducing costs through greater use of
a 'perceived' less costly Reserve Armed Forces. Perceived is
used to qualify Congress' view because there is presently
numerous discussions and debates about whether transferring
missions to the Reserves actually does save money. A case
in point is that the cost to operate a Reserve ship from a
forward deployed site has proven to be more costly than oper-
ating an Active ship under the same conditions. [5] Concern
has been expressed that, although initial cost studies show
a substantial savings when Reserve forces assume an active
12
4
duty mission, further analysis has shown that the degree of
participation by the Reserves will affect the amount of sav-
ings. "This cost differential however, should be considered
valid only for marginal changes. . . . Large substitutions
of Reserve for Active squadrons would reduce the cost dif-
ferential for several reasons." [2:3]
C. OPERATIONAL UNITS FOR COST STUDY
VC-13 is a Reserve Aviation Squadron located at Naval
Air Station, Miramar, San Diego, California. The squadron's
mission is to provide a variety of air services within two
major categories. The first category, Dissimilar Air Combat
Training (DACT), provides aircraft to oppose the Active and
Reserve fighters in simulated air battles. These battles can
include major encounters between an entire aircraft carrier's
fighter aircraft assets to single plane encounters such as
initial pilot training missions. The second category is air-
borne target towing for both ships and aircraft. Targets
are towed for fighter aircraft to practice air to air gunnery.
Certain specialized targets are towed so that ships can cer-
tify weapon stations and qualify gun and missile crews.
To provide these services VC-13 flies approximately 4000
hours per year. [61 The squadron does this with an authorized
squadron manning level of 21 Officers and 187 Enlisted. (7]
In addition to this manning, VC-13 is supplemented with 10
Officers and 39 Enlisted who are provided by a Squadron
Augment Unit (SAU) called VC-885.
13
.................
VC-885 is unique in that it maintains an administrative
identity of its own; while on a practical basis it functions
as an integral part of VC-13. For the purpose of this cost
comparison, VC-13 and VC-885 will be considered as one unit.
The Active duty unit being evaluated within this cost
study is VF-l26, a fighter squadron located at Naval Air
Station, Miramar, San Diego, California. VF-126 provides
Dissimilar Air Combat Training in the same manner as described
in the discussion of VC-13. Additionally, VF-126 provides
spin training to both Reserve and Active pilots.
In providing these services VF-126 flies approximately
4600 hours per year. [8] The squadron performs this mission
with an authorized squadron manning of 27 Officers and 217
Enlisted personnel. [71
VC-13 and VF-126 were chosen for this cost comparison for
several reasons. The writer's intimate knowledge of both
organizat ions prompted the initial question of "Could the ~
Navy save money or alleviate manpower shortages through a
similar use of Reserve forces within the organizational
framework of VF-126?" What was intriguing about this ques-
tion was the possibility of extending any identified cost!
manpower savings to units of like nature throughout the
Naval Air community. The closeness in unit structure, loca- -
tion, mission, and operating tempo also made these two units
ideally suited to this type of analysis. Although the air
service missions do vary, the pilot skill requirements for
14
each squadron are identical. Both squadrons recruit the
majority of their pilots from the fighter community. Many
of VC-13's Reserve pilots acquired their skill while serving
as Active duty pilots with VF-126. Essentially, these pilots
require little or no additional training prior to becoming
productive members of VC-13. These pilots also adapt quickly
to the few entirely new missions.
The Enlisted personnel are closely aligned in both pro-
fessional experience and training background due to the com-
monality of working on the same basic aircraft. The one
exception are the personnel assigned to VF-126's T-2 aircraft
spin training program. [7] For this cost comparison the 42
people specifically trained for maintenance on the T-2 air-
craft will be discounted. Coinciding with the removal of the
42 Enlisted personnel we must disregard 600 hours of VF-126's
flight time which is devoted to spin training in the T-2 air-
craft. With 27 assigned pilots flying approximately
4600 hours per year, the average flight time per pilot is
approximately 200 hours per year. Eliminating further costs
associated with the T-2 program requires that 3 VF-126 pilots
be removed from the cost consideration. The elimination of
personnel associated with the T-2 program now establishes
two units who have the same location, essentially the same
mission, the same maintenance environment, and approximately
the same operating tempo.
15
-;'1.
- . .• - ;r .- r .- -" .-- , ', -..'
."--- - - - - -- - - - -- - - -.
At this point, we should review the ground work that has
transpired. First, there may be some concern over the elimi-
nation of the T-2 program from the cost analysis. This was,$ .
done in an effort to match the two units as closely as possi-
ble. The identification of personnel associated with the T-2
program was not forced since the squadrons manpower document
clearly identifies those personnel assigned specifically for
the T-2 program. The 3 pilots were removed based on the
average amount of flying each pilot performs in one year and
applying this average to the 600 hour T-2 flight program.
We now have a Reserve and Active unit who fly approximately
4000 hours, maintain the same number and type of aircraft,
and perform approximately the same mission.
A secondary reason for selecting these two units is that
units with support missions who are based within the con-
tinental United States (CONUS) should be primary targets for
Reserve force integration. Although the Fiscal Year 1985
report to Congress on proposals deemed inappropriate for .
transfer to the Reserves, identified VC squadrons as not be-
ing practical for further integration because of the overseas
location of the remaining Active VC squadrons, it appeared to
ignore the closeness in structure and mission of Active ad-
versary squadrons to the current VC operations. [1]
16
- . . L .. . . .. '... . . . . . . . . . . . . . . . . . . . .
III. COST MODEL
A. METHODOLOGY . X~j
The Center for Naval Analysis (CNA), located in Alexandria,
Virginia, is an organization which employs analysts and re-
searchers to do various studies for the United States Navy.
Since 1983, it has published numerous documents relating to
many of the cost differences between Active and Reserve forces.
In May 1985, CNA published a memorandum that established both
a methodology and specific cost factors for evaluating per-
sonnel cost differentials between Active and Reserve forces.
[9]
The Center for Naval Analysis separated personnel costs
into two major categories of direct and indirect costs. CNA °r
then established per capital cost factors in the following
manner: "-.
Aggregate cost factors are developed for Officers andEnlisted personnel rather than for individual nay grades.Aggregating this way simplifies the analytical task with-out sacrificing accuracy. (Several test cases were triedin which personnel costs were estimated first using theaggregate factors and then by individual pay grades. Thedifferences were no greater than 8 percent, justifying theuse of aggregate factors.) In general, the aggregate costfactors are developed by dividing the costs displayed inthe budget justifications found in (1) and (2) by the ap-propriate average personnel strengths for the specificcategories, also displayed in (1) and (2). [9:2]
(1) and (2) refer to Department of the Navy Budget justi-
fication documents on both Active and Reserve manpower costs.
17
• " . . . . .. -. ... .. .. i i " - "4
Although CNA had qualified its use of aggregate figures,
there remained some question as to the validity of this '
statement. In a telephone conversation with one of the CNA
analysts, it was learned that additional actual data on Re-
serve personnel costs would be beneficial to refining future
cost factors. Consequently, this cost comparison will include
any actual cost data that are available.
While studying the Center for Naval Analysis documents
on costing methodology, several references to similar Rand
studies were noted. To broaden the possible perspective on
estimating costs, a Rand study comparing costs between Re-
serve and Active C-141 squadrons was reviewed. [3] Based on
this study and several other Rand Notes, there appeared to be
no major differences between the costing approach o' either
organization. One area that showed the same methodology but
significantly different cost factors was the replacement
training cost category. This issue is addressed later in
this cost study. The similarity of all cost studies reviewed
plus the general acceptance of the CNA methodology and stand-
ards by the Department of the Navy, made CNA the logical choice
to model this cost study after.
B. DIRECT COSTS
Direct Costs include the following:
1) Pay and Allowances
2) Flight Pay
184i..'
* . .*
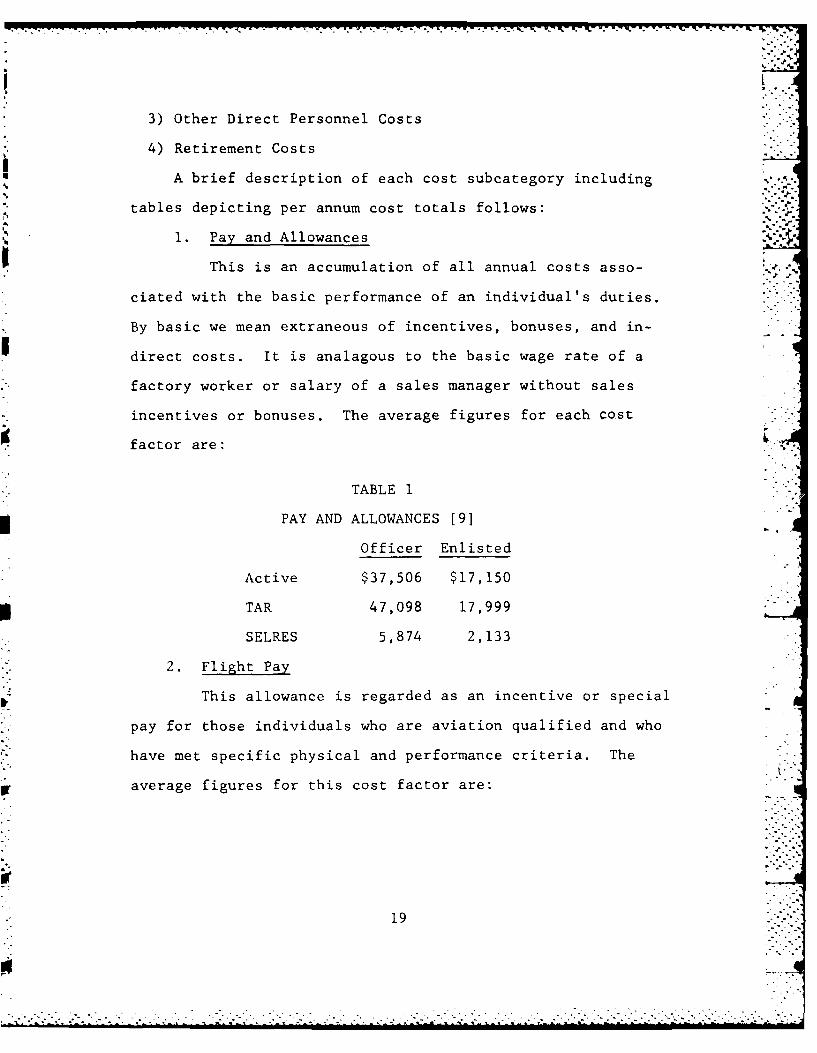
3) Other Direct Personnel Costs
4) Retirement Costs
A brief description of each cost subcategory including
tables depicting per annum cost totals follows:
I. Pay and Allowances
This is an accumulation of all annual costs asso-
ciated with the basic performance of an individual's duties.
By basic we mean extraneous of incentives, bonuses, and in-
direct costs. It is analagous to the basic wage rate of a
factory worker or salary of a sales manager without sales
incentives or bonuses. The average figures for each cost
factor are:
TABLE 1
PAY AND ALLOWANCES [9]
Officer Enlisted
Active $37,506 $17,150
TAR 47,098 17,999
SELRES 5,874 2,133
2. Flight Pay
This allowance is regarded as an incentive or special
pay for those individuals who are aviation qualified and who
have met specific physical and performance criteria. The
average figures for this cost factor are:
19
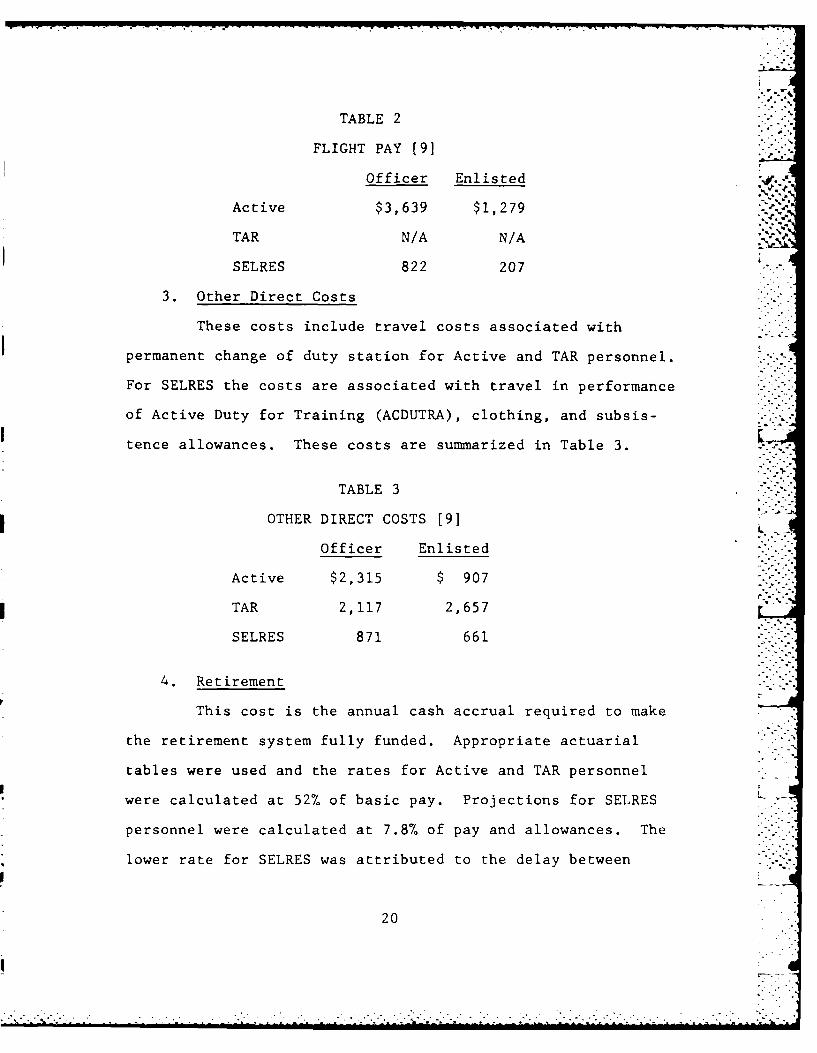
TABLE 2
FLIGHT PAY [9]
Officer Enlisted ..
Active $3,639 $1,279
TAR N/A N/A
SELRES 822 207
3. Other Direct Costs
These costs include travel costs associated with
permanent change of duty station for Active and TAR personnel.
For SELRES the costs are associated with travel in performance
of Active Duty for Training (ACDUTRA), clothing, and subsis-
tence allowances. These costs are summarized in Table 3. ,-
TABLE 3
OTHER DIRECT COSTS [91
Officer Enlisted
Active $2,315 $ 907
TAR 2,117 2,657
SELRES 871 661
4. Retirement
This cost is the annual cash accrual required to make
the retirement system fully funded. Appropriate actuarial
tables were used and the rates for Active and TAR personnel
were calculated at 52% of basic pay. Projections for SELRES
personnel were calculated at 7.8% of pay and allowances. The
lower rate for SELRES was attributed to the delay between
20
.. . . . . .
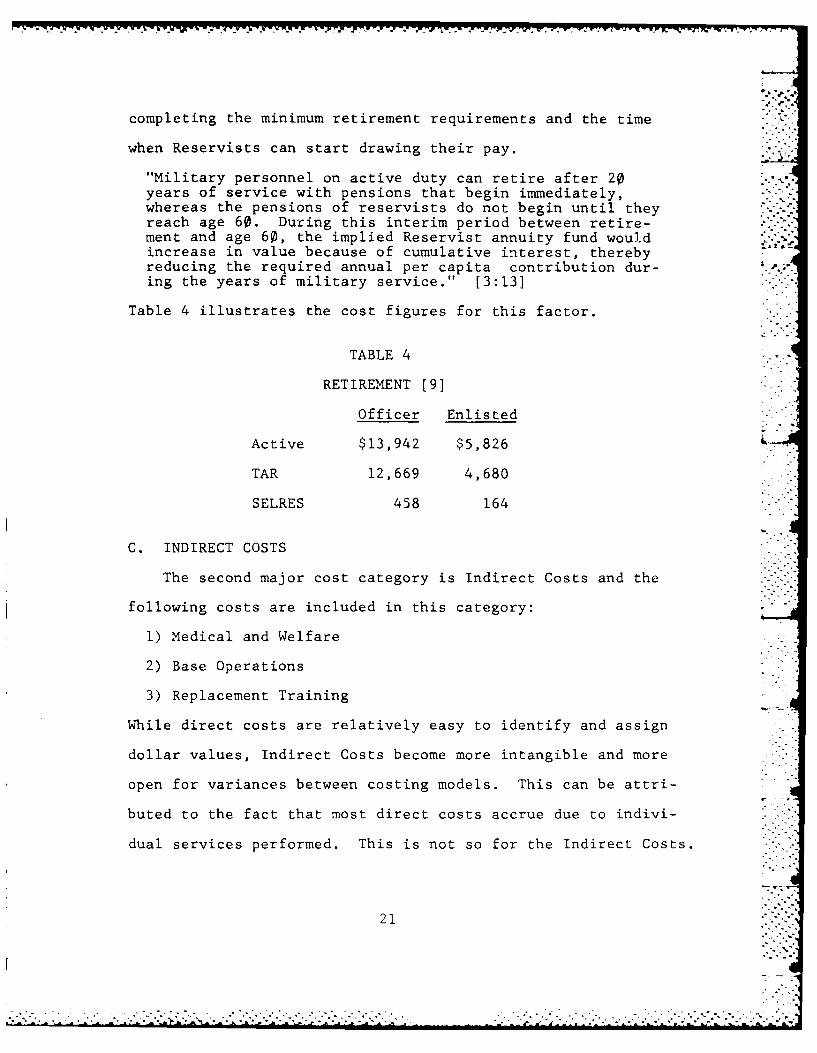
completing the minimum retirement requirements and the time
when Reservists can start drawing their pay.
"Military personnel on active duty can retire after 20years of service with pensions that begin immediately,whereas the pensions of reservists do not begin until theyreach age 60. During this interim period between retire-ment and age 60, the implied Reservist annuity fund wouldincrease in value because of cumulative interest, therebyreducing the required annual per capita contribution dur-ing the years of military service." [3:13]
Table 4 illustrates the cost figures for this factor.
TABLE 4
RETIREMENT [9]
Officer Enlisted
Active $13,942 $5,826
TAR 12,669 4,680
SELRES 458 164
C. INDIRECT COSTS
The second major cost category is Indirect Costs and the
following costs are included in this category:
1) Medical and Welfare
2) Base Operations
3) Replacement Training
While direct costs are relatively easy to identify and assign
dollar values, Indirect Costs become more intangible and more
open for variances between costing models. This can be attri-
buted to the fact that most direct costs accrue due to indivi-
dual services performed. This is not so for the Indirect Costs.
21
................................
S-. -. . -~ . -~ -r s- -. V - . ... * w-w-w
These costs require the analyst to attempt an estimate of
benefits such as "how much does one individual benefit from
the medical, dental, or general base services?" To simplify
the Center for Naval Analysis calculated per annum costs by
taking the aggregate budgets in each benefit area and dividing
them by the force strength. Since some budgets did not dis-
tinguish between Officer and Enlisted, a single figure for
average cost per person was calculated for Medical and Welfare
costs for Active and TAR personnel. It amounted to $954 per
person, SELRES costs for Death Gratuities and Hospitalization
were calculated at $17 for Officers and $9 for Enlisted.
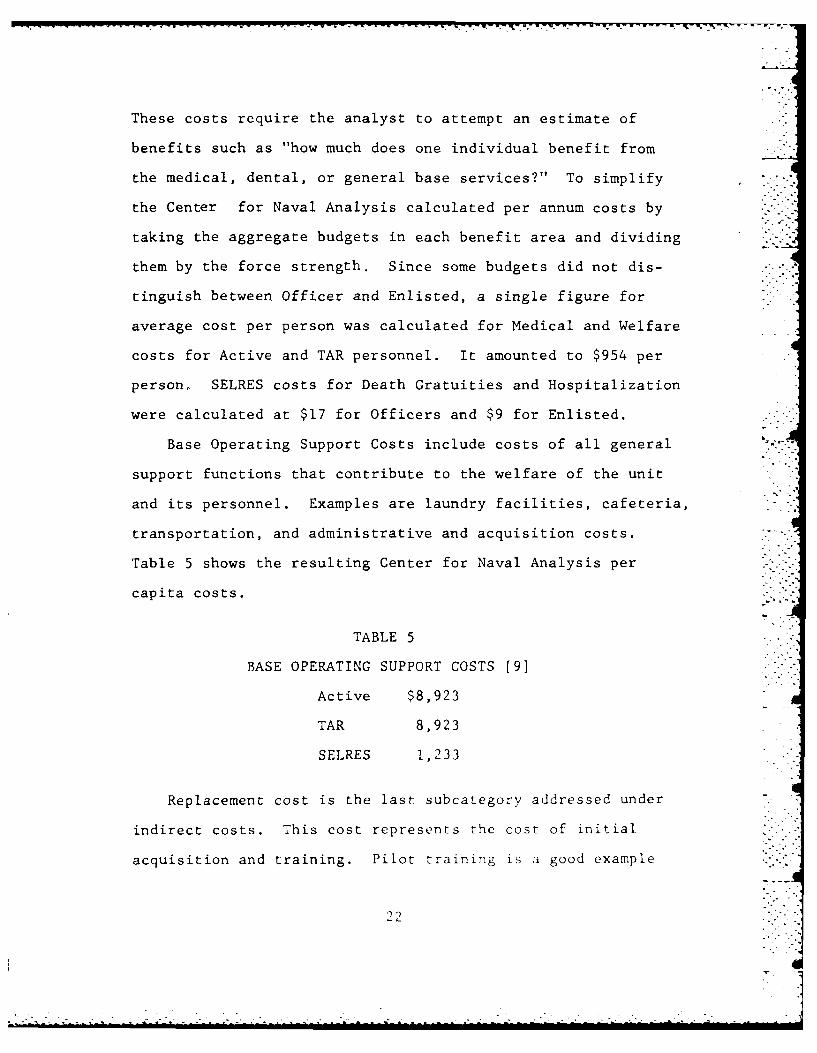
Base Operating Support Costs include costs of all general
support functions that contribute to the welfare of the unit
and its personnel. Examples are laundry facilities, cafeteria,
transportation, and administrative and acquisition costs.
Table 5 shows the resulting Center for Naval Analysis per
capita costs.
TABLE 5
BASE OPERATING SUPPORT COSTS [9]
Active $8,923
TAR 8,923
SELRES 1,233
Replacement cost is the last subcategory addressed under
indirect costs. This cost represents the cost of initial
acquisition and training. Pilot training is ai good example
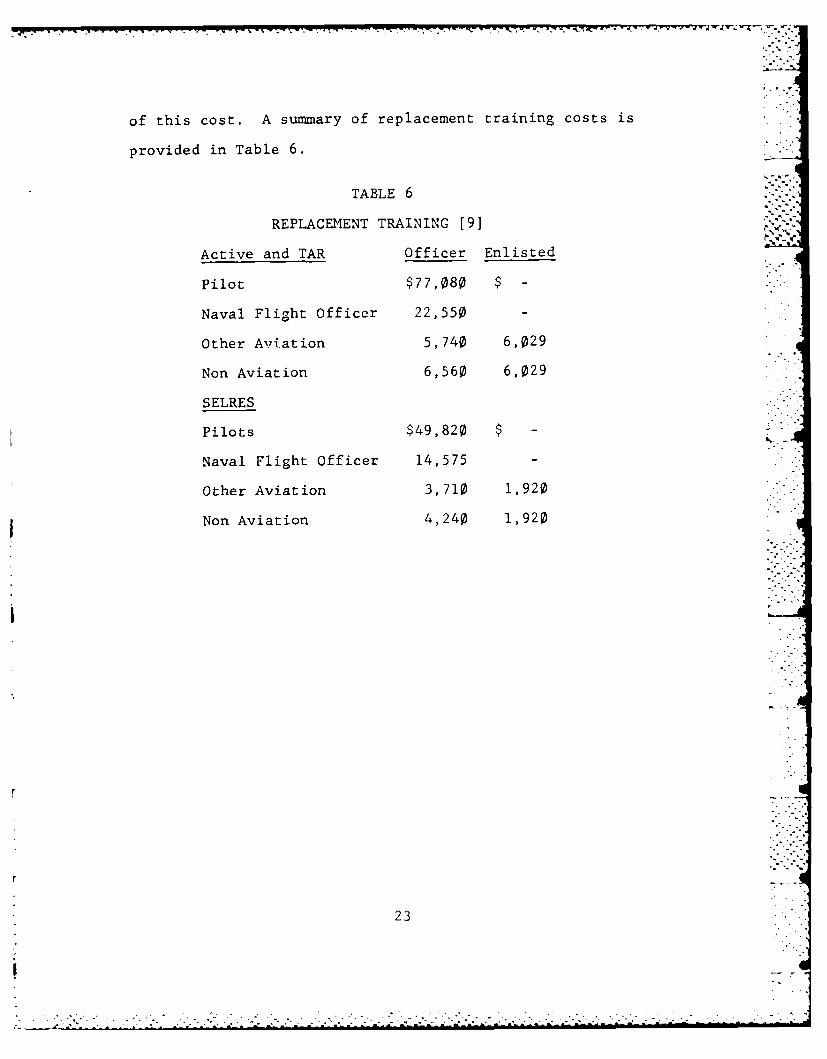
of this cost. A summary of replacement training costs is
provided in Table 6.
TABLE 6
REPLACEMENT TRAINING [9]
Active and TAR Officer Enlisted
Pilot $77,080 $ -
Naval Flight Officer 22,550
Other Aviation 5,740 6,029
Non Aviation 6,560 6,029
SELRES
Pilots $49,820 $ -
Naval Flight Officer 14,575 -
Other Aviation 3,710 1,920
Non Aviation 4,240 1,920
23
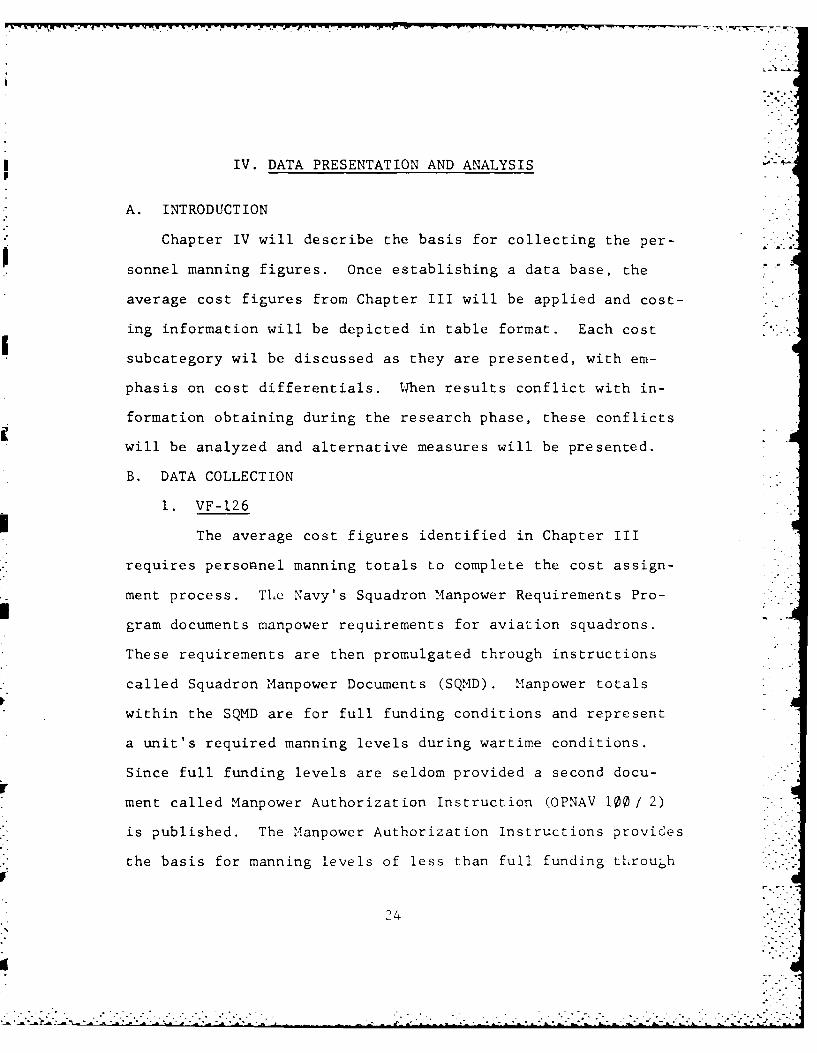
IV. DATA PRESENTATION AND ANALYSIS
A. INTRODUCTION
Chapter IV will describe the basis for collecting the per-
sonnel manning figures. Once establishing a data base, the
average cost figures from Chapter III will be applied and cost-
ing information will be depicted in table format. Each cost
subcategory wil be discussed as they are presented, with em-
phasis on cost differentials. When results conflict with in-
formation obtaining during the research phase, these conflicts
will be analyzed and alternative measures will be presented.
B. DATA COLLECTION
1. VF-126
The average cost figures identified in Chapter III
requires personnel manning totals to complete the cost assign-
ment process. The Navy's Squadron Manpower Requirements Pro-
gram documents manpower requirements for aviation squadrons.
These requirements are then promulgated through instructions
called Squadron Manpower Documents (SQMD). Manpower totals
within the SQMD are for full funding conditions and represent
a unit's required manning levels during wartime conditions.
Since full funding levels are seldom provided a second docu-r|
ment called Manpower Authorization Instruction (OPNAV 10 / 2)
is published. The Manpower Authorization Instructions provides
the basis for manning levels of less than full funding throuh-
24
I'2 -
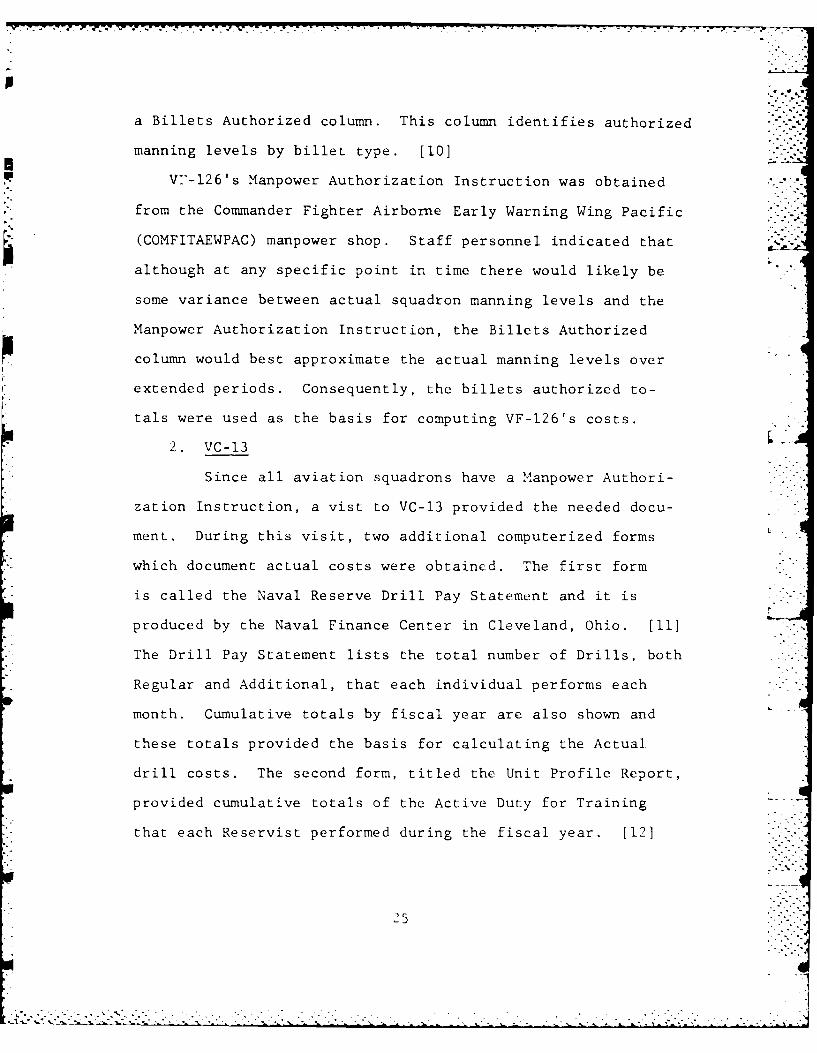
a Billets Authorized column. This column identifies authorized ".
manning levels by billet type. [10]
Vi7-126's Manpower Authorization Instruction was obtained
from the Commander Fighter Airborne Early Warning Wing Pacific
(COMFITAEWPAC) manpower shop. Staff personnel indicated that
although at any specific point in time there would likely be
some variance between actual squadron manning levels and the
Manpower Authorization Instruction, the Billets Authorized
column would best approximate the actual manning levels over
extended periods. Consequently, the billets authorized to-
tals were used as the basis for computing VF-126's costs.
2. VC-13
Since all aviation squadrons have a Manpower Authori-
zation Instruction, a vist to VC-13 provided the needed docu-
ment. During this visit, two additional computerized forms
which document actual costs were obtained. The first form
is called the Naval Reserve Drill Pay Statement and it is
produced by the Naval Finance Center in Cleveland, Ohio. [11]
The Drill Pay Statement lists the total number of Drills, both
Regular and Additional, that each individual performs each
month. Cumulative totals by fiscal year are also shown and
these totals provided the basis for calculating the Actual.
drill costs. The second form, titled the Unit Profile Report,
provided cumulative totals of the Active Duty for Training
that each Reservist performed during the fiscal year. [12] .-
25
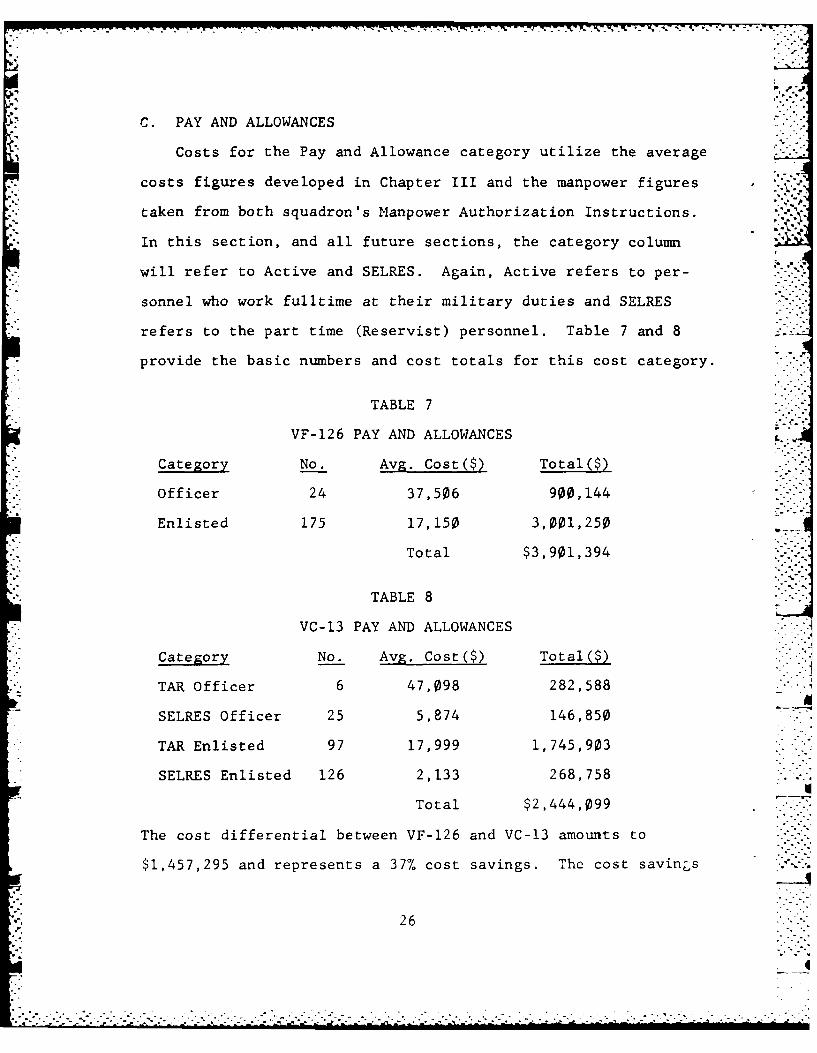
C. PAY AND ALLOWANCES
Costs for the Pay and Allowance category utilize the average
costs figures developed in Chapter III and the manpower figures
taken from both squadron's Manpower Authorization Instructions.
In this section, and all future sections, the category column
will refer to Active and SELRES. Again, Active refers to per-
sonnel who work fulltime at their military duties and SELRES
refers to the part time (Reservist) personnel. Table 7 and 8 -f
provide the basic numbers and cost totals for this cost category.
TABLE 7
VF-126 PAY AND ALLOWANCES 8.
Category No. Avg. Cost($) Total($)
Officer 24 37,506 900,144
Enlisted 175 17,150 3,001,250
Total $3,901,394
TABLE 8
VC-13 PAY AND ALLOWANCES
Category No. Avg. Cost($) Total(S)
TAR Officer 6 47,098 282,588
SELRES Officer 25 5,874 146,850
TAR Enlisted 97 17,999 1,745,903
SELRES Enlisted 126 2,133 268,758
Total $2,444,099
The cost differential between VF-126 and VC-13 amounts to
$1,457,295 and represents a 37% cost savings. The cost savings
26
4
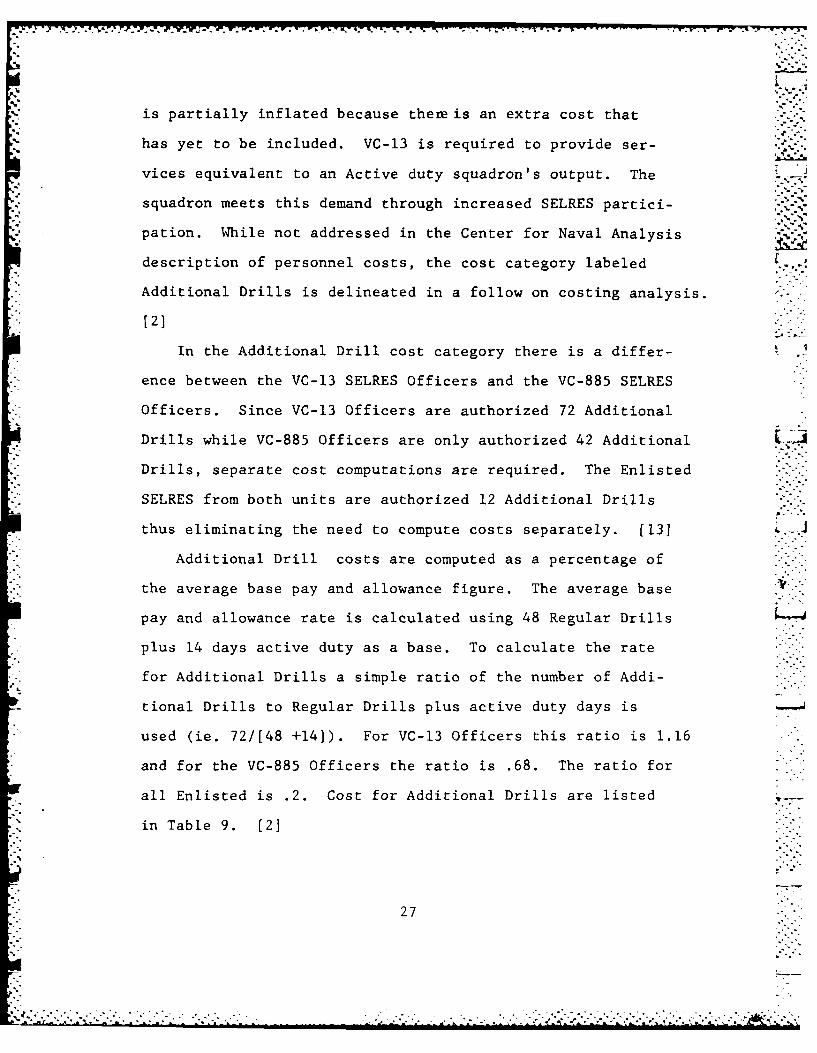
is partially inflated because ther is an extra cost that
has yet to be included. VC-13 is required to provide ser-
vices equivalent to an Active duty squadron's output. The *,. .
squadron meets this demand through increased SELRES partici-
pation. While not addressed in the Center for Naval Analysis ,,.
description of personnel costs, the cost category labeled
Additional Drills is delineated in a follow on costing analysis.
[2]
In the Additional Drill cost category there is a differ-
ence between the VC-13 SELRES Officers and the VC-885 SELRES
Officers. Since VC-13 Officers are authorized 72 Additional
Drills while VC-885 Officers are only authorized 42 Additional LA
Drills, separate cost computations are required. The Enlisted
SELRES from both units are authorized 12 Additional Drills
thus eliminating the need to compute costs separately. (13.
Additional Drill costs are computed as a percentage of
the average base pay and allowance figure. The average base
pay and allowance rate is calculated using 48 Regular Drills
plus 14 days active duty as a base. To calculate the rate
for Additional Drills a simple ratio of the number of Addi-
tional Drills to Regular Drills plus active duty days is
used (ie. 72/[48 +14]). For VC-13 Officers this ratio is 1.16
and for the VC-885 Officers the ratio is .68. The ratio for
all Enlisted is .2. Cost for Additional Drills are listed
in Table 9. (2]
27
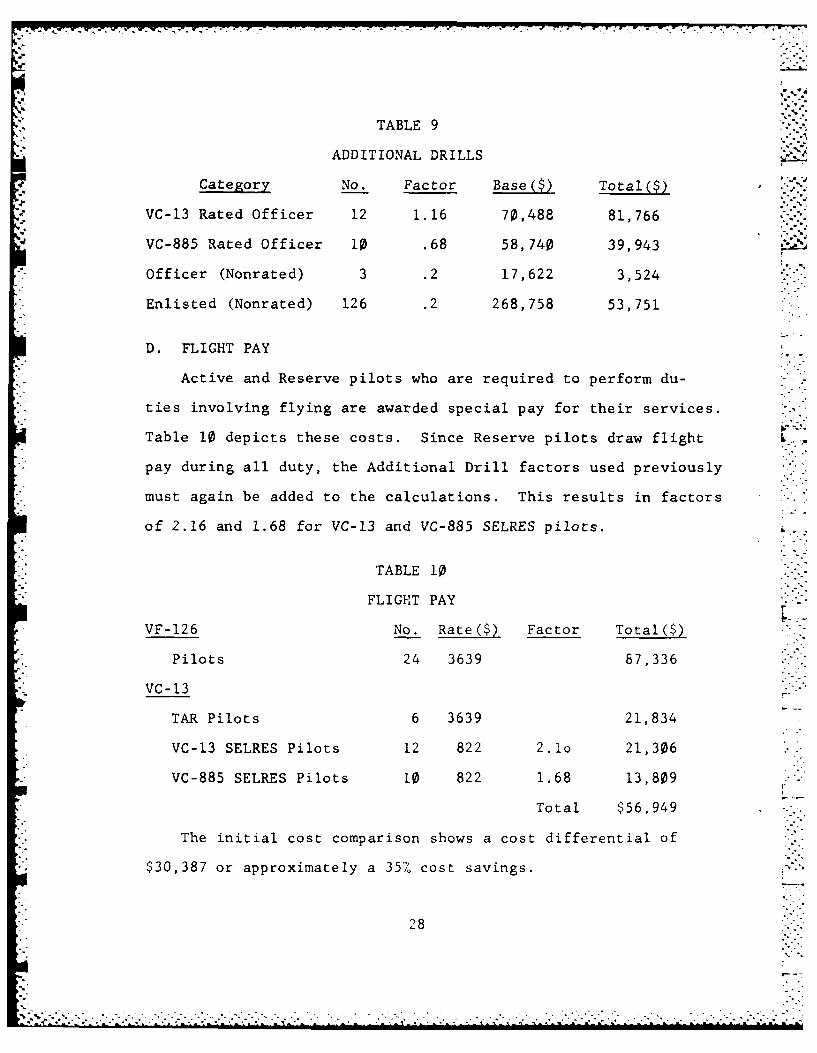
TABLE 9
ADDITIONAL DRILLS__
Category No. Factor Base($) Total($)'
VC-13 Rated Officer 12 1.16 70,488 81,766
VC-885 Rated Officer 10 .68 58,740 39,943
Officer (Nonrated) 3 .2 17,622 3,524
*Enlisted (Nonrated) 126 .2 268,758 53,751
D. FLIGHT PAY
Active and Reserve pilots who are required to perform du-
ties involving flying are awarded special pay for their services.
Table 10 depicts these costs. Since Reserve pilots draw flight
pay during all duty, the Additional Drill factors used previously
must again be added to the calculations. This results in factors
of 2.16 and 1.68 for VC-13 and VC-885 SELRES pilots.
TABLE 10
FLIGH~T PAY
VF- 126 No. Rate($) Factor Total ($)
Pilots 24 3639 87,336
VC-13
TAR Pilots 6 3639 21,834
VC-13 SELRES Pilots 12 822 2.1o 21,306
VC-885 SELRES Pilots 10 822 1.68 13,809
Total $56,949
The initial cost comparison shows a cost differential of
$30,387 or approximately a 35%~ cost savings.
28
The use of average costs can distort results when the
assumption of nearly uniform cost distribution is not justi-
fied. Active duty flight pay costs fall into this category.
Beginning in 1981, Congress authorized an additional special
pay for aviators called the pilot bonus. Congress, along with
the Navy, was responding to a severe drain on the pilot supply
by the civilian airline industry. The greatest drain was in
the group of aviators who had completed their initial obliga-
tion for service but had not yet had the time invested towards
retirement that would deter them from leaving the Navy. Pilot
bonuses are limited to aviators who fall within this group.
The bonus amounts to $6000 per year for up to six years. The
net increase to aviators accepting the bonus amounts to $4872
because the normal flight pay is reduced by $94 per month when
the bonus is awarded. [14] Each pilot who accepts the bonus
incurs an obligation to perform additional years of service.
When civilian airline positions are available or projected to
be available, this obligation causes many pilots to reject or
delay accepting the bonus. Information provided by OP-130
indicates that approximately 39 percent of those eligible
accept the bonus. [15] SELRES pilots are not eligible for
the bonus.
Based on the above information, the $3639 average flight
pay cost used in Table 10 should be adjusted by a factor of
.39 times $4872 or $1900.
29
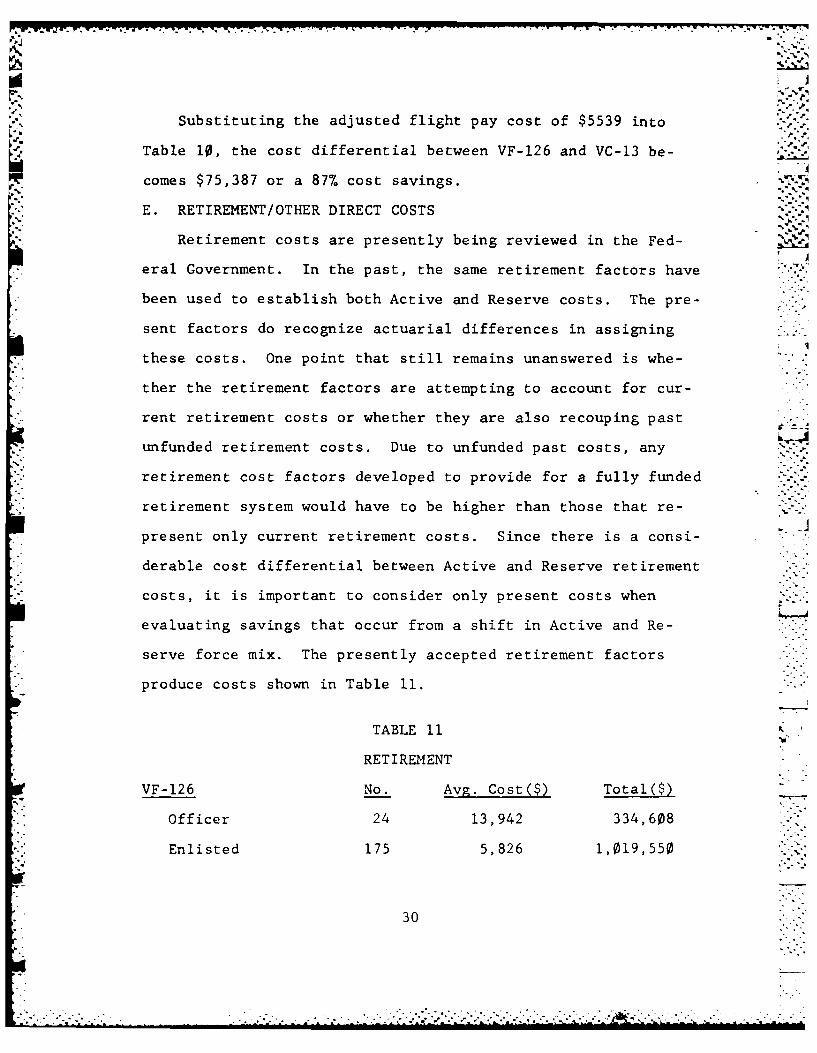
Substituting the adjusted flight pay cost of $5539 into
Table 10, the cost differential between VF-126 and VC-13 be-
comes $75,387 or a 87% cost savings.
E. RETIREMENT/OTHER DIRECT COSTS
Retirement costs are presently being reviewed in the Fed-
eral Government. In the past, the same retirement factors have
been used to establish both Active and Reserve costs. The pre-
sent factors do recognize actuarial differences in assigning
these costs. One point that still remains unanswered is whe-
ther the retirement factors are attempting to account for cur-
rent retirement costs or whether they are also recouping past
unfunded retirement costs. Due to unfunded past costs, any
retirement cost factors developed to provide for a fully funded
retirement system would have to be higher than those that re-
A_present only current retirement costs. Since there is a consi-
derable cost differential between Active and Reserve retirement
costs, it is important to consider only present costs when
evaluating savings that occur from a shift in Active and Re-
serve force mix. The presently accepted retirement factors
produce costs shown in Table 11.
TABLE 11
RET I REMENT
VF-126 No. Avg. Cost($) Total($)
Officer 24 13,942 334,608
Enlisted 175 5,826 1,019,550
30
- ..- ."."".' "".'".... ......
["-6 '%q "'
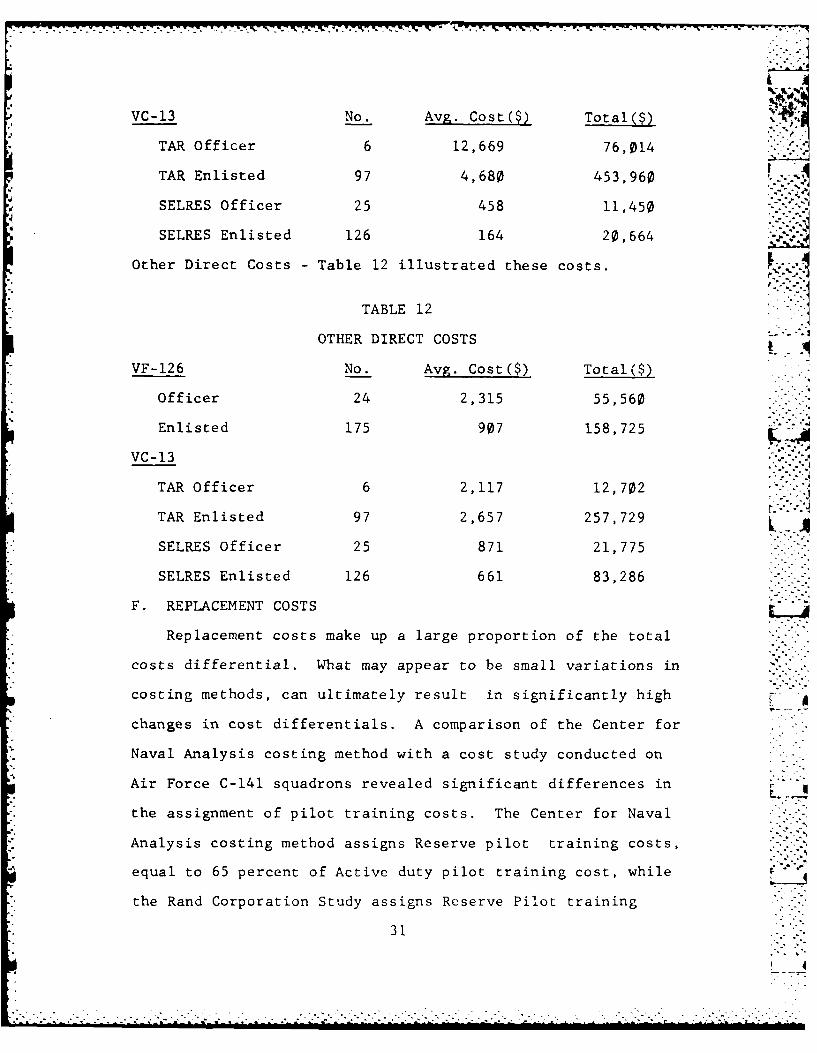
VC-13 No. Avg. Cost($) Total ($)
TAR Officer 6 12,669 76,014
TAR Enlisted 97 4,680 453,960
SELRES Officer 25 458 11,450
SELRES Enlisted 126 164 20,664
Other Direct Costs - Table 12 illustrated these costs.
TABLE 12
OTHER DIRECT COSTS
VF-126 No. Avg. Cost($) Total($)
Officer 24 2,315 55,560
Enlisted 175 907 158,725
VC-13
TAR Officer 6 2,117 12,702
TAR Enlisted 97 2,657 257,729 -
SELRES Officer 25 871 21,775
SELRES Enlisted 126 661 83,286
F. REPLACEMENT COSTS L a
Replacement costs make up a large proportion of the total
costs differential. What may appear to be small variations in
costing methods, can ultimately result in significantly high
changes in cost differentials. A comparison of the Center for
Naval Analysis costing method with a cost study conducted on
Air Force C-141 squadrons revealed significant differences in "
the assignment of pilot training costs. The Center for Naval
Analysis costing method assigns Reserve pilot training costs,
equal to 65 percent of Active duty pilot training cost, while
the Rand Corporation Study assigns Reserve Pilot training
31
"ask"
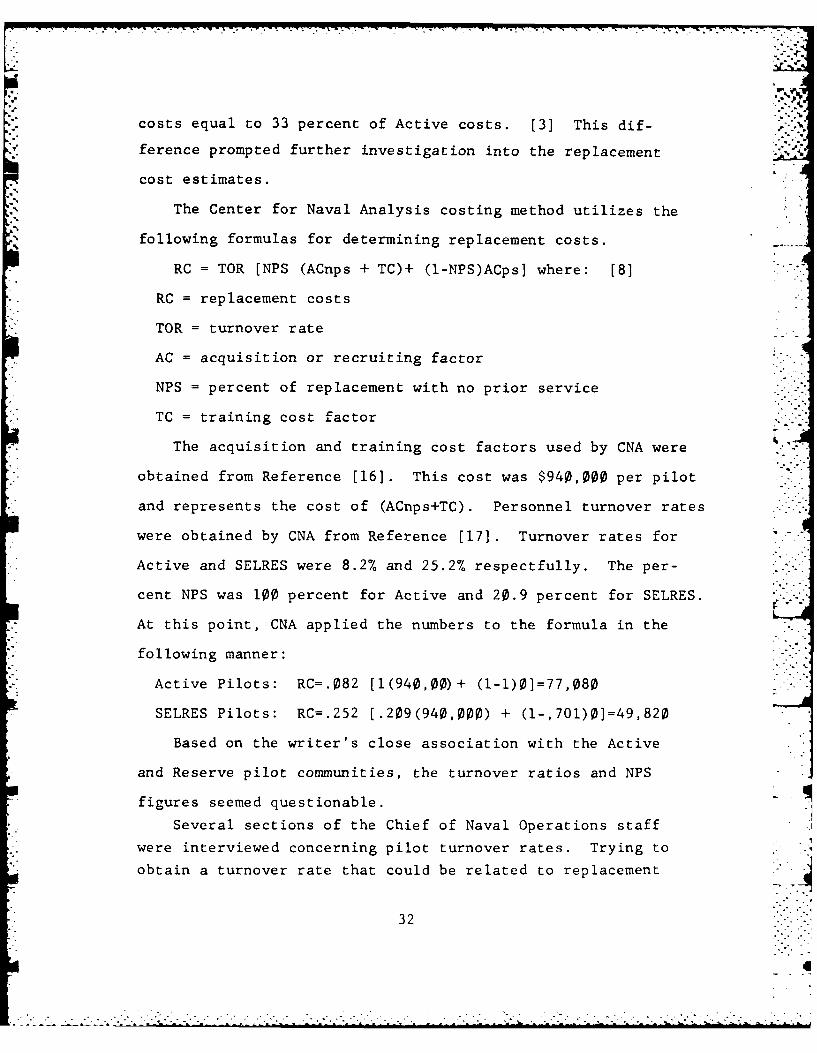
costs equal to 33 percent of Active costs. [3] This dif-
ference prompted further investigation into the replacement
cost estimates.
The Center for Naval Analysis costing method utilizes the
following formulas for determining replacement costs.
RC = TOR [NPS (ACnps + TC)+ (I-NPS)ACps] where: [8]
RC = replacement costs
TOR = turnover rate
AC = acquisition or recruiting factor
NPS = percent of replacement with no prior service
TC = training cost factor
The acquisition and training cost factors used by CNA were
obtained from Reference [16]. This cost was $940,000 per pilot
and represents the cost of (ACnps+TC). Personnel turnover rates
were obtained by CNA from Reference [17]. Turnover rates for
Active and SELRES were 8.2% and 25.2% respectfully. The per-
cent NPS was 100 percent for Active and 20.9 percent for SELRES.
At this point, CNA applied the numbers to the formula in the
following manner:
Active Pilots: RC=.082 [1(940,00)+ (1-1)01=77,080
SELRES Pilots: RC=.252 [.209(940,000) + (1-,701)0]=49,820
Based on the writer's close association with the Active
and Reserve pilot communities, the turnover ratios and NPS
figures seemed questionable.
Several sections of the Chief of Naval Operations staff
were interviewed concerning pilot turnover rates. Trying to
obtain a turnover rate that could be related to replacement
32
4llo T
. , ~r , ., . . , . .- . v . - -Lj-n- ''' " - '- . ' .- w k" - - . -. -. - m- - ,
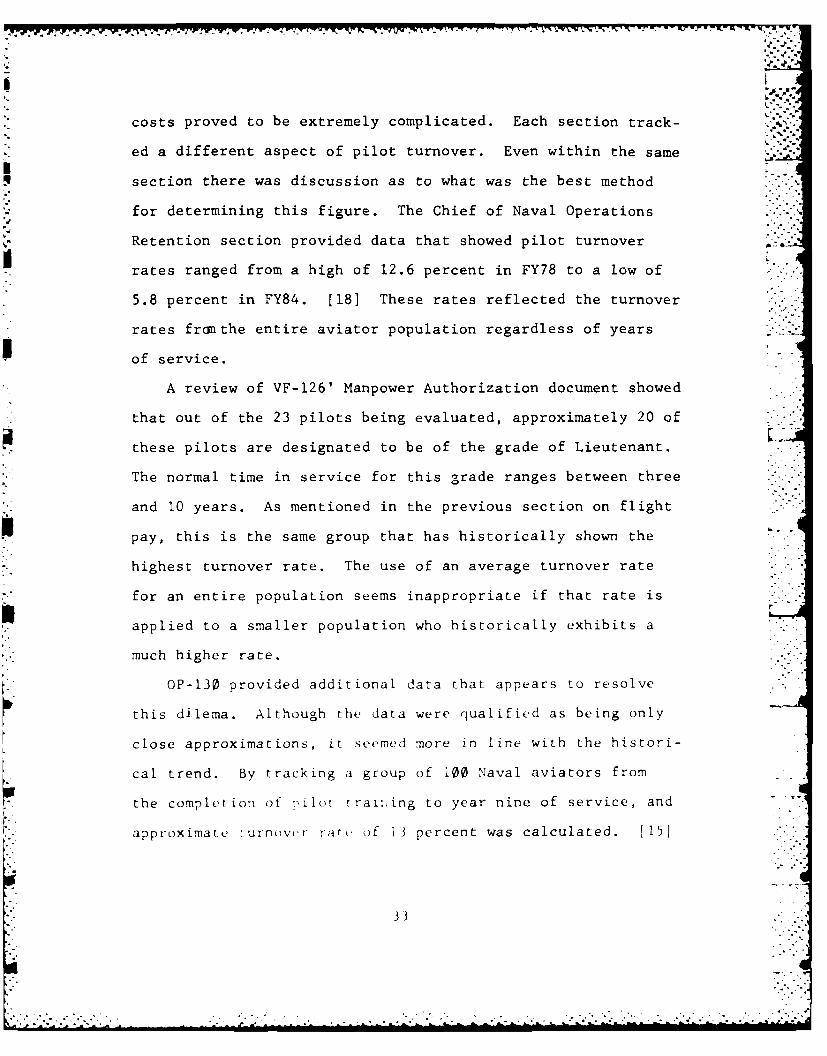
costs proved to be extremely complicated. Each section track-
ed a different aspect of pilot turnover. Even within the same
section there was discussion as to what was the best method
for determining this figure. The Chief of Naval Operations
Retention section provided data that showed pilot turnover
rates ranged from a high of 12.6 percent in FY78 to a low of
5.8 percent in FY84. [18] These rates reflected the turnover
rates franthe entire aviator population regardless of years
of service.
A review of VF-126' Manpower Authorization document showed
that out of the 23 pilots being evaluated, approximately 20 of
these pilots are designated to be of the grade of Lieutenant.
The normal time in service for this grade ranges between three
and 10 years. As mentioned in the previous section on flight
pay, this is the same group that has historically shown the
highest turnover rate. The use of an average turnover rate
for an entire population seems inappropriate if that rate is
applied to a smaller population who historically exhibits a
much higher rate.
OP-130 provided additional data that appears to resolve
this dilema. Although the data were qualified as being only
close approximations, it seemed more in line with the histori-
cal trend. By tracking a group of 100 Naval aviators from
the completion of pilot trai:,ing to year nine of service, and
approximate turnovwr raft, of 13 percent was calculated. [151
33 i"
- - . . - -' -- ~ - - 9~*-.-.-. ---. . -- . .
79 7~
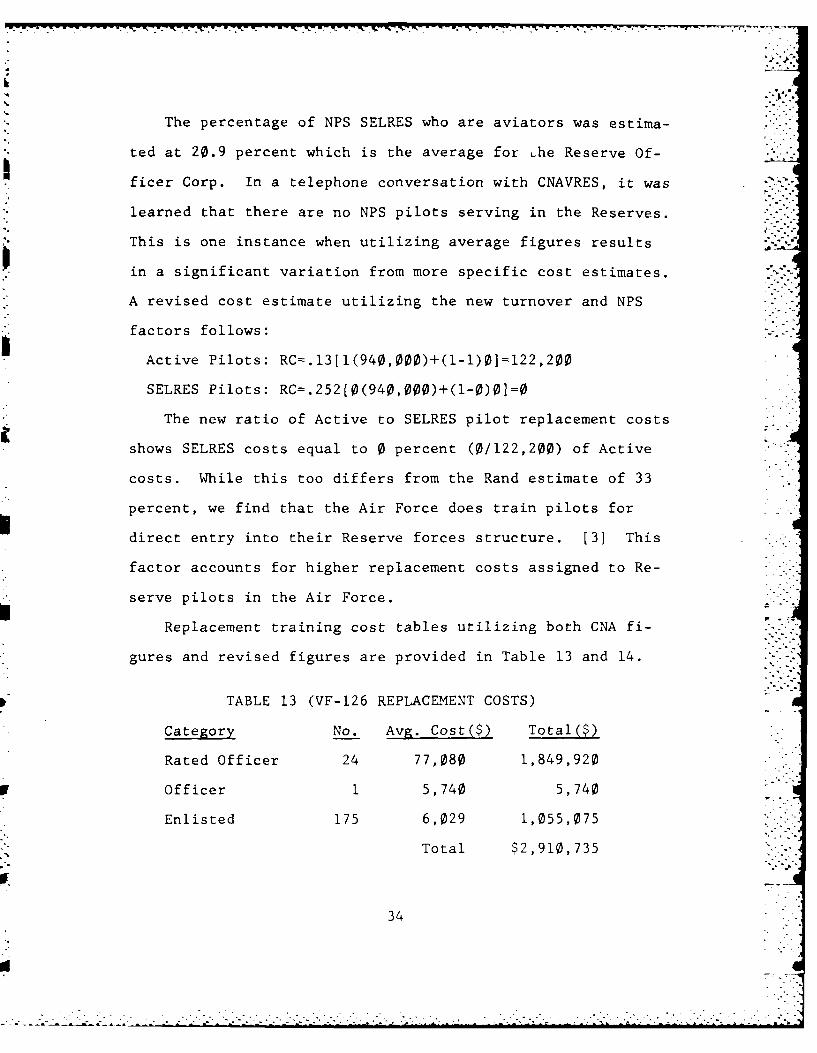
The percentage of NPS SELRES who are aviators was estima-
ted at 20.9 percent which is the average for Lhe Reserve Of-
ficer Corp. In a telephone conversation with CNAVRES, it was
learned that there are no NPS pilots serving in the Reserves.
This is one instance when utilizing average figures results
in a significant variation from more specific cost estimates.
A revised cost estimate utilizing the new turnover and NPS
factors follows:
Active Pilots: RC=.13[1(940,000)+(1-1)0]=122,200
SELRES Pilots: RC=.252[0(940,000)+(l-0)0l=0
The new ratio of Active to SELRES pilot replacement costs
shows SELRES costs equal to 0 percent (0/122,200) of Active
costs. While this too differs from the Rand estimate of 33 . -
percent, we find that the Air Force does train pilots for
direct entry into their Reserve forces structure. [3] This
factor accounts for higher replacement costs assigned to Re-
serve pilots in the Air Force.
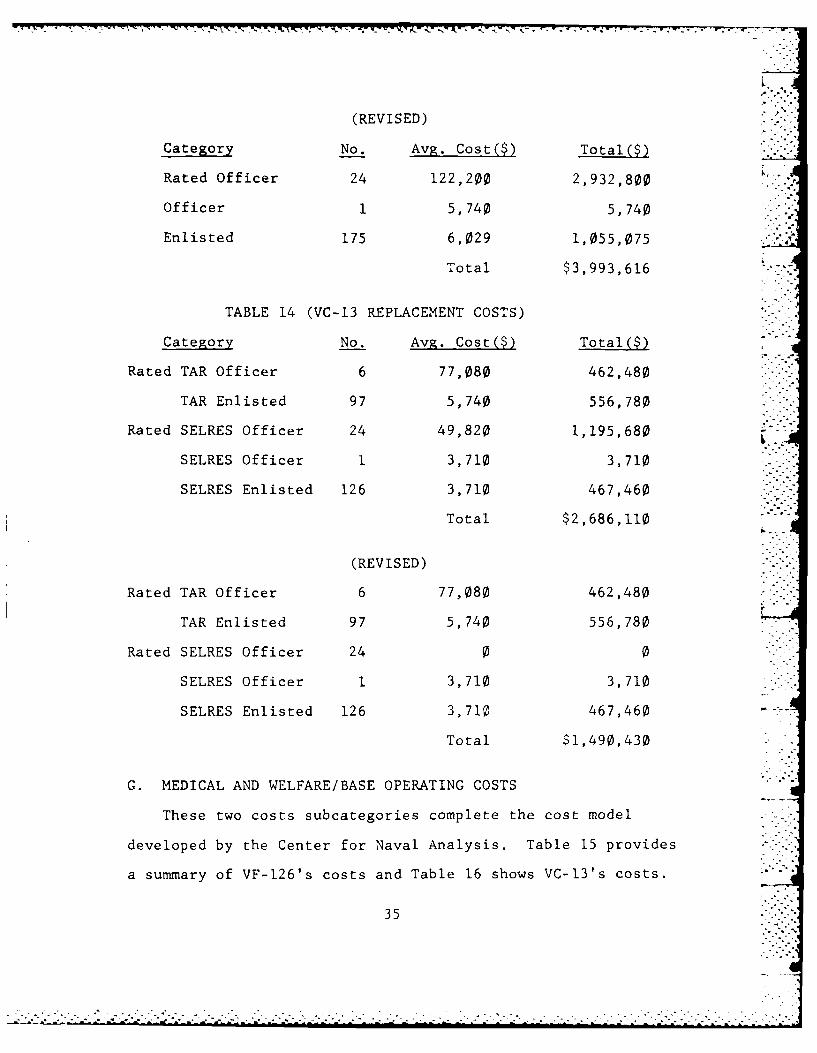
Replacement training cost tables utilizing both CNA fi-
gures and revised figures are provided in Table 13 and 14.
TABLE 13 (VF-126 REPLACEMENT COSTS)
Category No. Avg. Cost($) Total($)
Rated Officer 24 77,080 1,849,920
P Officer 1 5,740 5,740
Enlisted 175 6,029 1,055,075
Total $2,910,735
34
.1-
y~. - ~ 'J~. ~ - ...*
(REV ISED)
Category No. Avg. Cost($) Total($)
Rated Officer 24 122,200 2,932,800
Officer 1 5,740 5,740
Enlisted 175 6,029 1,055,075
Total $3,993,616
TABLE 14 (VC-13 REPLACEMENT COSTS)
Category No. Avg. Cost($) Total($)
Rated TAR Officer 6 77,080 462,480
TAR Enlisted 97 5,740 556,780
Rated SELRES Officer 24 49,820 1,195,680
SELRES Officer 1 3,710 3,710
SELRES Enlisted 126 3,710 467,460
Total $2,686,110
(REVISED)
Rated TAR Officer 6 77,080 462,480
TAR Enlisted 97 5,740 556,780
Rated SELRES Officer 24 0 0
SELRES Officer 1 3,710 3,710 ' - -
SELRES Enlisted 126 3,710 467,460
Total $1,490,430
G. MEDICAL AND WELFARE/BASE OPERATING COSTS
These two costs subcategories complete the cost model
developed by the Center for Naval Analysis. Table 15 provides
a summary of VF-126's costs and Table 16 shows VC-13's costs.
35
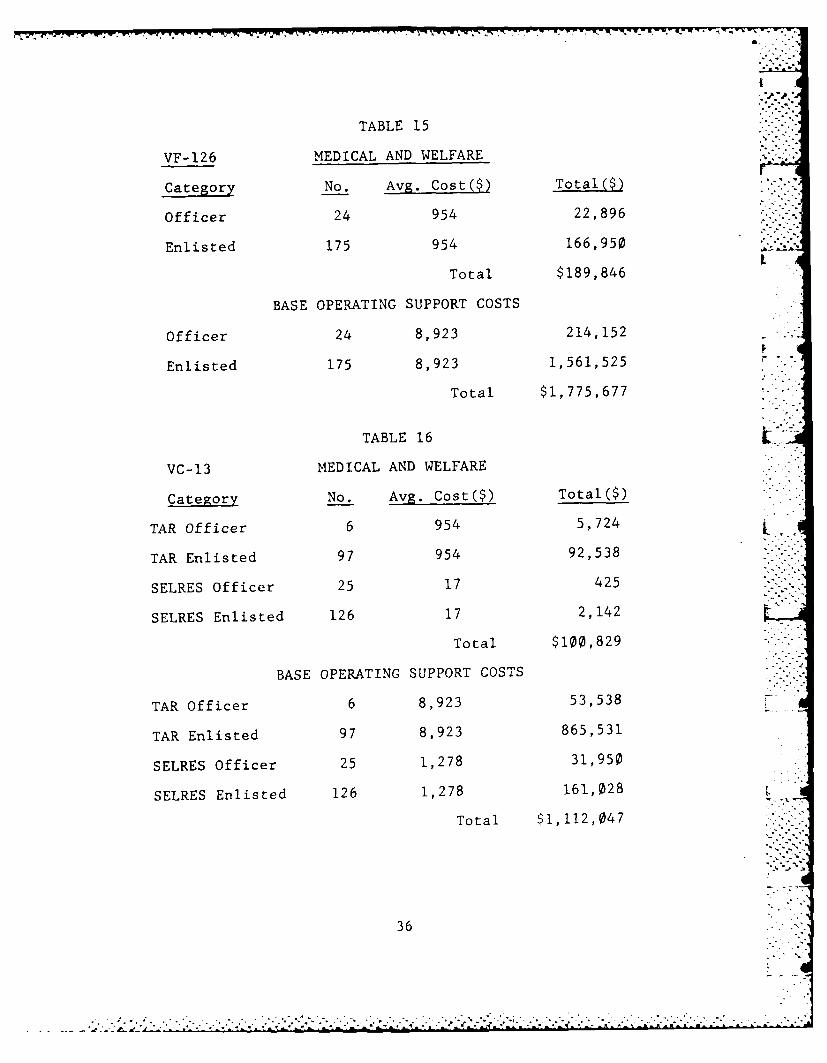
TABLE 15
VF-126 MEDICAL AND WELFARE -.
Category No. Avg. Cost($) Total($)
Officer 24 954 22,896
Enlisted 175 954 166,950L
Total $189,846
BASE OPERATING SUPPORT COSTS
Officer 24 8,923 214,152
Enlisted 175 8,923 1,561,525
Total $1,775,677
TABLE 16
VC-13 MEDICAL AND WELFARE
Category No. Avg. Cost($) Total($)
TAR Officer 6 954 5,724
TAR Enlisted 97 954 92,538
SELRES Officer 25 17 425
SELRES Enlisted 126 17 2,142
Total $100,829
BASE OPERATING SUPPORT COSTS
TAR Officer 6 8,923 53,538
TAR Enlisted 97 8,923 865,531
SELRES Officer 25 1,278 31,950
SELRES Enlisted 126 1,278 161,028
Total $1,112,047
36
. ~. . . . . . . . .
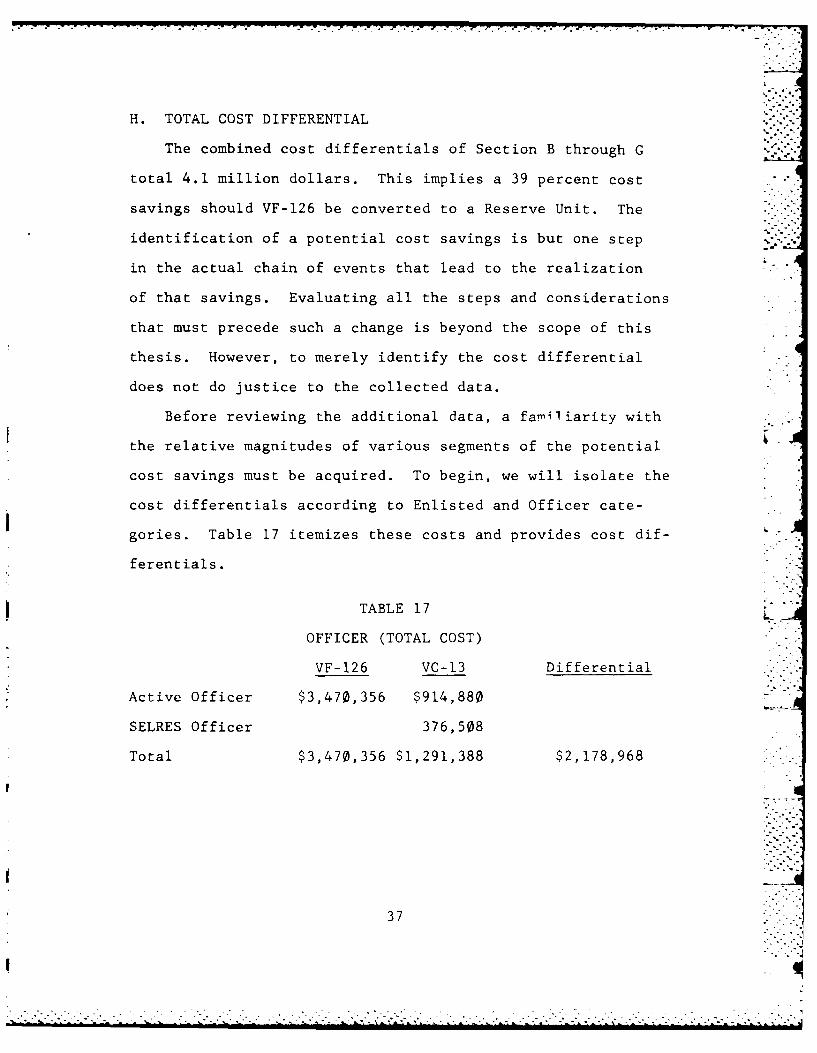
H. TOTAL COST DIFFERENTIAL
The combined cost differentials of Section B through G
total 4.1 million dollars. This implies a 39 percent cost
savings should VF-126 be converted to a Reserve Unit. The
identification of a potential cost savings is but one step
in the actual chain of events that lead to the realization
of that savings. Evaluating all the steps and considerations
that must precede such a change is beyond the scope of this
thesis. However, to merely identify the cost differential
does not do justice to the collected data.
Before reviewing the additional data, a familiarity with
the relative magnitudes of various segments of the potential
cost savings must be acquired. To begin, we will isolate the
cost differentials according to Enlisted and Officer cate-
gories. Table 17 itemizes these costs and provides cost dif-
ferentials.
TABLE 17,_
OFFICER (TOTAL COST)
VF-126 VC-13 Differential
Active Officer $3,470,356 $914,880
SELRES Officer 376,508
Total $3,470,356 $1,291,388 $2,178,968
37
- .
37•.l
I .. . .
, .
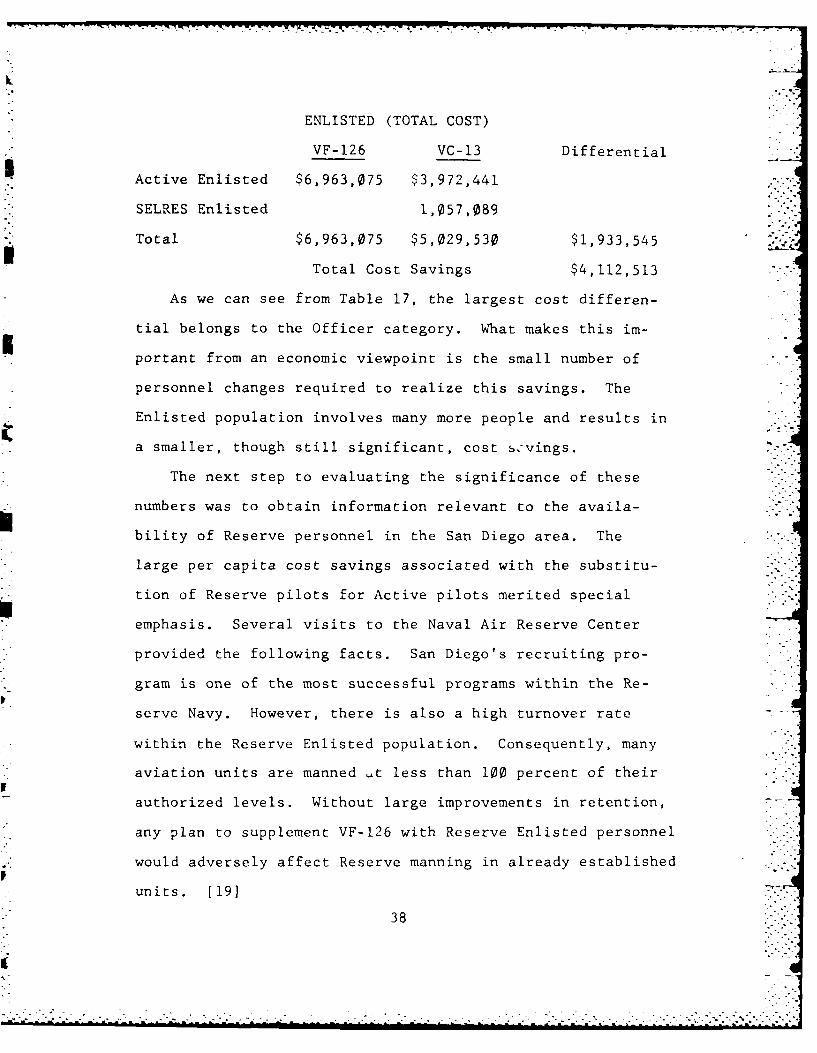
ENLISTED (TOTAL COST)
VF-126 VC-13 Differential
Active Enlisted $6,963,075 $3,972,441
SELRES Enlisted 1,057,089
Total $6,963,075 $5,029,530 $1,933,545
Total Cost Savings $4,112,513
As we can see from Table 17, the largest cost differen-
tial belongs to the Officer category. What makes this im-
portant from an economic viewpoint is the small number of
personnel changes required to realize this savings. The
Enlisted population involves many more people and results in
a smaller, though still significant, cost scvings.
The next step to evaluating the significance of these
numbers was to obtain information relevant to the availa-
bility of Reserve personnel in the San Diego area. The
large per capita cost savings associated with the substitu-
tion of Reserve pilots for Active pilots merited special
emphasis. Several visits to the Naval Air Reserve Center
provided the following facts. San Diego's recruiting pro-
gram is one of the most successful programs within the Re-
serve Navy. However, there is also a high turnover rate --
within the Reserve Enlisted population. Consequently, many
aviation units are manned ,t less than 100 percent of theirII
authorized levels. Without large improvements in retention,
any plan to supplement VF-126 with Reserve Enlisted personnel
would adversely affect Reserve manning in already established
units. [19]
38
. . . . . .. . . -m
Reserve pilot resources proved similar to the Reserve
Enlisted situation with one noticeable exception. Data did
indicate that several aviation units were undermanned in the
pilot category. However, there was a large pool of aviators
who were no longer flying, in any capacity, assigned to the
Naval Air Reserve Center. M1ost of these pilots had served
at one time or another in the very same units that now showed
pilot vacancies. The pool of pilots was the direct result of
a pay grade restriction which prohibits pilots who reach the
pay grade of 0-5 from serving in Reserve Units unless they
are assigned to an 0-5 billet. Since there are usually only
two such billets per unit, many pilots find their flying
careers ending around the 15 years of service time frame.
Lacking the 20 years of service required for retirement,
these pilots complete their remaining five years by drilling
at various Reserve centers. Presently, there are 18 pilots
who meet all the requirements to fly VC-13 or VF-126 aircraft
but, because of this policy, are prohibited from doing so.
[19]
The relationship that this information has with the
previously identified cost differentials can best be shown
by answering the question, "What price are we paying by not
utilizing these pilots?". To illustrate the significance of
this question a theoretical cost comparison has been con-
structed. Suppose that we elect to use the pooled Reserve
pilots to replace 10 VF-126 pilots. Since Reserve pilots
39
fly less hours per year than Active pilots, a greater than
one to one trade-off must be made. Dividing VF-126's per
capita flight time average (200 hours) by the average per
Reserve pilot (130 hours) we get a trade-off ratio of ap-
proximately 1.5. Thus, it will take 15 Reserve pilots to
replace the 10 Active duty pilots. Utilizing the Center
for Naval Analysis costing method the cost of 10 Active
pilots is $1,443,590 and the cost for 15 Reserve pilots is
$256,310. The cost savings is $1,187,280. Utilizing the
alternative replacement cost figures resulting from a higher
Active pilot turnover rate, the Active pilot cost is
$1,894,790. The answer to the theoretical question is that -
we are losing somewhere between $1,187,280 and $1,638,480
by not using these Reserve pilots.
I. ACTUAL COSTS VERSUS COMPUTED COSTS
After calculating the total cost differential, one ques-
tion still cast an air of uneasiness over the results. One
of the major reasons VC-13 was chosen for this cost comparison
was that it was not a typical Reserve unit. Unlike most Re-
serve units whose activity levels are well below their Active
counterparts, VC-13 activity level matches those of most
Active squadrons. There is even consideration being given
to increasing VC-13 flight hour program to 5000 hours per
year. [191
During the data collection phase, it became apparent that
Reserve personnel within VC-13 were serving more time than
40
.......................................... o...."
. . -.
the Center for Naval Analysis costing method had used as a
norm. Since the average cost figures were derived using force
budget totals and normal Reserve participation requirements,
there remained some doubt as to the accuracy of this costing
approach. To resolve this issue, all available actual cost
data was obtained from VC-13.
Section A described the documents that provided the
source for pay and allowance plus flight pay actual costs.
Efforts to recover actual cost data on the remaining cost
categories proved to be fruitless. These costs are analagous
to intangible costs in that there is no billing procedures
or direct cost link between services rendered and cost assign-
ment. Consideration was given to using specific budget totals
like those for a medical facility or a base transportation
department. However, the determination of a basis for cost
assignment required too many assumptions.
In the areas where costs are not accumulated like pay
and allowances, the Center for Naval Analysis' approach using
aggregate budgets appears to limit cost basis assumptions to
a single basic one. The basic assumption is that all indivi-
duals receive approximately an equal proportion of these
services. Given that this investigation produced no local
source documents, no cost accounting codes, or any local pro-
cedures that would enable one to determine actual costs on
the individual level, the Center for Naval Analysis' approach
seems reasonable. The actual cost comparison reduces down
41
• . .o
."
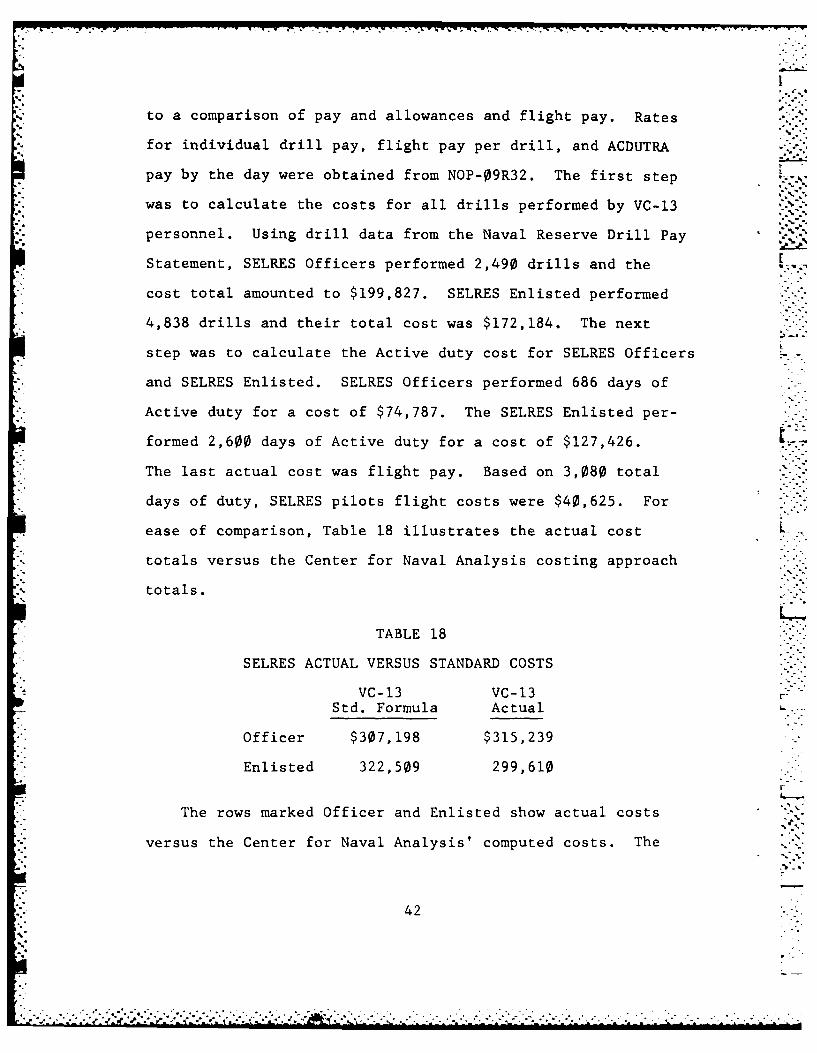
to a comparison of pay and allowances and flight pay. Rates
for individual drill pay, flight pay per drill, and ACDUTRA
pay by the day were obtained from NOP-09R32. The first step
was to calculate the costs for all drills performed by VC-13 Kpersonnel. Using drill data from the Naval Reserve Drill Pay
Statement, SELRES Officers performed 2,490 drills and the
cost total amounted to $199,827. SELRES Enlisted performed
4,838 drills and their total cost was $172,184. The next
step was to calculate the Active duty cost for SELRES Officers
and SELRES Enlisted. SELRES Officers performed 686 days of
Active duty for a cost of $74,787. The SELRES Enlisted per-
formed 2,600 days of Active duty for a cost of $127,426.
The last actual cost was flight pay. Based on 3,080 total
days of duty, SELRES pilots flight costs were $40,625. For
ease of comparison, Table 18 illustrates the actual cost
totals versus the Center for Naval Analysis costing approach
totals.
TABLE 18
SELRES ACTUAL VERSUS STANDARD COSTS
VC-13 VC-13Std. Formula Actual
Officer $307,198 $315,239
Enlisted 322,509 299,610
The rows marked Officer and Enlisted show actual costs
versus the Center for Naval Analysis' computed costs. The
42
.........................
cost differentials result in a seven percent variation between
the Enlisted costs and less than a three percent variation in
the Officer costs. While only one example, this result re-
flects well on the accuracy of the Center for Naval Analysis ...
method.
ii
. .
V. SUMMARY, CONCLUSIONS, AND RECOM4MENDATIONS
A. SUMMARY .-
Chapter I stated that the objective of this research was
to identify the cost differences between an Active duty sup-
port squadron and a similar Reserve support squadron. The
interest in this cost area was generated by a growing public
concern over increased defense spending and Congressional
directives stressing the need to reduce costs through more
efficient use of available Reserve Forces. Support units
were chosen for this study because mobilization requirements,
operational environment, and unit personnel structure were
viewed as less restrictive to any full or partial implemen-
tation considerations.
Chapter II provided a brief introduction to the Reserve
Forces with emphasis on defining the key personnel terms and
Reserve participation requirements. Building on these new
concepts, two aircraft squadrons with similar missions, size
and operational environment were described. Chapter III laid
the groundwork for the costing approach. Recent cost criteria
and methods were reviewed and a framework for assessing the
personnel costs of each organization was developed.
Chapter IV applied the costing methods and criteria from
Chapter III to data obtained from several research trips.
When individual results appeared to conflict with information
44
acquired during the research phase, explanations and alter-
native measures were introduced. Finally, an evaluation of
the costing approach and an identification of high concen-
trations of cost savings were discussed,
B. CONCLUSION
Substantial cost savings that occur within mobilization
type units (ie. Reserve fighter squadrons) are also present
within Reserve aviation support units. This cost comparison
identified a cost differential between VC-13 and VF-126 of
approximately 4.1 million dollars per year. The cost differ-
entials were almost equally divided between the Officer and
Enlisted personnel groups. Information obtained during the
research phase indicated that due to the current availability
of personnel, the 2.1 million dollar cost differential in
the Officer category appears to be the most likely area to6-
achieve cost savings.
Unlike many units that obtain a cost savings through
reduced operating tempo, aviation support units realize a .
cost savings while still providing the same basic service as
their active counterpart.
When large training investments are recoverable through
Reserve service, the cost savings increase dramatically.
From a strictly monetary viewpoint, present policy regarding
senior reserve Naval aviators precludes any recovery of
these training costs.
45
Current costing methods overstate the replacement costs
of Reserve Aviation Rated personnel while understating the
, replacement costs of Active Aviation personnel. The method
identified in this cost comparison results in approximately
a $95,000 difference per pilot over the previous costing
method.
C. SUMMARY OF RECOMMENDATIONS
1. Recommendation 1
CNA needs to review its cost factors in the area of
flight pay and replacement costs. Attention to high concen-
trations of aviators who are drawing bonuses can cause the
present CNA flight pay factor to almost double. General
population turnover factors should not be used if more spe-
cific rates can be obtained. This is especially critical
when computing costs which involve unusually high replace-
ment costs. Until the Navy specifically trains pilots for
SELRES billets, the Non Prior Service factor should remain 0
and SELRES pilot replacement costs should be treated as sunk
costs.
2. Recommendation 2
An in-depth study to determine the feasibility of
augmenting aviation support units with senior Reserve pilots
should be conducted. Without abandoning the existing policyF
to seek the youngest, most experienced aviators, it seems
plausible to incorporate a policy that is flexible enough to
ensure full use of this valuable resource. Presently, the
46
. ..
i% donly utilization of senior pilots is through a limited waiver
policy. Policy goals should seek to recoup this extensive
investment by continuing to fly Reserve pilots up to their
retirement date or a point where they are no longer physically
qualified to fly. % -C
3. Recommendation 3
A study to identify other aviation organizations
similar to the VC-13/VF-126 model should be conducted.
Initially, all Active adversary support squadrons could be
reviewed for possible augmentation by Reserve pilots.
47
29
A ~ ii
'
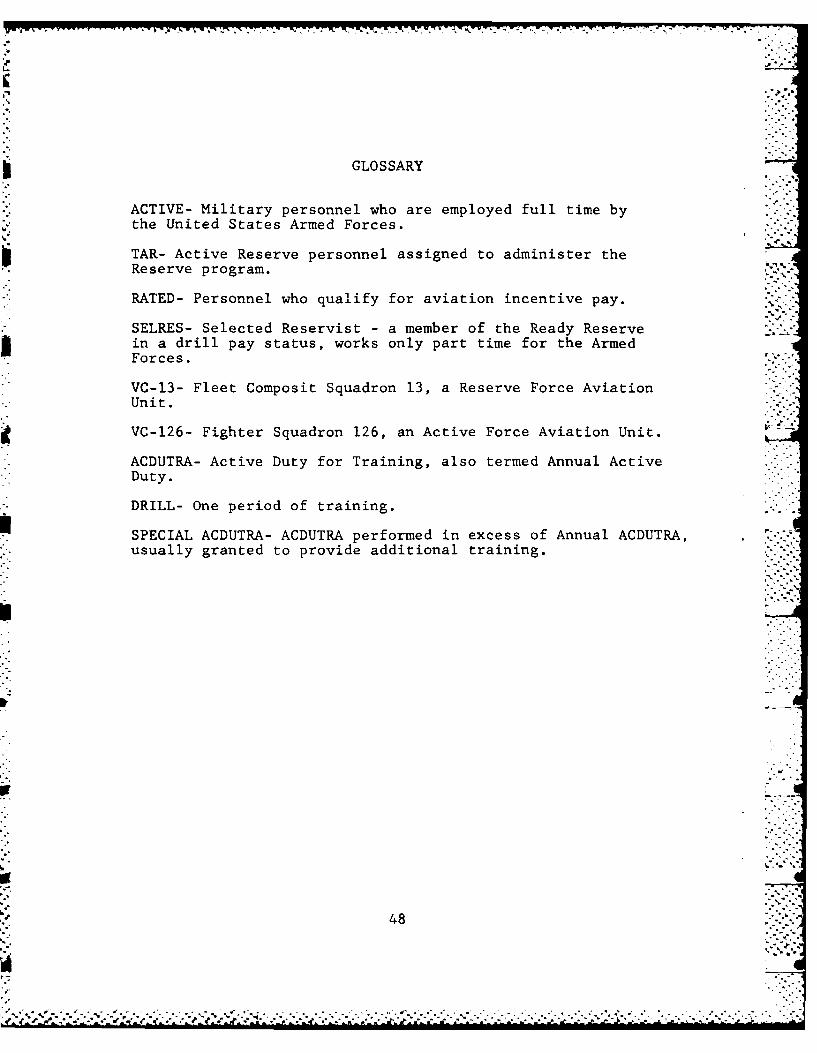
GLOSSARY
ACTIVE- Military personnel who are employed full time bythe United States Armed Forces.
TAR- Active Reserve personnel assigned to administer theReserve program.
RATED- Personnel who qualify for aviation incentive pay.
SELRES- Selected Reservist - a member of the Ready Reservein a drill pay status, works only part time for the ArmedForces.
VC-13- Fleet Composit Squadron 13, a Reserve Force Aviation
Unit.
VC-126- Fighter Squadron 126, an Active Force Aviation Unit.
ACDUTRA- Active Duty for Training, also termed Annual ActiveDuty.
DRILL- One period of training.
SPECIAL ACDUTRA- ACDUTRA performed in excess of Annual ACDUTRA,
usually granted to provide additional training.
48
-.*.-0'
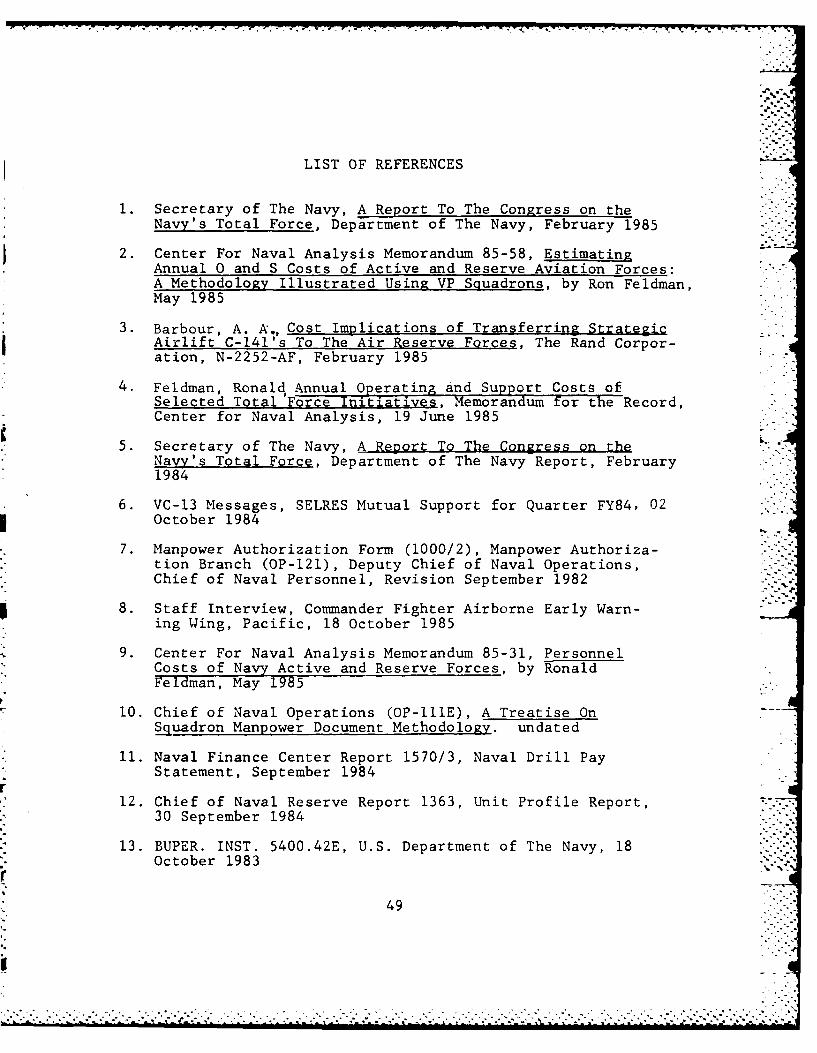
LIST OF REFERENCES
1. Secretary of The Navy, A Report To The Congress on theNavy's Total Force, Department of The Navy, February 1985
2. Center For Naval Analysis Memorandum 85-58, EstimatingAnnual 0 and S Costs of Active and Reserve Aviation Forces:A Methodology Illustrated Using VP Squadrons, by Ron Feldman,May 1985
3. Barbour, A. A., Cost Implications of Transferring StrategicAirlift C-141's To The Air Reserve Forces, The Rand Corpor-ation, N-2252-AF, February 1985
4. Feldman, Ronald, Annual Operating and Support Costs ofSelected Total Force Initiatives, Memorandum for the Record,Center for Naval Analysis, 19 June 1985
5. Secretary of The Navy, A Report To The Congress on the ."
Navy's Total Force, Department of The Navy Report, February1984
6. VC-13 Messages, SELRES Mutual Support for Quarter FY84, 02October 1984
7. Manpower Authorization Form (1000/2), Manpower Authoriza-tion Branch (OP-121), Deputy Chief of Naval Operations,Chief of Naval Personnel, Revision September 1982
8. Staff Interview, Commander Fighter Airborne Early Warn-ing Wing, Pacific, 18 October 1985
9. Center For Naval Analysis Memorandum 85-31, PersonnelCosts of Navy Active and Reserve Forces, by RonaldFeldman, May 1985
10. Chief of Naval Operations (OP-IlIE), A Treatise OnSquadron Manpower Document Methodology. undated
11. Naval Finance Center Report 1570/3, Naval Drill PayStatement, September 1984
12. Chief of Naval Reserve Report 1363, Unit Profile Report,30 September 1984
13. BUPER. INST. 5400.42E, U.S. Department of The Navy, 18October 1983
49
Ii:!:!
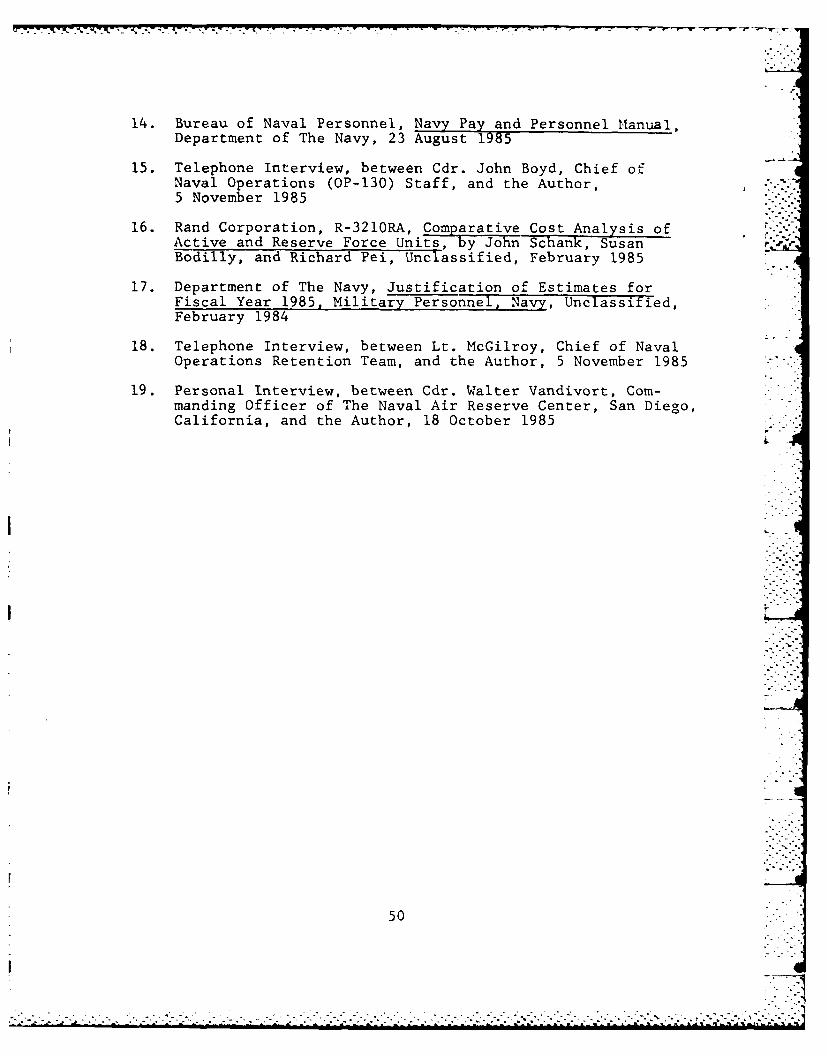
14. Bureau of Naval Personnel, Navy Pay and Personnel Manual,Department of The Navy, 23 August 1985
15. Telephone Interview, between Cdr. John Boyd, Chief ofNaval Operations (OP-130) Staff, and the Author,5 November 1985
16. Rand Corporation, R-3210RA, Comparative Cost Analysis ofActive and Reserve Force Units, by John Schank, SusanBodilly, and Richard Pei, Unclassified, February 1985
17. Department of The Navy, Justification of Estimates forFiscal Year 1985, Military Personnel, Navy, Unclassified,February 1984
18. Telephone Interview, between Lt. McGilroy, Chief of NavalOperations Retention Team, and the Author, 5 November 1985
19. Personal Interview, between Cdr. Walter Vandivort, Com-manding Officer of The Naval Air Reserve Center, San Diego,California, and the Author, 18 October 1985
50
- . . . . . . . . . .. . . . . . . . . . . . . . * ..- -. ~ - .. -.- .~. .-. ,--.-.I'
.. .. . . . ......... ........ '*. .............. .. <.2?""
INITIAL DISTRIBUTION LIST
No. Copies
1. Defense Technical Information Center 2Cameron StationAlexandria, Virginia 22304-6145
2. Library, Code 0142 2Naval Postgraduate SchoolMonterey, California 93943-5002
3. Associate Professor Roger Evered, Code 54 EV IDepartment of Administrative SciencesNaval Postgraduate SchoolMonterey, California 93943-5004
4. Cdr. M.O. Rishel USN (RET) 4Star Route 2Box 515Bracey, VA 23919
r
51Ir2
~*~* J 07....i l

'I.' .p. *~.
* *1.-
I
w
p k
* 48G'V
(.
('4~4**~~**~~
L *
,-~*.-- ~
-A
........................................... *.., .. .-