Embed Size (px)
Citation preview

AD-A282 274 JMENTATiUN PAGE10M.
1b, RESTR:CTIVE MARI(.NGS______N/A
LAQ I F!3. DSTR;8UTON IAVA:LABiLITY OF REPORT
Pa AEROF Rý' .3~(5 MONITORiNG ORO:A.ZAT,ON REPORT %\i.V&ER S)
6a AM FPERFORMAINu ORGA.NZA7ýON ioS O-C" SYMBOL 7a. NAME OF VO.NiTOR.'. ORO:AVZAT ONIndins Uiverity(if applicable)
6c. ADDRESS (City, State, and ZIP Code) 7b. ADC)QRESS (City, State. ard ZIP Code)
4,501 Central Avenue Building 410Columbus& IN 47203 Bolling AYB DC 20332-6448
Ba. _NA.M( OF FUNDiNG, SPONSOR.NQ 8b GFF Cg SYVBOL 9 P;OC',REVE&NT NSTP0AIE.NT IDENT;FCAT.ON N~7vORGANIZAT!ON j ifa~pllcable)
8'c. ADDRESS (City, Srtae, arid ZIP Code) 10, SOIYRCE OP V8o'.~ A ERS
Building 410 PROGRAM P40)ECT TASK O~ -IBolling MME DC 20332-6448 ELEMENT NO4. NO. NO ACCESSON 14,Y
_________________________________ 611027 1 2312 1 A-5 I
11. TITLE (Include Sec un ry Claslifica ton) T e = e u a n t m f P D a a o o i i y a t d e
two-dimensional electrophoresis
12. PERSONAL AUTHOR(S) Frank A. Witzm-ann, Ph.D.
13a. TePE OF REPORT 13b .~ '~ 14. DATE O)F ~CR r; (Year, Monh.da RAEFINAL I :lmjSD(ýFt39 - 140ec92 26FER93 23
16. %.PPLzMENTARY NOTA7;0*
17. COSA71 CODE;S SB S9BECT I E -MS (Comtinu# on reversep if, ece~sar-y and derftlY "Y ~c ~~FIELD ýjQý S3-3;lc rat liver; parfluoro-n-decanoiC acid; hopatotogic3,ty,
two-dimensional. electrophornsis; paroxiqo,.nw.proliferation; image analysis
'9 A8ST PACT ICortirwr, otl rever~fit f'feresiary ard ofyby /ock ritimo'r)
Pezfluoro-n-decanaic acid (PDA) effects on protein expression in thm. rit vo::,were stud~ied in rodients following In vivro exponuza to PYD0A levels aboy'> Y' mndat the =D-50. Two-4L-nensionai. whole-liver hiomoq.mnats protesin pattrvrnr %11103:11generated and compared to previous results. As beforA, nurierous prot7 .r' I'insaltered; sovwo suppressed, soma induced, but most werA unaffected. In Zoi ~cr,to identify the altered protoi-ns, further analysis of b~aiC protf~in. by fl'v-tdimiansion NZPHGZ revealed the induction of cytochrcTna~ P452 (lauric a~cid. fo1m1?and enoyl-CoA hydratasa. Induction of these and ralatmd anzynnes cni~previously obnmr-vad PF7DA-induced paroxinctra proliferation and leýnds mrto the notion that P70A blocks normal 3-o)xidation, causes fatty acid ac-c-,,1'T-1a.and results in compmnatory paroxiscmal and m!dtochondrial. It- and ~-~iContinued identification of other altered proteins will bo~ ui-dr~rt, ~kr-n tn (,,', tothe metabolic paths affected by PFDA to further delineata its toxic tr~r'-;-h-n'*n
A 7CM A,~ S CA T, I N ,~i ~
00 Form 1473, JUN 86~c..d'JPh.' '

THE MOLECULAR ANATOMY OF PFDA HEPATOTOXICITY AS STUDIED BY TWO-DIMENSIONAL ELECTROPHORESIS
Frank A. Witzmann, Ph.D.Department of BiologyIndiana University-Purdue University at IndianapolisColumbus Campus4601 Central AvenueColumbus IN 47203
14 Jan 1993
Final Technical Report for Period 15 Dec 89 through 14 Dec 92
Prepared for: rr'r AT-r-' r. -
Dr. Walt KuzumboDirectorate of Life Sciences
AFOSRBuilding 410 NtiS c : - 11Boiling AF13 DC 20332-6448 Wit- TA, _1
0 1:
I - - - -
i% 'I _

2
INTRODUCTION
Within the last 20 years, technological developments in two-dimensional electrophoreticprotein separation have made possible the resolution and comparison of complex mixtures ofthousands of proteins from hundreds of samples (1-5). During the last 10 of those years, two-dimensional (2-D) protein electrophoresis has become a powerful tool in molecular biology andhas found increasing application in pharmacologic and toxicologic investigations (5-15). Theprimary motivation behind developing this technique in toxicology has been the potentialinformational capabilities 2-D protein patterns provide regarding toxicologic phenomena. Inthis respect, one operates under the assumption that the comparative abundance andelectrophoretic characteristics of cellular proteins are indicative of ceil activities at the molecularlevel. By describing the changes observed in the pattern of protein expression, i.e.drug/chemical-induced abnormality, we endeavor to 1) describe and understand, from auniquely informative perspective, specific xenobiotic effects and 2) predict others on the basisof structure-activity relationships.
The present project addressed the feasibflty of analyzing rodent hepatotoxicity byexamining the protein patterns of rat liver whole homogenates and cell fractions generat,,d bylarge-scale (2-3) 2-D electrophoresis. Our hitent was to evaluate the utility of this approach intoxicity testing by generating 2D liver protein patterns representing various levels ofintoxication with the assumption that changes in hepatocellular protein expression are specificindicators of cell injury and dysfunction. The compound chosen initially, perfluoro-n-decanoicacid (PFDA), is a ten carbon straight-chain perfluorinated carboxylic acid whose surfactantproperties give it and chemically similar compounds important commercial application.Substantial previous investigation of PFDA's hepatotoxicity has demonstrated that a single50mg/kg i.p. dose (1.6 induces significant weight loss characterized by hypophagia (1-,hepatomegaly, peroxisome proliferation (1--o0, and delayed lethality in rats. More rec,.ntobservations have led to the notion that PFDA interferes with normal f3-oxidaý.>-n of fatty acidsresulting in an accumulation of fatty acids in the cell (21). As a result of this accumulation,peroxisomes proliferate as a prominent feature of compensatory 3- (22.z3) and o-oxidativeinductions (2z4,25). Accordingly, a broad base of hepatotoxicologic phenomena associated withperfluorocarboxylic acid toxicity are available for comparison with molecular changes In theform cf 2-D protein pattern alterations.
Presented in this report are the final results of this three-year investigation, some ofwhich have been reported to AFOSR via Annual Technical Reports as well as published and/orpresented at scientific meetings (26-34). It is important to note that the results reflect a naturalprogression in quality and technique as innovative technological developments, i.e. ours (o) andothers, were incorporated into our protocols. Electrophoretic data will be presented whichconfirm previous systemic observations regarding PFDA's hepatotoxicity mentioned above.

3
From the same data it will be clear that although it is a potent peroxisome proliferator, PFDAexerts its cellular effects differently when compared to other structurally diverse peroxisomeproliferators.
Additional data that document the value of large-scale, high-resolution 2-Delectrophoresis and computerized image analysis in relating molecular changes to xenobioticeffects are also included in this report. This evidence will illustrate that we are meeting thefollowing previously established criteria (3) for systematic use of 2-D electrophoresis intoxicology: 1) a useful range of known effects produces detectable changes at the molecularlevel, 2) that there is sufficient specificity associated with molecular effects to differentiatevarious classes of mechanisms, and 3) that there is some basis for expecting that the molecularchanges can be interpreted in a way that helps illuminate not only the details, but also thepossible significance, of the events observed.
TECHNICAL APPROACH
Animal Care and IntoxicationMale Fisher-344 rats (225-250g) were obtained from Charles River Breeding Labs,
individually housed, and maintained on rat chow and water ad libitum. Rats were injectedintraperitonealy with either of the following:
2mg, 20mg or 50mg PFDA/kg body weight; single injection; animals sacrificed on day8 of exposure
150mg PFOA/kg (perfluorooctanoate, PFDA's eight carbon analog); single injection;animals sacrificed on day 3 of exposure
250mg clofibrate/kg; single injection on each of 3 successive days; animals sacrificedon day five of exposure
1200mg DEHP/kg (di[2-ethylhexyllphthalate); single injection on each of 3 successivedays; animals sacrificed on day 5 of exposure
1.25g/kg polyCTFE (chlorotrifluoroethylene); daily injection on each of 7 successivedays; rats sacrificed on day 8 of exposure
Matched control rats were vehicle injected and pair fed (PFC)
Sample PreparationAfter the appropriate exposure period, livers were surgically removed from the
ketamine/xylazine anesthetized rats and manually perfused with ice-cold saline to removeexcess blood. One 0.5g piece was removed, minced, and homogenized in 8 volumes (4mL)of a lysis buffer containing 9M urea, 4% NP-40, 2% DTE (dithioerythritol), and 2% ampholytes(Serva pH 9-11) pli 9.5 for ISO-DALT' electrophoresis 035). A second piece of liver tissue wasminced and homogenized in ice-cold 0.25M sucrose. Microsomal and mitochondrial fractionswere prepared from this homogenate by differential centrifugation (36). These fractions were

4
then solubilized in either a lysis buffer containing 9M urea, 4% dodecyl-maltoside detergent,[and later 2% NP-40 and 2% dodecyl-maltoside detergents], 2% ý-mercaptoethanol, 2%ampholyte (Serva pH 2-11) at pH 3.0 (as) for nonequilibrium pH-gradient electrophoresis(NEPHGE-DALT) or the lysis buffer described above for conventional ISO-DALTI runs. Aftercomplete solubilization at room temperature for 120min, all samples were centrifuged at110,000 x g using a Beckman TL-100 ultracentrifuge and stored at -70'C.
Two-dimensional Electrophoresis (conventional)The strength of the 2-D electrophoretic technique lies in its ability to resolve literally
thousands of cellular proteins first based on their content of acidic and basic amino acids(isoelectric focusing) and second by molecular weight (SDS electrophoresis). In combination,these two separation techniques produce a two dimensional protein pattern unique for aspecific group of cells/tissues. Individual proteins within the pattern can be analyzed foralterations in volume (density), charge, and (least likely) molecular weight. Changes in volumeor spot density reflect alterations in a protein's abundance and suggest up- or down-regulationof the genome or altered protein turnover rates. Charge modifications suggest eitherposttranslational modification alterations or point mutations in the genome.
Using the Anderson ISO-DALT' (2-D Electrophoresis) System (35), 10PL of thesolubilized protein sample was placed on each of 20 first dimension gels (25cm x 1.5mm)containing 4% acrylamide, 2% NP-40, 2% ampholyte (BDH pH 4-8) and electrophoresed for32,000 VHr at room emperature. Each first dimension gel was then placed on a second-dimension DALT slab gel (20cm x 25cm x 1.5mm) containing a linear 9-17% acrylamidegradient. During initial phases of the investigation these gradient slab gels were manuallypoured as described (35) using the ISO-DALT' 300 DALT gradient maker (Hoefer Sci). Later inthe investigation gradient slab gels were poured more easily and reproducibly using theANGELIQUE" computer-controlled gradient maker (arge Scale Biology Corp.). This system enablesone to reduce run-to-run variability in the polyacrylamide gel concentration, an essentialcharacteristic for protein pattern image analysis. Molecular weight standards were comigratedon the gel margin while internal charge standardization of was accomplished using carbamyl-ated creatine kinase charge-train standards. DALT gels were run for 18hr at 4°C and laterstained w.ith Coommassie brilliant blue G-250 (37). Protein patterns on some gels wereelectrobi otted onto nitrocellulose for immunological identification of specific proteins. Initially,all stainiJ gels and protein blots were photographed on a fluorescent light box with KodakPanatomic-X film and printed on 1iford Multigrade III photographic paper for both visualanalysis of protein spot patterns as well as archiving. After recently acquiring imagingtechnology, stained gels and protein blots were processed and archived as described later.Polyclonal antibodies were the generous gifts of the following: anti-cytP452 (cytochromeP450IVA) and anti-trifunctional enzyme (enoyl-CoA hydratase) from G.G. Gibson, Univ. ofSurrey; anti-FABP (fatty add binding protein) from J. Vanden Heuvel, Univ. of Wisconsin,Madison; anti-TFA (trifluoroacetylated) protein from L. Pohl, NIH.
5
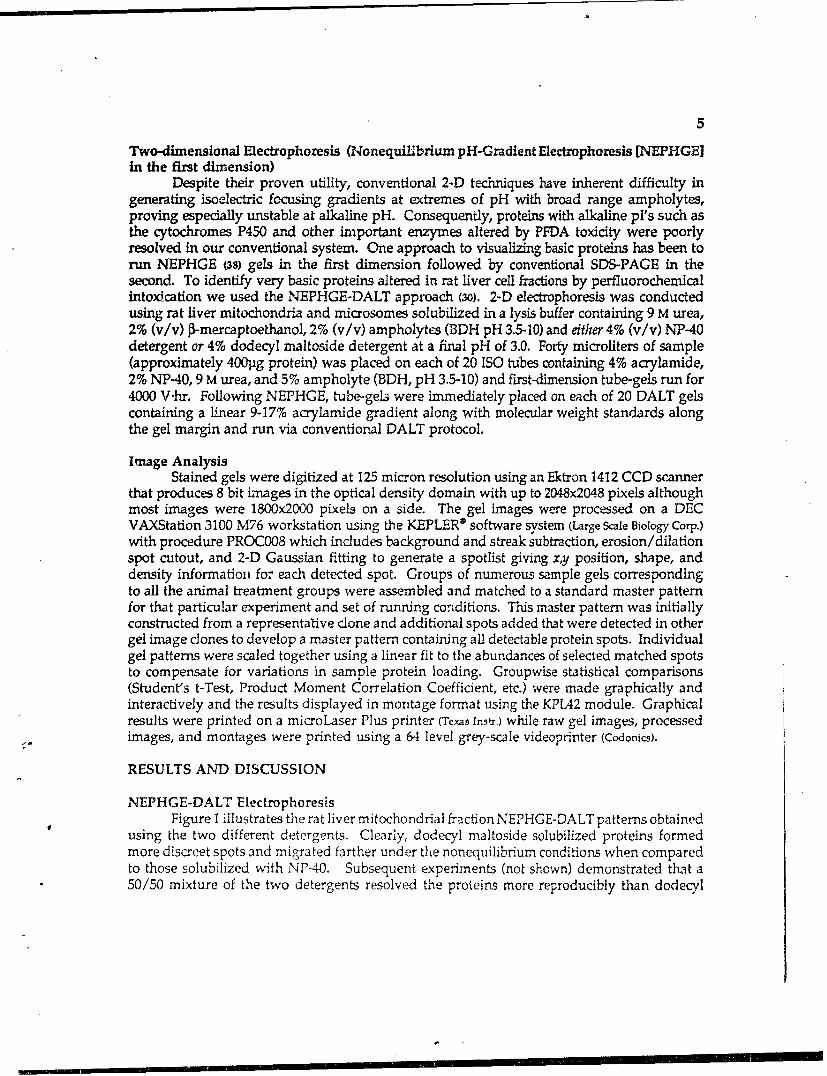
Two-dimensional Electrophoresis (Nonequilibrium pH-Gradient Electrophoresis [NEPHGE]in the first dimension)
Despite their proven utility, conventional 2-D techniques have inherent difficulty ingenerating isoelectric focusing gradients at extremes of pH with broad range ampholytes,proving especially unstable at alkaline pH. Consequently, proteins with alkaline pl's such asthe cytochromes P450 and other important enzymes altered by PFDA toxicity were poorlyresolved in our conventional system. One approach to visualizing basic proteins has been torun NEPHGE (3s) gels in the first dimension followed by conventional SDS-PAGE in thesecond. To identify very basic proteins altered in rat liver cell fractions by perfluorochemicalintoxication we used the NEPHGE-DALT approach (30). 2-D electrophoresis was conductedusing rat liver mitochondria and microsomes solubilized in a lysis buffer containing 9 M urea,2% (v/v) ]3-mercaptoethanol, 2% (v/v) ampholyt.s (BDH pH 3.5-10) and either 4% (v/v) NP-40detergent or 4% dodecyl maltoside detergent at a final pH of 3.0. Forty microliters of sample(approximately 400pg protein) was placed on each of 20 ISO tubes containing 4% acrylamide,2% NP-40, 9 M urea, and 5% ampholyte (BDH, pH 3.5-10) and first-dimension tube-gels run for4000 Vthr. Following NEPHGE, tube-gels were immediately placed on each of 20 DALT gelscontaining a linear 9-17% acrylarnide gradient along with molecular weight standards alongthe gel margin and run via conventional DALT protocol.
Image AnalysisStained gels were digitized at 125 micron resolution using an Ektron 1412 CCD scanner
that produces 8 bit images in the optical density domain with up to 2048x2048 pixels althoughmost images were 1800x2000 pixels on a side. The gel images were processed on a DECVAXStation 3100 M76 workstation using the KEPLER" software system (Large Scale Biology Corp.)
with procedure PROC008 which includes background and streak subtraction, erosion/dilationspot cutout, and 2-D Gaussian fitting to generate a spotlist giving xy position, shape, anddensity information for each detected spot. Groups of numerous sample gels correspondingto all the animal treatment groups were assembled and matched to a standard master patternfor that particular experiment and set of running conditions. This master pattern was initiallyconstructed from a representative clone and additional spots added that were detected in othergel image clones to develop a master pattern containing all detectable protein spots. Individualgel patterns were scaled together using a linear fit to the abundances of selected matched spotsto compensate for variations in sample protein loading. Groupwise statistical comparisons(Student's t-Test, Product Moment Correlation Coefficient, etc.) were made graphically andinteractively and the results displayed in montage format using the KPL42 module. Graphicalresults were printed on a microLaser Plus printer (Texas Instr.) while raw gel images, processedimages, and montages were printed using a 64 level grey-scale videoprinter (Codonics).
RESULTS AND DISCUSSION
NEPHGE-DALT ElectrophoresisFigure 1 illustrates the rat liver mitochondrial fraction NEPHGE-DALT patterns obtained
using the two different detergents. Clearly, dodecyl maltoside solubilized proteins formedmore discreet spots and migrated farther under the nonequilibrium conditions when comparedto those solubilized with NP-40. Subsequent experiments (not shown) demonstrated that a50/50 mixture of the two detergents resolved the proteins more reproducibly than dodecyl

6
maltoside alone. Consequently, all NEPHGE first-dimension runs now incorporate thisnonionic detergent.
Z,1MJ
, , ++ • - + .' Vt , . ++
S.- . • .++A + .+ - - . - ,V
4. ,4p ++ ... - •, ++,:v ++ . .. +
,. , .?+ ++,. I• o ++, + . . . . . .+++ +• +22
.4 4 44- ..
,~a. - . . -,+
Figure1. 2-D PAGE (N E PHG E-DALT) of liver mitochondrial fraction from a rat treated with a peroxisome inducer, perfluoro-n-decanoic acid. 400 vg
of protein was loaded and gels stained with Coomassie Brilliant Blue G-250.iThe 2-D pattern in (A) was generated from proteins solubilized in NP-40
detergent while panel (B) illustrates dodecyl maltoside solubilization. Proteins labeled 1, 3, and 4 are peroxisomal enoyl CoA hydratase (bifunctional
enzyme; 78 kDa) and its constituent polypeptides (39.5 and 35.1 kDa). Protein 2 is cytochrome P4501VAI (lauric acid W-oxidase; 52.5 kDa).
PFDA exposure described above was associated with significant alterations of the 2Dprotein pattern in the mitochondrial fraction (Figure 2) tested. PFOA's effect on pattern altera-tion was similar to PFDA's but less intense. Clofibrate also showed some similarities althoughcompartmental differences in its effect were notable. Foremost among the alterations observedwere those illustrated in Figure 2 (panels I-VI). In NEPHGE-DALT separation of the mit-ochondrial fraction, several proteins with alkaline pI's were induced relative to dose, xenobiote,and cellular compartment. Cataiase (diamond-shaped box) was identified by coomigration ofthe purified form. With the exception of the thiolase, the following were identifiedimmunologically on protein blots of replicate gels: (A) peroxisomal/microsomal enoyl-CoAhydratase (bifunctional enzyme; 0B) cytochrome P451VA1 [cyt P4521 (lauric acid c-oxidase);(C) peroxisomal enoyl-CoA hydratase polypeptide I; (D) peroxisomal enoyl-CoA hydratasepolypeptide II; (E) 3-ketoacyl-CoA thiolase and (F) mitochondrial enoyl-CoA hydratase(crotonase) represent the most notable inductions. Panels I-IV represent replicate sample gelsfrom the following treatments: (I) control; (II) 50mg/kg PFDA; (III) 100mg/kg PFOA; and(IV) 400mg/kg clofibrate. Panels V and VI are nitrocellulose blots of PFDA-treated patternsexposed to polyclonal antibodies raised against purified rat hepatic bifunctional enzyme (enoyl

7
CoA-hydratase). Panel (M) illustrates the microsomal pattern (note absence of themitorhondrial protein F, crotonase). Panel (VI) illustrates the niltochondrial pattern.
_E4-C
Figure 2. Rat liver mitodhondrial fraction, prroteins separated by NE•PHGE in the first-dimension. Proteins appearing on thesegels have Peny basic p1's and consequently do not appear on conventional ISO-DALT patterns. Significant induction ofperoxisomal f-ox-idative enzymes by xenobiotic treatment is sho~wn, individual panels are described in the text above.
ISO-DALT ElectrophoresisMicrosomal fractions separated by conventional 21)-PAGE are illustrated in Figure 4.
Each panel represents replicate gels of several samples from (5) control; (6) 50mg/kg PFDA-exposed; (7) 7 daily 1.25g/kg polyCTFE doses; and (8) 400 mg/kg clofibrate treated. Theencircled charge train resembles the -78 kDa hepatic protein previously shown to betrifluoroacetylated [391. A rmdnor but readily apparent alteration in the composition of that spot-group is induced by PFDA exposure, but not by polyCTFE nor clofibrate. The nature of thisapparent charge shift in the train of proteins suggests protein acylation by FFDA.
T. 0 OD • I'I-• r r - I- -

P.. / o• I#+ .. i
• • •._•...+.•
*04. .. Q,
Figure 3. Rat liver micrsosal prti pat n geneated by covetionl ISO-DALT procdures. (5) cotol, (6)PFDA 50mg/kg PFDA exposed, (7) CTFE exoed, and (8) clofibrate-treated. Creatine kinase carbamyLated chargestandards shown in panels 5 and 7. Only panel 6 exhibits charge modification of eneircled prrotein ch~arge train.
More recent experiments incorporating the Kepl~er System have generated a 2D proteinmap for rat liver and eneabled us to investigate, in greater detail, the observation above as wellas several other previously observed protein pattern alterations. Figure 4 on the following pageillustrates a two-dimensional protein map generated by the Kepler System for rat liver wholehomogenates. By convention, isoelectrcally focused proteins (horizontal dimension) areoriented with acidic proteins toward the left and basic proteins toward the right. Highmolecular weight proteins are located near the top of the pattern while lower molecular weightproteins migrate toward the bottom. The pattern in Fig. 4 is essentially a composite of morethan 1400 proteins fotund in sample patterns and is used to match sample patterns and illustratepattern alterations. Highlighted spots (opaque) represent those proteins whose identity hasbeen ascertained with high probability.
Each spot (polyrpeptide) in the pattern represents numerical data regarding coordinateposition and density. In contrast to our previous reliance on black and white photographs toanalyze protein alterations, we are now able to observe positional and integrated densityvariations in over 800 matched protein spots and statistically determine the significance of theiralteration.

9
F344LIVER-2 .
. .. .. ,°
* o . . 'J.. . . .. .' . . o . ' ' • ,
*.. .... .. .. . .. . .. ..
...
8 . .'0i45. .,°- ... • -; •"a** -9%o -:. . , ',n•' •. (Io. U
"O. .. 4 * . , . y • * -
0 0*, * *°*' 2°~ ° '1 . ~ ," •
•. , q . .. *. ,, . .=: . • .=.
0' ~ 0". - .0 " o 0 O
* •*°*- • 0o 0 2 =5-
S 00. • . .•- 90," *" o. o- - v ~o -
°'. "- o 0 .% -oo,
00 08 0 0 .00
o- * V=o • o {• "• • .oo • o~o o°° 0 • -, 000 00* :.o oO
* °°0 0 o * •
000.0 0 o0o o 0
- 0
C>0 0
* 0~8 - "0 *
- o O1o 0o e
*o 00
IDENTIFIED PROTEIN SPOTS - RAT LIVER WHOLE HOMOGENATEExperimen LTKLIVER 14:38 4-JAN-93
Figure 4. Schematic representation of the 2D electrophoretic standard master pattern map of F344rat liver whole homogenate proteins. Each detected protein is represented as a circle or an elipsewith those conclusively identified filled in black (see Table I). Susequent figures and data aregenerated by similar mapping techniques.
Table 1, found on pages 10-11, lists the identified proteins highlighted on the map inFigure 4 along with their database identification, estimated molecular weight, x and ycoordinate position (in the master number system F344LIVER), and integrated density of eachprotein as it appears in normal, control rat livers. Those proteins found only in experimentalgroups but included in the master pattern are listed as well.
I

C40,
r- C4 -0 1- ýQ0
cl 1j). Oý w 0 '0IN(7
0n %0 fzJ N'
2 ONo
UO
l<"
r4~
~~23
~~~~ zz r.E~>>>
3. E << < !
0 w___

a 0 11
aq I q Qýq ''n - "q q 4R t ,q f8
"a %'a 1-4 S
N., - r4 Wa
C-4-C' C1 (1
oV V
V-4
ci~
Z Li

12
Whereas much of our effort during the funded research period was focused on rat liverprotein expression with respect to PFDA and related chemical exposures as p art of our statedobiectives, we also began prelimary investigation of liver protein patterns in other species.Using the Translatioai Table Utility provided by the Kepler Image Anlysis System, we intendto develop a comparative approach to our overall experimental strategy. This will expedite theapplication of this technique to in vitro toxicologic methodologies and improve extrapolationto man. To this end, presented in Figure 5 are preliminary 21) electrophoretic maps of guineapig, baboon, and human liver whole homogenate proteins.
GPIGLIVERJ.L. . - BABOONLIVER-I..
.:7-
-- 7
-N' M.
HUMANLIV. 1.a-
Figure 5. Schzematic representation of "D whole-* ~,. homoge-nate protein pattern from guinea pig, balvon,
and human liver samples. Circles and/or elipestrepresent detected protemns. Similarities in spot
a. coordinate positions betwe~en srecies maps suggest ahighly conserv'ed mature of many he-patic proteinsand typifies the utility of this arp~rcach in
*' interspecies toxicity testing and extrapolation to
* .. /

13
To assess the effect of the various exposures listed earlier, individual sample patternswere matched against the master pattern F344LIVER and variations in integrated spot densitycalculated via Student's paired t-test. Proteins that underwent significant, P<.O01, alterationas a result of any or all treatments were highlighted in the master pattern for that group. Inthe nine groups tested, 86 total proteins across 8 experimental groups were altered byxenobiotic exposure and are shown below (Table 2 and Figure 6):
TABLE 2
TREATMENT (n) NUMBER OF PROTEINSALTERED (P<301)
Pair-fed (9) 2PFOA (150mg/kg) (8) 5PFDA (2mg/kg) (5) 1PFDA (20mg/kg) (5) 14PFDA (50mg/kg; 8da) (9) 63PFDA (50mg/kg; 30da) (5) 25Clofibrate (250mg/kg) (10) 6DEHP (1.2mg) (3) 4
F344LIVER_6 ....
2 - - Fray .. . .•f
'4 liver .oil ho "', ,, .f
a, • . * . . -, o ***S) .*-
. .. . .' .. . , ' . . . . .
.•... *'.. * ,' 'e,
,o** .-*- , -
tho,;e pr*i 41ýeed (1) pv
PFDA ( S<.07) , jS w '7*ýIrr a
p " ( i

14
To visualize the treatment effects on the individual proteins in each sample by group,we have plotted the relative densities of each altered protein (P<.001). These are shown belowin Figure 7. The abundance of each protein is displayed by master spot number (MSN)according to group. Using this plotting technique it is possible to observe conspicuous trendsin the data. Furthermore, the relationship between individual proteins whose alteration trendsare similar (i.e. MSN 5,36,62,96,113 [down-regulation with PFDA] or MSN 14,19.190,200 (up-regulation]) can be determined by calculation of the Pearson product-moment correlationcoefficient.
ILI ½ i,
_ _9_ (_J
jLl 4ý A
k$ 1 ji [j LI t L•I J 1 II Itif .
Fi w re 7. This tur gra'ph dlistrate the prc•tins by maýr tr.ot nvubr!r (MSN), Uh',3 abWjndJTIt Aha- feen a4r1?i Ny one Otf MAWof the eight treaitments vs. crmIr1. Lac:h bor rerr,-nt one rontemn wLth the Mk N iltdivated. Ibfht iidWal Ftar q r fe t tJhI relatiPeabundance of fach *rrotrin iubcal h `41 helý4. khe horizomtIl aIii of ('14 Mtr ii dLtiJda i,t tC 9 grour, in thie ft4lown"order: control, pir-fd, I A. PDA 2 rgjkg, I'MDA li•mgi g, tA 5 8,14Xt PFDA 50mi~,k Jodi. Clif-'rte, and DEl IP.

15
Of the numerous proteins altered by xenobiotic treatment, several have recently beenexamined for group comparisons by one-way ANOVA and Student-Neuman-Keuls post hocpairwise multiple comparisons and are presented below.
One of the unique features of PFDA toxicity observed previously [201 is the virtualabolition of stearoyl-CoA desaturase activity by both PFDA exposure and pair-feeding for 14days in rodents. As Figure 8 illustrates, statistical analysis of integrated density of MSN62(tentatively identified as stearoyl-CoA desaturase) by one-way ANOVA followed by Student-Newman-Keul post hoc test (P<.05) provides confirming electrophoretic evidence that thedecline in enzyme activity is a result of decreased protein abundance after 8 days of PFDAexposure or pair-feeding. The data also illustrate that the PFDA effect persists even four weeksfollowing a single exposure. Furthermore, it is clear that PFDA, in the single 2mg/kgexposure, has no significant effect on the abundance of this enzyme while increased exposurelevels cause profound down-regulation. Structurally diverse PFOA, clofibrate, and DEHP,potent peroxisome proliferators, have a moderate effect in this regard.
MSN 62 STEAROYL-COA DESATURASE Figure 8. Effel of xenobi.tic___o__0 _exposure on protein abundanct
01 Ad Lb as calculated by integrated1400 -- 7density. F-11.178, P<.O01.
M0 TPair-ted Values are mean t SEM.
120000 -•TT PFOA 150m,8 3da
, Lc T J.PFDA 2m# 8da
1 t.-7P~FDA 20mg 8da
T 7;;-PFDA 60mg 8da
• ,. oooPF-A 50ng .0d..2 i. - lJDHi1 1.2m1g 5d,
'3 v i
Similar statistical methodology was applied to three other identified protein spots whosemean integrated densities were altered by trevatment. A significant reduction in rat livercytochrome b, content as a result of PFDA exposmue h,,,m also been observed previously 11o).Once again, Figure 9 (top) provides clectrophoretic confirukation of assay data. In Fig. 9, onlyP[FDA exposure of 50mg/kg (8 and 30 days) is assodated with a significant reduction in theabundance of cyt b, The decline in cytdchrome bs abundance (coidinmed on 21.) patterns ofmicrojonal proteins, not shown) ;s particularly interesting in view of itK .qle as the primaryelectron tran,fer protuin in the desa:turase reaction. The data further sug,, ,- that PFIAexposure results in si,,nificant reduction in electron transfer during cytochrome ['1.% ,atAy/edrnonoxyen,,cations, for which b, is partly re,,ponsible. This may be related to the yetunconfirmed minor decline observed in NADPI I-cytchroine P4,50 reductase (F3,-34IIVIR MSN

16
122 and 351), the major electron transfer protein to cytochromes P450. The relationshipbetween these specific protein alterations to PFDA's toxic mechanism remains to be explained.Corregulation of spots as indicated by 2D 140C00results suggests that the spots are commonto some tightly regulated biochemical 1200-Cyt b5pathway (as may bethe caeabove), theare subunits of multimeric protein(s), or 100they are individaul components of vast ~100 T1cellular xenobiotic effects.
Figure 9 (middle) also illustrates W 80,0
the response of a mitochondrial stress H Tprotein Hsp58. This protein has been 3: 60000 /
identified based on its homologous /position in other mammalian systems [51 100and is induced by heat shock, can be400 /
phosphorylated, and is also classified as a 20000 -.
chaperonin (cpn6O). Its induction (Fig. 9) 1,Mby PEQA and PI"DA is indicative of astress response, perhaps oxidative stress. 2800CC0However, because the abundance of s5superoxide dismutase (SOD), a biomarker 20~ s5of oxidative stress (that converts free-radical 02 to H202) and a difficult enzyme 20CW0 -T T Tto assay, is significantly reduced by highlevel PEDA exposure (Figure 9 -bottom), Z -it is ui-likely that PFDA is associated withIj .classic oxidative stress. Instead, the H70 2 <1Cgenerated by the high levels of Wperoxisomal [3-oxidative enzymes induced vby PFDA [29,331 may cause feedbac-k dowyn- C
0 VFKH
regulation of SOD synthesis. These three I
4CCA'preliminary observations demonstrate the ~ LI
utility of this 2D electrophoretic approachand provide precursory informationregarding the a-ssorted effects these 0structurally diverse peroxisome SLýPercx de Disr-nu c Pproliferators have on the liver. These data iproliferitors can L-e quite dissimilar ,
mechanistically.
Figure 9. Integrated gpot dei't;itygrrnip mrns~n t S!~kfr (IK Tthree idtntificýd prrteirts: cwto~hrome h, (top), heat shiX~k -
siipermxde disrnutiuse (lh'Atfrm). For group ide-ntifioflicMC .1
se legenid in Fig. 8 on previous pag~e. I

17
The separation characterization, and analysis of many membrane-associated proteins isparticularly suited to 2D electrophoresis. Because many of these proteins are post-translationally modified (such as glycoproteins or phosphoproteins) they often exist asheterogeneous species with multiple isoelectric points. On, a one-dimensional gel, theseproteins appear as one large band. On 2D gels, these proteins exist as charge trains, with thenative form having the most alkaline pl. We have examined a significant number of theseheterogeneous proteins appearing in our liver patterns but have concentrated on a particularhepatic microsomal protein referred to as TFA protein (trifluoroacetylated) and tentativelyidentified as grp78 (glucose-regulated protein) or BiP, a member of the hsp70 family locatedon the endoplasmic reticulum. We have immunologically identified this protein in wholehomogenate and microsomal fractions as the protein trifluoroacetylated following halothaneanesthesia 139,401. The 2D pattern of this protein is shown below in Figure 10.
M LM Ulm -, ... Figure 10. Montage showing the effects ofPFDA intoxication on the expression ofTFA protein in the same gel region of 1800 000 C ccý& Ct, :8cg c dfern sample paten.Teis w4 ___ ___ horizontal rows are controls while the
bottom two rows are PFDA-treated. TheU11V LOM. P Lar •,right-most spot (filled-in) in each charge
train'is MSN5 and represents the most
abundant spot Of any in .he train. Thec-x3,•< remaining spots, in a lefiward (acidic)
diriction are MSN14, 18, 1536, and 1537
(sea Table 1, page 11). PFDA-treated
" UPI ... livers undergo a significant lefIardcagshfsuggesting an acylation effect
the figure abov clDtear lutmeate an chiftinm abundancefofec preiosl ( blcelise)vetowardNth oleftto MSN 14, by [PFDA treatment and confirms a ['FDA effect previously observed 129!. Not only
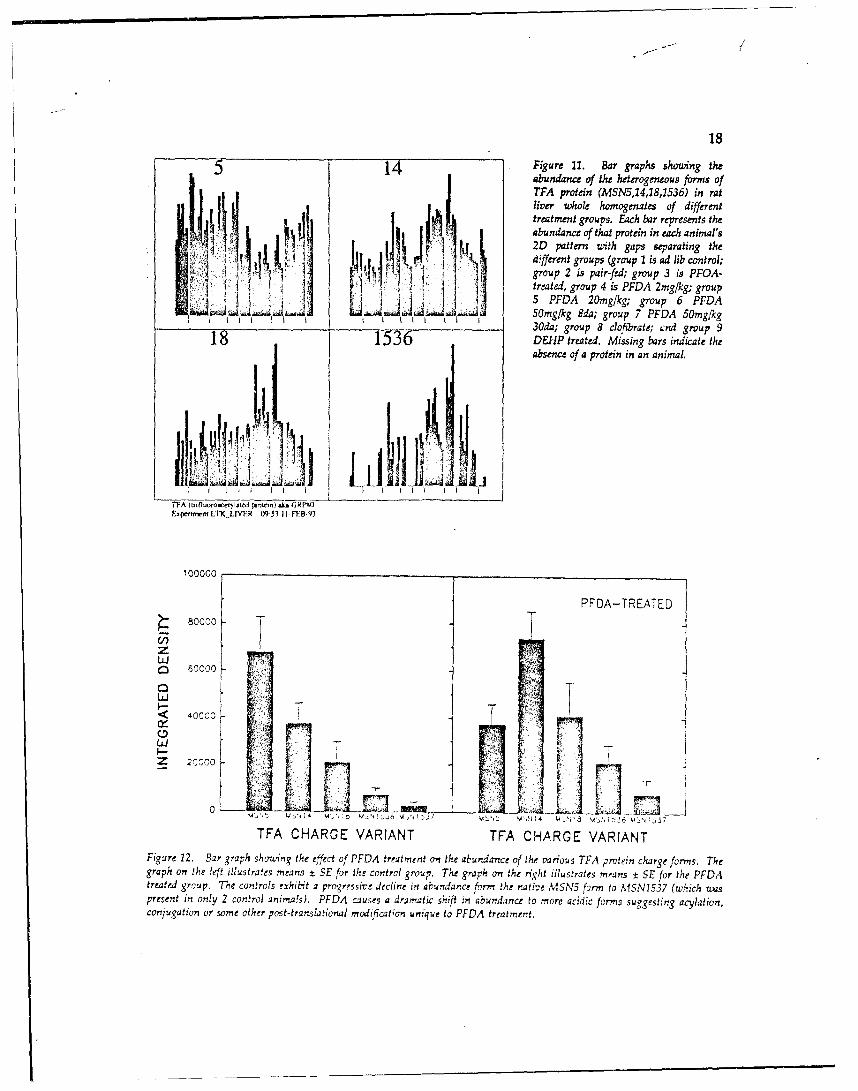
is the abundance of MSN5 significantly reduced and MSN14 increased by PFDA treatment, butMSN18, 1536, and 1537 are more abundant in the PFDA group as well. The effect depictedabove is illustrated on the next page in Figure 11 for all patterns and all treatments. Thisillustration explicitly shows Jhat the charge shift is limited to perfluorocarboxylic acidexposures and is not observed when rats are exposed to either clofibrate or DEHP. Groupmeans shown in Figure 12 for the individual effects in the montage above conclusivelydemonstrate the specific PFDA-induced shift in protein abundance. The cause of this chargevariation 's not yet known. Previous studies of halothane hepatitis 139,401 have demonstrated
185 4Figure 11. Bar graphs showting the
abundance of the heterogeneous forms of7FA protein (MSN5,14,18,1536) in ratliver whoLe homogenates of differenttreatment groups. EAch bar represents theabundance of that protein in each animal's2D pattern with gaps separating the
4 different groups (group 1 is ad lib control;group 2 is pair-fed; group 3 is PFOA-treated, group 4 is PFDA 2mg/kg; group5 PFDA 20mg/kg; group 6 PFDA
C.I I 50mg/kg $da; group 7 PFDA 50mg/kg3Oda; group 8 clolbtrate; ýnd group .9
1536 DEHP treated. Missing bars indicate theabsence of a protein in an animal.
TTA (mrnl~ow.eiyIftd proxew) sk~A ORMAExpenmLILVF.IR 0953 11 FT Af3
100000
PFOA-TREATED80000
z
LAJ
LU n0
TFA CHARGE VARIANT TFA CHARGE VARIANTFigure 12. Bar graph shozcing the effect of PEDA treatment on the abundance of the various TPA protein charge forms. Thegraph on the left iliustra!es means t SE for the control group. The graph on the right illustrates mrants ± SE for the PFDAtreated group. The controls exhibit a progressive decline in abundance form the native MSN5 form to MISN15.37 (which vuuspresent in only 2 control animals). PFDA causes a dramatic shift in abundance to more acidic forms suggesting acylation,conjugation or some other post-translational mcidification unique to PEDA treatmert.

19
the trifluoroacetylation of a 76 kDa protein in the endoplasmic reticulum (TFA-76). ThatMSN14 cross-reacts with the antisera formed against TFA-76 [321 from those studies suggeststhis protein may be acylated by a metabolite of PFDA and thereby acquire some structuralsimilarity to the trifluoroacyl conjugate. On the other hand, the charge shift observed may bethe result of increased glycosylation of the native form in PFDA treated livers. To answer thisquestion, we are currently attempting to synthesize PFDA-protein conjugates to generateantibodies. We are also interested in the synthesis of 14C-labelled PEDA to investigate putativeconjugation by autoradiography.
SUMMARY AND CONCLUSIONS
Regarding the original objectives stated in the project proposal, each was achieved andin some cases exceeded. State-of-the-art 2D electrophoretic technology and computerizedimage analysis were successfully integrated into our toxicological approach. A rat liver wholehomogenate master pattern was generated and is currently being compared to a rat liverdatabase under development elsewhere [tIi. Over 1,400 proteins have been resolvedreproducibly and 64 protein spots in the F344LIVER master pattern number system have beenidentified (Table 1). Of the 64 proteins identified, several have been studied with regard toperfluorocarboxylic acid effects and the results 1) confirm previous independent observationsregarding PFOA, PFDA, and clofibrate hepatotoxicity and 2) reveal novel PFDA-effects thatsuggest a complex toxic mechanism. Although PFDA's specific mechanism and peroxLomeproliferative mechanisms in general have not been elucidated from these data, this study hasconfirmed our expectation that high-resolution 2D electrophoresis in combination with imageanalysis is indeed a powerful tool in the assessment of xenobiotic effects. As more protein areidentified in our database of rat liver 2D patterns and those of others, it will be possible toassess enzyme induction and protein-bound metabolites of toxicants and to explore cellularmetabolic pathways associated with specific intoxications (i.e. peroxisomal P3-oxidation).
This project has satisfied established criteria (13) for systematic use of 2-D electrophoresisin toxicology: 1) a useful range of known effects produces detectable changes at the molecularlevel, 2) that there is sufficient specificity associated with molecular effects to differentiatevarious classes of mechanisms, and 3) that there is some basis for expecting that the molecularchanges can be interpreted in a way that helps illuminate not only the details, but also thepossible significance, of the events observed.

20
BIBLIOGRAPHY
1. CYFarrell, P. (1975) J. Biol. Chem. 250:40047-4021.2. Anderson, N.G. and Anderson, N.L (1978) Anal. Biochem. 85:331-340.3. Anderson, N.L. and Anderson, N.G. (1978) Anal. Biochem. 85:341-354.4. Anderson, L. and Anderson, N. (1984) Clin. Chem. 30:1898-19055. Anderson, N.L., Esquer-Blasco, R., Hofmann, J.P. and Anderson, N.G. Electrophoresis
12:907-930, 1991.6. Vlasuk, G.P. et al. (1982) Biochem. 21:6288-62927. Jellum, E., Karasek, F.W., and Thorsrud, A.K. (1983) Anal. Chem. 55:2340-2344.8. Watanabe, T., Lalwani, N.D. and Reddy, J.K. (1985) Biochem 1. 227:767-775.9. Anderson N.L. et al. (1986) Electrophoresis 7:44-48.10. Anderson, N.L. et al. (1987) Fundam. Appl. Toxicol. 8:39-50.11. Wirth, P.j. and Vesterberg, 0. (1988) Electrophoresis 9:47-53.12. Witzmann, F., Bale, S. and London, S. (1990) In Vitro Toxicol. 3:205-217.13. Anderson, N.L. (1990) In: New Horizons in Molecular Toxicology, Ed. G.S. Probst, FASEB,
Bethesda, MD, pp. 65-71.14. Witzmann, F.A. and Parker, D.N. (1991) Toxicology Letters 57:29-36.15. Anderson, N.L. et al. (1992) Fundam. Appl. Toxico!. 18:570-580.16. Andersen, M.E., Baskin, G. and Rogers, A.M. The Toxicologist 1:16, 1981.17. Olson, C.T. and Andersen, M.E. Toxicol. Appl. Pharmacol. 70:362-372, 1983.18. Harrison, E.H., Lane, J.S., Luking, S., VanRafelgehm, M.J. and Andersen, M.E. Lipids
23:115-119, 198819. Ikeda, T., Aiba, K., Fukuda, K. and Tanaka, M. J. Biochem. 98:475-482, i985.20. VanRafelgehm, M.J., Mattie, D.R., Bruner, R.H., and Andersen, M.E. Fund. Appl. Toxicol.
9:522-540, 1987.21. George, M.E. and Andersen, M.E. Toxicol. Appl. Pharmacol. 85:169-180, 1986.22. Shindo, Y., Osumi, T., and Hasimoto, T. Biochem. Pharmacol. 27:2683-2688, 1978.23. Osmundsen, H. in "Peroxisomes and Glyoxysornes , Annal. NY Acad. Sci. 386:13-18, 1982.
Eds. H. Kindl and P.B. Lazarow.24. Gibson, G.G., Orton, T.C. and Tamburini, P.P. Biochem. J. 203:161-168, 1982.25. Sharma, R., Lake, B.C., Gibson, G.G. Biochem. Pharmacol. 37:1203-1206, 1988.26. Witzmann, F., DelRaso, N., and George, M. The Toxicologist 10:251, 1990.27. Witzmann, F.A. (1990) Proceedings, Society of Environmental Toxicology and Chemistry
Annual Meeting p. 177.28. Witzmann, F.A. and Parker, D.N. (1990) Proceedings, ISSX North American Meeting29. Witzmann, F.A. and Parker, D.N. (1991) In: 2D PAGE '91: Proceedings of the International
Meeting on Two-dimensional Electrophoresis, M.J. Dunn, Ed., Zebra Printing, Middlesex UK,pp. 236-237, 1991.
30. Witzmann, F.A., Jarnot, B.M. and Parker, D.N. (1991) Electrophoresis 12:687-688.31. Witzmann, F.A., Parker, D.N. and Jarnot, B.M. (1991) The Toxicologist 11:348.32. Witzmann, F.A. (1991) Clin. Chem. 37:1096.33. Witzmann, F.A., Parker, D.N. and Jarnot, (1992) Toxicologist 12:417.34. Witzmann, F.A., George, M.E., Jarnot, B.M. and Parker, D.N. (1992) Proceedings, ISSX
North American Meeting.35. Anderson, N.L. (1988) Two-dimensional Electrophoresis: Operation of the ISO-DALTr
System, Large Scale Biology Press, Washington DC, pp. 3-15, 142.

21
36. Chappall, J.B. and Hansford, R.G., in: Birnie, G.D. (Ed.) (1972) Subcellular Components,Butterworths, London, pp. 77-91.
37. Neuhoff, V., Arold, N., Taube, D., and Ehrhardt, W. (1988) Electrophoresis 9:255-262.38. O'Farrell, P.Z., Goodman, H.M., and COFarrell, P.H., (1977) Cell 12:1133-1142.39. Pumford, N.R., Pohl, L.R. et al. The Toxicologist 11:1031-1032, 1991.40. Kenna, J.G., Satoh, H., Christ, D.D., and Pohl, L.Rt (1988) 1. Pharmacol. Exp. Ther.
245:1103-1109.

22
Publications resulting from this effort:
Hepatic protein alterations following perfluorodecanoic acid exposure in rats.Witzmann, F.A. and Parker, D.N. Toxicology Letters 57:29-36, 1991.
Dodecyl maltoside detergent improves the resolution of hepatic membrane proteins ontwo-dimensional gels. Witzmann, F.A., Jarnot, Bj., and Parker, D.N. Electrophoresis12:687-688, 1991.
Hepatotoxicity of perfluorinated compounds in male rats: 2D-PAGE analysis.Witzmann, F.A. and Parker, D.N. In: 2-D PAGE '91: Proceedings of the InternationalMeeting on Two-Dimensional Electrophoresis, M.J. Dunn, Ed. 1991, Zebra Printing,Middlesex UK, pp. 236-237.
Papers presented at scientific meetings:
Two-dimensional electrophoretic analysis of PFDA hepatotoxicity. Witzmann, F.A.,DelRaso, N. and George, M. at the 29' Annual Meeting of the Society of Toxicology,February 12-16, 1990 in Miami Beach FL. Published as an abstract in The Toxicologist10:251, 1990.
Induction of cytochrome P452 in liver cell fractions by perfluoro-n-decanoic acid: anelectrophoretic analysis. Witzmann, F.A. and D.N. Parker. Presented at the NorthAmerican Meeting of the International Society for the Study of Xenobiotics, October 1990in San Diego CA.
Two-dimensional protein electrophoresis: Hepatotoxic applications. Witzmann, F.A.Presented at the Society of Environmental Toxicology and Chemistry Annual Meeting,November 1990 in Alexandria VA.
Induction of an 80kDa protein in rat liver homogenates and cell fractions by perfluoro-n-decanoic acid. Witzmann, F.A. and Parker, D.N. Presented at the 30th AnnualMeeting of the Society of Toxicology, February 25-March 1, 1991 in Dallas TX.
Hepatotoxicity of perfluorinated compounds in male rats: 21)-PAGE analysis. Witzmann,F.A. and Parker, D.N. Presented at the International 2D-PAGE Conference, July 16-19,1991 in London England.
Perfluo-.o-n-decanoic acid toxicity in the rat liver: Two-dimensional electrophoreticanalysis. Witzmann, F.A. Presented as an invited selected topics lecture in MolecularPathology: Applications to the Study of XenoN'otic Effects in Animal Testing at the 43 "dNational Meeting of the American Association for Clinical Chemistry, July 28-August1, 1991 in Washington DC; published as an abstract in Clinical Chemistry 37:1096, 4
1991.

23
Perfluorocarboxylic acid intoxication increases tB-oxidative enzyme content of hepaticmitochondrial fractions in rodents. Witzmann, F.A., Jarnot, B.M., and Parker, D.N.Presented at the 31jt Annual Meeting of the Society of Toxicology, February 23-27, 1992in Seattle WA.
Hepatic, renal, aad testicular gene product regulation by perfluorocarboxylic acids andclofibrate: Two-dimensional protein mapping and pattern recognition. Witzmann, F.A.,George, M.E., Jarnot, B.M., and Parker, D.N. Presented at the Fourth North AmericanJSSX Meeting, November 2-6, 1992 in Bal Harbour FL.
N -. -i


![A method for determining electrophoretic and …...[4,5]. Current techniques for measuring electrophoretic mo-bility include an electroacoustic method [6], electrophoretic light scattering](https://img.pdfslide.us/doc/110x75/5f08e22b7e708231d4242f99/a-method-for-determining-electrophoretic-and-45-current-techniques-for-measuring.jpg)