Embed Size (px)
Citation preview

AD- A270 D40
FRAUNHOFER-GESELLSCHAFT
4
EXPERIMENTAL INVESTIGATION OF
WAVE AND FRACTURE PHENOMENAIN IMPACTED CERAMICS
!
Final Report:EXPERIMENTS ON SAPPHIRE FRAUNHOFER-INSTITUT FOR
WERKSTOFFMECHANIK
S. Winkler
IWM-R"prt T 8193 EECTE ?May Ms3 E29P,: 9,
r~ A

BestAvai~lable
Copy
Y
Prepared for European Research Office of the U.S. Army, London
Contract Number DAJA45-90-C-0053
R&D 6472-MS-01, 27 Sept. 1990
IWM Project 301 388
Principal Investigator: Hermann Senf
Fraunhofer-Institut ftir Kurzzeitdynamik (EMI), Weil am Rhein, FRG
The research reported in this document has been made possible ihrough the support and
sponsorship of the U.S. Government through its European Research Office of the ULS.
Army.
UNCLASSIFIED; APPROVED FOR PUBLIC RELEASE; DISTRIBUTION UNLIMITED
Acoesslon For
NTI "iA&V,•DTL.2 TAB
Fh-IWMWohlerstr. 11, 79108 Freiburg , ,
Vervielfaltigung und Weiterverbreitung - ..
sind nur mit Zustimmung der FhG gestattet -.s , .•/
Dis 1u

SUBJECT TERMS
Ceramics, Sapphire, High Speed Photography, Impact, Energy Transfer, Energy Absorption,
Comminution (Mescall) Zone, Terminal Crack Velocity, Crack Nucleation, Spalling,
Electric Emission
ABSTRACT
Experiments have been performed in order to investigate the behavior of mono-
crystalline sapphire under impact loading. Tile shaped samples were hit edge-on by
spherical or flat steel impactors. The generation of pressure waves and disintegration
effects were observed by a Cranz-Schardin high speed camera.
The results are compared with earlier ones obtained with glass and alumina as
target material. A terminal crack velocity was not found. Crack velocities exceeding the
Rayleigh wave speed have been measured. Similar as with glass, nucleations of cracks in
the field between the primary wave front and the front of the disintegration area form a
damage velocity which can approach the longitudinal wave speed. Usually, cracks did not
follow crystal planes; the influence of the crystal structure does not seem to be a
;itrong one.
CONTENT
I INTRODUCTION
2 EXPERIMENTAL PROCEDURE 2
3 MATERIALS 5
3.1 Glass 5
3.2 Sapphire 5
4 IMPACT EXPERIMENTS 9
4.1 General 9
4.2 Description of Impact Experiments 10
5 WAVE PHENOMENA 39
5.1 Camera Limits 39
5.2 Wave Velocities and Elastic Constants 40
5.3 Wave Formation in a Slab 43
5.4 Wave Splitting 44
5.5 Energy Distribution 47
5.6 Temperature of the Wave Field 51
6 FRACTURE PHENOMENA 53
6.1 General 53
6.2 Summary of Fracture Phenomena 53
6.3 Mescall Zone Development 57
7 ELECTRIC EMISSION METHOD FOR WAVE AND
FRACTURE DETECTION 64
7.1 General 64
7.2 Pre-experiments For Wave Detection 65
7.3 Application in Experiments 68
8 SUMMARY AND CONCLUSIONS 72
9 ACKNOWLEDGEMENTS 74
10 REFERENCES 75
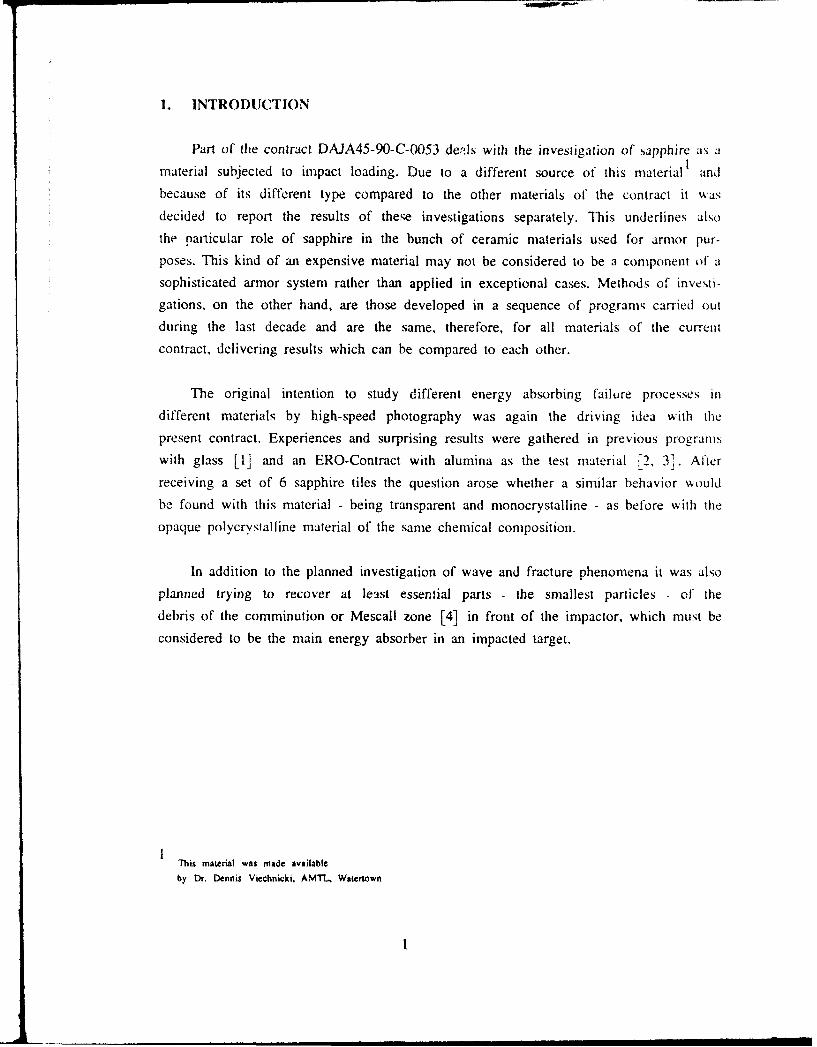
1. INTRODUCTION
Part of the contract DAJA45-90-C-0053 de-ls with the investigation of sapphire as a
material subjected to impact loading. Due to a different source of this material and
because of its different type compared to the other materials of the contract it was
decided to report the results of these investigations separately. This underlines alsothe particular role of sapphire in the bunch of ceramic materials used for armor pur-
poses. This kind of an expensive material may not be considered to be a component of a
sophisticated armor system rather than applied in exceptional cases. Methods of investi-gations, on the other hand, are those developed in a sequence of programs carried outduring the last decade and are the same, therefore, for all materials of the current
contract, delivering results which can be compared to each other.
The original intention to study different energy absorbing failure processes indifferent materials by high-speed photography was again the driving idea with thepresent contract. Experiences and surprising results were gathered in previous programs
with glass [1] and an ERO-Contract with alumina as the test material [2, 31. After
receiving a set of 6 sapphire tiles the question arose whether a similar behavior would
be found with this material - being transparent and monocrystalline - as before with the
opaque polycrystalline material of the same chemical composition.
In addition to the planned investigation of wave and fracture phenomena it was alsoplanned trying to recover at least essential parts - the smallest particles of the
debris of the comminution or Mescall zone [4] in front of the impactor, which must be
considered to be the main energy absorber in an impacted target.
"This material was made available
by Dr. Dennis Viechnicki. AMTL, Watertown
I
2. EXPERIMENTAL PROCEDURE
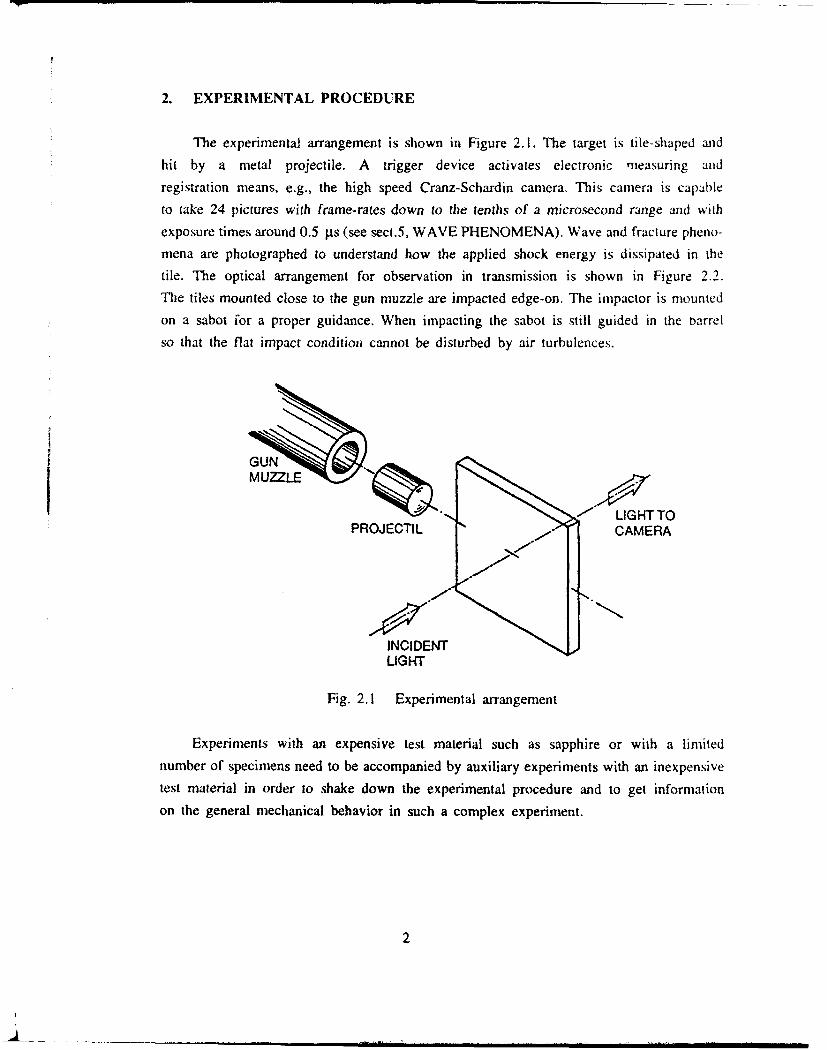
The experimental arrangement is shown in Figure 2.1. The target is tile-shaped and
hit by a metal projectile. A trigger device activates electronic measuring and
registration means, e.g., the high speed Cranz-Schardin camera. This camera is capableto take 24 pictures with frame-rates down to the tenths of a microsecond range and with
exposure times around 0.5 pas (see sect.5, WAVE PHENOMENA). Wave and fracture pheno-mena are photographed to understand how the applied shock energy is dissipated in the
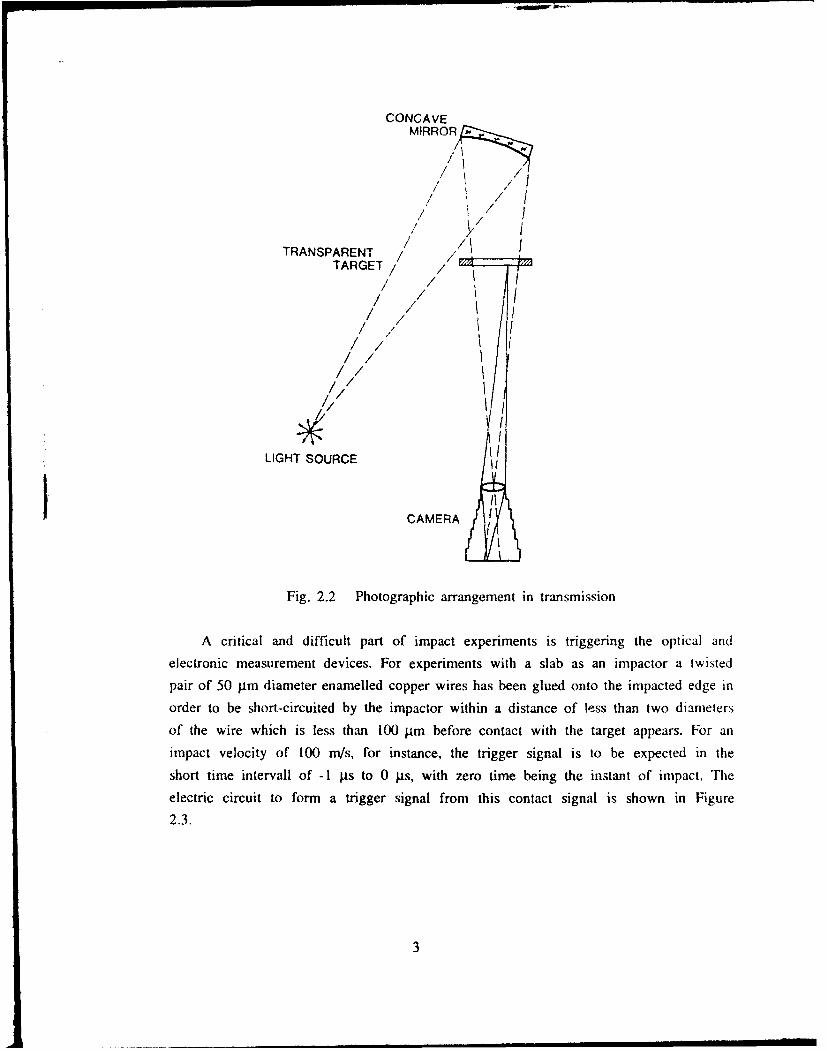
tile. The optical arrangement for observation in transmission is shown in Figure 2.2.
The tiles mounted close to the gun muzzle are impacted edge-on. The impactor is mounted
on a sabot for a proper guidance. When impacting the sabot is still guided in the tbarrel
so that the flat impact condition cannot be disturbed by air turbulences.
GUMUZZLE.
- LIGHT TOPROJECTIL CAMERA
INCIDENTLIGHT
Fig. 2.1 Experimental arrangement
Experiments with an expensive test material such as sapphire or with a limited
number of specimens need to be accompanied by auxiliary experiments with an inexpensive
test material in order to shake down the experimental procedure and to get information
on the general mechanical behavior in such a complex experiment.
2
CONCAVEMIRRORi'
/ ,/ // '1/
/ /! I
TRANSPARENT / /TARGET/ /
LIH SOURC
/ A/ / //~/ /I
/ /'I
1// /
LIGHT ,SOURCE CAEA
Fig. 2.2 Photographic arrangement in transmission
A critical and difficult part of impact experiments is triggering the optical andelectronic measurement devices. For experiments with a slab as an impactor a twisted
pair of 50 gm diameter enamelled copper wires has been glued onto the impacted edge in
order to be short-circuited by the impactor within a distance of less than two diameters
of the wire which is less than 100 Am before contact with the target appears. For an
impact velocity of 100 mns, for instance, the trigger signal is to be expected in the
short time intervall of -1 gs to 0 pgs, with zero time being the instant of impact. The
electric circuit to form a trigger signal from this contact signal is shown in Figure
2.3.
3
TRIGGER A 10 I TRIGGERSIGNAL 0...+5 V
WIRES A 1 gF
100 WQ
-5 V
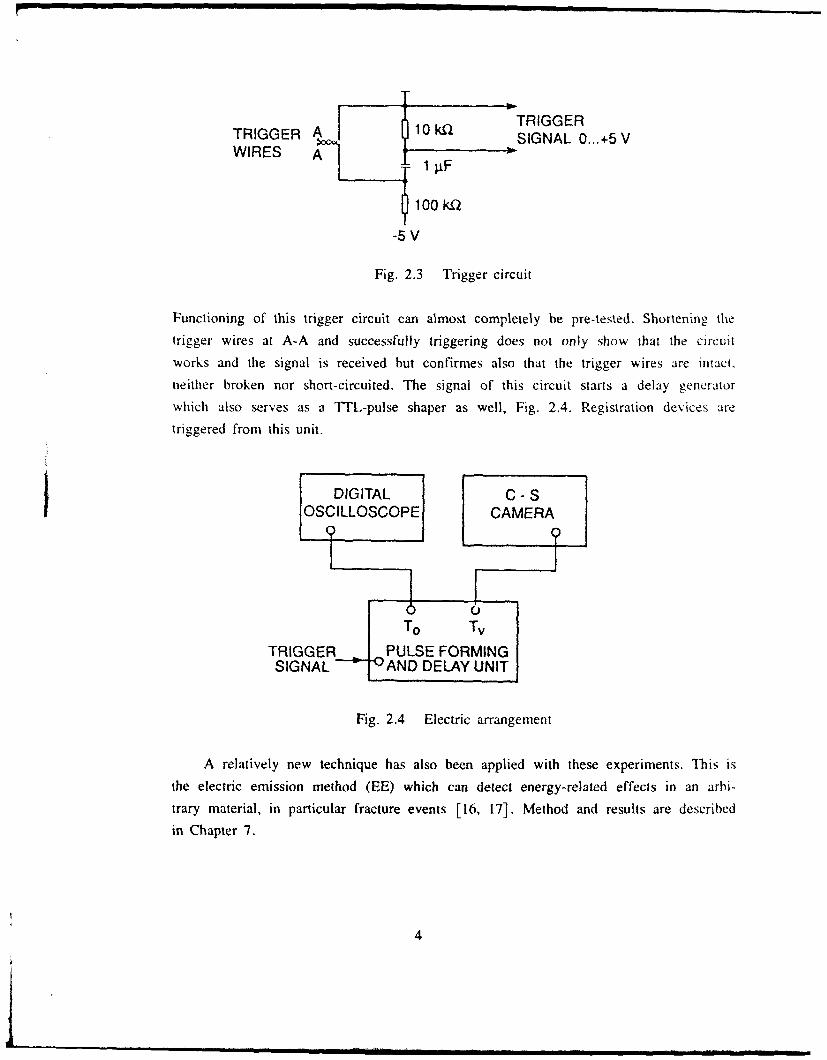
Fig. 2.3 Trigger circuit
Functioning of this trigger circuit can almost completely be pre-tested. Shortening thetrigger wires at A-A and successfully triggering does not only show that the circuitworks and the signal is received but confirmes also that the trigger wires are intact,neither broken nor short-circuited. The signal of this circuit starts a delay generatorwhich also serves as a TTL-pulse shaper as well, Fig. 2.4. Registration devices aretriggered from this unit.
DIGITAL C -S
OSCILLOSCOPE CAMERA
I FTo TV
TRIGGER PULSE FORMINGSIGNAL AND DELAY UNIT
Fig. 2.4 Electric arrangement
A relatively new technique has also been applied with these experiments. This isthe electric emission method (EE) which can detect energy-related effects in an arbi-trary material, in particular fracture events [16, 17]. Method and results are described
in Chapter 7.
4
In1 I ! a" i I

3. MATERIALS
3.1 Glass
Accompanying experiments have been carried out with float glass as a targetmaterial as in the previous investigations [1-3]. This material is available andinexpensive. Material parameters are presented in Table 3.1. This float glass exhibits
residual stresses caused by production with t:-igential compression stress at thesurfaces and an inside tensile stress component.
PROPERTY CONDITION QUANTITY
DENSITY, p published data 2500 kg/m 3
SOUND WAVE VELOCITY, cL published data 5860 m/sPOISSON' s RATIO, v published data 0.23YOUNG' s MODULUS, E pub l ished data 70 GPa
P_ c 2 86 GPatACOUST IC IMPEDANCE Z = pC 15. 106 kg/( s);
HARDNESS, HV published dat 680
Table 3.1 Properties of float glass
3.2 Sapphire
Published sapphire material parameters are taken from data sheets or are measured -
respectively calculated - during work on this contract. The published data sometimesvary considerably. Young's modulus, for example, varies in literature from about 350 GPato about 390 GPa, probably depending on the orientation of the test bar compared withthe crystallographic C-axis. Methods for determination of material parameters duringthis work are described in detail in chapter 5 of this report.
All target samples used in experiments of this part of the contract were tileshaped and had the dimensions 100 mm x 100 mm x 10 mm.
5

PROPERTY CONDITION QUANTITY
S1 3980DENSITY, p publ i shed data 3980 kg/gm' 3
p = M/V 3995 kg/ mSOUND WAVE pub I i shed dataVELOCITY; c ul t rasonic 11360 m//s
__t h i s work, average 11538 rn/.s
SHEAR WAVE pub I i shed dataVELOCITY, c this work 6170 mr/sRAYLEIGH WAVE pubI i shed dataVELOCITY; c this work 5720 rn/sRYOUNG' s pu l . data, 30' C 350-390 GPaMODUKUS, E Pc 516 GPa
this work 390 GPa
POIS. 's RAT., v this work 0.29
ACOUST. IMPED Z = pC 45 .4. 106 kg/(m-N
MELTING POINT p pubI i shed data (2040 ± 10)° C
COMPR. STRENGTH pub l i shed data 2. GPa
TENSILE 200 C 0.400 GPaSTRENGTH 500 0 C 0. 276 GPa
10000 C 0.359 GPa
MODULUS OF mrax. bend. stress, 0.449 GPaRUOTURE orient, dependent 0.690 GPa -
MODULUS OF minimum value,RIGIDITY o...orient, dependent 148 GPa
SPECIFIC HEAT 200 C different 419 J/(kgK)200 C sources 754 J / (kg.K)
THERMAL heat flow, 26' C 0.251 J/(mr.s.K)CONDUCTIVITY heat flow, 23" C 0.209 J /(n.s.K)
Table 3.2 Properties of sapphire
General properties of this material, also compared with others, are cited from a
manufacturer's brochure [5]:
Sapphire, single crystal aluminum oxide, is classed as a rhombohe-dral structure but is normally indexed on hexagonal axes. Optical-ly, it is a negative, uniaxial crystal in the visible; it exhibitsanisotropy in its physical, thermal, and dielectric properties. Anamphoteric semiconductor, sapphire's energy band gap, approximately10 eV, which is one of the larger for oxide crystals, permits use-ful optical transmission to extend from about 1450 A to 5.5 mn.
6

(..) Generally, most sapphire grown by this (the CZOCHRALSKI) pro-cess is such that the c-axis or optic aris is inclined at an angleof 60 degrees from the growth axis. Where the growth axis is coin-cident with the c-axis, usually called zero-degree orientation, theoptical quality of the sapphire is substantially lower than thatobtained in all other growth orientations ...
Of all practical optical materials (...) Cz sapphire has the great-est strength, the most useful broadband transmission, the highestoperating temperature capability, the highest thermal conductivity.the highest dielectric constant and dielectric strength, the bestdegree of chemical inertness, the highest hardness, the best raine-rosion resistance.
X-Ray diffraction measurements were carried out in order to identify the cry ,al
orientation. As a test piece a fragment of the target of shot # 1035 was used. Thisshowed a part of the large surface as well as a part of an edge surface. The applied Cr-
Kcc radiation corresponds to a 2.2897 A wavelength. The lattice parameters are lis!ce,; i'1
Table 3.3. The determined orientations of the surfaces are shown in Table 3.4
a = 4.758 5 h =4.7589 c = 12.991 A
a = 5.1282 A = 55.279 t = 42.956'Rh Rh Rh
Table 3.3 Lattice parameters
CRYSTAL PLANF 1 ANGLE OF DIFFRACTION. 20
SURFACE 1300) 112 863° 6
EDGE1 10) 57.53 20
Table 3.4 Orientation of the sample surfaces
Theoretically, the hexagonal-rhornbohedral crystal exhibits 61 possible latticeplanes with many of them counted twice or more in this systematic way. These planes arelisted in Table 3.5 related to the (110) plane which is the edge surface and in Table3.6 r-lated to the large surface which is the 13001 plane. Any of the lattice planes can
act as a cleavage plane, however, with different strength.
7
S. . ... . . • , • , • , l I I | I nII !I !I |mn

h k I ANGLE
-2 1 0 120 .000-1 -1 0 180 .000
1 2 0 60 .0001 -2 0 120 .0001 1 0 0 .0002 -1 0 60 .000
Table 3.5 Lattice planes related to the (110) plane
h k I ANGLE h k I ANGLE h k 1 AN61,E
-3 0-3 162 402 -1-2-4 132 970 2-3-5 80 672-3 0 0 180 000 -1-2 5 130 419 2-3 4 80 1S9-3 0 3 162 402 -1 3 -5 80 672 2 2 -7 70 449
-3 1 -5 144 141 -1 3 4 80 189 2 -2 8 7 1 970h-3 1 4 148 431 0 -3 -3 11 8 464 2 0 -8 5 1 755-3 2-4 132 970 0-3 0 120 000 2 0 7 47 9 S8-3 2 5 130 419 0 -3 3 118 464 2 1 -4 3 1 569-3 3 -3 118 464 0 -2 -8 108 030 2 1 5 35-3 3 0 120 000 0-2 7 109 551 3-3-3 6 1536- -1 -5 144 141 0 0-9 90 000 3 -3 0 60 0 60-2 -1 4 148 431 0 0 9 90 000 3 -3 3 61 536-2 0-7 132 012 0 2-7 70 449 3-2-5 49 581-2 0 8 128 245 0 2 8 71 970 3-2 4 47 030-2 2 -8 108 030 0 3 -3 6 1 536 3 -1 -4 3 1 569-2 2 7 109 551 0 3 0 60 000 3 -1 5 35 859-2 3 -4 99 811 0 3 3 6 1 536 3 0 -3 1 7 598-2 3 5 99 328 1-3-4 99 811 3 0 0 0 000
1 -3 5 99 328 3 0 3 17 5981 2 -5 49 5811 2 4 47 030
Table .3.6 lattice planes related to the (300) plane
8

4. IMPACT EXPERIMENTS
4.1 General
A series of 17 experiments has been carried out which are listed In Table 4.1.Steel was used for the projectile material. This exhibits the same acoustic impedance a-sapphire, Z S 45.106 kg/(rn 2s).
steel
SHOT TARGET PPROJECTILE v! No material shape II sI
110341 glas s here 18 mm di a98: 2L 1035lsapphire sphere 18 mm di a. 39__
311036. glass kn__ife edge 5e14037i glass knife edge .e_ 2"-I------ ......- -----
5;1038 glass knife edge 24
6 •1039 gl as s s bar 10 mm x 10 mm, 49 mm ._92"711040 sapphire bar 10 mm x 10 mm, 43 mm 1311,S 1041 s apph i re knife edge 3 2.1911042 sapphire knife edge 32S I10lO045 glass bar 10mm x 10 mm 49 nmml o'11 1046 1 a s s tbar I 0mm x 10 mm. 49 mm I 6t)I-)1047i g l ass cyl. 5 , mm di a. 174 mm I.. flat nose '20
f1310 4 8 g las s cyl. 50 mm d ia. 174 mm I., spher. nose, 13114 1049 glIa ss bar 1 0 mmi x 10 mim, 4 9 mmi15
151050sapph i re slab 49 mm d ia. 10 mm t hick 193;i11 105 glas s slab 49 mm d ia. 10 mm t hick 104LsgR T ....... 1_~l}02spp re slab 49 mim dia. 10 mm thick il14•
'rable 4.1 List of impact experiments
Attempts have been made to vary the impact area from zero (point or line contact)to a maximum area of 49 mm x 10 mm, which is close to the cannon caliber of 50 amm. Aline contact was thought to be preferable instead of a point contact by using a steelsphere This, however, caused increased difficulties with triggering with the consequencethat it worked once in a g!ass experiment but it failed twice with the sapphire.
9

r V
The initial impact pressures of the experiments described thereafter is calculated
from the impact velocity by eq.(5.9a).
4.2 Description of Impact Experiments
# I Results of 98 mns experimer.: on glass, # 1034
The calculated initial pressure in the wave is aA = 1.1 GPa- ,+.(5.9a). Theimpaclor was an 18 mm diameter steel sphere. The target was a float glass plate
100 mm x 100 mmx 10 mm. Figure 4.1 shows a series of 24 high speed photographs of thespecimen during impact at 98 m/s. Black regions in the photos are assumed to be cracks,whose surfaces stop light or reflect it and direct it away from the camera lens. Wavesof any kind cannot be seen on the pictures which is a consequence of the low wvave
pressure
The purpose of this experiment was to test the arrangement and in particular the
new trigger which is described in chapter 2 (Fig.2,2). This included also the test ofthe electric emission probes for wave and fracture detection. The results are discussed
in chapter 7.
# 2 Results of 39 m/s experiment on sapphire, # 1035
The calculated initial pressure in the wave is GA = 0.9 GPa. Figure 4.2 shows a
series of 24 high speed photographs of the sapphire specimen during impact at 39 m/s.
Black regions in the photos are assumed to be cracks, whose surfaces stop light orreflect it and direct it away from the camera lens. No waves can be seen on the
pictures. For triggering the camera a pair of contacts had been used as described indetail in [2], page 11. With this trigger device the exact instant of impact is dif-ficult to determine. From the occurrence of damage which is first evident in picture #3(Fig.4.2.1) it is assumed that this happened shortly before 12.75 pis after trigger.
The location of the shadows at the periphery of the projectile contact region, and
their orientation at roughly 45' to the impacted surface suggests that the damage
consists of cone cracks, which propagate into the target approximately 15 microseconds,
Figure 4.3.
10

IWM-Report T 8/93TI
Fig. 4.1 High speed photographs, # 1034
11

Fig. 4.2 High speed Photographs. # 1035
12

PICTURE NO.
1 3 5 7 9 11 13 15 17 19 21 22 23 24
# 1035 SAPPHIRE * CONE CRACK (UPPER) vc.rax = 1. 7 mrnmts
v = 39 mi/s o RADIAL CRACK (UPPER) vc.max = 1.8 mm/ps
80 O + RADIAL CRACI' (CENTER) vc.rrx - 2.8 mm/rts* RADIAL CRACK (EDGE)
E o X-CRACK I (FIG. 4.5) vc 3 4 fMV s,E a X-CRACK I (FIG. 4.5)
S60 v X-CRACK IV (FIG. 4.5)
LU-0z< 40
20
010 20 30 40 50
TIME t, stS
Fig. 4.3 Crack events, # 1035
The cracks seem to start at relatively modest velocities (~ 700 m/s), speed up to
about 1700 m/s and slow down again. Different parallel, shell-like cracks develop within
about 20 microseconds after impact and grow at velocities around 1800 m/s. Because the
dominant shell crack (that is approximately parallel to the specimen sides) does not
divert much of the light away from the camera lens, its front and details of its surface
structure can be seen. The parallel cracks emanating from opposite sides of the impact
periphery coalesce with one another in Figure 4.2, #8 and overtake the cone crack front
after 7 microseconds, Figure 4.2, #9.
A parallel dominant shell crack appears to be active in Figure 4.2, #19, overtaking
the arrested dominant parallel (Figure 4.2, #21) before it arrests. After 33 micro-
seconds all damage processes local to the impact site have ceased, only structural
damage continues to occur in the plate far from the impact site.
Several large radial macrocracks emanate from the impact site and propagate in x-direction through the plate to fracture it into several large pieces. The vestiges ofthese cracks are clearly visible in Figures 4.2, #21 to #24, although only in the last
13
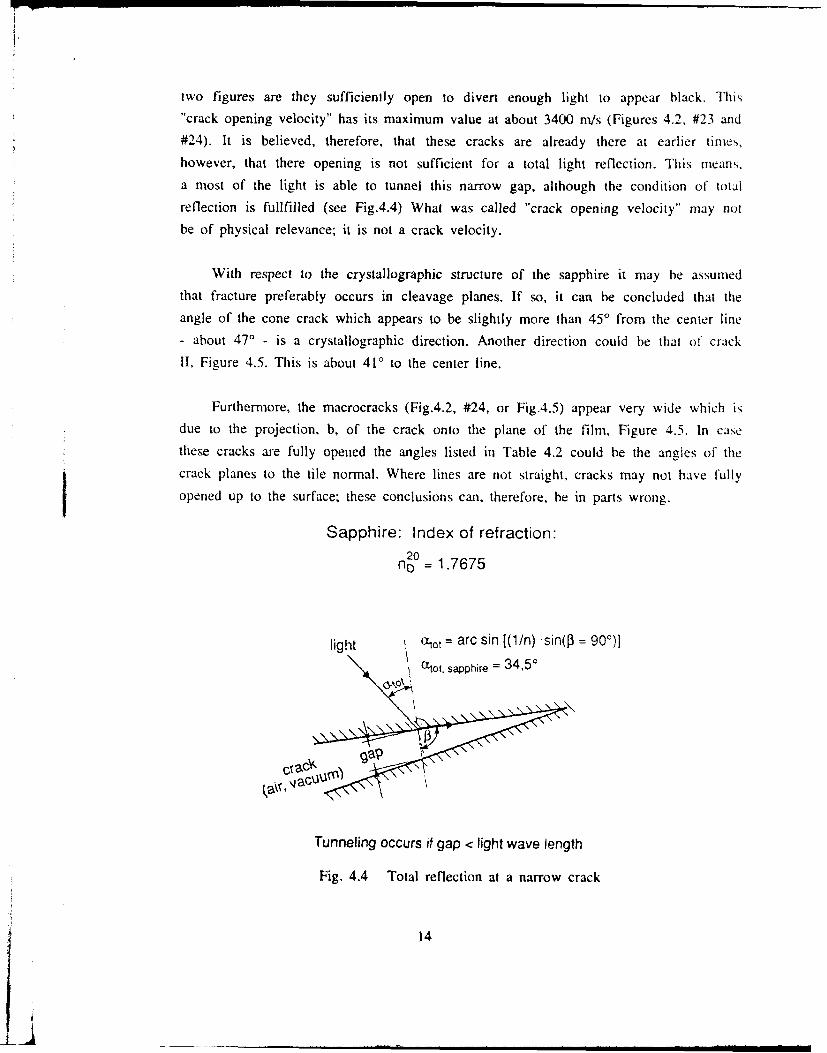
two figures are they sufficienily open to divert enough light to appear black. This"crack opening velocity" has its maximum value at about 3400 nvs (Figures 4.2. #23 and#24). It is believed, therefore, that these cracks are already there at earlier times,however, that there opening is not sufficient for a total light reflection. This means.a most of the light is able to tunnel this narrow gap, although the condition of totalreflection is fullfilled (see Fig.4.4) What was called "crack opening velocity" may notbe of physical relevance; it is not a crack velocity.
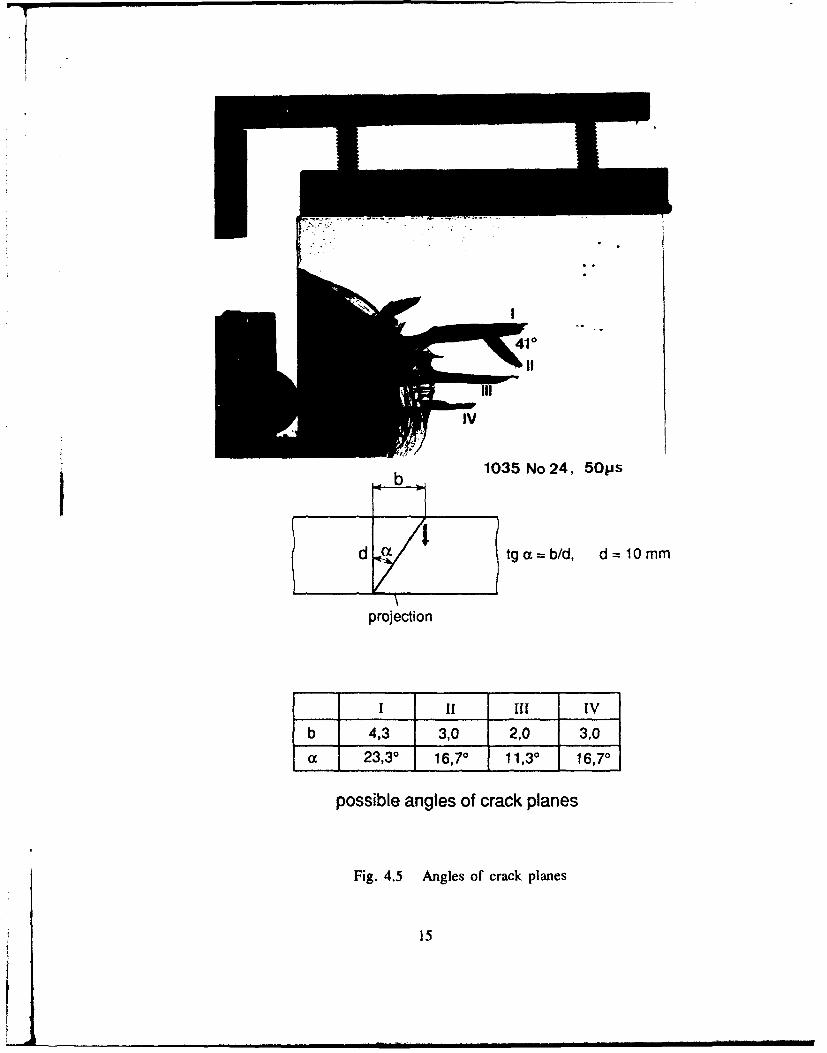
With respect to the crystallographic structure of the sapphire it may be assumedthat fracture preferably occurs in cleavage planes. If so, it can be concluded that theangle of the cone crack which appears to be slightly more than 45' from the center line- about 470 - is a crystallographic direction. Another direction could be that of crack
II, Figure 4.5. This is about 41' to the center line.
Furthermore, the macrocracks (Fig.4.2, #24, or Fig.4.5) appear very wide which isdue to the projection, b, of the crack onto the plane of the film, Figure 4.5. In casethese cracks are fully opened the angles listed in Table 4.2 could be the angles of thecrack planes to the tile normal. Where lines are not straight, cracks may not have fully
opened up to the surface; these conclusions can, therefore, be in parts wrong.
Sapphire: Index of refraction:
20n C = 1.7675
light o ,t = arc sin [(l/n) 'sin(i3 = 90c)]" "!%, \ :tatot, sapphire =34,50
Tunneling occurs if gap < light wave length
Fig. 4.4 Total reflection at a narrow crack
14
A
I
b 1035 No 24, 50ps
d tg a = b/d, d = 10 mm
projection
I 11I 1 IVb 4,3 3,0 2,0 3,0
a 23,30 16,7- 11,30 16,70
possible angles of crack planes
Fig. 4.5 Angles of crack planes
15

# 3 Results of 55 m/s experiment on glass, # 1036
The calculated initial wave pressure is cyA = 0.6 GPa. The impactor was a knife-edgesteel bar. For triggering the camera a pair of contacts were used as described in detailin [1], page 11. Unfortunately, the trigger failed in this experiment. The purpose was
to test the capability of the gun device - which has no guided barrel - to carry out
knife-edge experiments. From that point of view the test, although it failed, showed
that principally this can be done. The knife-edge arrived at the target in the correct
position.
# 4 Results of 22 m/s experiment on glass, # 1037
The calculated initial wave pressure is aA = 0.2 GPa. The impactor was a steel
knife-edge. For triggering the camera a pair of contacts were used as described in
detail in [2], page 11. Unfortunately, the trigger failed also in this experiment. The
purpose was to repeat shot # 1036, i.e., to test the capability of the gun device to
carry out knife-edge experiments. Again the knife-edge arrived at the target in tile
correct position.
# 5 Results of 24 ni/s experiment on glass, # 1038
The calculated initial wave pressure is a"A = 0.3 GPa. The impactor was a knife-edgesteel bar. For triggering the camera a pair of contacts were used as described in detail
in [2], page 11. The purpose of the experiment was to repeat shots # 1036 and # 1037 and
to test the capability of the gun device to carry out knife-edge experiments. The knife-
edge arrived at the target in the correct position.
Due to the very low wave pressure, the optial method could not detect waves within
the target. First cracks become visible at 27 ps after trigger. The instant of impact is
unknown. Two cracks seem to develop, a radial crack about normal to the surfaces and at
least one shell-like crack about parallel to the surfaces. The velocity of the radial isvery low in the beginning, about 0.5 mm/ts, but speeds up to 1.2 mm/ts in the last
pictures, at 80 gts. The shell crack becomes slower and arrests when it reaches the
surface.
16

171

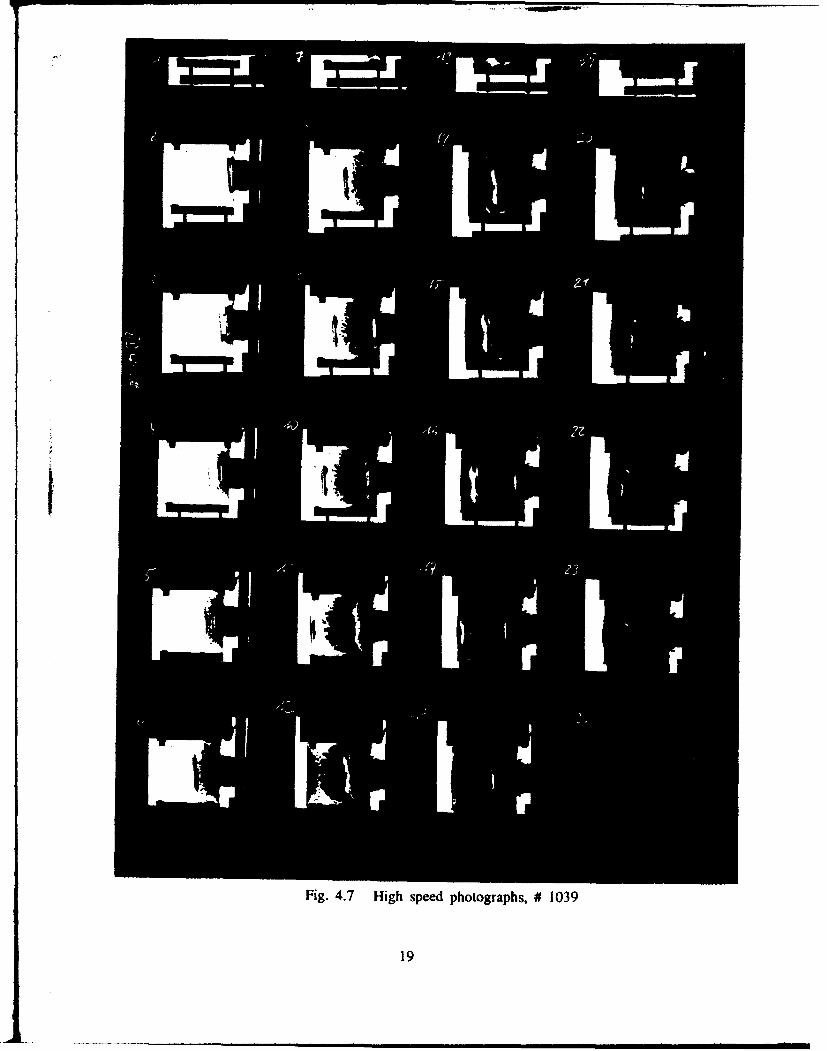
# 6 Results of 292 m/s experiment on glass, # 1039
The calculated initial wave pressure is aA = 3.3 GPa. Waves are photographed pre-ceeding the fracture events. The impactor was a 10 mm square and 49 mm long steel bar.Figure 4.7 shows 24 high speed photographs of this experiment. The trigger was thatdescribed in chapter 2 (Fig. 2.2).
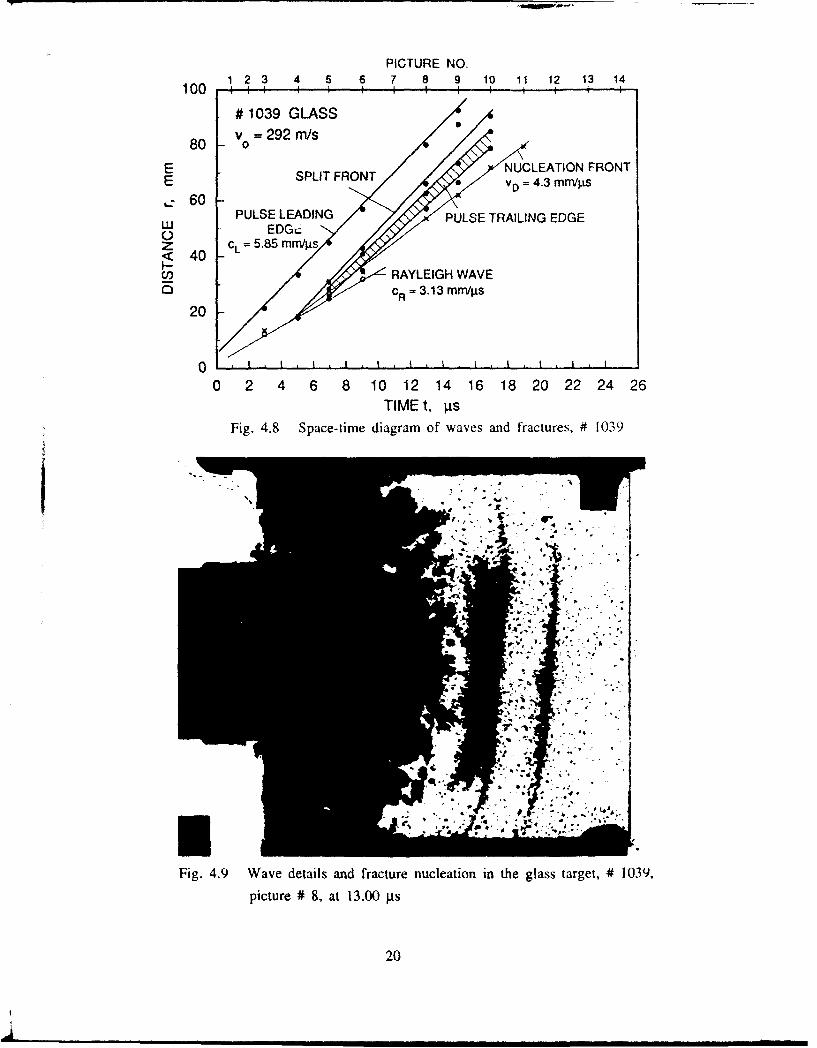
This experiment shows interesting wave and fracture phenomena. Eight of manyvisible crack nucleations could be used to determine a damage velocity, vD = 4.3 mnmips.Because of the 10 mm thick projectile bar the pressure pulse has a duration of 3.5 p.swhich results in a pulse length of about 20 mm in glass. The photographs show this pulse
with the leading front and the trailing edge and a front in between, which is belie,,ed
to be due to wave splitting (see sect. 5.4). The intermediate second front follows thefirst front after X = 14.5 mm. With the method described in section 5.4. eq. 5.8, theshear wave velocity can be calculated from this distance: cL = 1.7 6 .cT which results in
i = 3 330 m/s.
The rear pulse edge appears much thicker than the two wave fronts, Fig.4.9. This isa consequence of this part of the pulse having been travelled twice through the impactor
bar. In steel the edge splits up into an elastic part and a slower plastic part and is
reflected at the rear impactor edge, thereby undergoing a fan-out effect.
Figure 4.9 shows also material being ejected at the impactor edges. The also seenair blast wave which originates from the compressed air at the impact site has a radiusof more than 1 cm in this picture which corresponds to an average expansion velocity ofabout 800 m/s, which is almost three times the speed of sound in air. The material'svelocity is less but still supersonic as can be concluded from the attached air wave.
18
I2
PICTURE NO.1 2 3 4 5 6 7 8 9 10 11 12 13 14
# 1039 GLASS
80 Vo = 292 m/s
E SPI FROTNUCLEATION FRONTE SPLIT FRONT vD = 4.3 mmr/ps
60PULSE LEADING PULSE TRAILING EDGE
uJ EDGezOZ CL =5.85 mm/lS/
< 40 CL585 mL_ • RAYLEIGH WAVE
C0 CR =3.13 mm/pgs
20
0
0 2 4 6 8 10 12 14 16 18 20 22 24 26TIME t, gs
Fig. 4.8 Space-time diagram of waves and fractures, # 1039
SI
Fi g. 4.9 Wave details and fracture nucleation in the glass target, # 1039,
picture # 8, at 13.00 pis
20
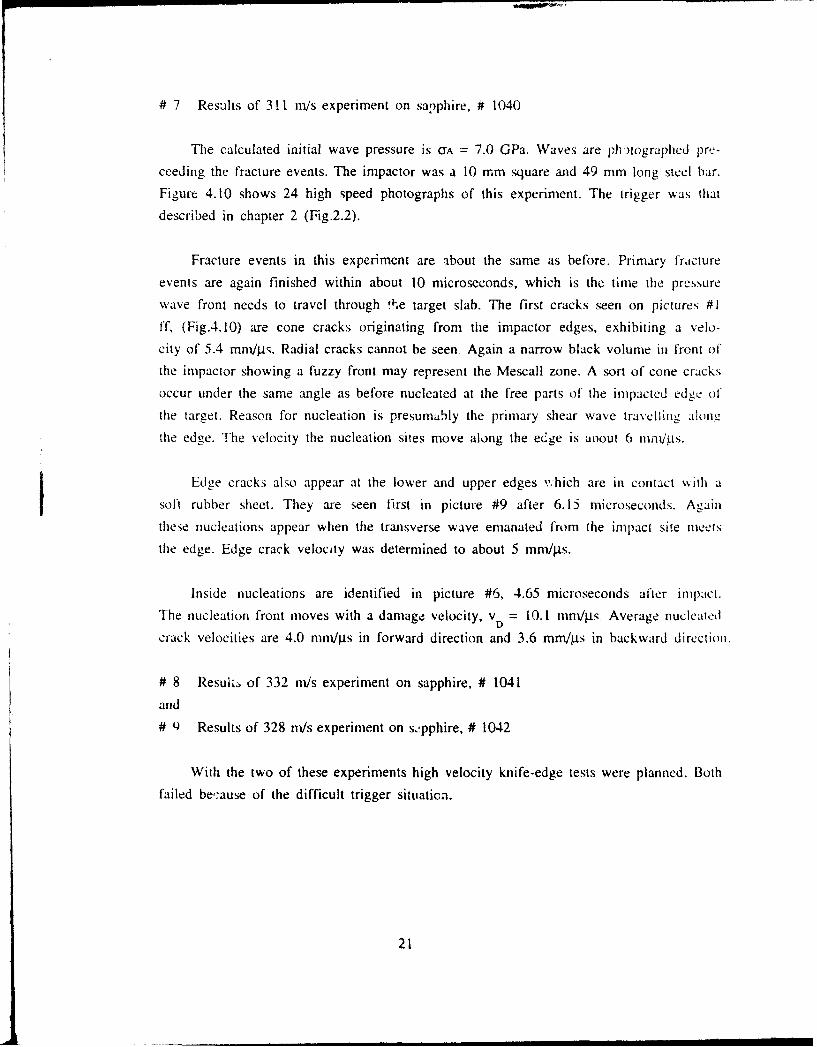
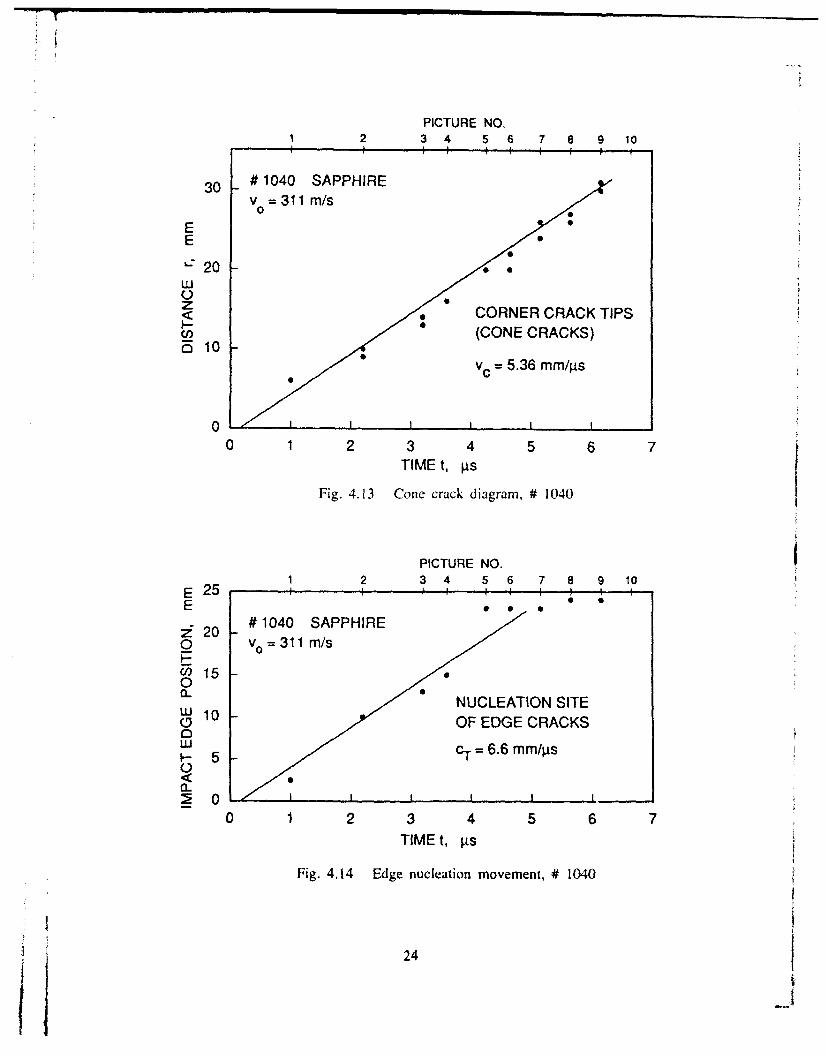
# 7 Results of 311 m/s experiment on sapphire, # 1040
The calculated initial wave pressure is oA = 7.0 GPa. Waves are phmographed pre-
ceeding the fracture events. The impactor was a 10 mm square and 49 mm long steel bar.Figure 4.10 shows 24 high speed photographs of this experiment. The trigger was that
described in chapter 2 (Fig.2.2).
Fracture events in this experiment are about the same as before. Primary fracture
events are again finished within about 10 microseconds, which is the time the pressure
wave front needs to travel through ke target slab. The first cracks seen on pictures #1
ff, (Fig.4.10) are cone cracks originating from the impactor edges, exhibiting a velo-
city of 5.4 mnVip;. Radial cracks cannot be seen. Again a narrow black volume in front ofthe impactor showing a fuzzy front may represent the Mescall zone. A sort of cone cracks
occur under the same angle as before nucleated at the free parts of the impacted edge- of
the target. Reason for nucleation is presumably the primary shear wave travellinie alo•nthe edge. The velocity the nucleation sites move along the edge is aoout 6 mnm./p.s.
Edge cracks also appear at the lower and upper edges which are in contact Nkith asoft rubber sheet. They are seen first in picture #9 after 6.15 microseconds. Againthese nucleations appear when the transverse wave emanated from the impact site meets
the edge. Edge crack velocity was determined to about 5 mm/its.
Inside nucleations are identified in picture #6, 4.65 microseconds after impact.The nucleation front moves with a damage velocity, v = 10.1 mam/pts Average nucleated
crack velocities are 4.0 mm/pns in forward direction and 3.6 mm/p.s in backward direction.
# 8 Resultt of 332 ni/s experiment on sapphire, # 1041
and
# '4 Results of 328 m/s experiment on s.,pphire, # 1042
With the two of these experiments high velocity knife-edge tests were planned. Both
failed because of the difficult trigger situation.
21

Fig. 4.10 High speed photographs, # 1040
22
P Ii I

PICTURE NO.
1 2 34 5 6 7 8 9 10 11
100 -A 4 I I I IT
# 1040 SAPPHIRE
80 Vo =311 m/s
E PULSE LEADING EDGEES60 CL = 1161 mm/is
0 j SPLIT FRONTz RAYLEIGH WAVE< 40 c5.78(n PULSE TRAILING
S~KEDGE
20 0.
0 / BLACK AREA // VBA =3.3mm/is
/0 1 2 3 4 5 6 7 8 9 10
TIME t, ýis
Fig.4.11 Space-time diagram of waves, # 1040
PICTURE NO.
6 8 10 12 13 14 15 16 17100 4 f 1 • /i i
/ .
# 1040 SAPPHIRE / /VD=10.lmmris
80 Vo =311 m/s / // oE /E /,: 60 / /
z< 40C,)/
20forward: = (4.0 +0.35) mm/ps
// / backward:c = (3-6 ± 076) mm/rs
0 1 1 I 1 I I I 1 1 1 I 1 ,
0 1 2 3 4 5 6 7 8 9 10 11 12 13 14 15TIME t, ps
Fig,4.12 Space-time diagram of fractures, # 1040
23
PICTURE NO,1 2 3 4 5 6 7 8 9 10SI I I ' - , , ,
30 # 1040 SAPPHIREV= 311 m/s, -0
EE
"20LU(.)Z * CORNER CRACK TIPS
t"-o')(CONE CRACKS)S10-
vc- 5.36 mm/lgSC,,
t I00 1 2 3 4 5 6 7
TIME t, p.S
Fig. 4.13 Cone crack diagram, # 1040
PICTURE NO.
1 2 3 4 5 6 7 8 9 10E 25 - +
E
20-# 1040 SAPPHIREo 20 =311m/s
W" 150a. _NUCLEATION SITEWU 1009 OF EDGE CRACKS0j 5c-T= 6.6 mm/;.Is
0<2: 0
0 1 2 3 4 5 6 7TIME t, I•s
Fig. 4.14 Edge nucleation movement, # 1040
24
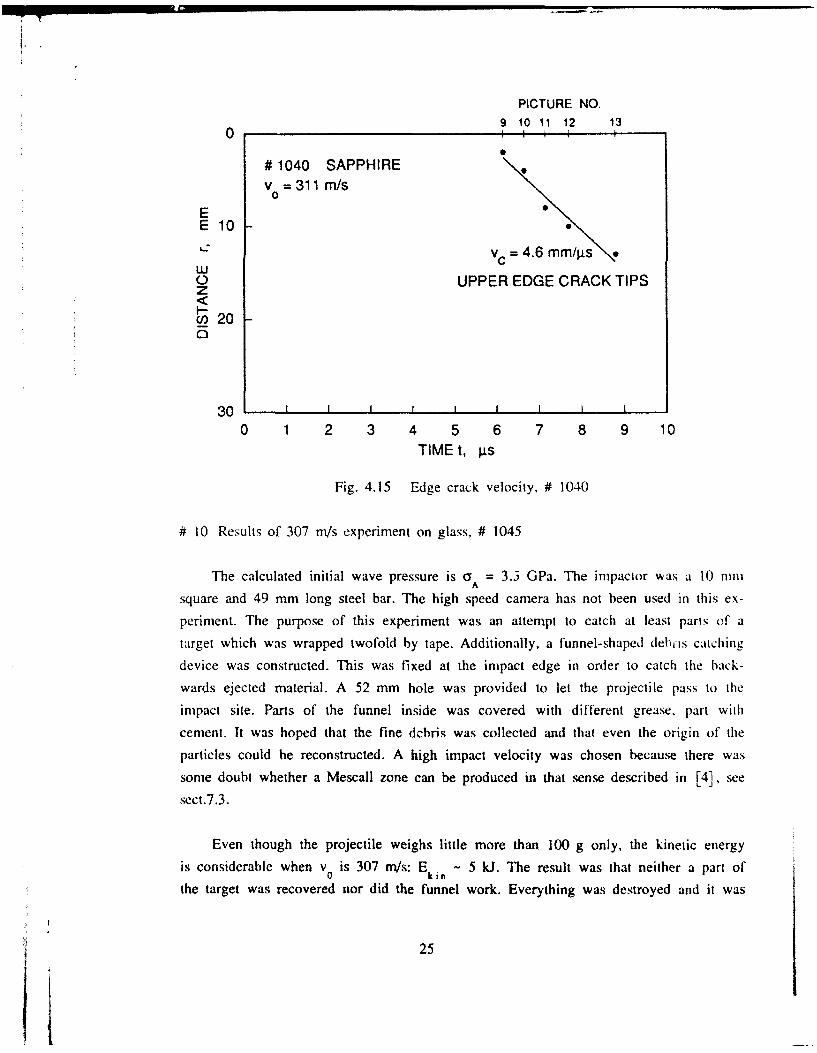
PICTURE NO.9 10 11 12 13
0 I00
# 1040 SAPPHIREv =311 m/s0
EE 10
=c.4.6 \mm/gsLLI
0 UPPER EDGE CRACK TIPSZ
i 20
30
30 t I I I I I I I
0 1 2 3 4 5 6 7 8 9 10
TIME t, gis
Fig. 4.15 Edge crack velocity, # 1040
# 10 Results of 307 m/s experiment on glass, # 1045
The calculated initial wave pressure is YA = 3.3 GPa. The impactor was a 10 mm
square and 49 mm long steel bar. The high speed camera has not been used in this ex-
periment. The purpose of this experiment was an attempt to catch at least parts of a
target which was wrapped twofold by tape. Additionally, a funnel-shaped debris catching
device was constructed. This was fixed at the impact edge in order to catch the back-
wards ejected material. A 52 mm hole was provided to let the projectile pass to the
impact site. Parts of the funnel inside was covered with different grease, part with
cement. It was hoped that the fine debris was collected and that even the origin of the
particles could be reconstructed. A high impact velocity was chosen because there was
some doubt whether a Mescall zone can be produced in that sense described in [41, see
sect.7.3.
Even though the projectile weighs little more than 100 g only, the kinetic energy
is considerable when v0 is 307 m/s: Ekin - 5 kJ. The result was that neither a part of
the target was recovered nor did the funnel work. Everything was destroyed and it was
25

concluded that for a successful debris catching method further development work would be
necessary.
Nevertheless, three more tests have been carried out with glass targets without
camera in order to vary these catching devices or to study large fragment target dis-
integration:
# I 1 A 160 m/s experiment on glass, # 1046
The calculated initial wave pressure is GA = 3.3 GPa. The impactor was a 10 mm
square and 49 mm long steel bar (untreated mild steel).
# 12 A 20 m/s experiment on glass, # 1047
The calculated initial wavc pressure is cIA = 0.23 GPa. The impactor was a steel
cylinder with flat nose.
# 13 A 13 m/s experiment on glass, # 1048
The calculated initial wave pressure is aA = 0.15 GPa. The impactor was a steel
cylinder with spherical nose, r = 25 mm.
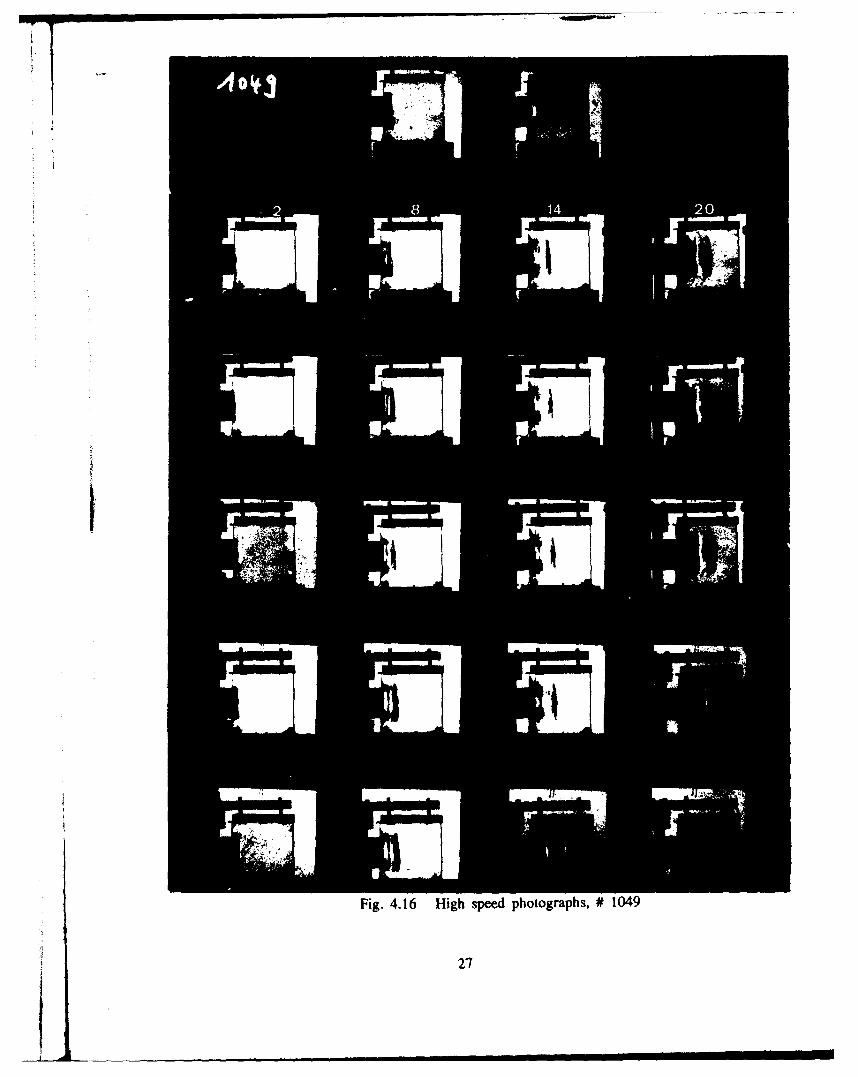
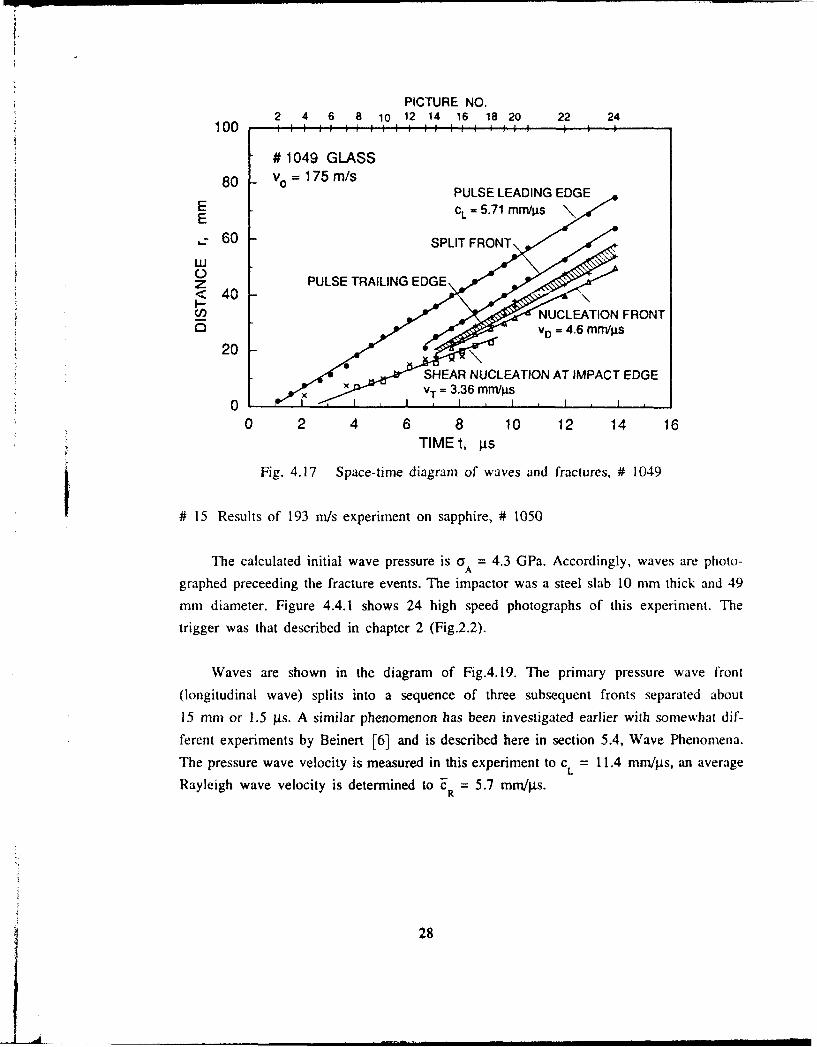
# 14 Results of 175 mls experiment on glass, # 1049
The calculated initial wave pressure is YA = 2.0 GPa. Accordingly, waves are photo-
graphed preceeding the fracture events. The impactor was a 10 mm square and 49 mm long
steel bar. Figure 4.13 shows 24 high speed photographs of this experiment. The triggerwas that described in chapter 2 (Fig.2.2).
This experiment is very similar to the one of # 1039. It shows similar wave and
fracture phenomena. Again the 10 mm thick projectile bar gave rise to a pressure pulse
duration of 3.5 pts. This time, however, the tile thickness was 8 mm only instead of 10
mm which led to a closer distance of X = II mm of the two primary wave fronts due to the
splitting effect (sect.5.4).
26
TV1II
Fig. 4.16 High speed photographs, # 1049
27
PICTURE NO.2 4 6 8 10 12 14 16 18 20 22 24
100
# 1049 GLASS80 Vo =175 m/s
PULSE LEADING EDGEE
S60S
z PULSE TRAILING EDGE< 40U) NUCLEATION FRONT
SvD = 4.6 mirrills
20
SHEAR NUCLEATION AT IMPACT EDGEX vT =3.36 m rn/ls
0 2 4 6 8 10 12 14 16TIME t, I•s
Fig. 4.17 Space-time diagram of waves and fraclures, # 1049
# 15 Results of 193 m/s experiment on sapphire, # 1050
The calculated initial wave pressure is cA = 4.3 GPa. Accordingly, waves are photo-
graphed preceeding the fracture events. The impactor was a steel slab 10 mm thick and 49
mm diameter. Figure 4.4.1 shows 24 high speed photographs of this experiment. The
trigger was that described in chapter 2 (Fig.2.2).
Waves are shown in the diagram of Fig.4.19. The primary pressure wave front
(longitudinal wave) splits into a sequence of three subsequent fronts separated about
15 mm or 1.5 ps. A similar phenomenon has been investigated earlier with somewhat dif-
ferent experiments by Beinert [6] and is described here in section 5.4, Wave Phenomena.
The pressure wave velocity is measured in this experiment to cL = 11.4 mm/jis, an average
Rayleigh wave velocity is determined to E = 5.7 mm/ps.
28

J,
IMI
Fig. 4.18 High speed photographs, # 1050
29
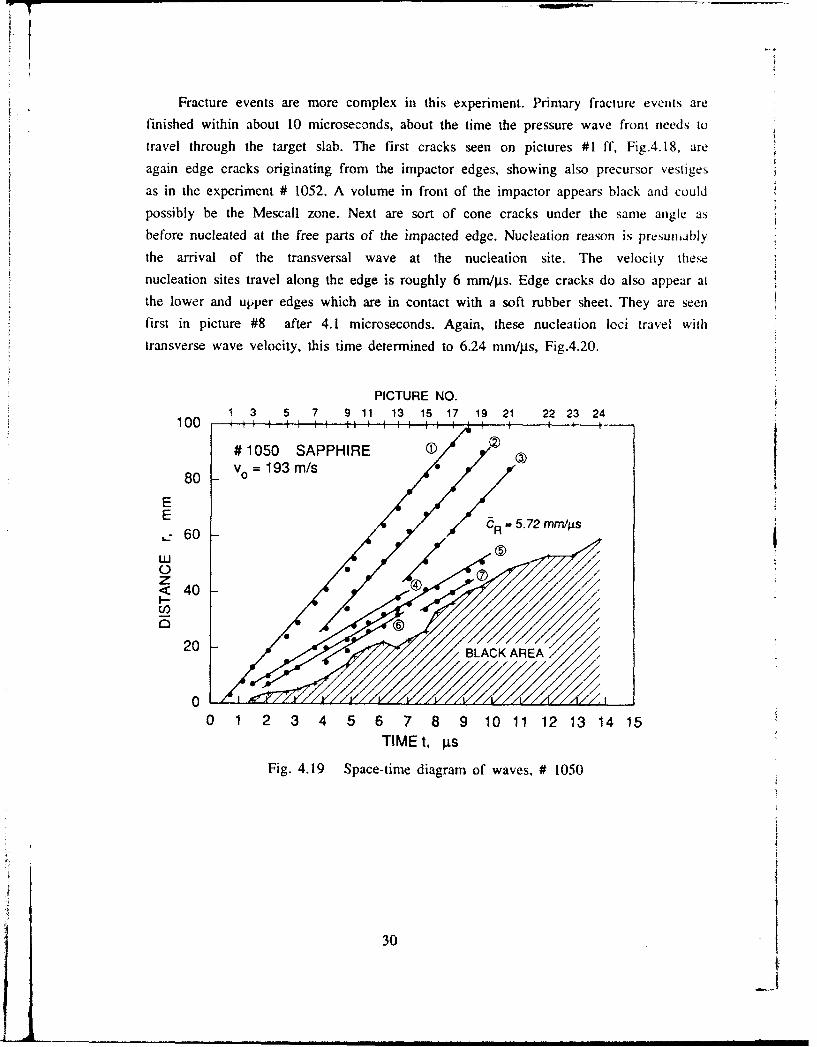
Fracture events are more complex in this experiment. Primary fracture events arefinished within about 10 microseconds, about the time the pressure wave front needs to
travel through the target slab. The first cracks seen on pictures #1 ff, Fig.4.18, areagain edge cracks originating from the impactor edges, showing also precursor vestigesas in the experiment # 1052. A volume in front of the impactor appears black and could
possibly be the Mescall zone. Next are sort of cone cracks under the same angle asbefore nucleated at the free parts of the impacted edge. Nucleation reason is presumablythe arrival of the transversal wave at the nucleation site. The velocity thes e
nucleation sites travel along the edge is roughly 6 mm/ps. Edge cracks do also appear atthe lower and upper edges which are in contact with a soft rubber sheet. They are seen
first in picture #8 after 4.1 microseconds. Again, these nucleation loci travel withtransverse wave velocity, this time determined to 6.24 mm/lgs, Fig.4.20.
PICTURE NO.
1 3 5 7 9 11 13 15 17 19 21 22 23 24100 1
# 1050 SAPPHIRE I80 V = 193 m/s
E
E CR = 5 .7 2 mmlgs
w
0i
< 40_-
20- 20 ~BLACK AR 1EA
00 1 2 3 4 5 6 7 8 9 10 11 12 13 14 15
TIME t, gis
Fig. 4.19 Space-time diagram of waves, # 1050
30

PICTURE NO.1 3 5 7 9 11 13 15 17 19 21 22 23 24
100
# 1050 SAPPHIRE /Sv = 193 m/s /
E/ EDGE NUCLEATIONE / DATA POINTS \
S60 //
o• / THEORETICAL CURVE<Z 40/ CT (6.17 ± 0,15) rniwfThs"
3 / =6,17mrn/is ±2.5%oCORNER CRACKS
20 V- 4.90 mmrn/ps
0 0
00 1 2 3 4 5 6 7 8 9 10 11 12 13 14 15
TIME t, lts
Fig. 4.20 Edge crack nucleation effects, # 1050
Inside nucleations may occur shortly after impact. They cannot clearly be iden-
tified, although there are indications from picture #3 on. Clearly to distinguish inside
nucleations appear first in picture #15, 7.65 microseconds after impact. About four of
them can be used to evaluate a damage velocity, vD = 7.0 mm/ts, Fig.4.21. The cracks
propagating from these nuclei do not exhibit very uniform crack velocities.
PICTURE NO.1 3 5 7 9 11 13 15 17 19 21 22 23 24
100 :1 i i 6 i M 4 i; I\I I I i ,
#1050 SAPPHIRE /v° = 193 m/s /
80 INSIDE NUCLEATIONS //E / VD 7.0 mr4ts. \E / D
S60 /
z< 40 ,W - vc - 5.8 rnnvjiS "-
C'
20 ,LACK AREA
0
0 2 4 6 8 10 12 14TIME t, Vs
Fig. 4.21 Space-time diagram of inside nucleatins, # 1050
31

jI
-1
Fig 4.2 ighsped hotgrahs # 05
-4 ýaP
32 ,

# 16 Results of 104 mns experiment on glass, # 1051
The calculated initial wave pressure is a = 1.2 GPa. Waves are photographed pre-ceeding the fracture events. The impactor was a 10 mm thick and 49 mm diameter steelslab. Figure 4.22 shows 24 high speed photographs of this experiment. The trigger was
that described in chapter 2 (Fig.2.2).
This experiment is similar to those of # 1039 and # 1049. It shows similar wave andfracture phenomena. The tile thickness agian was 8 mm which results in a distance of
X = II mm of the two primary wave fronts due to the splitting effect (sect.5.4). Thisexperiment was considered to be a pre-test for the following sapphire test. The pro-jectile slab thickness was 10 mm which should have generated a pressure pulse durationof 3.5 pIs. The glass tile, however, was in a relatively crude state with an uneven
impact surface. This can be seen with the first wave front which is not as thin asusual. This leads also to a longer (25 mm) pulse length because both of the two edgeshave a reduced slope. There was also a tilt with the -impacted edge so that the lowerprojectile comer hit the target first. This resulted in a tilted wave movement. Oversix pictures a Rayleigh wave can be identified. Its velocity is c = 3.1 mmi/ps. Thefront of many nucleations form a damage velocity of vD = 3.3 mm/s, Fig.4.23.
PICTURE NO.I 2 3 4 5 6 7 8 9 10 11 12 13 14 15 16 17 18 19 20 21
100 I
#1051 GLASS N.8 v° 104 rn/s SPLIT FRONT
80 0
E PULSE LEADING PULSE TRAILINGE EDGE EDGE': 60 cL =5.88 mrn/ps
OD NUCLEATION FRONMz< 40 V0 = 3,33 mrn/ls
I-< 00
20 RAYLEIGH WAVEC R =3.12 mrn/j.s
0 2 4 6 8 10 12 14 16 18 20 22 24
TIME t, gs
Fig. 4.23 Space-time diagram of waves and fractures, # 1051
33

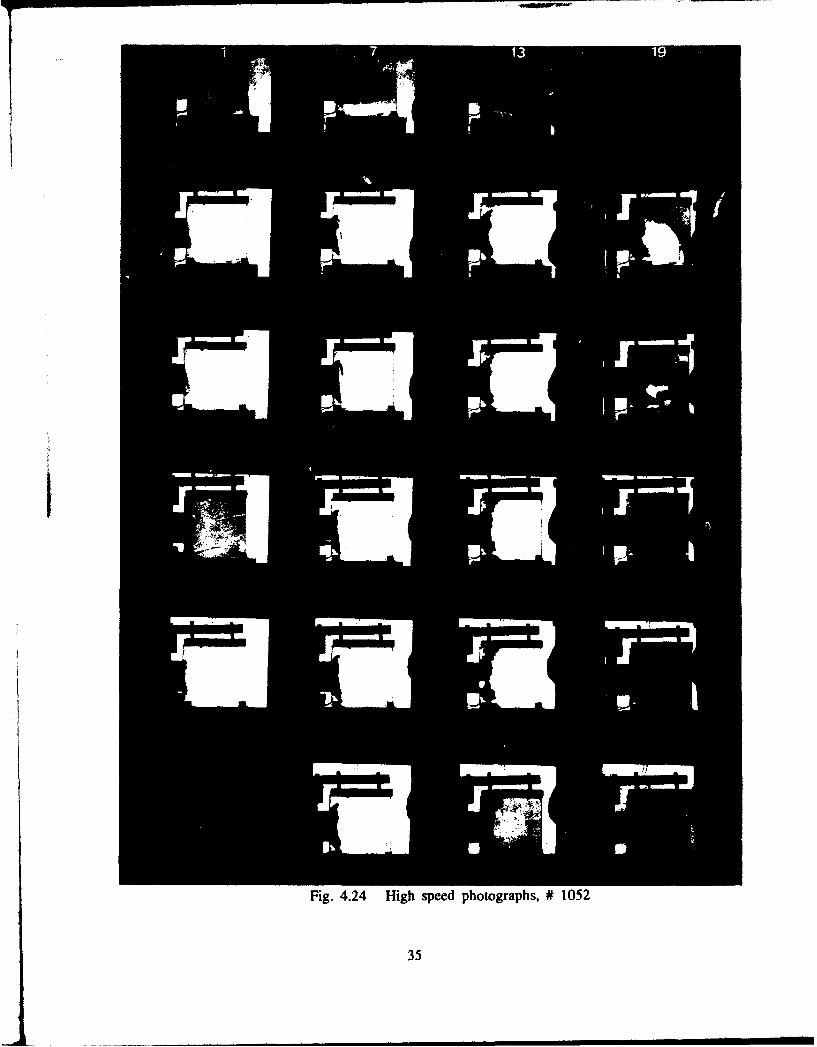
# 17 Results of 114 m/s experiment on sapphire, # 1052
The calculated initial wave pressure is aA= 2.6 GPa. Accordingly, waves are photo-
graphed preceding the fracture events. The impactor was a steel slab 10 mm thick and 49mm in diameter. Figure 4.24 shows 24 high speed photographs of this experiment. The
trigger was that described in chapter 2, Fig.2.2. The tilted wave front in the firstpictures reveales a poor alignment. From the first pictures it was calculated that tilemisalignment was 0.16 mm corresponding 3.2 mrad. This caused an impact delay of 1.4 psbetween the upper and lower projectile corner.
A 45' crack seems to begin instantaneously with edge contact at the lower edge,pictures #2, #3, Fig.4.24. This seems to be one tilted crack oniy which is concluded
from the appearance of the crack front. The projection varies from about 3 to 5 mm which
corresponds to angles between about 170 and 270. Most surprising is a vestige in
pictures #3 to #14 with the shape of the later crack. A continuous transition from ashadow to the dark crack suggests something similar as was observed in # 1035, the crack
is generated very early but not visible due to an insufficient crack opening (Fig.4.4).
These edge cracks show a slight curvature and do, therefore, not seem to be crystallo-, graphic cracks.
Within these edge cracks in the central part a crack system seems to develop with a
crack propagation direction in x-direction, different parts, however, with different
velocities.
A kind of spalling which is also seen in most of the experiments is particularly
well formed here in #18 to #21.
It can be recalculated from wave progress that the instant of impact took place
0.65 ýis after trigger which coincides with the first picture. Waves which can be
observed on pictures are plotted in diagram Fig.4.25. This is the primary longitudinal
wave at two places, the lower edge and at the centre line (for different positions waves
separate in the diagram due to the misalignment) and one or two following Rayleighwaves. The pressure wave velocity is determined to c L = 11.7 mm/ts and the Rayleigh wavevelocity to cR = 6.0 mm/ts.
34
T r
eo ýfo pV
Fig 424 Hig see phtorahs,# 05
35l

PICTURE NO.1 2 3 4 5 6 7 8 9 10 11 12 13 14 15 16 17 18 19
6 0 I I i I S I i I I i 1 I i I
# 1052 SAPPHIRE cL 11.7 0Omm/gs50 -V 0 =__114 m/s CR =5.98 mm/gs
E misalignment: 3.2 mrad ~1 .4g.s)E 40
WI 30 PRIMARY WAVE FRONT0
c, 2 LOWR CONERRAYLEIGH WAVESn 20
LO /
10
0 1 2 3 4 5 6 7 8 9 10TIME t, lis
Fig. 4.25 Space-time diagram of waves, # 1052
PICTURE NO.1 3 5 7 9 11 13 15 17 1920
90 #1052 SAPPHIRE /80 -V 0 11 r/s /PL
E 70
,:60 / /
( 50 /< 40 /GHOST //VISIBLE CORNER CRACK
/ X-CRACK FIELD3.15 mrn/is
1-AI II
0 2 4 6 8 10 12 14TIME t, jis
Fig. 4.26 Space-time diagram of fractures, # 1052
36

%tU
(a) pitr 9 .5p
(b)pitue 20 1.1 p
Fig.4.2 Spalaton a th rea ede, #105
37 .
F
Besides the appearance of spallation 17 mm from the back edge (see Fig.4.27). the
450 lower edge crack (and with some delay, caused by the misalignment, also the upper
edge crack) is most interesting in this experiment because of a precursing ghost, see
diagram, Fig.4.26. From crack appearance it is assumed that these two cracks are
generated with or with little less than longitudinal wave velocity. The black part of
the lower edge crack seems to propagate with about 5 mmits which is close to Rayleigh
wave velocity. Cracks of the central main system (x cracks, i.e., cracks in x direction)
propagate with velocities around 3 mm/gs or less.
Spalling occurs when the reflected leading edge of the primary pulse - which is a
tensile stress - interacts with the arriving trailing edge of the same pulse. This
trailing edge has passed the steel impactor slab and did, therefore, split up into an
elastic and a slower plastic wave and was also fanned out at the rear impactor edge.
This effekt can, for instance, be seen in Figure 4.9 with the rear pulse edge being much
thicker than the two pulse fronts. This is the reason for the observed time-extended
development of the spalling effect, although the reflected wave front is assumed to be a
sharp one.
38
5. WAVE PHENOMENA
5.1 Camera Limits
A main tool used with the presented work is the high speed Cranz-Schardin camera
which, of t,urse, has limited properties, e.g., a limited speed, which concerns framing
rate, time delay, and exposure time. In applications, however, it is of importance to
assess these limits. The time delay (which is connected to the time jitter) is indepen-
dently determined by recording the light pulses by an oscilloscope. The framing rate is
automatically limited mainly by the exposure time. This exposure time could be deter-
mined by photographing waves in the target materials.
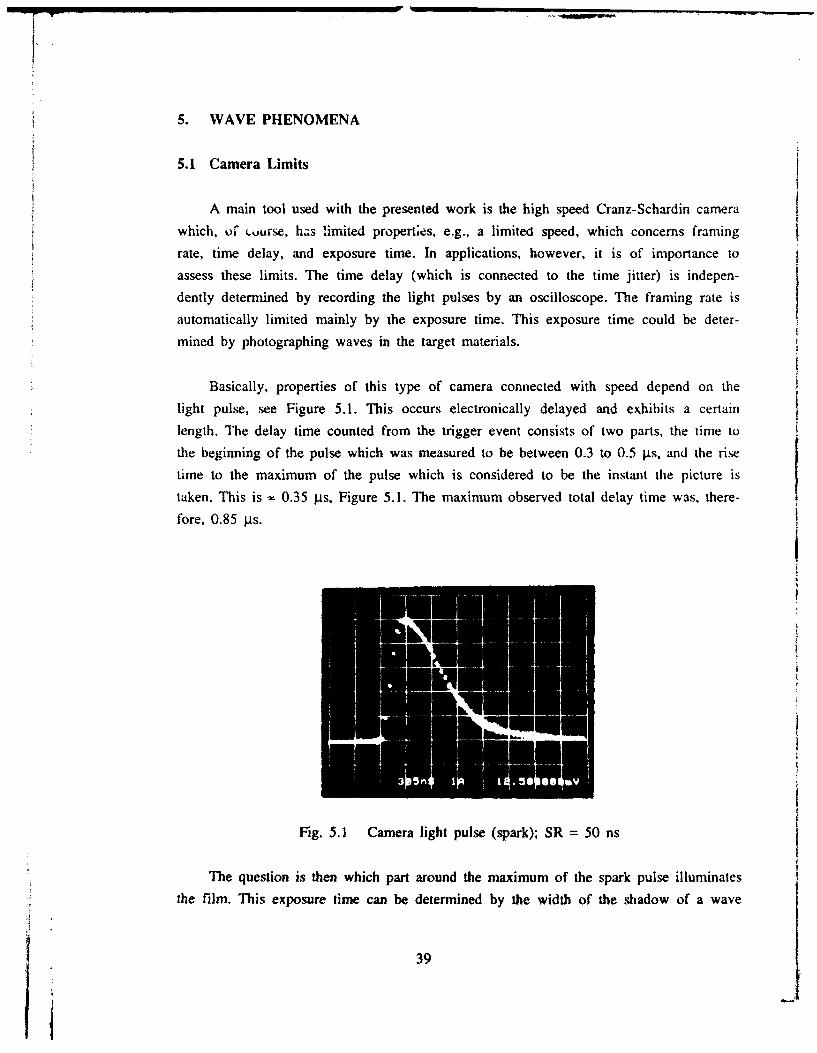
Basically, properties of this type of camera connected with speed depend on thelight pulse, see Figure 5.1. This occurs electronically delayed and exhibits a certain
length. The delay time counted from the trigger event consists of two parts, the time to
the beginning of the pulse which was measured to be between 0.3 to 0.5 pts, and the rise
time to the maximum of the pulse which is considered to be the instant the picture is
taken. This is 0.35 ps, Figure 5.1. The maximum observed total delay time was, there-
fore, 0.85 gis.
II
Fig. 5.1 Camera light pulse (spark); SR = 50 ns
The question is then which part around the maximum of the spark pulse illuminates
the film. This exposure time can be determined by the width of the shadow of a wave
39
tA

front in a picture. Due to the lack of plastic effects in ceramics and glass the wave
profile can be considered to be steep and narrow. If the spark were a very short light
pulse the photo would show this as a sharp line. Real photos, however, show a shadow
with a finite width x which suggests an exposure time of t = x/c, with c being theC
velocity of the wave. This is with sapphire c = 11.5 mm/ts and with glass c =
5.86 mm/ps.
In sapphire experiments a width x 5 mm is observed. This leads to t = 0.43 pIs.
The width x in glass experiments is between 2 and 3 mm. Using x = 2.5 mm an exposure
time of t = 0.43 gts is calculated for glass. It is concluded, therefore, that
the exposure time is
t 0.5 jIts
This reveals an error source of about a quarter of a microsecond in determiningthe position of a moving effect, e.g., a wave. For a longitudinal wave in ceramics this
is about a delay of 3 millimeters and for glass 1.5 millimeters, if the center of the
stripe is taken for its position. The sign of this error is known from the direction of
the movement; the read position is that of a retarded move. If the first appearance of a
stripe is used for reading, the error will be smaller but remains usually unknown since
the width of the stripe may depend on the amount of the effect.
5.2 Wave Velocities and Elastic Constants
The longitudinal sound wave velocity in sapphire was measured in two different
ways, by an ultrasonic method through the tile thickness and from high speed photo-
graphs, which is parallel and perpendicular to the C-axis. The anisotropy of sapphire
does not seem to be very distinct since both results fit well together.
40

METHOD c PROPAGATIONOR L DIRECTION
SHOT # m/s TO C-AXIS
UI t rasonic 11 360 perpendicular
# 1040 11 610 parallel
# 1050 11 480 parallel
# 1052 11 700 parallel
Table 5.1 Longitudinal wave velocities in sapphire
The average value of all results is
= (11 538 t 149) m/s or = It 538 m/s ± 1.3 %
Due to the finite length, L, of the projectile (the slab thickness) the pressure
wave is of limited duration. In those cases when a bar or slab with 10 mm thickness was
used the pulse duration, T, is twice the travel time for a wave through the projectile,
T = 2L/c 1tt = 3.5 pts. This time corresponds to a pulse length of about 40 mm in
sapphire. The leading edge of the original pulse is considered to be relatively steep
because of minimum plasticity effects. The trailing edge, however, is formed in the
steel projectile thus fanned out by plastic effects and reflection.
In some experiments also the Rayleigh wave velocity, c, could be determined from
the photographs.
SHOT# c PROPAGATIONDIRECTION
m/s TO C-AXIS
# 1040 5 780 parallel
# 1050 5 720 paral lel# 1052 (5 980) paral l e l
Table 5.2 Rayleigh wave velocities in sapphire
41
, I I I II I
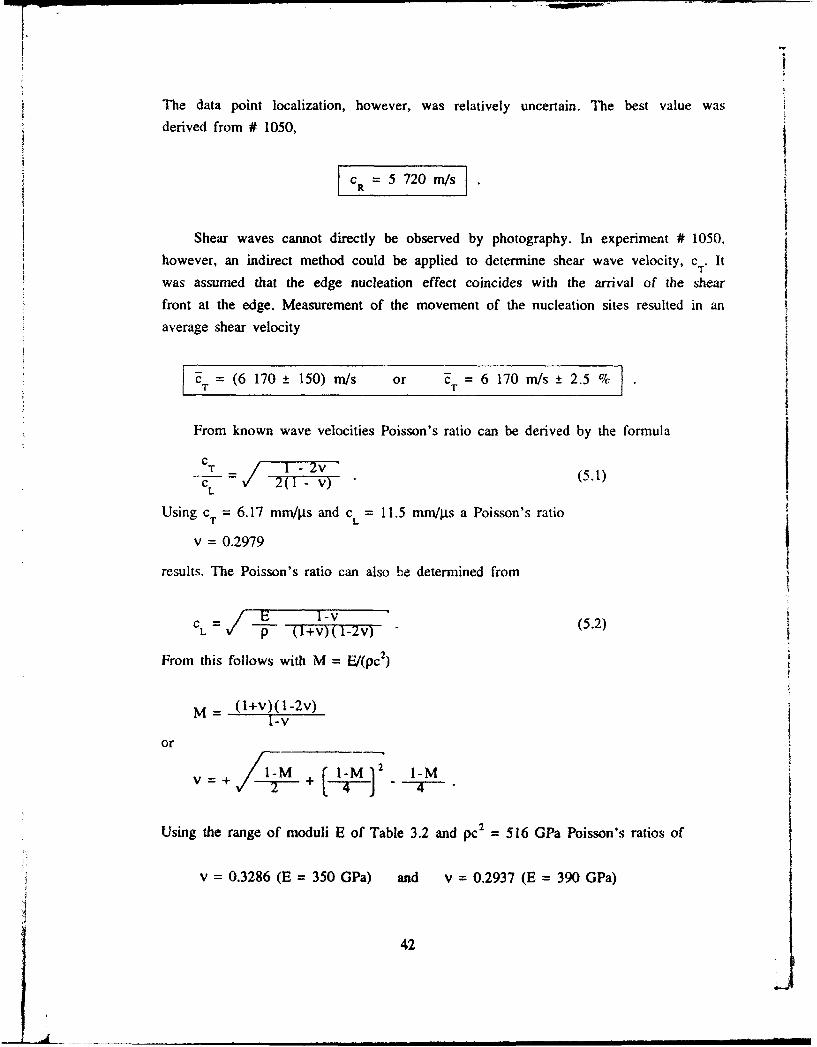
The data point localization, however, was relatively uncertain. The best value wasderived from # 1050,
S= 5 720 m/scR
Shear waves cannot directly be observed by photography. In experiment # 1050,
however, an indirect method could be applied to determine shear wave velocity, cT. Itwas assumed that the edge nucleation effect coincides with the arrival of the shearfront at the edge. Measurement of the movement of the nucleation sites resulted in an
average shear velocity
•T =(6 170 ± 150) m/s or c= 6 170 m/s 2.5 %
From known wave velocities Poisson's ratio can be derived by the formula
c_ T v (5.1)CL 2l V
Using cT = 6.17 mm/rgs and cL = 11.5 mm/rgs a Poisson's ratio
v = 0.2979
results. The Poisson's ratio can also be determined from
CL=/ E 1-v.L= (l+v) (-2v) (5.2)
From this follows with M = F/(pc2)
M- (l+v)(1-2v)1-V
or
I M I 2 I-MV=+ + -11.
Using the range of moduli E of Table 3.2 and pc 2 = 516 GPa Poisson's ratios of
v = 0.3286 (E = 350 GPa) and v = 0.2937 (E = 390 GPa)
42
are calculated. The value, v 0.29, supported also by Experiment # 1050 seems reason-
able. As a result of this work
E = 390 GPa and v = 0.29
can be confirmed.
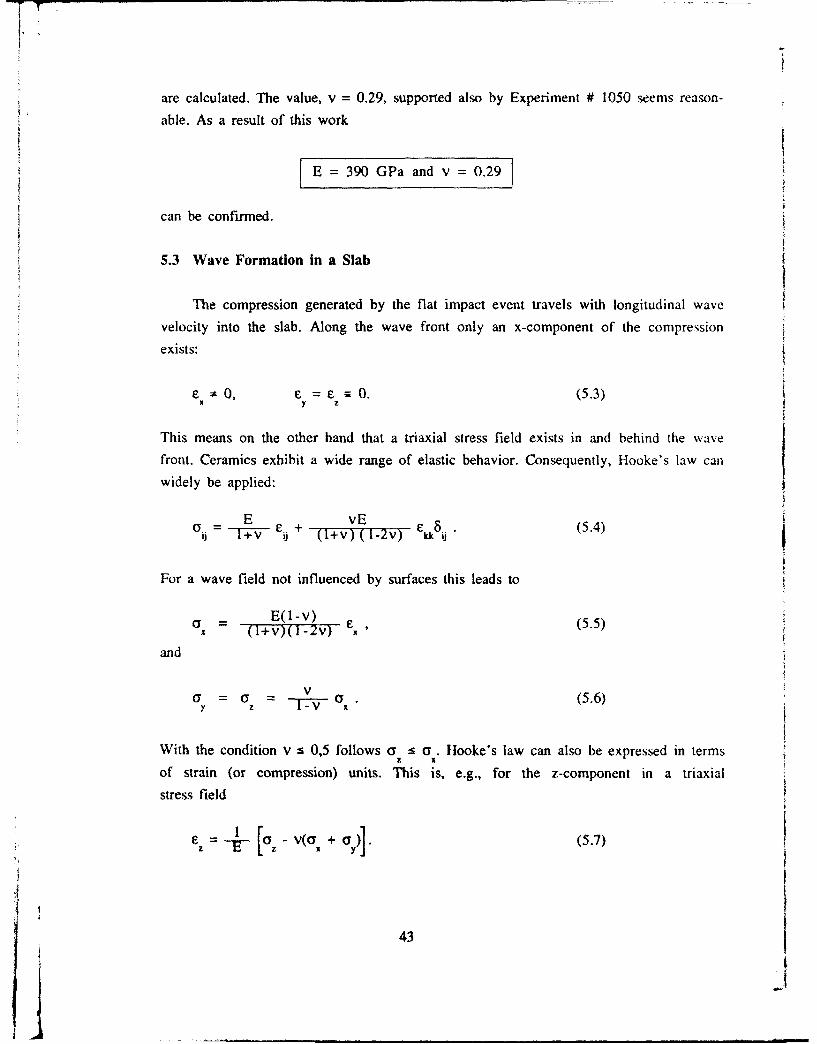
5.3 Wave Formation in a Slab
The compression generated by the flat impact event travels with longitudinal wave
velocity into the slab. Along the wave front only an x-component of the compression
exists:
*0, 6=E--0. (5.3)x y z
This means on the other hand that a triaxial stress field exists in and behind the wave
front. Ceramics exhibit a wide range of elastic behavior. Consequently, Hooke's law can
widely be applied:
E _vE_5oij= • •..+ .y(.4
ij +v j +(l+v) (l1-2-v) Ekk ij
For a wave field not influenced by surfaces this leads to
a = E(1-v)a (l+v)(1-2v) C, (5.5)
and
a =G = a" (5.6)
With the condition v s 0,5 follows a : a . Hooke's law can also be expressed in termsz I
of strain (or compression) units. This is, e.g., for the z-component in a triaxial
stress field
i + -a.- (5.7)z -4z3
43 _

which is identically zero under the conditions cited above. However, equation (5.7)
becomes important for an assessment of the strain situation behind the the wave front. A
tensile stress is formed thereafter which leads to the effects described in section 5.4.
5.4 Wave Splitting
In some experiments it has been observed that the primary wave front is succeeded
by one or more others in a certain distance, travelling with the same speed. A similar
effect has been known earlier. Beinert [5] quantitatively investigated that phenomenon
with short-pulse loaded glass plates by a schlierenoptical method in l175. That effect
is a geometrical one. The spacing between two succeeding waves depends on plate thick-
ness. Additionally, Beinert observed and measured quantitatively an energy flow from the
primary wave front to the following.
For the plane longitudinal compression wave travelling in x direction in order to
meet the condition a = 0 at the free surfaces, a shear wave is generated at each of thez
target surfaces with a particle acceleration component normal to the surface based on
eq.(5.7). This distortion moves with transversal wave velocity into the target. From the
geometry conditions sketched in Figure 5.2 it follows
X2 + d2 = L2 and sin a d - cT
L
which leads to
X= d /(c/c,) 2 - 1 (5.8)LT
In particular the shear wave velocity, cT, can be calculated by the pre-determined quan-
tities speed, cL, and distance, X, of the wave fronts. d is the thickness of the slab.
44

XL=CL'tXL=CTit
front
Fig. 5.2 Shear wave formation and wave splitting in a slab (top view)
An attempt is made in Figure 5.3 to geometrically understand what kind 'of dis-
placement a particle in the slab is subjected to. Due to the condition az = 0 at the
surface the free particle (A, A') not solely moves in the x-direction but it starts also
to move perpendicular to the surface (z-direction) resulting into an oblique movement
and thus causing the shear wave. The responsible boundary condition at the surface is az
0, so that follows from (5.7)
V 1z -T- V- --u- ax
with o being little smaller than the original one of the triangle AA'B
given by eq.(5.5). The strain perpendicular to the wave propagation direction
in the midplane B D is twice that of the regions out of center and can,
therefore, lead to a fracture which moves as fast as the longitudinal wave
front thus cleaving the slab in two halves. This kind of fracture has been
observed in high velocity impact experiments with TiB and SiC as target
materials.
45
Z
C LX
Fi.53 Pril ah i iesbetdt wav (tpviw
4 D-- -FRAC5TURr -
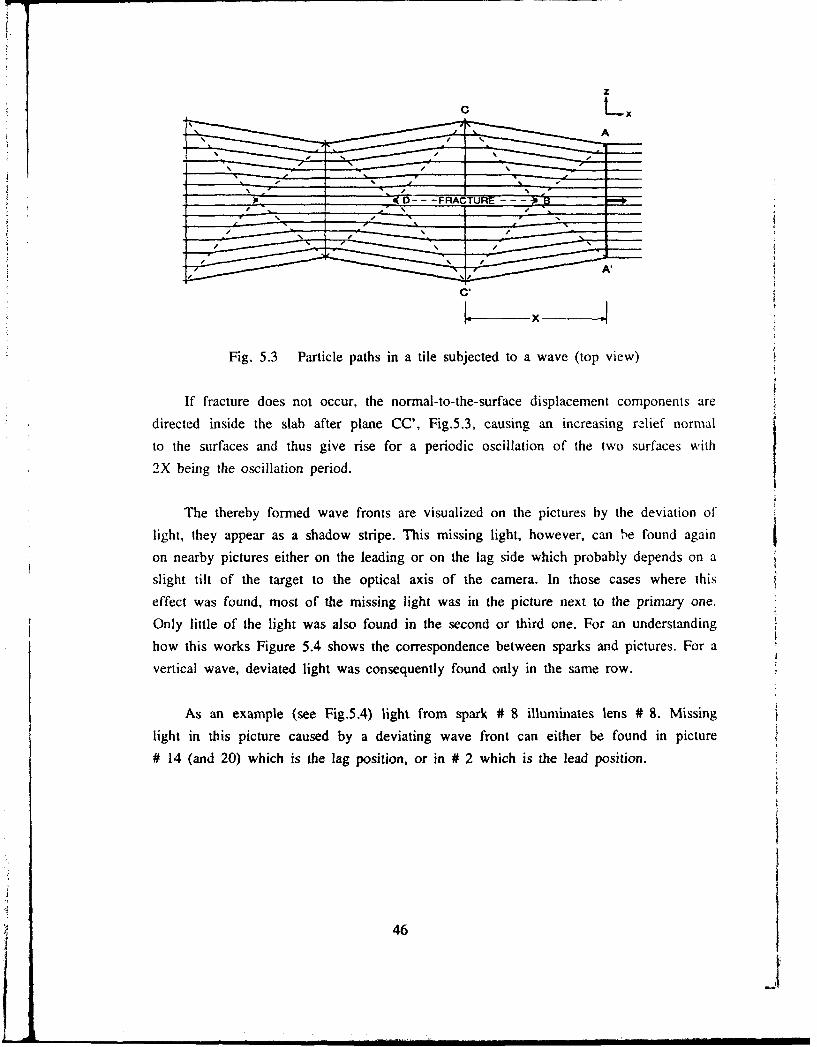
C.
Fig. 5.3 Particle paths in a tile subjected to a wave (top view)
If fracture does not occur, the normal-to-the-surface displacement components are
directed inside the slab after plane CC', Fig.5.3, causing an increasing relief normal
to the surfaces and thus give rise for a periodic oscillation of the two surfaces with
2X being the oscillation period.
The thereby formed wave fronts are visualized on the pictures by the deviation of
light, they appear as a shadow stripe. This missing light, however, can le found again
on nearby pictures either on the leading or on the lag side which probably depends on a
slight tilt of the target to the optical axis of the camera. In those cases where this
effect was found, most of the missing light was in the picture next to the primary one.
Only little of the light was also found in the second or third one. For an understanding
how this works Figure 5.4 shows the correspondence between sparks and pictures. For a
vertical wave, deviated light was consequently found only in the same row.
As an example (see Fig.5.4) light from spark # 8 illuminates lens # 8. Missing
light in this picture caused by a deviating wave front can either be found in picture
# 14 (and 20) which is the lag position, or in # 2 which is the lead position.
46
,, • . .. ... , • I

SImpactDeflected light
iII
1 a
?/ 11 I S I t 17 23
'FO $ 4 10 16 22
0' 3 9 15 21
2 8 14 201 7 13 19
Fig.5.4 Correspondence of sparks and pictures
5.5 Energy Distribution
With the experimental arrangement chosen in the reported experiments the target is
usually large compared to the impact site size. Neither the stress distribution, (I(x, y,
z), in the target nor the distribution of the energy density w(x,y,z) are, therefore,
uniform ones. The wave front is a more or less cylindrical one, less with a large impact
area. An attempt is made, therefore, to at least estimate the actual energy distribution
within the target in order to better understand some of the wave and fracture events.
Beginning with the initial stress calculated from the intersection point of the
Rayleigh lines of projectile (P) and Target (T) [1],
47

z z zp T P
S T v u V (5.9ab)A Z + Z V0 ~Z +Z 0
P T P T
the initial energy density in the generated wave is
2 2 2 2
GAz T.z P vA T P 0 (5.10)wo =o=--- 2 (.0
(ZT + Z) E
The distribution of the energy density in the wave field is given by
w(r) dW
rThe volume, V(r), occupied by the wave increases with wave veloity, cL t with rbeing the absolute value of the propagation vector of the wave. In those experiments
with the impact area, A0, being large and constant in time, the energy flux into the
target (the power) is, up to that instant when reflected waves arrive at the interface,
also a constant:
dW.N - - const.
The initial energy W, is given by w0V , with Vi = A0*r being an initial volune.
V,=A ,c.t,
so that follows
N = wo. A0.c
and
w(r) = d 0 (5.11)
48
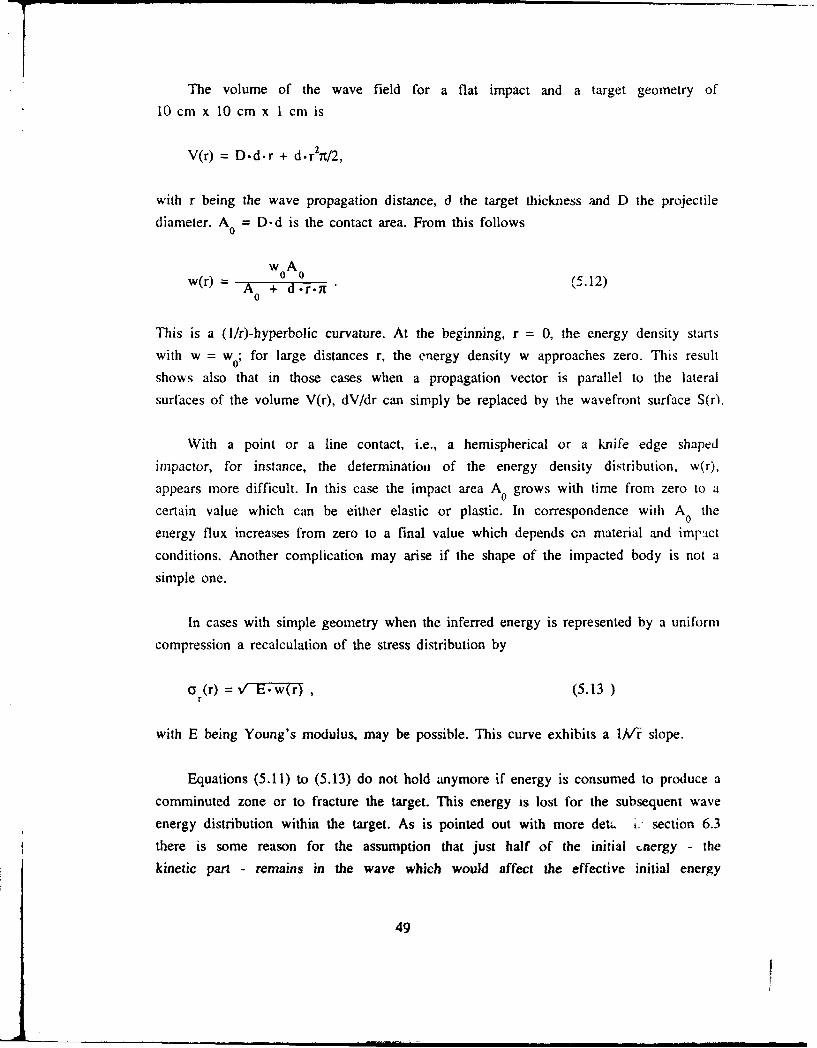
The volume of the wave field for a flat impact and a target geometry of
10 cm x 10 cm x 1 cm is
V(r) = D.d-r + d.r 2 t/2,
with r being the wave propagation distance, d the target thickness and D the projectile
diameter. A = D-d is the contact area. From this follows0
w0A0w(r) 0A ( 5.12)
0
This is a (l/r)-hyperbolic curvature. At the beginning, r = 0, the energy density starts
with w = w0; for large distances r, the energy density w approaches zero. This result
shows also that in those cases when a propagation vector is parallel to the lateral
surfaces of the volume V(r), dV/dr can simply be replaced by the wavefront surface S(r).
With a point or a line contact, i.e., a hemispherical or a knife edge shaped
impactor, for instance, the determination of the energy density distribution, w(r),
appears more difficult. In this case the impact area A0 grows with time from zero to a
certain value which can be either elastic or plastic. In correspondence with A0 the
energy flux increases from zero to a final value which depends on material and impact
conditions. Another complication may arise if the shape of the impacted body is not a
simple one.
In cases with simple geometry when the inferred energy is represented by a uniform
compression a recalculation of the stress distribution by
a (r) = / E.w(r) , (5.13)
with E being Young's modulus, may be possible. This curve exhibits a Iv'i slope.
Equations (5.11) to (5.13) do not hold anymore if energy is consumed to produce acomminuted zone or to fracture the target. This energy is lost for the subsequent wave
energy distribution within the target. As is pointed out with more detu. i section 6.3
there is some reason for the assumption that just half of the initial ,.nergy - the
kinetic part - remains in the wave which would affect the effective initial energy
49

density w0 and reduce tne two sets of curve: nd o(r) by a factor of 1/2 or VTh2,
respectively.
An application of this formalism has been made with shots # 1040, # 1050, and
# 1052 without considering the effect of energy reduction by damage effects. The energy
distribution is given by eq.(5.12) using d = 10 mm, A0 = 49 mm x 10 mm, and w0 from
eq.(5.10). These curves are shown in Figure 5.5 and calculated up to r = 40 mm, the
approximate pulse length. With these calculations it was not considered that, possibly,
energy was lost by the Mescall zone production. In Figure 5.6 G0(r) curves of these
three experiments are also shown calculated with eq.(5.13). Both Figures are an attempt
to demonstrate qualitatively how energy and stress develop when the pulse penetrates the
target.
120-
100-i \\
80-
, # 104060'311 M/s
60-
40- S/ " -- ~# 1050 "-- -. _..-.-.J " - - 193 m/s2- # 1052 _2114 r/s
0 10 20 30 40
r, mm
Fig. 5.5 Distribution of energy density in the wave
50

7-6 .
# 10405 . 311 m/s
Z 4 "- '- --- ..S., # 1050 •
" "-- 193 mis
2-
# 10521 - 114 m/s
0 .T
0 10 20 30 40
r, mm
Fig. 5.6 Distribution of radial stress in the wave
5.6 Temperature of the wave field
From a known initial energy density, w0, of a wave field the adiabatic temperature
rise, AT0, at the impact site can roughly be determined by
2 2AT =w 0 /PC or AT = -Y --- (5.14)
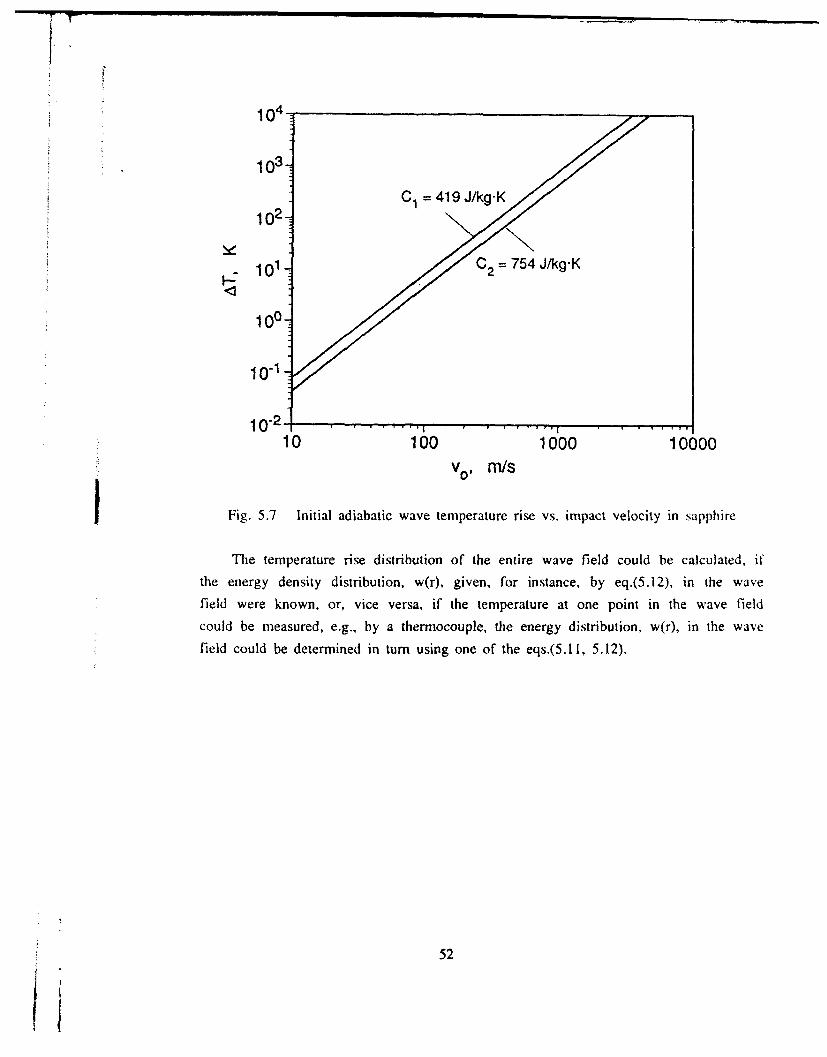
with C being the heat capacity of the material. For sapphire two values of C are given
in Table 3.2 : CI = 419 J/(kg.K) and C2 = 754 J/(kg-K). The temperature rise is,
therefore, either ATI or AT2, whatever a heat capacity has been used for computation.
Calculated data for this initial temperature rise are given in Figure 5.1 as a function
of the impact velocity, v0. Initial wave temperature at v0 = 100 n/s is either 8°C or
4°C over room temperatur depending on which C has been used. With an impact velocity of
v0 = 311 n/s (# 1040) the corresponding temperature rises are about 70 K or 35 K.
respectively.
51
p
104
i 103-
102C C=419J/kg-K102-
101 C 754 J/kg-K
10°-
10-1-
10 -2 -!. .. 1 "€' " "" '
10 100 1000 10000v, rn/s
Fig. 5.7 Initial adiabatic wave temperature rise vs. impact velocity in sapphire
The temperature rise distribution of the entire wave field could be calculated, it'the energy density distribution, w(r), given, for instance, by eq.(5.12), in the wave
field were known, or, vice versa, if the temperature at one point in the wave fieldcould be measured, e.g., by a thermocouple, the energy distribution, w(r), in the wave
field could be determined in turn using one of the eqs.(5.1 1, 5.12).
52

I.
6. FRACTURE PHENOMENA
6.1 General
Fracture mechanics states that under uniaxial loading conditions the crack speed
can vary only up to a certain limit. This terminal crack velocity was theoretically
determined by, e.g., Yoffi [6], Broberg [7], Freund [8] to be Rayleigh wave velocity:
v = CR. Experiments showed that usually the terminai crack velocity is even less.cimax R
For float glass with a longitudinal wave velocity of cL = 5860 m/s the terminal crack
velocity is 1460 m/s which is about half the Rayleigh wave velocity.
This "law" seemed to be violated with recent experiments on alumina tiles [2, 3].
Depending on impact conditions crack velocities up to about 90 % of the longitudinal
wave velocity have been reported. Crack paths with such large propagation speeds appear
fuzzy. It is not finally clear whether the observed phenomena are propagating cracks or
just a chain of coalescing independent nucleations and what is the influence of the
particular geometry of the target.
These very high crack velocities, on the other hand, did not occur with glass as a
test material in impact experiments. In no case a crack was observed exceeding the
terminal velocity of 1460 m/s. But with glass also never a crack propagation speed less
than terminal velocity was observed [I].
For alumina it was concluded that the geometry will certainly have an influence but
the material will primarily cause this strange behavior. It was, therefore, highly
interesting what would be found with sapphire which is a material of the same chemical
composition, Al 20 3, when impacted under the same geometrical conditions.
6.2 Summary of Fracture Phenomena
Quasistatic tests have been performed by Cook and Pharr [9]. They used an inverted
microscope to photograph crack patterns in sapphire and several other transparent
ceramics and glasses produced by a Vickers diamond indenter. Viewing in the direction
opposite to the indentation direction (the 0001 direction), these workers found that
ring and cone cracking did not occur, but rather that radial cracks and twins initiated
alhrost immediately upon load application and that their trajectories were extremely
53

l
dependent on crystallographic orientation. Many of the radial cracks grew out of planes
perpendicular to the indented surface. The primary radials nucleated sequently during
loading and were often followed by smaller secondary radials. On unloading the radials
cracks continued to grow and lateral cracks formed. Similar observations were made byEvans and Wilshaw [10] and Lenkford and Davidson [11]. Cone cracks, observed in many
glasses, were not seen by Cook and Pharr in any of the seven monocrystalline ceramics
which they investigated, although they are nearly always produced in polycrystalline
ceramics under high-rate loading (Shockey et al, [12] for example).
In the low blow tests (# 1035, sapphire, # 1038, glass) crack systems have been
photographed which seem to consist of two types. Radial cracks propagate into the energy
expanding direction about perpendicular to the two large surfaces. Shell cracks develop
more or less parallel to the surface, normal to the radial cracks. These are curved to
the surface like shells and, therefore, slow down and come to a halt when they reach the
surface, see Fig.4.5, for instance.
In slab or bar impacts fractures are immediately generated at the projectile
comers, therefore called corner cracks. These do not seem to be Hertzian cone cracks.
Projectile comers are, obviously, most critical for an immediate destruction initiation
of the target. Shearing processes seem to be responsible. Even after a high velocity
impact these comer cracks occur first and propagate at an angle of approximately 450 tothe x-direction (the impact direction). What is reproduced on the photos does not seem
to be all of the cracks, Advancing vestiges suggest that the real crack speed is much
higher than the one measured on the photos. The visible black part of these comer
cracks propagates usually at around 5 mm/gts, the real speed is estimated to be 7 to8 mm/ps. The reason for these vestiges seems to be a tunnel effect of the light due to a
not sufficiently opened crack as described in section 4.2, shot # 1035.
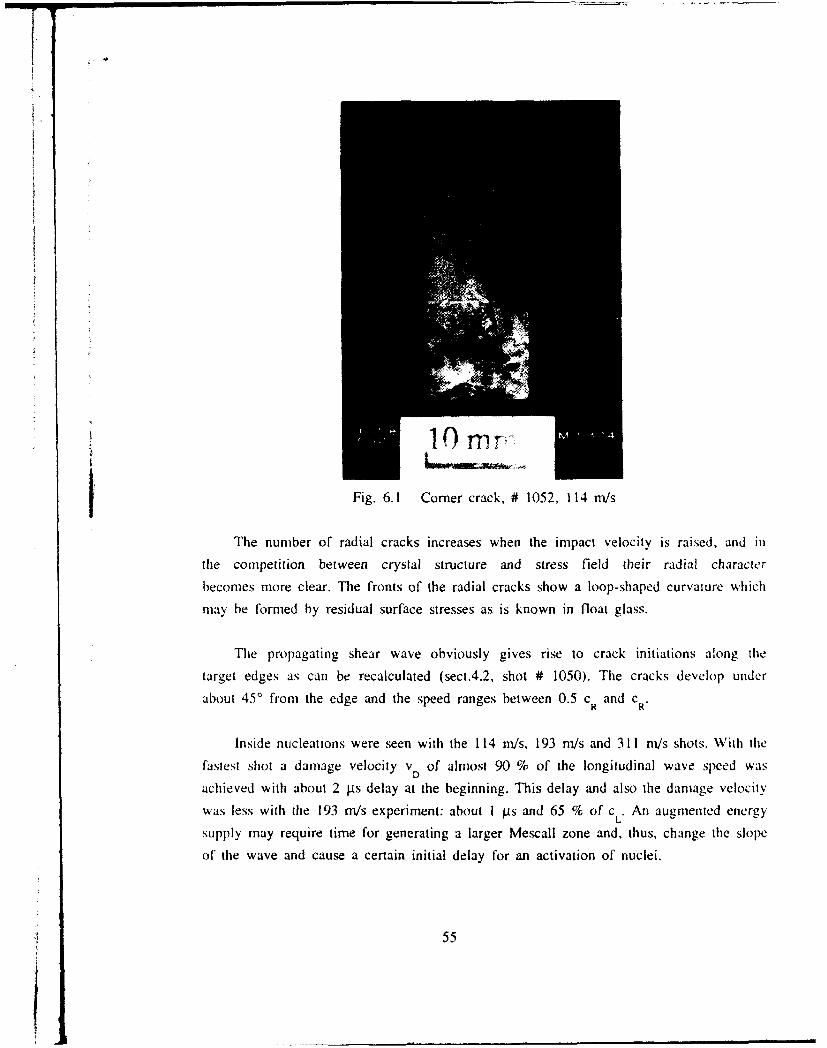
A comer of the target, shot # 1052, 114 m/s, has been recovered and the structure
of the fracture surface is shown in Figure 6.1. The crack propoagation direction is
upward i this picture. Fracture occurs in several crystal planes with rough steps in
between.
54
I
I0mrn
Fig. 6.1 Comer crack, # 1052, 114 rn/s
The number of radial cracks increases when the impact velocity is raised, and in
the competition between crystal structure and stress field their radial character
becomes more clear. The fronts of the radial cracks show a loop-shaped curvature which
may be formed by residual surface stresses as is known in float glass.
The propagating shear wave obviously gives rise to crack initiations along the
target edges as can be recalculated (sect.4.2, shot # 1050). The cracks develop under
about 45' from the edge and the speed ranges between 0.5 cR and ca-
Inside nucleations were seen with the 114 nvs, 193 nvs and 311 m/s shots. With the
fastest shot a damage velocity v D of almost 90 % of the longitudinal wave speed was
achieved with about 2 jis delay at the beginning. This delay and also the damage velocity
was less with the 193 m/s experiment: about I gs and 65 % of c.. An augmented energy
supply may require time for generating a larger Mescall zone and, thus, change the slope
of the wave and cause a certain initial delay for an activation of nuclei.
55
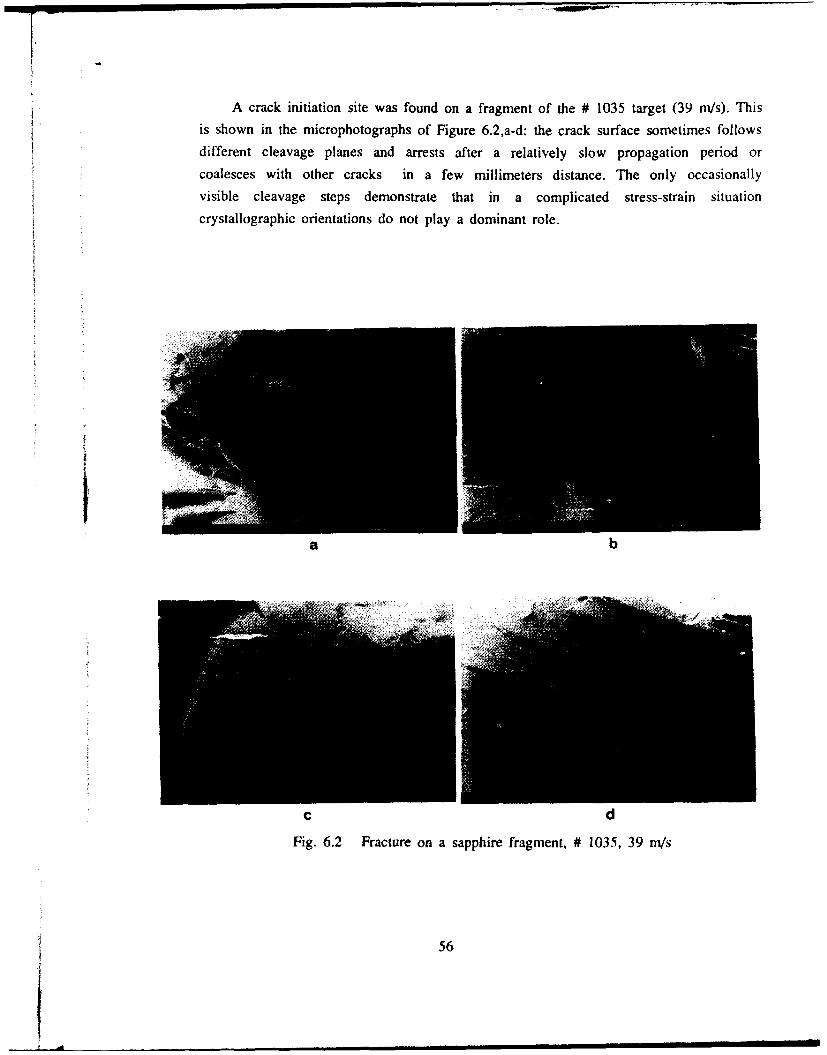
-I.A crack initiation site was found on a fragment of the # 1035 target (39 mis). This
is shown in the microphotographs of Figure 6.2,a-d: the crack surface sometimes follows
different cleavage planes and arrests after a relatively slow propagation period or
coalesces with other cracks in a few millimeters distance. The only occasionally
visible cleavage steps demonstrate that in a complicated stress-strain situation
crystallographic orientations do not play a dominant role.
a b
c dFig. 6.2 Fracture on a sapphire fragment, # 1035, 39 ni/s
56
Spall-like fracture appears in three of the sapphire experiments, but best in
# 1052 at 114 m/s, see Fig.4.27. This straight line of shadow spots occurs 9 AIs after
impact at 17 mm (half the pulse length) apart from the rear target edge. This is exactly
time and place for the leading edge of the reflected pulse coinciding with the trailing
edge of the incoming pulse, there summing up to a tensile stress. From Figure 5.6 it may
be estimated that the effective stress at this place could be around 1 GPa with shot #
1052 and, obviously, this level exceeds the threshold for fracture initiation.
6.3 Mescall Zone Development
The high speed pictures show bubble-like air blast waves expanding backwards after
impact into the air from the projectile comers, see Figs.4.9 or 4.27, for instance.
Their velocity depends on the direction: sonic or less backwards along the projectile
edges and supersonic (I to 1.5 minis) along the target edge within the first 5 jAs or
longer depending on the impact velocity. Afterwards this speed slows down. Some dark
spots in the bubbles suggest larger particles being ejected from the comer when the
impact velocity was slow. Radial black lines indicate ejected fine material moving at
about I mm/[ts under an angle of about 30' from the target edge. Ejected material is more
dense and moves faster (1.5 mm/its) when the impact velocity increases. The ejection
angle increases to some 60' with increasing impact velocity. The fine particles overtake
the bubble at times exceeding 5 gs.
A black and cloudy zone in the target in front of the projectile looks at its front
like a fan of a large number of single cracks emanating radially from the impact site.
Their speed is around 3 mm/pis. There is no particular evidence of a comminution zone,
even not with the 311 m/s shot. Casual bright spots in the black zone originate from
deflected light of a different spark in the same row according Fig.5.4.
It was not possible to measure the particle size during or after the experiment.
But an attempt was made to estimate the particle size of the comminuted material on the
basis of energy consumption. In a disintegrated initial volume, V, of n = V/V particlesp
of an assumed spherical shape with radius, r, and Volume V = 4itr3 /3 the total gener-pated surface is
S =n.4trr2 = 3 Vr
57

The energy transferred by the expanding wave and therefore available within this initialvolume is
W = Wo.V,
with w° from eq.(5.10). This energy, W, is consumed to generate the total surfaces, S,
according
W = G.S,
with G = K2/E being the energy release rate. These equations combined lead toC
r=3 w0
For sapphire is known K 1.80 MPaVmi (Field [13], Table 1, p. 32 ). WithIc
E = 390 GPa it follows G = 8.3 J/m2 in sapphire. From eq.(5.10) an initial energyt density w. = 0.12. 10 J/m 3 is calculated for the fastest shot, # 1040 (311 m/s). With
these parameters follows
r = 0.2 g.m.
Figures 6.5 and 6.6 show particles of the Mescall zone of shot # 1040. These are of sub-
micrometer size.
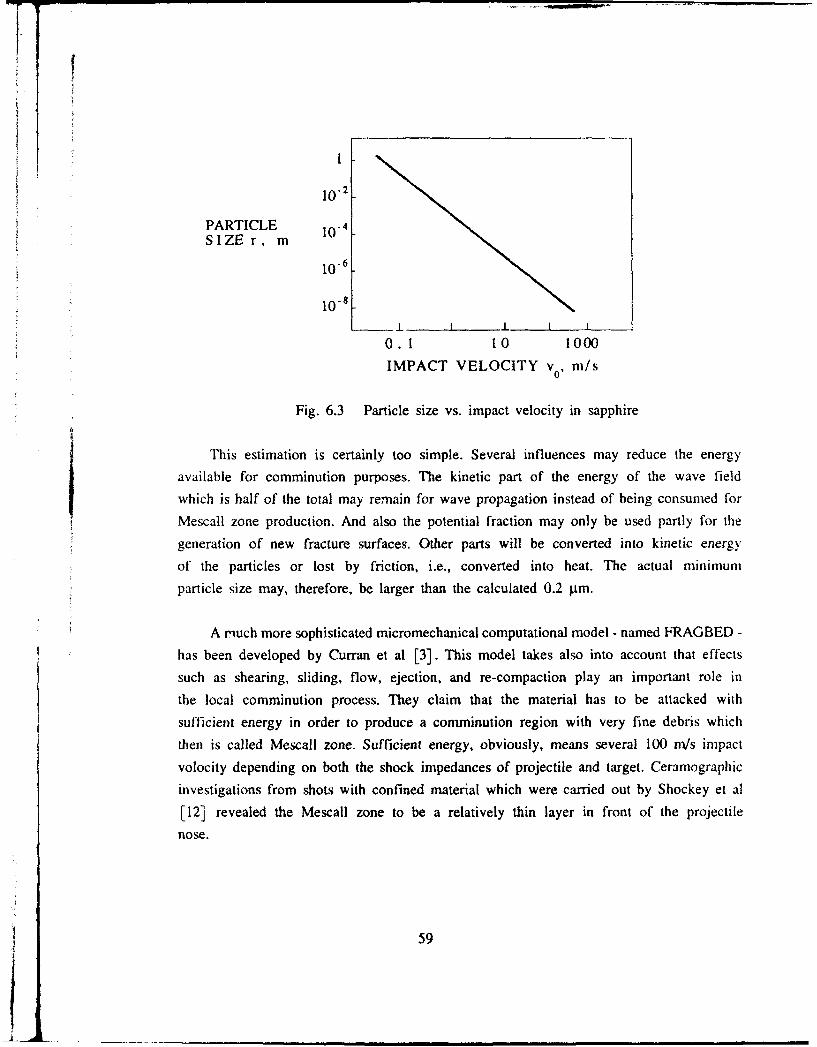
The size of the particles depends on the material and on the impact velocity. Itdoes not depend on the impact area. If w is replaced by eq.(5.10) the particle size canS~0be related to the imnact velocity. This diagram is drawn in Figure 6.3.
58
I 10.2
PARTICLE 4
SIZE r, m
10.6
10sI_1 I J I I
0. 1 10 1000
IMPACT VELOCITY v0, m/s
Fig. 6.3 Particle size vs. impact velocity in sapphire
This estimation is certainly too simple. Several influences may reduce the energy
available for comminution purposes. The kinetic part of the energy of the wave field
which is half of the total may remain for wave propagation instead of being consumed for
Mescall zone production. And also the potential fraction may only be used partly for the
generation of new fracture surfaces. Other parts will be converted into kinetic energy
of the particles or lost by friction, i.e., converted into heat. The actual minimum
particle size may, therefore, be larger than the calculated 0.2 lAim.
A much more sophisticated micromechanical computational model - named FRAGBED -has been developed by Curran et al [3]. This model takes also into account that effects
such as shearing, sliding, flow, ejection, and re-compaction play an important role in
the local comminution process. They claim that the material has to be attacked with
sufficient energy in order to produce a comminution region with very fine debris which
then is called Mescall zone. Sufficient energy, obviously, means several 100 mn/s impact
volocity depending on both the shock impedances of projectile and target. Ceramographic
investigations from shots with confined material which were carried out by Shockey et al
[12] revealed the Mescall zone to be a relatively thin layer in front of the projectile
nose.
59

7 7
For a comparison of the fracture mechanics properties of sapphire with those of
some other ceramic materials Table 6.1 shows fracture toughness data, K1 , given by
Viechnicki et al [14]. Additionally, the range of calculated energy release rates, G, is
shown.
Mat erial YOUNG's Modulus, E Fract.Toughness Energy Ret. Rate
GPa K , MPaVii G, Jim
Sapphire 390 [this report ] 1.80 [13] 8.3
SiC 391 . .. 408 3.01 . . . 5.23 23 ... 68
Al 0 29 1 ... 394 3.5 ... 3.75 ~-35 ... 412 3
B C 457 all [14] 3.7 . . . 4.5 30 ... 444
TiB2 440 . 55 1 6. 69 8 .800 81... 1452
Table 6.1 Fracture toughnesses and energy release rates for ceramics
The recovered projectile steel bar of shot # 1040, 311 m/s, containes small frag-
ments and tiny particles of sapphire from the impact site on its surface. The micro-
photographs of Figures 6.4 to 6.6 show three different regions with fragments. An over-view of almost the entire area is shown in Fig.6.4.a. Larger pieces of the 10 ýIm range
in Figs.6.4.c.. .e seem small particles re-compacted to larger particles, an effect which
may be considered to be a criterion for a Mesall zone. A large sapphire fragment is seen
in Fig.6.5. Small particles in the 0.1 to I gtm range are found on slip planes of the
crystal fragment. Tiny sapphire particles on a steel surface are seen in Fig.6.6. These
pictures confirm roughly the calculations above.
60

a b
Ir
iC
d e
Fig. 6.4 Sapphire particles on steel projectile, # 1040
61
I i m mm mI i

a b
moe$
Fig. 6.5 Sapphire particles on sapphire, # 1040
62
a
b
Fig. 6.6 Sapphire partiles on steel, # 1040, particle size - I gtm
63
I . . . m mm M-1
7. ELECTRIC EMISSION METHOD FOR WAVE AND FRACTURE DETECTION
7.1 General
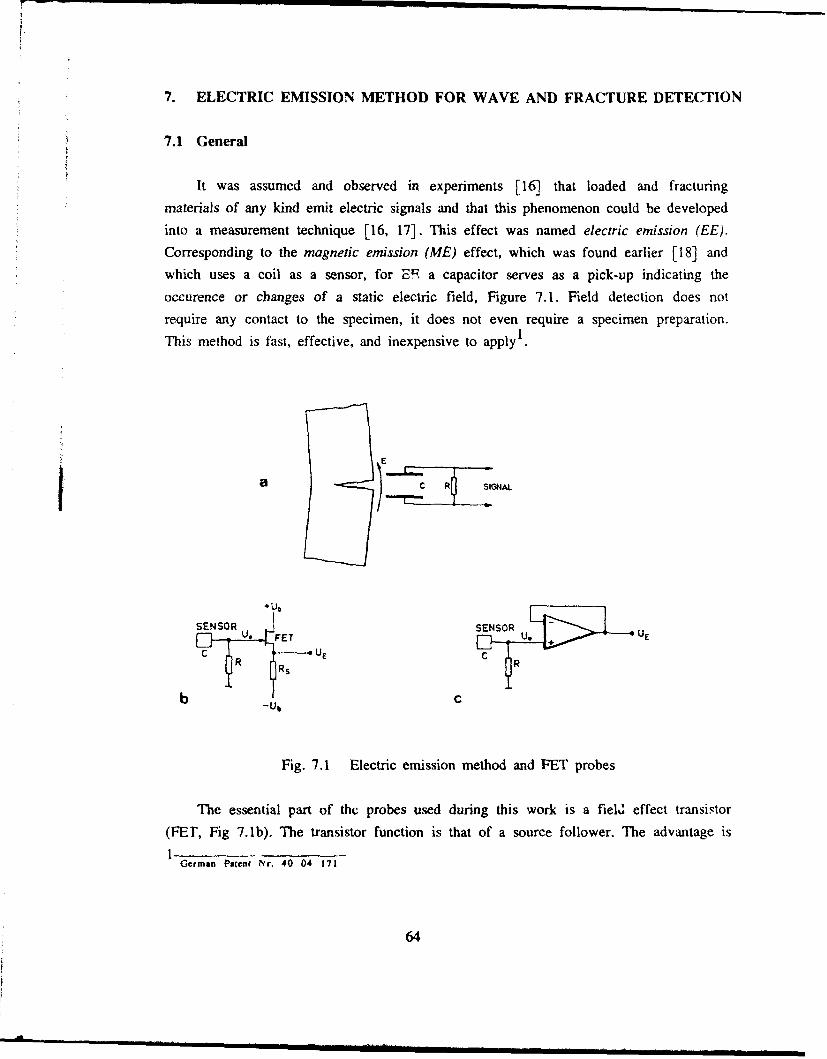
It was assumed and observed in experiments [16] that loaded and fracturing
materials of any kind emit electric signals and that this phenomenon could be developed
into a measurement technique [16, 17]. This effect was named electric emission (EE).
Corresponding to the magnetic emission (ME) effect, which was found earlier [18] and
which uses a coil as a sensor, for EF a capacitor serves as a pick-up indicating the
occurence or changes of a static electric field, Figure 7.1. Field detection does not
require any contact to the specimen, it does not even require a specimen preparation.IThis method is fast, effective, and inexpensive to apply
a ýR SIGNAL
SENSORSENSOR
R Rc
b Ub
Fig. 7.1 Electric emission method and FET probes
The essential part of the probes used during this work is a field effect transistor
(FET, Fig 7.1b). The transistor function is that of a source follower. The advantage is1
German Potent ?r. 40 04 171
64
twofold: this single device furnishes the detection capacitor which is the input capa-
city of the transistor, and it renders the required impedance conversion. This capacityC - extended by a small metal area of some ten square millimeters only - is of the order
of 10 pF (0'1' Farad) which, therefore, is capable to deliver large signals, U = q/C,with q (= charge) being the signal source. A time const,,nt, t = R.C t 10as, is chosen
for the present application. Instead of a single transistor an operational amplifier wi-th a FET input stage can also be used with the advantage of an accurate zero line (Fig.
7. lc).
With the magnetic emission effect the measured change of the external magnetic
field is caused by a change of the magnetic structure of the ferromagnetic material in
consequence of an energy transfer into the material. The origin of electric fields
measured with the EE method is different from material to material, with high polymeric
materials the deformation or rupture of molecule chains may cause large electric fields.with ceramics an elastic deformation (electro striction) of crystals may be the reason
for an electric field which is expected to be a rather small effect.
7.2 Pre-experiments For Wave Detection
A series of pre-experiments has been carried out in order to test the capability of
the EE method for detecting waves - not fracture - in an impacted material. Tiles of an
epoxy resin, Araldite B, of float g'ass, titanium diboride, TiB2, silicon carbide. SiC,
alumina, Al 20 3, and sapphire, Al 203, have been used as test materials.
Reported first is a typical result with Araldite B. This material exhibits low wave
velocities and did, therefore, not cause any time resolution problems. Material para-
meters are
cL = 2 500 mns, c = 1 060 m/s, c = 997 m/s, v = 0.39.LT R
The tile was impacted edge-on by a 4.5 mm diameter lead bullet at 76 m/s. Two EE probes
(t = 10 its) were mounted in a distance of 7 mm and 22 mm from the impacted edge. Signals
of these two probes are shown in Figure 7.2. The upper signal, (1), comes from the first
probe at 7 mm, the lower from the one at 22 mm. The zero line which is almost 400 pts
corresponds to the free flight distance after the triggering light barrier. This is the
same with Figures 7.3 and 7.4.
65

The second signal, (2), is delayed by 6.0 gis (difference of the first deviation
from zero line of the two signals). This corresponds to an information velocity of
2.5 mm/gts which, obviously, is longitudinal wave speed in this material. The individual
shape and the difference of the two signals reflects the complicated superposition of
waves in the tile. This can be analyzed up to a certain degree. The first minimum of
(the upper) signal I indicates the arrival of the Rayleigh wave produced at the impact
site, this signal is a mixture of the pressure front and the Rayleigh wave.
jEmmmmiUWm MW
"total begiming
Fig. 7.2 Signals from two EE probes with an impact loaded Araldite B sample
The periodic behavior is due to the wave splitting effect (see sect. 5.4). This can
be seen best with signal 2. The calculation of the distance X of two subsequent wave-
fronts (eq.(5.8)) yields X = 21.4 mm or a corresponding time t = 8.5 ps. The distance of
the first three or four maxima of signal 2 is little more, 10 jis. In this material this
is probabiy due to a plastic wave front effect which results in a certain delay.
The same experiments carried out with glass, TiB2, SiC, alumina and sapphire are
more difficult to analyze because of the very fast wave speed. A typical result with
sapphire is shown in Figure 7.3.
Longitudinal wave fronts seem always difficult to detect. Larger effects originate
from shear or from Rayleigh waves. This is in particular true with ceramics. The signals
are much smaller than with plastic materials as was expected. The second minimum in
Figurc 7.3 appears delayed by about 1.3 pts with respectto the first minimum which cor-
responds to the propagation time of a longitudinal wave between the two probes being
positioned on the tile in a distance of 15 mm.
66

The electric conductivity of TiB2 was utilized to generate a contact signal for the
impact event in Figure 7.4. A 50 pm enamelled copper wire was fixed at the impact sitein order to produce a signal when being short-circuited to die grounded target by the
projectile. The probe was placed 22 mm from the impact site. The voltage jump in the
m- mm ... m-l•bgi-ing
Fig. 7.3 Electric emission signals from two probes with sapphire
upper signal indicates this event. A first hump maximum appears at about 2 gts which canbe interpreted as the longitudinal wave front. Even if the wave front would be apressure steep step function (which is not expected with that point-like contact of a
small bullet), the corresponding electric field may not be very sharply located becauseof the wide-spread source. A second, rather noisy signal begins at 3.4 ps with a maximum
l •.besimins
Fig. 7.4 Contact signal and electric emission signal with TiB2
67
at about 4.5 gis which could correspond to the Rayleigh wave rather than to the shear
wave. The periodic signal thereafter shows a repetition rate of 2.5 ts. If wave
splitting accounts for that, this is little more than is calculated using a repeated
occurrence t(2X) = 2.2 pts (eq.(5.8) and Fig. 5.3) of the same state in the target.
These experiments - in particular those with Araldite B - demonstrate the capa-
bility of the method to detect longitudinal and Rayleigh waves as well, even if inter-
pretation sometimes appears difficult. Currently, it is worked on a further improvement
of the probes (shielding, size of sensitive area, time constant).
7.3 Applications in Experiments
In all experiments on glass and sapphire reported in chapter 4 two EE probes have
been mounted close to the lower edge of the specimen which can be seen as round or
square shadows on the pictures, see high speed photographs of the experiments, chapter
4. This position was chosen in order not to disturb too much the light paths of the high
speed camera. The purpose of the probes was to detect the instants of arriving waves orthe initiation of fracturing.
Figure 7.5a shows the situation with shots # 1034 and # 1035. A first result was
achieved with shot # 1034, Fig.7.5b, on a glass target. Trigger occured with the cross
mark. These signals of the two probes fit approximately to what is calculated "-¾r the
propagation time of a Rayleigh wave travelling along the edges of the target. For probe
1 the distance is approximately 75 mm and if cR I 3 mm/ps is taken for the Rayleigh wave
velocity a travelling time of 25 pts is calculated which is about what the upper trace
shows for the hump. For probe 2 the distance is approximately 125 mm which leads to a
travelling time of 42 ps. Correspondigly, shows the lower trace about 40 Ps for the
hump.
Fig.7.5c shows the signals of shot 1035 with a sapphire target. Contact of the pro-
jectile with the target was expected at about 10 pts after trigger (crossmark). Electric
emission indicates this by the onset of some noise in both of the traces. If time is
counted from this mark a first negative hump is found at little more than 10 pts in the
68

r I
L: t 4. 3 A.s. t2 s*739
IMPACTOR TARGET
T 7 T-- 7.9 AS, t2 13.9 As
V0 R t t 13.2 As. I z 22 As
"• PROBES I ¢R 2
49 mm rlI r 2
= 86 mm N edge I (cl) 75 mm, edge2 = 123 mm
50 mm "1 c Lc1.Smm/I , cT=6 .
2 mm/ ,U.t$ CR=5 .7mm/ýJs
Fig. 7.5a Probe arrangement and propagation times (sapphir only)
I
toua beginning
Fig. 7.5b EE signals 1 and 2, shot # 1034, glass, v0 = 98 n/s
touta beginning
Fig. 7.5c EE signals I and 2, shot # 1035, sapphire, vo = 39 m/s
69
upper trace for probe 1. Due to the low impact velocity in this experiment the lower
signal originating from probe 2 is not clear to distinguish within the noise. There is
some indication that after 20its a signal begins. The calculations given under R in
Fig.7.5a make reasonable that a Rayleigh wave which travelled along the target edges may
have caused these parts of the signals. The maxima of the two signals correspond to
velocities around 2 mm/ts which could be caused by the far field of an approaching crack
tip (see Fig. 4.2).
The probe arrangement with the two sapphire shots # 1052, vY = 114 m/s, and # 1050,
v = 193 m/s, was the one shown in Figure 7.6a. The signals of the two experiments are
shown in Figure 7.6b and 7.6c. In each of the two pictures the upper signal, probe 1,
shows the arrival of the primary wave after about 2 or 3 gs indicated by the maximum of
a little hump in each curve. A similar effect with probe 2 which is expected at 8 4s
cannot be stated. There is a noisy event beginning at about this time in both signals of
# 1052 which is not understood. A maximum with probe 2 arond 15 to 20 jis may be cor-
related with a more or less complicated arrival of a shear or Rayleigh wave. Within
those first 50 Ats no fracture can be identified, - even though it seems from the photo-
graphs that the targets are totally destroyed in a shorter time. Large signals appear
usually at later times as is demonstrated with Figure 7.7, the complete signals of
probes (1) and (2) of # 1050. It is also usual that the signal of probe (2) exhibits
much larger amplitudes than the other. With shot # 1040, v0 = 311 m/s meaningful signals
were not achieved.
70

rIL: c L
IMPACTOR TARGET
T: t = -15 A S
I cTR :t = -- 6.I J.et 2.•20 .Ls
PROBES R cR 2
r = 23 mm r ""1 r 2
r I 93 mm 2-___w edge I (el) = 35 mm, edge2 = 115 mm2o 8 u C=1ll.Smm/gs, c =6.2mm/As, cR=5,7mm/'"s
1*-80m -~ LT flinJ.R~
Fig. 7.6a Probe arrangement and propagation times
total begining
Fig. 7.6b EE signals I and 2, shot # 1050, sapphire, v0 = 193 n/s
mal lbgimin
Fig. 7.6c EE signals I and 2, shot # 1052, sapphire, v0 = 114 m/s
71
8. SUMMARY AND CONCLUSIONS
A total of 17 experiments has been carried out within this part of the contract,
thereby 6 with sapphire. Planned tasks were the variation of the impact geometry and
velocity, and the recovery of the fine debris from the impact site (Mescall zone).
Problems arose with triggering the camera when knife-edge impactors were used. Four of
five of these experiments failed. We were also not successful with recovering the
complete material from the Mescall zone. We were, however, successful in recovering
parts of it so that some conclusions could be made.
From high speed photography using a Cranz-Schardin camera wave velocities and the
elastic material parameters, Young's modulus and Poisson's ratio, could be determined.
Furthermore, the effect of wave splitting was directly observed and measured in glass
and in sapphire targets. This supports the assumption that a crack can be drawn in the
midplane of the target by the longitudinal wave front, i.e., that a tile may be cleaved
in two halves by longitudinal wave speed. It was also seen that the intensity of the
shadows which are correlated to the splitted wave fronts vary with propagation time. The
first front is most intense in the beginning and decreases thereafter whilst the second
grows. This finding that energy moves less fast than the longitudinal wave front was
also reportet by Beinert [6]. This helps to understand that crack velocities can reach
the wave velocity only as)mptotically and that the nucleation front must be delayed with
respect to the longitudinal wave front. Models were developed on the stress-strain
distribution and energy flow within the pressure wave and during the impact event.
In earlier investigatons [1] it was found that glass under impact loading fractures
with a crack field with a uniform propagation speed, the terminal crack velocity. Energy
absorption was controlled by (a) the density of the crack field, (b) the density of
nucleations of secondary cracks in the pressure wave field in front of the fan of
extending primary cracks, and (c) the velocity vD of the nucleation front [1, 2].
A terminal crack velocity was not found with alumina [2, 3]. Single cracks were
produced with low impact velocities and crack fields when the impact velocity was
raised. Crack speeds were observed from about 3 000 m/s up to 9 000 m/s. The transferred
energy was obviously also augmented when the impact area was increased. With high impact
velocities a comminution (Mescall) zone was probably produced. This is concluded from
the particles found on the recovered part of the impactor of shot # 1040 (v° = 311 m/s).
72
Sapphire ranges in between. The scale of crack velocities extends from several
100 m/s to about 6 000 m/s with two accumulations at about 3 000 m/s and 5 000 m/s whichis about the Rayleigh wave velocity and half of it. Similar as with glass and different
from alumina activation of nuclei in the pressure wave field was observed with the
higher rate impact experiments. The effect of a damage velocity was, therefore, also
found with sapphire in two experiments: # 1052, v. = 7 000 m/s which is 61 % of thelongitudinal wave velocity and # 1040, v = 10 100 m/s or 88 % of this fastest velocity.
The crack configuration seems more complicated with sapphire than with amorphous
glass or alumina. Although crystallographic or cleavage planes were not found to be pre-
ferred crack planes the crystallographic structure of the material seemed to have
influenced the fracturing behavior. Parts of a crack surface can sometimes be identified
to be crystallographic planes. Radial cracks follow the wave vector which is thedirection energy propagates. They seem caused by the tangential tensile stress in the
pressure wave field. Shell cracks were observed in low blow tests. Corner cracks
initiate the target disintegration at the projectile comers. They develop in conse-
quence of the comer shear stress rather than are Hertzian cone cracks. Observed were
also edge cracks which are caused by the incident shear wave. Cracks which develop from
nuclei are radial cracks.
Energy consumption in sapphire is, obviously, controlled by number and speed of
cracks, viz., by generated surface areas, A, and the rate, A, these surfaces are pro-
duced, and by the amount and rate of nucleations. The production of a Mescall zone is
considered to be part of this although there are also additional contributions of dif-
ferent energy sinks like shearing along slip lines, kinetic energy of the particles,friction (heat generation), and re-compaction. From comminution techniques is known that
the compaction effect is particle size dependend. Only particles which achieve a certain
minuteness can compact. This effect may, therefore, be considered to be the defining
parameter for the Mescall zone. The critical size is probably in the sub-micrometerrange - but depending on the material. From shot # 1040 (v0 = 311 m/s) it may be con-
cluded that sapphire particles of 0.1 to 1 jtm diameter cast compact (Fig.6.4).
73
9. ACKNOWLEDGEMENTS
The sapphire samples tested in this contract were made available by Dennis
Viechnicki, AMTL, Watertown. This is gratefully appreciated. We ow thanks to William A.
Gooch from BRL and to the European Research Office of the U.S.Army in London, UK, both
for encouragement and funding. Wilbur C. Simmons, the representative of EP, in the
starting phase of the contract, has often demonstrated his deep interest in our work.
Experiments were carried out with the assistance of Joseph Schiler. Ceramo- and fracto-
graphic work was done by Monika Aberham. X-ray examination of the sapphire specimens was
performed by Eduard Reisacher.
74
10. REFERENCES
[I] U. HORNEMANN, H. ROTm-iHAuSLR., H. SENF, J.F. KALTHOFE, and S. WLNKLER,"Experimental Investigation of Wave and Fracture Propagation in Glass SlabsLoaded by Steel Cylinders at High Impact Velocities", Inst. Phys. Conf. Ser.No. 70, pp. 291-298, Pape; presented at 3rd Conf. Mech. Prop. High Rates ofStrain, Oxford 1984,
[2] S. WINKLER, H. SENF, and H. RoTmENHNAusL.E, "Wave and Fracture Phenomena inImpacted Ceramics", Final Report, European Research Office of the U.S. Army,London, Contract Number DAJA45-88-C-001l, 1WM Report V 23/89, 1989
[3] S. WINKLER, H. SENF, and H. RoTEmN usLER, "High Velocity Fracture Investi-gation in Alumina", Proceedings of the Conference on the Fractography ofGlasses and Ceramics II, Conference held at Alfred University, July 15-18,1990, edited by VD. Frechette, J.R. Varner, pp. 165-183, The American CeramicSociety, 1991
[4] D.R. CURRAN, L. SEAMAN, TH. CooPER, D.A. SHOCKEY, "Micromechanical Model forComminution and Granular Flow of Brittle Material under High Pressure and HighStrain Rate; Application to Penetration of Ceramic Plates", SRI International,Poulter Laboratory Technical Report 001-91, December 1991
[5] LINDE broshure on sapphire
(6] J.M. BENERT, "Schlierenoptical Stress Analysis of Short Duration Pulses in
Elastic Plates", J. Appl. Mech. Vol.42, No.1, pp.5-8, 1975
[7] E.H. YoFFE, "The Moving Griffith Crack", Phil. Mag. 42, pp. 7 39 -7 5 0. 1951
[8] K.B. BROBERr, "The Propagation of a Brittle Crack", Ark. Fiz. 18, pp.159-192,1960
[9] L.B. FREUND, "Crack Propagation in an Elastic Solid Subjected to GeneralLoading", I and II, J. Mech. Phys. Solids, 20, pp.129-152, 1972
[10] R.F. COOK and G.M. PHARR, "Direct Observation and Analysis of IndentationCracking in Glasses and Ceramics", J.Am.Soc.73, pp.787-815. 1990
[11] A.G. EvANs and T.R. Wu..sHow, "Quasi-Static Solid Particle Damage in BrittleSolids-I. Observations, Analysis, and Implications", Acta Metall., 24, pp.939-956, 1976
[12] J. LENKFORD and D.L. DAVIDSON, "The Crack Initiation Threshold in CeramicMaterials Subject to Elastic/Plastic Indentation", J. Mater. Sci., 14,pp.1662-1668, 1979
[13] D.A. SHocKEY, A.H. MARCHAND, S.R. ScAGos, G.E. CORT, M.W. BuRK=r.r and R.PARKER, "Failure Phenomenology of Confined Ceramic Targets and ImpactingRods", Int. J. Impact Engng. Vol 9, No.3 pp.263-275, 1990
75

[14] J.E. FmLD, "Investigation of the Impact Performance of Various Glass andCeramic Systems", Final Technical Report, ERO Contract DAJA45-85-C-0021,Cavendish Laboratory, Department of Physics, University of Cambridge, August
J! 1988
[15] D. VIECHNIcK, W. BLUMENTHAL, M. SLAtvi, C. TRACY, and H. SKEELE, "ArmorCeramics - 1987", Proceedings of The Third Tacom Armor Coordinating Conference17-19 February 1987, Monterey, California, Army Materials Technology Labora-tory, Watertown, MA, 1987
[16] S. Wmi.K•x, "Brucherkennung mit elektrischer Emission", Fraunhofer-Institutftir Werkstoffmechanik, Freiburg i.Br., IWM-Bericht T 10/90, 1990
[17] H. LovsE, E. STRASSBURGE, H. SEF, G. ZIMMEMANN, B. SALZIGUE, "Erfassung derRiflbildung in Werkstoffen durch Ausnutzung der elektrischen Emission",Fraunhofer-Institut fur Kurzzeitdynamik, Weil am Rhein, EMI-Bericht 8/91,1991
[18] S.R. WiNaKaE, "Magnetic Emission Detection of Crack Initiation", FractureMechanics: Twenty-First Symposium, ASTM STP 1074, J.P. Gudas, J.A. Joyce, andE.M. Hackett, Eds., American Society for Testing and Materials, pp. 178-192,Philadelphia, 1990
7
i 76