Embed Size (px)
Citation preview

AD-A241 630 - *,NASA CR-187117 A -2160 ~CRI/RD 87-164 " -
FINAL REPORT
Hydrogen Test Of A Small, Low Specific SpeedCentrifugal Pump Stage
by
Rocketdyne Engineering
Rocketdyne Division
Rockwell International
prepared for
NATIONAL AERONAUTICS AND SPACE ADMINISTRATION
May 1991
NASA-Lewis Research Center
Cleveland, Ohio 4413591-12972
Contract NAS3-23164 !I 91l1297G. Paul Richter, Project Manager
91 10 9q 148

LAhIKER NOTICE
00
THIS DOCUMENT IS BEST
QUALITY AVAILABLE. THE COPY
FURNISHED TO DTIC CONTAINEDA SIGNIFICANT NUMBER OF
PAGES WHICH DO NOT
REPRODUCE LEGIBLY.

NASA CR-187117RI/RD 87-164
Table of Contents
SUMMARY ............................................................................................................................ 1
INTRODUCTION .................................................................................................................... 2
CONFIGURATION SELECTION & DESCRIPTION ................................................... 2
TEST FACILITY DESCRIPTION ......................................................................................... 6
TEST PROG RAM .......................................................................................................... 9
TEST ARTICLE .................................................................................................... 9
INSTRUM ENTATION ........................................................................................... 9
TEST PROCEDURES ........................................................................................... 9
TEST MATRIX .................................................................................................. 1 5
TEST RESULTS ................................................................................................ 1 6
HEAD-FLOW .................................................................................................... 1 6
PUM P EFFICIENCY ......................................................................................... 2 0
ANALYSIS OF PUMP LOSSES ............................................................................ 2 5
SUCTION PERFORMANCE ................................................................................ 25
DIFFUSION SYSTEM PERFORMANCE ................................... 31
HYDRO DYNAM IC LOADING ................................................................................ 3 1
CONCLUDING REMARKS .............................................................................................. 40
REFERENCES ..................................................................................................................... 41
T A-
................. ...... .

NASA CR-187117RI/RD 87-164
List of Figures
Figure 1- Shrouded Impeller Volute Pump .................................................................. 5
Figure 2 - LH2 Test Facility Schematic ...................................................................... 7
Figure 3 - Pump / Turbine Test Stand Installation .................................................... 8
Figure 4 - Pump / Tester Cross Section .................................................................... 1 0
Figure 5 - Pump/ Tester Assembly ........................................................................ 1 1
Figure 6 - Typical Pump Instrumentation ................................................................. 1 2
Figure 7 - Tester and Turbine Instrumentation ............................................................. 1 3
Figure 8 - Isentropic H ead Flow ...................................................................................... 1 7
Figure 9 - Low Thrust Hydrogen Test, Config. 2, H/Q Test ....................................... 1 8
Figure 10 - Low-Thrust Water Testing, Config. 2 .................................................. 1 9
Figure 11 - Low Thrust Hydrogen Testing, Config. 2, Test 016027 .................... 2 1
Figure 12 - Low Thrust Hydrogen Test, Config. 2, Isentropic Pump Efficiency ..... 22
Figure 13 - Low Thrust Turbine Efficiency ............................................................. 23
Figure 14 - Low Thrust Tester Torque, Liquid Hydrogen Lubrication ..................... 24
Figure 15 - Low Thrust Hydrogen Test, Config. 2 .................................................... 26
Figure 16 - Low Thrust Hydrogen Testing, CAV Test 016027 ................................ 27
Figure 17 - Low Thrust Hydrogen Test, Config. 2, H/Q Testing ................................ 3 0
Figure 18 - Low Thrust Hydrogen Testing, Config. 2, CAV Test 016026 ................ 32
Figure 19 - Low Thrust Hydrogen Testing, Config. 2, CAV Test 016027 ................ 33
Figure 20 - Low Thrust Hydrogen Testing, Config. 2, Section Specific Speed ....... 3 4
Figure 21 - Low Thrust Hydrogen Testing, Config. 2, Suct.Perform.for LH2 & H20 ..... 3 5
Figure 22 - Diffusion System, Config. 2 .................................................................... 3 6
Figure 23 - Low Thrust Hydrogen Testing, Config. 2, Impeller Volute H/Q ........ 3 8
Figure 24 - Low Thrust Hydrogen Testing, Config. 2, Radial Load ............................ 39
iii/
NASA CR-187117RI/RD 87-164
List of Tables
Table I - Design Summary of Centrifugal Pump Configurations ................................... 3
Table II - Pump Design Geometry ................................................................................. 4
Table III - LH2 Centrifugal Pump Test Instrumentation List ....................................1 4
Table IV - Instrumentation Accuracies ......................................................................1 5
Table V - Test Matrix ................................................................................................. 1 5
Table VI - Predicted Design Point Losses as Percent of Input Power
at Operating Wear Ring Clearances ......................................................... 2 8
Table VII - Design Point Pump Efficiencies ..............................................................2 9
iv

NASA CR-187117RI/RD 87-164
SUMMARY
A small, low specific speed (430 RPM*GPM**0.5/ft**0.75) centrifugal pump stage with a 2inch tip diameter, 0.030 inch tip width shrouded impeller and volute collector, which had
previously been tested in water, was tested with liquid hydrogen as the pumped fluid. Data in
hydrogen obtained at test speeds of 60% and 80% of design speed were scaled to the 77,000RPM design speed using appropriate affinity laws. The head / flow characteristic in hydrogen
was relatively flat over the test flow range similar to the characteristic determined in the
previous water tests. Based on scaled data from the 80% test speed, the pump overallisentropic head rise was 7,000 feet at design flow. Efficiency was 30.3% based on output
power delivered from a calibrated drive turbine. Impeller wear ring radial clearances for thehydrogen tests were over twice the design value of 0.002 inch and significantly affected the
test efficiency. Results of loss analyses using as-tested clearances indicated that an efficiency
of 43.7% could be expected when operating at design clearance. Limited cavitation data
indicated that the pump had better suction performance in hydrogen than in water at
corresponding flow ration conditions.

NASA CR-187117
RI/RD 87-164
INTRODUCTION
Pump-fed low-thrust chemical propulsion systems are being considered for transferringacceleration-limited structures from low earth orbit to geosynchronous or other high earthorbits. Engine systems for these applications will require small, relatively low flow rate,high head rise pumps that fall outside the design range of existing rocket engine turbopumps.In order to establish a technology base for future design of these systems, a program wasinitiated to experimentally evaluate low specific speed centrifugal pump tages and inlet-typestages over the flow rate range of interest. Funding for the program was provided under N1ASA-Lewis Research Center Contract NAS3-23164 and related effort was provided by Rocketdyneinternal sources.
Contracted effori consisted of design, fabrication and water test of six single-stage centrifugalpump configurations with subsequent test of one of the configurations in liquid hydrogen. Thetester and drive turbine used in the test effort were fabricated and test-calibrated as part of aprior Rocketdyne-funded program. Also, an inducer was designed and fabricated under contractand a shear force pump stage was designed and fabricated under the prior company-fundedprogram. Because of a reduction in program scope, neither of these units was tested. Thereduction in scope likewise precluded tests in liquid hydrogen of a second of the centrifugalpump stages.
Results of the water testing along with design details of the six centrifugal configurations aregiven in reference 1. This report present-, liquid hydrogen test results of Configuration 2, a430 (RPM*GPM*.5/ft**.75) design specific speed stage with a 100% admission shroudedimpeller discharging directly into a volute.
CONFIGURATION SELECTION & DESCRIPTION
A complete description of the six centrifugal pump configurations along with theirperformance characteristics in water are given in reference 1. A design summary of theconfigurations is given in Table I. Following the water tests, the performance and designadvantages of the six configurations were evaluated by NASA Lewis Research Center andRocketdyne with Configuration 2 chosen as the first of two configurations to be tested in liquidhydrogen Configuration 6 which included a shrouded impeller with a 0.052 inch tip width (forease of fabrication) and a 50% emission vaned diffuser was selected as the second configurationbut was not tested because of the previously noted reduction in program scope.
Design details for Configuration 2 are given in Table II. Pump hardware is shown in Figure 1.The pump incorporates a 100% admission full shrouded 2-inch tip diameter impeller withseven backwardly curved blades which have a 33 degree discharge blade angle. Impellerdischarge tip width is 0.030 inch. Impeller flow discharges directly into a volute with adiffusion section at the exit.
2

NASA CR-187117
RI/RD 87-164
Table I - Design Summary of Centrifugal Pump Configurations
Impeller ISpecific Speed,Imp ller g WTip Diffuser Speed. Flow, He..d, RPMDischargi Width, I 11uld
Type Diameter Inch.. Type RPM GPM Feet rpmgpm 0.5
Inches /f 0.75
Shrouded 2.00 0.030 Vaned Water 24.500 5.0 637 430100% Admission 1009/6 Emission Hydrogen 77,000 15.? 6,30C 430
2 Same as 2.00 0.030 Volute Exit Water 24,500 50 637 430Configuration 1 Hydrogen 77,000 15.7 6.30C 430
3 Same as 2.00 0.030 Vaned Water 39.200 2.0 1.63C 215Configuration 1 25% Emission; Hydrogen 125,00C 6.3E 16.600 215
4 Open Face 2.00 0.035 Volute Exit Water 24,500 5.0 637 430100% Admission Hydrogen 77,000 15.7 6,30C 430
5 Open Face 2.00 0.035 Volute Exit Water 39.20C 2.0 1.711 21525% Admission Hydrogen 125.00C 6.7E 17.400 215
6 Shrouded 2.00 0.052 Vaned Water 24.500 5.0 637 430100% Admission 50% Emission I H4drogen 77,000 15.7 6.30C 430
3

NASA CR-187117RI/RD 87-164
Table II - Pump Design GeometryConfiguration NO. 2
Impeller
TpShroudedDischarge diameter, inches 2.0Inlet Eye diameter, inches 0.75Inlet Hub diameter, inches 0.50Discharge tip width, inches 0.030Number of Blades 7Discharge Blade angle, degrees 33Wear Ring diameter, inches 1.00Front Wear Ring Radial clearance 0.002Inshes (maximum design)Impeller Face clearance, inches ----Rear Wear Ring radial clearance 0.002Inches (maximum design)Inlet Eye Blade angle, degrees 21.9Inlet flow coefficient (10% blockage) 0.134Percent admission 100Discharge Flow coefficient 0.074
DiffuserInlet diameter, inches ----Discharge diameter inches ----Passage width, inchesNumber of passagesInlet angle, degrees ----Area ratio, out/in ----Percent emission ----
VoluteMaximum area at 360 degrees, in. 2 0.0267Continuity area/Actual area 0.60Conical Diffuser Exit area, in.2 0.096
4

NASA CR '8-17R! R4D 87 164
Figure 1- Shrouded Impeller Volute Pump
V>z
a
z Q
- Z ~ CD
* ~ <

NASA CR-187117RI/RD 87-164
TES , FACILITY DESCRIPTION
Testing was conducted at the Lima Test Stand of the Advanced Propulsion Test Facility (APTF) atthe Santa Susana Field Laboratory of Rocketdyne. Lima Stand has liquid oxygen (LOX), liquidhydrogen (LH 2 ), liquid nitrogen (LN 2 ), gaseous hydrogen (GH2), helium and nitrogen flowcapability. Only gaseous and liquid hydrogen were used for this test series. Liquid hydrogenwas used as the pumped fluid and to cool the bearings, and gaseous hydrogen was used to drivethe turbine. A schematic of tho test facility showing the test article is shown in Figure 2.Gaseous hydrogen for turbine drive is supplied from a 5,000 psig, 602 ft 3 bottle supply. Thegas flows through the run line to a servo controlled valve for control of GH 2 turbine inletpressure independent of bottle supply pressure. The gas then passes through a 10 micronfilter and precision critical flow nozzle for GH2 flow rate measurement. Ports are alsoprovided for pressure and temperature measurements.
Liquid hydrogen is supplied to the tester for bearing coolant and at the pump inlet from a15,000 gallon tank rated at 100 psig. Due to the long lengths of small diameter inlet anddischarge lines, it was anticipated that chilling the flow systems and providing liquid hydrogenof proper condition to the pump inlet would be difficult. Consequently, the facility lines werereworked to utilize insulated jacketed lines with hydrogen of proper condition to the pumpinlet would be difficult. Consequently, the facility lines were reworked to utilize insulatedjacketed lines with hydrogen flowing in the jacket as well as the line itself. During therework, instrumentation was added to determine the quality of the hydrogen entering the pump.The pump flow supply system includes a shut-off valve, flow venturi system, a 10 micron-filter, and the pump inlet throttle valve. The pump discharge line contains a flow venturisystem and the throttle valve. The bearing supply line includes an orifice and necessaryinstrumentation to measure bearing flow rate and temperature. Pump discharge flow andbearing overboard drainage are dumped into a burn stack. A picture of the completed test standwith the pump/turbine tester installed is presented in Figure 3.
Test data were collected on a 128 channel, computer based system capable of taking 50,000measurements per second. The system consists of a NEFF series 620 data acquisition sub-system and a Data General Eclipse S140 computer. The computer has 256 kilobytes ofmemory, 256 megabytes of storage on a fixed disc, and 126 megabytes of storage on aremovable disc. Associated with the computer are three video terminals. Two terminals arefor displaying facility and test data for the operations personnel. The third terminal is theoperator's terminal.
Data were recorded on magnetic tape during a test. Scaled data were available post-testimprinted from a 600 line-per-minute printer. The tape format is compatible withRocketdyne's link to Rockwell's Western Computer Center, so that more extensive datareduction was provided on a 24-hour turnaround basis.
Three, six-channel Watanabe strip chart recorders were used to monitor key parameters asbackup and to assist the test engineer in determining trends and/or necessary adjustments inthe test plan.
6

NASA CR-187117RI/RD 87-164
Figure 2 LH2 Test Facility Schematic
LJOOUID
STURN ETC
VAALVE
7UPTUBN

NASA CR-187117RI RD 87-164
Figure 3 -Pump fTurbine Test Stand Installation
pA
0c
Jc
Vc
CCC
AMA8V

NASA CR-187117RI/RD 87-164
TEST PROGRAM
TEST ARTICLE
The low thrust pump/turbine tester is essentially a small turbopump with self containedturbine drive and centrifugal pumping element. For hydrogen testing, the tester turbine wasdriven by gaseous hydrogen supplied at ambient temperature and exhausting to a burn stack.The pumped fluid was liquid hydrogen. A cross sectional view of the pump/turbine tester andphotograph of the assembled unit are shown in Figure 4 and Figure 5 respectively. Theassembled unit was the same configuration as for the previously reported water testing exceptthat the carbon face seal between the pump and tester was replaced with a labyrinth seal, andthe impeller smooth surface wear ring seals were reworked to labyrinth configurations bymachining labyrinth grooves in the housings. Also, the conventional oil lubricated bearingsused in the water tests were replaced with bearings suitable for use in liquid hydrogen.
INSTRUMENTATION
Typical pump and tester instrumentation is shown in Figure 6 and 7. Overall (flange toflange) head rise was determined by measuring the difference in pressure between a four-holestatic pressure piezometer ring located 5 diameters upstream of the pump inlet and a four-hole static pressure piezometer ring located 10 diameters downstream of the pump discharge.The velocity heads calculated from the pump flow rate and respective cross-sectional areas atthe measurement stations were added to the inlet and discharge static heads to obtain the totalhead rise. Static pressure measurements within the pump at the tap locations noted on Figure6 were used to calculate pump impeller radial and axial loads. Pump inlet flow rate and pumpdischarge flow rate were measured by means of venturi tubes. Speed was measured using eddycurrent proximity probes that sensed the rotation of a 0.004 inch depression machined on thetester shaft. Housing mounted accelerometers which measured pump-end radial, turbine-endradial and axial vibrations were monitored during testing to ensure safe operation.
Instrumentation is listed in Table I1l. Instrumentation accuracies are given in Table IV. Allinstrumentation was calibrated by standards traceable to the Bureau of Standards prior totesting. Calibrations were checked pretest and post-test.
TEST PROCEDURES
The tests evaluated head rise versus flow at shaft speeds of approximately 46000 and 62000RPM. The flow rate was controlled by a throttle valve located downstream of the pump. Pumpspeed was controlled by varying the turbine inlet pressure to control the power input to thepump. Flow rate was varied from approximately 60 to 120% of design flow.
Suction performance tests were conducted by gradually lowering pump inlet pressure fromapproximately 80 psig to a low value which caused in excess of 5% pump head loss. Eachcavitation test was cut automatically when pump head dropped more than 10%.
Input power to the pump was determined by computing the output power generated by the driveturbine (which had been calibrated as part of the water test series) and subtracting the testerbearing and seal drag loss. Turbine pressure and temperature measurement locations duringthe pump tests were the same as those for the calibration tests to provide a direct relationshipof calibration information. Test drag was experimentally determined by removing thecentrifugal pump and running the tester rotating assembly with liquid hydrogen as the bearingcoolant and the calibrated turbine as the power source.
9

NASA CR-187117RI/RD 87 104
Figure 4 - Pump / Tester Cross Section
(NOT TO SCALE)
Bearingsi earigs Turbine Rotor
Front Wear Ring Rear Wear Ring Bearing -
F tabyrinth) (Labyrinth) Coolant Jets
Turbine Nozzle
Labyrinth Sea] Bearing Coolant Turbine Inlet
Rear Wear Ring DrainsDownstream Cavity
10

NASA CR-187117RI/RD 87-164
Figure 5 -Pump /Tester Assembly
400

NASA CR-187117RI/RD 87-164
Figure 6 Typical Pump Instrumentation
Front Shroud Mid. Press
Front Wear Ring(Labyrinth)Upstream Press
Pump Inlet Pressureand Temperature
Rear Wear Ring(Labyrinth)Downstream Press
Rear Wear Ring(Labyrinth)
Upstream Press
Impeller RearTip Pressure
Impeller FrontTip Pressure
Volute Pressure (4)
*- Pump Discharge Press and Temperature
12

NASA CR-187117RI/RD 87-164
Figure 7 -Tester and Turbine Instrumentation
Bearng~ Coolant InletPress and Temperature Rotor Out Cavity Press
-Nozzle Out Cavity Press
_,ozzle Out Hub Press
ozzle Out Tip Press
Nozzle Inlet Press
Proximity Prob
(used for Shaft Speed) Pump Bearing Coolant otor Out Hub Press
Drain Temperature otor Out To Press
Turbine Bearing CoolantDrain Temperature
13

NASA CR-187117
RI/RD 87-164
Table III - LH2 Centrifugal Pump Test Instrumentation LIST
ange Redlne Lw igh
Pump Inlet Temperature 0 to 100 R 44 R XPump Outer Temperature 0 to 200 RBearing Coolant Inlet Temperature 0 to 100 R 47 R XPump Bearing Coolant Drain Temperature 0 to 200 R 100 RTurbine Bearing Coolant Drain Temperature 0 to 200 R 100 R XTurbine Inlet Temperature 450 to 550 RTurbine Outlet Torus Temperature 400 to 550 RPump Inlet Pressure 0 to 100 psig 60 psia X (H-O Tests only)Pump Discharge Pressure 0 to 500 psigVolute Discharge Pressure - 0 Degrees 0 to 500 psigVolute Discharge Pressure - 90 Degrees 0 to 500 psigVolute Discharge Pressure - 180 Degrees 0 to 500 psigVolute Discharge Pressure - 270 Degrees 0 to 500 psigFront Wear Ring Upstream Pressure 0 to 500 psigRear Wear Ring Upstream Pressure 0 to 500 psigRear Wear Ring Downstream Pressure 0 to 250 psigImpeller Front Tip Pressure 0 to 500 psigImpeller Front Mid Pressure 0 to 500 psigImpeller Rear Tip Pressure 0 to 500 psigTurbine Nozzle in Pressure 0 to 50 psia 25 psiaTurbine Nozzle Out Tip Pressure 0 to 100 psigTurbine Nozzle Out Hub Pressure 0 to 1OC psigRotor Out Tip Pressure 0 to 100 psigRotor Out Hub Pressure 0 to 100 psigTurbine Nozzle Out Cavity Pressure 0 to 100 psigRotor Out Cavity Pressure 0 to 100 psigTurbine Out Torus Pressure 0 to 50 psiaBearing Coolant Inlet Pressure 0 to 100 psig 60 psig X XBearing Coolant Inlet Orifice Pressure 0 to 100 psigPump Inlet Valve Inlet Temperature 0 to 100 RPump Inlet Venturi Temperature 0 to 100 RPump Inlet Venturi Pressure 0 to 100 psigPump Inlet Valve Inlet Pressure 0 to 100 psigShaft Speed, Rpm (2 Bently's) 0 to 85,000 Varies per test XBearing Coolant Inlet Orifice Delta-p 0 to 20 psidPump Radial Acceleration, Vibration 0 to 50 G, Rms 20 G Rms XTurbine Radial Acceleration, Vibration 0 to 50 G, Rms 20 G Rms XAxial Acceleration, Vibration 0 to 50 G, RmsTime-irig, SecondsPump Discharge Flow Venturi Delta-p 0 to 20 psidPump Inlet-discharge Depta-p 0 to 250 psidPump Inlet Flow Ventura Delta-p 0 to 20 psidTurbine Flow Nozzle in Temperature 450 to 550 RTurbine Flow Nozzle in Pressure 0 to 1000 psigTurbine Flow Nozzle Out Pressure 0 to 100 psigBently (3) Vibration 0 to .015 inch, P-P .010 inch, P-P X
'Barometric Pressure Recorded for Test Period
14

NASA CR-187117RI/RD 87-164
Table IV - Instrumentation Accuracies
Pump Inlet Pressure +0.5 PSIPump Inlet and Discharge Temperature ±0.2 Degree RPump Discharge Pressure and ALL OTHER ±2.5 PSIInternal Pressures Shown in FIG. 6Flow Rate ±0.5%Shaft Speed ±0.5%
TEST MATRIX
Liquid hydrogen tests were performed at two speeds and four flow rates per speed at non-cavitating conditions. Cavitation data were obtained at three flows for one speed. The tests arelisted in Table V.
Table V - Test Matrix
Test Nlumber Testing Details
016024 H-Q testing at 60%Design speed (46200 RPM)Flow range .7 to 1.6 0/0D
016026 H-0 testing at 80%Design speed (61600 RPM)Flow range .7 to 1.4 Q/QD
Cavitation test at 80%Design sped (61600 RPM)
Flow of .65 0/0D
016027 H-0 testing at 80%Design speed (61600 RPM)At design flow
Cavitation test at 80%Design speed (61600 RPM)
15

NASA CR-187117
RI/RD 87-164
TEST RESULTS
Liquid hydrogen testing of Test Configuration #2 consisted of non-cavitating and cavitatingperformance tests over a range of rotational speeds and hydrogen flow rates. The pump designspeed and flow rate are 77,000 RPM and 15.7 GPM, respectively. A rotordynamic vibrationwas encountered during testing between 70,000 and 75,000 RPM. The planned test speed of77,000 RPM was reduced to avoid potential component damage. Review of the test dataconfirmed the presence of a critical speed at about 74,000 RPM. The predicted value of thefirst critical was 96,000 RPM. The difference was probably due to the larger than desireddead band found in one bearing assembly. Successful non-cavitating tests were run at 60percent design speed, and a series of cavitating and non-cavitating tests were conducted at 80percent design speed.
HEAD-FLOW
The head produced by the pump is determined from measurements between a point upstream ofthe pump inlet and a point downstream of the volute discharge. The thermodynamic statesupstream and downstream of the pump are known from measured pressures and temperatures.The discharge state reflects an increase in energy over the inlet state due to pumping of thefluid and also due to pump losses resulting in internal fluid heating. The isentropic processline 1-3 of Figure 8 is used to determine the ideal pump head. The process 1-2 is the actualprocess including losses.
The isentropic head for the two test speeds in hydrogen is plotted in Figure 9 with all datascaled to a speed of 77,000 RPM. Two data sets were derived from test 016-024 (test shaftspeed of 46200 RPM). The first set, represented by solid squares in Figure 9, was obtainedwhile operating at a fixed steady state flow. The second set, represented by circles, wasobtained while the flow rate was in a slow transient from 1.3 to 0.7 times design flow. It isobserved that both sets align well with each other. This agreement is not always true fortransient data because of lag in sensing ports and/or data acquisition equipment.
The measured head in hydrogen is relatively flat over the test flow range similar to thehead/flow characteristic from the water test results given in reference 1 and shown here inFigure 10. As discussed in reference 1, leakage flow which is recirculated through theimpeller strongly influenced the shape of the curve. The leakage includes rear wear ring flowwhich is returned to the inlet through passages in the test article and front wear ring flowwhich mixes with the inlet flow after passing through the wear ring. The front wear ring flowhas a large tangential velocity component prior to mixing with the incoming flow. Thisproduces prewhirl at the impeller inlet which drops the change of angular momentum producedby the impeller and therefore reduces pump head rise. As the delivered pump flow is reduced,the ratio of impeller total flow to whirling front wear ring flow is decreased. This acts toreduce pump head rise at reduced delivered flow while the increased tangential velocity at theimpeller blade exit acts to increase the pump head rise. The result is a nearly constant headrise as delivered flow is reduced.
The scaled head rise data in Figure 9 also indicate that the isentropic head coefficient of thepump decreased as test speed was increased. This is typical of hydrogen pump operation in thatat higher speeds (pressures) the head rise does not follow similarity relations because ofhydrogen compressibility and thermodynamic property effects.
16

NASA CR-187117RI/RD 87-164
Figure 8 -Isentropic Head Flow
2 CONSTANT PRESSURE3 LINES
ENTHALPY
ENTROPY
Where: 1 - Inlet State2 - Actual Discharge State3 - Ideal Discharge State
The calculated pump head is:A H - (h3 - hl) 788.2
Where: A H - Head (feet)h - Enthalpy (btu/lbm)
17

NASA CR-187117RI/RD 87-164
Figure 9 - Low Thrust Hydrogen Test, Configuration 2Head-Flow Testing
II I I
I
CLf0O
In
rj
0. (0
, WM
0
(000 M
0 0
0n 0
0 0 0 0 0 0 000 00 0 000 to 0 00
18

NASA CR-187117RI/RD 87-164
Figure 10 - LOW-Thrust Water TestingConfiguration 2,
Test and Curve Speed 24,500 RPM
Ln
0 C) 00
00 C10
oAA 'APCl5~ 0VO 0ln
19

NASA CR-187117RI/RD 87-164
PUMP EFFICIENCY
EnthaRv Basis The pump isentropic efficiency can be determined from the ratio ofenthalpy gain in the ideal process to the actual process when no overboard flow losses exist.
h = 1 J3-11h2-hl
In the configuration which was tested, an efficiency correction is required to account for theheated fluid being lost through the shaft labyrinth seal into the bearing cavity (See Figure 4).This amount of overboard flow is the difference between the pump inlet and discharge flowswhich were measured during the tests. The overboard flow is primarily a function of thepressure difference between the rear wear ring downstream cavity and the bearing cavity.Wear ring pressure is measured during testing.
The bearing cavity pressure was nearly constant throughout the test. The bearing cavitypressure can be determined from cavitation test data. During cavitation testing, pumppressure is decreased to the point where there is no overboard flow, as shown in Figure 11.The bearing cavity pressure is 76 psig compared to a bearing supply pressure of 80 psig. At aflow rate of 93% of design, the pump efficiency with no overboard flow is two percentagepoints lower than the uncorrected efficiency measured during the flow tests. This correctionfor overboard flow is applied to the entire flow range tested since the overboard flow rate didnot vary significantly during H-Q testing.
The corrected values for pump isentropic efficiency are plotted in Figure 12 along with thewater test efficiencies. This figure also includes the corrected efficiency of the pump duringthe transient portion of test 016-024. The efficiency plot for the transient test exhibits morescatter than corresponding head data in the previous discussion. The data scatter is caused bytransducer accuracy during the transients and not oscillations from the pump.
Referring to the previous section (HO discussion), the head of the pump was almost flat. Fromthe efficiency plots it is seen that the efficiency is increasing with fiow even above the designflow. The efficiency increases with flow because the ratio of recirculation to incoming flowdecreases. Since impeller head remains fairly constant, the recirculated flow also is constant.However, as the incoming flow increases while the recirculating flow remains constant, theimpact on efficiency is less. It is not unusual for a low specific speed pump to have itsefficiency strongly driven by the seal leakage rates.
Turbine Power Basis Pump efficiencies based on turbine output power have beencorrected to include the losses from the tester drag torque for pump Configuration #2. Tomake this correction the tester is considered as three components: the turbine, the tester andthe pump. Turbine calibration was completed as part of the water testing series, and theresulting turbine performance characteristic is presented in Figure 13. For liquid hydrogentesting, liquid hydrogen was used to lubricate the bearings. A tester drag calibration test wasconducted with liquid hydrogen supplied to the bearing lube jets, and the resulting tester dragtorque characteristic is plotted in Figure 14.
20

NASA CR-187117RI/RD 87-164
Figure 11 Low Thrust Hydrogen Testing, Configuration 2Test 016027, Shaft Speed 61,600 RPM
Lai 40, -,
0
11- wrm N
ADVANCED PROPULSION TEST FACILITY Test 016027 Framp 59
Rear Wear Ring Downstream Cavity Pressure (Psig)
21

NASA CR-187117RI/RD 87-164
Figure 12 - Low Thrust Hydrogen Test, Configuration 2Isentropic Pump Efficiency
00U -P
< I
100
8 1')- 1"
OF
CL-
CL 02
00
voo 0
N00U2 0 6
4
oCt3 00 Z
0
0 o o
Isentropic Efficiency
22
m m m i I I I I l-i I

NASA CR-187117RI/RD 87-164Figure 13 - Low Thrust Turbine Efficiency
100 Percent Admission
-I
Ln
0Mn C2
CC
EFF Fia Curv
23f*~

NASA CR-187117RI/RD 87-164
Figure 14 -Low Thrust Tester TorqueLiquid Hydrogen Lubrication
Shaft Speed, RPM
C
Testr ToqueIn-O
24c

NASA CR-187117RIIRD 87-164
To correct the pump efficiency for tester drag, a linear curve fit to the tester drag torque wasextrapolated to cover the full range of shaft speeds tested. By subtracting the bearing dragfrom the turbine output power, the pump input power was found. The pump hydraulic outputpower was then divided by this input power to determine the pump efficiency.
Efficiencies for Configuration 2 in hydrogen and water based on turbine power output andbearing and seal drag calibration tests are shown in Figure 15. Also shown are the isentropicefficiencies from the steady state head-flow tests in hydrogen. The water and hydrogenefficiencies based on turbine power which are based on ideal-to-actual enthalpy increases, areshown to be 10 to 13 percentage points above the efficiencies based on turbine power. Sincethe hydrogen temperature rise across the pump was only about 3 degrees Rankine, theisentropic efficiencies have a high uncertainty. For example, a temperature measurementerror of 0.5 degrees would cause the efficiency to vary by approximately seven points. For theturbine power based efficiencies, the temperature differential across the turbine was about 70degrees so that a 0.5 degree error would cause an efficiency variation of only one-halfpercentage point in derived pump efficiency.
ANALYSIS OF PUMP LOSSES
The work conducted during the water test program included analysis of pump losses in waterfor Configuration #2 using the as-tested wear ring radial clearances. Results of that analysisalong with results of similar analysis for the as-tested wear ring radial clearances inhydrogen are given in Table VI. Note that the losses are given as a percentage of input powerfor the respective pumped fluid and are not directly comparable in terms of absolute powerconsumption.
Comparison of the water and hydrogen losses shows that friction related loss factors inhydrogen are lower than those in water. This is due to the much lower viscosity of hydrogenand higher Reynolds numbers which reduce the friction factor to the extent that the loss factorsare lower even though the hydrogen velocities are significantly higher. The largest loss factorin either fluid is wear ring leakage which is seen to be inordinately high in hydrogen because ofthe large as-tested wear ring clearance. As was the case in the water test program, analysiswas conducted to provide an expected efficiency to reflect pump operation at the 0.002 inchdesign value of radial clearance. Results are given in Table VII along with the previous resultsfor the water pump. The adjusted design point water test efficiency is 33.5 percent, and theadjusted hydrogen test efficiency is 43.7 percent.
SUCTION PERFORMANCE
Two successful cavitation tests were performed at 61,600 RPM. The target flow rates for bothtests were near design, however, as the inlet pressure is steadily reduced, the flow rate alsodecreases. The test flow rates are representative of the f;ow conditions at the point of severecavitation. Plots of pump inlet flow rate, shaft speed, isentropic head and overboard flow rate(to bearing cavity) are shown vs. pump inle( NPSH in Figure 16. The overboard flow rate isthe difference between pump inlet and discharge flow rates. At high inlet pressures the netoverboard flow is from the impeller rear wear ring downstream cavity past a shaft labyrinthseal to the bearing cavity. As pump pressures are lowered during cavitation testing, the flowreverses, now flowing from the bearing cavity at approximately 76 psig and below to mix withthe pump wear ring flow.
25

NASA CR-187117RI/RD 87-164
Figure 15 - Low Thrust Hydrogen TestConfiguration 2
uCO* CI
I~.ca 0
ra: (t) --
- z
00,
00
i IIn
, NCOlOCP
I 0 3 II
Pump E i26
i=00
6 6 6 6 6 6; 6 6
Pump Efficiency
26

NASA CR-187117Ri/RD 87-164
Figure 16 - Low Thrust Hydrogen Testing
Configuration 2Cavitation Test 016027
PUMP DISCHARGE FLOWRA'E (GPM) OVERBOARD FLOWRATE (GPM)VS. INLET NPSH (FEET) VS. INLET NPSH (FEET)
16---------,- -71 2
1. L I I I- .-
1 . t it -2 --
0 800 1600 0 800 1600
PUMP ISENTROPIC HEAD (FEET) SHAFT SPEED (RP4)VS. INLET NPSH (FEET) VS. INLET NPSH (FEET)
4600- 6400---,- -
-- "* . . -. - SI
i'
m ,
'A I I
4000 03 ..0
3401 - 1 - 560- i r-0 800 1600 0 800 1600
27

NASA CR-187117
RI/RD 87-164
Table VI - Predicted Design Point Losses AS Percent of Input Power atOperating Wear Ring Clearances
Configuration 2
LiquidParameter Water HLdrogkn
Speed, RPM 24,500 77,000Flow Rate, GPM 5.0 15.7
Wear Ring Radial Clearance, InFront .0025 .0053Rear .0020 .00465
Losses as Percent of Input Power
Total Wear Ring Leakage 28.9 51.74Disk Friction 22.07 9.84Impeller Internal Friction 4.65 2.73Impeller Diffusion .71 .44Impeller Incidence .62 .34Impeller Exit Recirculation 0 0Vaneless Space Friction .77 .47Volute Momentum 1.28 1.00Volute Friction 3.78 2.37Volute Diffusion .22 .21
TOTAL 62.99 69.14
Predicted Efficiency, Percent 37.01 30.86
28

NASA CR-187117RI/RD 87-164
Table VII Design Point Pump EfficienciesConfiguration 2
Pe Water Test Hydrogen Test
Speed, RPM 24,500 77,000
Flow Rate, GPM 5.0 15.7
Average Wear RingClearance in .00225 .00498
Test Efficiency Percent 32.5 30.3
Predicted Efficiencyat Test Clearance Percent 37.01 30.86
Test Efficiency AdjustedTO .002" Radial WearRing Clearance 33.5 43.7
This flow is then routed to the impeller inlet. The pump isentropic head varies during the testdue to shaft speed variations and due to changes in the overboard flow rate. For positiveoverboard flows the head follows the shaft speed squared. As the overboard flow reverses, thehead is shown to decrease due to the mixing of the two flows.
Figure 17 is a re-plot of Figure 16, where the abscissa is pump flow over design flow. Theleft ordinate (Y-axis) is the head of the pump, and the right ordinate is the overboard flow.Results from three tests are plotted. The head from test 024 remains constant for all flows,and the overboard flow is always positive. Tests 026 and 027 have nearly constant head untilthe overboard flow becomes negative, that is, bearing cavity fluid mixes with the pump fluid.The pump efficiency characteristic also dropped off sharply at the corresponding pump flow atwhich the overboard flow became negative.
Pump cavitating performance can be characterized by the Suction Specific Speeds (Nss)parameter which is defined by the following expression:
Nss= iL 11 2
(NPSH) 3/Where N - Shaft Speed (RPM)
0 - Pump Inlet Flow (GPM)NPSH - Net Positive Suction Head at each data point (FEET)
For the hydrogen testing reported here, the cavitation performance capability of the pump isdefined as the Suction Specific Speed at which the head rise of the pump is 3% less than thenon-cavitating head rise.
Figures 18 and 19 are plots showing the increase in Nss as inlet NPSH was lowered during thetests. Figure 20 presents Nss as flow varied during the tests. Since inlet flow rate was
29

NASA CR-187117RI/RD 87-164
Figure 17 - Low Thrust Hydrogen TestConfiguration 2
Head-Flow Testing
Overboard Flow, GPM
L =L - 0. (
CD c
rn
_ 0:11 I Iz
-44
,o 0 0 ,10 0 0 o/
o o 0) 0
Z O
0 U) UT) ri00
0~E 1- 0 0:0 0 04. 4
:2:
Isentropic Head, Ft.
30
. . .... .~~~~~~~ ~~~~ • , ,,=,= in1 m i4 a n i l

NASA CR-187117
RI/RD 87-164
decreasing as NPSH was lowered, the Nss points reflect flow rates below the design point valuesfor the test speeds. In test 016026, the 3% head loss point occurred at an Nss of 9620 withthe flow at 65% of design. In test 016027, the 3% head loss point was at an Nss of 8800 withthe flow at 72% of design.
In Figure 21, the two Nss points which were obtained in the hydrogen tests are overlaid on aplot of Suction Specific Speed versus Flow Ratio from the water tests results given inReference 1. Note that the water test results were reported at 5% head loss conditions ratherthan the 3% conoitions for the hydrogen tests. Examination of the water head loss versus NPSHcurves showed relatively steep head drop-off such that the difference in water Nss between 3%and 5% is small. As shown in the figure, both of the hydrogen Nss points reflect better suctionperformance than water Nss at corresponding flow ratio conditions. This is expected because ofthermodynamic suppression head affects in hydrogen. With only two Nss points, anextrapolation of data to design flow conditions was not possible, especially since the two pointsby themselves indicate an erroneous Suction Specific Speed trend as flow ratio is increasedfrom 0.65 to 0.72 Q/Qd. The reason for the difference in calculated Nss magnitudes is believedto be due to the inability to obtain the accuracy in the pressure and temperature measurementsnecessary to determine NPSH levels.
As discussed above and shown in Figures 16 and 17, the head rise of the pump was decreasingduring the cavitation tests after pump inlet pressure became low enough to allow hydrogencoolant from the bearing cavity to mix with the inlet flow. Although a quantitative effect of theflow mixing on cavitation results is unknown, the coolant flow increases the volume flow andtemperature of the hydrogen at the impeller eye, both of which have an adverse effect oncavitation margin. As such, the reported Suction Specific Speeds are believed to beconservative.
DIFFUSION SYSTEM PERFORMANCE
A cross sectional view of the diffusion system for Configuration 2 is shown in Figure 22.Impeller flow discharges directly into a volute with a diffusing section at the volute exit.Because of the very small size, the volute flow area (for constant velocity) was made oversizeby the empirical factor given in Table I[. As a result there was recovery of static pressure inboth the volute and the volute exit section as shown in Figure 23 for the test at 80 percentdesign speed. Pump overall static head noted on the figure reflects measurements from alocation 20 diameters upstream of the impeller inlet to a location five diameters downstreamof the pump discharge. Impeller static head was measured from the same upstream station tothe impeller tip. The difference between the two indicates the conversion of impeller exitvelocity pressure into static pressure. System performance in hydrogen was similar to watertest results, i.e. good static pressure recovery with essentially no change in performance overthe range of test flow rate.
HYDRODYNAMIC LOADING
The scope of the program experimental effort included a study of pump axial and radialhydrodynamic loading. Pump internal static pressures were !,;ed to determine the pressuredistributions on the various pump parts. The pressures acting cver a known area are summedup to get the corresponding load. This section presents comparisons of the measured loads inboth water and liquid hydrogen.
31

NASA CR-187117RI/RD 87-164
Figure 18 - Low Thrust Hydrogen TestingConfiguration 2
Cavitation Test 016026, Shaft Speed 61,600 RPM
-12 INLET N55
9620
(aj.65)
D4
-1 44 -1 log
INLET NPSH (FEET)
NPSH AT 3% HEAD FALLOFF
32

NASA CR-187117
RI/RD 87-164Figure 19 - Low Thrust Hydrogen Testing
Configuration 2Cavitation Test 016027, Shaft Speed 61,600 RPM
Suction Specific Speed vs Inlet NPSH
tW -12 B---T NSS
2111111
So"[8800 4
( 0.72)
D
%m.
INLET NPSH (FEET)0 POpULS|II O lSII UIMIV, TUT INV-01 FE S4
I.
NPSH AT 31 HEAD rALLOrr
33

NASA CR-187117RI/RD 87-164
Figure 20 - Low Thrust Hydrogen Testing
Configuration 2Suction Specific Speed
U I'
V)
a. m~ 0,( 0
r) WI I
Z.
0
CnCP--
001
6
I . . ! • - I * • | . . . U)
0 0 oO ,,.
in in ino
Suction Specific Speed
34

NASA CR-187117RI/RD 87-164
Figure 21 Low Thrust Hydrogen Testing
Configuration 2Suction Performance FOR Hydrogen and Water
Cnr
• " I' T I I ,..
W)
U)
0rO4
zE
oo
0Cav
C-
I * I I _0 0 0 0 0 O0 (1) 0
Suction Specific Speed
35

i'JASA CR-187117RI/RD 87-164
Figure 22 -Diffusion System, Configuration 2
RADIUS ATTONGUE1.025 INCH
VOLUTE STATICPR~ESSUJRE TAPS(4 PLACES)
30
VOLUTEto DISCHARGE
2 70' X_____ ____ ___
IMPELLER TIPDIAMETER2.000 INCH
180*
36

NASA CR-187117RI/RD 87-164
RaainLoad The radial load acting on the impeller is determined by integrating theimpeller tip static pressure over the circumferential area. The impeller tip pressures werenot measured directly, but measurements were made at four equally spaced locations aroundthe outer diameter of the volute (Figure 22). The static pressure at the impeller tip wasderived from these four measurements by assuming that the flow from the impeller o.d. to thevolute o.d. follows the free vortex relationships.
The static pressure rise to the volute measurement stations were shown in Figure 23. As canbe seen, the pressures are increasing with increasing angle. This is a consistent distributionfor a volute that is larger in area than required for passing the flow. This distribution willyield a load acting to push the impeller towards the 90 degree side (a pressure distributionthat is linear with angle would act exactly towards 90 degrees)
With only four measurements, the accuracy of a calculated angle would not be expected to bevery good. The angle calculated was actually between 90 and 180 degrees which is the rightgeneral trend. The scaled magnitude of the radial load in hydrogen is shown in Figure 24 basedon operation at full speed (77,000 RPM). Also shown are the water test results fromreference 1. All three sets of data are seen to be in good agreement when hydrogen results arescaled to consistent conditions. The data show that the volute size is large enough to pass amuch larger flow than the pump design flow without introducing significant radial load. This isanother reason that small pumps like this should have ar' oversized volute.
AxialJLoad The axial load is determined from the measured static pressure distributionon the front and rear impeller face and by the impeller inlet pressure. The front face hasthree static pressure taps located at the impeller tip, at the wear ring diameter and at alocation mid-way between these two. The rear face has two static pressure taps. These arelocated at the tip and at the wear ring diameter. The fluid pressures in the shroud areas are afunc, in of the effective tangential velocity in the region which is typically defined by a factorK which is the ratio of fluid velocity to wheel speed at any given radius (for the limiting case ofpure forced vortex motion K=1.0).
The shroud K-factors calculated from the measured static pressures are all higher thanexpected. The rear shroud K factor averages approximately 0.75 aid the front shroudapproximately 0.73. From experience on similar small scale turbopumps (MK-51 fuel andoxidizer pumps) the K-factors are characteristically high. A possible explanation is therelatively large impeller tip shroud thickness which increases the tangential velocity of thefluid entering the shroud cavity. Also, the boundary layers on the small size impeller would belarger leading to high tangential velocities, and the wear ring flow is primarily derived fromthese boundary layer flows.
The axial load at design speed and flow rate on the front and rear shrouds are 570 lb and 552lb, respectively givinq an unbalance of 18 lb. The pump inlet pressure at 80.3 psig adds to theshroud imbalance by a 59 lb load. The remaining loads on the pump and turbine are relativelysmall compared to these loads. The turbine, operating at full admission, contributes less thanone lb axial load. The net axial load of 77 lb is primarily a function of the pump inlet pressure(contributing 77% of the total load).
37

NASA CR-1871 17RI/RD 87-164
Figure 23 - Low Thrust Hydrogen TestingConfiguration 2
Pump Impeller, Volute Head vs Flow
I~C I II
0 co 0
1c
0
CL-2UvE -R C
00
to IM .4cU~
o 0 0 0L0 0 0 0 0
o 0 0 0C 0 0 0 00 0 0 0 0 0 0
Head, Feet
38

NASA CR-187117RI/RD 87-164
Figure 24 - Low Thrust Hydrogen Testing
Configuration 2 Radial Load
OLJ
W -W
4000
z
S -. . . .. . . . . . . . . . . . . .
cc
0
L-
M d
r4c
0
C4
• , , . • I , . , I , I " " * I 00 LC 0 U) o) U1)o
Radial Load, lbs.
39
NASA CR-187117
RI/RD 87-164
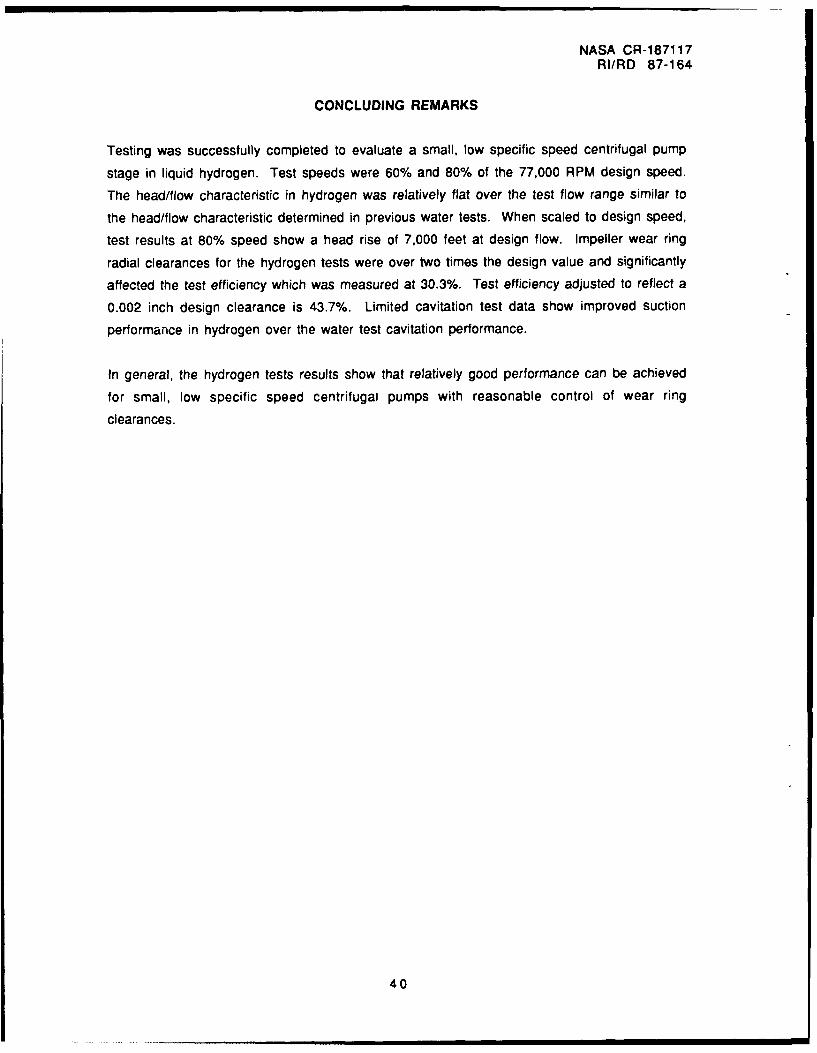
CONCLUDING REMARKS
Testing was successfully completed to evaluate a small, low specific speed centrifugal pump
stage in liquid hydrogen. Test speeds were 60% and 80% of the 77,000 RPM design speed.
The head/flow characteristic in hydrogen was relatively flat over the test flow range similar to
the head/flow characteristic determined in previous water tests. When scaled to design speed,
test results at 80% speed show a head rise of 7,000 feet at design flow. Impeller wear ring
radial clearances for the hydrogen tests were over two times the design value and significantly
affected the test efficiency which was measured at 30.3%. Test efficiency adjusted to reflect a
0.002 inch design clearance is 43.7%. Limited cavitation test data show improved suction
performance in hydrogen over the water test cavitation performance.
In general, the hydrogen tests results show that relatively good performance can be achieved
for small, low specific speed centrifugal pumps with reasonable control of wear ring
clearances.
40

NASA CR-187117
RI/RD 87-164
REFERENCE:
1. Furst, R.B.: Small Centrifugal Pumps for Low-Thrust Rocket Engines - Interim Report.NASA R 174913, Rockwell International, Rocketdyne Division, March 1986.
41

1. Report No 2. Government Accession No. 3. Recipient's Catalog No.NASA CR-187117
4. Title and Sublille S. Report Date
Hydrogen Test of a Small, Low Specific Speed May 1991
Centrifugal Pump Stage 6. Performing Organization Code
7. Autnoris, 6. Performing Organization Report No.
Rocketdyne Engineering RI/RD 8T-164
10. Work Unit No.
YOS 14499. Performing Organization Name and Address
Rocketdyne Division 11. Contract or Grant No.
Rockwell International NAS3-23164
6633 Canoga Avenue
Canoga Park, CA 91304 13. Type of Report and Period Co&vred
12. Sponsoring Agency Name and Address Contractor Report
National Aeronautics and Space Administration Final
Lewis Research Center 14 Sponsoring Agency Code
Cleveland, Ohio 44135-3191
15. Supplementary Notes
Project Manager: G. Paul RichterNASA - Lewis Research CenterCleveland, Ohio 44135
16. Abstrac
A small, low specific speed (430 RPM*GPM"A*0.5/FT**0.75) centrifugal pump
stage with a 2 inch tip diameter, 0.030 inch tip width shrouded impeller
and volute collector was tested with liquid hydrogen as the pumped fluid.
The hydrodynamic design of the pump stage is summarized and the noncavi-
tating and cavitating performance results are presented. Test speeds were
60% and 80% of the 77,000 RPM design speed. Liquid hydrogen test results
are compared with data from previous tests of the stage in water.
17. Key Words (Suggested by AuthOr(S)) 1. Distribution Statement
Low-Thrust Rocket Engine Pumps Unclassified - Unlimited
Low Specific Speed Pumps Subject Category - 20Centrifugal PumpsHydrogen Pumps
19. Security Classf (of this report) 120. Security Cusif. (of this pep) 21. No. of pages 22. frce"
Unclassi fied Unclassified 46 A03
For sale by the National Technical Information Service. Springfield, Virginia 22161