Embed Size (px)
Citation preview

Report No.AD-A231 004
SIDE-BY-SIDE SEAKFEPING AND POWER PLANTCOMPARISONS OF THE SURFACE EFFECT SHIPS (SES)
USCGC SEA HAWK AND USN SES-200
Thomas Coe
U.S. Coast GuardResearch and Development Center
Avery PointGroton, CT 06340-6096
FINAL REPORTJUNE 1990 D TIC
This document is available to the U.S. public through theNational Technical Information Service, Springfield, Virginia 22161
Prepared for:
U.S. Department Of TransportationUnited States Coast GuardOffice of Engineering, Logistics. and DevelopmentWashington, DC 20593-0001

NOTICE
This document is disseminated under the sponsorship of theDepartment of Transportation In the Interest of informationexchange. The United States Government assumes noliability for Its contents or use thereof.
The United States Government does not endorse products ormanufacturers. Trade or manufacturers' names appear hereinsolely because they are considered essential to the object ofthis report.
The contents of this report reflect the views of the CoastGuard Research and Development Center, which isresponsible for the facts and accuracy of data presented.This report does not constitute a standard, specification, orregulation.
/ ;0
ISAMUEL F. POWEL, IlITechnical DirectorU.S. Coast Guard Research and Development CenterAvery Point, Groton, Connecticut 06340-6096
0 V 1A
n -4 CO, --1'4j. : o.

Technical Report Documentation Page1. Report No. 2. Government Accession No. 3. Recipient's Catalog Njo,
CG-D-19-901
4. Title and Subttle 5. Report Date
Side-by-Side Seakeeping and Power Plant June 1990Comparisons of the Surface Effect Ships 6. Performing Organization Code
(SES) USCGC SEA HAWK and USN SES-200
8. Pertorming Organization Report rjoThomas Coe
R&DC 06/90
9. Performing Organization Name and Address 10. Work Unit No. (TRAIS)
United States Coast GuardResearch and Development Center I 1. Contract or Grant Nc.
Avery PointGroton, CT 06340-6096 13. Tye of eport and Period Co3erec
12. Soonsoring Agency Name and Address
Department of Transportation FinalU.S. Coast GuardOffice of Engineering, Logistics and 14. Soonsoring Agency Ccce
Development, Washington, D.C. 20593-0001
15. Supplementary Notes
16. Abstract
The performance characteristics of the U.S. Coast Guard 110'Surface Effect Ship (SES) CGC SEA HAWK and 160' U.S. NavySES-200 are documented and compared. Engine performance incalm water and side-by-side rough water seakeeping performancetests were conducted in the Atlantic Ocean south of Key West,Florida. The SES-200 ride control system was evaluated inthe seaway. The NASA Ride Quality Meter and Bruel and KjaerHuman Response Vibration Meter are compared and were utilized'.to document the discomfort level and human fatigue on boardthe SEA HAWK.
i7. Key Words 18. Distribution Statement
Surface Effect Ship Seakeeping Document is available to the U.S.SES, SES-200 USCGC SEA HAWK public through the NationalSide-by-Side Ride Control Technical Information Service,Technical Evaluation System Springfield, VA 22161
19 Security Classif. (of this report) 20. SECURITY CLASSIF. (of this page 2 t No. of Pages 12 Price
Unclassified Unclassified
Form DOT F 1700.7 (8/72) Reproduction of form and completed page Is authorized.iii

COa) -Cl, >1
E~ 0
0 0 Q C
c-) cl) 04 (D (D:
0 -J w
LU LUI.2ccLU
LfD
>~o >- -
EE 0
CC E~E - Lm v
Cia)4) g, EEE-EE
0 EE 01 ,U. .a,. 2 c LL
w LU
LL C1
C
0 9 4321 1 inhs
E~a u . . i
E a)
ILL Z z a N0 )a
E E>E o0 m*6 8w - (D 2 26, a = == u
1.2 c cv

Table of Contents
Page
INTRODUCTION................................................ 1
BACKGROUND AND DESCRIPTIONS................................ 1
TESTS AND DATA COLLECTION................................... 3
Tests................................................... .. 7
qData Colle-ction......................................... .. 7
Engin..-: Performance............................ ......... .. 7
Hors .power......................................... ..... 10
Fuel Consumption/Range.......................... ..... .. 13
Noise Levels................. ......... ................ .. 15
Tactical Data (USCGC SEA HAWK)................... ...... 19
Side-by-Side Seakeeping........................ ....... ..22
USCGC SEA HAWK Ride Quality Evaluation................. 31
ISO Fatigue Standard ................................ ..33
NASA Discomfort Standard................ ............. .. 37
SES-200 Ride Control System Evaluation............... .. 40
SUMMARY..................................................... 48
UPDATE....................................................... 51
RECOMMENDATIONS..................... .............. ......... 58
ACKNOWLEDGEMENTS............................................ 59
REFERENCES................................................... R-i
APPENDIX A - DESCRIPTION OF INSTRUMENTATION................ A-1
APPENDIX B - TABULATED DATA................................ B-1
APPENDIX C - NASA RIDE QUALITY MEASUREMENTS ON BOARDCOAST GUARD VESSEL SEA HAWKHHHHHHHHHHHHHC-i
Accession ForNTIS C:PA&lDTIC TAB
Unanno~inc ed
Dist Spocial
7,
. c.

List of Illustrations
Figure Page
1 SES Plan and Profile Views ............................. 6
2 Block Diagram of Data Acquisition Systems onBoth Vessels ............................................ 9
3 Propulsion System with Torque and RPM MeasurementInstrumentation ........................................ 11
4 Comparison of Shaft Horsepower ........................ 12
5 Total Fuel Consumption vs Speed ...................... 14
6 Range vs Speed .. ....................................... 16
7 Endurance vs Speed ..................................... 17
8 Fuel Efficiency vs Speed .............................. 18
9 Sound Level Exposure Limits for Selected Compartments. 20
10 Typical Turning Path Plot of CGC SEA HAWK ............ 2'.
11 CGC SEA HAWK Sensor Locations ......................... 24
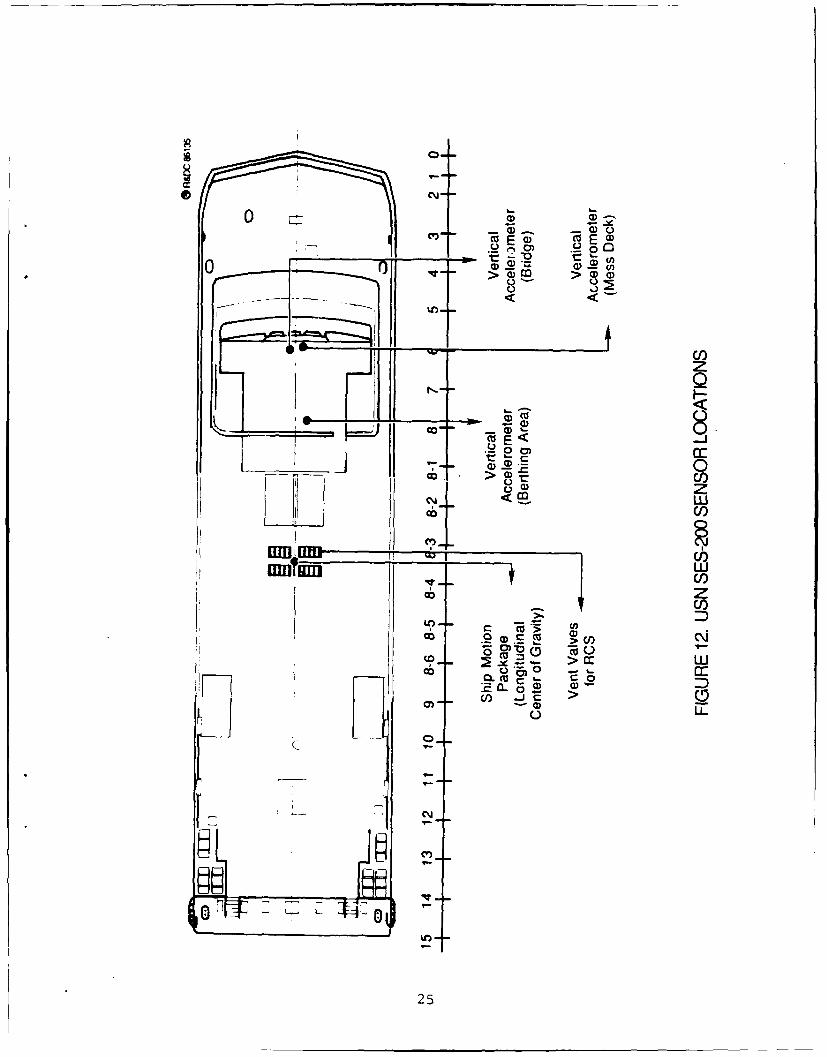
12 USN SES-200 Ser.sor Locations .......................... 25
13 Polar Plot Comparison of Roll Angle in 4 Ft. Seas,31 January 1985 .. ...................................... 27
14 Polar Plot Comparison of Pitch Angle in 4 Ft. Seas,31 January 1985 .. ...................................... 28
15 Polar Plot Comparison of Heave Acceleration in 4 Ft.Seas, 31 January 1985 ................................. 29
16 Bridge and CG Accelerations Compared in 3.4 Ft. HeadSeas, 2 February 1985 .................................. 32
17 Vertical "Longitudinal" Acceleration Limits as aFunction of Frequency and Exposure Time ............... 34
18 SES-200 RCS Effect on Heave Spectrum at cg in 3.9 Ft.Seas ................................................... . 45
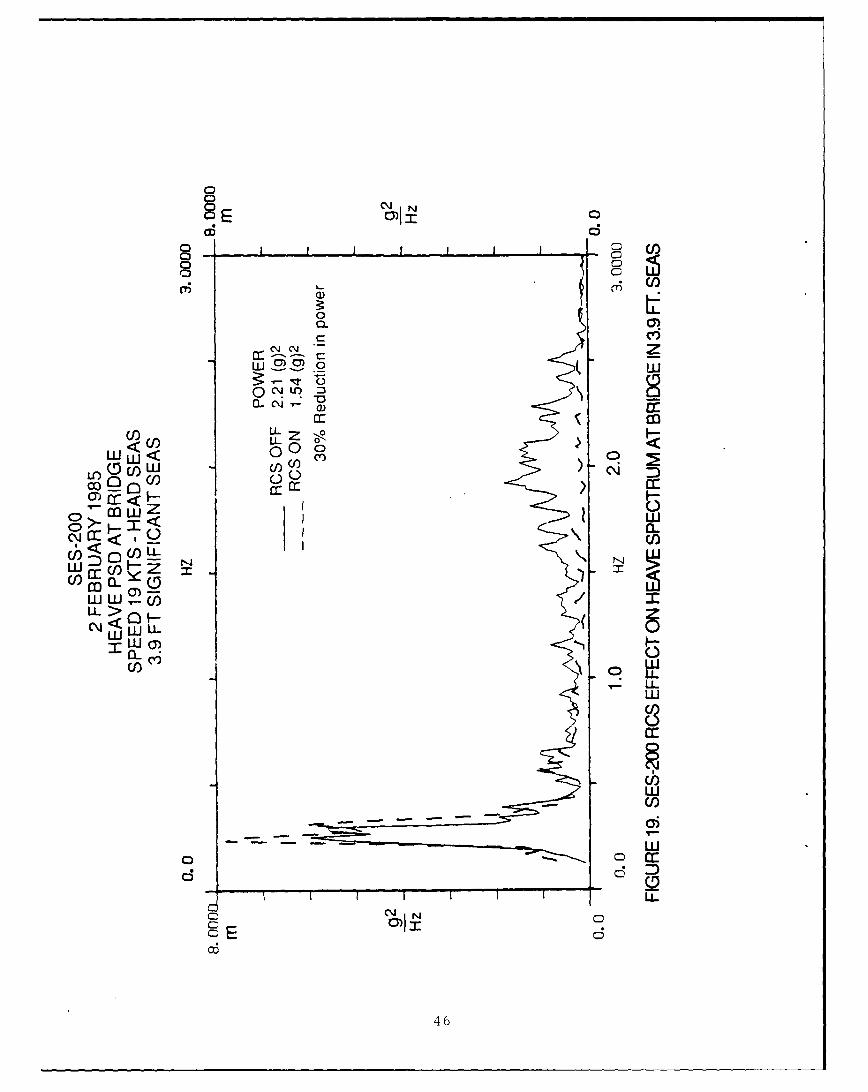
19 SES-200 RCS Effect on Heave Spectrum at Bridge in3.9 Ft. Seas .. ......................................... 46
20 SES-200 RCS Effect on Heave Spectrum at Bridge in6.4 Ft. Seas ............................................ 47
vi

List of Illustrations (Cont'd.)
Figure Page
21 Exposure Limits RCS ON vs RCS OFF................. 53
22 Vertical Heave, RCS ON............................. 54
B-XIX Wave PSD Plot, 4.4 Ft. Seas, 27 January 1985........B-19
B-XX 3-D Directional Wave Plot, 4.4 Ft. Seas,27 January 1985.................... ................. B-20
B-XXI Wave PSD Plot, 2.2 Ft. Seas, 28 January 1985........B-21
B-XXII 3-D Directional Wave Plot, 2.2 Ft. Seas,28 January 1985..................................... B-22
B-XXIII Wave PSD Plot, 4.0 Ft. Seas,31 January 1985..................................... B-23
B-XXIV 3-D Directional Wave Plot, 4.0 Ft. Seas,31 January 1985.....................................B8-24
B-XXV Wave PSD Plot, 6.4 Ft. Seas,31 January 1985...................................... B-25
B-XXVI 3-D Directional Wave Plot, 6.4 Ft. Seas,31 January 1985..................................... B-26
B-XXVII Wave PSD Plot, 3.9 Ft. Seas,2 February 1985..................................... B-27
B-XXVIII 3-D Directional Wave Plot, 3.9 Ft. Seas,2 February 1985..................................... B-28
vii

List of TablesTable Pg
I Comparison of USCGC SEA HAWK (WSES-2) andUSN SES-200 Principal Characteristics.............. 4-5
II Tests Conducted..................................... 8
III Summary of Human Response Vibration MeterMeasurements on the CGC SEA HAWK StarboardBerthing Area...................... ................ 36
IV RCS Effectiveness on the SES-200................... 43
V RCS Heave Reduction................................ 52
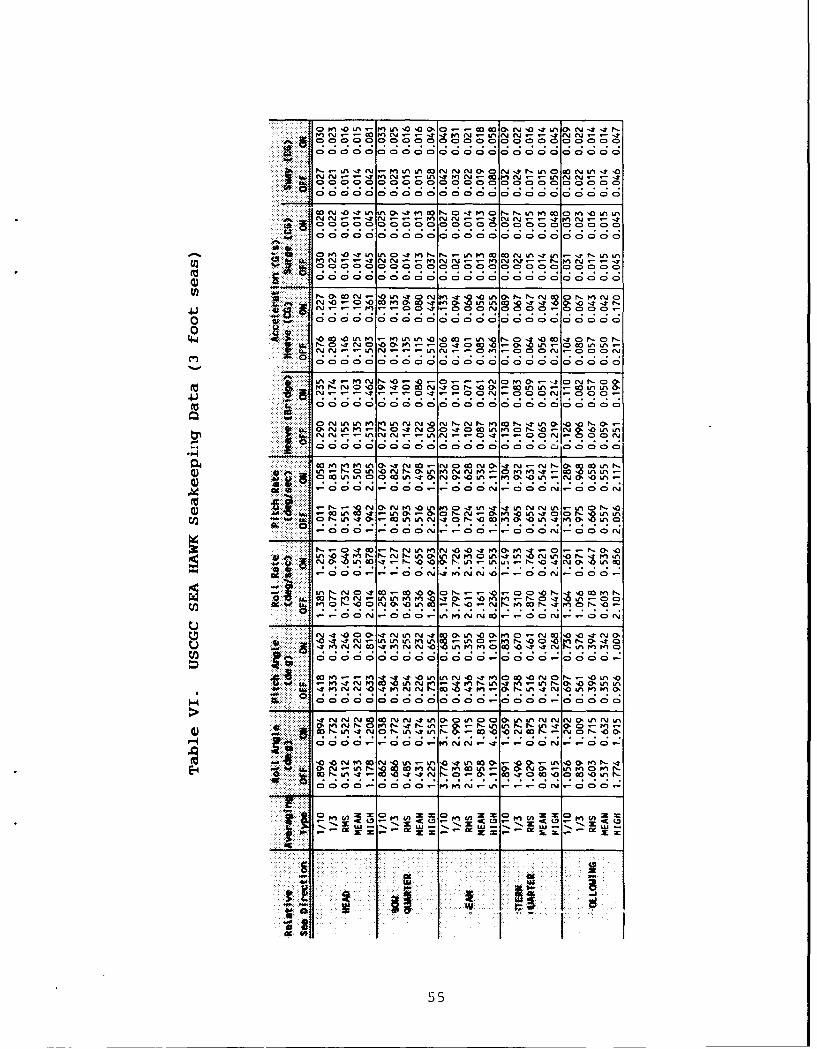
VI USCGC SEA HAWK Seakeeping Data, 3 Ft. Seas...... ..55
VII USCGC SEA HAWK Seakeeping Data, 6 Ft. Seas ......... 57
B-I USCGC SEA HAWK Speed Power......................... B-1
B-Il SES-200 Speed Power................................ B-2
B-Ill USCGC SEA HAWK Fuel Consumption With Two Lift
Engines............................................. B-3
B-IV SES-200 Fuel Consumption With Four Lift Engines. B-4
B-V USCGC SEA HAWK Range and Fuel Efficiency Data B-5
B-VI SES-200 Range and Fuel Efficiency Data ............ B-6
B-VII Noise Levels USCGC SEA HAWK (WSES-2).............. B-7
B-VIII Noise Levels USN SES-200.......................... B-8
B-IX USCGC SEA HAWK (WSES-2) Tactical Data............. B-9
B-X USN SES-200 Tactical Data......................... B-10
B-XI USCGC SEA HAWK Seakeeping, 3.5-4.4 Ft.
Significant Seas, 27 January 1985................. B-11
B-XII SES-200 Seakeeping, 3.5-4.4 Ft. Significant Seas,27 January 1985.................................... B-12
B-XIII USCGC SEA HAWK and SES-200 Seakeeping, 2.2 Ft.
Significant Head Seas, 28 January 1985............ B-13
B-XIV USCGC SEA HAWK Seakeeping, 4.0 Ft. Significant
Scas, 31 January 'OAR .................................... B-14
viii

List of Tables (Cont'd.)Table Paae
B-XV SES-200 Seakeeping, 4.0 Ft. Significant Seas,31 January 1985.................................... B-15
B-XVI USCGC SEA HAWK and SES-200 Seakeeping, 6.4 Ft.Significant Seas, 31 January 1985................. B-16
B-XVII USCGC SICA HAWK Seakeeping, 3.4-3.9 Ft.Significant Seas, 2 February 1985................. B-17
B-XVIII SES-200 Seakeeping, 3.4-3.9 Ft. Significant Seas,Seas, 2 February 1985.............................. B-18
ix

[BLANK]

INTRODUCTION
The U.S. Coast Guard Office of Research and Development is in
the process of evaluating advanced surface craft concepts as
well as documenting the performance of present cutters to
support the vessel aquisition process. The Coast Guard Research
and Development Center has been directed under the Advanced
Marine Vehicle (AMV) Project's 9207.2 Ship Test and Evaluation
element to conduct simultaneous technical evaluations on t;*;o
surface effect ships (SES). Side-by-side seakeeping and caIm
water power plant performance tests were conducted on the USN;
160' SES-200 and USCG 110' CGC SEA HAWK (WSES-2) in the Atlantic
Ocean south of Key West, Florida. An evaluation of the ride
control system on the SES-200 was required to assess the utility
of adding a similar system to a 110' Coast Guard SES in order to
improve ride quality and reduce high frequency vertical
accelerations which cause crew fatigue.
This data will be incorporated into the AMV data base to support
the vessel evaluation and acquisition process. Performance
information will also be utilized by headquarters personnel when
evaluating proposed craft in the upcoming patrol boat and buoy
tender replacement efforts. The Research and Development Center
will also utilize the data as input for various operations
analysis computer models which evaluate a vessel's ability to
perform Coast Guard missions.
BACKGROUND AND DESCRIPTIONS
Surface Effect Ships (SES) are a catamaran-type hull which can
operate at low speeds on its two side hulls like a displacement
ship or cushionborne by pressurizing the region between the side
hulls with air. When cushionborne the ship partially rides on
its side hulls and on a drag-reducing cushion of air contained
by the sidehulls and flexible bow and stern seals. When
cruising on cushion the center portion of the hull is clear of

the water and supported by the air cushion and some reduced
buoyancy from the side hulls. This configuration reduces the
wetted surface area and thus decreases the resistatice enabling
higher speeds.
The air cushion exerts both a lift and a drag force on the hull
as it moves over the water surface. The drag force, known as
cushion wave making drag, represents a significant percentage
of total SES resistance and hence, the required propeller
thrust. Selection of cushion length-to-beam proportions is a
fundamental part of SES design because the ratio of these
dimensions determines the wave making resistance character-
istics.
The Navy has been conducting research on the effect of
length-to-beam proportions on SES performance, seakeeping and
maneuvering since 1970. For ocean capable vessels, research
showed that length-to-beam ratios of 4 to 1 or greater offer
efficient operation at task force speeds without compromisirj
the SES advantage of operating at significantly higher speeds.
This balanced performance is attributable to shifting the peak
of the high wave drag region known as "hump" to higher speeds
outside the operating envelope. The name "High Length-to-Beam
SES" has been given to these vessels to distinguish them from
the previous generation of Navy SES which had lower
length-to-beam ratios and has to be propelled through a high
drag speed regime in order to attain efficient cruise speeds.
The three 110' Coast Guard SES's are classified as low
length-to-beam ratio vessels with a ratio of 2.65.
To validate high lngth-to-beam research, the Navy procured a
110' commercial Bell Halter, Inc. (BH) SES, the same class
vessel the Coast Guard later purchased. After extensive
testing, the Navy increased its length-to-beam ratio from 2.65
to 4.25 by installing a 50' hull extension amidships. This
vessel is the SES-200.
2

The Coast Guard tested the Navy 110' SES in 1981 before it was
extended to 160' (Reference 1). Subsequently, three 110' Bell
Halter, Inc. SES's were purchased by the Coast Guard and placed
into service in the newly formed SES Division out of Key West,
Florida. These vessels have the same main engines as the
SES-200 and a low cushion length-to-beam ratio of 2.65 compared
to 4.25 of the SES-200. The CGC SEA HAWK must be propelled
through hump (22 knots) in order to reach design speed of 28
knots while the SES-200 operates below the high wave drag hump
speed which is in the 30+ knot range. The SES-200 has four lift
engines, and the SEA HAWK has two of the same make and
horsepower. Of the four fans driven by the lift engines on the
SES-200, two are identical to the two centrifugal fans installed
on the SEA HAWK.
Powering and seakeeping performances of the SES-200 and CGC SEA
HAWK can be easily compared because they have identical power
plants, seal systems, and midship section hull shapes. The
propellers are slightly different. The m. or differences are
the length-to-beam ratios, displacement, range and lift engine
configuration where the SES-200 has two more lift engines which
were added to support a larger cushion volume and displacement.
A comparison of the principal characteristics and plan and
profile views of the CGC SEA HAWK and SES-200 aie presented in
Table I and Figure 1.
TESTS AND DATA COLLECTION
The objective of this side-by-side technical evaluation was to
quantify and compare the calm water power plant and rough water
seakeeping performance of the two vessels. An evaluation of the
USN SES-200 ride control system (RCS) was also conducted during
all seakeeping tests. A similar RCS is being considered for
installation on one of the Coast Guard SES's. Human response to
ship motions were studied mainly on the CGC SEA HAWK.
3

TABLE I
COMPARISON OF USCGC SEA HAWK (WSES-2) AND USN SES-200PRINCIPAL CHARACTERISTICS
LIST OF PARTICULARS
Type CGC SEA HAWK USN SES-200
Length, Overall 109 ft. 3/4 in. 159 ft. 1 in.
Beam, Overall 39 ft. 0 in. Same
Length, Cushion 83 ft. 2-1/2 in. 133 ft. 4 in.
Beam, Cushion 31 ft. 9-1.2 in. Same
Cushion Length/Beam Ratio 2.65 4.25
Cushion Area 2644 ft.2 4236 ft. 2
Max. Draft, On Cushion3.5 Deg. Bow-up Trim 5 ft. 6 in. Same
Max. Draft, Off CushionMax., 0 Deg. Trim 9 ft. 3 in. Same
Displacement, Light 130 long tons 150 long tons
Displacement, Max. 150 long tons 205 long tons
Fuel Capacity (100%) 23.8 long tons 59.6 long tons(7342 gal.) (18,389 gal.)
Design Speed, On Cushion 30 knots, sea state 0 Same25 knots, sea state 3
Design Range, On Cushion 1100 nm in sea state 3 2200 nm in seastate 3
Hull Construction Welded Aluminum (5086) Same
Crew 18 (2 officers, I chief petty Sameofficer, 15 enlisted)
Main Engines Two Detroit Diesel 16V-149TI Same1600 shp at 1900 rpm
4

TABLE I (continued)
LIST OF PARTICULARS
Type CGC SEA HAWK USN SES-200
Reduction Gears Two ZF Model BW455, 2:1 ratio Same
Propellers Two Three-bladed 42" dia by Two three-bladed 40" dia49" pitch by 48" pitch
Lift Engines Two GM 8V-92 diesel Four (Same)350 shp at 2100 rpm
Lift Fans Two Bell 40" dia Two (Same)centrifugal fans
Two Neu LILLEFRANCE rotatingdiffuser fans
Bow Seals Two-dimensional elastomer- Samecoated fingers (8 total)
Stern Seals Three lobe elastomer- Samecoated bag
Steering Twin rudder, differential Samethrust and reverse withpropellers
5

00)
CGC SEA HAWK
15 4 13 12 1 110 9 8-6 8-5 8-4 8-3 82 8- 8 7 6 5 210
15 14 13 12 1110 9 8-6 8-5 8-4 8-3 8-2 8-1 8 7 6 5 4 3 21 0
SES-200
FIGURE 1. SES PLAN AND PROFILE VIEW
6

Tests
Tests defined herein are referenced by number relating to
the USCG Research and Development Center's "General Test Plan
for Marine Vehicle Testing (GTP)". Table II is a list of all
tests conducted during the technical evaluation. Details of the
test procedures can be seen in the GTP (Reference 2).
Data Collection
Data was collected utilizing identical sensors and data
Oacquisition systems on both vessels. A computerized data
acquisition system with analog tape recorder backup was used to
collect ship motion, cushion pressure, shaft rpm, torque and
horsepower information. Sound level readings and in-line fuel
flow measurements were recorded by hand. Human responses to
ship motion were measured two ways each with self-recording and
documenting capability. Two engineers from the National
Aeronautics and Space Administration (NASA) conducted measure-
ments on the SEA HAWK using their ride quality meter. The
second method utilized International Standard Organization (ISO)
vertical acceleration standards. A directional wave buoy was
deployed from the SEA HAWK before and after seakeeping tests.
It transmitted wave height and buoy tilt North-South and
East-West to the receiver on the vessel. On board SEA HAWK, a
microcomputer analyzed the buoy data for significant wave height
directionality and frequency components of the wave field. This
directional information assisted the test directors in choosingthe desired headings during seakeeping runs. Figure 2 presents
the data acquisition equipment systems used on both vessels.
Test equipment specifications are listed in Appendix A.
Engine Performance
Main engines and lift engines were outfitted with in-line
fuel flow meters. Flow into and return flow from the diesels
7

TABLE II
TESTS CONDUCTED
GTP Test No.Description
1 Principal Characteristics
13* Side-by-side motions in waves and in calm water.Wave heights 3-6 feet at the maximum sustained speed of theslowest vessel approximately 23 knots. -These tests wereconducted with and without the ride control system activated onthe SES-200. Vertical accelerations on the bridge, Center ofGravity (cg), berthing area and mess deck on both vessels weremeasured along with roll and pitch angles and rates.
38 Cushion pressure (concurrent with ship motions runs).
3 Speed vs Power in calm water.
4 Fuel consumption and endurance in calm water
37 Human fatigue response to ship motions. Twodiscomfort standards were utilized and results compared usingthe NASA ride quality meter and the Bruel and Kjaer Humanresponse meter on the CGC SEA HAWK.
24 Noise levels (concurrent with speed and power tests).
7 Tactical Data (USCGC SEA HAWK only)
* Tests conducted side-by-side
8

Port StarboardAcurex 1202A Acurex 1202A
HORSEPOWER HORSEPOWER
METER METERShaft Torque Shaft Torque
RPM RPMHorsepower Horsepower
ANALOG TAPECOMPUTER DATA ACQUISITION RECORDER
Hewlett Packard BACKUPHP 9920S Computer (200 Series) Store 14D
HP 3497A Scanner 14 ChannelHP 3437A Voltmeter FM Recorder
tData Acquisition System
VERTICAL ACCELEROMETERS SHIPAND CHARGE AMPLIFIERS (B&K) MOTION PACKAGE*
Bridge Pitch, roll, yaw anglesMess Deck and rates, surge,
Berthing Area sway and heaveCenter of Gravity (CG) accelerations
Additional instruments manually read or internally recorded
Bruel & Kjaer Hedland Bruel & Kjaer**Sound In line fuel Human response
level meter flow meters vibration metertype 2113 H
NASA RIDE Transmits wave heightMTER*" and buoy tilt,
I T east/west andENDECO north/south.OTRNA-- Receiver DC
ICompute r H (On board (Wave..buoy/
SEA HAWdrcini
At Center of Gravity (CG) on SES 200At 10 ft forward of CG on CGC SEA HAWK
Ride quality meters were only utilized on the CGC SEA HAWK
Figure 2. BLOCK DIAGRAM OF DATA ACQUISITION SYSTEMS ON BOTH VESSELS
9

were measured and recorded for each rpm level incrementally
increased durina the power plant testing. Shaft torque was
measured with strain gauges epoxied to both main shafts at the
closest possible point to hull penetra-ion as seen in Figure 3.
The Acurex systeitt transmitted the torque signals fiom the shaft
to the antenna surrounding the shaft using FM telemetry and
processed the signals along with shaft rpm transducer outputs to
compute shaft horsepower. The system is calibrated utilizing a
shunt resistor simulating a known strain level across the strain
gauge bridge. Speed/power/fuel consumption tests were conducted
independently on both vessels in calm water. The horsepower (HP)
meters were transferred to the SEA HAWK after the SES-200 was
tested since only two HP meters were available for testing.
Horsepower
Both ships were at displacements considered medium to heavy
range during speed/power/fuel consumption tests. Shaft horse-
power tests verified that the SES-200 is operating below primary
hump speed as expected. The SEA HAWK, which is designed to
operate above hump speed at speeds greater than 22 knots, was not
able to exceed this speed. This has been a problem with the
three Coast Guard SES's which have been loaded down by additional
equipment and structural weight since their commissioning.
Although the 16V Detroit Diesels on both vessels are identical,
the SES-200 was able to extract more horsepower from them than
the SEA HAWK as seen in Figure 4 and Tables B-I and B-II. This
may be attributed to slightly different propellers and
hull/cushion resistance characteristics. The CGC SEA HAWK has
never attained more than 1300 shaft hp at 1617 rpm during this
and one previous evaluation on engines rated at 1600 shp at 1900
rpm. Recently after this evaluation, the engines were modifiPH
on all three Coast Guard SES's to obtain an additional 200 shp
each. The SES's can now routinely attain speeds of 26-30 knots.
10

U, - -- f UW Xa
a 0. inz z I
- z z 1w u
w 2 LL
~o
CD 0
w czm 0.
0.
W LI..
0.0
LI-L
L.LL
LL z IL ,
cc4cZ
w LL x 0I

CO
CL C
0 V0(A LCI0
4QQ12

Sidehull, rudder and seal drag on a SES typically increases
linearly with speed while cushion wave drag has one small
secondary hump and one large primary hump at a higher speed.
The secondary hump speed is seen in Figure 4 at 8-10 knots for
both vessels. The crest of the primary drag hump for the SEA
HAWK is seen at 18-22 knots.
During the two week test period, the SES-200 was able to go
approximately two knots faster than the SEA HAWK, while 50 foot
longer and 46 long tons heavier, for one main reason. The
SES-200 does not have to transit primary hump speed as the SEA
HAWK must at 22 knots, because its high cushion length to beam
ratio of 4.25 causes that hump to exist a speed above its design
speed (30+ knots). The geometry of the hull being 50 feet
longer allows it to plane out at approximately 1.5 degrees up by
the bow while the SEA HAWK planes at 3.5 degrees trim up. This
lower planing attitude may enable the propellers to be more
efficient in developing usable thrust on the SES-200.
Care should be taken to ballast the vessels properly to
adjust the longitudinal center of gravity to obtain optimum trim
operation. The 110' surface effect ship operator's manual
states: "For best performance and most comfortable ride, the
vessel should be loaded to place the longitudinal center of
gravity (cg) approximately 1.5 feet aft of amidships, and the
lateral cg on the centerline. This cg location will result in a
trim of 3 to 4 degrees bow up deck angle at cruise and zero
heel." Trim adjustments are controlled by ballasting and can
make the difference as to whether or not the vessel can transit
and remain above hump speed (22 knots).
Fuel Consumption/Range
As seen in Figure 5, the SEA HAWK consumes less fuel than
the SES-200 at low speeds; however, above 18 knots the SES-200
consumes less fuel. This relates to the hump drag speed which
13

0~0Q CN
0 wj
00
C)
K Dz,.
0 Lj
V) z
LLJ
:56 - .-
cn 14

the SEA HAWK must overcome in the 18-22 knot range in order to
get to the most economical operating speeds in the 23-28 knot
range. The SES-200 always operates at speeds below primary hump
speed which exists in the 30+ knot range.
When the Navy 110' SES-160 was stretched 50 feet and became
the SES-200, it was modified to carry an additional 11,000
gallons, 60% more fuel. This extra fuel capacity along with the
fuel efficiency gained due to reduced wave drag when the vessel
was lengthened provides the SES-200 with far superior range and
endurance over that of the CGC SEA HAWK as seen in Figures 6 and
7. This change also improved the ride quality and is discussed
in detail in the Side-by-Side Seakeeping section.
Fuel efficiency is defined here as the number of gallons
consumed per nautical mile traveled (gal/nm). Both SES's tested
exhibited small changes in fuel efficiency over their entire
speed range compared to conventional displacement hulls which
dramatically lose efficiency at high speeds. It is clear that
SES's should be operated at top speeds since there is not a
significant fuel efficiency advantage to run at moderate or slow
speeds. At speeds above 18 knots, the SES-200 is more fuel
efficient than the SEA HAWK, as seen in Figure 8. Fuel con-
sumption, range, and fuel efficiency data tables for the SEA
HAWK and SES-200 are presented in Appendix B, Tables B-III
through B-VI, respectively.
Noise Levels
A sound survey was conducted on both vessels during the
speed/power runs in calm water. Both vessels exceed OSHA
standards in all engine room and some living compartments at
high speeds. It may be prudent to have personnel sleeping in
after berthing compartments on the SEA HAWK wear some type of
ear protection during high speed transits. Additional sound
proofing of the bulkhead between the engine room and the berth-
15

C,
0(j) - 4
W/
CN
LL LU
CP- LiUV)( LL 0IJ
LLU
a..
0
o o1414 4l
00
Cl) -J -
U2
_ \1

0
00 V
z N
z I. tz W(I) zj I n
I-. V)
a- LLI0 LL
CI) /L
V) 2/5 LLL/
CI))
<00
z __ _ _ __ _ D
(04 0 0 I (N 0
17

0 'ACN
C)~C . Cl)
w00
(LU
LLLU
8 00
0) L LU- CL
- w
W LL
0 a-
LUU
C).
z /0 n z
Li
0 (M 00 r- (0 LO It C14N -
18
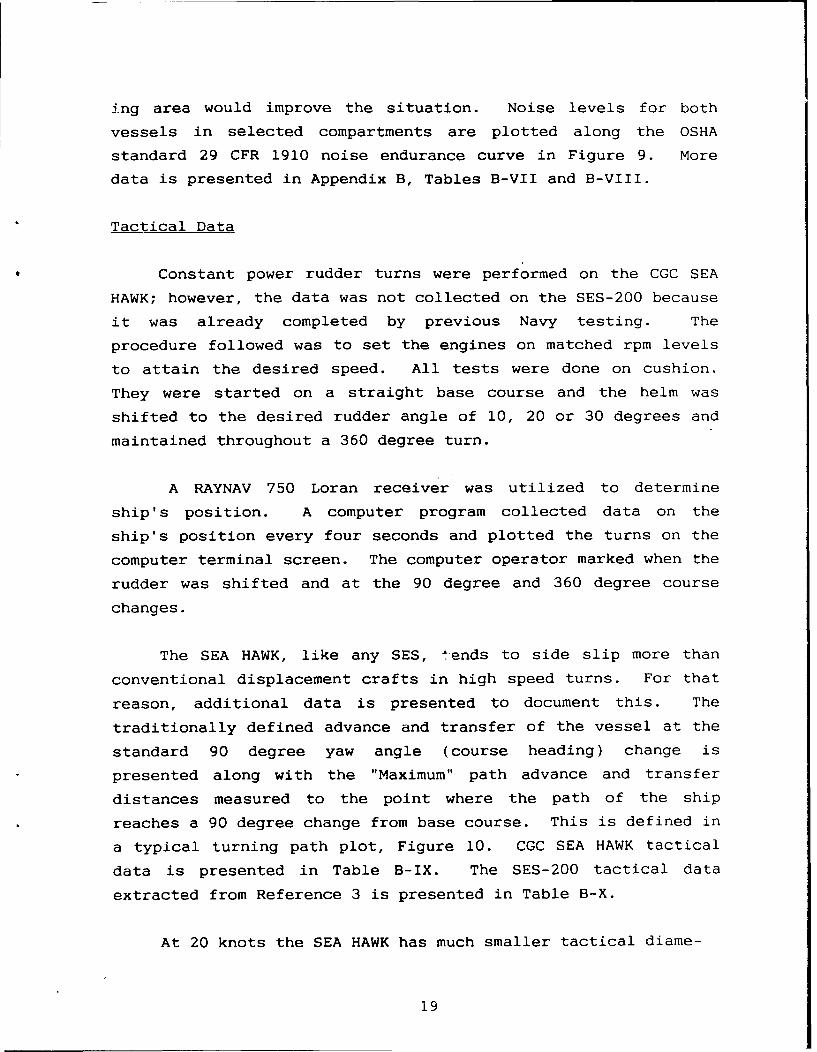
ing area would improve the situation. Noise levels for both
vessels in selected compartments are plotted along the OSHA
standard 29 CFR 1910 noise endurance curve in Figure 9. More
data is presented in Appendix B, Tables B-VII and B-VIII.
Tactical Data
Constant power rudder turns were performed on the CGC SEA
HAWK; however, the data was not collected on the SES-200 because
it was already completed by previous Navy testing. The
procedure followed was to set the engines on matched rpm levels
to attain the desired speed. All tests were done on cushion.
They were started on a straight base course and the helm was
shifted to the desired rudder angle of 10, 20 or 30 degrees and
maintained throughout a 360 degree turn.
A RAYNAV 750 Loran receiver was utilized to determine
ship's position. A computer program collected data on the
ship's position every four seconds and plotted the turns on the
computer terminal screen. The computer operator marked when the
rudder was shifted and at the 90 degree and 360 degree course
changes.
The SEA HAWK, like any SES, -ends to side slip more than
conventional displacement crafts in high speed turns. For that
reason, additional data is presented to document this. The
traditionally defined advance and transfer of the vessel at the
standard 90 degree yaw angle (course heading) change is
presented along with the "Maximum" path advance and transfer
distances measured to the point where the path of the ship
reaches a 90 degree change from base course. This is defined in
a typical turning path plot, Figure 10. CGC SEA HAWK tactical
data is presented in Table B-IX. The SES-200 tactical data
extracted from Reference 3 is presented in Table B-X.
At 20 knots the SEA HAWK has much smaller tactical diame-
19

(6eI) 73A31 GNflos G31HDI3M .HIC)
cu z
cu
z mULJ inU 10
U I0w
HD Hz LUow
Ou 0a
uL z L
LL (r
LLC)LLJ 0 Of
0 >wO C
LLLU
z~ ow Ho Z xEcrLU 0 LUJ
cc 0D 00 D
LU F- 0 CZ CCC
0z U)
- - -
(SC) -13A37 QNflos QILHDI3M 1 H
20

Tactical Diameter(230 m)
Maximum Path Transfer(120 m)
Transfer (20 m) Position at 90" CourseChange from Base Course
* (41 sec.)
0
Maximum Path Advance(380 m)
0 Advanceg 0 0 Adas (330 m)
Position at 360" course changefrom base course (153 sec.)
V Initiate Rudder Over20" Left
Base Course(speed 16 kts)
FIGURE 10. TYPICAL TURNING PATH PLOT OF CGC SEA HAWK
21

eters than the SES-200. At 30 degrees rudder, SEA HAWK tactical
diameters are approximately 50% smaller, while at 10 degrees
rudder, the SEA HAWK has tactical diameters 70% smaller than
those of the SES-200.
Side-by-Side Seakeeping
The USCGC SEA HAWK and USN SES-200 were operated
side-by-side during four seakeeping test days. Identical sensor
packages and data acquisition systems were used on both vessels.
An Endeco directional wave buoy was deployed by the SEA HAWK
before and after each test period in order to define the wave
environment. The objective of these tests were to compare the
seakeeping characteristics of both vessels proceeding
side-by-side at the same cruise speed in five different
orientations to the major swell direction; head, bow quarter,
beam, stern quarter, and following seas. All seakeeping data is
presented in Appendix B, Tables B-XI to B-XVIII. Directional 3-D
wave energy and wave power spectral density (PSD) plots for each
seakeeping test are presented in Figures B-XIX to B-XXVIII.
The vessels proceeded side-by-side, 100 to 400 yards apart,
at the fastest speed attainable by both vessels (approximately 20
knots). Data was collected for 20 to 30 minutes during each of
the five seakeeping legs. The SES-200 ride control system (RCS)
was evaluated during these seakeeping runs by operating with the
system off for half of each leg of the course, then on. Although
data tables and graphs are presented here for both ride
conditions (RCS on and off), the discussion of RCS effectiveness
is presented in the section entitled "SES-200 Ride Control System
Evaluation". The RCS effects are not addressed in this section
so that there is a clear determination of the ride quality gained
by the larger length, displacement, and cushion length-to-beam
ratio of the SES-200 compared to the CGC SEA HAWK.
22

Sensors were placed on both vessels as indicated in Figures
11 and 12. The ship motion package on the SEA HAWK could not be
placed at the center of gravity (cg) because its large cables
could not be run through water-tight doors. It was placed ten
feet forward of the cg. In order to compensate for this, a
separate vertical accelerometer was placed at the cg. It is
assumed that surge and sway accelerations measured in the motion
package ten feet forward of the cg are not significantly
different from those at the cg.
In addition to the motion package sensors, accelerometers
were hard mounted vertically on the bridge, mess deck, berthing
area, and at the center of gravity as previously mentioned. In
this way, a comparison of motions at equivalent operational
sites on the vessels could be made. Note that the bridge, mess
deck, and berthing areas of the SES-200 are further away from
the cg when compared to those spaces on the SEA HAWK (shown in
Figures 11 and 12.) This is a result of the 50 foot section
which was added to the SES-200 just forward of the original 110'
configuration longitudinal center of gravity between frames 8
and 9.
There were some sensor malfunctions during the test period;
however, none made a significant impact on the seakeeping data
because redundant vertical accelerometers were utilized, as well
as a replacement ship roll angle gyro. Two vertical acceler-
ometers, located on the mess deck and berthing area on the
SES-200, did not operate properly. Since accelerometers at the
cg and bridge functioned well and bracketed the two
malfunctioning sensors located between them, there was no
significant loss of information. The roll angle sensor in the
SEA HAWK motion package was discovered drifting excessively
during the first test day underway. It was replaced by a backup
motion package roll angle gyro.
The first test day underway, 27 January 1985, was utilized
23

0)
2 a E
-a0) < =1Lco
.YoQ cD z.
> (
Lo
(D*1U)
1~ca uJE: a. a- :
>)- a 0
_o E o 4 -..
C2 Oj <
< C)
24
C cCD
CV)o
C/)z<
0Io >0 a)
C/)C6 z
cc > ll
00
25

as a shake down seakeeping cruise to check out all sensors, data
acquisition hardware and software. Although there were some
equipment problems this first day out, in addition to a
disrupted schedule because of a law enforcement case, some
useful data was collected at 18 knots in 3.5 to 4.4 foot
significant waves. This seakeeping data is presented in tabular
form in Appendix B, Tables B-XI and B-XII. Wave PSD and
direction data collected is presented in Figures B-XIX and B-XX
for 4.4 foot unidirectional seas.
The second seakeeping test day was conducted in relatively
calm water. For this reason, only head seas runs were conducted
on 28 January in 4 second period, 2.2 foot significant waves.
Seakeeping data for both vessels is presented in Table B-XIII.
Vertical accelerations at the cg on the SES-200 are
substantially less than compared to the SEA HAWK, even though
the seas were relatively calm. Wave PSD and direction plots are
presented in Figures B-XXI and B-XXII.
Seakeeping runs were conducted at 20 knots, in five
directions relative to the major swells, in 4.0 foot significant
seas on the morning of 31 January 1985. Results are presented
in Table B-XIV and Table B-XV. Roll, pitch, and heave on the
SES-200 were generally less than that on the SEA HAWK; however,
there are some exceptions at certain headings. Polar plots are
used to present a comparison of ride quality results relating to
ship motions at various headings relative to major swells.
Figures 13-15 graphically show the ship motion response to 4
foot seas of both vessels. Surge acceleration on the SES-200
was 4.5 to 5 times higher than that experienced on the SEA HAWK
in bow quarter and head sea runs. This was not expected. It is
unusual in ship tests to get higher surge accelerations than
vertical accelerations at the cg. This was very often the case
during the test period on the SES-200 in head and bow quarter
seas runs. Test team members noted that surgilig motion often
required them to hold on during seakeeping runs on the SES-200.
26

CE
LLU
U) -iD 0
-An
0 L0LULU
CE 0
o c
/ a.
_j m I
u i m CD u 9
'III
K~ z1
27.

DigI
C±D +0
* 07-
-m sCE I -
ci: Oco
F- cH-
0
- Lu4
C)u
C,)C0
28

VTO 1 Isi
LLi
U)LU wiu
zD U) --. w
- F- * LL0
/ - (5a )cr- In
I2JLLI W~ c u-j~ u
M -
zo 0z/
~Cl7
"lCu LL0LL D w
14,ELL- CM cw<m
X 29

The RMS surge on the SEA HAWK was 11% of its heave in head seas,
while surge was 127%, or 27% greater than the heave value on the
SES-200 at its cg. Wave PSD and direction information is
presented in Figures B-XXIII and B-XXIV. The seas were
multi-directional as seen in Figure B-XXIV.
The sea state increased the afternoon of 31 January, and
additional testing was completed in 6.4 foot significant
unidirectional seas, Figures B-XXV and B-XXVI. The three
dimensional directional wave data plotted in Figure B-XXVI shows
the unidirectional characteristics and wave period content of
the seas. Both vessels conducted head seas runs. The runs were
conducted thirty minutes apart because of engineering problems
on one vessel; however, they are compared since the sea state
did not substantially change in that short period of time. The
SES-200 continued to do additional seakeeping runs at other
headings in order to evaluate the ride control system in heavy
seas. All of the seakeeping data for both vessels is presented
in Table B-XVI.
VeLtical accelerations measured on the SEA HAWK increased
substantially from the morning runs in 4 foot seas when compared
to afternoon runs in 6.4 foot seas, while the SES-200's
accelerations rose only slightly. During two head seas runs in
4 and 6.4 foot seas, vertical accelerations on the SES-200
increased 4% at the cg and 1% on the bridge, while vertical
accelerations on the SEA HAWK increased by 27% at the cg and 15%
on the bridge.
The last seakeeping test day was completed in 3.4 to 3.9
foot significant seas. The seakeeping data obtained in
side-by-side tests conducted on 2 February 1985 are presented in
Tables B-XVII and B-XVIII. Wave PSD and direction plots .re
presented in Figures B-XXVII and B-XXVIII for 3.9 foot seas.
The same trend of vertical acceleration on the SES-200 being
less than accelerations at corresponding locations on the SEA
30

HAWK continued; however, the difference between accelerations at
the cg and bridge of those vessels is quite different. In head
seas RMS heave accelerations on the SEA HAWK bridge are only 24%
higher than those on the SES-200 with RCS off, while
accelerations at the SEA HAWK cg are 120% higher. This trend is
consistent for all head and bow quarter seakeeping runs
conducted and can be seen in Figure 16 for the 3.4 foot head
seas run.
The bridge on the SES-200 is approximately 39 foot forward
of the cg compared to 26 foot forward of the cg on the SEA HAWK.
Vertical acceleration on the bridge is comparable to the whole
body acceleration encountered at the cg plus the acceleration
caused by the pitch action of the vessel which pivots close to
the cg. The further forward from the cg you are, the more
vertical acceleration is encountered. The vertical acceleration
at all comparative selected sites is less on the SES-200 due to
larger displacement and greater hull/water dampening than the
SEA HAWK. The acceleration differences are not as great on the
bridge as they are at the cg, because the bridge on the SES-200
is further forward of the cg than the relative bridge location
on the SEA HAWK.
Cushion pressure was measured on both vessels. Nominal mean
cushion pressure is 0.54 PSI on the SES-200 and 0.65 PSI on the
SEA HAWK. Less pressure is required on the SES-200 for several
reasons. Although the SES-200 is about 25% heavier, it has 37%
more cushion area and also more buoyancy created by the
additional 50 foot section of the two side hulls.
USCGC SEA HAWK Ride Quality E,,aluation
Two methods were utilized to quantify the ride quality of
the CGC SEA HAWK. A similar analysis of the SES-200 was not
conducted because it is not an operational cutter in Coast Guard
service and duplicate equipment was not available. Ride quality
31

z
U) WU
0 o I
CfoLv, l3 0 L nV) Z
LL
(fV) V)ic
V) WO tU)rgz2 U)
~ED: 6 LLI CLU .
LLLu
tq O t U-l n~ UO C1 il U-) 0 (
LL
32

is very often a subjective evaluation; however, it is quanti-
fiable when using a standard scale which evaluates how ship
motions and noise levels affect comfort. The two methods
utilized have quite different standards and data analysis
techniques. Despite this difference, both methods obtained
similar levels of discomfort aboard the SEA HAWK. The two
standards utilized were the International Organization for
Standardization (ISO) No. 2631-178(E) and the National
Aeronautics and Space Administration (NASA) algorithm,
References 4 and 5 respectively. Both standards address the
effect of high frequency vibrations above .5 Hz on subjects.
This type of motion causes discomfort, and over a period of
time, fatigue and decreased proficiency. The ride quality
evaluation here does not address low frequency (.05 to .5 Hz)
motions which typically cause motion sickness or seasickness.
The SEA HAWK along with the SES-200 and other air cushion
vehicles experience relatively high frequency (2 Hz) vertical
accelerations which are related to air cushion dynamics. These
motions are not usually experienced on conventional displacement
vessels below moderate speeds (25 knots).
ISO Fatigue Standard
The ISO standard is based upon subjective tests of many
subjects exposed to vertical accelerations at various
frequencies while in the seated position. According to ISO,
Reference 4, the four factors responsible for determining the
human response to vibration are intensity, frequency, direction
(vertical or horizontal), and duration (exposure time) of the
vibration. The three quantifiable human responses to vibrations
are the preservation of work efficiency, health or safety, and
comfort.
The ISO fatigue-decreased proficiency boundary, Figure 17,
specified a limit beyond which exposures to vibrations can be
regarded as carrying a significant risk of impairing work effi-
33

\- %6
IL NI\
k RX N
NL c
~Z
-NI
0'
0t
(.o
Iv w
.0 fa ko v0 eq c4- t4 -S o c; c DC
(.1A) Zo~ UDMU_~
34

ciency in many time-dependent tasks (such as watchstanding
aboard ship). Although individuals may respond differently to
vibrations, the fatigue limits showed the general level of onset
of such degradation. The exposure limit for health or safety is
similar to the fatigue decreased proficiency boundary but
corresponds to acceleration levels two times (6 dB) higher. The
exposure limit is defined as half the level considered to be the
threshold of pain.
The Bruel and Kjaer (B&K) Human Response Vibration Meter
Type 2512 was utilized to measure these fatigue limits using ISO
weighting filters on the vertical acceleration signal. The unit
displays the exposure limit, the equivalent continuous vibration
level (Leq), and the maximum peak vibration level.
It is well known and documented that operation in in-
creasingly higher sea states increases incidents of sea sickness
caused by low frequency accelerations. This does not always
hold true when evaluating human fatigue caused by high frequency
vertical accelerations because short crested seas and the
vessel's response to those wave encounters are the dominant
factors. Fourteen measurements were taken during three days in
sea conditions ranging from 2 to 6.4 foot significant seas.
During two of those days (30 and 31 January 1985), concurrent
measurements were made by NASA personnel using their own ride
quality meter. All measurements were made in the starboard
berthing area adjacent to the mess deck on the SEA HAWK. The
B&K meter (ISO Standard) results are presented in Table III.
Head sea runs in 4 to 5 foot seas are generally the most
fatiguing. The wave period as well as height seems to have a
dramatic effect on human fatigue on the SEA HAWK in head seas.
Head seas runs on 31 January and 2 February in 4 foot seas
resulted in quite different fatigue times in similar conditions.
The time to reach 100% of the exposure limit was 4.5 hours on 2
February in 4.7 second period 3.9 foot waves, compared to 10.2
hours on 31 January in 6.2 second period 4 foot waves. The
35

LLL
*A 0J CD
(.n 0) -
M 3c
LLJ 114
QD CD
- = - a~c)f Ln LAjC-ir ,Ci ) LO t. P= =CD Ln0l 000 00 0 000 W LnL 0 0o
LA= < .. xw ~ LA LLC)E
(^ LLL
tjJ &Q0LIQ
Id Cm=
LJ m CL ) -
OCLLC <
V d) C-).- In .--LA LQ LAJ t ot 1c w410( 00 E
I- n L&~ co V L
0 4 nni -)0-S.
LA-U 3. feCD ) LaiJa Q UUE 83 3 83 8 0aA
:3 LLJULL Z t LfL
0
j U. 0000L *) W ) 83j (D L)'Urcr 7 NO
mo L4c o o n inc r(A C4 .0 C
~LJ Ln
U) >- 0inwtLL coJ( enifu L0O)J O
V~) -_jI- 0 0 0 0 00 ~ '0Oi ~ L
3 83

shorter period waves are causing larger heave accelerations at
high frequencies because the encounter frequency in head seas is
exciting the natural heave frequencv of the vessel at 2 cyc±eL
per second. The head seas run in short crested 4 foot seas with
a 4.7 second period was more fatiguing than the 6.4 foot head
seas run in 6.2 second period waves. The time to reach 100%
exposure limit in 6.4 foot seas was 7.7 hours compared to 4.5
hours in short crested 3.9 foot waves.
The mean time to reach 100% of the exposure limit for the
three day testing was 16.1 hours. This is approximately the
same level obtained in five previous test days conducted in 1983
and 1984 as documented in Reference 6. The mean time to reach
100% of the exposure limit was 15.1 hours during those previous
tests conducted in 1-4 foot seas.
These ISO standards are time-dependent and relate mainly to
fatigue caused by vertical accelerations. The NASA meter
addresses a discomfort limit which is not time-dependent by
using motions in five degrees of freedom as well as sound level
effects.
NASA Discomfort Standard
The NASA Langley Research Center has developed a generalized
ride comfort model for estimating passenger ride comfort in the
presence of complex vehicle vibration and interior noise. As
part of this research NASA has developed a portable,
self-contained ride quality meter for use in obtaining real-time
estimates of passenger ride comfort during actual vehicle
operations. This meter is a direct hardware and software imple-
mentation of the generalized ride comfort model.
The NASA model was developed in a research program that
obtained subjective ratings from more than 3000 persons who were
exposed to controlled combinations of vehicle vibration and in-
37

terior noise using the NASA ride quality simulator. This re-
search resulted in a model with the unique capability of
transforminD individual elements of the ccmb 'ed noise and
vibration environment into subjective units and then summing the
subjective units to produce a single discomfort index typifying
passenger acceptance of the environment.
The ride quality meter contains a sensor package for
simultaneously measuring five axes of vehicle vibration and a
microphone for measuring interior vehicle noise. The vibration
sensor package can be placed on the floor of a vehicle at a
location selected by the user. At the selected location it will
measure vehicle vibration (acceleration) in the vertical,
lateral, longitudinal, roll, and pitch axes. Similarly, the
microphone can be placed at a user selected location. Signals
from the sensor package and microphone are fed to the ride
quality meter which conditions and processes each one according
to the NASA comfort algorithm. Meter output provides the user a
number of options for use in assessing vehicle ride comfort as
well as identifying particular contributing sources of passenger
discomfort. These options include: total overall discomfort,
vibration component of total discomfort, noise component of
total discomfort, due to individual axes of vibration,
discomfort due to individual octave bands of noise, and
discomfort corrected for trip duration. These outputs are
provided via an internal printer. The ride quality meter can be
operated off of vehicle power when available or by use of
rechargeable battery packs.
No other method is known to exist that can provide such
detailed ride comfort information during actual vehicle
operations. This meter provides the first known capability to
directly sum the effects of noise and vibration into a single
objective comfort index. The meter, in essence, acts as a
reliable and accurate passenger jury.
38

Two NASA engineers from Langley Research Center, Hampton, VA
conducted ride quality tests aboard the SEA HAWK on 30 and 31
Jantary- Thpr findings were similar to the !SO method in that
the ride of the SEA HAWK was above the discomfort level 53% of
the time on 30 January in 2 foot chop and in the discomfort
range 81% of the time on 31 January in 4 foot seas. The unique
aspects of their results is that it identifies the primary
factors contributing to that total discomfort index. A ride is
considered uncomfortable if the total subjective discomfort
level is above 2.5. The NASA algorithm was designed for comfort
evaluations on vehicles and is valid for short term (less than
two hour) rides. It is not intended to be a time-dependent
measurement of fatigue effects which the ISO standards address.
The NASA ride quality measurements on board the SEA HAWK are
documented by the NASA preliminary information report (PIR) NO.
SD-5 attached as Appendix C to this report.
The NASA report identifies the major contributing factors to
the discomfort index measured on the SEA HAWK. On both days,
the highest discomfort levels were made during high speed runs
while low measurements were obtained on "ride conditions" when
the vessel was dead in the water. On 30 January in relatively
low sea states (2 foot chop) the dominant contributor to
vibration discomfort was roll axis vibration while vertical axis
vibration generally was the second longest contributor followed
by lateral accelerations.
During measurements in 4-6 foot seas taken on 31 January,
the dominant contributor to vibration discomfort was vertical
acceleration. Roll vibration discomfort varied slightly com-
pared to 30 January tests while lateral vibration discomfort was
similar both days. Sound levels contributed significantly to
total discomfort on both test days. Noise contribution to total
discomfort depends upon the level of ship vibration which is
simultaneously present. To improve ride quality requires mea-
39

sures taken to control noise transmission into living spaces as
well as reduction of ship vibration.
SES-200 Ride Control System Evaluation
The SES-200 ilde control system (RCS) is a prototype unit
built by Maritime Dynamics, Inc. for the Navy. The purpose of
the RCS on the vessel is to modulate cushfon airflow to smooth
out cushion pressure and thus reduce vertical acceieration. The
system uses one to four pressure signals for cohAtrol law
feedback. A microprocessor manipulates the data using an
algorithm to output a single control signal to the four vent
valves. The four vent va"',es are located on the main deck
centerline as seen in Figure 12. The effective open area of the
tour vent valves is 9 square feet each. A set of louvered
valves allows the ship's air cushion to be vented vertically in
order to minimize pressure changes caused by passing waves and
cushion venting. This system is designed to attenuate high
frequency whole body vibrations in the 1 to 4 Hz range which
causes crew fatigue. The low frequency (.05 to .6 Hz) ship
motions caused by encountering swells are not attenuated because
the motion is related to hull interactions with the waves not
air cushion dynamics. These low frequency motions which are not
affected by the RCS typically cause seasickness.
The SES-200, as well as the 110' Coast Guard SES's, have a
relatively high resonant or natural heave frequency at
approximately 2 Hz which is a major contributor to vertical
accelerations in calm water to 4 foot seas. These high
frequency heave motions are most pronounced in high speed runs
in head and bow quarter seas. As demonstrated in Reference 6,
this high frequency energy is most pronounced on a 110' Coast
Guard SES at speeds above hump speed (22 knots). The SEA HAWK
could not attain speeds above 22 knots during these tests. The
SES-200 was tested below its primary hump speed which exists in
the 30+ knot range and could not attain speeds above 23 knots
during these tests. With the higher length to beam ratio, the
40

SES-200 is not designed to operate above its hump speed.
When seas get larger, above 4 feet, and wave periods get
longer, the wave encounter frequencies (.05 to .6 Hz) become the
major contributor to vertical accelerations and thus the ridecontrol system is less effective because it is not designed to
control these low frequency ship motions. As sea states
increase above five feet, waves start to siam the wet deck area
of the hull. Voluntary speed reduction usually occurs when
slamming starts.
In order to evaluate the RCS on the SES-200 during
on-cushion operations, the system was turned on and then off ior
half of each 30 minute seakeeping leg conducted side-by-side the
USCGC SEA HAWK on four separate days. Headings relative to the
waves were varied from head to following seas in 45 degree
increments. In addition to these side-by-side runs at different
orientations to the major seas, one period of time on 31 January
was devoted to the Navy for 12 independent runs to evaluate the
RCS. The Coast Guard test team recorded and analyzed ship
motions during all testing aboard the Navy SES-200.
Most of the seakeeping tests were conducted in sea state III
(3.0 to 5.7 foot significant wave heights). One test set for
the Navy was conducted in sea state IV with 6.4 foot significant
waves. A calm water evaluation was also conducted for head seas
runs only, in 2.2 foot waves. All seakeeping data collected is
presented in Appendix B, Tables B-XI to B-VIII. The wave field
directional data and PSD plots collected during seakeeping tests
are presented in Figures B-XIX to B-XXVIII.
Based on previous evaluations conducted by the Navy and the
company which designed the RCS (Maritime Dynamics, Inc.)
documented in Reference 3, we were anticipating a 30%
attenuation of vertical accelerations at the center of gravity
(cg) due to the RCS in sea state III tests. While proceeding at
41

18 to 20 knots, the RCS attenuated vertical accelerations at the
cg to varying degrees over the four seakeeping test days. One
day, 31 Januacy, Lh i RCS failed to attenuate accelerations in 4
foot and 6 foot head and bow quarter seas. On two other days
the system attenuated vertical accelerations at the cg 36% on 27
February in 3.7 foot head seas and attenuated accelerations 20%
on 2 February in 4 foot head seas. Occasionally, the RCS caused
an amplification of vertical accelerations.
A summary of RCS performance is presented in Table IV. It
can be seen from this data table that the ride control system
performed intermittently. The Coast Guard test team director
noted that on 31 January a control card used in the RCS
electronics package had malfunctioned and the Maritime Dynamics,
Inc. representative made attempts to compensate for that
component failure. The RCS did not attenuate acceleration that
day. It was also noted that the partly opened (bias) setting of
the vent valves was about 30% on the first test day (27 January)
and each day thereafter the valves had decreased bias opening.
During the last seakeeping day (2 February), the bias of the
vent valves were closed except for venting actions. The RCS is
most effective when there is a significant bias open setting on
the vent valves. This allows for control of the wet deck
cushion pressure to reduce positive pressure spikes as well as
reducing low pressure troughs. With no bias opening, the system
can only control pressure in one direction (positive spikes).
The RCS is designed to attenuate relatively high frequency
1 to 4 Hz vertical accelerations of the ship by controlling air
cushion pressure. It cannot affect low frequency .05 to .6 Hz
motions caused by wave encounters on the hull. The RCS is thus
most effective in low to moderate short crested seas (2 to 4
feet significant seas) where a good part of the energy
contributing to vertical accelerations is at the natural heave
frequency response of the vessel at 2 Hz. As the sea states
increase above four feet, the major energy contributing to
42

TABLE IV
RCS EFFECTIVENESS ON THE SES-200
ATTENUATION OF VERTICAL ACCELERATIONS
CENTER OF GRAVITY BRIDGE
DATE RELATIVE REFERENCE REFERENCE1985 HEADING ATTENU- H 1/3 ACCEL. ATTENU- H 1/3 ACCEL. SEA STATE/
(SPEED) TO THE SEAS ATION RCS OFF (G's) ATION RCS OFF (G's) WAVE HEIGHT
27 JAN HEAD 36% .153 n/a n/a IIIBOW QTR. 7% .061 n/a n/a 3.7 ft.
(18kts) STERN QTR. 7% .077 n/a n/a significantwaves
28 JAN HEAD -12% .032 0 .461 II(20 kts) 2.2 Ft.
significantwaves
31 JAN HEAD -2.5% .121 1% .438 III0900 BOW QTR. -16% .119 2% .446 4.0 ft.(20kts) BEAM 37% .099 1.5% .439 significant
STERN QTR. 21% .046 0.5% .437 waves
31 JAN HEAD 2% .116 0 .435 IV1600 BOW QTR. 0 .103 0 .434 6.4 ft.
(20kts) BEAM 38% .118 -5% .425 significantSTERN QTR. 21% .053 0 .437 wavesFOLLOWING -134% .036 0 .440
2 FEB HEAD 20% .09 17% .391 Ill(20kts) BOW QTR. 16% .084 18% .309 3.9 ft.
BEAM 56% .071 n/a n/a significantSTERN QTR. 2% .074 14% .422 wavesFOLLOWING -20 .024 16% .242
-% Attenuation indicates the amount accelerations were amplified when the RCS wasturned on compared to levels with the RCS off.
n/a - Data Not Available
43

vertical accelerations is at the low frequency hull encounters
with the swells. For this reason, t1 RLS is not effective in
attenuating vertical accelerations in high sea states.
The effectiveness of the RCS and its limitations can be
seen by looking at a vertical acceleration signal in the
frequency domain. In this way, the heave power whicn is
attenuated can be seen and evaluated. The most dramatic effect
of heave power attenuation at the cg can be seen during a head
seas run on 2 February at 19 knots in 3.9 foot seas, Figure 18.
The majority of power attenuated is centered around 2 Hz, the
natural heave frequency of the vessel. Note that there is some
power attenuated as low as .5 Hz, however, no power is
attenuated in the wave encounter low frequencies centered around
.25 Hz (4 second period). Heave power is larger on the bridge
compared to the cg because of the additional acceleration caused
by the pitch action of the vessel, Figure 19. The power
centered at .25 Hz, the wave encounter frequency, has increased
the most on the bridge compared to the 2 Hz power. The RCS
still reduces the higher frequency heave power; however, there
is a smaller percent reduction in total heave power on the
bridge. This is because the low frequency motion which is not
affected by the RCS is more pronounced due to pitch action
experienced on the bridge centered at a pivot point close to the
center of gravity.
During runs in 6.4 foot significant seas, the major power
was at 0.3 Hz (3.3 second encounter period). There is little
room for RCS effectiveness in this case, as seen in Figure 20.
This is because very little heave power was present between 1
and 3 Hz to be attenuated by the RCS. This plot dramatically
demonstrates that in rough seas (6.4 foot), the RCS is not
effective on the SES-200.
Recent R&D Center tests conducted in February 1986 on the
air cushion pressure and fan system of the CGC SHEARWATER
44

C~
OECD 1 :
CC
0000
0--- C
00
ulE E .9 _Y
3: w 0 *6- z
0 co ZoZOcY)o m
8
ClU) 00< cQ U. UJLU < Q 0~(n C,)
00 0 CL
C) C~ < w
9 8
LLLU
co >(<
c\1 C'
(\Jj
45h
0 0L0 -C0 0
00
0 C~j L
co~Cf) IL 0 I
()0 0
0) r < .0
a)- :r <CW 1 -c/
oC
W Lij LL
w
cc
1w
0
46

0 0
C
C (I
CL
LLL
Lz U'W< U)CI 00
coOU) < () nCC) wl
E < '-U
Ca LU Z
6 WU)LL M-
in z a (
LUU
LU L
I 0 (5U.)L
CC
oCC C\JAN
4-7)

(WSES-3) show that air flow was lower than expected and cushion
pressure control by lift engine rpm changes was marginal because
the fans are operating in a stall region. Addition of an RCS
will add a parallel flow out of the wet deck. Through control
of the bias opening of the vent valves that parallel air flow
may change the air system's resistance enough to get the fans
operating in a stable region. This would improve the ride
quality and possibly improve fan efficiency.
SUMMARY
The 160' U.S. Navy SES-200 has many advantages over the
110' U.S. Coast Guard SES. These SES-200 advantages all relate
to the increased length, displacement and payload benefits when
compared to the smaller CGC SEA HAWK. The SES-200 has lower
wave making drag, better seakeeping and longer range, with
essentially the same speed and fuel efficiency characteristics
of the CGC SEA HAWK. The SES-200 has more than twice the range
of the SEA HAWK. Despite a 25% larger displacement, the
SES-200, with essentially the same power plant configuration,
has slightly less fuel consumption than the SEA HAWK at 22
knots. This seemingly contrary relationship is possible because
the additional 50 foot length of the SES-200 reduces wave making
drag of the vessel. Both vessels have fairly flat fuel
efficiency curves which indicate that routine full speed
operation is an effective operating profile for these surface
effect ships.
The liabilities of the SES-200 are that turning diameters are
twice as large as the SEA HAWK and thus has slower turning
rates. The SES-200 has four lift engines and fans in order to
maintain proper cushion pressure and air flow compared to two
fans on the CGC SEA HAWK. Both vessels have marginal noise
levels in living compartments at moderate and fast speeds.
The seakeeping characteristics of the SES-200 without ride
48

control are better than the SEA HAWK with the exception of surge
acceleration. Surge accelerations on the SES-200 in head and
bow quarter seas are of the same order of magnitude as the
vertical accelerations at the cg. This translates to walking
tasks being more difficult on the SES-200 compared to the SEA
HAWK as reported by test team members. Surge acceleration on
the SEA HAWK are one order of magnitude below its heave
accelerations at its cg.
Roll and pitch amplitudes on both vessels are very low and
are considered very good. Vertical accelerations at the cg of
the SES-200 with the ride control system off are approximately
70% lower than those encountered on the SEA HAWK. That benefit,
however, is mitigated to some extent on the bridge of the
SES-200 because it is further forward of its cg compared to the
bridge location on the SEA HAWK. Vertical accelerations on the
SES-200 bridge is dropped down to approximately 33% below those
experienced on the bridge of the SEA HAWK.
The ride control system on the SES-200 intermittently
attenuated vertical accelerations during the two week test
period. On one seakeeping day it did not function and it
occasionally amplified accelerations. When it was operational
it attenuated vertical accelerations 20 to 36% in sea state III
(4 ft.) head seas at the cg and 17% on the bridge while
proceeding at 20 knots. The ride control system (RCS) does not
attenuate low frequency wave encounters and so it is not
effective in sea states IV (6 ft.) and above where those low
frequency motions dominate. The RCS reduces the high frequency
(2 Hz) vertical accelerations which are responsible for fatigue
effects on crew members. The RCS is most effective in head and
bow quarter moderate seas of 2-4 feet in height.
Ride quality was evaluated on the SEA HAWK. According to
ISO standards, high frequency vertical accelerations cause human
fatigue and decreased proficiency within 16 hours underway
49

in sea state III (4 foot waves). The NASA ride quality meter
substantiated the vertical accelerations are the major
contributor to ride discomfort and that noise levels added to
that discomfort level.
50

UPDATE
Many power plant performance improvements have been completed on
the three Coast Guard SESs since these tests were completed on
the USCGC SEA HAWK in February 1985. As of July 1987, all three
110' SEA BIRD class SESs were routinely attaining a design speed
of 28 to 30 knots at full displacement in sea state 2,
(Reference 7). Total fuel consumption (main engines, lift
engines and generator) at this speed is 180 gallons per hour.
This improved speed and fuel consumption performance is
attributed to:
a. decreasing propeller pitch from 49" to 46", now
enabling the vessels to easily transit hump speed in higher sea
states. Tha SA IIAWI1 engines were load limited by the 49" pitch
propeller as tested in 1985 at 22 knots. The main engines are
now RPM limited at 1900 RPM (voluntarily) at 30 knots.
b. main engine modifications made in February 1986 to in-
crease horsepower by 200 HP on each engine. Consistent top
speed performance, however, was not obtained until propeller
pitch was reduced.
c. main engine intake fuel temperature being reduced from0 0
worse case conditions of 145 F to 95 F through installation of
fuel coolers (heat exchangers). Exhaust system back pressure
was relieved when an original piping system problem was
discovered. Lift f-n efficiency was improved through
replacement of smaller profile intake screens on the SEA HAWK
only. Installation of turning vanes below the fans improved
flow to ducts which supply air to the seals. Stern seals are
now trimmed to fit each vessel to prevent material folding which
allowed undesired pressure loss. Forced air ventilation to
engine room was improved dropping air temperature by 30 F to an0 0
average of 105 F-110 F.
51

In September of 1988, the Coast Guard Research and
Development Center tested the USCGC SEA HAWK (WSES-2) to analyze
the Ride Control System (RCS) that was installed on the ship.
The data were obtained in 3 foot and 6 foot significant seas
during a normal patrol operation. The following information is
provided as the RCS is reflective of an improvement of this
class of vessels. It should be noted that only the USCGC SEA
HAWK is currently configured with the RCS.
Tests indicate that there is little variation in roll and
pitch either in "angle" or "rate" with the RCS on or off. There
is, however, significant reduction in heave at the Center of
Gravity (CG) and the Wheelhouse with the RCS on versus off. The
difference is as shown in Table V, and Figures 21 and 22.
Analysis of the three foot seakeeping data show that
normally there is an amplification of approximately 1.15 - 1.20
on vertical heave values between the CG and the Wheelhouse.
This is true because the Wheelhouse is located approximately six
feet forward of the CG sensing point. Visual observations of
the USCGC SEA HAWK in motion indicate that the center of
rotation is located 33 feet (10.1 meters) aft of the CG.
Location
Seas CG Wheelhouse
HEAD -20% -24%
BOW -30% -29%
BEAM -35% -30%
QTR -26% -20%
FOLLOWING -16% -15%
Table V: RCS Heave Reduction
Table VI shows the engineering data for the three wave height
52

j-
I-LIN CD
U)
4-)
cn Clo 1-
I.- cm
C))
4-J-J U)
U-r
CD C:
3C '-I
C C3LrLu
M U-
C) C)53

Tz
CD,
LUI-m
L
U) J
co
cr-
LLL
M LLU
LU L
CD =L
LU
0 D 40 CD C) 0
I I
~LLJ U
LU CD .
.zU-
54
00 c 0 0000 D 0 00 00 0D 0D 0D 00 00 0D 0oc DC D(DC DCDC
i-.~~~~~~~~I W-U 4N-r f j~~(I CMN 00 M 4 In r4~ 0 I,-J
0D C 0 0 D 00 0 0 0 0 0000nC D DC QC D D( 0 0000( C 0 0D
w N 0 It U'n LA~ 0 It' m~ w N a0-4 m~ 0 N'- N. Un M~ w 0= m ICM (1 n
C- i 0 000000000000000000000000m Ln'T '
4J 9 9 9 9 . 9 9 9 9 9 9 9 9,
C.,,
in 'r n M N C) M01 - 3ONZ -N-r 00 N. 00 n LA 00 .-L
.4J - - : 9 799C
ON ~0N .&A L m 3 OO4 00 P..nR 0 -N0..0 wl.
-00 MF20 L%0. rCQ00 -" D00 V0, ' 00CY :0 o LI P
Uf% LAURLA. CMN 0'LAWICM(MM n N .0400. L r
000 C) 00 - 0 0- 00 NO - 00 a DCN C D
CO L (Dl N0.uNr 0 nt %0 LN Ur W%
('.10. Ln ut . M0
V% cm0 00O OO 0DOu - - N' DC ~P0 0 mc .- 00Nm 000 -u en -- 00N-- 0N
N!09 19 1 N W!. .0 . .F~. '0-09.tN0.1
N :r14, LXu 'Inn t-s -Cr1 N' 0. *
'", a Q 2 .7p -4VN M"1N f'-,o 'n PA~ I en 0
01 L"I-o nClo
0.~~~~NI'.. .I-t-u. 0. u -. .~ -4.0-.. .
0000 C 000.CM It t.- O O 9 C MN -V%0U.W
U, -"X ,'00- - '0 - 'o0
C, 'n co ;7, y rn co 0, 0,m , LWCD"
K 1 9C I 919U 1CDC 00 a DCD0 M n -C M-55C C

sekeeping test. The table shows the average of the largest
H 1/10, H 1/31 RMS, mean and highest value recorded for all runs
in head, bow quarter, beam, stern quarter and following seas.
Table VII shows the engineering data for the six foot
seakeeping tests. Due to the heavy sea conditions, all runs
were not completed as noted in the data tables. The seakeeping
analysis shows that the six to seven foot (1.8 to 2.1 meter)
significant wave height is the point at which the RCS stops
being effective in reducing ship motion. At this point, the
motion of the ship becomes great enough that the bow seals break
contact with the water, causing the boat to lose cushion and
slam down into the waves with personnel on board leaving their
feet [8].
56

! 0. 0 9 !C
m '0 4D CY 0 m go .MP0000 r ND 000 rmMC.- .44. 400000 444
0000000003 Q 0 (DQC D z z M Q 0 0 D of :z M
1- mI' m~ 1 l 0 M m. mr Q~ p w m It m~ fn l r rn rt LA Vr% MNMgc0000000003-0000) D D D -0000000CDCDC lCDCDC00D
U~ca Go00 00 00 0 00 00 00 0
& ~ ~ ~ I "(VP NO * 4PiN
C) CC 0 CD D0.D0 0 CD M M400Q0>0044DM 4MM43
000000ll t NN0 0002V 2222 Ir 0 0000D2o2.2D 22 O z;
an * lF. -.0LA. 0 L 1~ CD 11 r*- .
r ' -- u t 2- - C9 .~ .~ ~~2 *~. .00000000 02D 2220 0002222
m O unO %0 N0 K O MC N. ol CD -n LA
t~l r- 1.0 0 ~. C 0 SC10I ~N m " -00 004 44
CD MM nC 0'o "0 00.mNQ A., ;2 CD, 'Nr
MN-. - coc- .a- . . . . O 2 -
. CO '0 .4 mC g 0 -S :I= c Nz .M 0 2 2ZZ
10L AI N N U' 0 N4'OLw 10N - r rN '0NN.'0 I
N It M 0.FI L .m .C'Cc tOp 0V . . .~ ..- ~. C 0 . . 04
Un N *r~0 %n m N M r4W P2N. 0m2N2MQ. 0. N . . .
F2 0. * 2 2 O0 - . C9 44-C4
C99* if! 44 . *4. LOLA.
H ( - tN -0, NZ2 2Z f N2 2
4* .3-*000 - U m. VC9 09 01 9 A 1 1 1
col F'3 QN- -t 2N LA f4P (M 0 10 U% MN U% W. &n ul -1 m N N
CO U~' ?0 N~.0 Un M M0- D N .m 0 rm(
~ 0 - N N LM m * ct 0. m 2 2N At~V
E-44 "9I. f
IC ~ ~ ~ ~ -en CA 2c x. pr 'x (ZX ZX< -z c 22 - 22
zu Ljw
44off

RECOMMENDATIONS
Consideration should be given to reducing noise transmission
from the engine room to the aft berthing compartment on the CGC
SEA HAWK and the other two Coast Guard SESs. Presently, ISO
duration time is exceeded after 13 hours exposure in aft
berthing while proceeding at 20 knots. Although this is within
acceptable limits, it is a marginal condition.
This technical evaluation and other tests conducted by the Coast
Guard on the SES Sea Bird Class indicate that a ride control
system is necessary in order to improve ride quality, reduce
human fatigue and possibly extend the life of the hull and the
lift system. Experience gained by ret-ofitting the Navy oES-200
and Coast Guard Cutter SEA HAWK with active ride control systems
(RCS) aemonstrate that it is difficult and expensive to
accomplish after the ship is designed and built. Future
procurements of SESs should include some form of an RCS as a
standard design requirement.
The air cushion itself must be considered as an integral system
of the ship rather than an isolated element in order to design,
operate and maintain an efficient air cushion vehicle. The SES
exhibits a 2-3 Hz bounce caused by the compressibility and
resiliency of the air cushion itself even in calm water
operations. This cushion instability measured on the SEA HAWK
varied from 72 to 128 PSF. The lift fans, ducting system,
seals, RCS, cushion volume, required flow rate, and pressure
must be properly matched as a system to insure stable, steady
state operation. Once a stable cushion is obtained, the
immediate benefits are improved ride quality, less human
fatigue, and a more efficient lift and propulsion system. The
long-term benefits obtained by reducing high frequency whole
ship oscillations are an extended hull life through the
reduction in hull cracking and reduced maintenance on fans and
seals.
58

ACKNOWLEDGEMENTS
I wish to acknowledge the superior effort and thoroughness in
which Mr. Robert Desruisseau reduced the vast majority of the
seakeeping data presented in this report. Many data sets were
evaluated twice to ensure data integrity. He performed valuable
data editing and some plotting functions as well which enhanced
the quality of this report.
Mr. James Bellemare did an outstanding job as test director of
the SES-200. This effort involved a great deal of technical
expertise and test team coordination between the two vessels,
which Mr.Bellemare handled admirably well. He was very helpful
in conducting a technical review of this report.
The cooperation of the U.S. Coast Guard SES Division, U.S. Navy,
and the officers and crews of both vessels enabled this test
series to be completed successfully one week earlier than
planned.
59

REFERENCES
1. Goodwin, M.J., "Technical and Operational Evaluation of USCGC DORADO (WSES-I)", USCG Report No. CG-D-44-82, NTISAccession No. AD-A121-314, (August 1982).
2. Goodwin, M.J., "General Test Plan for Marine Vehicles",USCG Research and Development Center Internal Document.
3. Adams, John D. et. al., "SES-200 Technical Evaluation TestReport", USCG Report No. CG-D-l-85, NTIS Accession No.AD-A152-344, (January 1984).
4. International Organization for Standardization Guide ForThe Evaluation of Human Exposure to Whole-Body Vibration"Ref. No. ISO 2631-1978(E) (1978).
5. Leatherwood, Jack D., Barker, Linda K., "A User-Orientedand Computerized Model for Estimating Vehicle RideQuality". NASA Technical Paper 2299, (1978).
6. Coe, Thomas J., "Seakeeping and Vibration Tests of theCoast Guard 110' Surface Effect Ship SEA BIRD Class(WSES)", USCG Report No. CG-D-32-84, NTIS Accession No.AD-A154150 (September 1984).
7. McCollum, Joe B., CW03, SES Division Engineering Officer,Key West, FL, Personal Communication, July 1987.
8. Swensen, Eric E., "Human Factors Analysis of the USCGC SEAHAWK (WSES-2) Ride Control System", USCG R&DC Report No.13/89, January 1990.
R-I

APPENDIX A
DESCRIPTION OF INSTRUMENTATION
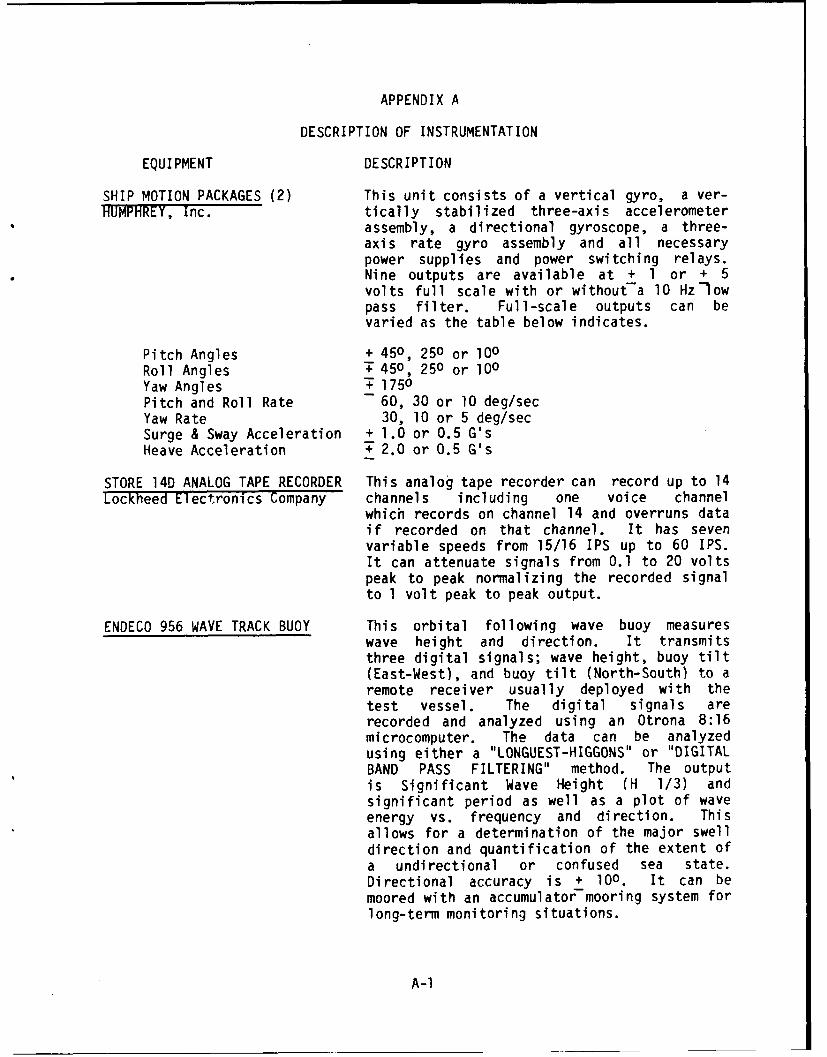
APPENDIX A
DESCRIPTION OF INSTRUMENTATION
EQUIPMENT DESCRIPTION
SHIP MOTION PACKAGES (2) This unit consists of a vertical gyro, a ver-HUMPHREY, Inc. tically stabilized three-axis accelerometer
assembly, a directional gyroscope, a three-axis rate gyro assembly and all necessarypower supplies and power switching relays.Nine outputs are available at + 1 or + 5volts full scale with or without-a 10 Hz-1owpass filter. Full-scale outputs can bevaried as the table below indicates.
Pitch Angles + 450, 250 or 100Roll Angles T 450, 250 or 100Yaw Angles + 1750Pitch and Roll Rate 60, 30 or 10 deg/secYaw Rate 30, 10 or 5 deg/secSurge & Sway Acceleration + 1.0 or 0.5 G'sHeave Acceleration T 2.0 or 0.5 G's
STORE 14D ANALOG TAPE RECORDER This analog tape recorder can record up to 14Lockheed Electronics Company channels including one voice channel
which records on channel 14 and overruns dataif recorded on that channel. It has sevenvariable speeds from 15/16 IPS up to 60 IPS.It can attenuate signals from 0.1 to 20 voltspeak to peak normalizing the recorded signalto 1 volt peak to peak output.
ENDECO 956 WAVE TRACK BUOY This orbital following wave buoy measureswave height and direction. It transmitsthree digital signals; wave height, buoy tilt(East-West), and buoy tilt (North-South) to aremote receiver usually deployed with thetest vessel. The digital signals arerecorded and analyzed using an Otrona 8:16microcomputer. The data can be analyzedusing either a "LONGUEST-HIGGONS" or "DIGITALBAND PASS FILTERING" method. The outputis Significant Wave Height (H 1/3) andsignificant period as well as a plot of waveenergy vs. frequency and direction. Thisallows for a determination of the major swelldirection and quantification of the extent ofa undirectional or confused sea state.Directional accuracy is + 100. It can bemoored with an accumulator-mooring system forlong-term monitoring situations.
A-l

HUMAN-RESPONSE VIBRATION METER Measures vibration from a tri-axial accelero-Type 2512 Bruel & Kjaer (B&K) meter for the evaluation of vibration on theMrion, A human body in agreement with current ISO
standardu for Hand-Arm and Whole-Body(including motion sickness) measurement. Thecomplex relationship between level, frequencyand time is automatically taken into accountin the compututation of equivalent continuousvibration level and exposure dose. Outputsare printed on thermal paper with the use ofa Alphanumeric Printer type 2312. Outputsare automatically printed at preselectedintervals in the form of: Current Time,Elapsed Time, Peak Acceleration (dB),Equivalent Exposure (dB) and Percent of aparticular ISO standard selected which hasbeen reached at that elapsed time.
TRIAXIAL SEAT ACCELEROMETER This accelerometer is especially designed forType 4322 detecting vibration motion in connection with(used with B&K Meter Type 2512) the measurement of whole-body vibration and
can be put under the buttocks of a seatedperson.
Frequency Range: 0.1 Hz to 2 kHz (+ 5%)Charge Sensitivity: 1 pC/ms-2 + 2% lT pC/gPiezoelectric Material: PZ27
Delta Shear Configuration
ACCELEROMETER CHARGE Various ship vibration measurements are madeAMPLIFIERS Type 2635 using Bruel & Kjaer (B&K) accelerometers andand 2651 Bruel & Kjaer charge amplifiers. The output of the chargeMarion, MA amplifiers are recorded on magnetic tape.
Two types of B&K accelerometers are used;they are the 4368 and the 4384. Two typesof charge amplifiers are used; they are theModel 2635 and the Model 2651. The 2365 is abattery operated (stand alone) chargeamplifier with transducers sensitivityconditioning from 0.1 to 10.99 pC/ms-2.
Frequency Range:Acceleration .2Hz to lOOkHzVelocity 1Hz to lOkHzDisplacement IHz to IkHz
The Model 2651 charge amplifier needs a powersupply (and is packaged in a pack of fouramplifiers with the power supply); transducersensitivity conditioning settings of 0.1, 1,and 10 mV/pC.
A-2

Frequency Range:
Acceleration .003 to 200kHz
General B&K accelerometer information follows:
Charge Frequency TemperatureModel Sensitivity Range Range (deg. C)
4368 4.8 pC/ms-2 .2 to 5000 -74 to 2504384 1 + 2% .2 to 9200 -74 to 250
FUEL FLOW METERS In-line flow meters are direct reading unitsHEDLAND requiring no electrical connections or read-Racine, WI out devices. Scales are based on a specific
gravity of 0.84 for fuel oil. Accuracy iswithin + 5% of full scale.
HORSEPOWER METER 1202A (2) The 1202A measurement system measures shaftACUREX AUTODATA, torque and rpm and calculates horsepower fromMountain View, CA that information (HP = Torque x rpm x
Constant). The shaft is strain gauged fortorque. A transmitter collar and antenna arebolted to, the shaft in order to power andtransmit FM signals from the strain gaugebridge. Three simultaneous analog outputsare provided at the readout box (Torque, HPand rpm). Calibration using a shunt resisteris usually conducted because a known torqueload is difficult to apply to a vessel in thewater. This method simulates a torque loadby shunting a gauge with a known value ofresistance.
SPECIFICATIONSAccuracy: Torque + 1% of full scale
rpm 7 0.25% of full scaleHorsepower ; 1.5% of full scale
SOUND LEVEL METER TYPE 213HBruel and Kjaer This hand-held sound level meter measuresMarlborough, MA levels from 50 to 130 dB with A or C
weighting filters. It can be used with fastor slow response. Calibration is done byusing a Sound Level Calibration unit Type4230. The sound pressure level of thecalibrator is 93.6 dB.
A-3

NASARIDE QUALITY METER SPECIFICATIONS
Input Power: 12Vdc @ 3.5 A
Size: 6"H x 16"W x 14"D
Weight: 30 lbs
Environment: 10 - 400C5 - 95% R.H. (Noncondensing)
Signal Inputs: Accelerometers (Max Levels)
Vertical + 2g
Lateral + 2g
Longitudinal + 2g- 2Pitch + 2 Rad/Sec
Roll + 2 Rad/Sec2
Microphone (Range)
50 - 100 dB
Sensitivity: Accelerometer Inputs
+ 0.1 V to + 10.0 V Full Scale
Microphone Input
+ 0.05 to + 5.0 V Full Scale
Input Independence: 20K OHMS
Filters: Acceleration
Per NASA developed discomfort model (1-30 Hz)
Microphone
"A" - weighting
Six octave bands (63 - 2000 Hz)
Internal Computer: DEC LSI - 11
Display Type: 3 1/2 Digit LCD
A-4

NASARIDE QUALITY METER SPECIFICATIONS (continued)
Display Output: Total Discomfort
Individual axis and noise discomfort
Printer Type: 20 - column alphanumeric
Printer Output: Total discomfortVibration component of discomfortNoise component of discomfortIndividual axis discomfortIndividual octave band discomfortDiscomfort corrected for trip duration
A-5

BLANK
A-6

APPENDIX B
TABULATED DATA

TABLE B-I
USCGC SEA HAWKSPEED POWER
WITH TWO LIFT FANS
30 January 1985
DRAFTS 8'0" Fwd; 9'1" AftDISPLACEMENT 148.5 LT (Heavy)
SPEED MAIN ENGINES TOTAL LIFT ENGINESKTS PORT STBD MAIN ENGINE PORT STBD
SRPM HP SRPM HP HORSEPOWER FFT E1M
7 365 190 310 103 293 1070 1100
11 480 385 470 315 700 1360 1360
17.5 590 679 520 430 1109 1550 1490
19.2 700 1005 700 1000 2005 1576 1625
20.5 720 1035 750 1125 2160 1576 1625
21.5 750 1O8 800 1177 2235 1576 1625
22 760 1090 800 1230 2320 1950 1975
B-1

TABLE B-II
SES 200SPEED POWER
WITH FOUR LIFT FANS
28 January 1985
DRAFTS 6'7" Fwd; 8'10" AftDISPLACEMENT 189.5 LT (Heavy)LCG 0.67 Ft Aft Centerline
RCS OFF
LIFT ENGINESSPEED MAIN ENGINES TOTAL FWD AFTKTS PORT STBD MAIN ENGINE PMT_______PORT______
SRPM HP SRPM HP HORSEPOWER ERPM ERPM ERPM ERPM
6.3 325 201 337 151 352 1400 1400 700 800
9 498 495 528 545 1040 1600 1600 700 800
13 598 753 595 707 1460 1600 1600 700 800
18 701 980 700 952 1932 1800 1800 700 800
19.7 748 1137 745 1103 2204 1800 1800 700 800
21 804 1336 806 1360 2696 1900 1900 700 800
22.5 828 1452 815 1375 2827 1900 1900 700 800
B-2

LaJO
-9K ON IL) m~ 0) Nc V) %0
~CD -
CD)
~a ~j %J C14 CJ C%.j C*.j %
LLii
Liin
4- U
-j LOA
Lii x oCD OCD a~ 0nL)
= - r-r-c
S. 39 00 L A A- & 1.0 OLCr()j (%
V- LL - -
L.i= >.tm.a
V) 0LS 11. 0C-) % c " rr- U.. a
LL. < ~ m
-CD ("I LA ULA LA LA m~ L.Ln P a- a- a a- - a- a
Lii LA Oct 0D -d CD~ LLI 0m- U-) ek) LA m. Lm, 4--
La-
co CD 0cn C-) 4-)
LAJ CD 0 ) 0 ) 0 0 0 0 0- Ca.CL r- C*4 0D LA Q 0 0 5
0"' m qw LA) r- r-. c c
Liij 4-) 0
en C l) LA %0 1.. co 0 - Q.'LV 0 :3
Ln~~C. CD C) CDCD
00
S-
B-3-

- n m
-Jt-
06
0 >0i~0 . . . S
~a) C 1
.0
(./)0 >
o CD C 0 CD C -wA o co 00 o co 0o 0o
tO 0 0LI) 39L) t) .f O O
In - r_'
( D wC XC 2D C D 0 0 C D
-z 2 C C C 0 0 0o 0 0
C - r. r. r r- t r. -
C L " Ul U-L.10 C)) >- 1.- U 4-
S- CY CD a; C4 Cf - - cb. M0) c
co- 44-)
-x CD ) tO C) ) C>0
cr. . 0
LCD -I .0C L rl LL. 4X
o oD C 0 0D C CD 0D CD C 0 0D C ) C) w 4
co 00 co cv) 4- W) .- -- - - -C.- 1..
C> om C, 06 .- I.
o ~ ~ ~ ~~k IDt ) t ') 0 . ~ 4
c CDco C)
(A tn O - E0
:1. 'f *-c a 0 * C) - S.--cn LI) Ut r- t- o oo 0(
zi 0- u
M C'J -n r* Mo. t "J -
C))
C n MV 0~ -c0. i 4-) C)S CD -I,
to~c 0) ea 0E - a -,
U)t r- r., Ln LA- <uj Ln
(I. '- A
B-) 4

TABLE B-V
USCGC SEA HAWKRANGE AND FUEL EFFICIENCY DATA
TWO MAIN ENGINES AND TWO LIFT ENGINES
30 January 1985
DRAFTS 8'0" Fwd; 9'1" AFt Fuel 7342 Gal.DISPLACEMENT 148.5 LT (Heavy) % Usable 95%LCG 1.4 Ft Fwd Centerline Usable 6975 Gal.
TOTAL FUEL FUELSPEED CONSUMPTION RANGE ENDURANCE EFFICIENCY(KNOTS) (GPH) (NM) (DAYS) (GAL/NM)
7.0 49.0 996 5.9 7.0011.0 75.0 1023 3.9 6.8217.5 103.0 1185 2.8 5.8919.2 140.0 957 2.1 7.2920.5 164.0 872 1.8 8.0021.5 185.0 811 1.6 8.6022.0 196.0 783 1.5 8.91
B-5

TABLE B-VI
SES-200RANGE AND FUEL EFFICIENCY DATA
TWO MAIN ENGINES AND FOUR LIFT ENGINES
29 January 1985
DRAFTS 6'7" Fwd; 8'10" Aft Fuel 18390 Gal.DISPLACEMENT 189.5 LT (Heavy) % Usable 95%LCG 0.67 Ft Aft Centerline Usable 17470 Gal.RCS OFF
TOTAL FUEL FUELSPEED CONSUMPTION RANGE ENDURANCE EFFICIENCY(KNOTS) (GPH) (NM) (DAYS) (GAL/NM)
6.3 55.0 2001 13.2 8.739.0 73.0 2154 10.0 8.1113.0 101.0 2249 7.2 7.7718.0 114.0 2759 6.4 6.3319.7 139.5 2467 5.2 7.0821.0 165.0 2224 4.4 7.8622.5 178.0 2208 4.1 7.91
B-6

0
tf A.CL cc Cl Cl CD n V)04-) n (x = 0
Z LL 0) m m COcC P" L) C (DC'~j cmD r- a -
V LL. R& u-(M I-i C) OLrC LnC) COLn 4-)
0.) 0) mUA 0 CDC. 3cC)r-4-) P-4 C l;. O u C.; 0;0 cl
LinU I-L L D n(
- j 'A :30' -l LJCLij
4 m Lt) LJ w 0)0 to 0 L4
L LiiJ = U) CD~~L (-I-) ' O 0 ) O
C) m
< ~ LL 0)40
F- C) (0 CVL) OOO 6-4 4
(1)~~~~U CD a43..
0. 39
0)
>) 0
3) 0
CA- r_* 0x
U) 0) 4-)3EuJ 0 S. 0 S-
cm~ 0. ) m~. 4)4 0 4) a
CA- 4-~ -- CMC
0~ EU0)4-L& 0 -

4-J Ia. LUJ LU -
C\J CD- C DL a ~ ~ OC C ~D -O
a) r-.4 =OM
CC) CD CD
4-)4-) :
4-) eu LU U
-0 4r- m.L ~ OOO
- D L o -C) mr- ) 0
() a) C... C.D L.) m -. aC) o:U)
4-4) F
LAL
4 ~ L 34-4- UO
LOL
4 -) C\J C-C>.U C L L-~ C) R- r r- r-a)c-4J C)() C)I/CD4u4M O~~0e1 0)
I- j ca LUCV)~- 3
U~j LAJ +34-) -LU)
Li) .LUL . - 0D r c)
LU 00 LLA ea S.
-V 4-) I-ajj CLi3:4--.0CJ
W V LJ 034- 0a01Z~ =f C) C
LC) :z c
a-- 4- VLnZ 0- 4-- a) 0Ci :
3c/ 4- 0 . 0
LL ) 0 CL
L) aD L C4-)L~eo u 1. e

TABLE B-IX
USCGC SEA HAWK (WSES-2)TACTICAL DATA
DISTANCE IN METERS TIME IN SECONDSAdvance Transfer Time to Time toat 900 Maximum at 900 Maximum 900 3600
Degrees Course Path Course Path Tactical Course CourseRudder Change Advance Change Transfer Diameter Change Change
SPEED 8 KTS TWO LIFT ENGINESMAINS 1000 RPM 1200 RPM
10 Right 320 330 140 185 300 92 36010 Left 300 370 160 180 550 -- --
20R 220 280 40 110 190 72 23220L 215 230 110 180 340 51 26830R 165 200 40 90 140 55 19630L 170 270 50 140 250 49 196
Note: A 12-knot wind off port beam at start of turn caused a significant increase oftactical diameters when turning to the left.
SPEED 16 KTS TWO LIFT ENGINESMAINS 1350 RPM 1400 RPM
10 Right 470 610 110 290 620 72 251
10 Left 430 510 80 180 360 72 22420R 220 250 35 170 290 44 17120L 330 380 20 120 230 41 15330R 230 300 0 110 210 32 12830L 220 350 30 120 210 40 144
SPEED 17 KTS ONE LIFT ENGINEMAINS 1400 RPM 1400 RPM
10 Right 380 440 110 380 700 63 244
10 Left 460 550 135 330 580 64 224
20R 205 320 35 180 330 39 144
20L 380 440 65 130 340 28 13630R 260 330 25 90 260 32 124
30L 310 350 35 90 200 32 126
SPEED 20 KTS TWO LIFT ENGINESMAINS 1450 RPM 1500 RPM
10 Right 495 560 105 220 440 55 --
10 Left 460 570 30 120 305 36 --
20R 330 400 85 100 260 40 140
20L 270 650 0 120 260 36 120
30R 250 320 40 80 180 31 112
30L 310 340 40 75 200 32 --
B-9

TABLE B-X
USN SES-200TACTICAL DATA - (From Reference 3)
Time to 1800
Tactical Diameter Course ChangeDegrees Rudder (meters) (seconds)
SPEED 10 KTS
10 Right 1158 27010 Left 896 22220 Right 460 12020 Left 460 12030 Right 320 9030 Left 320 90
SPEED 20 KTS
10 Right 1400 26410 Left 1160 21020 Right 762 12620 Left 670 12030 Right 426 7230 Left 305 72
SPEED 29 KTS
10 Right 1676 18310 Left 1700 19020 Right 868 12020 Left 675 10830 Right 395 6930 Left 460 81
B-IO

LAU
LLU
cn 'j- ID0u- i -enCL/8 , 00 e . -. 00 00 00 0 0000 0 0
-i C. 1, Jko.-f a L
LU0 -Dr QU ; nr oci " u ~~ ') U') a,:; r- L- 9 w a)v ~cn..-- ci0 (Dco Uh-W 0 Lncn n ccj In .) o
I- .99 9 .9, 9 .
L!)Cr ) n ' - k nU c 0q091r n mM -g L S ofnUir D ~ m
-d'O L) 0 L)L ) l( D r nc
LUD
-j
vi V) L D w -'~~)'
z: ~ ~ CD uj"
(3 4
1.4.
.0 L 0
co = I= -'(.m 0 L&1 0 00
CI .9 CU .- .U .LU C . . C'
Q 4
Lo
Z~ V, 0< LISO LULJ 0DLJ
VLE Uj
< 0
B-11

(n M LO -n r -0Mc nc, -o-C n O
. . . . . . .. .' .O 0
--m-- n a0 a -- v)L)c 0Ch
-A - c'.j 0- -M- -- n o0 o
Ljz 0 0 O000 ff!0 rl0O0
Lwn 0 1- U
r - r- r- o Ln r-a c .. aLc
z Lnm L C 7 O .
0- CS.99 .- ... 9 . 9 9 9
W40 CO -0 -a mc a q
-I In
m L.J ____x___m__Ln r u
10 >. cc
LI))
z L _j :-= .u .I j. 5S: -
4 , * I I
80 Oe . 0 0 0 .- I. = -. -=. 3c
cj " j Lco ~ )O-o o
1- z c 0)0O 0 cl - u r- m m 9r4f
,4 z;; ~ ~ .- ~ .-. -- -- -- 1
0U,0O r- %0in f)c%9 . 9 , . . . .a .
_j cl m kOo* . ..'J ..-
-- e4 I-j m ~ 0 c-.
==) 1 =
c-~~ cl a
., ..- aimc 0 -)I Daim m
z a-z- - I "
1j 1- - za- 1,r 2 , ,_j- Q ~ Zr- LnO - -C4J0 n
_j0~ La.-', lj C"a - ON
q 90
B-12

L..h
r- -l OCflr40'Jen
(J(. C'J0^:119 1 L.ALa -. z l L
-oA -- rlf-0.7
00 C'CDC~ 00 00.-o q
000 0. L
(D a D0 ) -0wrO
V)L. --Jncl ~
-0Q 4v Lo 4
0 x .0 M___ n__=C
= 0 - x!
w. Q 0e
'A ) . =' ) . .J .. . .uj (.CU -CLiW
V) .-. ui I.-V
L.A L.A LJ ... -cr
'A ji :, X C__
x -V)!2beI,'
CD -jt'A L. L"A~'..~.~
CL 0 Ln 0 O C
0 1
LU .- . C V
InO >- vi 1. 0
--
- c C 0o,-
=. (0 C i a
I- - w !~ - I- G
0 i V D AJV)1
-r 2.. ;
0CLl V'- Iz 0 =D
~LU (.0 L.C'. ~. ILJE',M
B- 13

[THIS PAGE LEFT INTENTIONALLY BLANK]
B-13/a

*~L0
(.2(* cflC~Oj O cO j CD. e* r- Lc' -l -o-ren m-o Lo Ln -- 01- -
~-Ll
~L
_j L .A . : .: 0!.9C l 911 1:" o l
Loz - n% a% (J0 00C.jO CDOC, cr a-~, " r, G 0 -- m0 CL)k 0r q m r- u)o.~. R'j~,r0 ff)'scLn -0. c- ~ ~ I 1c qlrr- :!~.
L.Jo
m- crmcorco Q -__ ___ M__ _ _ _ _ _ _
L.)
v) 4n LO) (. \I0. '.0~(4
me 30 C I >c AV)m- o -c oc-h0 e -. o C 7
cn enI(D 0)O). 0.aw~ mr"CJ c~.folO0O0cVz 0.-s: v) .r .)
Ll -C L.
c c Im- co, r- 9-c qq o - a% o - o
_j LJ -j Ll.-* . .() LJ ~.
v)-
v) c -11
Z~~~~l IDi. ~ J~. ~ nLnJ U.Jo 0ocjo jc nC 1c-I- w 0 r., L.J.j J. ko- o
U) -n" o c ~ mCs 0 !f~ "mf,0 ~ ?l
r, :TOcl % O O cj B-14 o "

ap m ar *L C) . Ln o ID *- fne
-.w CD 0O 0f C ~OC) : 0% l10f101
LD 1O.-O% .~J Oic c 9 Juj0'O.-O%!.
00~ ~~ en Lin~ e. .
m m D lj C. m o~0000 000cc0 '
-j L" c, 00 e
_j L3 C, .(M . Q9 .9q
C: mm(A- - l
cnA co. -e -W " (\ n- ~
-. I-.
cD NJ LCD C, Cl
-. j
F. ll . .
25 %D Ln -Wv o I t nC n Dr )
'~ . ~.~ .~ .J .. I. . . . J . . L.. .
v)
M,CD c uj
V)A
'n Lc) -
LcJ Ic 0l ruj- I
I.6. co Z
CD ______ _ _
_j 0 , c jr o m' l D( D mL)I
Bo-15
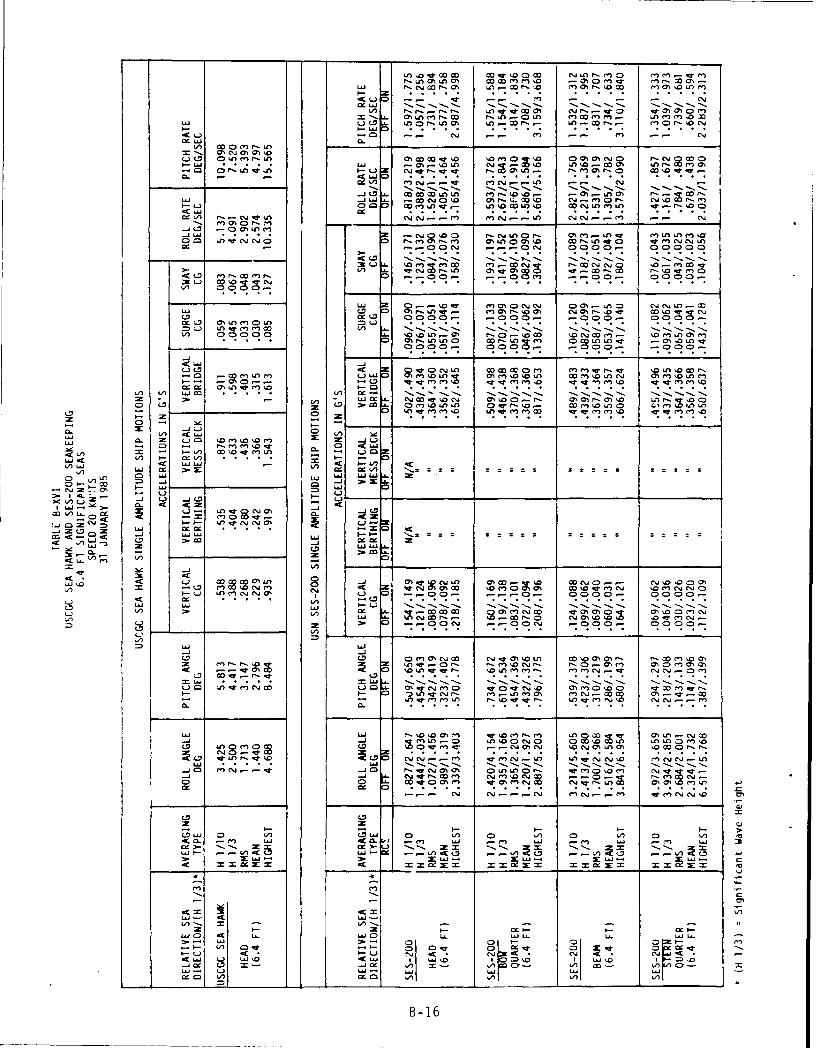
Lo-W -- OD 00q , -O r f - - T (nL a n. .N a, Ln N. co 00 m .rn 10 M. N . -1 00 0.N .
=a m. al CD O
0-L Ln en r fl C0 ~l 00 1 n n0'n
- M C~ m 2
Q ;. .LI P- .
CI c U -4 M0C M .-. C%J LC)0 00000 O
La~~~~ !RL- CDOO ~ eJOr~O~L9 C000. .-o o. -0 0. 000 9
___ __ 0000. 00 -o .- 0004 ..
0~ ~~ (-W 0r)~lf ~ - 1c)L l -T
V~J) I- -O M__ _ r-C ___ o__ o nenLI) _,
co r- 0n (0 LC) M0 (0r. ZC IIc, C0 - CDr.(0 0l C
= -A ~ ~ .U
V) -i V)La ., I - -V) -. J 'o-r- C C , 0 Ln__0C
L7 L) U)F Lc C)' n QfI%
C) C.) .. J C.)
a. 'n CD V
C) LLU
-C LiV) -
-CL '.'O i L. =U -j IDI ~ .
I-C) UC'JO :) .. 0. ---. 0 0- 0 0
C) - C .V >. .' . .
V) 1- o ( n A *. a, 0 10O ( ) . 00 o rn C,JLI! C% CD- ~ CJ (D0( 90 -
V0 0000 8 ~ 0 C'40 r n 00 m 0000
Ln .- . . . .. . .
-- J(. 0 0m cn ej O %% ) cok OrOn O r ) O0
0LJ. . .
ul Le)U.- .-- C.Or' 0 Ul oa Dr l 0 m 1 ) U))0(crlO0'J m U ) mO n l o 0 a
0 0 r, ~ e rZ 4 wmc c - W1 r.u ol ; C c-, .
I.- m OD (" I- M - >C)L 0D -W CD~L 0 ffA 0r (1 A 0 Acr .. .. .. . . .N. . .N. N. . . . .
Ul LD
LaA
V)- La) 11 [ I-* 0 I
CLJ wa( C.a uI L.( 0( a(
<0 (-) K0 (Ai C- <
B-16

[THIS PAGE LEFT INTENTIONALLY BLANK]
B-16/a

v) GOe C0~U -cOr MeJ~' Clcjmcj% nc
-
Lp~L~j -T~l.f en JU cl -r l -
.-jc Q9 . .. 1 a l I!- ta
~~~~ 00 0 0000 0000 00 0000 0
=L) L000 0000 0m0 m000 lmf O )m00 00000l c
3c SLS
S CR ~ ~ ~ o~ .99 .. 9 %C'9 ! 99.9 999
< LJ ..Jj o I
ON (A. co L
Il= . . . .
07 Lo 0' cl C'Jl0W
w cr ;I-
0: -C
v) D- ,- 0, co %Dc7 - .rr %A0c
(DLJ 0 GO 0 vA 0 r (A 0 Ln 0l Q(A j C(Aj c- t2, UJj -l L.W C- C1 hCJ
oi . . . . .- .
LC_ -A - .o-
mA.~ -~ tD I~ e mL - 04 CDammc c -c
v) Ch L. C Lim..- -4 M1 W4Mu c
Lj L.. Lc L C%. 0 Ic c%-
* *I-e
I DC
co 0 ~ co_ __ _ __ _ _ -r c G oDco k __co c L O '
-C c) N - cj c L u. cj0 B - 7 1- Qr

'o r (NJ 00. Lo J -o c- CN ON c
IA C' Ln Cy%11 mo1- AO
It .1 l l 0 . .iC .
P. LJ (NJ C14 -j - - I - -LM
CL~lf0~0ru
*I-~ --1 1- - C1 * -,t - -
* C . "! .iC ,
w m c r-C j -'n C 0C.(-eJ Cfl ~ -0 N - -CNJ--c'mJei
fl.Dl% Q.0 '.j
.& :. .
(AQ ) D CS SfOD~N C NJO CD0 D C 0C ( C C
C, L.JJ (O(Dr' .- 0. en C) (NO-c ' Lf 0Cw0 e ' cl en~ejcJ- CJ.4 tcNJ-.f CC~%j mCNJ"
0 z DC D QC .C
.9 .9 999
UJ L.JU " 0nciL n a1 -
IL0 Cc ;zz V
() V) leV)=-
-~ ji CD z
ui L.J L.J 2
LL'J
01 ort ~ ~ - ~*A z 0 0 0 0 0 0
020
vi L'L
e, 01 0 C~ C>
&gOSLf 'r_ rr- %0OO1 -O
0 ~ ~ ~ ~ ~ ~ ~ l o 0~.-. C0..--~ C>.,-e C,- 0-- -
0 - -- - CI C - Cl CJ. C'M C J.~ - --
LJ C - , - 1
a r -r- D - 0 %C a.R r- (If
0a. .l .% -. l
.u(isCNu co(NU c~N~ o Go JU r- q 0% (n
-1 0 to ( 0 () 0D en 0w (A 0 (AC-
OD~~~ 0.0: o
LD .A L..IL m Lm. L.JU XL2. 1
L* Ij L'* JA * im
8-18

LOcoz
C')
aI-
xl
LL
B-19

VU-)
(12)
00
0 ~
LLU
0 -t
a (D . - - m
000
C0 LL z
* S 0
-m wuon
B -20

z
'00
LuIUI)
C.) m
CL1q _ ___ wI I II I>
B-21

7 j
7c LO0 0
0~0
U1) -)3
r-00
0
CLL
0 0
0 c0
00
4 4'
CZ ma) 0
0 0 z- G
a,, ff~C)
0. D
- (5
B-22

LO
0'0 IJ
t-
CL
CL
'WI1
I ~Iw'.>
44 <3

Ir
C,,
C r CC0
C)l)
0 U0
CC
0 C0
CL Wrn F-
C.Y
C LL
B-24

LO
00
z
(Y)
coiLU
aJ(I
LL
B-25

-71C
III
co07
CL c z
,,e 00CZ-
70 CZ
o 5o
B-26

O
LU
LU
Ci £
LU
LU>
:D
B-27

I/h IIILLI
i//b N
70 IL
0~J I~ Q) -
00
C:)E

BLANK
B-29

APPENDIX C
NASA RIDE QUALITY MEASUREMENTS ONBOARD COAST GUARD CUTTER SEA HAWK
STRUCTURES DIRECTORATE - LANGLEY RESEARCH CENTER
PRELIMNARY INFORMAION REPOR
PIR NO.: SO-5
TITLE: NASA Ride Quality Measurements Onboard Coast Guard Vessel Seahawk
AUTHOR: Dr. Jack D. Leatherwood
ORGANIZATION: Acoustics DivisionStructural Acoustics Branch
DATE: March 1985
C-i

NASA Ride Quality Measurements Onboard Coast Guard Vessel Seahawk
Background
At the request of the U.S. Coast Guard Research and Development Center,
Avery Point, Groton, CT, NASA personnel participated in tests of a 110-foot
Surface Effect Ship (Seahawk) at Key West, Florida during the week of January
29 - February 1, 1985. Specific purposes of NASA involvement were to (1)
utilize the NASA ride quality meter to obtain detailed measurements of
passenger ride quality for comparison with other ride quality measurement
instruments and procedures and (2) to provide a data base for future vessel
acquisition and support. Original plans called for the NASA measurement& to be
made on January 29, 30, and 31. Engine problems prevented acquisition of data
on January 29 but extensive data were obtained during vessel operations on
January 30 and 31.
Results of the NASA ride quality measurements are .presented and discussed
in the remaining sections of this writeup. Consideration is limited to
examination of the various subjective discomfort indices output by the meter.
The physical vibration and noise parameters output by the meter are given in
the accompanying tables but are not directly addressed. First, however, a
brief discussion of the basic concepts embodied within the NASA meter is given
in order to facilitate understanding of the various parameters provided as
routine output by the meter.
Description of Ride Quality Meter
The NASA ride quality meter is a direct implementation of a comprehensive
comfort algorithm developed at Langley Research Center. More than 3,000 people
rode in the Langley Ride Quality simulator where they were exposed to
C-2

2
controlled combinations of vehicle vibration and noise. Each completed a
questionnaire detailing the level of discomfort experienced. These data
provided the basis for development of a computer model, which transforms
individually measured vibration/noise elements into subjective comfort units,
then combines the subjective units to produce an overall discomfort index that
typifies passenger comfort within the total vibration/noise environment. It is
this computer model that is directly implemented within the ride quality meter.
The meter consists of sensing elements to measure vibration in five axes
(vertical, lateral, longitudinal, roll, and pitch) and interior noise. The
vibration and noise data are frequency-weighted in accordance with the
specialized and detailed psychophysical functions that define human response to
noise and vibration. These functions were determined during the course of the
NASA research. The frequency-weighted noise and vibration data are then
applied to the NASA comfort algorithm which outputs via, an internal printer,
the following subjective discomfort indices:
DTOT - Total subjective discomfort index, a single index incorporating theeffects of multiple frequency, multiple axis vibrations and vehicleinterior noise
DVIB - Subjective discomfort due to the vibration environment
DN - Subjective discomfort due to the noise within the combined noise andvibration environment
DIN - Subjective discomfort due to noise if vibration is absent (DVIB 0)
(NOTE: DTOT - DVIB + DN)
DLONG - Subjective discomfort due to longitudinal axis vibrations
DPITCH - Subjective discomfort due to pitch axis vibrations
DROLL - Subjective discomfort due to roll axis vibrations
DLAT - Subjective discomfort due to lateral axis vibrations
DVERT - Subjective discomfort due to vertical axis vibrations
C-3

3
Additional printer outputs are the weighted rms acceleration levels
(GLONG, GPITCH, GROLL, GLAT, GVERT) and the subjective discomfort indices due
to each of six octave bands (63, 125, 250, 500, 1000, 2000 Hz) of noise.
Interpretation of the absolute levels of subjective discomfort output by
the meter relies to some extent upon contextual factors within a given mode of
transportation as well as the prior experience and judgements of the ride
quality investigators. Extensive measurements made onboard other transport
vehicles such as helicopters, trucks, automobiles, and railcars have indicated
that the transition between a comfortable and uncomfortable ride usually
occurred at subjective discomfort levels between approximately 2 to 2.5
subjective units. Whether or not the above guidelines apply to the shipboard
environment is uncertain and subject to future confirmation. For comparative
evaluations of ride quality, however, absolute levels of the subjective indices
are not of concern and direct, reliable assessments of relative ride quality
within and between vessels can be readily made.
It is also important to note that the NASA discomfort indices do not
reflect the influence of vibration energy at frequencies that produce motion
sickness. The ranges of vibration frequencies for which the NASA comfort
algorithm is applicable are given below.
Minimum Freq, Hz Maximum Freg, Hz
Vertical 1 30
Lateral .5 10
Longitudinal .5 6.5
Roll .5 10
Pitch .5 6.5
Noise 50 2500
C-4

4
Measurement Procedure
At the direction of the Coast Guard Project Manager the NASA
instrumentation was set up within a two-berth compartment located on the mess
deck adjacent to the galley area. The five axis accelerometer box was placed
on the floor near the forward end of the lower bunk. The microphone was placed
about one foot above the top surface of the upper bunk approximately two feet
from its forward end. Also located on the upper bunk were the ride quality
meter, an audio tape recorder, and a seven channel instrumentation recorder.
These recorders were used to obtain backup data to be used in the event of ride
quality meter failure. At this location the meter was operated almost
continuously throughout the tests. The meter was turned off during long stops
(e.g., lunch) and to change printer paper when required. On the first day of
testing the meter was inadvertantly turned off for 52 minutes. This is noted
in Table 1.
Results from Day 1
A summary of the meter output quantities for Day 1 is given in Table 1.
This table contains approximately one-fourth of the meter output for Day 1.
Included in the table are the various discomfort indices described earlier as
well as the weighted root-mean-square acceleration levels for each axis of
vibration. The left-most columns contain the numbered ride conditions and
clapsed meter time (measured from initial turn on and subsequent meter resets
to zero time). Each discrete time is arbitrarily defined as a ride condition
and provides a convenient parameter for subsequent plotting of the data. This
is particularly useful since information required to relate meter events (e.g.,
time) to specific test and/or operating conditions was not available at the
C-5

5
time of measurement. Thus, the discussion and comments that follow, as well as
implications derived from these results, must be treated as objective observations
base upon examination of the "face value" of the data. No attempt is made to
explain fluctuations and/or trends in the data or to account for the significant
differences between the results of Day I and Day 2 (to be discussed later). This
is left up to the cognizant Coast Guard test personnel familiar with the actual
conditions under which these results were obtained.
The meter output parameter that typifies overall human subjective comfort
response is the total discomfort index, DTOT. This parameter is plotted in Figure
I for each of the ride conditions of Table 1. Also shown in Figure I is the noise
discomfort index, DN, which represents the contribution of noise to the total
discomfort index. (Since DTOT - DVIB + DN, the difference between the two curves
in figure I is the vibration contribution to total discomfort). These data
indicate that human comfort -response within the measured environments is
influenced most by the vibration components of the environments. It is also
evident that total measured discomfort varied considerably over the range of ride
conditions on Day 1. Highest levels of discomfort were obtained during cruise
away from the harbor (rides 4-14) and return to the harbor (rides 50-71). The
least discomfort occurred during turning maneuvers (rides 15-31) and during the
stop for lunch (rides 38-44).
Recall that the measurement of ride quality within other transport vehicles
has indicated that discomfort threshold generally corresponded to discomfort
values between 2.0 and 2.5. Using this range as a tentative guideline, it was
found that 38 of the 71 ride conditions would be classified as uncomfortable, with
the degree of discomfort increasing as the value of the discomfort index
increases. Examination of Figure I may also give the impression that the noise
C-6

6
component of discomfort would be totally acceptable for all ride conditions.
This, however, would be erroneous. The reason for this is due to a fundamental
interaction between noise and vibration discovered in the course of the NASA
ride quality research and incorporated in the comfort algorithm. The nature of
this interaction is such that the noise contribution to total subjective
discomfort depends upon the level of vibration simultaneously present in the
environment. This means that, for a given level of noise, the noise discomfort
index will be greater for an environment with low vibration than for an
environment having high levels of vibration. This is important since it means
that reducing vibration alone will not necessarily solve a ride quality problem
since the crew and/or occupants then pay more attention t3 the noise. To
assess this effect the ride quaity meter provides an additional output (DIN)
which is the noise discomfort index that would occur if vibration were totally
eliminated from the environment. In this case the noise discomfort index would
be identical to the total discomfort index (i.e., DTOT - DIN when DVIB - 0).
This index is presented in Figure 2 for comparison with the actual noise
discomfort indices measured in the presence of vibration. This comparison
implies that, even if vibration could be greatly reduced (by a ride control
system, for example), the noise discomfort would increase for many of the ride
conditions so that, in many instances, the ride environment would still be only
marginally acceptable. Achievement of an acceptable environment would require
that measures also be taken to control noise transmission into the interior
environment. The ability to provide this type of ride assessment is one of the
more powerful features of the ride quality meter.
A detailed examination of the effects of individual axes of vibration on
the measured discomfort response for Day I is presented in Figure 3. Shown in
C-7

7
this figure is the vibration discomfort index, DVIB, and the relative values of
the single axis discomfort indices from which DVIB is derived. Only the
vertical, lateral, and roll vibration discomfort indices are presented since
the pitch and longitudinal discomfort indices were relatively small (see Table
1). These data indicate that roll axis vibration was the dominant contributor
to vibration discomfort for many of the ride conditions (4-14, 32-37, 57-71)
and had the least influence at other ride conditions (16-31 and 38-44).
Vertical axis vibration generally was the second largest contributor to
vibration discomfort followed by the lateral vibration component. Both the
vertical and lateral discomfort components exhibited less fluctuation between
ride conditions than did roll discomfort. As will be discussed later these
results are somewhat different from those obtained on Day 2. Explanation of
the fluctuations of the data in Figure 3 and the relative levels of the several
discomfort indices must await subsequent analysis of the physical vibration
data and identification of the ride conditions by the Coast Guard.
Results from Day 2
The meter output quantities for Day 2 measurements are given in Table 2.
A total of 69 ride conditions are given which cover a total test duration of
approximately 7 hours. The data presented in Table 2 represents about
one-seventh of the meter data obtained and is representative of the discomfort
history for the Day 2 testing. The total discomfort index, DTOT, and noise
discomfort index, DIN, are plotted in Figure 4 for each of the ride conditions
of Table 2. These data indicate that total discomfort remained relatively
constant throughout the test and generally did not reach the peak levels
attained on Day I (see Figure 1). The pronounced dips in DTOT represent
measurements made when the vessel was dead in the water. Comparison of Day 2
C-8

8
and Day 1 results also shows that the discomfort due to noise was higher on Day
2. This is likely due to the noise/vibration interaction described earlier and
not to a significant increase in interior noise level. If the vibration levels
could be reduced to zero then the noise discomfort index would take on the
marginally acceptable values represented by the open symbols of Figure 5. This
further illustrate that reduction of vibration only may not be sufficient to
achieve acceptable crew ride comfort.
The various vibration discomfort components for Day 2 that most influenced
ride comfort are illustrated in Figure 6. These results differ from those of
Day 1 (Figure 3) in several aspects. These include:
(a) Vibration discomfort for Day 2 did not attain the high levels measured
on Day 1.
(b) The dominant component of vibration discomfort for Day 2 was vertical
vibration. One Day I (see Figure 3) the dominant discomfort component
was roll vibration.
(c) Roll discomfort on Day 2 varied only slightly over the various ride
conditions as compared to the large fluctuations in roll discomfort
observed on Day 1.
(d) The lateral component of vibration discomfort for Day 2 was similar to
that measured on Day I.
Explanation of the difference between Day I and Day 2 discomfort
measurements must await future evaluation of the physical ride data by the
Coast Guard.
C-9

9
Summary Comments
It has been seen that the NASA ride quality meter provided a variety of
output parameters characterizing passenger comfort within the SES environment.
Many of these parameters are unique in that they represent subjective indices of
comfort and hence permit direct identification of the particular physical
parameters of the environment that most contribute to passenger discomfort. This
is not always apparent from analysis of physical noise and vibration factors
alone. The ultimate usefulness and/or applicability of the NASA discomfort
indices in the evaluation of shipboard ride quality is a matter that must be
decided by the Coast Guard after careful correlation of the data contain herein
with the physical data characterizing the operating conditions throughout the
tests,
C-10

c0
LU
0' 0
LU6.0CLU .0 T
LU E~, 0 co
cr 0
IC)
c-i

-C
0'3
K03 '-~ -V 0
20
a U.2
~L~9
Li.
o -
Ii- i.L.o ~
o ~A
o5
0@
I I
Lfl
0 vd 0 Z S \ ~
C-12

........... 0
0j 0 r
< 0
00
_ _ _ _ _ _ _ 0
H~u JJ~osc
C- 1

ClCF- ~e~ZT. H 2
zF-A =
Cl)Y 0
o00 F-
00
LO C ~
xepu I JOILtWO3SIQ
C- 14

C-15

pie
~LO
0 -0" 1"'I 0.0
z 0
a~ ca
COC"
0D 0 00+
Xapu I J0ILW0QSIQ
C- 16

z~ -7"
t__ I________e -
-_ _ _ -
-< C -4b If
LA lug, 7
ibj w 2
toi' 'n C-hC~l Zj n iI p
S 3 o a
14 -1 Z "I T C- 17
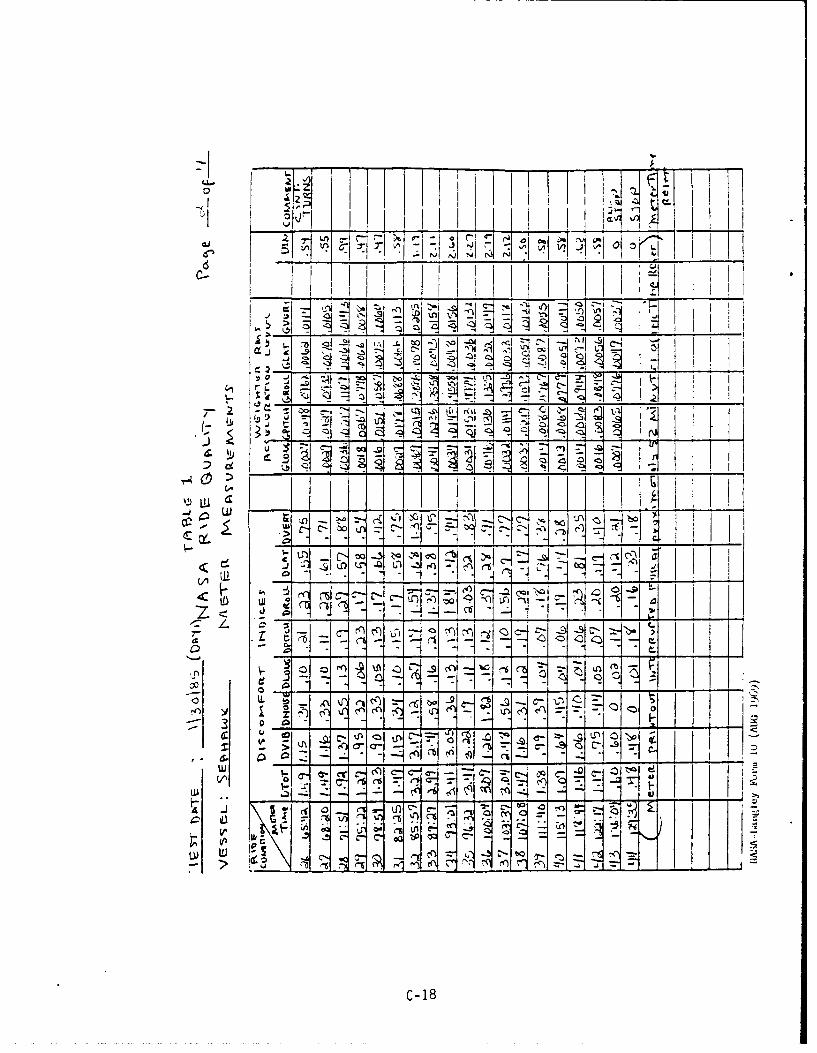
,p0
-~~ -4-:I
-t -.u
4 I Ia c0 z(4 ' C- s ___
4.I 1 77
E ~ .J C* - C, oz _
uj~ -'- 1
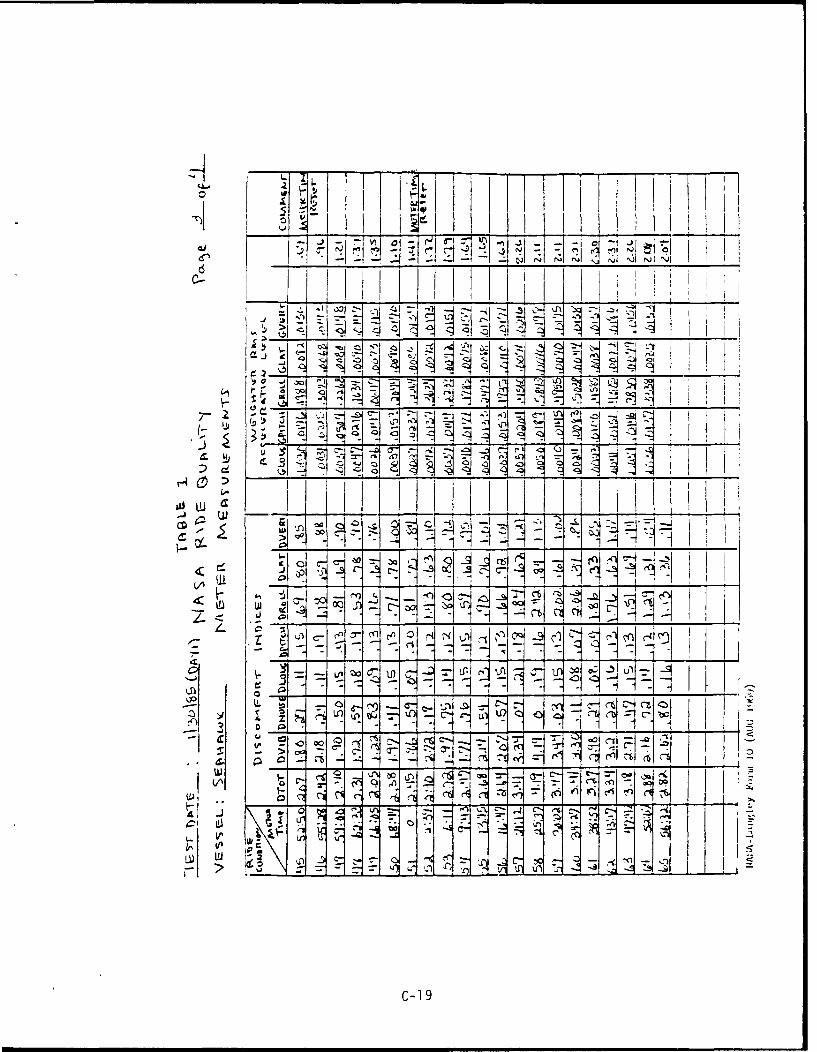
Z I t , i i !l i
4 1 1 I
i j .. , l -
< Q
7I. 4ij71N { - I '
7i 0 i- ini
". - - - =" . .J i . , , i
C-19

-4,
:K1 v in 21w
9 \E
C-1I
C vv 20~ ~

o i r1 _1 O rl
i T- Is I -q~ *~-~C - ,
______ eb
~~*1 -~~4 51_ _ _ _ _ _
~2 . __C11
I___iii I~ofc-i t . ~n~i~t '41
FT~
A0 01 -'. - ~ ~ 10
L-L 1111 _
CaV~ __
__
7---Q
-- 5 h6c C i C. c
C-21

j- I-- g
dal 22-

~ol 70 I'
"-I Ii
C!,- G21 14
- -
-- J
___ __ _____ ~ __
2 -_____________ ____L__
___o__ I
C; ____ ____ ___
£11 -i- -1_
10 C , 5 c
~~~Lr ____ ~r~-VV_
~ u~i~~ _ _ ~C-23
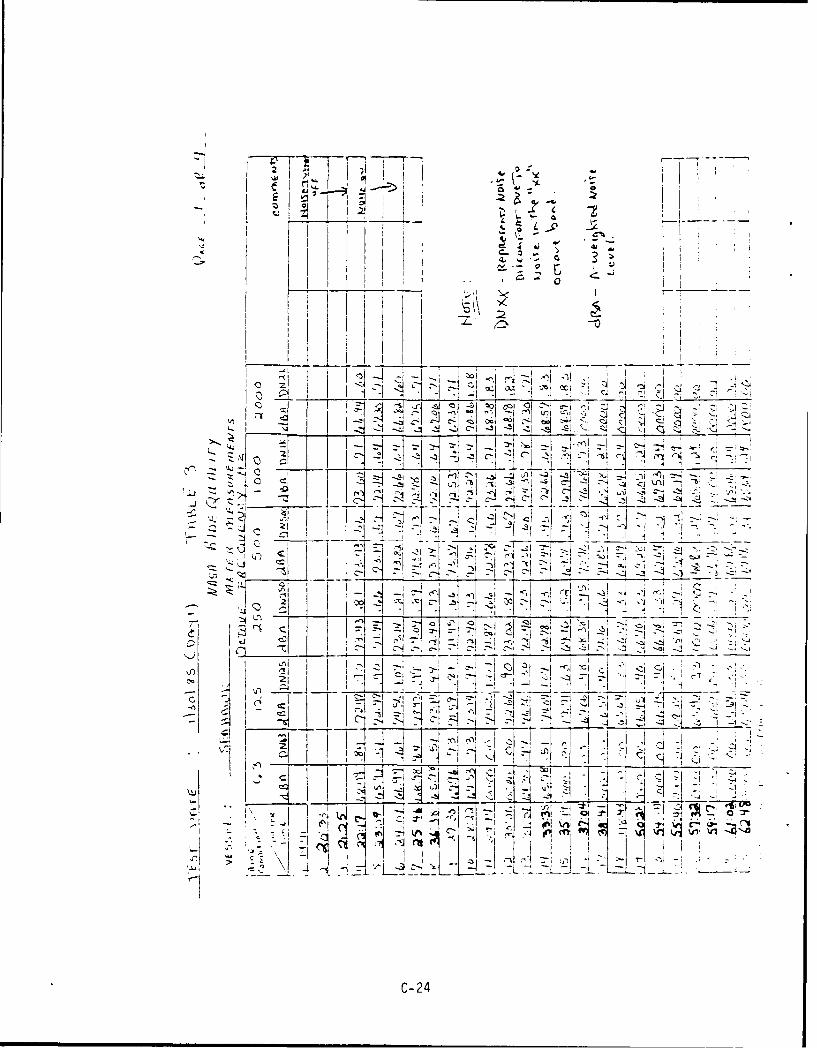
In I
II i -
--- -S -Z I .,
~LA
C-24

t
7 I
L
I ___ __ _ ____
NC-2

,I I i ,.. i
I,
i !~~II'I
I j
p t IiI IF
-C-2
! ~ ' J I i
jI-II
.1 C-26

C- I -,
t7)1
Iii I I
C-2

C u---
_z, -2
C- I
4- ~ I
zl~I
'rj c
OdI
:Z__ __ _ Ic
4 7L
q N\iI__1~~~~~~-~ qC-28.2~

I --
CI I
'rj 14 (- j c
- l-
tI I
777
C-29

jj rrnI I
-IIn4~
LLI- _ .LL;
C7
:.j_
-
-C:3