Embed Size (px)
Citation preview

AD-751 099
DYNAMIC SOILS INVESTIGATIONS. PROJECTBUGGY, BUC-KBOARD MESA, NEVADA TEST SITE,MERCURY, NEVADA
Z. B. Fry
Army Engineer Waterways Experiment StatioaVicksburg, Mississippi
January 1965
DISTRIBUTED BY:
E-fj3National Technical Information ServiceU. S. DEPARTMENT OF COMMERCE5285 Port Royal Road, Springfield Va. 22151

DYNMICSOILS" INVESTI GAt.IO NS'-PROJECT BUGGY, B4UCKBOARD. .'MESA'
NEVADA TEST S!TE,,. MERCURY,"NEVADA(N by,
Z. ~ S '. A -
January 1965
leproduced' by
NATIONAL TECHNICALINFORMATION SERVICE
U S Department c~f CommercoSpringfield VA 22151
U. S. Army Engineer Waeerways Experiment StationCORPS OF ENGINEERS
Vicksburg, Mississippi

MISCELLANEOUS PAPER NO. 4-666
DYNAMIC SOILS INVESTIGATIONS
PROJECT BUGGY, BUCKBOARD ; MESA
NEVADA TEST SITE. MERCURY,.NEVADAby
Z. B. Fry
January 1965
U. G. Army Engineer Waterways Experiment Station
CORPS OF ENGINEERSVicksburg, Mississipp;
AY.-PARC VICKSBURG., MISS.

Foreword
The investigations described herein were requested verbally by the
"Emnbankment and Foundat-on B~-anch and the Geology Branch., Soils Division,
U. S. Array Engineer Waterways Experiment Station (WES), Vicksburg, Missis-
sippi, in connection with the investigations being performed for PROJECT
BUC13Y at the Nevada Test Site, Mercury, Nevada. The field investigations
were performed from 7 through 10 February 1964+.
Engineers of the WE~S who were actively engaged in the field investi-
gations, analysis, and report phases of this study were Messrs. R. 0I.
Cunny, Z. B. Fry, R. F. Ballard, Jr., and J. L. Decell of the Soils Divi-
sion and Mr. H. C. Greer III of the Instrumentation Branch. The work was
under the general supervision of Messrs. W. J. Turnbull and A. A. Maxwell,
Chief and Assistant Chief, respectively, of the Soils Division. This re-
port was prepared by Mr. Fry.
Col. Alex G. Sutton, Jr., CE, was Director of the WES during the
( conduct of the investigation and preparation and publication of this re-
port. Mr. J. B. Tiffany was Technical Director.
3.11407A38

Contents
Foreword............ . . . ....... . . . . . . . . . iii.
Summary ..................... . . . . . . . . . . . . . . viiBackground, Purpose, and Scop', of Study ... ....... ..... ... 1
Location and Description of TeL't Site ........... 9. . .9.. 1
Tests and Test Methods .... . ............ ..... 2
Results of Tests ................ . . ............. 2
Site 1 . .. . . ........ ... . . . . .. . . . . . . . . . . . 4
Discussion of Results ................... ........... 5Conclusions ......................................
Recommendation ............................... . . . . .. 0 9 7
Plates 1-24
APE'IDIX A: DETERMINATION OF ELASTI". CHARACTERISTICS OF SOILS BIDYNAMIC FIEID TECHNIQUE: . ...................... . Al
v

Summary
Dynamic soils investigations were conducted at Buckboard Mesa,Nevada Test Site, Mercury, Nevada, to obtain data on the characterisiicsof subsurface materials underlying test locations propc.i:ed for crateringexperiments. Specifically, tne investigations were conducted to determinethe feasibility of utilizing dynamic techniques to rapidly determine anddelineate subsurface materials, thereby reducing the number of soil borings
i now required for such investigations. The investigations were. performed inareas where borings had been previously made in order to compare results
with known conditions and also in areas of unknown subsurface composition.
The investigations were conducted in two separate phases, i.e. seis-mic and vibratory, at four locations. Twelve seismic and four vibrationtraverses were made. The seismic traverses indicated very well the depthof overburden or topsoil, and also the underlying vesicular basalt. How-eve2, discontinuities encountered-in practically all of the seismic Zra-verses, indicating the presence of Jow-velocity materials, cinder lenses,wvertical fractures, etc., preývented such exploration to deeper depths, and
•° • it is doubtful that an underlying layer of dense basalt was actually en-i countered. The vibratory traverses were extended to greater depths than
the seismic traverses and definite "breaks" could be seen in the shearSvelocity at these greater depths. The shear and compression moduli wereSalso determined with vibratory traverses.
By integrating the results from the two methods of investigation, itwas possible to prepare an approximate profile of materials in the area todepths of approximately 90 ft However, a correlation of data obtained inthe dynamic investigations and from borings at site 4 was not possible be-cause of the erratic data obtained in the vibratory tests at this location.
It is concluded that dynamic techniques, such as those utilized inthe investigations reported'herein, can be used to rapidly determine thecharacteristics of subsurface materials such as those encountered in theBuckboard Mesa area.
Vi.,

- DYNAMIC SOILS IDESTIGATIONS, PROJECT BUGGY
FUCKBOARD MESA, NEVADA TEST SITE
MERCURY, IEVADA
Background, Purpose, and Scope of Study
1. This report describes and presents the results bf dynamic soils
investigations performed in connection with PROJECT BUGGY, Buckboard Mesa,
Nevada Test Site, Mercury, Nevada, to obtain data on the characteristics of
the subsurface materiels underlying selected test locations on Buckboard
Mesa. Specifically, the investigations were conduoted to determine the
feasibility of utilizing dynamic techniques to rapidly determine the char-
acteristics and layer thickness of subsurface materials, and thereby pos-
sibly reduce the number of soil borings now required for such investiga-
tions. ITe investigations were to be performed both in areas where borings
Shad been made (in order to compare results with known conditions) and also
in areas proposed for the PROJECT BUGGY crater experiments where borings
hadd not been made.
Location and Description of Test Site
2. The test area, located on Buckboard Mesa, is approximately 50
miles north-northwest of Mercury, Nevada. The top.-graphy of the area and
the test layout are shown in plate 1. The proposed site for PROJECT BUGGY
is located in the central portion of the mesa near test sites 3 and 4 which
are locations for other crate2 experiments. Sites 1 and 2 are areas inves-
tigated by the U. S. Army Engineer Waterways Exper'iment Station (WES).
3. The mesa rises rather abruptly to an elevation of approximately
5400 ft msl. The surface of the mesa is gently rolling t .rrain with numer-
ous large Loulders exposed over the entire area. Borings previously made
near the proposed PROJECT BUGGY test area indicated a thin layer (about
5 ft) of residual topsoil underlain by vesicular basalt varying from 35
to 90 ft in thickness changing to gray, hard, dense basalt below the vesi-
cular layer (plate 2). The basalts are interspersed with numerous lenses
of cinders and vary from highly to moderately to slightly fractured zones.
I9

Tests and Test Methods
4. The dynamic investigations were conducted in two ate phases:
seismic and vibratory. Each phase was designed to reveal specific informa-
tion on the physical properties of the soil underlying the test area. The
tests were performed in accordance with methods described in Appendix A.
5. The investigations were conducted at four l.ocations: sites 1, 2,
4, and BUGGY 2 (plate 1). The tests at site 1 consisted of three seismic
traverses (S-I, S-2, and S-3) and one vibratory traverse (V-3). The tra-
verses were run on a southeasterly line from ICG 2.1 to site 4, Just north
of and parallel to the site 4 access road. The tests at site 2 consisted
of six ';eismic traverses (s-6 and S-7, S-5 and S-8, and S-9 and S-10) and
two vibratory traverses (V-5 and V-9). The seismic traverses in this area
were reverse traverses, e.g. S-6 and S-7 were conducted in opposite direc-
tions over the same line. The site 2 area was just south of the access
road to site 4 and was indicated as that area in which the PROJECT BUGGY
tests were to be conducted. One seismic traverse (S-4) and one vibratory
traverse (V-4) ware run in the vicinity of site 4. Two seismic traverses
(S-l1 and S-12) were conducted at BUGGY 2. BUGGY 2 was a borehole pre-
viously drilled for subsurface exploration, but the area was considered
undesirable for the proposed PROJECT BUGGY tests. Both the seismic and
vibration traverses were conducted along linek extending 100 ft or more.
6. As previcusly stated, the area was covered with large exposed
boulders which prevented access with the vibratory equipment to the areasof seismic traverses S-1 near NCG 2.1 and S-11 and S-12 at BUGGY 2. In-vestigations were concentrated at site 2 since this was believed to be a
satisfactory locaticn for PROJECT BUGGY.
Results of Tests
Site 1
7. The results of the three seismic traverses conducted at site 1
are shown in plates 3 through 5. Traverse S-i (plate 3) indicates a veloc-
ity of 1425 fps in the near-surface materials to a depth of 4.2 ft. Below
4.2 ft the velocity increases to 3455 fps; however, a discontinuity occurs
•a "I

at a distance of about 60 to 90 ft (see plate 3) from the geophone location
and again at about 125 ft, where the velocity decreases to I460
8. The results of traverses S-2 and S-3 (plates 4 and 5) 1ixI Icate
a velocity of 1050 fps for the near-surface materials to depths of U.6 and
5 ft, respectively. There appears to be a transition zone along S-2 in
which the velocity increases to 1940 fps from depths of 4.6 to 16.5 ft.
Along S-3, the velocity increases to 1750 fps below 5 ft. . Below the 16.5-
ft depth along S-2, the velocity increases to 4000 fps. There is a dis-
continuity on traverse S-3 at about 30 ft from the geophone location, but
a velocity of 6250 fps is obtained between 60 and 200 ft from the geophone
location.
9. The vibratory traverse V-3 was conducted along the same line as
seismic traverse S-3. Plates 6 and 7 present results of the velocity
determinations and velocity versus depth, respectively. The shear veloc-
ity increases from approximately 250 fps near the surface to 940 fps at a
depth of 10 ft. The increase in velocity is then more gradual to 1300 fps
at a depth of 26 ft. There appears to be a definite "break," or change, in
the shear velocity at approximately 10 ft from the surface.
Site 2
10. At site 2 traverses S-6 and S-7, S-5 and S-8, and S-9 and S-10
were run along - line extending 300 ft from northwest to southeast. The
results of the seismic tests are shown in plates 8 through 10. The veloc-
ity in the near-surface material was 1050 to 1100 fps, except for traverse
S-7 which indicated a velocity of 1750 fps. There is some discontinuity
indicated by traverses S-6 and S-7. Near the southeast end of these tra-
verses, the terrain began to rise sharply and no doubt had a considerable
amount of the fractured rock interspersed with the residual top soil.
There are also indications of discontinuities at the northwest end of tra-
verses S-9 and S-10 where the rock is apparently nearer the surface. The
velocities obtained in the material below the 6- to 10-ft depths varied
considerably. Traverses S-9 and S-10 indicate a transition zone from 4 to
18 ft with velocities of 1500 to 2000 fps, and below 18 ft, velocities of
4500 fps. The velocities obtained from traverses S-5 and S-8, and S-6
ranged from 2500 to 14000 fps below the 6- to 10-ft depths.
11. The vibratory traverses V-5 and V-9 were conducted along the
3

same l.ine as seismic '-raverses S-5 and S-8. and S-9 and.S-10. The reslt a~
of V-5 dndV-9 (plates 11 through 14) indicate that the velocit increases*
from approximately 250 near the surface to 1200 fps at a deph f 15 ft.The velocity remains relatively uniform below 15 ft, i.e. from to1150 fps from 15 to 40 ft for traverse V-5, and from 1200 to 1400 fps from
15 to 54 ft for traverse V-9. Below the.40- and 50-ft depths, the veloc-
ity gradually increases to approximately 1900 fps at depths of 93 and 90
ft for v-5 and V-9, respectively.
Site 4
12. The area at site 4 had been previously prepared for a test simi-,
lar to the proposed PROJECT BUGGY. The area had been thoroughly investi-
gated and was considered to be a satisfactory site for cratering tests.13. The surface around site 4 had been graded and cleared of prac-
tically all topsoil, and many l.arge boulders or rock surfaces were visibleat the surface. Seismic traverse S-4 was conducted in a northwest direc-
tion from site 4 and the results (plate 15) indicate a velocity of 2300 fps
to a depth of 6.5 ft, increasing to 4000 fps below that depth. A disconti-
nuiity occurs at about 80 ft from the geophone and the velocity then de-
creases considerably to about 1250 fps.
14. A vibratory traverse V-A was conducted along the same line as
S-4, and the results (plates 16 and 17) are very erratic; only the values
obtainecO at the low frequencies (12 to 20 cps) are considered valid. Mea-
surements were attempted with numerous other frequencies from 20 to 100 cp.3,
but the signals were very distcrted and measurements could not be made.
The higher frequencie were equally erratic; only two velocity values
were obtained and tiese may De questionable. The lower frequencies pro-
duced velocities ranging from 1720 fps at 43 ft to 2100 fps at 88 ft. A
boring log (from previous tests) for the site 4 area is provided in plate
17 to illustrate the subsurface conditions.
BUGGY e2
15. The BUGGY 2 sibe was an *. ea In which a boring had previously
been made for subsurface explorat.or in cnn.;.bion with proposed site se-
lection for PROJECT BlUIGY. Tio •e.s'iz travervres (S-II and S-12) were
ducted in opposite directions at ihl'- sii e, overlapping the borehole by
about 20 ft.' The -esults (plates I'30 and 19) indic(..te a velocity of 1600 fps
4
4

in the near-surface topsoil to depths of 3.1 to 3.5 ft, increasing to 2750
to 3000 fps below those depths. Discontinuities began to appear about
midway of both traverses. Vibratory traverses could not be cond ted in
thi! area as large boulders on the surface prevented access with he
equipment.
Discussion of ResuIt;
16. The results of the dynamic tests, both seismic and vibratory,
irdicated that considerable stratifications or discontinuities exist in
the subsurface matcrials in the areas in,,restigated. The seismic travErses
usually indi .)ted only the compression velocity and the thickness of (he
topsoil or near-surfac? layer. Below the near-surface layer, disconr,inu-
ities encountered in practically all of the seiLmic traverses, except S-5
and S-8, indicated the presence of low-velocity materials, cindor lenses,
vertical fractures, or abrupt change in depth of underlying mater.als. The
seismic tra-erses conducted at sites 1, Z_, and BUGGY 2 indicate a layer of
topsoil from 3 to 6.5 ft in depth. TheF depths are well validated by re-
sults of the borings conducted at -, ,e 4 and BUGGY 2.(see plate5 17 throligh
19), which indicat,-: similar de-ths of overburden. At site 2 tha seismic
traverses indicated a gradual dip in the underlying rock from northwest
to southeast, increasing from about 4 ft at the northwest end of traverse
S-9 and S-10 to about 10 ft at a point midway on traverse S-( and S-7.
The velocitie; in the range of 2500 to 4000 fps obtained at sites 1, 2, 4,
and BUGGY 2 ar• believed to 0e representative of the vesicuLar basalt in
the area. This i•s further validated by the logs of boringt; for BUGGY 2
and site 4, plate. 17 through 19. It is doubtful that the dens-e lasalt was
actually encounterel except perhaps with traverse S-3 at site I for which
a velocity of 6250 f,'s was obtained at some mndeterminabLe depth (plate 5).
Normally, compression velocities of 8000 to 13,000 fps i.re expected for
dense basalt.
17. The vibrato traverses by which a shear velocity was determined
extended the exploratio:, to greater depths than could be reached with the
seismic, traverses. Def.,Jte "breaks" could be seen "n the velocity versus
depth plots for sites 1 ýid 2 (plates', 12, and 1.4), and materials believed z
A *= .. :• m=l • m•

to be present at variouq depths were designated. The information from
vibratory traverses was also utilized in conjunction with that obtained
from the seismic traverses to construct an approximate profile of materials
for the areas investigated (plate 20). The vibratory traverse conducted
at site 4 produced some rather erratic results, and measurements could not
be obtained to indicate the satisfactory test conditions previously indi-
cated by the boring made in the area. The boring log, shown in plate 17
in conjunction with results of traverse V-4, does not indicate partW.iularly
variable subsurface conditions; however, the traverse was conducted along
a line from 35 to 135 ft northwest of the boring, and it is possible ths.t
conditions may have changed.
18. The results of the vibratory tests were further utilized to
determine the shear moduli G and compression (Young's) moduli E in accord-
ance with methods outlined in Appendix A. To determine theýe moduli,
values of Poisson's ratio and density of the materials had to be obtained
or assumed. Samples of the subsurface materials had been previously ob-
tained, and laboratory tests were conducted by the VES Concrete Division.
The following values were found to be applicable to the depths shomn:
Density Poisson'sDepth, ft lb/cu ft Ratio
0 to 10 95 0.2510 to 50 145 0.20
50+ 170 0.20
The values of Poisson's ratio appear to be somewhat low, but even doublii1 g
the values would not affect the results more than 5 percent. Using the
preceding values in conjunction with the previously determined shear veloc-
ities for corrt.sponding depths, the compression and shear moduli were
determi.ned for traverses V-3, V-5, V-9, and V-A and, are plotted versus
approximate depth in plates 21 through 24. Also shown in these plates are
j the limits of the materials believed t, be indicated by the data. The de-
lineation of the depths of the different subsurface materials is made with
the kricwledge that such particular materials exist as previously determined
by nwiirous borings in the area. If this knowrledge had not been available,
specific designations such as vcsicular basalt and dense b•,sait could not
, 6
& ,• • • m ,= W ( m m -, ine ~ m mmmm• ' =m

have beern made and only the apparent changes in materials could be shown.
Conclusions
19. The results of the investigations irdicate that dynamic methods
can be used to rapidly determine the characteristics of subsurface m,ýtrials
3uch as those encounfered in the Buckboazd Mesa area. The se.ismic invet •i-
gations indicated very well the velocity and thickness of the topsoil aud
the velocity of the vesicular basalt. The vibratory techniques provided
a means of extending the depth of investigation at sites 1 anc? 2. The
correlation between vibratory and boring data was not concli ve for
site 4, the area previously determined to be "satisfactcry." The area
deemed most satisfactory from results of these tests was site 2, although
site 1 also was considered to be acceptable.
Recommendation
20. It is recommended that exploratory borings be made at sites 1
and 2 to provide a means for correlation of the predicted and actual sub-
surface characteristics of these areas.-
;~, ~ i.
6-:
S•• • . :• • •.• ... • •...:..• ,, ,...
• .. /• ;i', " ,

. + o . . .. .. rt l . .... ... - ....... .... . -- _ .
'°
ii i i • , i i i =11 |l i ii
NCO I.I
S"• BUGGY
S,•.• • 2
i SSTE Z
!t • =TE 4f
•_.• ___.• .•..--a. GENERAL TOPOGRAPHY OF AREA
SA
J•
LEGEND '•-'•. •UGG• Z
•" b. TEST LAYOUT
SSCALE IN FEET
S100 O. /00 200IlK--
AREA TOPOGRAPHY ANDTEST LAYOfJT ..,
S!
PLATE I
• '•- ."•_ .•...•...•F•-,••-,-,..__., ,- ,,•=• .......i• mlmamm • • • m • • • • • •

40 <3
U U
I I0<
<0~
-o-
'It 12d h lS1
PLATE 2-~'

z
waL
e0 Cj -
ItL
wwo
4L w
0 ~ i
VCIN :)39'111 NO 1MII
- - - - - -- - - - - - - - - - 3

z2u
o Ucr-
- -
00 -0 0z
SONO:3%1'llr4 N 3.i
PLT 4.

z
z W
Wj-w
ow>
w'7
EE-
Iii
CIO
MYRA-

7'
d I ' b
lbe~ OZ-tl u 47
* ~ ~ i~ 'of?
024 080 8 0 1 002
DITAC IN:10 FEET
I NOT~ X= AVEL NGTT
'01, --- t

1jl
VELOCITY IN FEET PER SECOND X 102
0 5 90 ,5 20 25 30 35
RESIDUAL TOPSOJL3 R1S4,. N'ps
TRANSIT'CW ZONEto TOPSOIL AND ROCK
VES;CULAR BASALT ?
isI ww
I-
I-
~250ccIL
30--
35 - ____
4511
VIBRATORY VELOCITYVSDEPTH
TRAVERSE V-3
PLATE 7

7.ri
U) V
<0)
I~U I-S
Z-
1 ~4.
-43-
0
SON00SITIMNI 3H
PLATE0

Z Wz
zw'U.)
0 i
>. c
hit
it
z
"Id
00
IL.
NO
d' 0~ 0- 0
GVNO:)3SIl1WI NI 3V11J.
PLAT-C 9

OU) 0
4'4
F3.
0-~~4 0 00
TONOD31111H I 3V4-
PLATE 10

k7r11 /q
vd-
a. (41 ,1 i / 000
o 20 40 0 60000DITAC A~ FEETV1
NOTE: ~WAVEiNGA.V~' WAV VELCIT v;; '0
100 1 -04 0 -1ol -oc =#I FPS

e-.
-,-
0 VELOCITY IN FELT BEASS ECOND X0
-
RESIDWiML TopsoIL
0 T"OPSOIL AND0, FRACTURED ROCK
0 VESICULAR BASALT30
w40
z DENSE SASALr
IL
i ,,,
xx
I-
(L6
-' ~70--
80
VIBRATORY VELOCITYVS DEPTH
TRAVERSE V-5
PLATE 12
•-1.

-•' • i: -- -o• "- • ' " ... - ,- •
-A,-
- "- - --- -
f Is
I /,• /4 , i,1/ i
X/7/
206,ýe 40 O0 10 10N 4
/o /
/0 IN FEET
TR VE S V I,
p j Fr V=68 FPS
DISTANCE IN FEET
NOTE: X =WAVELENGTHSV WAVE VELOCITY
VELOCITrY DE"TERM INATIONS'ROki~ VIBRATORY TESTS
TRAVERSE V-9
1- PLATE 13

VELOCITY IN FEET PER SECOND X 102
0 5 10 is 20 25 30 1 3500
000 __-TRANSITION ZONE-
TOPSOIL AND"P.RA.CT(IRED ROC*
200
VESICULAR BASALT
30- -
70 -,0
80 -
DENSE TASA4T
- -___
80 _po___m___u__ __a_
*~~~1 ~~90----- -C
VIBRATORY VELOCITYVS DEPTH
TRAVERSE V-9
PLATE 14

P t. - ... . --
SZ w
0.
- - - - - - ---
ik
~~~~~0LATE.

4 /
II
4//
3 - -
0/IIc/' ///
2 0 C~!~ 11 70 fPS10- - - -0_ ~. 6 i7 P
.,PS / 7 F . .,
24 60 8C 100 120 140DISTANCE IN FEET
[4
NOTE, X =WAVELENGTHSV = WAVE VELOCITY
VELOCITY DETERMINATIONSFROM VIBRATORY TESTS"
TRAVERSE V-4
PLATE 16

VELOCITY IN FEET' PER SECOND X 102
10 is 20 2
00
00
20--
'or -rm UsMAt, W. 0 /m1W RT U 0 1 5 0 20 Or
vft.. -~ fleI..
20d IN, Im .1 II. 1
-30 M-; WAL, ".N_ __C
m.? a n vi i , n
1. L
40 -6 4__ ._____'t
60
0~6 to2~' 0 t
I
01 00n'o 10.00I0 .
PRJC PLASCHE.E 17,IAA EA

-~~~~~~~ cn.-..-"-~----!
z 8.
IW
"Iitu0
I-
0 40IQO)sll NJ ..J
PLATE 1

i- t
tijy------------------------------
00
SON03S~lim H 31-
------- 1

-l W
(U ILI
S.a.IW w
IL c
0 U) Zo
00, z
00
<
ri) i NMI Z w
- 0. < IzJ- W0.
00zI
PLAT 20
MODULI "P PSI X I0320 40 o0 so too 120 140
"* A o600
5 r op, OlL
£0 0
A VDSICULAR SASALT
I 1 A
hi
II_
¶ _oI _ _ _ _ _ A 0,o
0 01 ~35-
1 ~40__
S~~LEGEND ;
SYMBOL MODULI
a SHEAR0 COMPRESSION
MODULI VS DEPTH
j TRAVERSE V-3
PLATE 21

1-81
I 0MODULI INs x 10o30
5ft 0 RE~ocucrop.sol.c
600-i 8
10 6 0 T7ANS/TION ZOALr1SOIL AAP ROCKA 66
0 0
SA 0
A0
VESICULAR SASALT
'IiI . 30[-BA~l 7
,•. 0
.440
IX 60
70
800
900
100
LEGENDSSYMBOL MODULIa SHEAR0 COMPRESSION MODULI VS DEPTH
TRAVERSE V-5
PLATE 22

C I
io RESIDUAL TOPSYL"h0
£ 0aO 0 AI N ROC
SA 0
00
30,
VESICULAR BASALT
i a 50,
•o DENSE SASAL 7
4
A
!z
• 00
LEGEND
SYMBOL MODULIS HCOMPRESSION MODULI VS DEPTH
TRAVERSE V-9BL
PLATE 23
VAX-. ", TR," ... . .

S- MOODU IN PSI X I0t100 200 300 400 am ow 7400
ia 0 TOM, AND ROCKI; A 0_' ""
30
I00
"" L•NsSEASALT
70 ____
900
LEGENDSYMBOL MODULI
a SHEAR0 COMPRESSION
1' MODULI VS DEPTHTRAVERSE V-4
PLATE 24
r*

Ali
APHMIIX A: DETEMINMATION OF EIASTIC CHAMPCTERISTICSOF SOInS BY DYNAMIC FIELD TECHNIQUES
1. This appendix is a re'sume of the usual tests performed and
methods employed in the Lweseigation of in-situ soils by vibratory tech-
niques. While every test described herein may not be applicable to the
study described in the main text, they are presented to describe better
the methods and the basic theories on which the procedures are based.
Seismic Tests
2. Seismic tests1 '9 are made to determine the velocity of com-
pression waves in the soil; this velocity is used in conjunction with
other data to determine Poisson's ratio. The seismic data are col-
lected first so that the presence of unusual subsurface conditions, if
any, can be revealed, and on thN basis of this information the vibration
lines can be located to the best advantage. A hammer-type seismograph
is used because of its portability, accuracy, and simple and reliable
operational features. In practice, a measuring tape is stretched away
from a geophone .vhich is embedded in the soil. A 9-lb sledgehammer,
incorporating a switch that closes when the hammer strikes a blow, is
used as the impulse source. Compression waves are produced by blows of
the hammer on a steel plate placed on the ground at regular intervals
along the tape. When the hammer strikus the plate, the switch on the
hammer closes, activating a binary counter. When the compression wave
produced by the hammer blow reaches the geophone, the counter auto-
matically stops, thus indicating the time required for the wave to
travel from the point of impact to the geophone.
3. Data are plotted in graphic form as impulse distance versus
travel time. The reciprocal of the slope of the lines drawn to connect
the plotted points indicates the velocity of the wave through each sub-
surface medium encountered. A distinct break in the slope of the line
* Raiscd numer~uls refer to similarly numbered items in list of refer-ence, at end of this apcpndix.
S. .... .. . , , , , tn, e!. ,. ll I
A2 -
i 2 " " - . -"
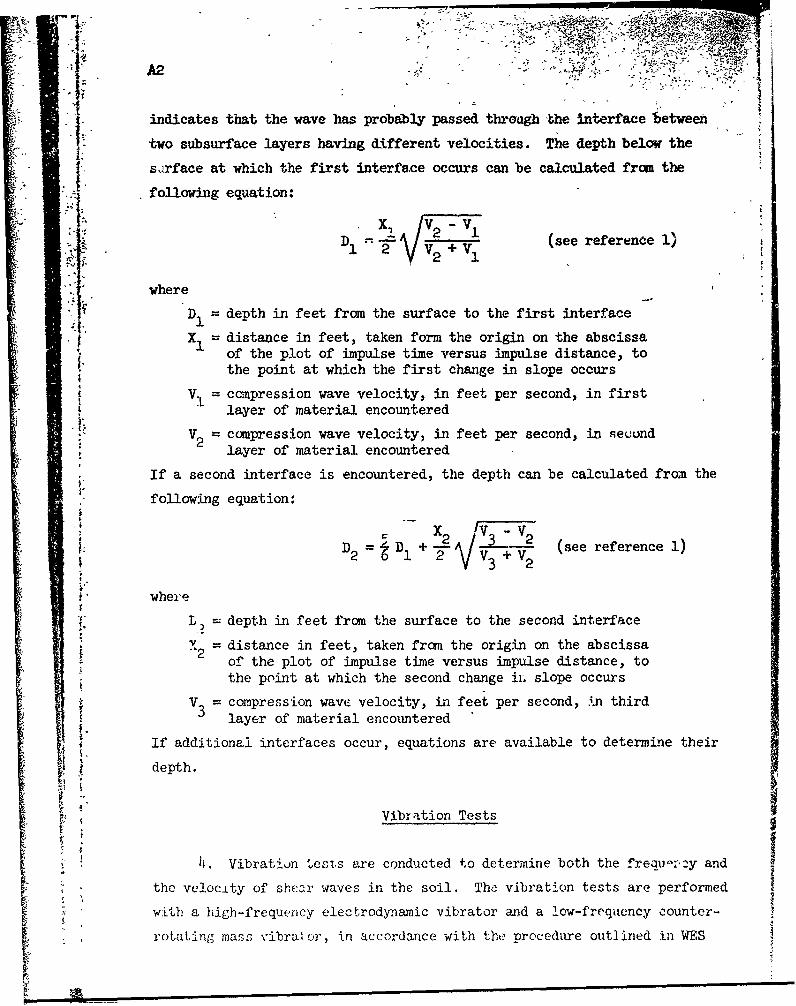
indicates that the wave has probably passed throegh the Interface between
L two subsurface layers having different velocities. The depth below the.. sarface at which the first interface occurs can be calculated from the
I following equation:
D - 2 1. (see referenee 1)
V2 1
where
D = depth in feet from the surface to the first interface
X = distance in feet, taken form the origin on the abscissaof the plot of impulse time versus impulse distance, to
the point at which the first change in slope occurs
V. ccmpression wave velocity, in feet per second, in firstlayer of material encountered
V2 = compression wave velocity, in feet per second, in second2 layer of material encountered
If a second interface is encountered, the depth can be calculated from the
following equation:
'• x• IV3 - v"1 V3 (see reference 1)
S• where
L) depth in feet from the surface to the second interface
SV = distance in feet, taken from the origin on the abscissaSof the plot of impulse time versus impulse distance, to
the point at which the second change ii. slope occurs
V3 compression wave velocity, in feet per second, .,n third3 layer of material encountered
If additional interfaces occur, equations are available to determine their
depth.
7 4 Vibration Tests
i. Vibration tests are conducted to determine both the frequ'-"-zy and 3
the velocity of shear waves in the soil. The vibration tests are performed
with a high-frequency electrodynamic vibrator and a low-frequency counter-
rotating mass vibra. or, in accordance with the procedure outlined in WES

I A3Miscellaneous Paper No. 4-577., A Procedure for DeterL.Aing Elastic ModuU!
of Soils by Field Vxbratory Techniques. The referenced report explains in
detail how wavelengths of propagated Rayleigh waves (treated as shear waves)
of known frequency are used to determine the shear and compression moduli
of subsurface materials.
Wave propagation
j 5. When sustained vibrations are induced into e- soil, concentric
'waves are propagated outward from the source. The waves require a tiae
Sto travel a distance X through tho- soil in which the wave velocity IsVV . If the waves are propagated et a known frequency f , then
, V = Xf (see reference 4) (3)
where
X= wavelength, ft
This velocity is dependent upon the ratio of the elasticity of the medium
to its mass density p , and the wave ty-n-. If the shear modulus G is
taken as a measure of the elastic propertAes, the shear wave velocity V
is defined by:
S V5 (see ree:ence 4) (4)
where
g = acceleration due to gravity = 32.2 ft/sec/sec
7 = wet density of soil, lb/cu ft
p = mass density g 6
6. In regard to the wave type, R. Jones states that the shear and
longituding2 waves produced by the vibrator are radiated into the entire
volume of the medium and undergo much greater attenuation than the RayleighSwave, which is propagated near the surface. Cons'equently, the vibrations
that are detected along the surface of a semi-infinite solid which were
>2.. produced by a vibrator normal to the surface are almost exclusively Rayleigh
waves. fleiland2 thinks it fairly certain that transverse waves are the most.5-8
Probable. Richart and othýrz, citing Miller and Percy (1955), state that
in an elastic solid wiith a Poisson's rat•io of 0.25 for the case of a single

source of vertical load on a free surfLce, D7 percent of the energy is dis-
sipated as Rayleigh waves, 26 percent as shear waves, and only 7 percent as
compression waves. While the ground does not behave in a purely elastic
manner, this does indicate that the predomir ant wave would be expected toi•Ii be a Rayleigh (surface) wave. However, the Uifferences between vý!locities
of Rayleigh and shear waves with changes in .oisson's ratio are so small
as to be of no practical significance in comiection with foundation prob-
r lems. A relation between Poisson's ratio anc velocities of propagation of
"compression, shear, and Rayleigh waves is shcwn in fig. Al. Since, as shown
by fig. Al, the velocities of Rayleigh and shear waves are so similar, the
propagated surface waves can be considered to be shear waves for all prac-
tical purposes and their relocities can be determined by vibratory tests.
4
V
2-
_ _ _ I _ _ I .... _ _o . ...__ __ I __ _ __ _-
R-WAVErS -
0 0.1 0.2 0.3 0.4 0.1POISSON'S RATIO-"
Fig. Al. Relation between Poisson's ratio pand velocities of propagation of compression(P), shear (S), and Rayleigh (R) waves in a
semi-infinite elastic medium
Computation of Poisson'sratio and elastic modtli
7. The velocity of a wave V is determined by the product of the
frequency f and wavelength .• It is then employed in the following

'.A --
equations which describe the mathematical relation of Poisson's ratio and
the compression and shear moduli.
I= 2 V( ) (see reference 2) (5)
ell
where
IV= shear wave velocity, fps
VC compression wave velocity, fps
t Poisson's ratio
i E = 2(1 + P) PVs (see refcrence 3) (6)i 144
where
E = compression modulus, psi
jp = mass density of soil =7 (where y = wet density, lb/au ft, andg
g = acceleration of gravity)
2(l + p)(7)
I where
G = modulus of shear elasticity, psi
It should be noted here that equations 4 through 7 are for hamogneous,
is'otropic, elastic materials.
S"th,• of computation
8. The preceding paragraphs have disci.ssed the theory and mathematics
tjýlizjd in the seismic and vibratory techniques to obtain Poisson's ratio
'81 the elastic moduli of soils. To present and utilize properly the data
''IieIted, a definite pattern, or sequence of computation, has evolved as
"P!vrience progressed.
9. The basic, data obtained by means of the vibratory technique are
as distances between troughs and peaks as a function of th ber

of wave)engths. The wavelength for a particular frequency is er-
mined as the reciprocal of the slope of the line through the p)1 tted
data points. The velocity of the shear wave is then determined by equa-
tion 3. A compression wave velocity which is determined by the metnod
described in paragraph 3 is used together with the shear wave velocity
to determine a Poisson's ratio by equation 5. Cautioi should be exer-
cised to ensure selection of the shear and compression wave velocities
for corresponding media or depths. As an approximation, it can be said
that propagation of the shear wave takes place at a depth equal to about
one-half the wavelength. Therefore, using one-half the wavelength as the
depth at which the velocity of propagation of the shear wave occurs and
the velocity of the compression wave at a corresponding depth, a Poisson's
ratio can be obtained for materials at different depths. The elastic
moduli, E and G, can then be computed by means of equations 6 and 7,
respectively. It is usually convenient to plot E and G versus depth,F which again is considered to be one-half the wavelength of the shear
wave. Such a plot provides a visual picture of the change in soil
characteristics with increasing depth. The depth can also be expressed
as overburden pressure in pounds per square inch, providing a comparison
of E and G with increasing pressure.
Natdral Frequency Determinations
10. Simple tests are conducted to determine the natural frequevcy
of the soil. Philips velocity pickups, oriented in both the horizontal
and vertical modes, are used to record the ground vibrations. Vibrations
"are produce,! b'y firmly embedding a striking plate in the soil and strik-
ing the plate with a sledgehammer, thus producing vibratory waves in the
soil which propagate at the natural frequency of the soil. Distance from
the velocity pickuos to the point of impact will vary, depending upon soil, types and conditions. The respon.ie of the velocity pickups to the vibra-
tion of the soil is recorded on an oscillograph. From this record, the
frequency of vibration can be determined. This record can be further
utilized to determine the damping ratio of the material in respect to
surface waves. The .ogar.itlhmic decrement can bQ determined as follows"

A7
I xLogarithmic decrement (see reference 5)X n+1
wherewr X = an amplitude
n•n+l = the succeeding amplitude
The damping ratio V can be deter-mined as follows:X
V =1 In n (see reference 5) (9)S~~Xn+l .
Attenuation Studies
11. Attenuation studies are conducted basically in the following
manner. A vibrator is positioned in a strategic location, and velocity
pickups or accelerometers are placed along a straight line at known dis-
tances from the vibrator. The vibrator -s then operated through a range
o:' frequencies, and the response of the transducers to each frequency is
J recorded on an oscillograph. From these records, the amplitudes of
These values can then be graphically represented as amplitudes or accelera-
tions versus distance from the source. This graphic representation of
amplitude or acceleration as a function of distance will usually lead to
the formulation of either an exponential or power equation.
12. Studies have been made concerning the damping of elastic waves
in soils8 in which it was stated that both the horizontal and vertical
components of Rayleigh wave amplitude diminish according to the law of
annular divergence, i.e. inversely with the square root of distance.
This reduction of wave amplitude is due to geometry alone and assumes no
damping. Assuming that damping occurs, the amplitude of the propagated
wave can be described as follows:
wheeX "(Xn-X1) (see reference 8) (lO)
F where
Yn= the amplitude at distance xn
the amplitude at distance x

A8
a= the absorption coefficient, wblch corresponds to the coefficient
of attenuation, and is a measure of the decay in intensity of anel-.stic wave writh distance
The coefficient of attenuation is related to the logarithmic decrement 8
by
where
c = the phase velocity, fps
a) = 21r X frequency of the propagating wave, cps
It should be noted that the attew, ation of amplitude in the basic assump-
tion is in respect to displacement. However, through knciwn mathematical
4 relations the data can be presented also in terms of velccity or accelera-
tion.
4,4
'0

REFERENCES
1. Geophysical Specialties Company, Engineering Seismograph". 1961.
2. Heiland, C. A., Geophysical Exploration. Prentice-HallIr.c., NewYork, N. Y., 1940.
3. Heukelom, W., Dynamic Testing of Pavements; Survey of TheoreticalConsiderations. Unpublished.
4. Heukelom, W., and Foster, C. R., "Dynamic testing of pavements."Proceedings, American Society of Civil Engineers, Journal of SoilMechanics and Foundations Division, No. SM1, Part 1, vol 86, NewYork, N. Y. (February 1960), pp 1-28.
5. Jacobsen, L. S., and Ayre, R. S., Engineering Vibrations. McGraw-Hill Book Co., Inc., New York, N. Y., 1958.
6. Jones, R., In-Situ Measurement of the Dynamic Properties of So byVibration Methods. Highway Research Board Bul!etin No. 277, 1960.
7. Richart, F. E., Jr., "Foundation.vibrations." Proceeaings, AmericanSociety of Civil Engineers, Journal of Soil Mechanics &Yad FoundationsDivision, No. SM4, Part 1, vol 86, New York, N. Y. (August 1960),pp 1-34.
8. Richart, F. E., Jr., Hall, J. R., Jr., and Lysmer, J., Study of thePropagation and Dissipation of "Elastic" Wave Energy in GranularSoils. Prepared by University of Florida under Contract DA-22-079-eng-314, for U. S. Army Engineer Waterways Experiment Station, CE,Vicksburg, Miss., September 1962.
9. U. S. Army, Office, Chief of Engineers, Subsurface Investigation,Geophysical Exploration. EM 1110-2-1802, 19-48.