Embed Size (px)
Citation preview
GS
University of MassachusettsAmherst, Massachusetts 01003
Department of Civil EngineeringEnvironmental Engineering Program
fccute Toxiclty Tests:General Description and Materials
and Methods Manual T. Fish
Finv.Eng. Report Mo. 72-83-?
Stephen Plotkin and Neil M. Ram
Aoril 1983
Acute Toxicity Tests: General Descriptionand Materials and Methods Manual
I. Fish
by
Stephen PlotkinResearch Associate
and
Neil M. RamAssistant Professor
Department of Civil EngineeringEnvironmental Engineering Program
University of Massachusetts, Amherst, MA 01003
Submitted to theMassachusetts Department of Environmental Quality Engineering
Division of Water Pollution ControlAnthony D. Cortese, Sc.D., Commissioner
Thomas C. McMahon, Director
April 1983
I. ACKNOWLEDGEMENT
Portions of this report have been excerpted from the following
sources:
1. American Public Health Association (1975);
. ' 2. Peltier (1978);
3. Medeiros et al. (1981);
4. and Weber (1980).
The authors wish to express their thanks to the UMass graduate and
UMass and Smith College undergraduate students, that have participated in
the bioassay studies at the Environmental Engineering Program Laboratory,
Department of Civil Engineering at the University of Massachusetts. Thanks
are also extended to Ms. Dorothy Pascoe and Kevin Sheehan Cor their help in
preparing this report.
The research, which helped in contributing to the information pro-
vided in this manual, was supported by the Massachusetts Division of
Water Pollution Control, Research and Demonstration Project Number 80-32.
(i)
II. EXECUTIVE SUMMARY
Toxicity tests determine the concentration of a chemical or percentage
of some complex waste which causes either death, or some altered physio-
logical process reflecting interference with the normal life cycle of a test
organism, and may be used to assess the impact of a pollutant on aquatic
organisms in a receiving water. There are several types of fish toxicity
tests including: 1) acute; 2) chronic; 3) subchronic embryo-larval; and
4) early juvenile toxicity tests; as well as 5) avoidance; 6) respiratory
activity; and 7) blood chemistry tests. This report describes the principles,
techniques, and calculation procedures used in acute toxicity testing with
fish as the test organism. Particular methods are described for test protocol
using fathead minnows (Pimephales promelas) as the test species. While acute
toxicity tests may be conducted using either static, continuous-flow, or
renewal .procedures, the report emphasizes protocol for static fish toxicity
testing. Such tests are conducted by exposing a population of test organisms
to varying concentrations of toxicant over some time period and observing
mortality at each toxicant concentration so that the LC50 (lethal concentra-
tion causing 50% mortality) may be calculated. An ILC50 value (incipient
LC50 value below which 50 percent of the test organisms will not die from
the toxicant stress even upon prolonged exposure) can also be calculated
from acute toxicity data.
The report provides information about selection of test organisms,
cleaning of facilities and equipment for toxicity testing, preparation and
choice of appropriate dilution water, fish procurement, acclimation and
(ii)
and prophylactic treatment, sampling procedures and test procedures for .
both screening toxicity tests and LC50 determinations. The report also .
describes general test conditions and protocol including temperature,
filtration, lighting, feeding and toxicant concentration, as well as the
interaction of dissolved oxygen, hardness, alkalinity, pH and ammonia on
toxicity data. Methods for data analysis are presented including: 1) Log-
concentration vs. percent survival; 2) Probit; and 3) Litchfield Willcoxon
abbreviated methods. A computer program is also described which calculates
LC50 values and associated confidence intervals. The applicability of
such laboratory derived toxicity values to field conditions is addressed*
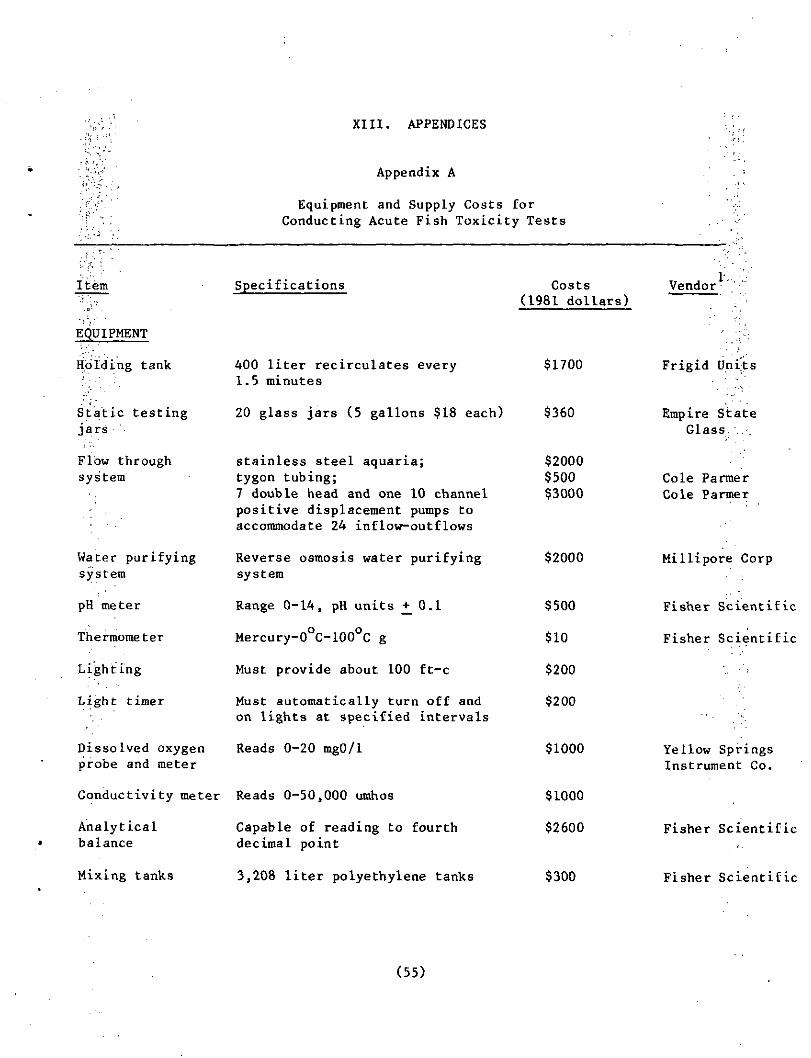
A listing of required equipment and supplies for conducting routine
static fish toxicity tests for one year is presented along with 1982 costs
which totaled about $18,000. While continuous flow toxicity tests may
occasionally be preferred over static tests for wastes or chemicals having
high biochemical oxygen demands or that are unstable or volatile, static
toxicity tests usually provide comparable information about the toxicity
of a chemical or sample waste as do flow-through tests. Static tests are
therefore usually preferred since they are simple and easily controlled
and are less capital and labor intensive than flow-through tests. Additionally,
they do not sacrifice sensitivity, reproducibility, and applicability to
field extrapolation.
(iii)
III. TABLE OF CONTENTS
I. Acknowledgement i
II. Executive Summary ii
III. Table of Contents Lv
IV. List of Figures vi
V. List of Tables vii
VI. General Description of Fish Toxicity Tests 1
VII. Types of Fish Toxicity Tests 3
VIII. Acute Fish Toxicity Test Procedure 6
1. Selection of Test Organisms 62. Cleaning of Facilities and Equipment 93. Preparation of Dilution Water 94. Procurement of Fish 135. Acclimation Period 146. Disease Treatment 167. Sampling 188. Evaluation of Acute Toxicity 20
A. Screening Toxicity Tests 21i. Ranging Oxygen Test 21
ii. Screening Jar Test 22B. LC50 Determination 22
9. Data Observation 24
IX. Types of LC50 Acute Toxicity Tests 26
1. Static Toxicity Tests 262. Flow-through Toxicity Tests 263. Renewal Toxicity Tests 284. Transfer Toxicity Tests 29
X. General Test Conditions and Protocol 30
1. Physical and Chemical Data 302. Dissolved Oxygen 303. Hardness, Alkalinity, pH and Specific Conductance 324. Ammonia 325. Temperature 346. Filtration 347. Lighting 348. Toxicant Concentration . 349. Feeding 35
(iv)
XI. Data Analysis 36
1. Calculation of LC50 36A. Log-concentration vs Percent-Survival 36B. LitchCield-Wilcoxon Abbrelvated Method 38C. Probit Method 43D. Computer Program 43
2. Calculation of the Incipient LC50 Value 433. Applications of LC Values 46
XII, References 52
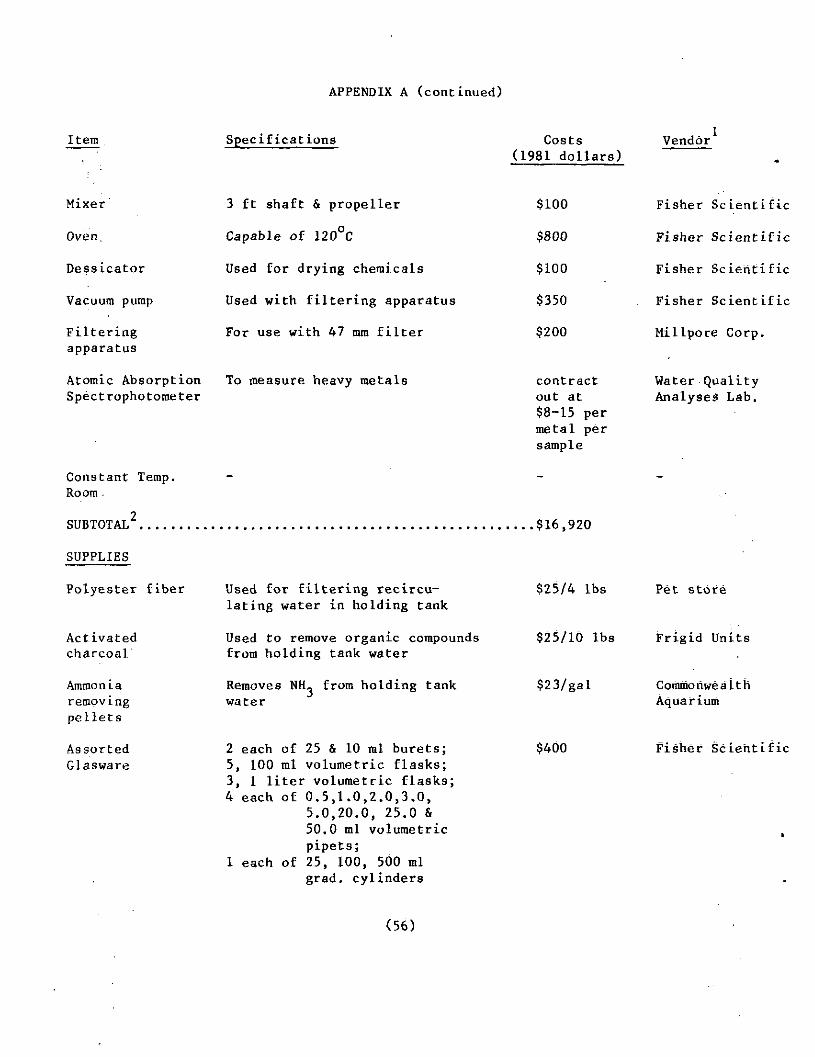
XIII. Appendices 55
A. Equipment and Supply Costs for Conducting Acute 55Fish Toxicity Tests
B. Dealer Addresses 58C. Computer Program Used to Calculate LC50 Values 59
and Confidence IntervalsD. Laboratory Worksheet 66
(v)
IV. LIST OF FIGURES
Number Title Page
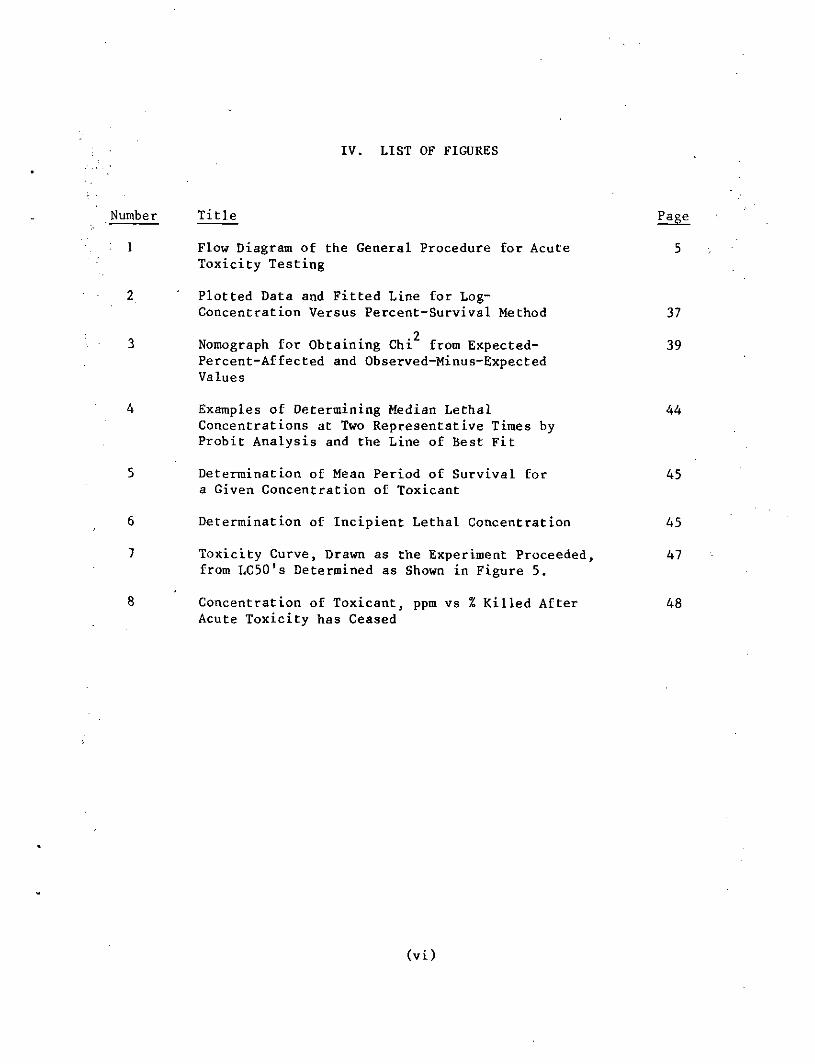
1 Flow Diagram of the General Procedure for Acute 5Toxicity Testing
2 ' Plotted Data and Fitted Line for Log-Concentration Versus Percent-Survival Method 37
23 Nomograph for Obtaining Chi from Expected- 39
Percent-Affected and Observed-Minus-ExpectedValues
4 Examples of Determining Median Lethal 44Concentrations at Two Representative Times byProbit Analysis and the Line of Best Fit
5 Determination of Mean Period of Survival for 45a Given Concentration of Toxicant
6 Determination of Incipient Lethal Concentration 45
7 Toxicity Curve, Drawn as the Experiment Proceeded, 47from LC50's Determined as Shown in Figure 5.
8 Concentration of Toxicant, ppm vs % Killed After 48Acute Toxicity has Ceased
(vi)
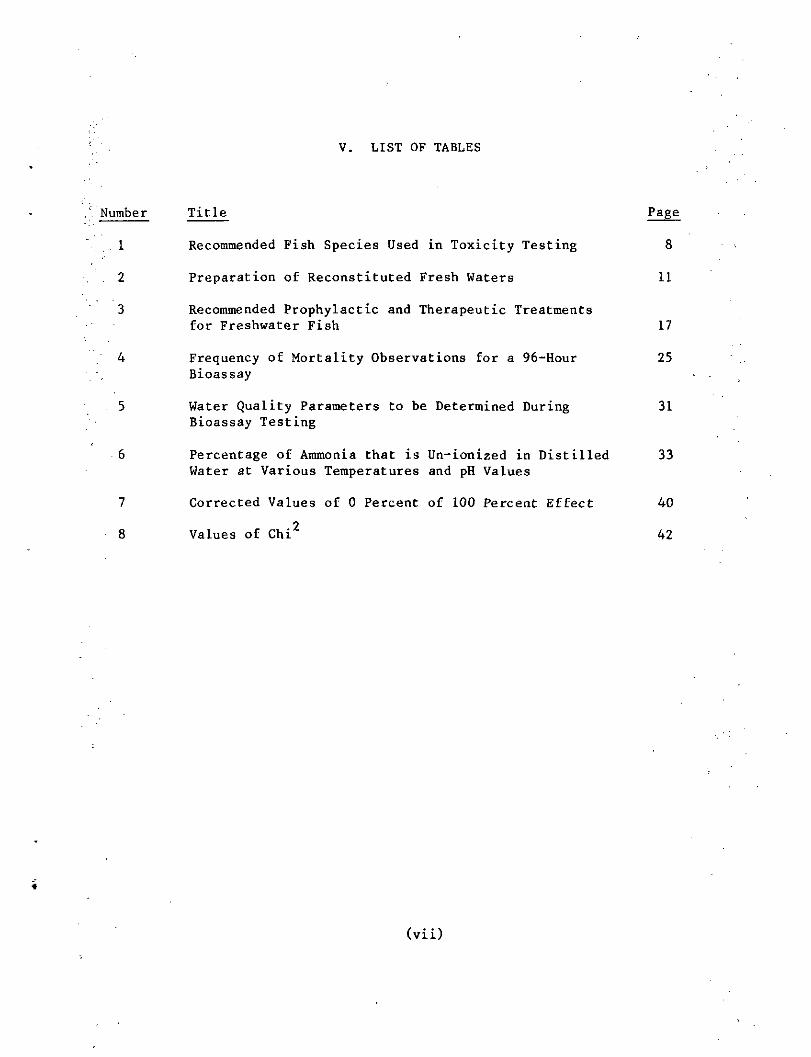
V. LIST OF TABLES
Number Title Page
. 1 Recommended Fish Species Used in Toxicity Testing 8
. 2 Preparation of Reconstituted Fresh Waters 11
3 Recommended Prophylactic and Therapeutic Treatmentsfor Freshwater Fish 17
4 Frequency of Mortality Observations for a 96-Hour 25Bioassay
. 5 Water Quality Parameters to be Determined During 31Bioassay Testing
6 Percentage of Ammonia that is Un-ionized in Distilled 33Water at Various Temperatures and pH Values
7 Corrected Values of 0 Percent of 100 Percent Effect 40
8 Values of Chi2 42
(vii)
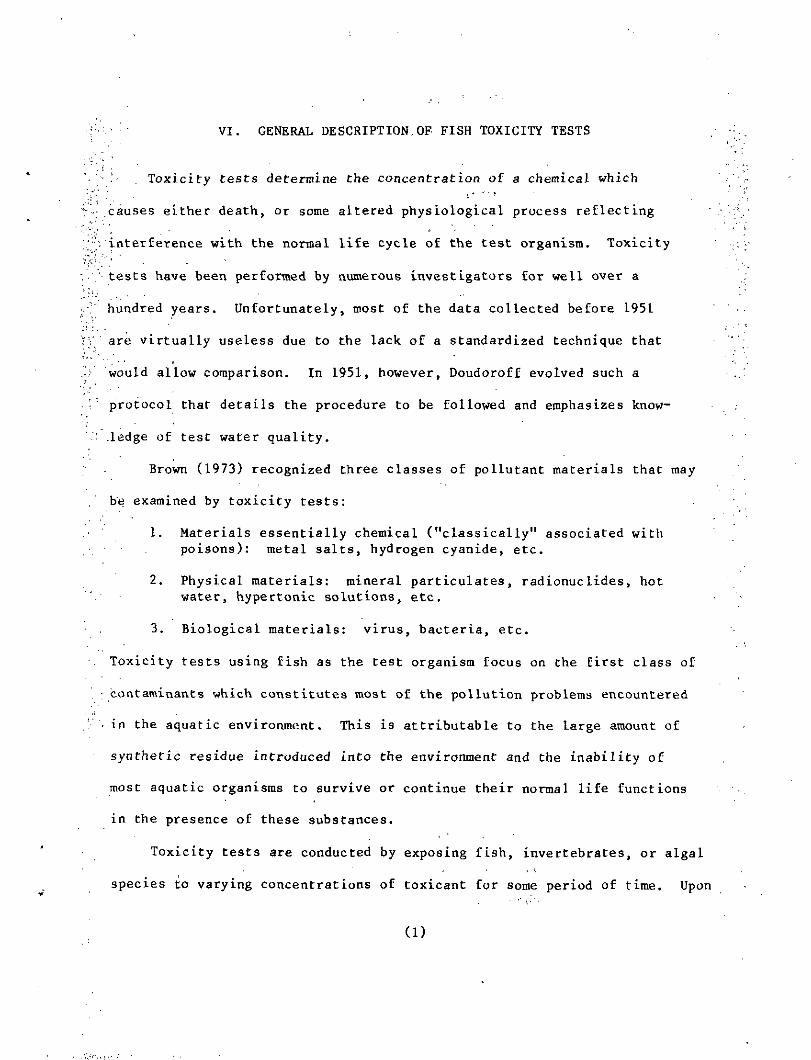
.' •• VI. GENERAL DESCRIPTION,OF FISH TOXICITY TESTS
, Toxicity tests determine the concentration of a chemical which
causes either death, or some altered physiological process reflecting
interference with the normal life cycle of the test organism. Toxicity
tests have been performed, by numerous investigators for well over a
hundred years. Unfortunately, most of the data collected before 1951
are virtually useless due to the lack of a standardized technique that
would allow comparison. In 1951, however, Doudoroff evolved such a
protocol that details the procedure to be followed and emphasizes know-i,
.ledge of test water quality.
Brown (1973) recognized three classes of pollutant materials that may
be examined by toxicity tests:
1. Materials essentially chemical ("classically" associated withpoisons): metal salts, hydrogen cyanide, etc.
2. Physical materials: mineral particulates, radionuclides, hotwater, hypertonic solutions, etc.
3. Biological materials: virus, bacteria, etc.
Toxicity tests using fish as the test organism focus on the first class of
contaminants which constitutes most of the pollution problems encountered
in the aquatic environment. This is attributable to the large amount of
synthetic residue introduced into the environment and the inability of
most aquatic organisms to survive or continue their normal life functions
in the presence of these substances.
Toxicity tests are conducted by exposing fish, invertebrates, or algal
species to varying concentrations of toxicant for some period of time. Upon
(1)
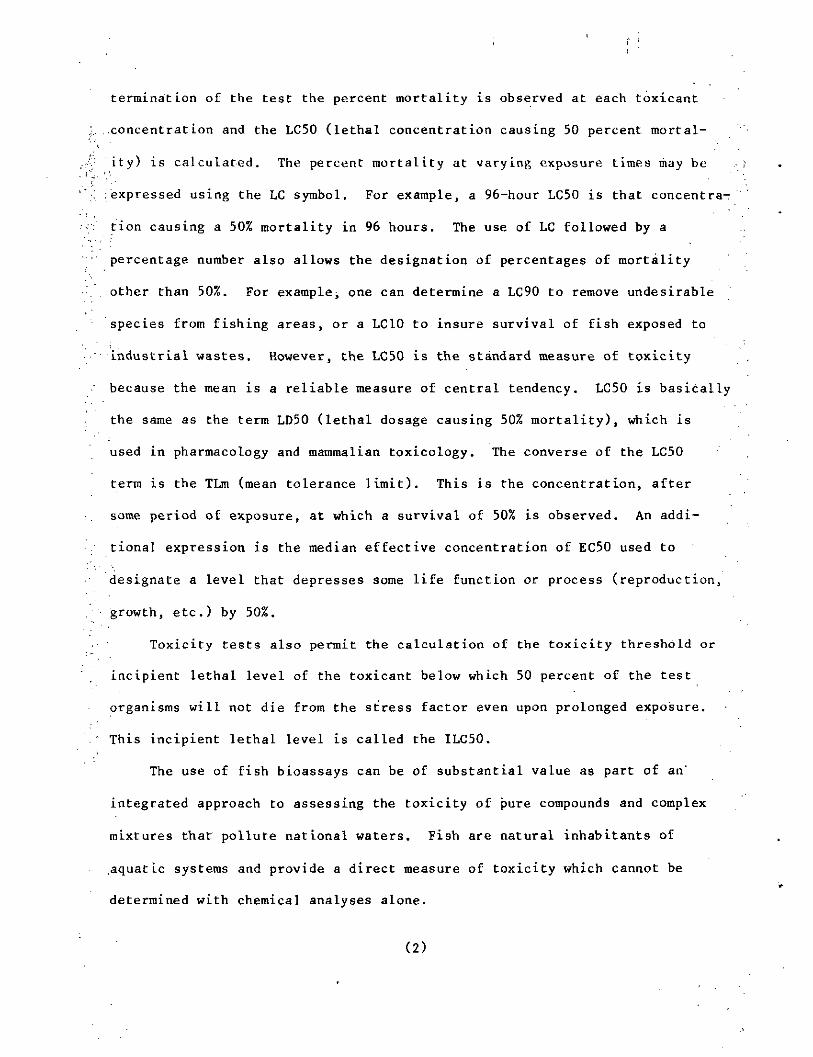
termination of the test the percent mortality is observed at each toxicant
.concentrat ion and the LC50 (lethal concentration causing 50 percent mortal-
ity) is calculated. The percent mortality at varying exposure times may be
expressed using the LC symbol. For example, a 96-hour LC50 is that concentra-
tion causing a 50% mortality in 96 hours. The use of LC followed by a
percentage number also allows the designation of percentages of mortality
other than 50%. For example^ one can determine a LC90 to remove undesirable
species from fishing areas, or a LC10 to insure survival of fish exposed to
industrial wastes. However, the LC50 is the standard measure of toxicity
because the mean is a reliable measure of central tendency. LC50 is basically
the same as the term LD50 (lethal dosage causing 50% mortality), which is
used in pharmacology and mammalian toxicology. The converse of the LC50
term is the TLm (mean tolerance limit). This is the concentration, after
some period of exposure, at which a survival of 50% is observed. An addi-
tional expression is the median effective concentration of EC50 used to
designate a level that depresses some life function or process (reproduction,
growth, etc.) by 50%.
Toxicity tests also permit the calculation of the toxicity threshold or
incipient lethal level of the toxicant below which 50 percent of the test
organisms will not die from the stress factor even upon prolonged exposure.
This incipient lethal level is called the ILC50.
The use of fish bioassays can be of substantial value as part of an'
integrated approach to assessing the toxicity of pure compounds and complex
mixtures that pollute national waters. Fish are natural inhabitants of
,aquatic systems and provide a direct measure of toxicity which cannot be
determined with chemical analyses alone.
(2)
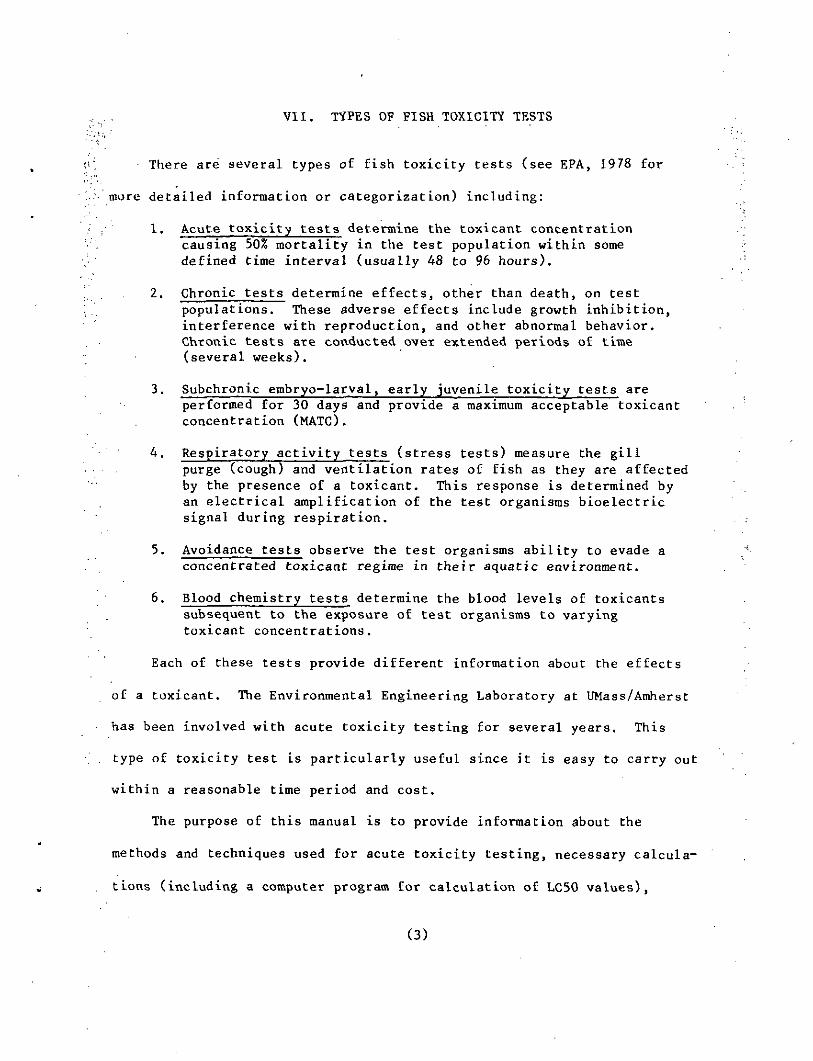
VII. TYPES OF FISH TQXICITY TESTS
There are several types of fish toxicity tests (see EPA, 1978 for
mure detailed information or categorization) including:
1. Acute toxicity tests determine the toxicant concentrationcausing 50% mortality in the test population within somedefined time interval (usually 48 to 96 hours).
2. Chronic jests determine effects, other than death, on testpopulations. These adverse effects include growth inhibition,interference with reproduction, and other abnormal behavior.Chronic tests are conducted over extended periods of time(several weeks).
3. Subchronic embryo-larval, early juvenile toxicj^ty tests areperformed for 30 days and provide a maximum acceptable toxicantconcentration (MATC).
4. Respiratory activity tests (stress tests) measure the gillpurge (cough) and ventilation rates of fish as they are affectedby the presence of a toxicant. This response is determined byan electrical amplification of the test organisms bioelectricsignal during respiration.
5. Avoidance tests observe the test organisms ability to evade aconcentrated toxicant regime in their aquatic environment.
6. Blood chemistry tests determine the blood levels of toxicantssubsequent to the exposure of test organisms to varyingtoxicant concentrations.
Each of these tests provide different information about the effects
of a toxicant. The Environmental Engineering Laboratory at UMass/Amherst
has been involved with acute toxicity testing for several years. This
type of toxicity test is particularly useful since it is easy to carry out
within a reasonable time period and cost.
The purpose of this manual is to provide information about the
methods and techniques used for acute toxicity testing, necessary calcula-
tions (including a computer program for calculation of LC50 values),
(3)
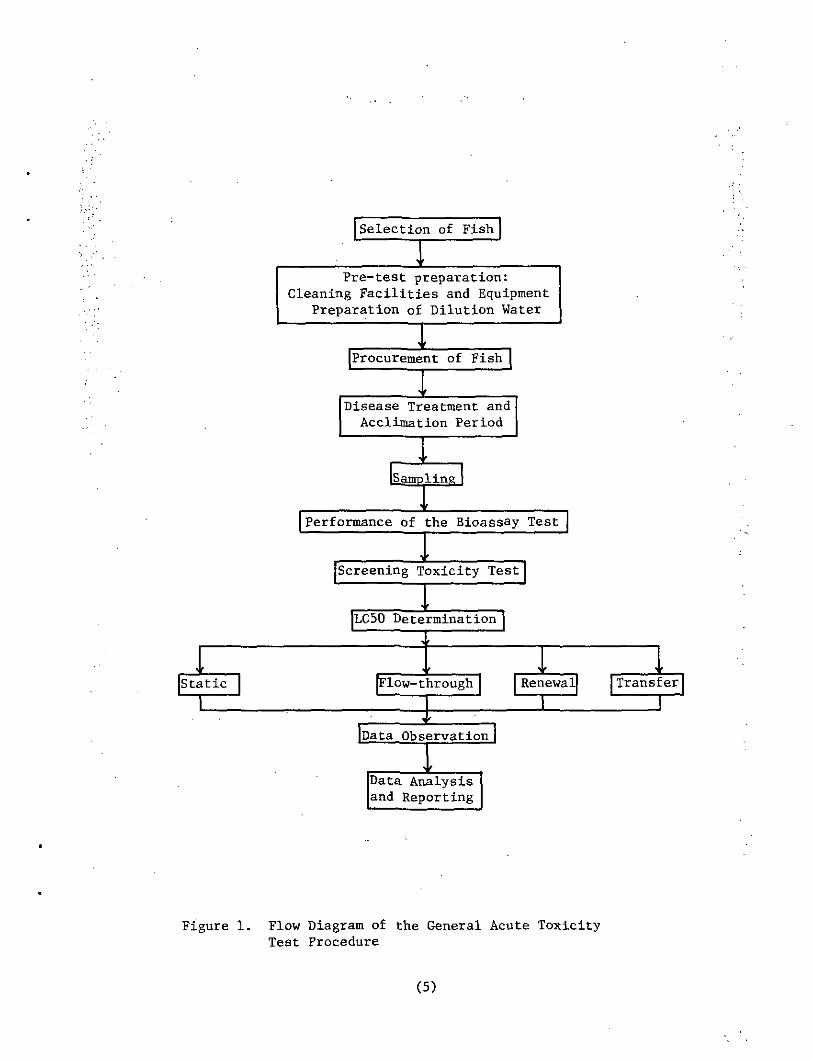
enumeration of personnel hours and equipment needs and costs. In addition,
in situ application of lethal concentration values (LC) are addressed. A
general flow diagram for acute toxicity testing is presented in Figure 1.
Each of these steps is discussed separately in the report.
(4)
Selection of Fish
Pre-test preparation:Cleaning Facilities and Equipment
Preparation of Dilution Water
[Procurement of Fish I
Disease Treatment andAcclimation Period
Sampline
Performance of the Bioassay Test
Screening Toxicity Test
LC50 Determination
Static [Flow-through! [Renewal Transfer
[Data Observation |
N fData Analysisand Reporting
Figure 1. Flow Diagram of the General Acute ToxicityTest Procedure
(5)
VIII. ACUTE FISH TOXICITY TEST PROCEDURE
Selection of Test Organisms
Test animals should be adaptable to laboratory conditions and ava i1 -
able in adequate numbers of a usable size (less than 2 grams fish/liter
test solution). When possible, the test animals should preferably be
native to the watershed under investigation, and be a species of recrea-
tional or commercial value.
APHA (1975) lists additional factors that should be considered in
choosing a test organism that include:
1. their sensitivity to the materials or environmental factors underconsideration;
2. their geographical distribution, abundance and availabilitythroughout the year;
3. availability of culture methods and knowledge of their environ-mental requirements;
4. their general physical condition and freedom from parasitesand diseases;
5. limitations of space and time;
6. consideration of the size of the organism and the length of itslife cycle (Note that some studies require large organismswith long life cycles.); and
7. their amenability to comparison with other toxicity data obtainedin previous research or other toxicity investigations.
In many instances it is necessary to use a species that is sensitive
to most toxicants but not found in the receiving water. Non-indigenous
species may be used for the following reasons:
1. Data rarely exist as to which species indigenous to a givenreceiving water is the most sensitive species.
(6)
2. Many times, because of the impact of the effluent on a receivingwater, all sensitive resident species may have been previouslyeliminated and only extremely pollution tolerant species remain.
; Using the remaining species would give an unrealistic estimateof effluent toxicity.
- . 3. A sensitive indigenous species may not be commercially available; , r for use in tests or their culturing requirements may not be known.
: 4. Test organisms should not be used if they have been exposed to- pollutants or other stress. The history of these organisms col-
: lected from a receiving water would be unknown. They could havepreviously been exposed to pollutants and, therefore, tests couldprovide erroneous results.
The length of the test organisms should not vary by more than 50 percent
: between the smallest and the largest. For fish, researchers contend that a
variation of more than a few millimeters is too much because the weight of a
fish increases as the cube of its length. A natural population of fish,
: however, is varied in size, and the application of toxicity data derived
from a very uniform group of fish to problems involving natural populations
. may be questionable. The test animals must also belong to the same age as
well as size class. Immature specimens are commonly used because differ-
ences attributable to sex are minimized.
The mean length and weights of the test organism must be determined.
Weighing may be accomplished by placing 10 randomly selected fish in a
preweighed beaker containing dilution water. Care must be taken not to
add additional water to the beaker in the process of transferring the fish
from the holding tank into the beaker. The beaker is then reweighed. The
difference between the two weight values divided by the number of fish is
then equal to the mean fish weight. Alternatively, several randomly
selected fish may be sacrificed and then weighed and measured.
(7)
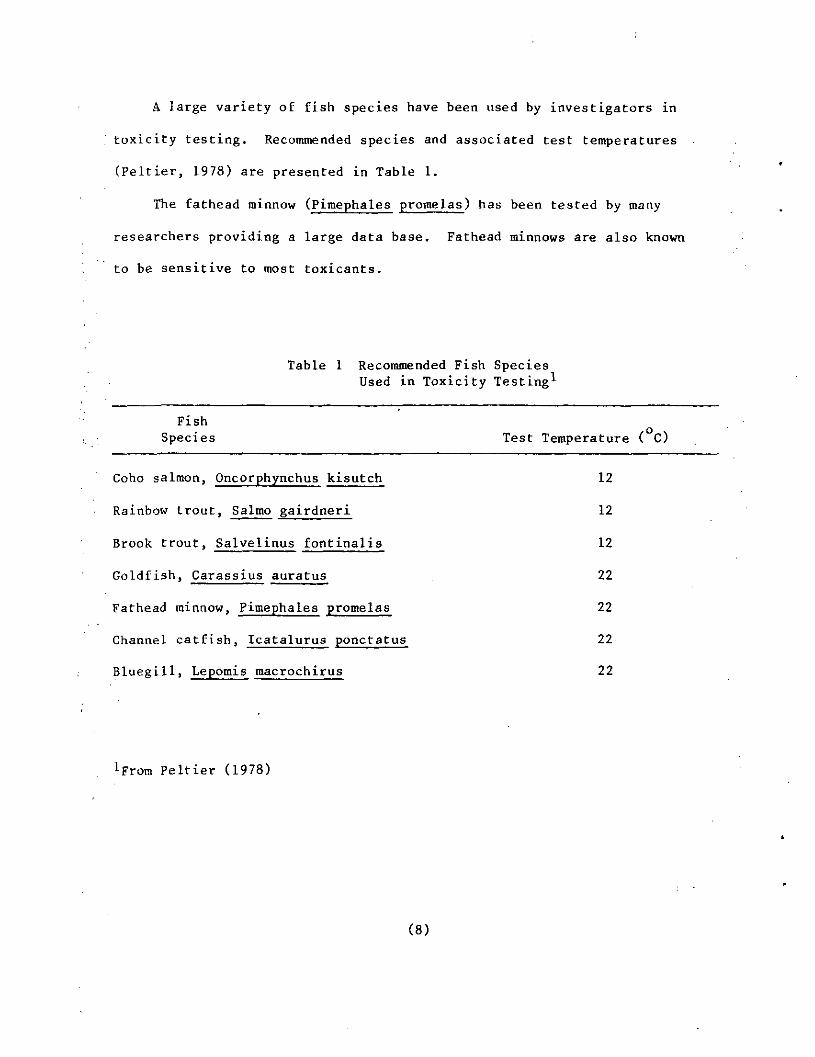
A large variety of fish species have been used by investigators in
toxicity testing. Recommended species and associated test temperatures
(Peltier, 1978) are presented in Table 1.
The fathead minnow (Pimephales promelas) has been tested by many
researchers providing a large data base. Fathead minnows are also known
to be sensitive to most toxicants.
Table 1 Recommended Fish SpeciesUsed in Toxicity Testing^
FishSpecies Test Temperature ( C)
Coho salmon, Oncqrphynchus kisutch 12
Rainbow trout, Salmo gairdneri 12
Brook trout, Salvelinus fontinalis 12
Goldfish, Cjirassius auratus 22
Fathead minnow, Pimephales promelas 22
Channel catfish, Icatalurus ponctatus 22
Bluegill, Lepomis^ macrochirus 22
1From Peltier (1978)
(8)
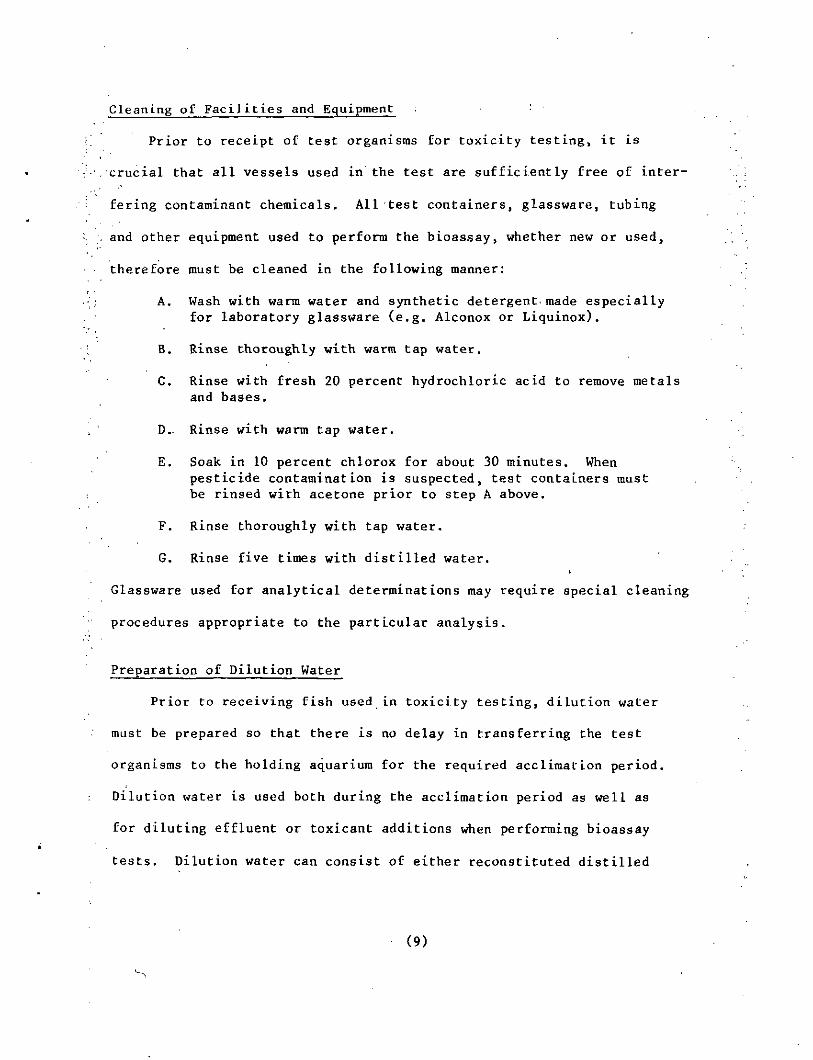
Cleaning ofFacilitiesand Equ 1 pmen t ; :
Prior to receipt of test organisms for toxicity testing, it is
crucial that all vessels used in the test are sufficiently free of inter-
fering contaminant chemicals. All test containers, glassware, tubing
and other equipment used to perform the bioassay, whether new or used,
therefore must be cleaned in the following manner:
A. Wash with warm water and synthetic detergent, made especiallyfor laboratory glassware (e.g. Alconox or Liquinox).
B. Rinse thoroughly with warm tap water.
C. Rinse with fresh 20 percent hydrochloric acid to remove metalsand bases.
D. Rinse with warm tap water.
E. Soak in 10 percent chlorox for about 30 minutes. Whenpesticide contamination is suspected, test containers mustbe rinsed with acetone prior to step A above.
F. Rinse thoroughly with tap water.
G. Rinse five times with distilled water.
Glassware used for analytical determinations may require special cleaning
procedures appropriate to the particular analysis.
Preparation of Dilution Water
Prior to receiving fish used in toxicity testing, dilution water
must be prepared so that there is no delay in transferring the test
organisms to the holding aquarium for the required acclimation period.
Dilution water is used both during the acclimation period as well as
for diluting effluent or toxicant additions when performing bioassay
tests. Dilution water can consist of either reconstituted distilled
(9)
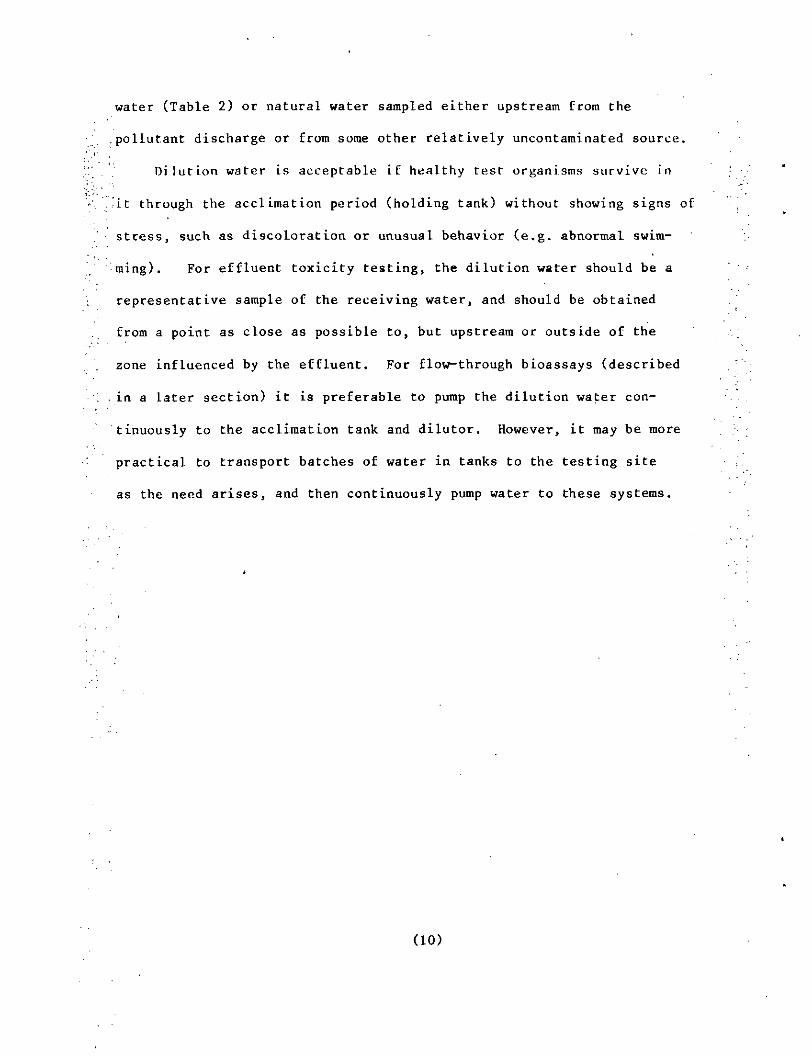
water (Table 2) or natural water sampled either upstream from the
pollutant discharge or from some other relatively uncontaminated source.
Dilution water is acceptable if healthy test organisms survive in
•it through the acclimation period (holding tank) without showing signs of
stress, such as discoloration or unusual behavior (e.g. abnormal swim-
ming). For effluent toxicity testing, the dilution water should be a
representative sample of the receiving water, and should be obtained
from a point as close as possible to, but upstream or outside of the
zone influenced by the effluent. For flow-through bioassays (described
in a later section) it is preferable to pump the dilution water con-
tinuously to the acclimation tank and dilutor. However, it may be more
practical to transport batches of water in tanks to the testing site
as the need arises, and then continuously pump water to these systems.
(10)
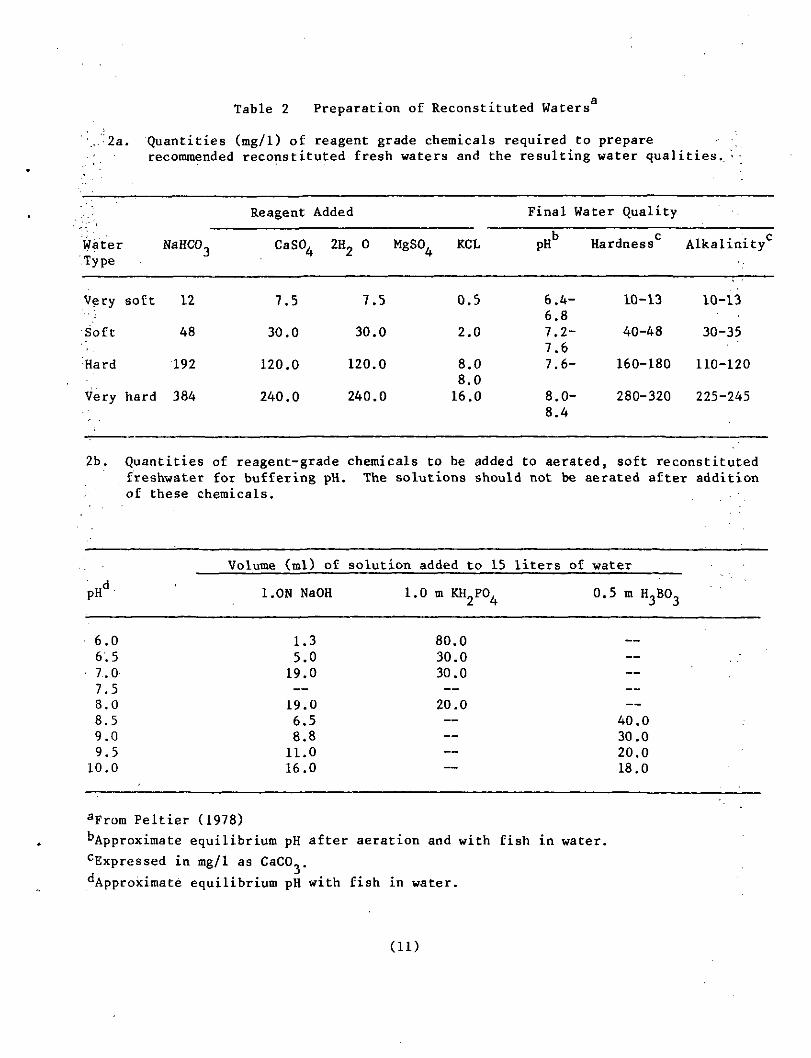
Table 2 Preparation of Reconstituted Waters
\2a. Quantities (mg/1) of reagent grade chemicals required to prepare
recommended reconstituted fresh waters and the resulting water qualities,
' ..' Reagent Added
Water NaHC03 CaS°4 2H2 ° MSS)
.Type
Very soft 12 7.5 7.5
Soft 48 30.0 30.0
Hard 192 120.0 120.0
Very hard 384 240.0 240.0
Final Water Quality
04 KCL
0.5
2.0
8.08.016.0
b c cpH Hardness Alkalinity
6.4-6.87.2-7.67.6-
8.0-8.4
10-13 10-13
40-48 30-35
160-180 110-120
280-320 225-245
2b. Quantities of reagent-grade chemicals to be added to aerated, soft reconstitutedfreshwater for buffering pH. The solutions should not be aerated after additionof these chemicals.
PHd
6.06.57.07.58.08.59.09.510.0
Volume (ml) of
l.ON NaOH
1.35.019.0
—19.06.58.811.016.0
solution added to 15
1.0m KH PO,
80.030.030.0
—20.0
———— *»
liters of water
0.5 m H3B03
__^
————40.030.020.018.0
aFrora Peltier (1978)
^Approximate equilibrium pH after aeration and with fish in water.
°Expressed in mg/1 as CaCO..j . . . . ."Approximate equilibrium pH with fish in water.
(11)
The same water sou-rce should be used for holding tank water and test
dilution water.
Pretreatraent of the dilution water should be limited to filtration
through a nylon sieve having 2 ram or. larger holes to remove debris
and/or break up large floating or suspended solids. The water should be
obtained from the receiving water as close as possible to the time the
test begins. It should not be obtained more than 96 hours prior to test-
ing. If acceptable dilution water cannot be obtained from the receiving
water, some other uncontaminated, well-aerated surface or ground water, or
reconstituted water can be used.
Reconstituted water is generally used at the University of Massachu-
setts Environmental Engineering Laboratory since it contains known concen-
trations of chemicals and is very accessible. Additionally, toxicity tests
are reproducible when using reconstituted water and results are easily
compared to results of other investigations since water quality parameters
specific to a particular natural water can be avoided. The major disad-
vantage of using reconstituted water is applying the findings of a test to
a particular water body that may contain chelators, metals, or organic
compounds that may increase or decrease the toxicity of an effluent.
Reconstituted water should ideally have a total hardness, total
alkalinity and specific conductance within 25 percent, and pH within 0.2
units, of the actual receiving water at the time of testing. Holding tank
water should be sampled weekly for these parameters which may change due to
evaporative loss or reaction with fish waste metabolites. These water
parameters should be kept constant by dilution with distilled water or
(12)
addition of appropriate chemicals (Table 2). Most inland %[gjfers of New
England are soft, with associated low alkalinities (Frey, 1971), there-
- .fore the Environmental Engineering facility generally uses soft reconsti-
•,. tuted water as the dilution water.
';•_•• The chemicals used for reconstituting water should be dissolved in
. 8-12 liters of water prior to adding the chemicals to the holding tank.
, CaSO,-2H 0 and MgSO, should be dissolved in separate vessels to*, -1 *T t H*
. increase solubilization of these salts. Actual concentrations of chemicals
; added to reconstitute very soft, soft, hard and very hard water types are
: presented in Table 2.
.Procurement of Fish
Fathead minnows may be cultured under laboratory conditions or can be
readily obtained from the Newtown Toxicology Station (EPA, Cincinnati, Ohio),
Joe's Bait House located in Windsor Locks, Connecticut, and other biological
supply companies (see Appendix D). Since the test organisms were not cultured
in this laboratory, this report will not address the methods needed for
culturing fish. Methods for fish culturing are provided in Brauhn and
Schoettge.r (1975).
Fish should be shipped in polyethlyene bags in secure containers such as
cardboard boxes (About 100 fathead minnows/gallon that are 1-2 grams will
survive several hours before oxygen depletion becomes significant.). Trans-
portation time should be minimized as much as feasible since the fish are
being stressed by crowding.
Immediately upon arriving at the laboratory, the fish should be trans-
ferred to the holding tank. This is accomplished by floating the bag
(13)
containing the fish in the holding tank water until temperature equilibrium
is achieved. The fish may then be slowly released into the tank. Water
contained in the holding tank should be prepared at least 24 hours prior to
the receipt of test fish. Fathead minnows which have been raised in hard
water may be safely transferred into softer water once temperature equili-
brium has been achieved (Pickering, personal communication; Plotkin, personal
observation).
Acclimation Period
Fish should be allowed to acclimate at least ten days but preferably 30
days before a test begins. Peterson and Anderson (1969) concluded that the
acclimation of metabolism to temperature change takes at least two weeks
regardless of direction. Presently, it seems the longer the period the
better; however, variations in other conditions associated with temperature
changes in the laboratory may make this approach impractical. At any rate
temperature fluctuations should not exceed 3 C/12 hours (Peltier, 1978).
Aquaria used to hold the fish during the acclimation period should
ideally be flow-through systems with a flow of at least two tank volumes
per day (Peltier, 1978). A recirculating system (such as that used by the
University of Massachusetts Environmental Engineering Laboratory) may also
be employed. The Environmental Engineering tank holds 400 liters and re-
cycles every 1.5 minutes. It was purchased from Frigid Units located in
Toledo, Ohio. The system consists of a two chambered filter. One chamber
contains polyester fiber and the other chamber is filled with activated
carbon plus some ammonia removing pellets. The pellets remove the ammonia,
from the water, which the fish release as metabolic waste products. The
(14)
.filter media should be renewed at least once per month in order to maintain
adequate water quality for fish survival. The filter precludes the necessity .=
of changing the water itself. Particulates not removed by filtration should
be removed once- & week by syphoning with acid washed nylon tubing. The Frigid •
'Units holding tank will accommodate about 1 gram of fish per liter (about 400 -
fish 2 to 4 cm in length) without causing stressful crowding. \ .
Alkalinity, hardness, pH and conductivity should be kept constant (see
dilution water section). A plexiglass shield should be placed over the section'
of the tank near the water recirculating pump to prevent water splashing out
of the tank. Distilled water can be added as needed to replace evaporative -
loss.
During the acclimation period fish should be fed at least once.a day. Feed
may consist of either dry constituents such as "Tetra Min Staple Food" (obtained
at fish supply stores), or may be supplemented with live food such as Daphnia.
It has been observed that fathead minnows remain very healthy over periods of
many months feeding upon only the "Tetra Min Staple Food" (Plotkin, personal
observation).
Food should be introduced into the holding tank in a quantity such that
the entire amount is eaten within five to ten minutes. Food remaining after
this time will usually not be eaten and may have a deleterious effect upon
the water quality by promoting microbial growth in the tank. Feeding should
be terminated, two days prior to the initiation of a test'.
Test organisms should not be used for a test if they appear to be
stressed, diseased or if there is more than five percent mortality during
(15)
the 48 hours prior to the performance of a bioassay test. Diseased or
Impaired organisms should be removed immediately and discarded.
Disease Treatment
During the two week, acclimation period, fish should be chemically
treated to cure or prevent disease. A number of products are available
for an assortment of problems. If tanks are kept clean and water period-
ically changed, disease generally will not be a problem. If severe disease
occurs the entire lot should be discarded. Antibiotic treatment of fish
during the acclimation period is a good procedure to destroy pathogenic
bacteria and is therefore a recommended preventative measure. Tetracycline
at a concentration of 15 mg/1 for 24-48 hours will kill most bacterial
pathogens. Other prophylactic and therapeutic treatments are presented in
Table 3. A review of icthyological treatments for diseases and parasites is
presented in APHA (1975).
(16)
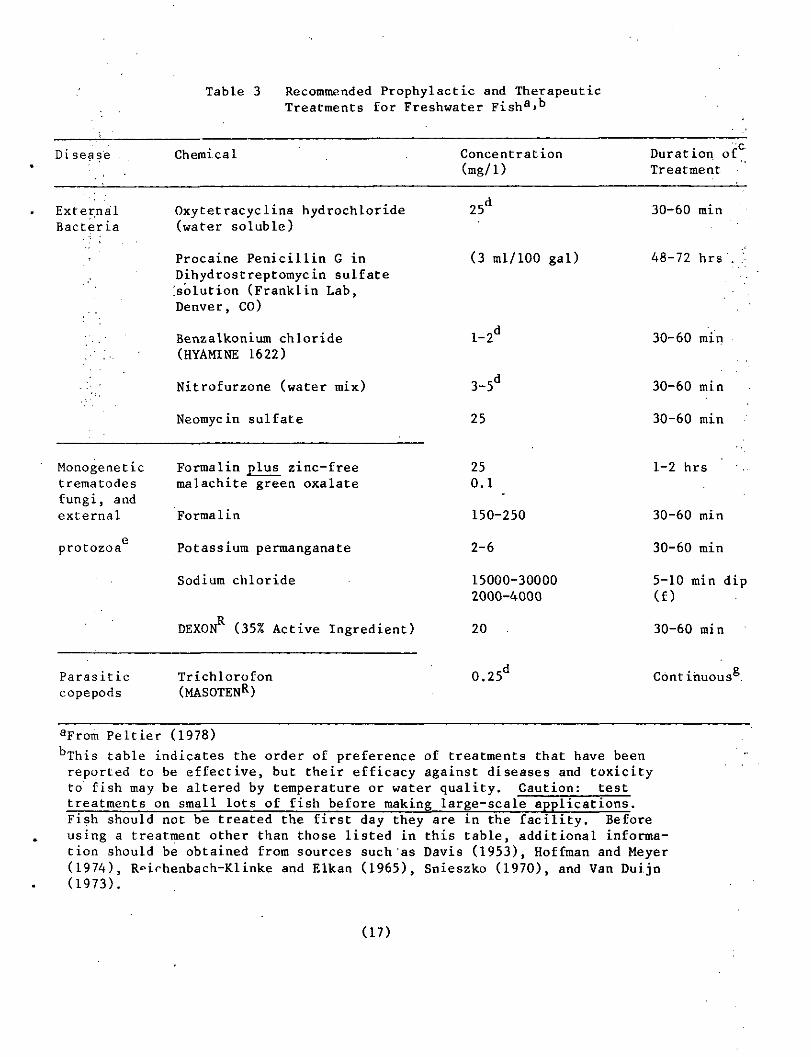
Table 3 Recommended Prophylactic and TherapeuticTreatments for Freshwater Fish3*"
Di sease Chemical Concentration(mg/1)
Duration ofTreatment -
ExternalBacteria
Monogenetictrematodesfungi, andexternal
protozoa
Oxytetracyclina hydrochloride(water soluble)
Procaine Penicillin G inDihydrostreptomycin sulfate^solution (Franklin Lab,Denver, CO)
Beuzatkonium chloride(HYAMINE 1622)
Nitrofurzone (water mix)
Neomycin sulfate
Parasiticcopepods
Formalin plus zinc-freemalachite green oxalate
Formalin
Potassium permanganate
Sodium chloride
DEXONR (35% Active Ingredient)
Trichlorofon(MASOTENR)
25
(3 ml/100 gal)
1-2
3-5d
25
250.1
150-250
2-6
15000-300002000-4000
20 .
0.25d
30-60 min
48-72 hrs '. .'•
30-60 min
30-60 min
30-60 min
1-2 hrs " '.
30-60 min
30-60 min
5-10 min dip(f)
30-60 rain
. gContinuous ,
aFrom Peltier (1978)bThis table indicates the order of preference of treatments that have beenreported to be effective, but their efficacy against diseases and toxicityto fish may be altered by temperature or water quality. Caution: t e sttreatments• °n small lots of fish before making large-sca^le^ applications.Fish should not be treated the first day they are in the facility. Beforeusing a treatment other than those listed in this table, additional informa-tion should be obtained from sources such'as Davis (1953), Hoffman and Meyer(1974), R^irhenbach-Klinke and Elkan (1965), Snieszko (1970), and Van Duijn(1973).
(17)
Treatment may be accomplished by (1) transferring the fish to a static treat-ment tank and back to a holding tank; (2) temporarily stopping the flow in aflow-through system^ treating the fish in a static manner, and then resumingthe flow to flush out the chemical; or (3) continuously adding a stock solu-tion of the chemical to a flow-through system by means of a metered flow orthe technique of Brungs and Mount (1967).
Active ingredient.
&
'One treatment is usually sufficient except for Ichthyopchirius ("Ich"),which must be treated daily or every other day until no sign of the proto-zoan remains. This may take 4-5 weeks at 5-10°C and 11-13 days at 15-21°C.A temperature of 32°C for one week is lethal to "Ich."
^Minimum of 24 hours, but may be continued indefinitely.
**"Continuous treatment should be employed in static or flow-through systemsuntil no copepods remain, except that treatment should not be continuedfor more than 4 weeks and should not be used above 27°C.
Sampling
Sampling of an effluent for bioassay is based upon short and long
term operation of the dischargers. To assess the maximum amount of damage
by a discharge, samples should be taken during a period when the effluent
is most concentrated or toxic. If this cannot be easily assessed, then the
following guidelines should be followed.
For complex toxicant solutions, such as municipal or industrial waste-
waters, bioassay testing is best performed at the site of the wastewater
using a continuous sampling technique and a continuous-flow test ing pro-
cedure. The various types of bioassay, along with the rationale used in
choosing a particular testing procedure is discussed in another section of
this report. For continuous-flow on-site bioassays, the effluent is
pumped directly and continuously from the discharge line to the dilutor
system for the duration of the test. However, if the effluent cannot be
(18)
pumped directly and continuously to the dilutor system, then either a
static or coatinuous-flow bioassay can be performed in a bioassay labora-
,t'ory which is not necessarily located at the site of the wastewater discharge,
In this case either a static or continuous-flow "off-site" toxicity test can
be performed. The following guidelines should be followed for collection of
the effluent.
'a. When the measured minimum retention time of the effluent is less
than 96 hours, as determined from dye studies, a 6-hour composite
sample, consisting of equal volumes taken every 30 minutes, may
be collected and transported to the dilutor every six hours for
the duration of the test.
b. When the measured minimum retention time of the effluent is
between four days (96 hours) and 14 days, as determined from
dye studies, then a 24-hour composite sample, consisting of
equal volumes taken every hour, may be collected daily for the
duration of the test.
c. When the measured minimum retention time of the effluent is
greater than 14 days, as determined from dye studies, a single
grab sample may be collected daily for the duration of the test.
If the industrial or municipal facility discharges intermittently (i.e.
where the waste is discharged at the end of the shift, or end of the week),
a composite sample, consisting of equal volumes collected every 30-minutes,
may be taken for an 8-hour operating shift or for the duration of the plant
operating schedule, or a single grab sample may be taken in the case of a
batch discharge.
Samples normally should not be altered except by filtering through a
(19)
teflon or stainless steel screen with 2 mm or larger openings. The test
should begin as soon as possible but no later than 24 hours after collec-
tion of the effluent. Refrigeration does not seem to effect the toxicity
of a complex effluent stored over several days (K. Macek, personal communi-
cation) .
For static bioassays about 60 liters of effluent are required. Samples
should be collected in pre-acid washed glass containers. Empty acid gallon
bottles are a good type of sample container. Samples should be stored on
ice in transit and acclimated to the temperature of the dilution water upon
return to the laboratory.
Any unusual conditions to which the test group were exposed, e.g.
pesticides or chemotherapeutic agents, should be considered and reported
(APHA, 1975). Additionally, such standard water quality parameters such
as temperature, dissolved oxygen, pH and conductivity should be deter-
mined at the time of sampling. Additional tests may be required depending
on the nature of the sample and the objective of the assay.
Evaluation of Acute Toxicity
There are two steps required to evaluate the acute toxicity of a
sample:
1. determination of the range of toxicant dosage which results inan observable response; and
2. determination of acute toxicity using toxicant dosages appliedover a narrower range.
(20)
Screening Toxiclty Tests
Ranging Oxygen Test:
The first step is a qualitative screening procedure used to
assign a range of: toxicity. One such procedure is the Ranging Oxygen
Test. Several fish are placed into BOD (Biochemical Oxygen Demand)
bottles containing fully aerated dilution water (control) or dilution
water plus some level of toxicant. 100, 10, 1, .1, .01, and .001
percent of the toxicant or waste effluent is recommended. The bottles
are then sealed and left until 100 percent fish mortality is observed.
: Care should be taken when sealing the BOD bottles to avoid entrapment
of air bubbles. The dissolved oxygen concentration in each BOD
bottle is determined immediately after 100 percent mortality is
obtained. The DO values in BOD bottles in which fish mortality is
attributable to oxygen depletion alone will be on the order of tenths
of a mg per liter. DO values in BOD bottles in which fish mortality
is attributable to the level of toxicant will be higher since mortality
will occur prior to oxygen depletion. Thus DO levels in BOD bottles
containing higher toxicant concentrations will be greater than those
containing lower toxicant concentrations. If final DO concentration
is plotted against the log of the toxicant concentration, an "inflec-
tion point" is observed where the OO concentration increases with
increasing toxicant level. Toxicant levels just below and above this
point are then tested over a finer incremental dosage range for the
96-hour LC50 determination. The incremental range is distributed
over a logarithmic interval owing to the exponential response of test
organisms to toxicant dosage.
(21)
Screening Jar_ T_est_
Alternat ively, a 24-hour screening jar test can be performed over
a wide range of toxicant levels. This is usually performed using
ten-fold dilutions of the toxicant from 100 to ,001 percent and ob-
serving 100 percent mortality and 100 percent survival of two test
organisms at different toxicant levels after a 24-hour exposure
period. The finer incremental toxicant dosage range to be used for
the 96-hour LC50 toxicity test is then determined. This range occurs
between the highest toxicant concentration resulting in 100 percent
survival and the lowest toxicant concentration resulting in 100 percent
mortality.
LC50 Determination
The second stage of evaluation is the determination of the 96-hour
LC50 or ILC50. This is a test performed with two replicates per con-
centration and ten fish per aquarium. The range of toxicant concentra-
tion required to observe the 96-hour LC50 value is determined using one
of the qualitative screening procedures just described.
Acute toxicity determination using Che bioassay test employs
replicates of a control and at least five concentrations of effluent
or toxicant in an exponential series. To determine the acute toxicity
of a sample with reasonable accuracy, a definitive test must meet both
of the following criteria:
a. Each concentration of the effluent or toxicant must be at least
50 percent of the preceding concentration.
(22)
b. One concentration must have killed (or affected) more than
65 percent of the organisms exposed to it, and one concentra-
tion must have killed (or affected) less than 35 percent of
the organisms.
If 100 percent effluent does not kill (or affect) more than 65
percent of the organisms exposed to it, the percentage of organisms ;
killed (or affected) by various levels of the effluent in the receiving
water must be reported.
A control, of diluent water (preferably ground or synthetic water)
without any toxicant, must be employed as a point for comparison.
There should be no more than ten percent mortality among the control
animals during the course of any valid test with the remaining 90 percent
appearing vigorous. When an organic solvent or other dispersing agent is
used to prepare test solutions, the test control should contain the maxi-
mum concentration of the solvent or dispersant to which organisms in the
other solutions are exposed.
At least 20 (10 per replicate) fish should be used for each experi-
mental concentration. A limit must be placed, however, on the weight of
the fish per liter of test solution to help minimize depletion of oxygen
and excessive build-up of metabolic waste products. For flow-through tests,
the number of test organisms should not exceed 5 grams/liter at 20 C
or about 3.5 grams/liter for temperatures above 20 C. The number of
test organisms in static test containers should not exceed 0.8 grams/liter/
day at 20 C or about 0.4 grams/liter/day at temperatures above
20°C.
(23)
Very immature fish (not actively feeding on exogenous food) or
spawning fish should not be used. Fish weighing between 0.5 and 5.0
grams each are preferred. In any single test, all fish should be
taken from the same year-class, and the total length (tip of snout to
end of tail) of the longest fish should be no more than 1 1/2 times
that of the shortest one.
Test animals are normally captured for transfer from acclimation
tanks to test chambers by dip-netting. No more than 20 percent of the
total number of organisms transferred to each chamber should be added
from a given net capture.
Data Observat ion
Fish mortality or abnormal behavior such as erratic swimming, canni-
bolism or discoloration should be observed and recorded at frequent time
intervals to obtain data for the ILC50 determinations. Table 4 provides
a suitable schedule for mortality observations during a 96-hour test. A
test fish is considered dead if there is no gill movement and the organism
does not respond to gentle proding. Dead organisms should be immediately
removed from the test solution. Procedures for determining the toxic
level of the material being tested are described in the "Data Analysis"
section of this report. The duration of all tests should be at least 48
hours (96-hour tests are preferable). When more than half of the test
fish survive at the highest test concentration, the test must be con-
tinued for at least a total of 96 hours.
(24)
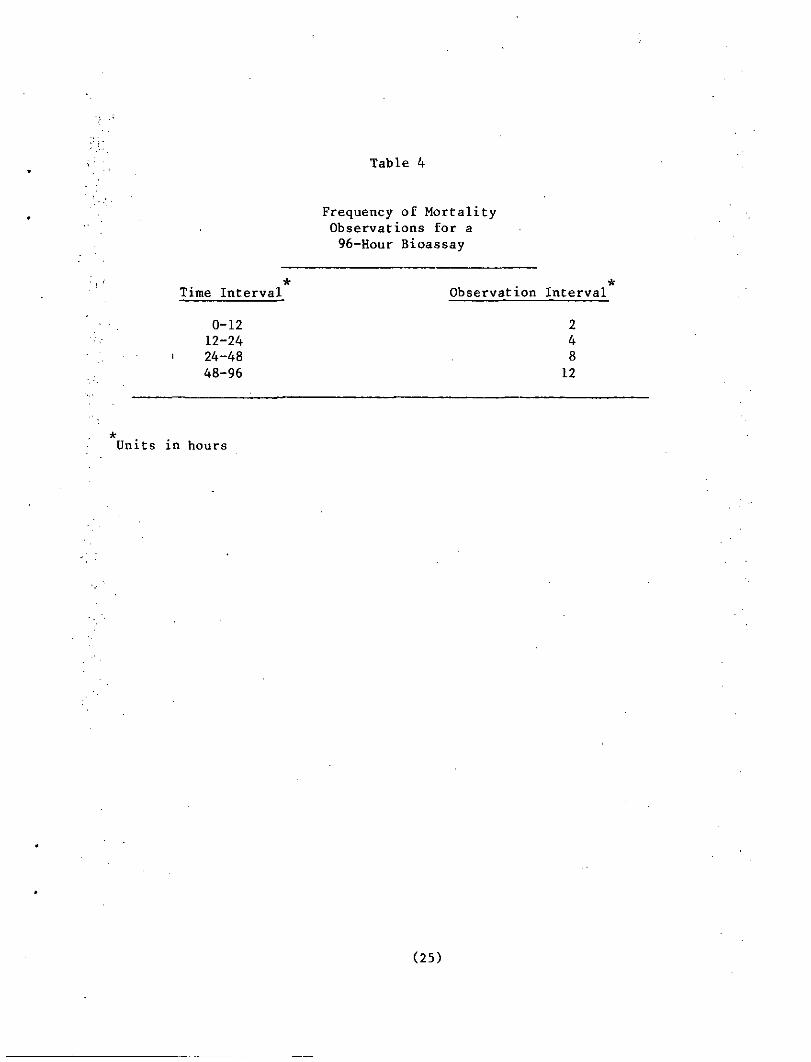
Table 4
Frequency of MortalityObservations for a96-Hour Bioassay
* . *Time Interval Observation Interya_l_
0-12 212-24 424-48 , 848-96 12
*Units in hours
(25)
IX. TYPES OF LC50 ACUTE TOXICITY TESTS
The determination of the 96-hour LC50 or ILC50 can be evaluated
using several experimental approaches with respect to the flow of the
toxicant and diluent solutions. These are classified into the three
groups: static, continuous flow, and renewal bioassays. A comparison of
continuous flow and static toxicity tests will be the topic of a future
report to the Massachusetts Division of Water Pollution Control.
Static toxicity tests are simple and easily controlled. They are
suitable for the detection and evaluation of compounds whose toxicity is
associated with low oxygen demand, and low concentrations of volatile
compounds. The major limitations with static toxicity tests are: (1) the
toxic substance being tested may be removed by volatilization, precipita-
tion, or detoxification by the test organisms, and (2) the test must be
relatively short term because of the stress and accumulation of metabolic
byproducts.
Test containers for the static test should ideally be made of glass.
Containers made of nontoxic and nonreactive material are also acceptable.
Containers should be at least 20 cm deep to allow for a minimum water
depth of 15 cm. Suitable containers such as wide-mouthed five gallon
glass jars can be obtained from Empire State Bottle Company, Buffalo, N.Y.
(see Appendix B).
For static bioassay tests, the toxicant should be added to the test
containers and completely mixed with a clean stirring rod prior to the
addition of the fish,
Flow-through toxicity tests are more complicated in design, but new develop-
ments in apparatus and techniques have made their usage practical. They
(26)
are used mainly to test chronic toxicity of industrial effluents and
chemicals that have high biochemical oxygen demands, are unstable or
.volatile, or are removed appreciably from solution by precipitation on
ithe test organism. The protocol provides Cor well-oxygenated solutions,
non-fluctuating concentrations of the toxicant, and removal of metabolic
byproducts. Furthermore, it more closely approximates the natural con-
ditions of receiving streams, and thus permits extended exposures to
detect chronic toxicity and to identify "safe" concentrations of the
toxicant. The shortcomings inherent in the flow-through approach are:
(1) the large amount of space needed, (2) the complicated experimental
apparatus, and (3) the' large amounts of wastes and diluent water needed.
Unlike static tests, the protocol for flow-through testing permits
feeding without danger of fouling or toxicant interaction. This allows
for the testing of organisms over their entire life cycle as well as for
determination of mortality-abnormality effects.
Test chambers used in flow-through tests may be constructed of 1/4
inch plate glass held together with clear siiicone adhesive. Silicone
adhesive does adsorb organochlorine and organophosphorus pesticides,
which may subsequently desorb into uncontaminated solutions. Therefore,
as little of the adhesive as possible should be in contact with water.
Extra beads of adhesive inside the containers should be removed.
Alternatively, a stainless steel system can be employed. Joints
should be welded rather than soldered. , The containers must be designed
to permit the desired flow-through characteristics of the test.
Toxicant and dilution water can be stored in 100 gallon polyethylene
(27)
containers. The appropriate volumes of toxicant and dilution water can
be delivered to test containers via tygon tubing and positive displacement
pumps. Alternatively, an inexpensive serial dilution apparatus such as
that developed by Mount and Warner (1965) can be employed. In such an
apparatus, incoming water is mixed with the toxicant at a specified
proportion by a device called a diluter. The modern apparatus is equipped with
a fail-safe which shuts off toxicant release when diluent stops or flow
rate diminishes appreciably. This method assures a constant concentration
of toxicant and 0. in tested water regardless of volatility or oxygen
demand. The UMASS bioassay facility employs stainless steel tanks and
positive displacement pumps for toxicant and diluent water delivery.
The continuous flow apparatus for flow-through bioassay testing should
be tested for 24 hours prior to adding toxicant or fish to assure flow
rates for the toxicant and dilution water are constant. The turnover rate
for the flow-through water should be at least six times per day.
Renewal toxicity __t_ests are considered as intermediate between static and
continuous flow. They differ from the static test in that the test solu-
tion is occasionally renewed. Here, organisms can be fed without accumulation
of metabolites and excess food. The test concentration is brought back by
replacement of the water, not as gradually as the continuous flow, but by
abrupt increases.
Renewal of test solution for the purpose of maintaining more or less
uniform concentrations of any volatile or unstable toxic materials, and
an adequate DO (dissolved oxygen) can be accomplished by transferring the
(28)
test animals quickly to fresh solutions. Test solutions, for such toxi-
cants, must be renewed every 24 hours or less.
-• Transfer Toxicity Tests are a modification of renewal tests and are
. .used to vary the concentration of toxicant to which the fish are exposed.
' Fish may be transferred alternately by dip-netting between high and low
•• concentrations of toxicant solutions over designated time intervals. This
type of test can also be performed with a flow-through system by varying the
proportions of incoming toxicant and dilution water. These tests provide
, . toxicity information that in some instances may be more applicable to
actual field conditions where toxic effluents are discharged intermittently.
The types of; toxicty tests discussed above may be modified by the
inclusion of a circulatory pump to simulate flowing water and keep the
animals active.
(29)
X. GENERAL TEST CONDITIONS AND PROTOCOL
Physical and Chemical Data
The number of analytical tests necessary depend upon the nature
o.f the toxicant(s) being tested. Analyses that should be performed in
all tests and the methods for their determination are presented in
Table 5. Other constituents of the water which markedly influence the
toxicity of the material being tested should be additionally monitored.
The BOD of waste materials having a high oxygen demand should also be
determined. Determination of these water quality constituents are
normally made before introducing the fish, and again, at the end of the
test (except DO and pH as noted below).
Dissolved Oxygen
Dissolved oxygen levels in the dilution water in the holding tank
at the start of a bioassay test should be at or near saturation (aeration
may be needed). Care should be taken however not to supersaturate the
solution. In most cases aeration should not be employed during a test
since this might alter the results. However, DO concentration should
not be allowed to fall below 40 percent of saturation for warm-water
species or 60 percent of saturation for cold water species. If the DO
concentration falls below the appropriate level, the test organisms may
be additionally stressed, therefore aeration may be needed, and in the
flow-through bioassay test, the turnover rate of the solutions may also be
increased in the case of waste materials having a very high BOD.
(30)
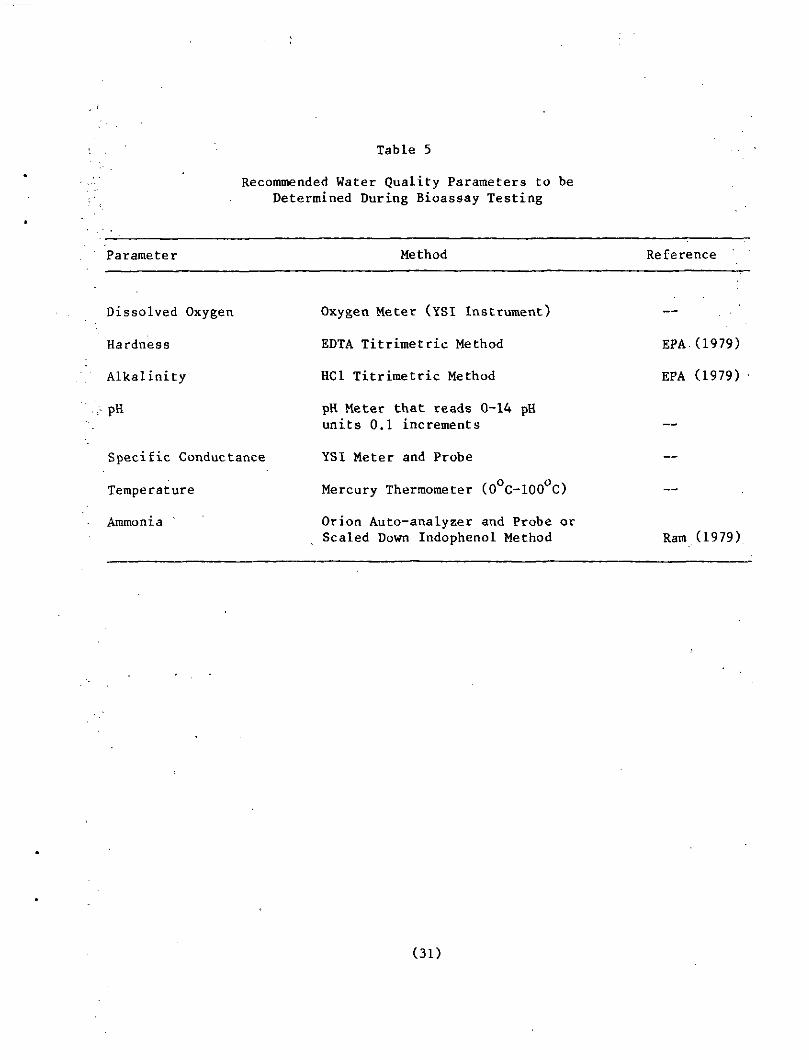
Table 5
Recommended Water Quality Parameters to beDetermined During Bioassay Testing
Parameter Method Reference
Dissolved Oxygen
Hardness
Alkalinity
PH
Specific Conductance
Temperature
Ammonia
Oxygen Meter (YSI Instrument)
EDTA Titrimetric Method
HC1 Titrimetric Method
pH Meter that reads 0-14 pHunits 0.1 increments
YSI Meter and Probe
Mercury Thermometer (0°C-100°C)
Orion Auto-analyzer and Probe orScaled Down Indophenol Method
EPA.(1979)
EPA (1979)
Ram (1979)
(31)
Hardness, Alkalinity,L j>H, and Specific Conductance
When the dilution water used is reconstituted or taken from a source
other than the receiving water of the effluent, the experimenter must
decide what level of hardness and alkalinity is desirable. For example,
if an effluent being tested normally discharges into a soft, poorly
buffered stream, then the reconstituted water should have about the same
pH, alkalinity, hardness, and specific conductance as the receiving stream.
Various formulas for reconstituted water have been previously presented
in Table 2.
Ammonia
Ammonia tends to increase in concentration during a static 96-hour
test as a result of fish metabolic activity. This should be monitored
by the method presented in Table 5. It is the un-ionized portion of total
ammonia (NH ) that is toxic to fish. By measuring the pH and total
ammonia concentration, the un-ionized fraction can be determined using
Table 6. If the un-ionized ammonia level approaches a harmful level for
..the species being tested, the water should be changed. For fathead
minnows, a guideline for the maximum allowable un-ionized ammonia concen-
tration during acute bioassay testing is 5 percent of the 96-hour LC50
value equal to 1.59 mg/1 as reported by DeGraeue et_ a_l_. (1980). • These
investigators determined this LC50 value using water containing a hardness
of 655 mg CaCO.,/1. Since toxicity generally decreases with hardness,
the ammonia LC50 may be higher using softer water.
(32)
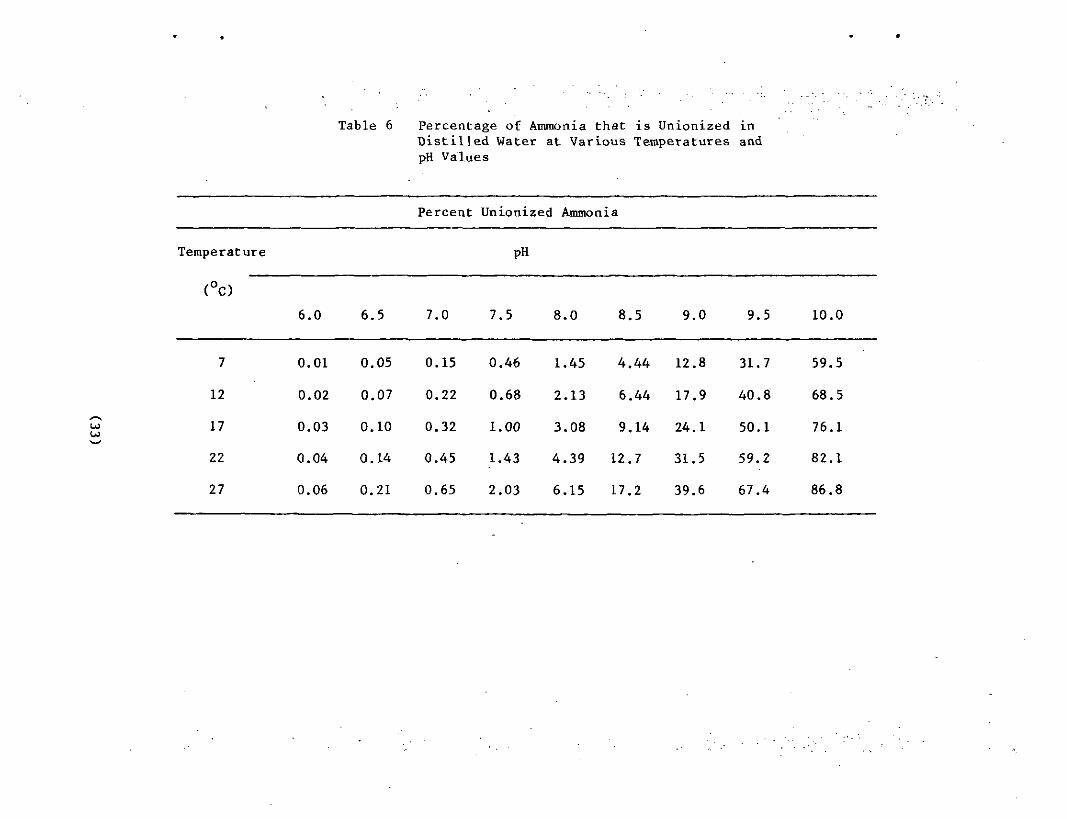
Table 6 Percentage of Ammonia that is Unionized inDistilled Water at Various Temperatures andpH Values
Percent
Temperature
(°c>
7
12
17
22
27
6.0 6.
0.01 0.
0.02 0.
0.03 0.
0 . 04 0 .
0.06 0.
5 7.0
05 0.15
07 0.22
10 0.32
14 0.45
21 0.65
Unionized Ammonia
pH
7.5
0.46
0.68
1.00
1.43
2.03
8.0
1.45
2.13
3.08
4.39
6.15
8.5 9.0
4.44 12.8
6.44 17.9
9.14 24.1
12 . 7 31 . 5
17.2 39.6
9.5
31.7
40.8
50.1
59.2
67.4
10
59
68
76
82
86
.0
.5
.5
.1
.1
.8
Temperature
Generally the temperature of the water must be kept at 25 C +_
4 C ,£or warm-water fish and 15 C + 4 C for cold-water species.
Fathead minnows have a recommended test temperature of 22 C (Peltier, 1978).
Filtration
Filtration may be necessary when an effluent is very turbid due to the
presence of particulate material. The particulate material may interfere
with fish respiration. In some instances continued precipitation occurs
after initial filtration. Slow settling and mixing induced by the swimming
action of the fish may keep the particles suspended. In very turbid solu-
tions these particulates may interfere with observing fish mortality. To
help avoid this problem, a one-fourth inch mesh polyethylene screen can be
situated several inches above the bottom of the test containers to prevent
the fish from contacting the precipitate and resuspending the settled material
into the supernatant solution.
Lighting
Ambient light intensities should be 50-100 ft-candles. A day/night
cycle is important with a minimum o£ at least eight hours of illumination
per day. The UMass Environmental Engineering lab maintains a cycle of
14 hours illumination and 10 hours darkness.
Tox ic an t Concen t rat ion
Concentrations of diluted municipal or industrial wastes are expressed
as percent by volume, while concentrations of non-aqueous wastes or individual
(34)
• chemicals are expressed in terms of milligrams per liter (mg/1) or micro-
,. grams per liter ((pg/1). These concentrations are conveniently expressed
; on a logarithmic scale (see "calculation" section).
The inclusion of any water of hydration as part of the weight of the
'\ solute, i.e., CaSO • 2H?0, should be clearly indicated. When an
, impure chemical is used, all ingredients should be reported. The range of
toxicant concentration to be examined by the full-scale tests should include
at least, two replicates of five or six concentrations. This range must first
, . -be determined by exploratory tests as previously described.
Feeding
' ' Fish are not fed during the static bioassay test since feeding might
cause fouling of the test solution. Feeding is additionally terminated in.
: the holding tank two days prior to conducting a static bioassay. Feeding
is permitted during the flow-through test although this is not required during
short testing intervals such,as a four day acute toxicity study.
Feeding is necessary in tests lasting longer than 96 hours such as in
, chronic flow-through testing.
(35)
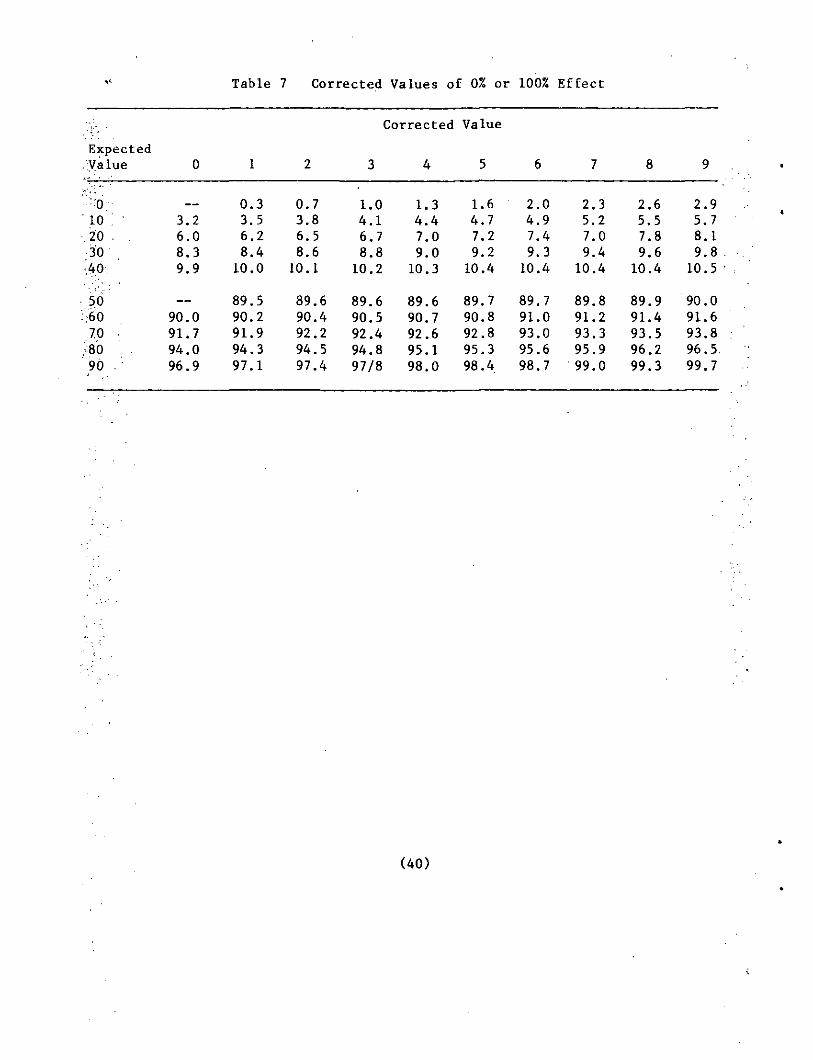
Table 7 Corrected Values of 0% or 100% Effect
;, - Corrected Value
ExpectedValue
•;o10 . •
,20 . .30<40,
50.60.70 •>8090 ,'•
0
— —
3.26.08.39.9
—90.091.794.096.9
1
0.33.56.28.410.0
89.590.291.994.397.1
2
0.73.86.58.610.1
89.690.492.294.597.4
3
1.04.16.78.810.2
89.690.592.494.897/8
4
1.34.47.09.010.3
89.690.792.695.198.0
5
1.64.77.29.210.4
89.790.892.895.398.4
6
2.04.97.49.310.4
89.791.093.095.698.7
7
2.35.27.09.410.4
89.891.293.395.999.0
8
2.65.57.89.610.4
89.991.493.596.299.3
9
2.95.78.19.810.5
90.091.693.896.599.7
(40)
ioo 100
flO
LUIS^ 20_l
O
t ,o^C
^ 0dLL eU. c
f i tULI -
0s* 4
I
56+^^^^^^m
^V^^^^^ta
18^•^^^^^
10
fi
— ̂
.2^••̂ •̂̂ •̂ ^
«
LC
i^
^
<
,50=
k
^s^v
XN
X »
•
<
10 20 30 40 50 60 70 80 90 IOO
% SURVIVAL
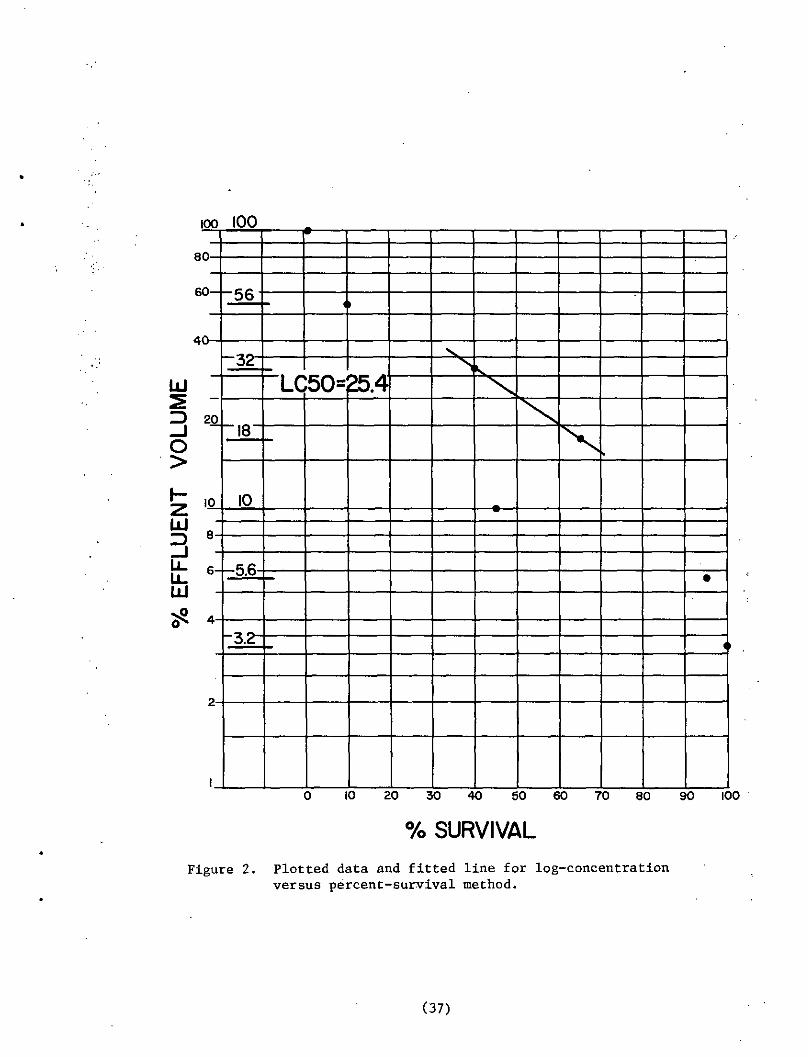
Figure 2. Plotted data and fitted line for log-concentrationversus percent-survival method.
(37)
2 'Chi
Expected . ObservedPercent MinusAffected Expected
5070
80
90
95
96
97
98
99-
99.5-
99.6-
99.7-
99.8-
99.9-
99.95-
99.96-
99.97-
99.98-
-50
-30
—20
-
—10
-
-5
—4-3•
-2_
--1.0
—.5
—.4
—.3• «
-.2
-.1
-.05
-.04
-.03*•
-.02
-50
—40•*
—30-
—2O
-
—10
--— 5
—4
—3-
—o
-I
-
-.5
-.4
-.3
-.2
-.1
.05
— 2.O
-
— 1.0_
.
— .50
— .40
—.30
— 20
-
—.10
-_
—.05
—.04
—.03
— .02
—.01
— .005
—.004
— .003
—.002
—.001
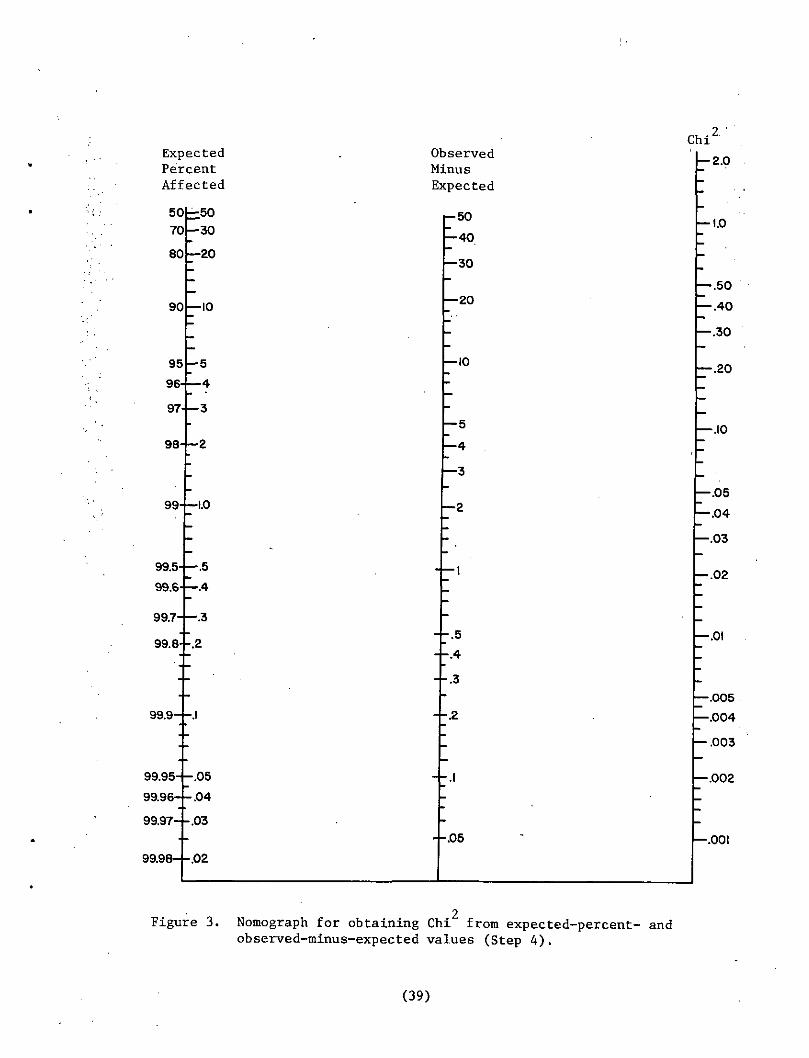
2Figure 3. Nomograph for obtaining Chi from expected-percent- and
observed-minus-expected values (Step 4).
(39)
.2oow
o>D"c0>
.0o
E Q.
Percentage Concentration ofEffluent (Log Scale)
(24 Hour (96 HourLC50=5.2%) LC50=4.4%)
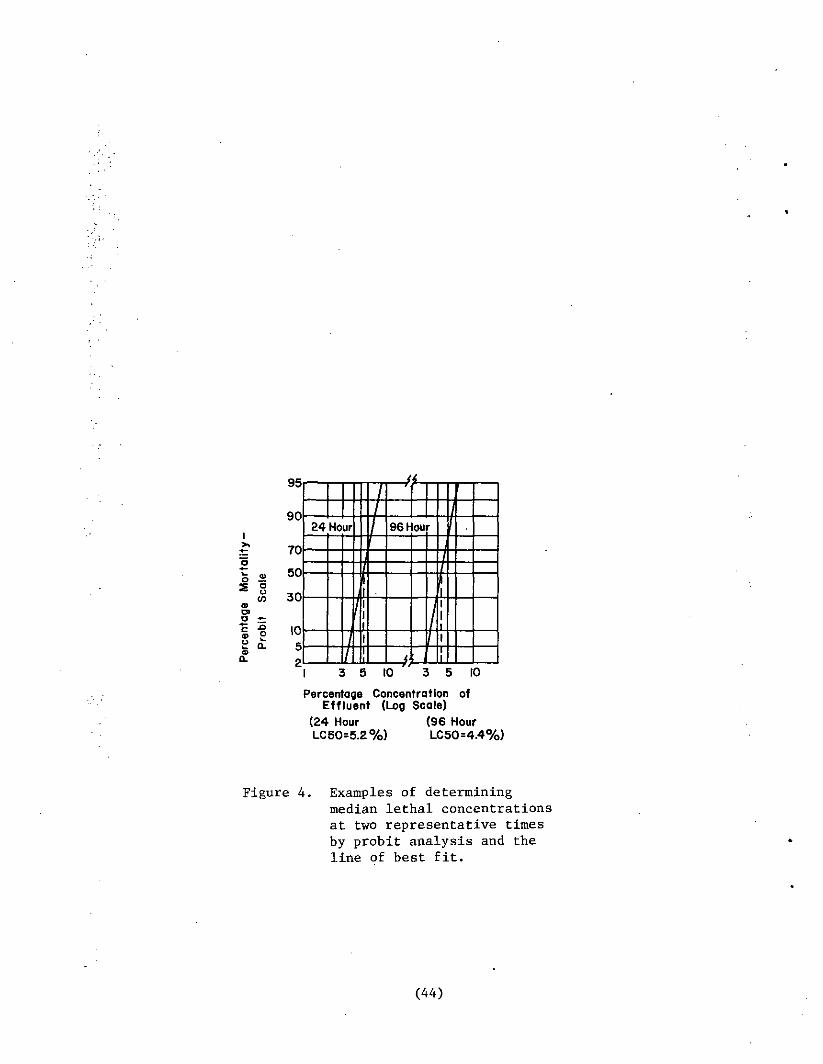
Figure 4. Examples of determiningmedian lethal concentrationsat two representative timesby probit analysis and theline of best fit.
(44)
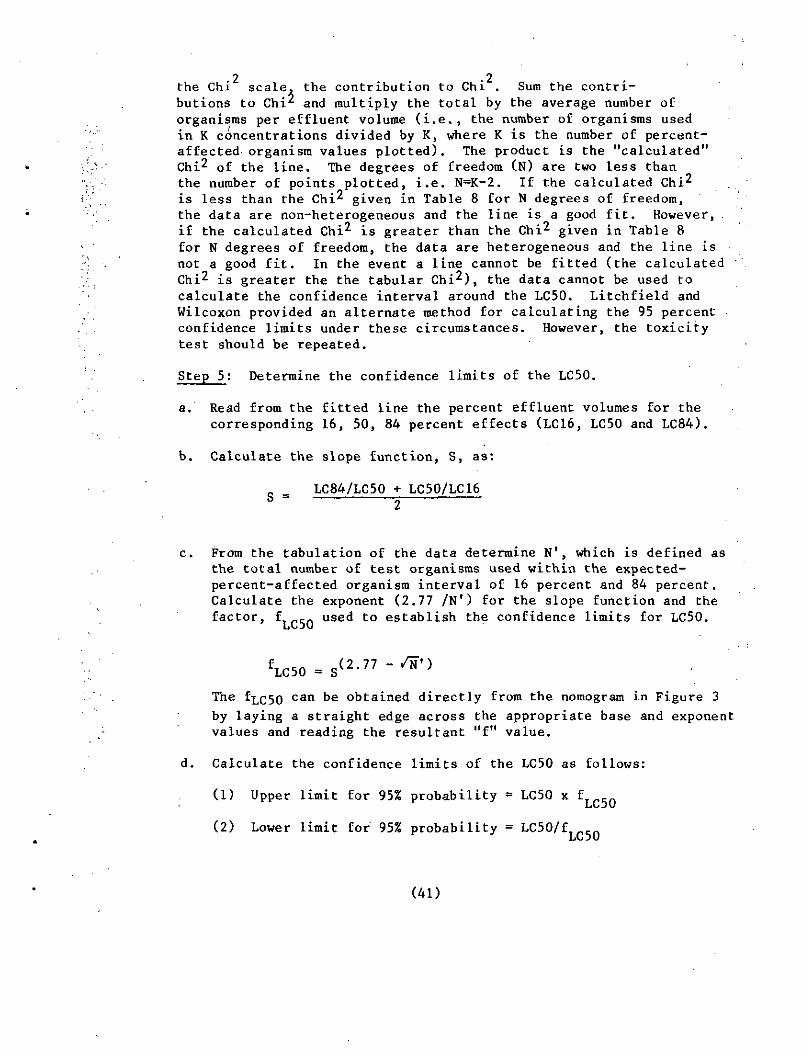
.2 .2the Chi scale* the contribution to Chi . Sum the contri-butions to Chi^ and multiply the total by the average number oforganisms per effluent volume (i.e., the number of organisms usedin K concentrations divided by K, where K is the dumber of percent-affected organism values plotted). The product is the "calculated"Chi^ of the line. The degrees of freedom (N) are two less thanthe number of points plotted, i.e. N=K-2. If the calculated Chi^is less than the Chi^ given in Table 8 for N degrees of freedom,the data are non-heterogeneous and the line is a good fit. However,i£ the calculated Chi^ is greater than the Chi^ given in Table 8for N degrees of freedom, the data are heterogeneous and the line isnot a good fit. In the event a line cannot be fitted (the calculatedChi2 is greater the the tabular Chi^), the data cannot be used tocalculate the confidence interval around the LC50. Litchfield andWilcoxon provided an alternate method for calculating the 95 percentconfidence limits under these circumstances. However, the toxicitytest should be repeated.
jatep 5: Determine the confidence limits of the LC50.
a. Read from the fitted line the percent effluent volumes for thecorresponding 16, 50, 84 percent effects (LC16, LC50 and LC84).
b. Calculate the slope function, S, as:
LC84/LC50 + LC50/LC16
From the tabulation of the data determine N1, which is defined asthe total number of test organisms used within the expected-percent-affected organism interval of 16 percent and 84 percent.Calculate the exponent (2.77 /N1) for the slope function and thefactor, f,rcn used to establish the confidence limits for LC50.
The fLC50 can bg obtained directly from the nomogram in Figure 3by laying a straight edge across the appropriate base and exponentvalues and reading the resultant "f" value.
d. Calculate the confidence limits of the LC50 as follows:
(1) Upper limit for 95% probability = LC5Q x ^
(2) Lower limit for 95% probability = LC50/f"LC50
(41)
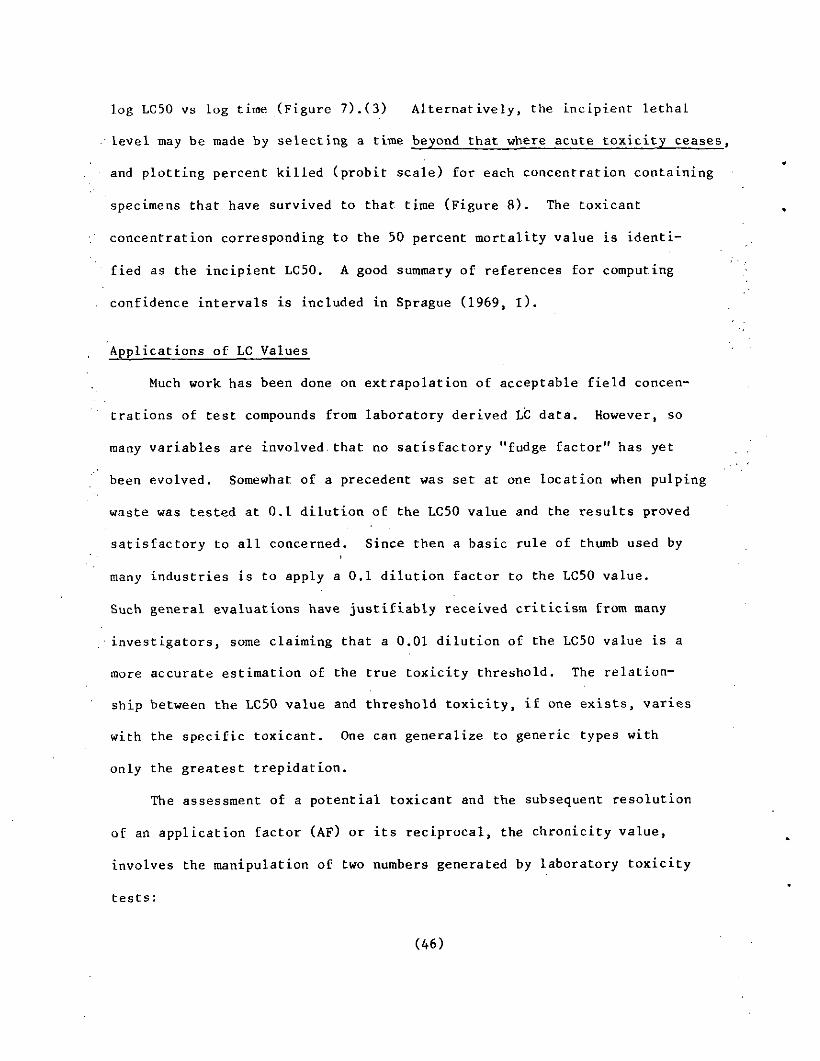
log LC50 vs log time (Figure 7).(3) Alternatively, the incipient lethal
level may be made by selecting a time beyond that^ where acute toxicity ceases,
and plotting percent killed (probit scale) for each concentration containing
specimens that have survived to that time (Figure 8). The toxicant
concentration corresponding to the 50 percent mortality value is identi-
fied as the incipient LC50. A good summary of references for computing
confidence intervals is included in Sprague (1969, I).
Applications of LC Values
Much work has been done on extrapolation of acceptable field concen-
trations of test compounds from laboratory derived LC data. However, so
many variables are involved.that no satisfactory "fudge factor" has yet
been evolved. Somewhat of a precedent was set at one location when pulping
waste was tested at 0.1 dilution of the LC50 value and the results proved
satisfactory to all concerned. Since then a basic rule of thumb used by
many industries is to apply a 0.1 dilution factor to the LC50 value.
Such general evaluations have justifiably received criticism from many
investigators, some claiming that a 0.01 dilution of the LC50 value is a
more accurate estimation of the true toxicity threshold. The relation-
ship between the LC50 value and threshold toxicity, if one exists, varies
with the specific toxicant. One can generalize to generic types with
only the greatest trepidation.
The assessment of a potential toxicant and the subsequent resolution
of an application factor (AF) or its reciprocal, the chronicity value,
involves the manipulation of two numbers generated by laboratory toxicity
tests:
(46)
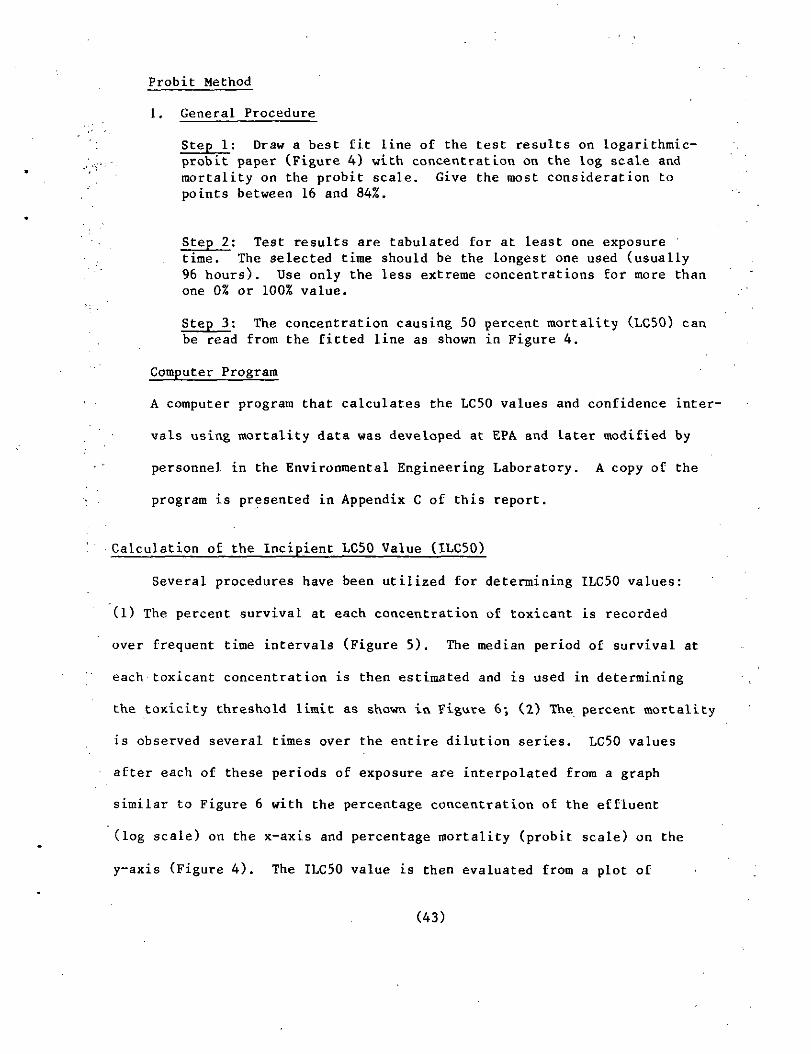
Probit Method
1. general Procedure
Step 1: Draw a best fit Line of the test results on logarithmic-probit paper (Figure 4) with concentration on the log scale andmortality on the probit scale. Give the most consideration topoints between 16 and 84%.
Step 2: Test results are tabulated for at least one exposuretime. The selected time should be the longest one used (usually96 hours). Use only the less extreme concentrations Eor more thanone 0% or 100% value.
Step 3: The concentration causing 50 percent mortality (LC50) canbe read from the fitted line as shown in Figure 4.
Computer Program
A computer program that calculates the LC50 values and confidence inter-
vals using mortality data was developed at EPA and later modified by
personnel in the Environmental Engineering Laboratory. A copy of the
program is presented in Appendix C of this report.
Calculation of the Incipient LC50 Value (ItC50)
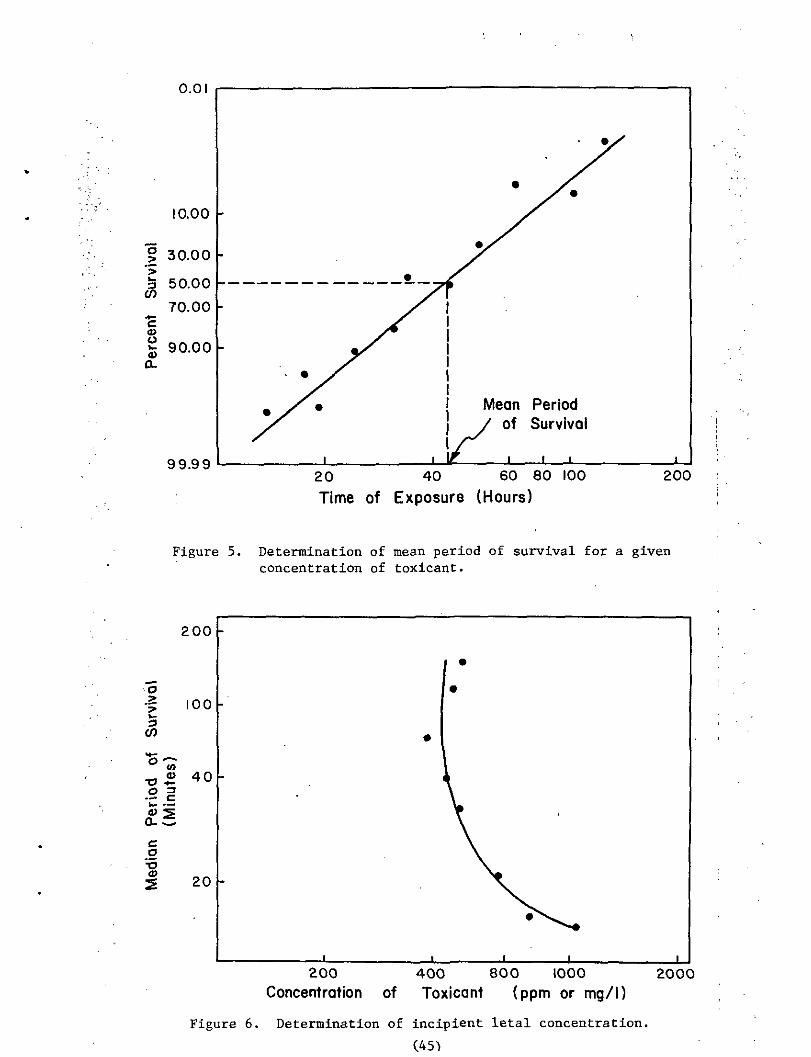
Several procedures have been utilized for determining ILC50 values:
(1) The percent survival at each concentration of toxicant is recorded
over frequent time intervals (Figure 5). The median period of survival at
each toxicant concentration is then estimated and is used in determining
the toxicity threshold limit as showcv in ?ig\ire 6; (2) The percent mortality
is observed several times over the entire dilution series. LC50 values
after each of these periods of exposure ace interpolated from a graph
similar to Figure 6 with the percentage concentration of the effluent
(log scale) on the x-axis and percentage mortality (probit scale) on the
y-axis (Figure 4). The ILC50 value is then evaluated from a plot of
(43)
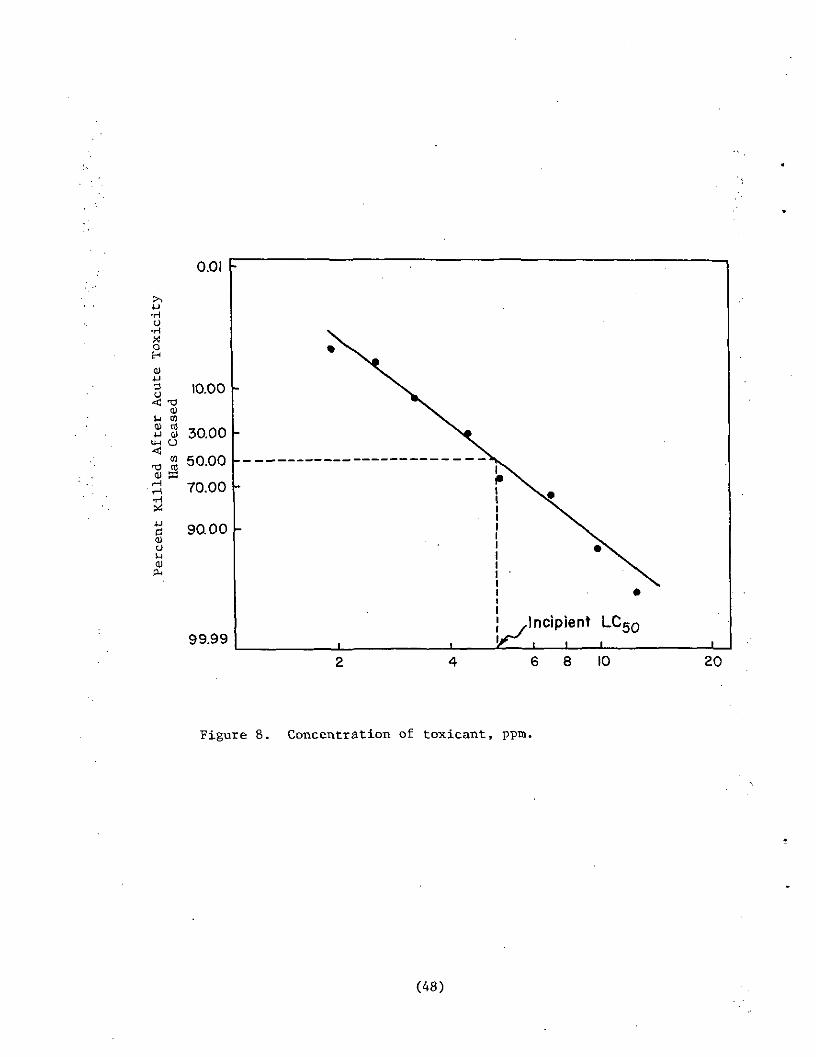
0.01
99.99ncipient LC50
i i i8 10 20
Figure 8. Concentration of toxicant,
(48)
0.01
10.00
? 30.00
3 50.00
o>o
O.
70.00
90.00
99.99
Mean Periodof Survival
20 40 60 80 100
Time of Exposure (Hours)200
Figure 5. Determination of mean period of survival for a givenconcentration of toxicant.
a
CO
"S
200
100
® 40
ca
"•oa?20
EGO 400 800 1000Concentration of Toxicant (ppm or mg/t)
Figure 6. Determination of incipient letal concentration.
(45)
2000
1) Long term exposure of test organisms to much lower toxicant
concentrations than are lethal to fish may still cause impaired
function or performances such as in swimming ability, appetite
and growth, resistance to disease, reproductive capacity and the
general ability to compete with other species. For example, a
certain concentration of a toxicant may have no noticeable chronic
toxic effect on a particular species of fish in the lab, but
due to subtle impairment of some ability, the species might be
outcompeted in the natural environment and be completely eliminated
from a waterway after a period of years.
2) Water quality parameters such as alkalinity, hardness, pH,
temperature and conductivity can drastically change the LC50
(Moreno, 1981) and MATC under field conditions,
3) Low levels of a toxicant may have no effect on Che species of
fish tested but could have a toxic effect on other biota that
the fish consume. Thus certain species of fish might be selected
against due to a change in food availability.
4) It is important to realize that the AF will change according to
the species and toxicant being tested, Pickering and Cast (1972)
demonstrated the AF for fathead minnows exposed to cadmium in
hard water was 0.005-0.008 of the 96-hour LC50 value. Mount (1968)
determined the AF for the same species with copper as the toxicant
was 0.03-0.08 of the 96-hour LC50. Eaton (1974) showed the AF
for the Bluegill (Lepomis machrochlrus) with cadmium as the
toxicant was 0.0015-0.0039 of the ILC50.
(50)
100
50
. 40S£I0>
J 20
exX
_L_L
*S
\\
o•o
aXUJ
10 20 40
Concentration of EffluentPercent by Volume :
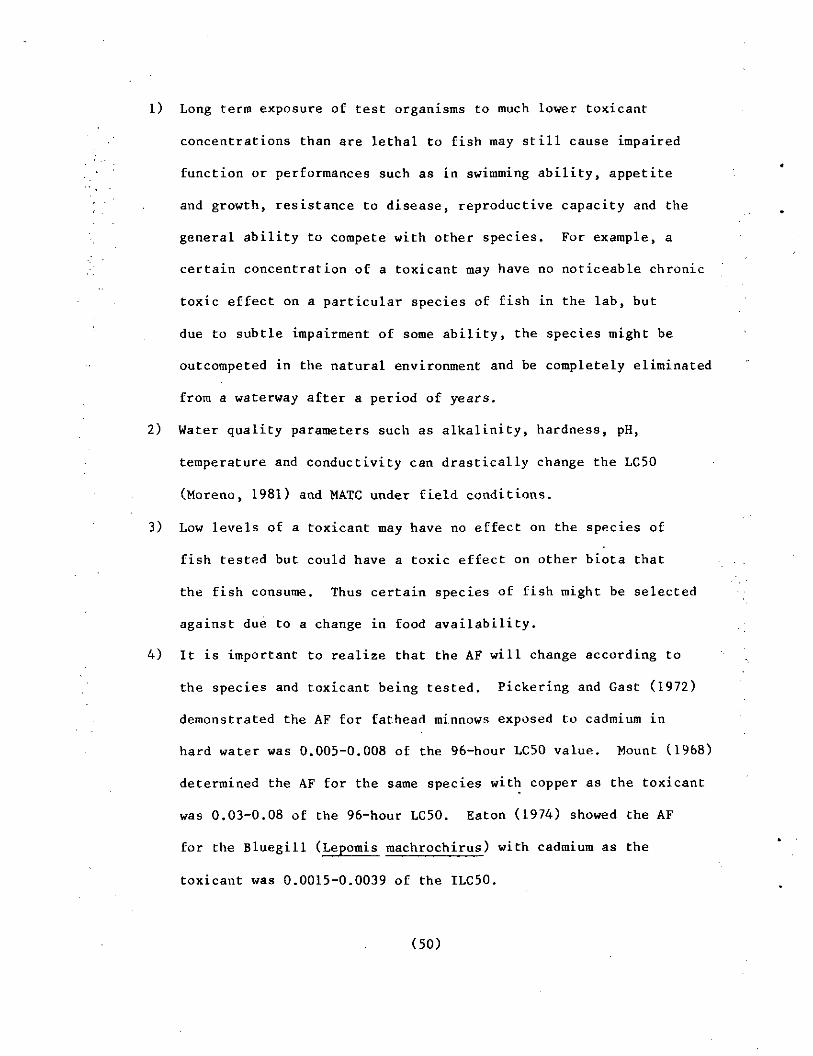
Figure 7. Toxicity curve, drawn as the experimentproceeded, from LC50's determined asshown in Figure 6. Curve has becomealmost asymptotic with the time axis.The 95 percent confidence limits areshown for each LC50, although in manybioassays they would be calculatedonly for the selected or final LC50.
(47)
1, the 96-hour LC50 estimate of acute toxicity, or the incipient
LC50 (ILC50) estimate of toxicity threshold; and
2. the safe concentration (SC) or the maximum allowable toxicant
concentration (MATC).
The AF is derived by dividing the MATC by the 96-hour LC50 or the
ILC50 (APHA 1975). The AF, once determined, permits estimation of MATC
values for a given toxicant from just the 96-hour LC50 value.
While the generation of the latter requires no great competence,
estimation of the MATC is a more difficult task. The definition of some
threshold of inhibition of a life function (growth, fecundity, etc.) over
a sustained period demands a high level of expertise. For this reason a
current list of AF values would be extremely useful to laboratories
evaluating sample toxicity.
The MATC can be determined directly by chronic toxicity studies.
This determination involves placing fish fry in toxicant and observing
growth inhibition or spawning interference. Such studies are performed
by E.G. and G. Bionomics, Inc., of Warehara, Massachusetts. The MATC is
determined from the geometric mean of the greatest concentration that
causes the same response as the control, and the lowest concentration
where a different response is observed.
An alternative to determining an AF or MATC value based upon long-
term chronic exposure is the estimation of safe levels by relatively
short-term exposures of embroyos and larvae as suggested by Eaton (1974).
Such a test may be completed in 30 days (EPA, 1978). In determining
the MATC, several factors should be considered.
(49)
Some AF values have been compiled while many are still unknown. The
National Technical Advisory Committee on Water Quality Requirements for
Aquatic Life (1968) has divided toxicants into three groups and provided
the appropriate LC50 and AF values. A general application factor must be
applied to toxicants at times when MATC values are unknown in the interest
of expediting pollution control. AF values ranging from 0.01 to 0.1 of
the 96-hoar LC50 have been suggested. Sprague (1969, II) suggested the
AF could roughly be approximated by 0.05 based on the 96-hour LC50 or
0.1 using the 20 day LC50. Considering the findings that AF values vary
greatly and may be well below 0.05 such as in the studies previously
alluded to, a general AF value of O.,005 using the 96-hour LC50 is a more
reasonable value.
(51)
XII. REFERENCES
/ j ;'.American Public Health Association.' 1975. 'Standard Methods for the'.•Examination of Water and Wastewater; 14th Ed., Washington, D.C./: American Public Health Association, 872 pp.
•! /
;-;/ Brauhn, J.L., and Schoettger, R.A. 1975. Acquisition and Culture of:-':• .Research Fish: Rainbow Trout, Fathead Minnows, Channel Catfish, and'•":: Bluegills. EPA-660/3-75-011. National Water Quality Laboratory,
;;> USEPA, Duluth, Minnesota, 46 pp.
;-;Brungs, W, A. and D. I. Mount. 1967. A Device for Continuous Treatmentof Fish in Holding Chambers. Trans. Amer. Fish. Soc., 96:55-57.
. Davis, H. S. 1953. Culture and Disease of Game Fishes. Univ. Calif.( Press, Berkeley, Calif. 332 pp.
-..""-;. DeGraeue, G. M. , R. L. Overcast and L. H. Bergman. 1980. Toxicity of; . Underground Coal Gasification Condenser Water and Selected Constituents•".'' .to Aquatic Biota. Arch. Environm.Cpntam. Toxicol.» 9:543-555.
Eaton, J. C. 1974. Chronic Cadmium Toxicity to the Bluegill (Lepomis, ' • - ' macrochirus). Trans. Amer. Fish. Soc., 4:729-735.
EPA. 1979. Methods for Chemical Analysis of Water and Wastes. EPA-600-4-79-020. USEPA, Cincinnati, Ohio.
. . EPA. 1978. Directory of Short Term Tests for Health and Ecological,. Effects, PB-2902 260. Health Effect Research Laboratory, USEPA, Research
Triangle Port, North Carolina.
; Finney, D. J. 1964. Statistical Methods in Biological Assay. 2nd Ed.,.;! . Hafner Publ.' Co., NY, NY, 668 pp.
Finney, D. J. 1971. Probit Analysis. Cambridge Univ. Press. London,: 333 PP.
-;i Hoffman, G. L. and F. P. Meyer. 1974. Parasites of Freshwater Fishes.THF Publ. Inc., Neptune City, NJ 224 pp.
• Litchfield, J. T., Jr. and F. Wilcoxon. 1949. A Simplified Method ofEvaluating Nose-effect Experiments, J. Pharm. Exp. Theor. 96:99-113.
Macek, Kenneth, Bionomics Inc. Wareham, MA personal communication.
Medeiros, C., R. Coler and N. Rara. 1981. Bioassays for Toxic andHazardous Materials. EPA 4361/1-81-026. National Training and OperationalTechnology Center, USEPA, Cincinnati, Ohio, 24 pp.
(52)
Moreno, M. C. Z. , 1981. In£lue_n_ce__of___Physical and Chemical Parameters
'•-' on ToKJcity. Dept. of Civil Eng., Univ. of Mass., Amherst, MA 19 pp.
Mount, D. I. 1968. Chronic Toxicity of Copper to Fathead Minnows•: (F ime phaJUis promelas Rafinesque) . Water Res. , 2: 215-223 .
• ..'.Mount, D. I. and R. E. Warner. 1965. Serial-dilution Applications of; . :.Continuous__Delivery of Various Concentrations of Materials in Water.'(.'.'[ No. 99WP23. U. S. Public Health Service Publ. Wash. D.C.
.;• .; Peltier, W. 1978. Methods for Measuring the Acute Toxicity of Effluents';. .'. to Aquatic Organisms. EPA-600/4-78-012. Environmental Monitoring and' . Support Laboratory, Office of Research and Development, U.S. EPA,
•-•-•- Cincinnati, Ohio, 52 pp.
\-..\ Peterson, R. H. and Anderson, J. M. 1969. Influence of Temperature.. Change on Spontaneous Locomotion Activity and Oxygen Consumption of•\ • Atlantic Salmon Acclimated to Two Temperatures. J. Fish. Res. Board Can.rX 26:93-109.
-."•- Pickering, Q. H. 1981. Personal communication. Newtown Fish Toxicology;."•'•. .Station, US EPA, Cincinnati, Ohio.
V. Pickering, Q. H. and M. H. Cast. 1972. Acute and Chronic Toxicity of: Cadmium to the Fathead Minnow (Pimephales promelas). J. Fish. Res. Board. Can., 29:1099-1106.
Plotkin, S. 1982. Personal observation, Environmental Engineering' Program, Civil Engineering Dept., University of Massachusetts,
Amherst, Massachusetts.
Ram, N. M., 1979. Nitrogenous Organic Compounds in Aquatic Sources.PhD Thesis, Harvard University, Cambridge, MA 414 pp.
Reichenbach-Klinke, H., and E. Elhan. 1965. The Principal Diseasesof Lower Vertebrates. Academic Press, New York, 600 pp.
Sephar, R. L., A. E. Lemke, A. H. Pickering, T. H. Roush, R.C. Russo,..-. J. D. Yount. 1981. Effects of Pollution on Freshwater Fish. JWPCF,
June, 1028-1075.
Sniewzko, S. F. (Ed.). 1970. A Symposium on Diseases of Fishes andShellfishes. Spec. Publ. No. 5, Amer. Fish Soc., Washington, D.C. -526 pp.
Sprague, J. B. 1969. Measurement of Pollutant Toxicity to Fish.I. Bioassay Methods for Acute Toxicity, Fish. Res Board Can.
(53)
Sprague, J. B. 1969. Measurement of Pollutant Toxicity to Fish.II. Utilizing and Applying Bioassay Results. Fish. Res. Board Can.
Van Duijin, C., Jr. 1973. Diseases of Fishes. 3rd Ed., Charles C.Thomas Publ. Spfld., IL. 309 pp.
Water Quality Criteria. 1968. Report of the National Technical AdvisoryCommittee to the Secretary of the Interior. FWPCA. U. S. Dept. Interior,U.S. Government Printing Office I-X.
.Weber, C. I. 1980. Effluent Toxicity Screening Test Using Daphnia andMysid Shrimp. Draft. EPA 600/4-81-000. Environmental Monitory andSupport Laboratory, USEPA, Cincinnati, Ohio. 48 pp.
(54)
XIII. APPENDICES
Appendix A
''?'':"• -
Item.?;:,.
EQUIPMENT
Holding tank
Static testingjars
Flow throughsystem
Water purifyingsystem
pH meter
Thermometer
Lighting
Light timer
Dissolved oxygenprobe and meter
Conductivity meter
Analyticalbalance
UJU U.L LHUl̂ lit- ** 11 U KJU L/LJ J- ¥ \J\J O t- tJ J-1
Conducting Acute Fish Toxicity
Specifications
400 liter recirculates every1.5 minutes
20 glass jars (5 gallons $18 each)
stainless steel aquaria;tygon tubing;7 double head and one 10 channelpositive displacement pumps toaccommodate 24 inflow-outflows
Reverse osmosis water purifyingsystem
Range 0-14, pH units +0.1
Mercury-0°C-100°C g
Must provide about 100 ft-c
Must automatically turn off andon lights at specified intervals
Reads 0-20 mgO/1
Reads 0-50,000 umhos
Capable of reading to fourthdecimal point
\J L
Tests
Costs(1981 dollars)
$1700
$360
$2000$500$3000
$2000
$500
$10
$200
$200
$1000
$1000
$2600
• ' ' *V
Vendor : '"'•"'
' •;-:.
Frigid Units
Empire StateGlass ...
Cole FarmerCole Farmer
Millipore Corp
Fisher Scientific
Fisher Scientific
'- '"'
\
Yellow SpringsInstrument Co.
Fisher Scientific
Mixing tanks 3,208 liter polyethylene tanks $300 Fisher Scientific
(55)
APPENDIX A (continued)
Item Specifications Costs Vendor
Mixer
Oven.
Dessicator
Vacuum pump
Filteringapparatus
Atomic AbsorptionS pec tropho tome ter
Constant Temp.Room .
SUBTOTAL
SUPPLIES
Polyester fiber
Activatedcharcoal
Ammoniaremovingpellets
AssortedGlasware
3 ft shaft & propeller
Capable of 120°C
Used for drying chemicals
Used with filtering apparatus
For use with 47 nun filter
To measure heavy metals
-
Used Cor filtering recircu-lating water in holding tank
Used to remove organic compoundsfrom holding tank water
Removes NH_ from holding tankwater
2 each of 25 & 10 ml burets;5, 100 ml volumetric flasks;
(1981 dollars)
$100
$800
$100
$350
$200
contractout at$8-15 permetal persample
-
$16,920
$25/4 Ibs
$25/10 Ibs
$23/gal
$400
—
Fisher Scientific
Fisher Scientific
Fisher Scientific
Fisher Scientific
Millpore Corp.
Water QualityAnalyses Lab.
-
Pet store
Frigid Units
CommonwealthAquarium
Fisher Scientific
3, 1 liter volumetric flasks;4 each of 0.5,I.0,2.0,3.0,
5.0,20.0, 25.0 &50.0 ml volumetricpipets;
1 each of 25, 100, 500 mlgrad. cylinders
(56)
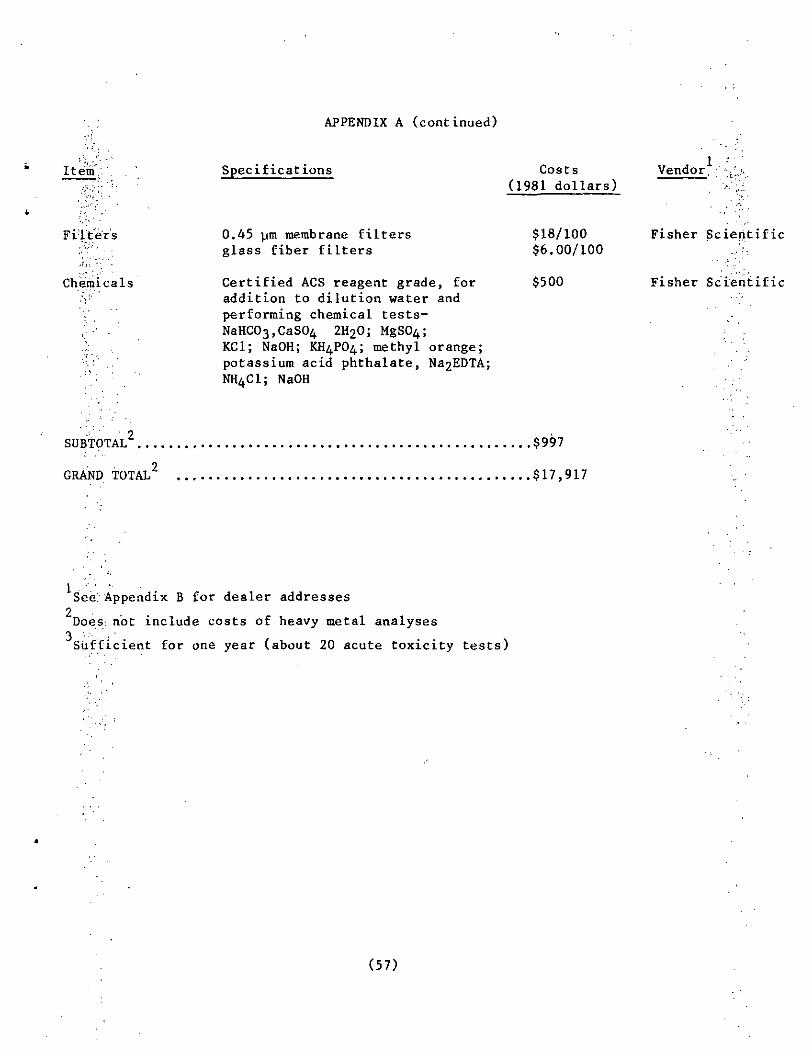
APPENDIX A (continued)
11 em';1.
Filter's
Chemicals
Specifications
0.45 jura membrane filtersglass fiber filters
Certified ACS reagent grade, foraddition to dilution water andperforming chemical tests-NaHC03,CaS04 21̂ 0; MgSC^;KC1; NaOH; KfyPO^ methyl orange;potassium acid phthalate, N32EDTA;NItyCl; NaOH
Costs(1981 dollars)
$18/100$6.00/100
$500
Vendor
Fisher Scientific
Fisher Scientific
SUBTOTAL
GRAND TOTAL'
,$997
$17,917
See; Appendix B for dealer addressesi"Does, not include costs of heavy metal analyses
Sufficient for one year (about 20 acute toxicity tests)
(57)
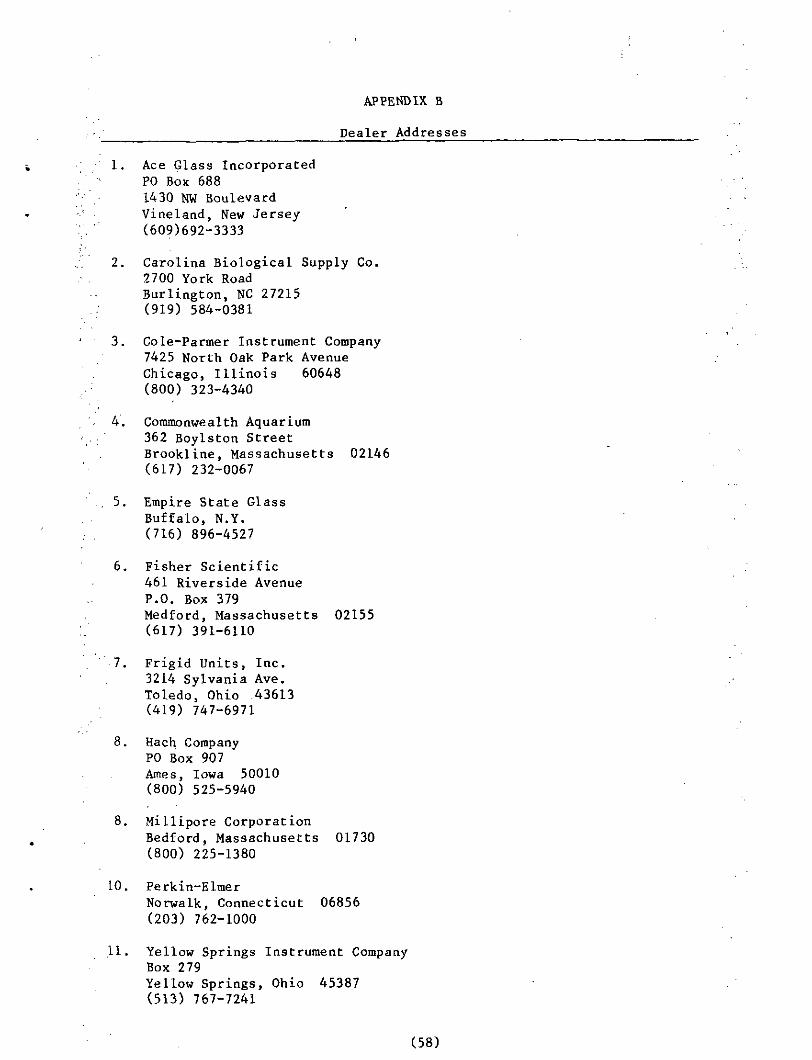
APPENDIX B
Dealer Addresses
1. Ace Glass IncorporatedPO Box 6881430 NW BoulevardVineland, New Jersey(609)692-3333
2. Carolina Biological Supply Co.2700 York RoadBurlington, NC 27215(919) 584-0381
3. Cole-Parmer Instrument Company7425 North Oak Park AvenueChicago, Illinois 60648(800) 323-4340
4. Commonwealth Aquarium362 Boylston StreetBrookline, Massachusetts 02146(617) 232-0067
5. Empire State GlassBuffalo, N.Y.(716) 896-4527
6. Fisher Scientific461 Riverside AvenueP.O. Box 379Medford, Massachusetts 02155(617) 391-6110
7. Frigid Units, Inc.3214 Sylvania Ave.Toledo, Ohio 43613(419) 747-6971
8. Hach CompanyPO Box 907Ames, Iowa 50010(800) 525-5940
8. Millipore CorporationBedford, Massachusetts 01730(800) 225-1380
10. Perkin-ElmerNorwalk, Connecticut 06856(203) 762-1000
11. Yellow Springs Instrument CompanyBox 279Yellow Springs, Ohio 45387(513) 767-7241
(58)
Appendix C
Computer Program Used Co Calculate
LC50 Values and Confidence Intervals
(59)
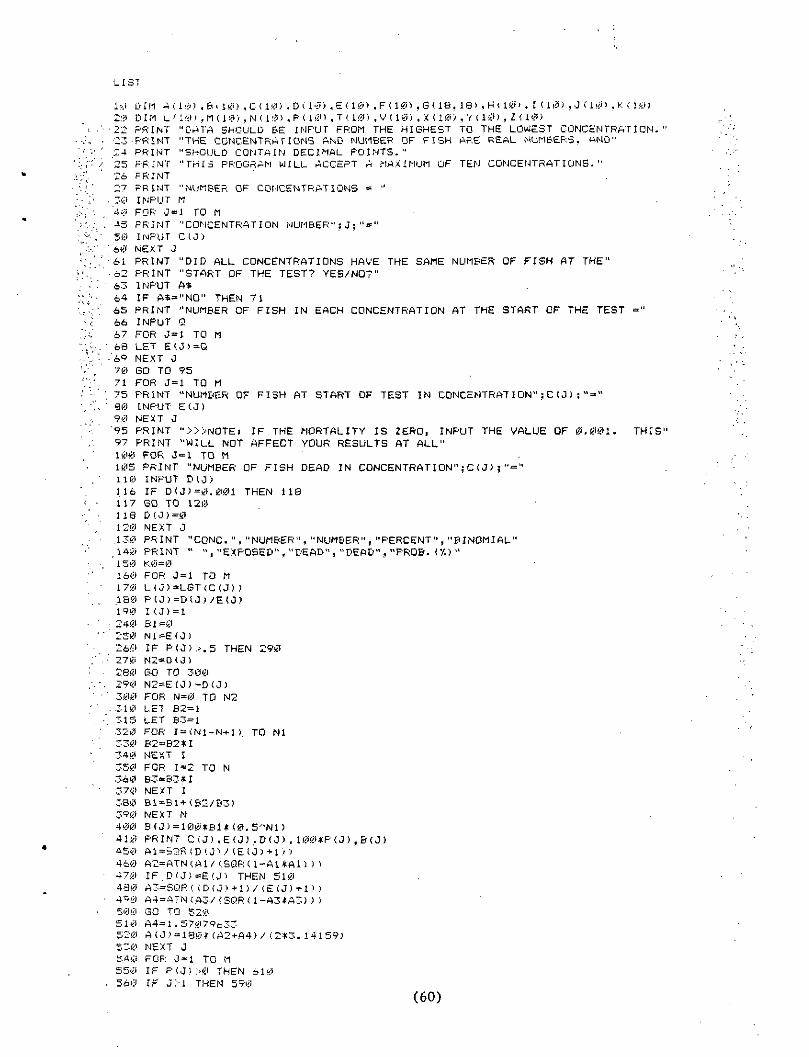
LIST
10 DIM AU0) , Ei« 10) ,CU0> ,DU0> ,EU0> ,F(10> ,6<18, 18> ,HU0> , I U0> , JU0> ,K < 10)20 DIM L ' 10.' , M (10 > , N ( 10) , P < 10 > . T < 10 '• , V ( 10) , X < 10 '> , V (10) , Z <10)22 PRINT "DATA SHOULD BE INPUT FROM THE HIGHEST TO THE LOWEST CONCENTRATION.'•23-PR I NT "THE CONCENTRATIONS AND NUMBER OF FISH AF;£ REAL NUMBERS, AND"24 PRINT "SHOULD CONTAIN DECIMAL POINTS."25 PRINT "THIS PROGRAM WILL ACCEPT A MAXIMUM GF TEN CONCENTRATIONS."26 PRINT27 PRINT "NUMBER OF CONCENTRATIONS = ""0 INPUT M40 FOR J=l TO M45 PRINT "CONCENTRATION NUMBER"jJ;"="513 INPUT C(J>60 NEXT J61 PRINT "DID ALL CONCENTRATIONS HAVE THE SAME NUMBER OF FISH AT THE"62 PRINT "START OF THE TEST? YES/NO?"63 INPUT A*64 IF AS="NQ" THEN 7165 PRINT "NUMBER OF FISH IN EACH CONCENTRATION AT THE START OF THE TEST ="66 INPUT Q67 FOR J=l TO M68 LET £<J)=Q'6^ NEXT J70 SO TO 9571 FOR J»l TO M75 PRINT "NUMBER OF FISH AT START OF TEST IN CONCENTRATION"sCU):"="80 INPUT E(J)90 NEXT J"95 PRINT ">»NOTE: IF THE MORTALITY IS ZERO, INPUT THE VALUE OF 0.001. THIS'97 PRINT "WILL NOT AFFECT YOUR RESULTS AT ALL"100 FOR J=l TO M105 PRINT "NUMBER OF FISH DEAD IN CONCENTRATION";C(J)j"="110 INPUT D(J)116 IF D<J)=0.001 THEN 119117 GO TO 120113 D(J)=0120 NEXT J
. 130 PR I NT " CONC. " ., " NUMBER " , " NUMBER " , " PERCENT " , " BINOMIAL ",140 PRINT " ", "EXPOSED11, "DEAD", "DEAD" ., "PROB. C/.)"
160 FOR J=l TO M170 L<J>=LCT(C(J)J
190 I(J)=1240 Bl=0
260 IF P(J».5 THEN 290
280 GO TO 300290 N2=E(J)-D(J)300 FOR N=l<f TO N2.310 LEI B2=l315 LET 83=1320 FOR I = <Nl-N-fl). TO Nl330 B2=B2*I340 NEXT I350 FOR 1=2 TO N360 B3=B3*I370 NEXT I380 Bl=Bl-MB-2/B3>390 NEXT N400 B(J)=100*B1*<0.5"'"N1>
PRINT CiJ),E<J),D(J),100*P(J),B(J)
460 A2=ATN<A1/(.SGR(1-A1*A11 ) ̂470 IF.DU>=E(J'> THEN 510430 A3=SQP. ( (D(J>+1)/ (E(J)-HM49gt A4=ATN(A3/(SQRU-A3*A3) ) >50';i GO TQ 52'/l'510 A4=l.S7079fc33
A(J)=1S0*(A2*A4>/<2*3.14159JNEXT JFOR J = l TO MIF P(J?>0 THEM 610IF J>1 THEM 590
(60)
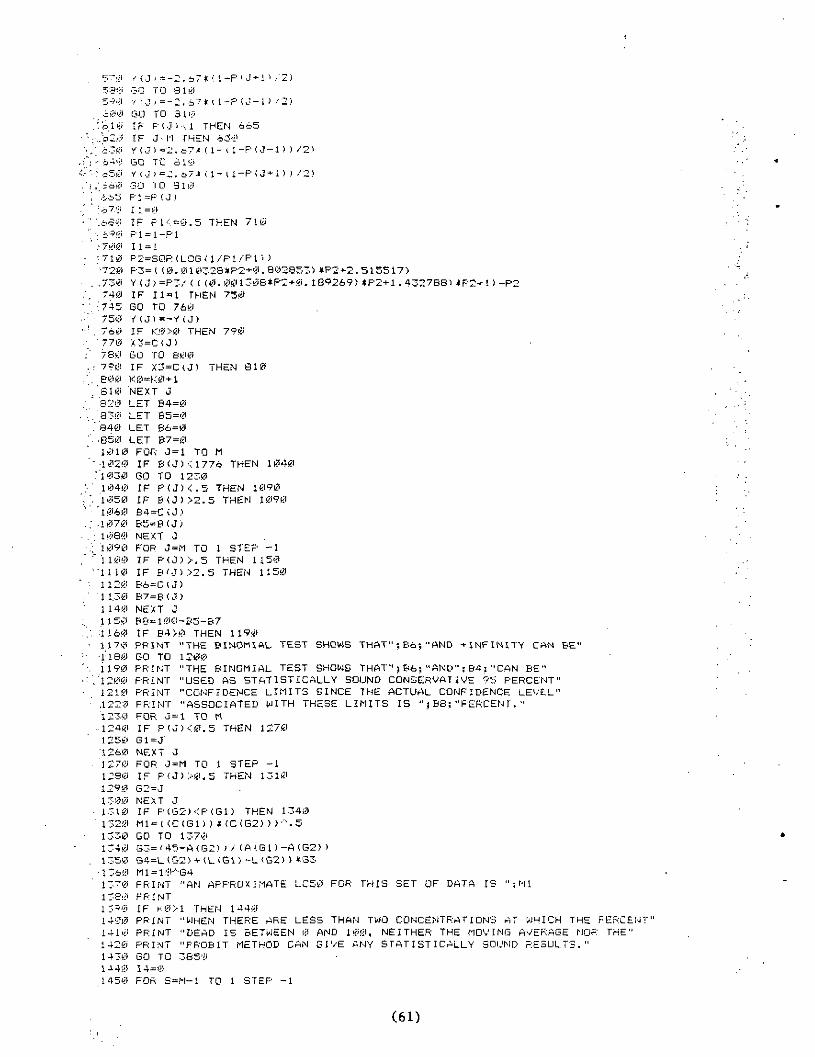
5^0 M J i =-2. {37* •: 1-P ' J*-l > /2)534/1 GO TO 8105 -?'-•! Y < , J > = - 2 , 67* i 1-FMJ-l > , '2>000 SO TO 310
- o 10 IF P ( J 1 •=.. 1 THEN o=5,b20 IF J ; ,M THEN 630v=3<if y (Ji =2. o7.« ( 1- t 1-P < J-l > ) /2>6-^ GD TC 319,s5fe' V (J ) =2. i?7J< i 1- l 1-P < J + i > ) -'2>
'i6'0 GO TO 910"iiS P 1 = P < J);o7';i 11=0.i>S0 IF P l<=0 .5 THEN 710V90 P1=1-P1
-700 11 = 1•71^1 P 2 = S Q R ( L O G U / P 1 / P 1 ' >
,73̂ V(J)=P3/ ( ( (0..0<iH306*P2 + 0. 18̂ 269) *P2+1 . 432768) *F2-M ) -P2740 IF 11=1 THEN 750:745 60 TO 760750 V (J) =-y (J)760 IF K'iOfil THEN 79w
' 770 X3=C(J )780 GO TO 6007?0 IF X 3 = C t J ) THEN 810800 K0»K0+1
' S 1 0 NE X T JSI'!:' LET 54=033i;i LET B5=<3840 LET 86=0'B50 LET B7=01010 FOR J=l TO M•ls?2fi> IF B(JX177o THEN 1040
:"lii!30 60 TO 12301040 IF P < J X . 5 THEN 10901050 IF B<J»2.S THEN 1090
-1070 B5=B(J)IwSfit' NEXT J'1090 FOP J=M TO 1 STEP -1llfeifl IF P<JJ>.S THEN 11501110 IF BM)>2.3 THEN 1150I12iii Bi=CtJ)11.30 B7=B<J>1140 NEXT J1 150 B8=100-B5-B7-1160 IF B4>0 THEN 11901170 PFflHT "THE BINOMIAL TEST SHOWS THAT" ; Bo; "ftND ^INFINITY CAN BE-11 S0 60 TO 12001190 PRINT "THE PINDhlAL TEST SHOWS THAT" ; B6; "AND" ; B4; "CAN BE"'1200 PRINT "USED AS STATISTICALLY SOUND CONSERVATIVE 95 PERCENT"1210 PRINT "CONFIDENCE LIMITS SINCE THE ACTUAL CONFIDENCE LEVEL",1220 PRINT "ASSOCIATED WITH THESE LIMITS IS "j BS; "PERCENT. "1230 FOR J=l TO M1240 IF P(J><0.5 THEN 1270125£* 61=J'1260 NEXT J1270 FOR J=M TO 1 STEP -11290 IF PU)>0.5 THEN 1310129« G2=J1300 NEXT J1-"10 IF P(62KP(Sn THEN 13401320 M1=«C(S1) )*(C<62) ) )̂ .51330 60 TO 13701340 G3='45-A<G2> J / ( A (Gl ) -A (G2) )
17-70 PRINT "AN APPROXIMATE L.C50 FOR THIS SET OF DATA IS " ;M11380 PRINT13"S IF K0>1 THEN 1440143i3 PRINT "WHEN THERE ARE LESS THAN TWO CONCENTRATIONS AT WHICH THE PERCENT1410 PRINT "DEAD IS BETWEEN 0 AND 100, NEITHER THE MOVING AVERAGE NOR THE"1420 PRINT "PROBIT METHOD CAN GIVE AMY STATISTICALLY SOUND RESULTS."1430 GO TO 365 'if1.1413 I4=©1450 FOR S-M-1 TO 1 STEP -1
(61)
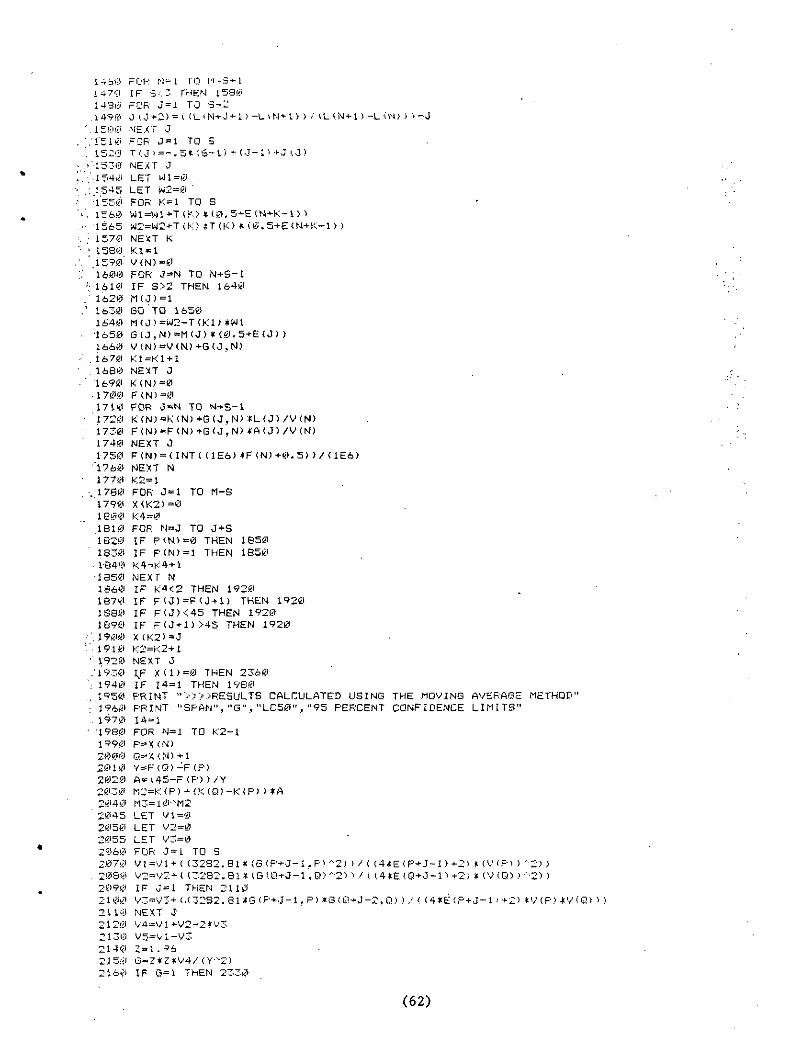
NEXT K
1-V613 FCH pl=l TO M-3*l147-;( IF S<'.3 THEN 15801430 FOR J = l TO 5-2.1493 0 u'>2> = ( tL * N-*-J •«- 1 >.1500 NEXT J•1'51# FOR J = l TO S1520 T<J i=-.5«S-U +(J"•133© NEXT J':1540 LET Ul=0.1545 LET W2=0 "•1550 FOR K=l TO S1560 W1=W1+T <K> * (0.5+E'1565 W2=W2+T(K)*T(K)*(15701580,1590'16fi"916101620163016'40•16501660
. 1670
. 1680'1690• 1700171«'1720173017401750•'17601770. 1780
(L
FOR J«N TO N+3~lIF S>2 THEN 1640l*t(J)=lBO 'TO 1650M<J)=W2-T(K1) *WlG(J,N)-M(J)*(fi».5+E<J))VCN)=V(N)+G(J,N)Kl=Kl-*-lNEXT JK(N)=0F(N)=0FOR J=N TO N+S-1K<N)»K<N)+B(J,N)*L(J)/V(N)
(1E6) *F(N)+K't.5»/(lE6>NEXT JF(N) = <NEXT NK2=JFOR J-l TO M-S
,1810 FOR N»J TO J+S1 920 IF pm>=0 THEN 1BS01830 IF F'CN)=1 THEN 1850
K4=K4+1NEXT NIF k-K2 THEN 192.0IF F(0.)=F(J-H> THEM 19IF F(J)<45 THEN 1920IF F(J+1)>45 THEN 1920
1350I860
18001890
1910 K2=K2+11920 NEXT J'19-30 I^F X<1>=0 THEN 23601940 IF 14=1 THEN 19801950 PRINT "»»RESULTS CALCULATED USING THE MOVING AVSRA6E METHOD1960 PRINT "SPAN", "G" , "LCS0" , "95 PERCENT CONFIDENCE LIMITS"1970 14=1'1980 FOR N=l TO K2-1.1990 P=X <N)2000 Q=X',N)*12010 Y=F(Q)-F(P)2020 A-14S-F(P) >/Y
20402045205020552«6020702080209021002110212.021302140
LET Vl=giLET 2̂=0LET V3=0FDR J=i TO SV1=V1* ( (3282.81*V2=V2*( (3282.81*IF J=l THEN 2110
NEXT J
2=1.96G=Z*Z*V4/ (V---2)IF Q=l THEN 2330
<P+J-1 , P> '^-l , Q>''-
) > / ( (4*E (P+J-1 > +2)> > / ( (4*E < 0*0-1 ^ +2)
(V <PM(VfQ) >
(4*E(P+J-1 ' +2)
(62)
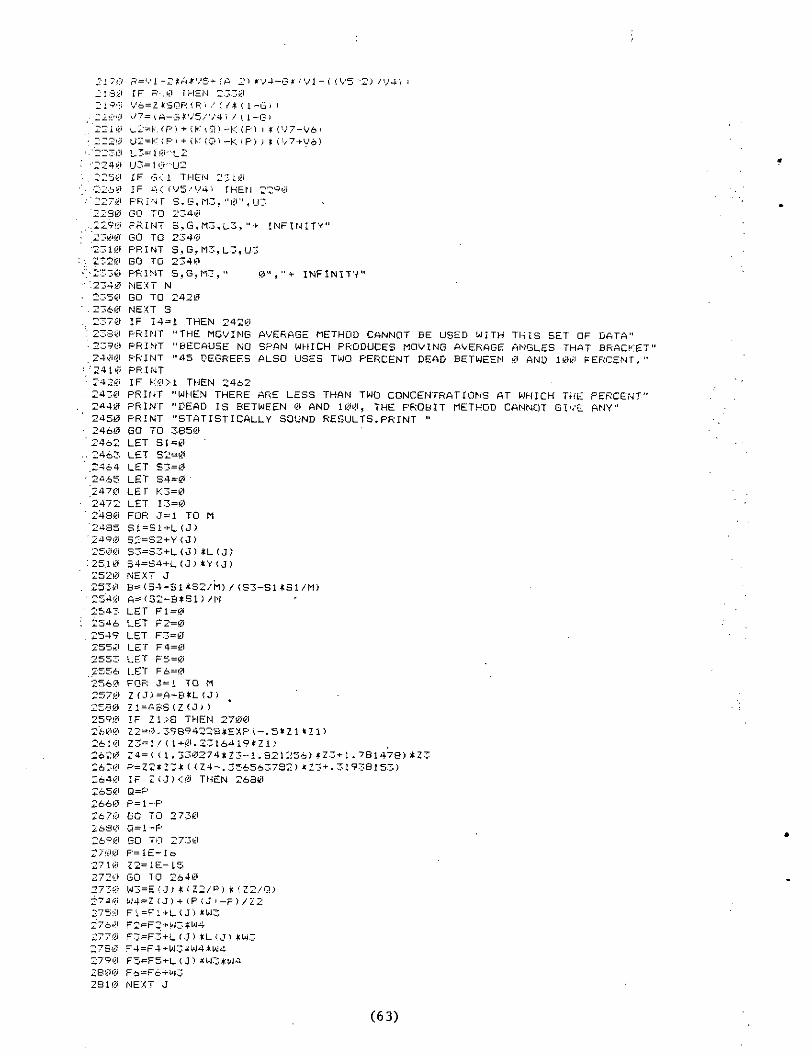
. 22:l"J ^7= irt-G*V5/V4) /' ( 1 -G >
.''2210 L2=K <P> * (KtQ) -K iPl i*<V7-V6'• 2220 U2=K(P> + <*• (Qi-KiP> ) * <V7+y,o)-'2230 L3=l!:i--L2•'2240 U3=1#""U2. 2250 IF G<1 THEN 2 3 Hi*•2-260 IF ^ < ( V 5 . ' V 4 ' . f H E N 22^-ii'227!? P R I N T S. G, ft3. "I:'!'1 , IJ3"2230 GO TO 234i3..229!;J P R I N T £, G, M3.L3, "-*- I N F I N I T Y "
23K»Kf GO TO 2340•2310 PRINT S,G,M3,L7.,U32320 GO TO 234#
-2~3i3 F"R!NT S . G . M 3 , " 0","-*- I N F I N I T Y "'234^1 N E X T N2350 GO TO 2420
'. 2360 NEXT 52370 IF 14=1 THEN 242023S0 PRINT "THE MOVING AVERAGE METHOD CANNOT BE USED WITH THIS BET OF DATA"-2390 PRINT "BECAUSE NO SPAN WHICH PRODUCES MOVING AVERAGE ANGLES THAT BRACKET'.2401;' PRINT "45 DEGREES ALSO USES TWO PERCENT DEAD BETWEEN 0 AND 100 PERCENT."-'2410 PRINT2420 IF K0>1 THEN 24b22430 PRINT "WHEN THERE ARE LESS THAN TWO CONCENTRATIONS AT WHICH THE PERCENT"2*4(3 PRINT "DEAD IS BETWEEN 0 AND 100, THE PROSIT METHOD CANNOT GIVE ANY"2450 PRINT "STATISTICALLY SOUND RESULTS. PRINT "2460 GO TO 385024-b2 LET 51=02463 LET S2-<3.2464 LET S3=02̂ 65 LET 54=0'2470 LET K3=02472 LET 13=02430 FOR J=l TO M'2485 St=Sl+L<J>
25.1 0252025302540254325462549255*12 b1 5 32556
2570
2590
2610-*i*•"2.6206302640j-2222
650660670630690
S3=53+L(J) *L(J>
NEXT JB=<S4-31*S2/M) / <S3~S1*S1/M)A=(S2-B*S1)/I-!LET Fl=0LET F2=0LET F3=0LET F4=0LET F5=0LET F6=0FGR J=i TO MZ{J)=At-B*L(J>Z1=ABS(Z<J>>IF
Z3--
21
I/Z4=( (P=ZIFQ=PP=lGO
2*
<17
ac• f
i.7
THEN 2700
+3*
Z ( J ><
-PTO 27
03(0
J
.2316419*Z1,'0274*23- 1.321 236) *Z3+1. 781 478) *Z^<Z4-. 356563732) * Z3+ . 31 933 1 53)THEN 2650
0Q=1-PGO TO
27(30 p=l£-I'"?
-1
710720
Z2=50KIT —
2o730
IE- ISTOC 1
2640^ > « / 7 ":• / C. -» t / -n y n \2730 W3=E fj; * (Z2/P) # (Z2/Q>
2740 W4=Z ( J) + (P (J.) -P) /*W3
NEXT J
(63)
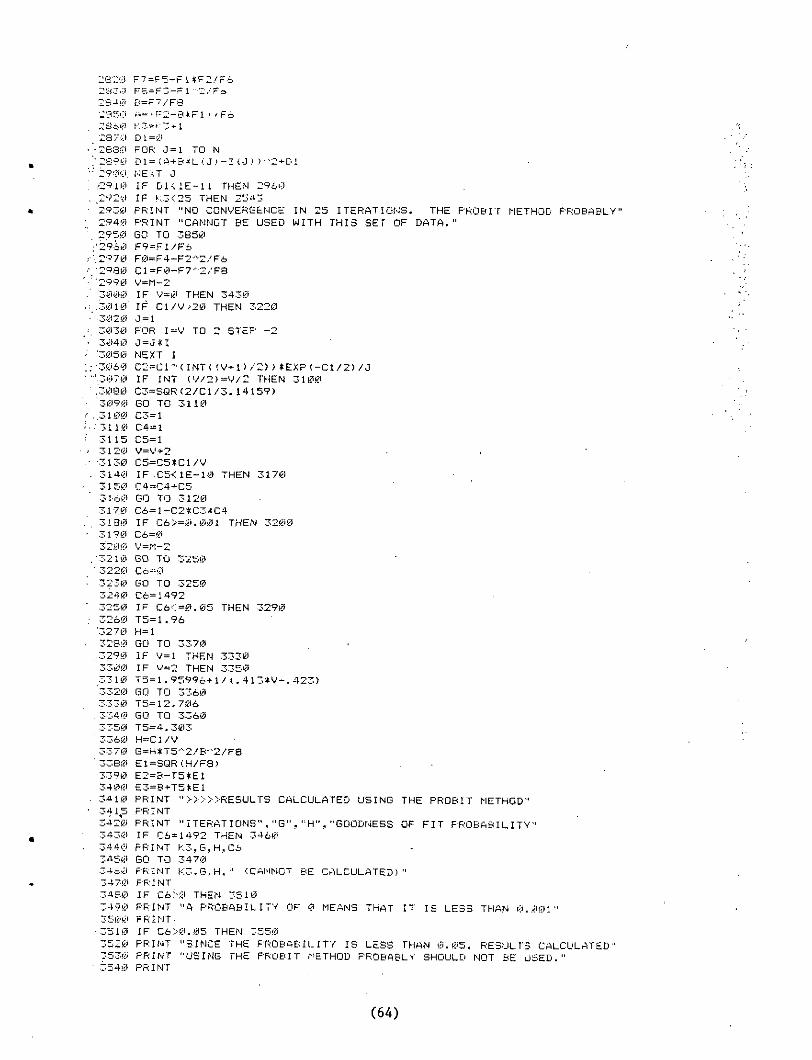
F7=F5-F1*F2/F6F5=F3-Fl-2/F»&=F7/FSM" '.F2-EUF 1 i ' F6
FOR j01= (ANEXTIF DIF K3PRINTPRINTGO TOF9=F1F0=F4Cl=F0
=i TOJ>-2 (0 ) ) "2-t-Dl
J
1E-11 THEN 2960<25 THEN 2543"NO CONVERGENCE IN 25 ITERATIONS. THE PROBIT METHOD PROBABLY1
"CANNOT BE USED WITH THIS SET OF DATA."3850/F6-F2^2/F6-F7-"2/F8
IF V=«l THEN 3430IF C1/V.*20 THEN 3220J = lFOR I=V TO 2 STEP -2
NEXT IC2=C1"MINT( (V+l> /2) ) *EXF'<-Cl/2>IF INT <V/2>=V/2 THEN 3100C3=SQR(2/Cl/3. 14159)GO TO 3110C3=l
C5=lV=V+2CS=C5*C1/VIF.C5<1E-10 THEN 3170C4=C4-*-C5GO TO 3120C6=1-C2*C3*C4IF C6>=0.001 THEN 3200C6=0V=M-2GO TO 3250C6-0GO TO 3250C6-1492IF C6-;=0.05 THEN 3290T5=1.96H=lGO TO 3370IF V=l THEN 3330IF W=2 THEN 3350T5=l .95996+ I/ ( . 413*V-. 423)GO TO 3360T5=12,706GO TO 3360T5-4.303H«C1/V
E1 = SQRE2=B-fE3=B>TPRINTPRINTPRINTIF C6=PRINTGO TOPRINTPRINTIF C6>PRINTPRINT.IF C6>PRINTPRINTPRINT
(H/F8.)S*ElS*E1"»»>RESULTS CALCULATED USING THE PROBIT METHOD"
"ITERATIONS", "B", 1!H", "GOODNESS OF FIT PROBABILITY"1492 THEN 3460K3,B,H,C63470K3.G,H," (CftNNOT BE CALCULATED)"
0 THEN 3510"A PROBABILITY OF 0 MEANS THAT IT IS LESS THAN 0..001"
0.05 THEN 3550"SINCE THE PROBABILITY IS LHSS THAN 0.05, RESULTS CALCULATED"USING THE PROBIT METHOD PROBABLY SHOULD NOT BE USED."
(64)
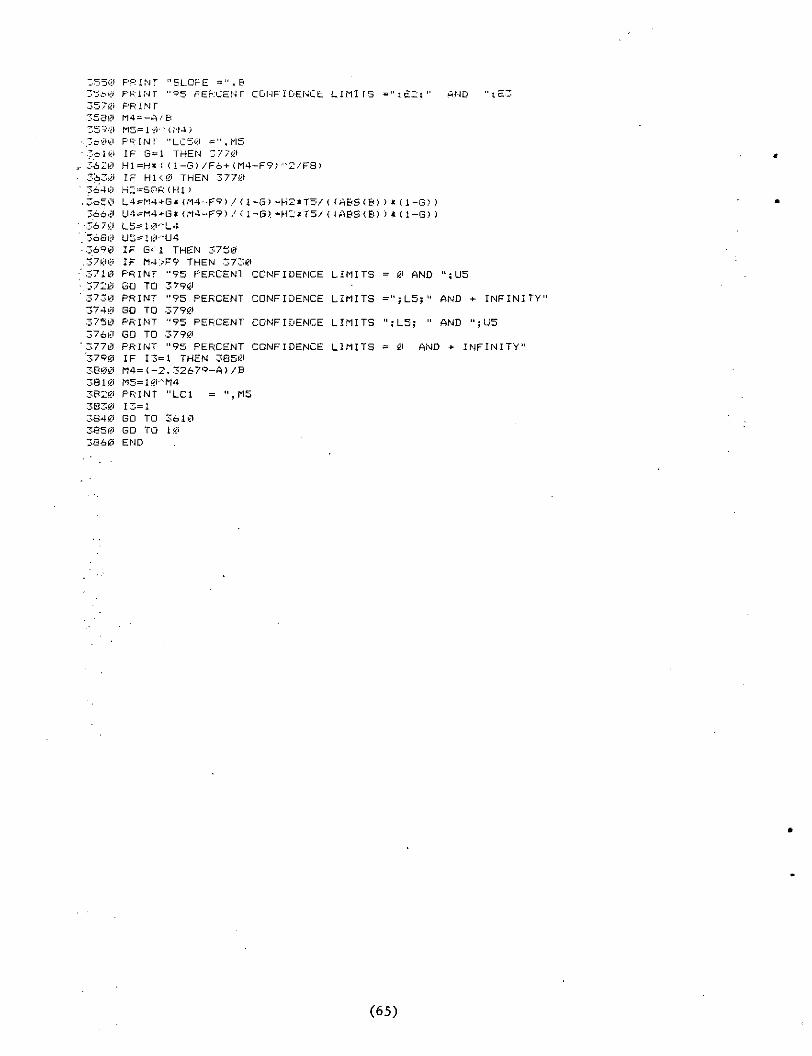
3550 PRINT "SLOPE = " , &3-56" PRINT "<?5 PERCENT CONFIDENCE LIMITS =";t2;" AMD " 5 E 3
3570 PRINT
.~o-;i<,-| PRINT "LC50 =" ,M5
3*10 IF 6=1 THEN 3770
3620 H1=H* ( ( l-G)/F6-MM4-F9>'-2/F8.i"63tii IF Hl<0 THEN 37703640 H2±=S?R(H1J
,3o50 L4=M4+G* <M4-F9>/U-G>-H2*T5/< < A & S ( & ) ) * ( J - G ) )
•"670 L5=10-"-L4
3690 IF G<1 THEN 3750.3700 IF H4>F9 THEN 37303710 PRINT "95 PERCENT CONFIDENCE LIMITS = 0 AND "; U5.3720 GO TO 37903730 PRINT "95 PERCENT CONFIDENCE LIMITS =";L5;" AND + INFINITY1
3740 SO TO 37903750 PRINT "95 PERCENT CONFIDENCE LIMITS ";L5; " AND ";U53760 GO TO 37903770 PRINT "95 PERCENT CONFIDENCE LIMITS = 0 AND -»• INFINITY"3790 IF 13=1 THEN 38503600 M4=(-2.32&79-A)/B
3820 PRINT "LCI = " ., M53B30 13=13S40 GO TO 36Itf3850 GO TO 103860 END
(65)

Appendix D
Laboratory Worksheet
(66)
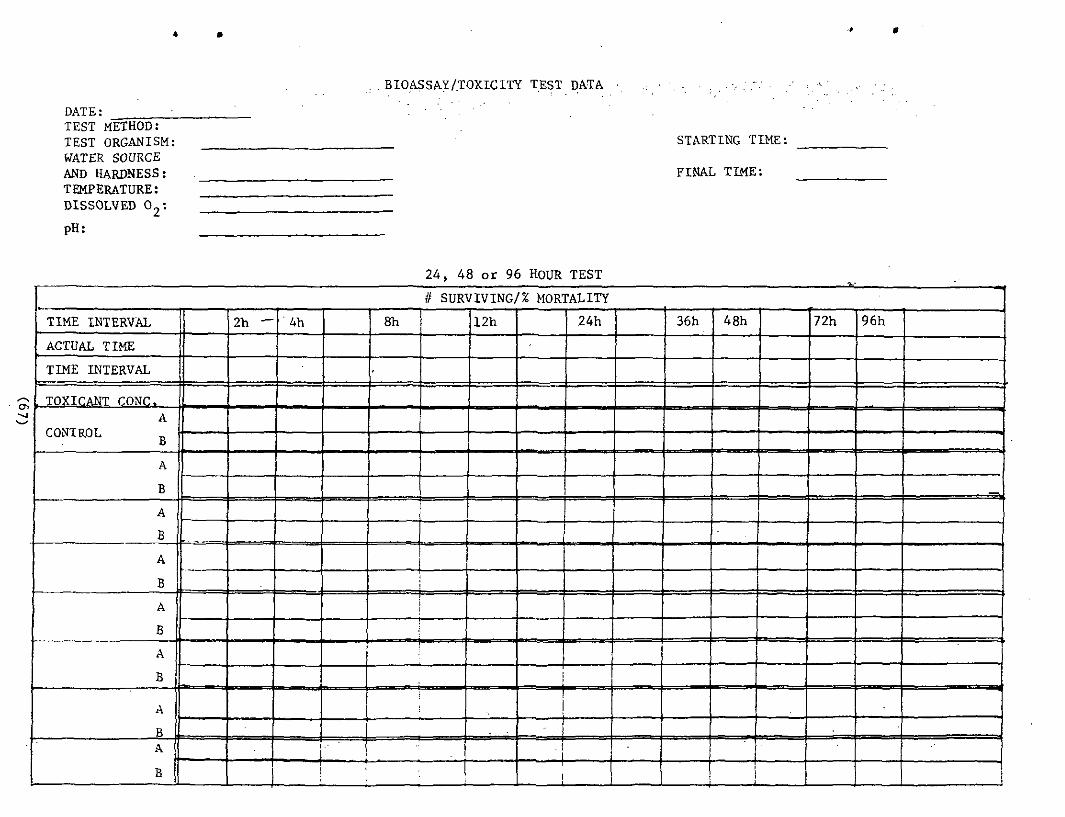
BIOASSAY/.TOXICITY TEST DATA
DATE: _TEST METHOD:TEST ORGANISM:WATER SOURCEAND HARDNESS:TEMPERATURE:DISSOLVED 02:
pH:
STARTING TIKE1
FINAL TIME:
24, 48 or 96 HOUR TEST
~̂\o-•̂ is— '
TIME INTERVAL
ACTUAL TIME
TIME INTERVAL
_ TOXICANT CONG.A
CONTROLa
A
B
A
B
A
B
A
B
A
B
A
B
A
B
# SURVIVING/% MORTALITY
2h — '4h
I
8h
•
_
i
.!
12h
. !
i— . i
24h 36h
1
48h
ii-A
72h 96h
—