Embed Size (px)
Citation preview
Acute Toxicity of Sodium Fluorescein to Ashy Pebblesnails Fluminicola fuscus
Kelly A. Stockton1
Christine M. Moffitt12 1Idaho Cooperative Fish and Wildlife Research Unit
2U.S. Geological Survey University of Idaho
Moscow, Idaho 83844-1141 USA
David L. Blew Idaho Power
1221 W Idaho Street Boise, Idaho 83702
and
C. Neal Farmer Idaho Department of Water Resources
322 Front Street Boise, Idaho 83720
Report Prepared for Hagerman National Fish Hatchery, USFWS
13 February 2011
Sodium fluorescein toxicity to snails 1
Abstract
Water resource agencies and groundwater scientists use fluorescein dyes to trace ground water
flows that supply surface waters that may contain threatened or endangered mollusk species.
Since little is known of the toxicity of sodium fluorescein to mollusks, we tested the toxicity of
sodium fluorescein to the ashy pebblesnail Fluminicola fuscus. The pebblesnail was selected as
a surrogate test species for the threatened Bliss Rapid snail Taylorcocha serpenticola that is
endemic to the Snake River and its tributaries in the Hagerman Valley, Idaho. In laboratory
tests, we expose replicated groups of snails to a series of concentrations of fluorescein in a static
24 h exposure at 15°C. Following the exposure, we removed snails, rinsed them, and allowed a
48 h recovery in clean water before recording mortality. We estimated 377 mg/L as the median
lethal dose. Mortality to snails occurred at concentrations well above those expected in test wells
during the monitoring efforts.
Introduction
Groundwater tracing especially through aquifers is very difficult to conduct without a dye
tracer. Many dyes can be used to trace the flow of groundwater from areas of recharge to areas
of discharge. Dye tracer tests can be used in a multitude of applications, such as: (1)
determination of flow paths and residence times; (2) measurement of aquifer properties; (3)
determination of site-specific hydrology; (4) determination of recharge areas for wellhead and
springhead protections; and (5) planning for response to spills of hazardous materials (Field et al.
1995). A known amount of dye is added to the water source and detection stations are
Sodium fluorescein toxicity to snails 2
established to monitor water discharge. Flow rates are measured by determining the
concentration of the dye as it flows past the detection station.
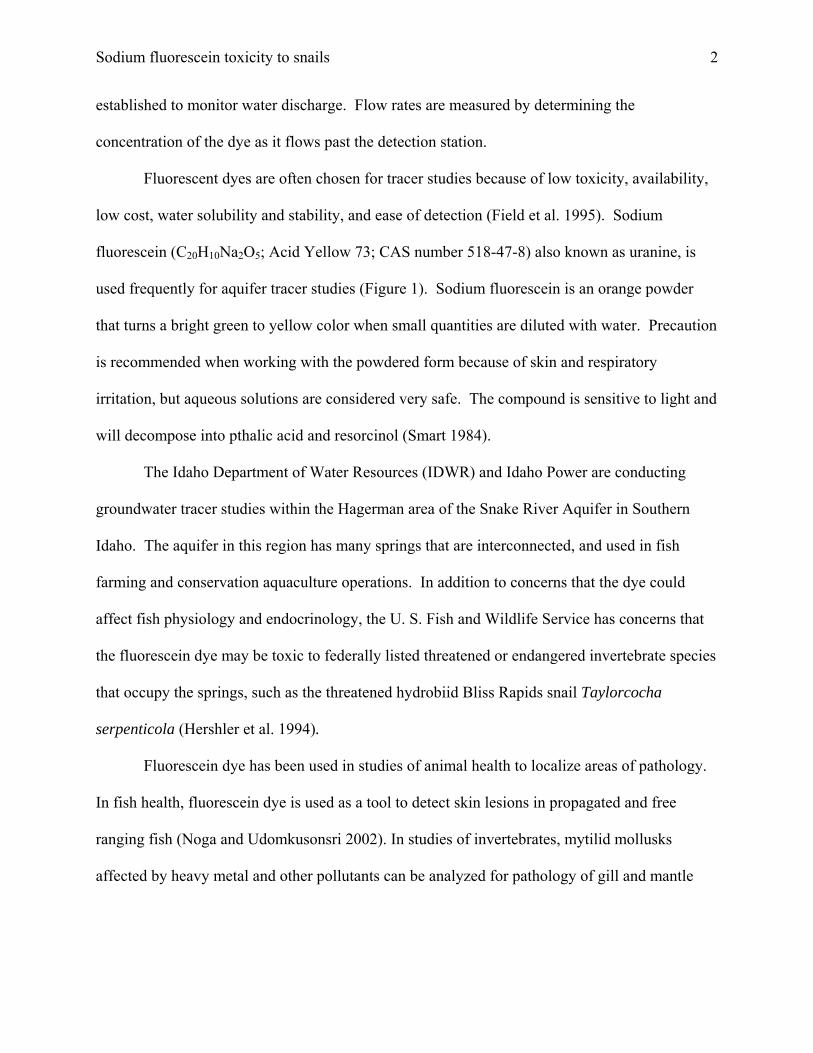
Fluorescent dyes are often chosen for tracer studies because of low toxicity, availability,
low cost, water solubility and stability, and ease of detection (Field et al. 1995). Sodium
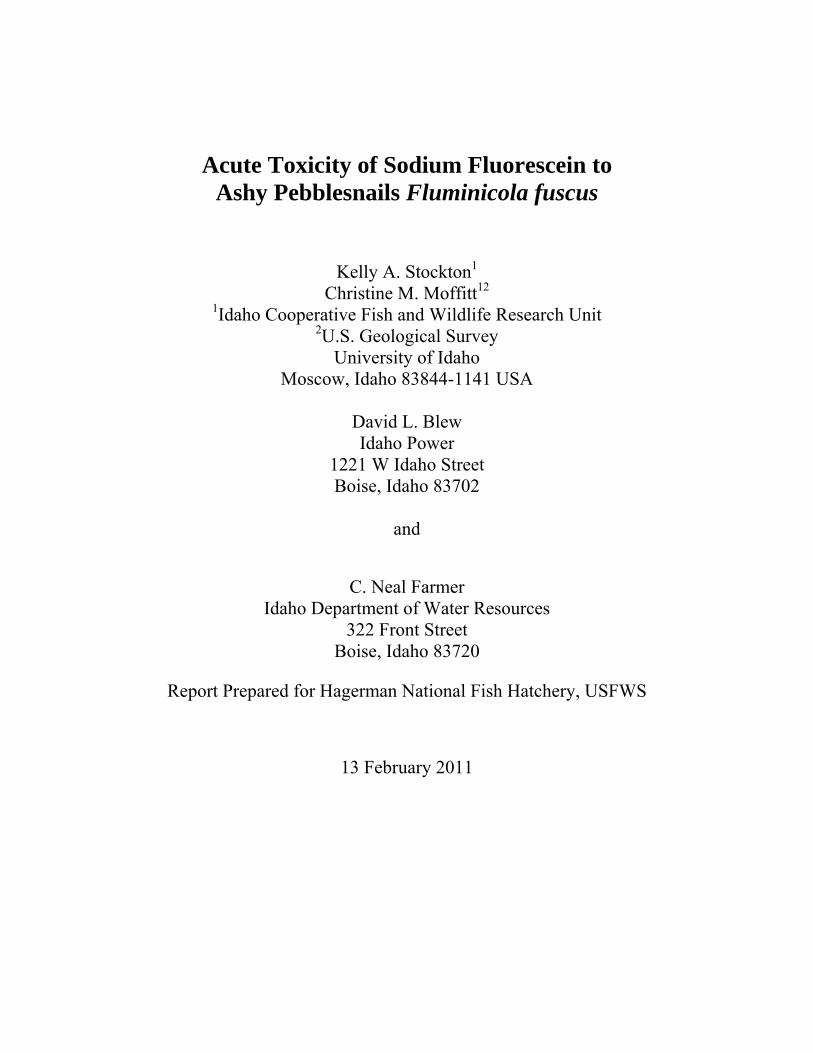
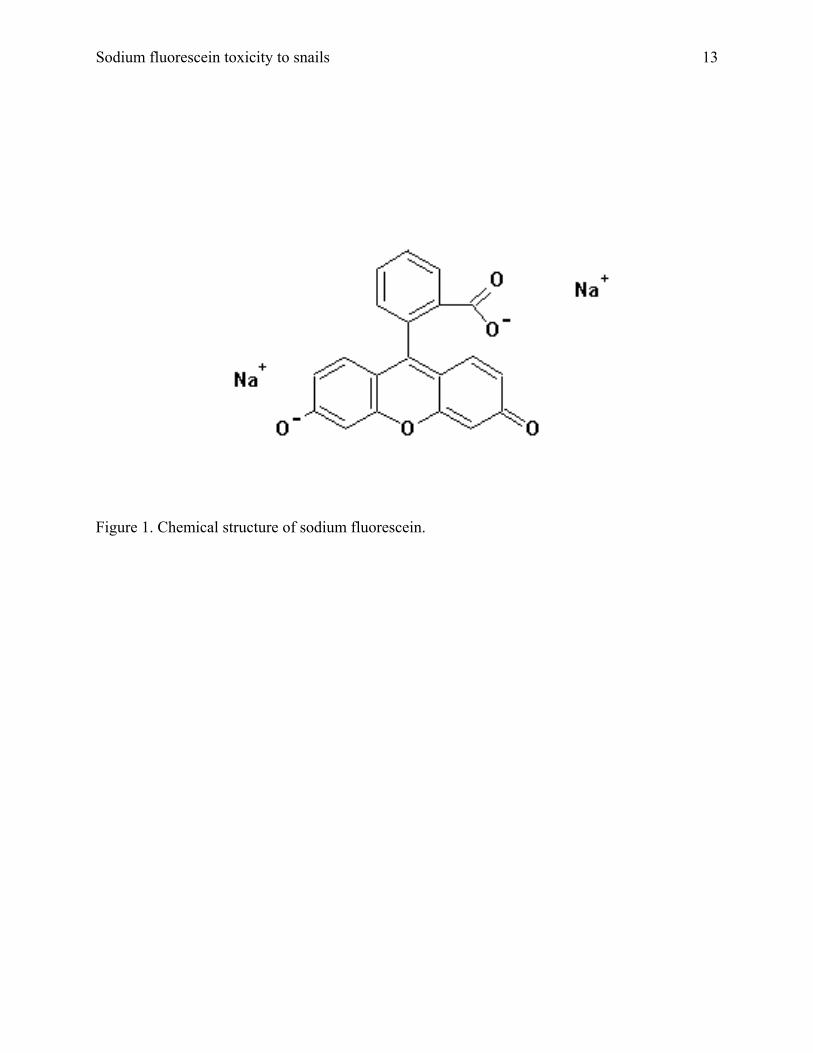
fluorescein (C20H10Na2O5; Acid Yellow 73; CAS number 518-47-8) also known as uranine, is
used frequently for aquifer tracer studies (Figure 1). Sodium fluorescein is an orange powder
that turns a bright green to yellow color when small quantities are diluted with water. Precaution
is recommended when working with the powdered form because of skin and respiratory
irritation, but aqueous solutions are considered very safe. The compound is sensitive to light and
will decompose into pthalic acid and resorcinol (Smart 1984).
The Idaho Department of Water Resources (IDWR) and Idaho Power are conducting
groundwater tracer studies within the Hagerman area of the Snake River Aquifer in Southern
Idaho. The aquifer in this region has many springs that are interconnected, and used in fish
farming and conservation aquaculture operations. In addition to concerns that the dye could
affect fish physiology and endocrinology, the U. S. Fish and Wildlife Service has concerns that
the fluorescein dye may be toxic to federally listed threatened or endangered invertebrate species
that occupy the springs, such as the threatened hydrobiid Bliss Rapids snail Taylorcocha
serpenticola (Hershler et al. 1994).
Fluorescein dye has been used in studies of animal health to localize areas of pathology.
In fish health, fluorescein dye is used as a tool to detect skin lesions in propagated and free
ranging fish (Noga and Udomkusonsri 2002). In studies of invertebrates, mytilid mollusks
affected by heavy metal and other pollutants can be analyzed for pathology of gill and mantle
Sodium fluorescein toxicity to snails 3
regions through use of fluorescein markers (Fishelsona at al. 1999) that only penetrate cell
membranes that are damaged.
Few studies have been conducted to determine the toxicity of sodium fluorescein to
aquatic organisms. Marking (1969) reported sodium fluorescein was of low toxicity to fish
species and estimated LC50 following a 24 h exposure as 3,828 to 5,000 mg/L for rainbow trout
(Oncorhynchus mykiss), channel catfish (Ictalurus punctatus) and bluegill (Lepomis
macrochirus), respectively. Information on the toxicology to invertebrates is scarce. Walthall
and Stark (1999) conducted extensive experiments to determine the chronic and acute toxicity of
sodium fluorescein and phloxine B to Daphnia pulex. They reported the 48 h LC50 of
fluorescein was 337 mg/L. Smart (1984) reviewed the published literature on the toxicity of 12
fluorescent dyes to selected species and reported a 48 h LC50 of 10 mg/L for sea urchins
(Hemicentrotus pulcher-rimus) and 1 mg/L for blue mussels (Mytilus edulis). Michelson (1964)
exposed Australorbis and Helisoma sp snails to sodium fluorescein for 5 consecutive days at
concentrations of 1, 10, and 100 mg/L, and reported mortality of 80 to 100% in concentrations of
10 and 100 mg/L.
The Bliss Rapids snail of the Snake River is considered threatened by the U.S. Fish and
Wildlife Service (U. S. Fish and Wildlife Service 1992). The snails are limited in their range to a
small section of the Snake River and its tributaries in southern Idaho. Snails are small (2.0 - 4.0
mm), light to orange colored, with 3.5 to 4.5 whorls and a blunt apex. They prefer habitat with
flowing water and stable cobble-boulder substratum or flowing springs. The snails do not
burrow, and avoid habitats with fine sediments. The Bliss Rapids snails are moderately
photophobic, residing on the lateral sides and undersides of rocks during daylight and they
migrate to the uppermost surfaces of rocks at night (U. S. Fish and Wildlife Service 2009). The
Sodium fluorescein toxicity to snails 4
snails are considered an annual species, are dioecious and can reproduce multiple times. Eggs
are laid singly in small capsules attached to rocks from December through March (U. S. Fish and
Wildlife Service 2009). After their initial listing in 1992, the status has been reviewed and
listing retained in 2004, 2008, and 2009 (U.S. Fish and Wildlife Service 2009).
A more common hydrobiid snail, the ashy pebblesnail, Fluminicola fuscus (Haldeman,
1847) occupies the same springs of concern, and was selected as a surrogate organism for
toxicity testing. The shell of the pebblesnail is tan, brown, or reddish, and the shape is
subglobular to trochoid, with the apex eroded. The ashy pebblesnails can grow much larger than
the Bliss Rapids snail, up to 11.2 mm with 4 - 4.5 whorls (Duncan 2008). Pebblesnails are
dioecious, live from 1 - 2 years, and eggs are laid from spring to autumn on plants and stones.
Most snails die following reproduction. Pebblesnails are considered a species of conservation
concern, but within the Hagerman Valley, they are rather widely distributed and occur at high
population densities.
The objectives of this study were to determine the toxicity of sodium fluorescein to the
ashy pebblesnail following a 24 h static exposure. With these data we simulated worst-case
scenarios to determine if use of a sodium fluorescein in aquifer trials could likely affect target
hydrobiid snails. The threatened status of the Bliss Rapids Snails makes direct testing of sodium
fluorescein toxicity difficult. The ashy pebblesnail was selected for testing because it inhabits
the same springs as the Bliss Rapids Snail and has a similar life history. Differences in size or
niche selection could result in differences in overall sodium fluorescein toxicity between the two
species. However, the ashy pebblesnail was the best-identified surrogate species for the Bliss
Rapids snail.
Sodium fluorescein toxicity to snails 5
Methods Experimental Animals –
Pebblesnails were collected from springs at Hagerman National Fish Hatchery (HNFH)
on 16 February and 22 March 2010, packaged at the hatchery in moist towels, placed into plastic
bags, and shipped in coolers to the University of Idaho College of Natural Resources Fisheries
wet laboratory in Moscow. Upon arrival, the snails were washed on a 2.0 mm sieve, and snails
between 2.0 and 4.0 mm were transferred into 2 L containers into dechlorinated, aged well-water
equilibrated to 15˚C. Snail containers were placed into an aquarium with a lid to provide
shading. The water in each container was changed every other day, and temperature in the test
room was maintained at 15°C throughout trials. A natural photoperiod for the latitude was
provided in the test room. Pebblesnails were retained in the lab no more than three weeks.
Test Substance and Test Concentrations
Sodium fluorescein for tests was provided by IDWR and shipped to the University of
Idaho on 5 February. All solutions of sodium fluorescein were prepared in the dark using
deionized water at 20°C. Sodium fluorescein powder was measured to the nearest mg, for a
stock solution, and volumetric pipettes and flasks were used to create test concentrations. Initial
tests were conducted as range finding with four concentrations: 0.2, 2.0, 20.0, and 200.0 mg/L.
A more extensive study was conducted using seven target concentrations to estimate an LC50.
These concentrations were: 0.2; 20.0; 50.0; 71.0; 100.0; 141.0; and 200.0 mg/L. All solutions
were equilibrated to 15˚C in the dark before testing. We report the concentrations of the test
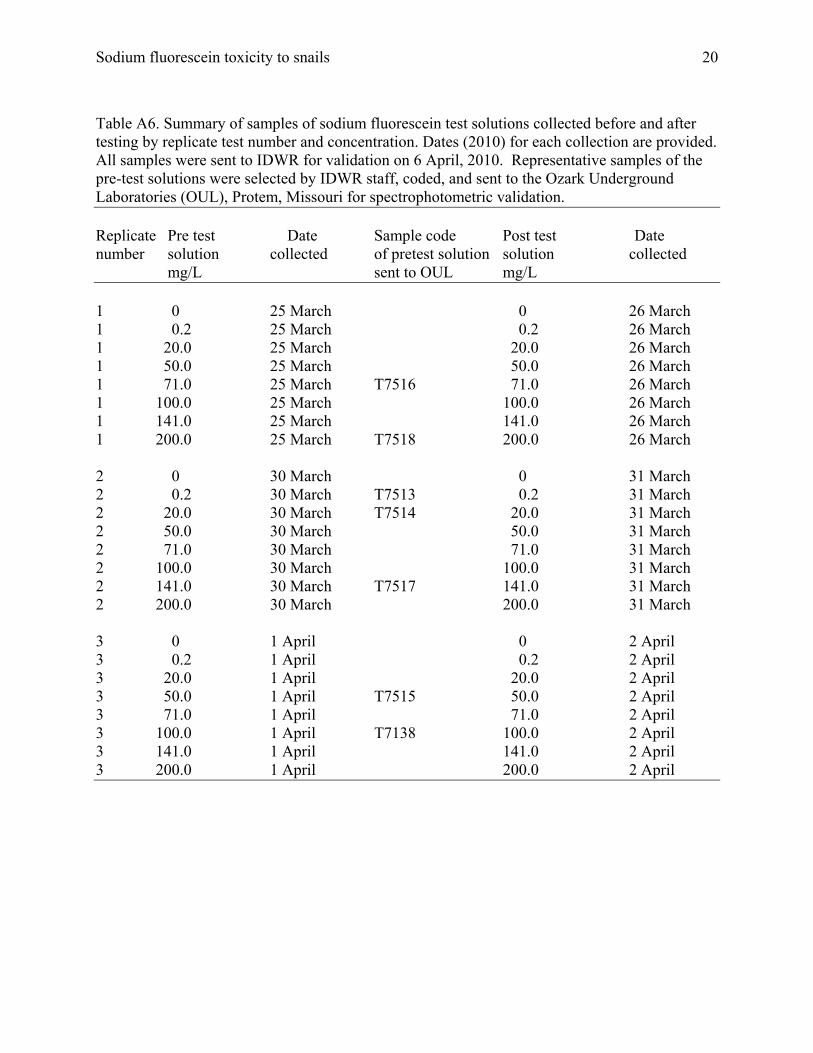
substance without adjusting for activity. Approximately 50 mL of each test solution was
collected before and after each exposure trial and refrigerated (4˚C). These archived samples
were shipped to IDWR for assurance verification, and some were tested by IDWR. However,
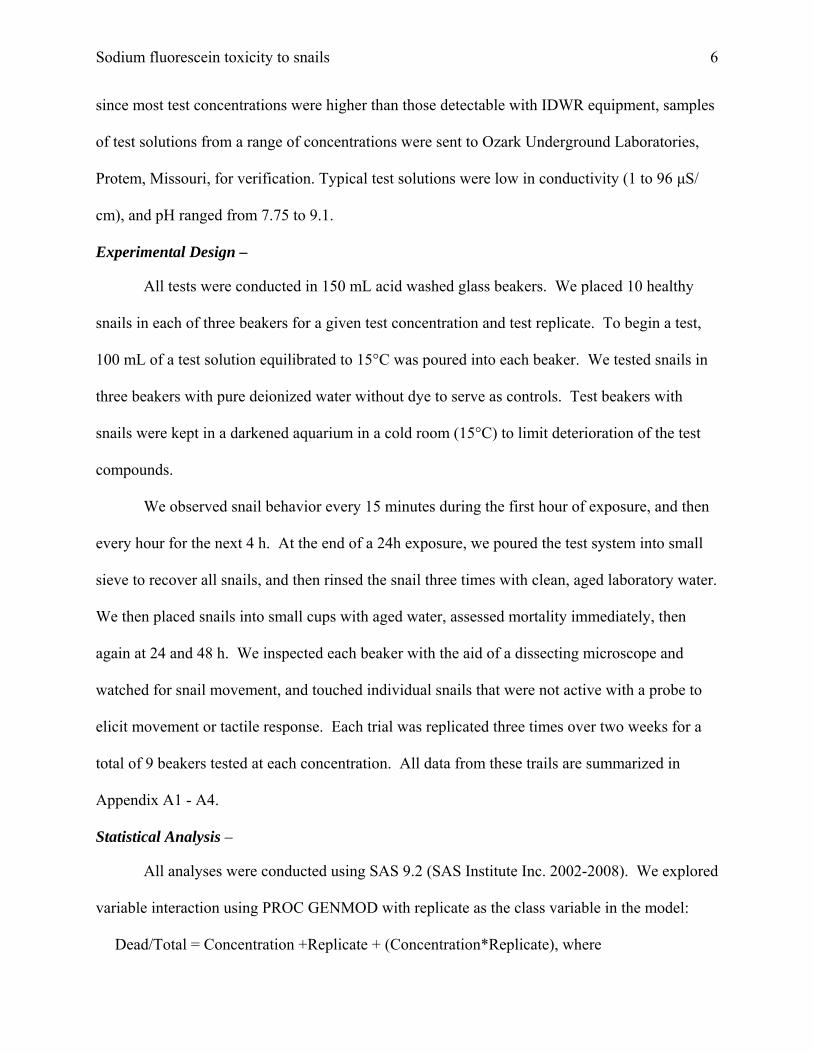
Sodium fluorescein toxicity to snails 6
since most test concentrations were higher than those detectable with IDWR equipment, samples
of test solutions from a range of concentrations were sent to Ozark Underground Laboratories,
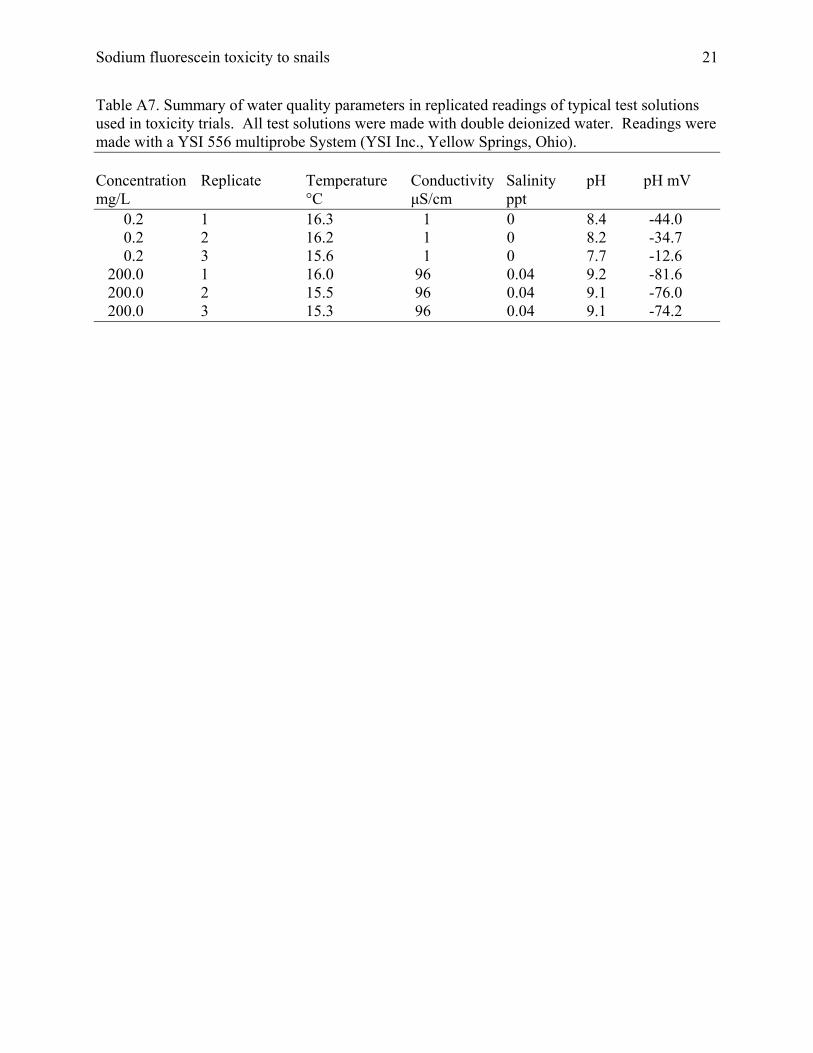
Protem, Missouri, for verification. Typical test solutions were low in conductivity (1 to 96 μS/
cm), and pH ranged from 7.75 to 9.1.
Experimental Design –
All tests were conducted in 150 mL acid washed glass beakers. We placed 10 healthy
snails in each of three beakers for a given test concentration and test replicate. To begin a test,
100 mL of a test solution equilibrated to 15°C was poured into each beaker. We tested snails in
three beakers with pure deionized water without dye to serve as controls. Test beakers with
snails were kept in a darkened aquarium in a cold room (15°C) to limit deterioration of the test
compounds.
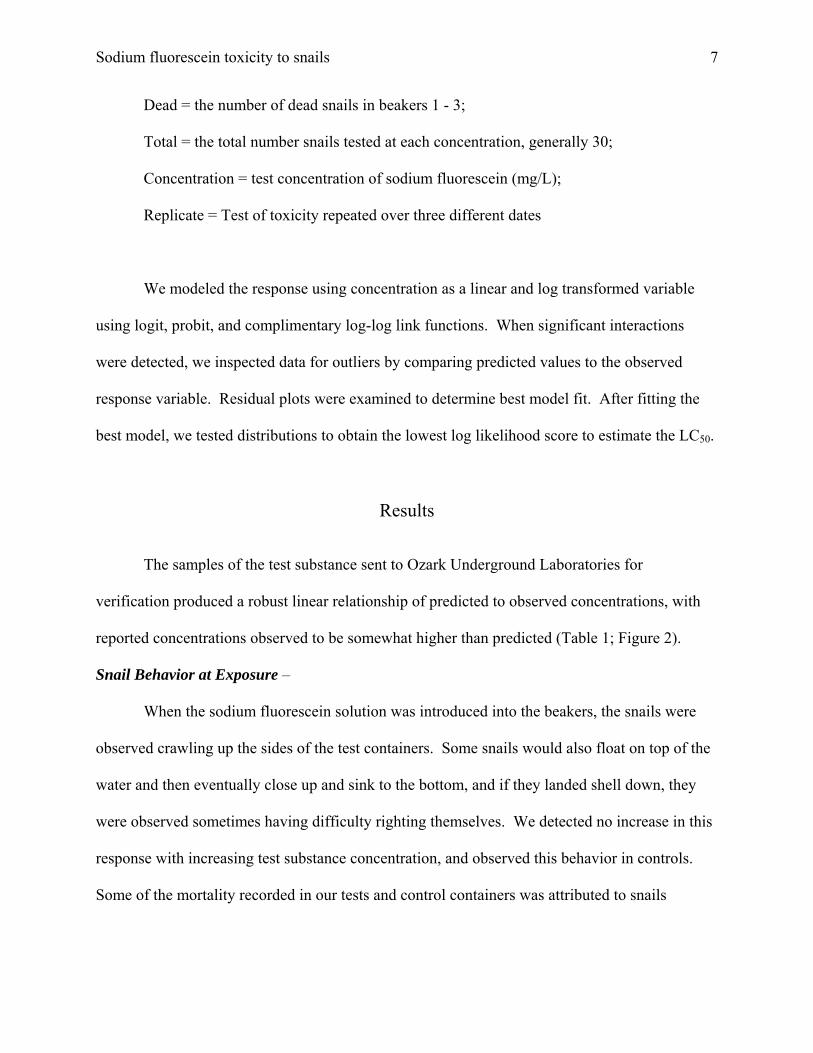
We observed snail behavior every 15 minutes during the first hour of exposure, and then
every hour for the next 4 h. At the end of a 24h exposure, we poured the test system into small
sieve to recover all snails, and then rinsed the snail three times with clean, aged laboratory water.
We then placed snails into small cups with aged water, assessed mortality immediately, then
again at 24 and 48 h. We inspected each beaker with the aid of a dissecting microscope and
watched for snail movement, and touched individual snails that were not active with a probe to
elicit movement or tactile response. Each trial was replicated three times over two weeks for a
total of 9 beakers tested at each concentration. All data from these trails are summarized in
Appendix A1 - A4.
Statistical Analysis –
All analyses were conducted using SAS 9.2 (SAS Institute Inc. 2002-2008). We explored
variable interaction using PROC GENMOD with replicate as the class variable in the model:
Dead/Total = Concentration +Replicate + (Concentration*Replicate), where
Sodium fluorescein toxicity to snails 7
Dead = the number of dead snails in beakers 1 - 3;
Total = the total number snails tested at each concentration, generally 30;
Concentration = test concentration of sodium fluorescein (mg/L);
Replicate = Test of toxicity repeated over three different dates
We modeled the response using concentration as a linear and log transformed variable
using logit, probit, and complimentary log-log link functions. When significant interactions
were detected, we inspected data for outliers by comparing predicted values to the observed
response variable. Residual plots were examined to determine best model fit. After fitting the
best model, we tested distributions to obtain the lowest log likelihood score to estimate the LC50.
Results
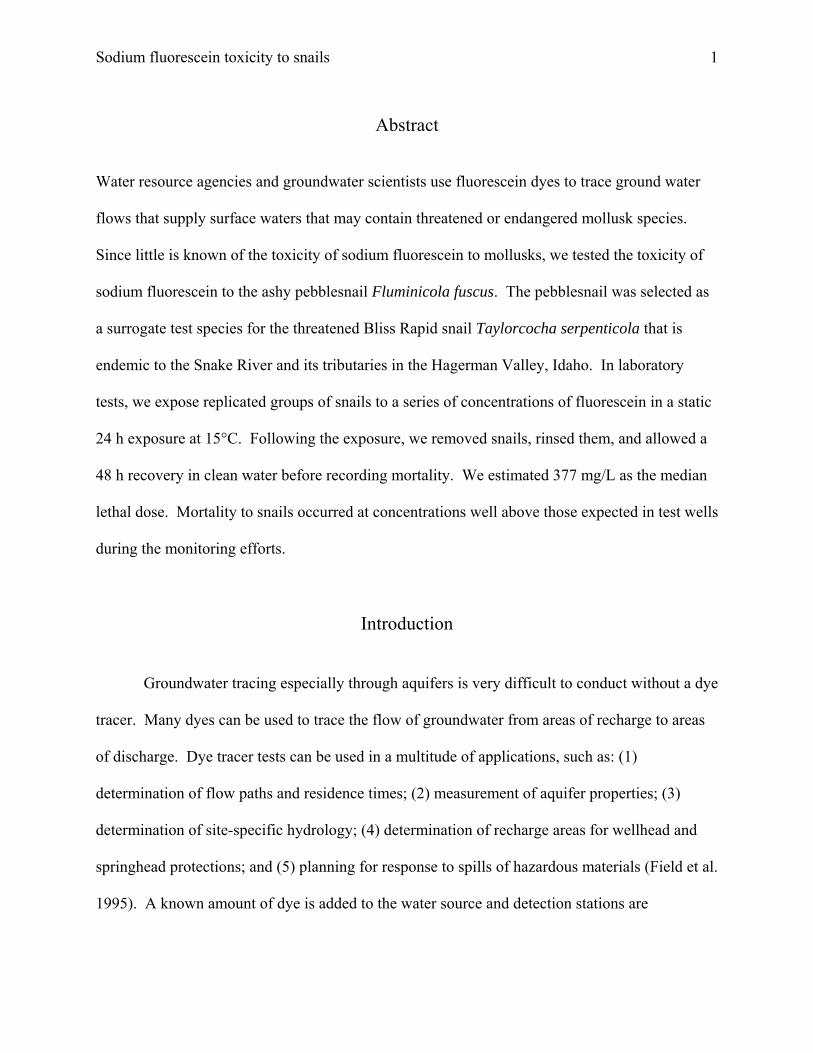
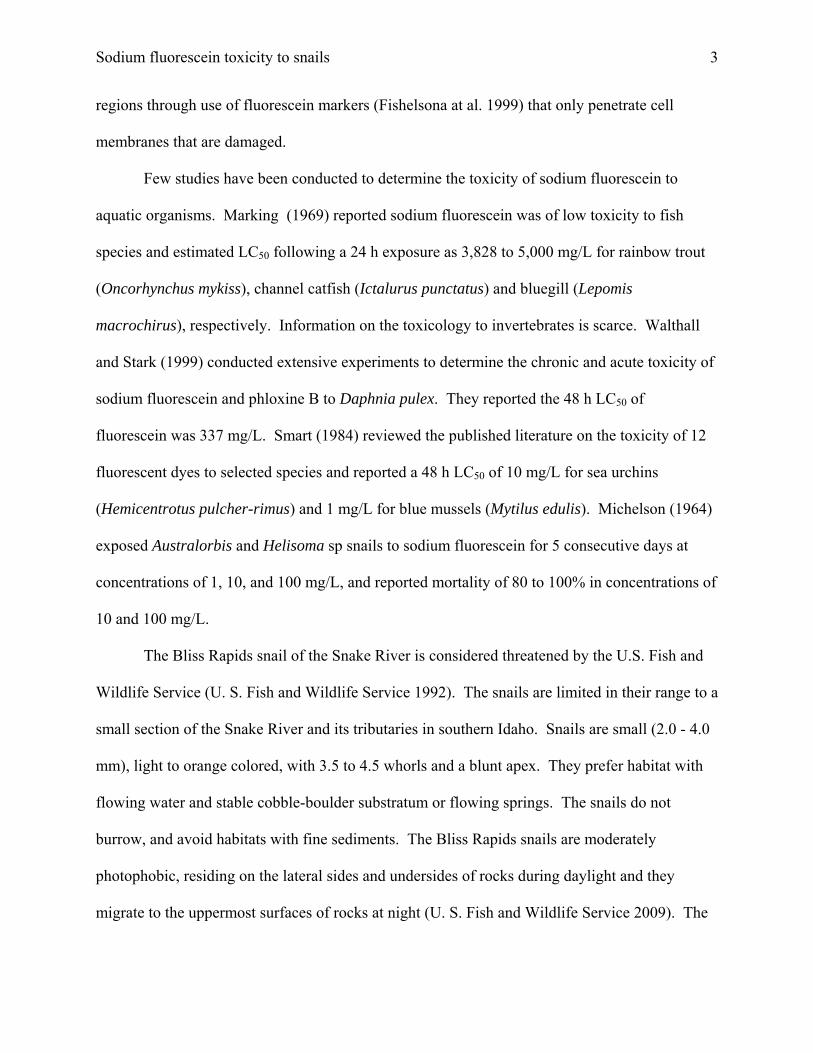
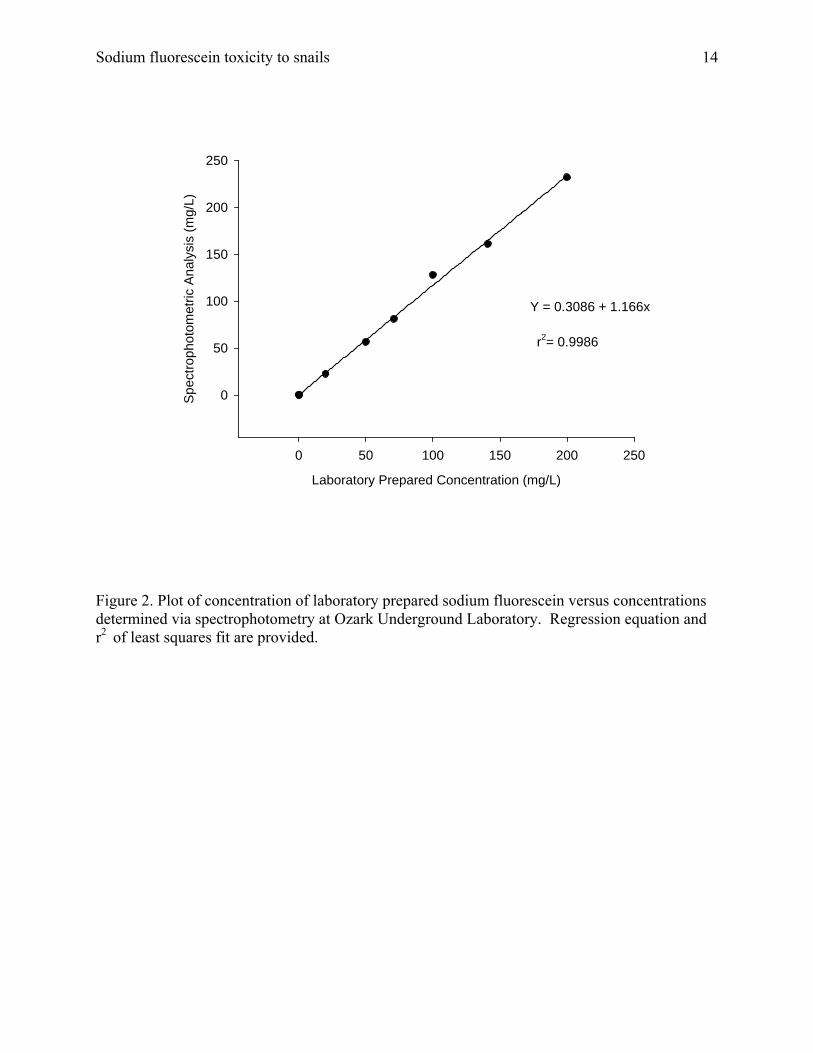
The samples of the test substance sent to Ozark Underground Laboratories for
verification produced a robust linear relationship of predicted to observed concentrations, with
reported concentrations observed to be somewhat higher than predicted (Table 1; Figure 2).
Snail Behavior at Exposure –
When the sodium fluorescein solution was introduced into the beakers, the snails were
observed crawling up the sides of the test containers. Some snails would also float on top of the
water and then eventually close up and sink to the bottom, and if they landed shell down, they
were observed sometimes having difficulty righting themselves. We detected no increase in this
response with increasing test substance concentration, and observed this behavior in controls.
Some of the mortality recorded in our tests and control containers was attributed to snails
Sodium fluorescein toxicity to snails 8
crawling above the water level and drying out. After 48 h of recovery, dried dead snails could
not be separated from snails that died in the test solution and all were recorded as mortality.
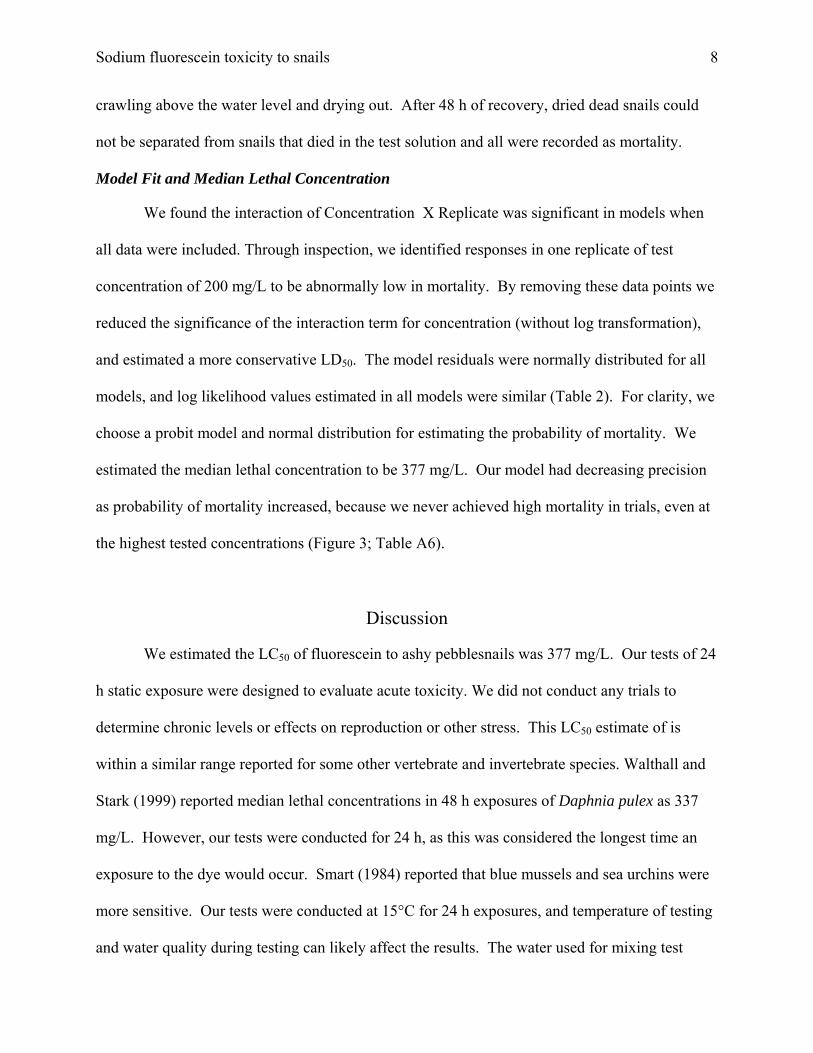
Model Fit and Median Lethal Concentration
We found the interaction of Concentration X Replicate was significant in models when
all data were included. Through inspection, we identified responses in one replicate of test
concentration of 200 mg/L to be abnormally low in mortality. By removing these data points we
reduced the significance of the interaction term for concentration (without log transformation),
and estimated a more conservative LD50. The model residuals were normally distributed for all
models, and log likelihood values estimated in all models were similar (Table 2). For clarity, we
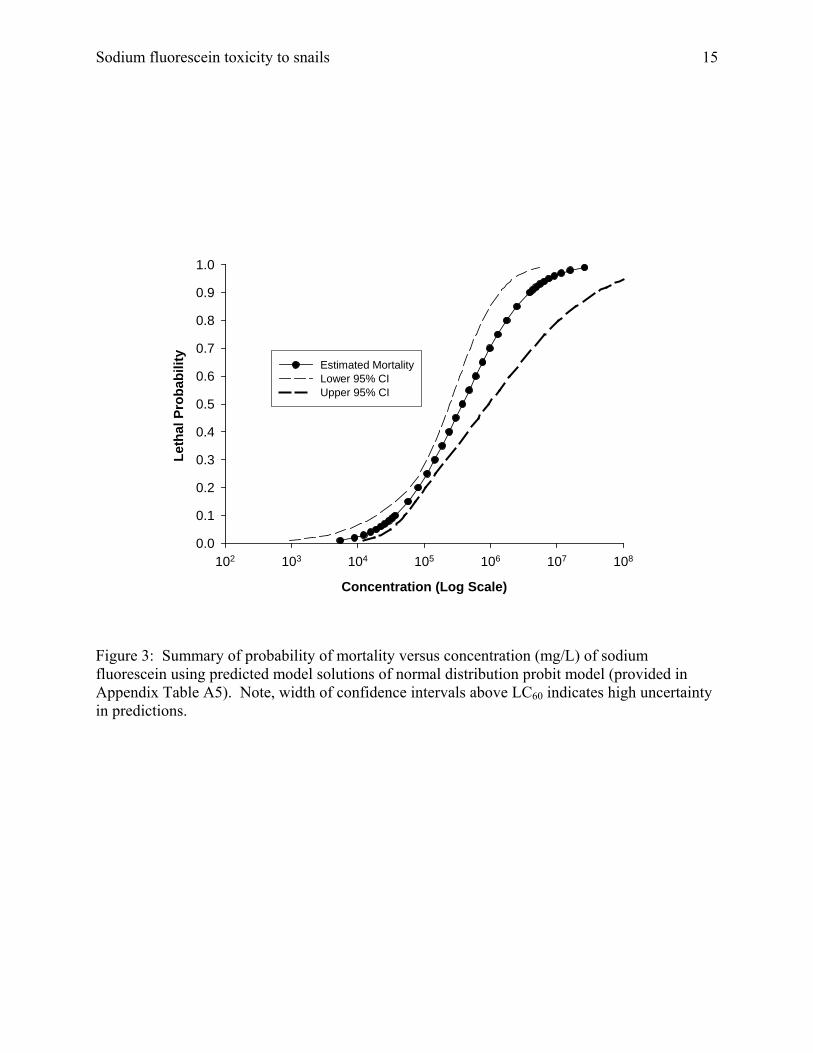
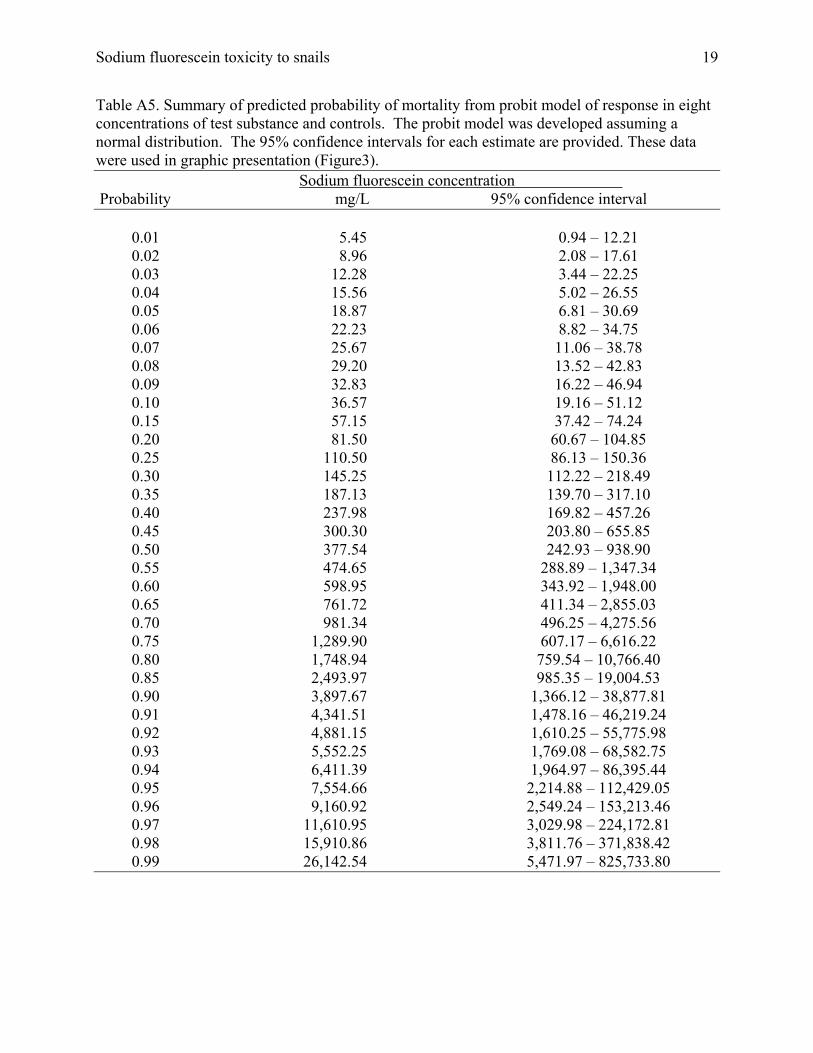
choose a probit model and normal distribution for estimating the probability of mortality. We
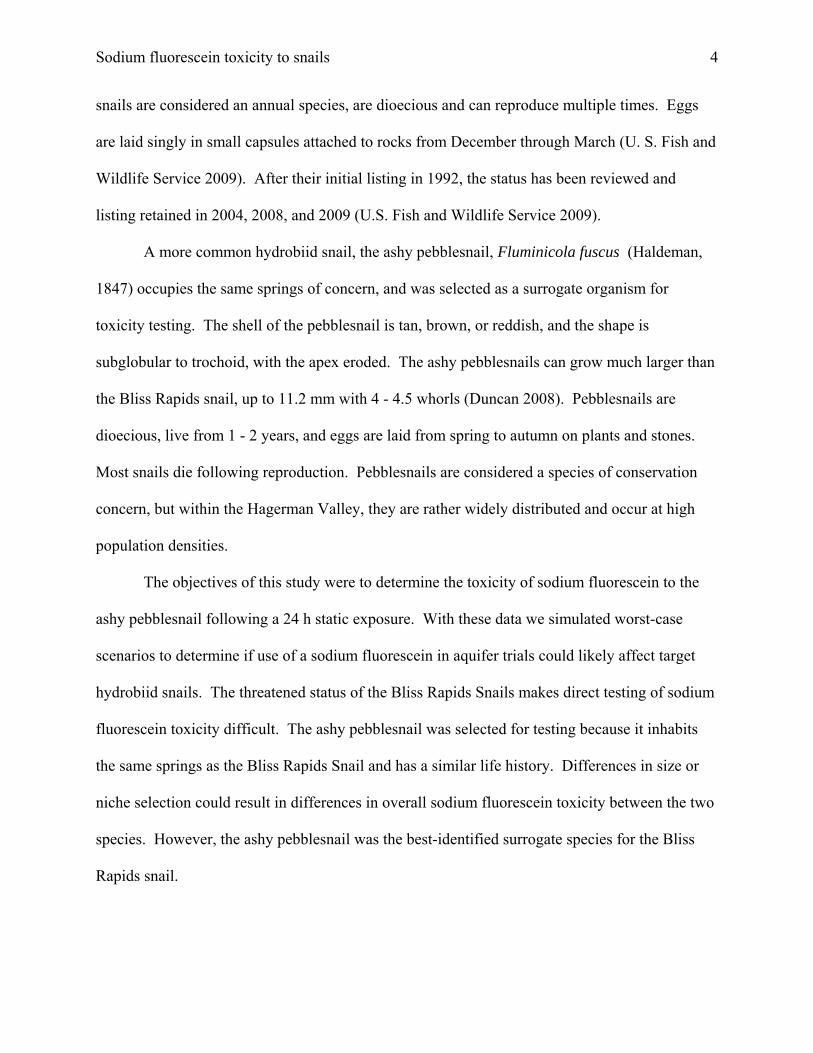
estimated the median lethal concentration to be 377 mg/L. Our model had decreasing precision
as probability of mortality increased, because we never achieved high mortality in trials, even at
the highest tested concentrations (Figure 3; Table A6).
Discussion
We estimated the LC50 of fluorescein to ashy pebblesnails was 377 mg/L. Our tests of 24
h static exposure were designed to evaluate acute toxicity. We did not conduct any trials to
determine chronic levels or effects on reproduction or other stress. This LC50 estimate of is
within a similar range reported for some other vertebrate and invertebrate species. Walthall and
Stark (1999) reported median lethal concentrations in 48 h exposures of Daphnia pulex as 337
mg/L. However, our tests were conducted for 24 h, as this was considered the longest time an
exposure to the dye would occur. Smart (1984) reported that blue mussels and sea urchins were
more sensitive. Our tests were conducted at 15°C for 24 h exposures, and temperature of testing
and water quality during testing can likely affect the results. The water used for mixing test
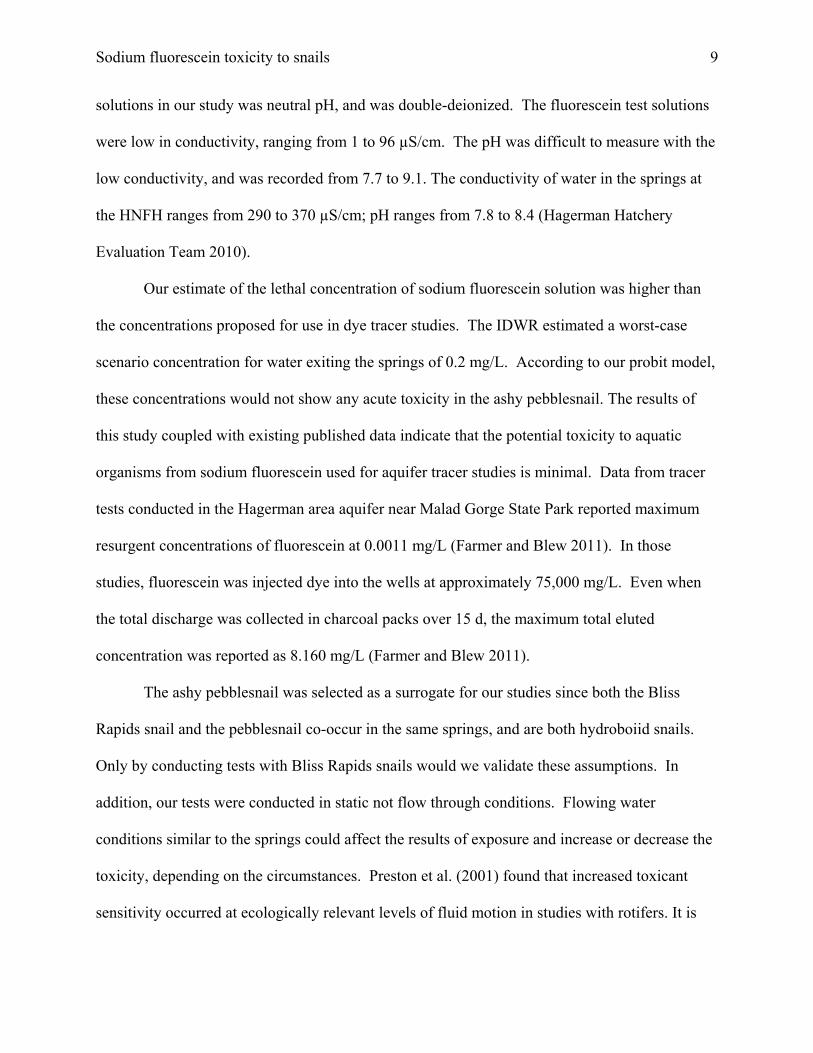
Sodium fluorescein toxicity to snails 9
solutions in our study was neutral pH, and was double-deionized. The fluorescein test solutions
were low in conductivity, ranging from 1 to 96 µS/cm. The pH was difficult to measure with the
low conductivity, and was recorded from 7.7 to 9.1. The conductivity of water in the springs at
the HNFH ranges from 290 to 370 µS/cm; pH ranges from 7.8 to 8.4 (Hagerman Hatchery
Evaluation Team 2010).
Our estimate of the lethal concentration of sodium fluorescein solution was higher than
the concentrations proposed for use in dye tracer studies. The IDWR estimated a worst-case
scenario concentration for water exiting the springs of 0.2 mg/L. According to our probit model,
these concentrations would not show any acute toxicity in the ashy pebblesnail. The results of
this study coupled with existing published data indicate that the potential toxicity to aquatic
organisms from sodium fluorescein used for aquifer tracer studies is minimal. Data from tracer
tests conducted in the Hagerman area aquifer near Malad Gorge State Park reported maximum
resurgent concentrations of fluorescein at 0.0011 mg/L (Farmer and Blew 2011). In those
studies, fluorescein was injected dye into the wells at approximately 75,000 mg/L. Even when
the total discharge was collected in charcoal packs over 15 d, the maximum total eluted
concentration was reported as 8.160 mg/L (Farmer and Blew 2011).
The ashy pebblesnail was selected as a surrogate for our studies since both the Bliss
Rapids snail and the pebblesnail co-occur in the same springs, and are both hydroboiid snails.
Only by conducting tests with Bliss Rapids snails would we validate these assumptions. In
addition, our tests were conducted in static not flow through conditions. Flowing water
conditions similar to the springs could affect the results of exposure and increase or decrease the
toxicity, depending on the circumstances. Preston et al. (2001) found that increased toxicant
sensitivity occurred at ecologically relevant levels of fluid motion in studies with rotifers. It is
Sodium fluorescein toxicity to snails 10
possible that fluid motion-toxicant interactions can affect toxicant uptake, and alter the
bioavailability of food resources. The snails have much different microhabitat requirements,
and we can only speculate that flow through conditions in the natural setting could likely alter
the outcome.
Acknowledgements
We thank B. Sun, and J. Hadzor at the University of Idaho for assistance with laboratory
testing and preparation. C. J. Williams provided assistance with statistical testing and
interpretation. Staff at Hagerman National Fish Hatchery provided snails for testing. Fluorescein
test materials were provide by Idaho Department of Water Resources. We are grateful to D.
Hopper for comments on the manuscript draft.
References Duncan, N., and R. Huff 2009. Fluminicola fuscus species fact sheet. Interagency Special
Status/Sensitive Species Program. U.S. Department of Interior, Bureau of Land Management, Oregon/Washington and U.S. Department of Agriculture, Forest Service, Region 6. 3 pp. http://www.fs.fed.us/r6/sfpnw/issssp/planning-documents/species-guides.shtml. Accessed October 2010.
Farmer, N., and C. D. Farmer. 2011. Fluorescent dye traces tests and hydrogeology near the
Malad Gorge State Park (Hopper well test). Idaho Department of Water Resources Open File Report. January 28, 2011.
Field, M.S., R.G. Wilhelm, J.F. Quinlan, and T.J. Aley. 1995. An assessment of the potential
adverse properties of fluorescent tracer dyes used for groundwater tracing. Environmental Monitoring and Assessment 38:75-96.
Fishelson L., V. Bresler, R. Manelisa, Z. Zuk-Rimonb, A. Dotanb, H. Hornungc, A. Yawetz.
1999. Toxicological aspects associated with the ecology of Donax trunculus (Bivalvia, Mollusca) in a polluted environment. The Science of the Total Environment 226:121-131.
Frest, T. J., and E. J. Johannes. 2000. An annotated checklist of Idaho land and freshwater
mollusks. Journal of the Idaho Academy of Science, December 2000
Sodium fluorescein toxicity to snails 11
Hagerman Hatchery Evaluation Team. 2010. Water quality monitoring of springs used for fish
production at the Hagerman National Fish Hatchery; relating nitrate levels to specific conductance. Lower Snake River Compensation Plan Report. U.S. Fish and Wildlife Service. Boise, Idaho.
Hershler, R., T. J. Frest, E. J. Johannes, P. A.Bowler and F. G. Thompson. 1994. Two new
genera of Hydrobiid snails (Prosobranchia: Rissooidea) from the northwestern United States. Veliger 37: 221 -243.
Marking, L. L. 1969. Toxicity of Rhodamine B and fluorescein sodium to fish and their
compatibility with Antimycin A. Progressive Fish Culturist 139-142. Michelson, E.H. 1964. Shell fluorescence in Australorbis glabratus and other aquatic snails
exposed to tetracyclines. Journal of Parasitology 50:743-747. Noga, E. J. and P. Udomkusonsri. 2002. Fluorescein: A rapid, sensitive, nonlethal method for
detecting skin ulceration in fish. Veterinary Pathology 39:726–731. Preston B. L., T. W. Snell, D. M. Fields,, and M. J. Weissburget. 2001. The effects of fluid
motion on toxicant sensitivity of the rotifer Brachionus calyciflorus Aquatic Toxicology 52:117–131.
SAS Institute Inc. 2002-2008. SAS/STAT Software Version 9.2. SAS Institute Inc. Cary, N.C. Smart, P.L. 1984. A review of the toxicity of twelve fluorescent dyes used for water tracing.
National Speleological Society Bulletin 4:21-33. U. S. Fish and Wildlife Service 1992. Endangered and threatened wildlife and plants;
determination of endangered or threatened status for five aquatic snails in south central Idaho. Federal Register 57(240): 59244-59257. 14 December.
U.S. Fish and Wildlife Service. 2009. Endangered and threatened wildlife and plants; 12-month
finding on a petition to remove the Bliss Rapids snail (Taylorconcha serpenticola) from the list of endangered and threatened wildlife. Federal Register 74 (178):47536–47545, 16 September.
Walthall, W.K. and J.D. Stark. 1999. The acute and chronic toxicity of two xanthene dyes,
fluorescein sodium salt and phloxine B, to Daphnia pulex. Environmental Pollution 104: 207-215.

Sodium fluorescein toxicity to snails 12
Table 1: Summary of results of sodium fluoroscein concentration validation at Ozark Underground Laboratory in 2010. Fluorescein concentration and peak absorptions are reported. Only samples taken before tests were conducted were analyzed. Test 7512 was a calibration test. Sample Concentration Date Fluoroscein ID mg/L collected Peak (mm) mg/L T7512 0.1 23 April 507.8 0.127 T7513 0.2 30 March 507.6 0.223 T7514 20.0 30 March 507.7 22.600 T7515 50.0 1 April 507.9 56.500 T7516 71.0 25 March 507.9 81.100 T7138 100.0 1 April 507.8 128.000 T7517 141.0 30 March 507.9 161.000 T7518 200.0 25 March 507.8 232.000 Table 2: Summary of log likelihood statistics for models tested for the full range study mortality. Test Log likelihood logit -254.37 probit -253.46 Complimentary log-log -254.77 probit-normal -249.52 probit-Gompertz -248.84
Sodium fluorescein toxicity to snails 13
Figure 1. Chemical structure of sodium fluorescein.
Sodium fluorescein toxicity to snails 14
Laboratory Prepared Concentration (mg/L)
0 50 100 150 200 250
Spe
ctro
phot
omet
ric A
naly
sis
(mg/
L)
0
50
100
150
200
250
Y = 0.3086 + 1.166x
r2= 0.9986
Figure 2. Plot of concentration of laboratory prepared sodium fluorescein versus concentrations determined via spectrophotometry at Ozark Underground Laboratory. Regression equation and r2 of least squares fit are provided.
Sodium fluorescein toxicity to snails 15
Concentration (Log Scale)
102 103 104 105 106 107 108
Leth
al P
roba
bilit
y
0.0
0.1
0.2
0.3
0.4
0.5
0.6
0.7
0.8
0.9
1.0
Estimated MortalityLower 95% CIUpper 95% CI
Figure 3: Summary of probability of mortality versus concentration (mg/L) of sodium fluorescein using predicted model solutions of normal distribution probit model (provided in Appendix Table A5). Note, width of confidence intervals above LC60 indicates high uncertainty in predictions.
Sodium fluorescein toxicity to snails 16
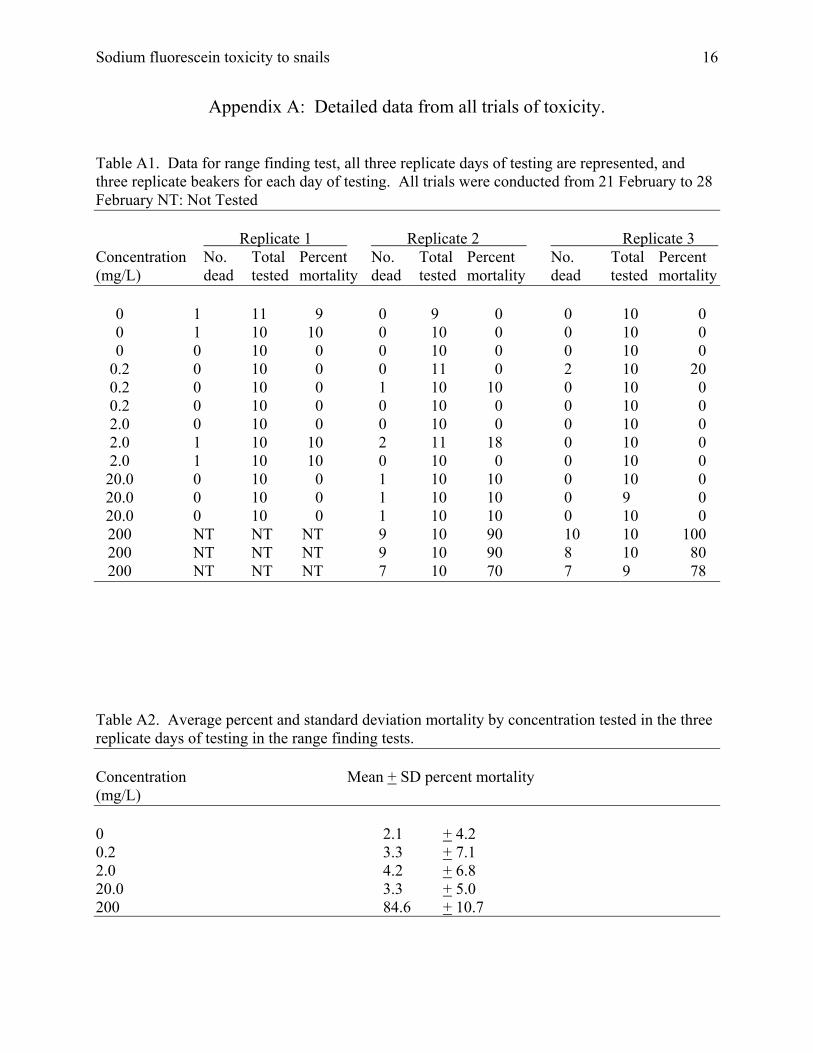
Appendix A: Detailed data from all trials of toxicity. Table A1. Data for range finding test, all three replicate days of testing are represented, and three replicate beakers for each day of testing. All trials were conducted from 21 February to 28 February NT: Not Tested Replicate 1 Replicate 2 Replicate 3 Concentration No. Total Percent No. Total Percent No. Total Percent (mg/L) dead tested mortality dead tested mortality dead tested mortality 0 1 11 9 0 9 0 0 10 0 0 1 10 10 0 10 0 0 10 0 0 0 10 0 0 10 0 0 10 0 0.2 0 10 0 0 11 0 2 10 20 0.2 0 10 0 1 10 10 0 10 0 0.2 0 10 0 0 10 0 0 10 0 2.0 0 10 0 0 10 0 0 10 0 2.0 1 10 10 2 11 18 0 10 0 2.0 1 10 10 0 10 0 0 10 0 20.0 0 10 0 1 10 10 0 10 0 20.0 0 10 0 1 10 10 0 9 0 20.0 0 10 0 1 10 10 0 10 0 200 NT NT NT 9 10 90 10 10 100 200 NT NT NT 9 10 90 8 10 80 200 NT NT NT 7 10 70 7 9 78 Table A2. Average percent and standard deviation mortality by concentration tested in the three replicate days of testing in the range finding tests. Concentration Mean + SD percent mortality (mg/L) 0 2.1 + 4.2 0.2 3.3 + 7.1 2.0 4.2 + 6.8 20.0 3.3 + 5.0 200 84.6 + 10.7
Sodium fluorescein toxicity to snails 17
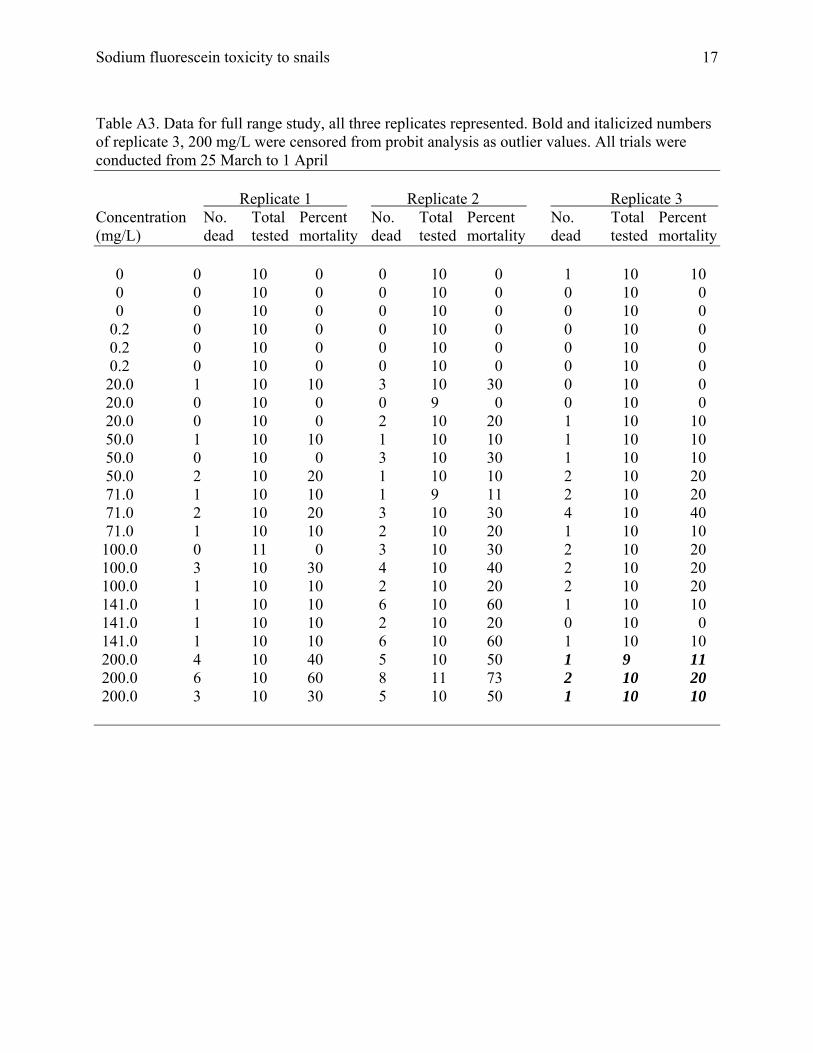
Table A3. Data for full range study, all three replicates represented. Bold and italicized numbers of replicate 3, 200 mg/L were censored from probit analysis as outlier values. All trials were conducted from 25 March to 1 April Replicate 1 Replicate 2 Replicate 3 Concentration No. Total Percent No. Total Percent No. Total Percent (mg/L) dead tested mortality dead tested mortality dead tested mortality 0 0 10 0 0 10 0 1 10 10 0 0 10 0 0 10 0 0 10 0 0 0 10 0 0 10 0 0 10 0 0.2 0 10 0 0 10 0 0 10 0 0.2 0 10 0 0 10 0 0 10 0 0.2 0 10 0 0 10 0 0 10 0 20.0 1 10 10 3 10 30 0 10 0 20.0 0 10 0 0 9 0 0 10 0 20.0 0 10 0 2 10 20 1 10 10 50.0 1 10 10 1 10 10 1 10 10 50.0 0 10 0 3 10 30 1 10 10 50.0 2 10 20 1 10 10 2 10 20 71.0 1 10 10 1 9 11 2 10 20 71.0 2 10 20 3 10 30 4 10 40 71.0 1 10 10 2 10 20 1 10 10 100.0 0 11 0 3 10 30 2 10 20 100.0 3 10 30 4 10 40 2 10 20 100.0 1 10 10 2 10 20 2 10 20 141.0 1 10 10 6 10 60 1 10 10 141.0 1 10 10 2 10 20 0 10 0 141.0 1 10 10 6 10 60 1 10 10 200.0 4 10 40 5 10 50 1 9 11 200.0 6 10 60 8 11 73 2 10 20 200.0 3 10 30 5 10 50 1 10 10
Sodium fluorescein toxicity to snails 18
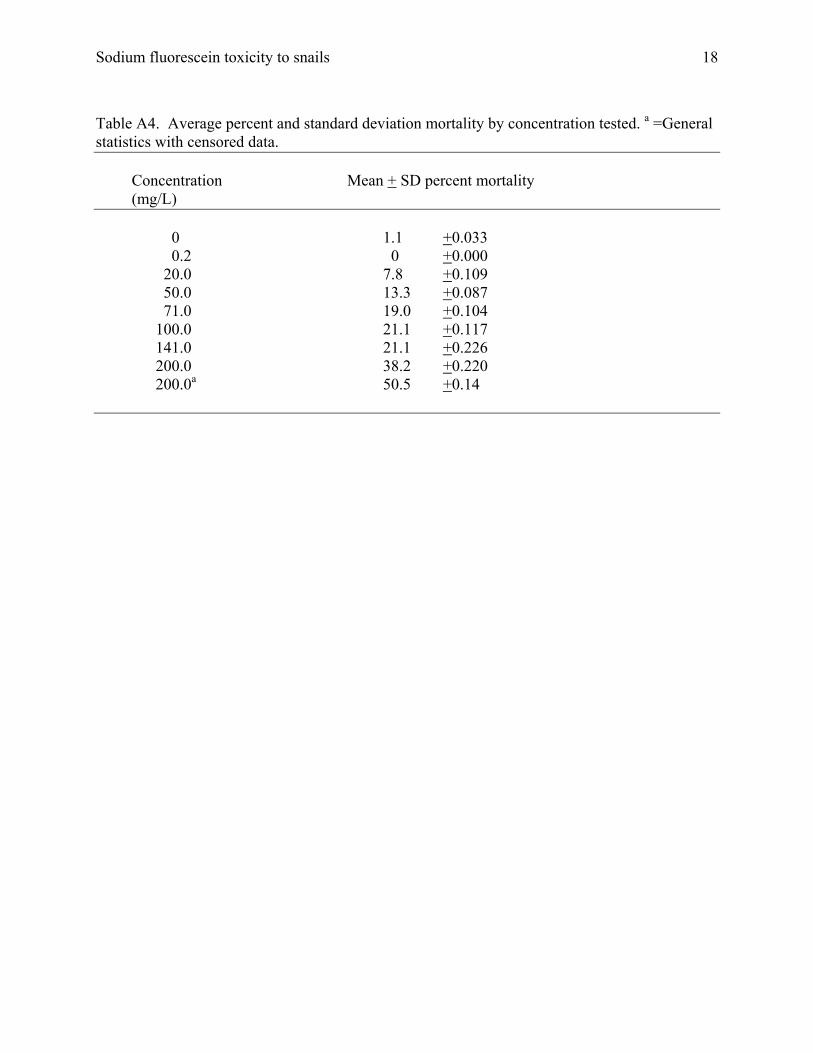
Table A4. Average percent and standard deviation mortality by concentration tested. a =General statistics with censored data. Concentration Mean + SD percent mortality (mg/L) 0 1.1 +0.033 0.2 0 +0.000 20.0 7.8 +0.109 50.0 13.3 +0.087 71.0 19.0 +0.104 100.0 21.1 +0.117 141.0 21.1 +0.226 200.0 38.2 +0.220 200.0a 50.5 +0.14
Sodium fluorescein toxicity to snails 19
Table A5. Summary of predicted probability of mortality from probit model of response in eight concentrations of test substance and controls. The probit model was developed assuming a normal distribution. The 95% confidence intervals for each estimate are provided. These data were used in graphic presentation (Figure3). Sodium fluorescein concentration Probability mg/L 95% confidence interval 0.01 5.45 0.94 – 12.21 0.02 8.96 2.08 – 17.61 0.03 12.28 3.44 – 22.25 0.04 15.56 5.02 – 26.55 0.05 18.87 6.81 – 30.69 0.06 22.23 8.82 – 34.75 0.07 25.67 11.06 – 38.78 0.08 29.20 13.52 – 42.83 0.09 32.83 16.22 – 46.94 0.10 36.57 19.16 – 51.12 0.15 57.15 37.42 – 74.24 0.20 81.50 60.67 – 104.85 0.25 110.50 86.13 – 150.36 0.30 145.25 112.22 – 218.49 0.35 187.13 139.70 – 317.10 0.40 237.98 169.82 – 457.26 0.45 300.30 203.80 – 655.85 0.50 377.54 242.93 – 938.90 0.55 474.65 288.89 – 1,347.34 0.60 598.95 343.92 – 1,948.00 0.65 761.72 411.34 – 2,855.03 0.70 981.34 496.25 – 4,275.56 0.75 1,289.90 607.17 – 6,616.22 0.80 1,748.94 759.54 – 10,766.40 0.85 2,493.97 985.35 – 19,004.53 0.90 3,897.67 1,366.12 – 38,877.81 0.91 4,341.51 1,478.16 – 46,219.24 0.92 4,881.15 1,610.25 – 55,775.98 0.93 5,552.25 1,769.08 – 68,582.75 0.94 6,411.39 1,964.97 – 86,395.44 0.95 7,554.66 2,214.88 – 112,429.05 0.96 9,160.92 2,549.24 – 153,213.46 0.97 11,610.95 3,029.98 – 224,172.81 0.98 15,910.86 3,811.76 – 371,838.42 0.99 26,142.54 5,471.97 – 825,733.80
Sodium fluorescein toxicity to snails 20
Table A6. Summary of samples of sodium fluorescein test solutions collected before and after testing by replicate test number and concentration. Dates (2010) for each collection are provided. All samples were sent to IDWR for validation on 6 April, 2010. Representative samples of the pre-test solutions were selected by IDWR staff, coded, and sent to the Ozark Underground Laboratories (OUL), Protem, Missouri for spectrophotometric validation. Replicate Pre test Date Sample code Post test Date number solution collected of pretest solution solution collected mg/L sent to OUL mg/L 1 0 25 March 0 26 March 1 0.2 25 March 0.2 26 March 1 20.0 25 March 20.0 26 March 1 50.0 25 March 50.0 26 March 1 71.0 25 March T7516 71.0 26 March 1 100.0 25 March 100.0 26 March 1 141.0 25 March 141.0 26 March 1 200.0 25 March T7518 200.0 26 March 2 0 30 March 0 31 March 2 0.2 30 March T7513 0.2 31 March 2 20.0 30 March T7514 20.0 31 March 2 50.0 30 March 50.0 31 March 2 71.0 30 March 71.0 31 March 2 100.0 30 March 100.0 31 March 2 141.0 30 March T7517 141.0 31 March 2 200.0 30 March 200.0 31 March 3 0 1 April 0 2 April 3 0.2 1 April 0.2 2 April 3 20.0 1 April 20.0 2 April 3 50.0 1 April T7515 50.0 2 April 3 71.0 1 April 71.0 2 April 3 100.0 1 April T7138 100.0 2 April 3 141.0 1 April 141.0 2 April 3 200.0 1 April 200.0 2 April
Sodium fluorescein toxicity to snails 21
Table A7. Summary of water quality parameters in replicated readings of typical test solutions used in toxicity trials. All test solutions were made with double deionized water. Readings were made with a YSI 556 multiprobe System (YSI Inc., Yellow Springs, Ohio). Concentration Replicate Temperature Conductivity Salinity pH pH mV mg/L °C μS/cm ppt 0.2 1 16.3 1 0 8.4 -44.0 0.2 2 16.2 1 0 8.2 -34.7 0.2 3 15.6 1 0 7.7 -12.6 200.0 1 16.0 96 0.04 9.2 -81.6 200.0 2 15.5 96 0.04 9.1 -76.0 200.0 3 15.3 96 0.04 9.1 -74.2