Embed Size (px)
Citation preview

Acuity Measurement at the Neonatal Intensive Care Unit
ACUITY MEASUREMENT AT THE NEONATAL INTENSIVE CARE UNIT
IE&M Graduation Thesis
Willem Hoek
S1014544 1-10-2015

Acuity Measurement at the Neonatal Intensive Care Unit
2
Acuity Measurement at the Neonatal Intensive Care Unit
3
Acuity Measurement at the Neonatal Intensive Care Unit
Department of Neonatology, UMC Utrecht
Master thesis Industrial Engineering & Management
Supervisors:
Prof.dr.ir. E.W. Hans
University of Twente
Centre for Healthcare Operations Improvement and Reseach
Dr.ir. J.M.J. Schutten
University of Twente
School of Management and Governance, Dept. IEBIS
Dr.W.B.De Vries
UMC Utrecht
Birth Center WKZ, Department of Neonatology
Author:
W. Hoek
University of Twente UMC Utrecht
School of Management and Governance Birth Center WKZ
Department of Neonatology
Acuity Measurement at the Neonatal Intensive Care Unit
Management Summary
Context
Due to an increase in neonatal intensive care demand every year many babies are denied an admission
place on the Neonatal Intensive Care Unit (NICU). At the Wilhelmina’s Child Hospital (WKZ), part of the
University Medical Center Utrecht, this has raised attention to research possible applications of healthcare
logistics to grant more babies the care they need.
At the NICU, premature born babies and babies in need of neonatal care are treated by highly specialized
neonatologists and nurses. The organization of this care is starting to gain importance because nowadays
babies born after 24 weeks of pregnancy can be admitted, and the length of stay reduces due to
improvements in healthcare technology. This leads to a more complex logistical process, which more and
more can benefit from operations research.
Problem Statement
The current decision-making process regarding patient logistics, such as admissions and transfers, is done
by medical experts and based on subjective information. When the NICU receives a request for admission,
the question “can we handle another patient?” is asked among nurses. When too many nurses say no, the
request is denied. This is based on the feeling of the nurses, which is hard to measure objectively. This
research introduces a way for the NICU to assess the current nurses’ workload more objectively in order to
make a better informed decision. Simply counting patients is an unreliable source, since the severity of the
patients is a large contributing factor.
Better informed decisions lead to fewer false decisions. There are two types of false decisions, which are
false admissions and false rejections. When a patient is admitted falsely, the nurses’ workload is too high,
leading to a lower quality of care and quality of work. When a patient is falsely rejected, the quality of care
for that single patient deteriorates unnecessarily and the WKZ misses the income.
Another benefit of measuring the nurses’ workload is that it enables quantitative analysis, benchmarking,
and optimization. This is a long-term benefit, of which this research the possible applications illustrates via
a simulation model to assess policy decisions regarding patient placement and admission levels. This
research introduces an own acuity measurement model, combining two existing models to fulfill the WKZ’s
requirements. Acuity is defined as “the categorization of patients according to an assessment of their
nursing care requirements” (Harper and McCulley, 2007).
The WKZ Neonatal Acuity Measurement Model
Our measurement model is based on the question “How many of these patients can I handle today at the
same time?” This results in a classification based on the nurse-to-patient ratio, varying from 1-on-1 to 1-on-
5. It is important to notice the word today in the question. Not only patient criteria are taken into account
when classifying. The five criteria to keep in mind when rating are the amount of medication, complicated
medical procedures, logistics, education, and psychosocial. Together, these factors contribute to the entire
perception of the nurses’ workload during a shift. We named our model NAPSS: the Neonatal Acuity-based
Patient Scoring System.
Empirical Test Results
We test the model on alignment, reliability, and validity. The test on alignment proves that the results from
the model actually align with the real performance of the department. We test alignment by calculating the
average length of stay as generated by a Markov chain analysis of the test results. This resulted in an average
Acuity Measurement at the Neonatal Intensive Care Unit
5
length of stay of 9.4 days, where the hospital estimates this to be 12.5. The discrepancy can is explained by
the test period and compensated.
The reliability of the model is measured by comparing the individual nurses’ ratings to each other, meaning
that the model is an objective measurement. The percentage of absolute agreement is sufficient to assume
the model to be reliable. The validity of the model is tested through correlating the perception of workload
by the nurses to the results of the model. This is correlated with a significance of <1%, meaning that the
model actually measures the nurses’ workload. These tests together confirm the model’s practical
applicability.
Simulation Experiment Results
After the practical applicability is confirmed, we test for the practical value and implications it can introduce.
This is done via a discrete event simulation model. The simulation study executes two experiments. The
first experiment is a comparison between the current situation, where the patients are admitted based on
the acuity levels, and a policy where only the number of free beds is taken into account. The goal of this
experiment is to underline the value of reliably basing the decision on acuity levels. Neglecting acuity leads
to a decline of refusals of 24%, raise the average amount of patients with 5,5%, but increase acuity
overloaded shifts for nurses over 40%.
The second experiment compares the basic policy, where patients are evenly distributed over the three
units of eight beds, to a policy where the units are filled optimally, leaving an as large as possible admission
space on the other units. This is called the best-fill policy. Using the best-fill policy leads to a decrease of
refusals of 25%, an increase of acuity overloaded shifts of 67%, and an increase in average amount of
patients of 5.5%.
Recommendations
The three main recommendations that follow from this research are:
Introduce the acuity measurement system. Using the measurement system introduces more
objectivity and reliability to base decisions on, as well as enables quantitative analysis,
optimization, and benchmarking.
Start benchmarking. This research identifies three performance indicators that acuity
measurement can affect: the number of patient rejections, average utilizations, and the number of
overloaded shifts. We also show a way of measuring the performance for all three indicators.
Use a best-fill policy, despite the fact that this will increase the number of acuity overloaded shifts.
The amount in which the average overload is, is less than the bed-filled policy, and when using
acuity measurement the threshold, or fill-level, can simply be lowered to decrease these acuity
overloads. Especially when combined with benchmarking and raising the bar on acceptable levels
of acuity can this policy lead to an decrease of rejections of 25%, and an increase of, on average, 1
patient per day. This can lead to a maximum increase in revenue of €1,000,000 per year.
Acuity Measurement at the Neonatal Intensive Care Unit
6
Table of Contents Management Summary ................................................................................................................................... 4
Abbreviations and Glossary ............................................................................................................................. 8
Preface............................................................................................................................................................. 9
1.Research Outline ........................................................................................................................................ 11
1.1 Context and Motivation ...................................................................................................................... 11
1.2 Problem description ............................................................................................................................ 11
1.3 Research Goal and Scope .................................................................................................................... 14
1.4 Research Questions and Methodology ............................................................................................... 14
2. The NICU .................................................................................................................................................... 16
2.1 Process Description ............................................................................................................................. 16
2.2 Process Organization ........................................................................................................................... 19
2.3 Current Performance........................................................................................................................... 21
2.4 Problem Analysis ................................................................................................................................. 23
3. The Neonatal Acuity-based Patient Scoring System ................................................................................. 26
3.1 Introduction and Literature on Acuity Systems .................................................................................. 26
3.2 Must-have Features for Acuity Models by Garcia (2013).................................................................... 27
3.3 Evaluation of Existing Models ............................................................................................................. 27
3.4 NAPSS: A New Model for Measuring Patient Acuity ........................................................................... 29
3.5 Conclusion ........................................................................................................................................... 30
4. Model Experiments ................................................................................................................................... 31
4.1 Model Tests ......................................................................................................................................... 31
4.2 Alignment, Reliability, and Validity tests ............................................................................................. 32
4.3 Testing the Model ............................................................................................................................... 34
4.4 Conclusion ........................................................................................................................................... 37
5. Simulation Experiments ............................................................................................................................ 38
5.1 Introduction Simulation ...................................................................................................................... 38
5.2 Conceptual Model ............................................................................................................................... 39
5.3 The Experiments .................................................................................................................................. 44
5.4 Experiment Results .............................................................................................................................. 48
5.5 Conclusion ........................................................................................................................................... 59
6. Conclusions and Recommendations ......................................................................................................... 60
6.1 Research Questions ............................................................................................................................. 60
6.2 Limitations and Assumptions .............................................................................................................. 61
6.3 Recommendations .............................................................................................................................. 61

Acuity Measurement at the Neonatal Intensive Care Unit
7
6.4 Further Research ................................................................................................................................. 62
Bibliography .................................................................................................................................................. 63
Appendix A: WANNNT ................................................................................................................................... 65
Appendix B: PCS of Harper and McCulley ..................................................................................................... 66
Appendix C: Experiment Results ................................................................................................................... 67
Appendix D: Transition Matrix ...................................................................................................................... 68
Appendix E: Absorbing Markov Chain Calculations....................................................................................... 69
Appendix F: Replications ............................................................................................................................... 73
Acuity Measurement at the Neonatal Intensive Care Unit
8
Abbreviations and Glossary Acuity The categorization of patients according to an assessment of their nursing care
requirements.
Alignment The measure for agreement between the calculations with the test results and real-life
measurements or observations.
Cohen’s kappa A statistic that measures inter-rater agreement.
CRIB Clinical Risk Index for Babies.
Discrete event simulation A quantitative method of analyzing a process through programming the process
in a software package that compares several process compositions based on random numbers. The time
series follows an order of well-defined events.
HC High Care.
IC Intensive Care.
ICC Intra-Class Correlation.
IV Intravenous.
NAPSS Neonatal Acuity-based Patient Scoring System.
Neonatology The area within medicine concerned with the care of newborn infants.
NICU Neonatal Intensive Care Unit.
NTISS Neonatal Therapeutic Intervention Scoring System.
Markov Chain Representation of a process as a chain of possible states.
MC Medium Care.
OR Operating Room.
PA Physician Assistant.
Pairwise comparison A method of comparing test results by comparing each pair of individual results with
the same test subject.
PCS Patient Classification System.
Pearson’s r A statistic that measures the correlation between two variables.
Reliability The measure for consistency and repeatability of the tests and models.
Significance Term to value the test results. We use 5% significance, meaning that test results that
promise 95% certainty or more are accepted.
SNAP Score for Neonatal Acute Physiology.
UMC University Medical Center.
Validity The measure for the representation of the real-life for the tests and models.
WANNNT Winnipeg Assessment of Neonatal Nursing Needs Tool.
WKZ Wilhelmina’s Child Hospital.

Acuity Measurement at the Neonatal Intensive Care Unit
9
Preface Before you lies the report of my master thesis project at the Wilhelmina’s Child Hospital of the University
Medical Center Utrecht. This project was conducted from September 2014 until September 2015. The
main result is a way of measuring the nurses’ workload, which is a newly developed method we have
called NAPSS (Neonatal Acuity-based Patient Scoring System.
Finishing this project means that I receive my master’s degree in Industrial Engineering and Management
at the University of Twente. I thank Willem de Vries for the opportunity to do this project at the WKZ, and
together with Mayko Louer for their involvement and enthusiasm. Especially the fact that the system will
be used in the future is something that I am proud of, which entirely compensates the slow progress we
made at some times.
When I started my master program, I did not think that I would do my master thesis project in healthcare.
I thank Erwin Hans for this opportunity , his immense enthusiasm, and his valuable comments. For his
involvement and comments do I also thank Marco Schutten. A lot of nurses contributed to this project
during the test period and pilot project, of which I want to thank Marion Bouman in particular for her
involvement and input.
And of course do I want to thank my family for their support throughout my study and having to listen to
me endlessly chattering about the project and related topics, and Jet specially for her correction of the
thesis.
Willem Hoek
Enschede, October 2015

Acuity Measurement at the Neonatal Intensive Care Unit
10
Acuity Measurement at the Neonatal Intensive Care Unit
11
1.Research Outline The Wilhelmina Children´s Hospital has a neonatal intensive care unit where newborns in need of intensive
care are treated. Although the hospital tries to deliver appropriate care for all patients, it regularly has to
refuse admission to newborns because of capacity constraints. This report explores the possible
applications of healthcare logistics to the perinatal division, discusses a method to inform decisions
regarding patient logistics, and recommends the application of a placement heuristic.
Section 1.1 introduces the context and motivation of this research. Section 1.2 describes the challenges
faced by the WKZ’s neonatal intensive care unit. Section 1.3 states the research goal and scope. Section 1.4
discusses the research questions and methodology that is used in this research.
1.1 Context and Motivation Due to a lot of novelties and researches, the chance of survival for premature newborns has significantly
increased over the years. The knowledge and resources to provide this type of care is rare, which is why
there are only ten Neonatal Intensive Care Units (NICUs) in the Netherlands. The Wilhelmina Children’s
Hospital (WKZ) in Utrecht, part of the University Medical Centre Utrecht (UMC Utrecht), specializes in
children’s care and is one of the ten NICUs in the Netherlands.
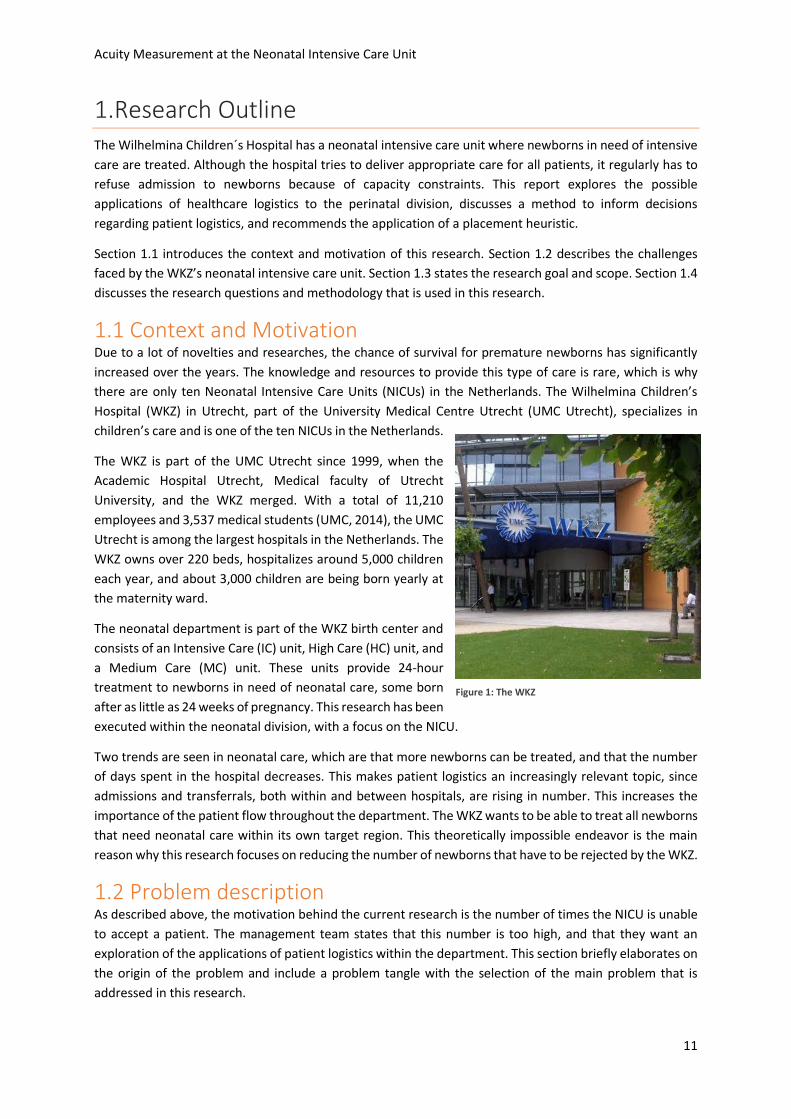
The WKZ is part of the UMC Utrecht since 1999, when the
Academic Hospital Utrecht, Medical faculty of Utrecht
University, and the WKZ merged. With a total of 11,210
employees and 3,537 medical students (UMC, 2014), the UMC
Utrecht is among the largest hospitals in the Netherlands. The
WKZ owns over 220 beds, hospitalizes around 5,000 children
each year, and about 3,000 children are being born yearly at
the maternity ward.
The neonatal department is part of the WKZ birth center and
consists of an Intensive Care (IC) unit, High Care (HC) unit, and
a Medium Care (MC) unit. These units provide 24-hour
treatment to newborns in need of neonatal care, some born
after as little as 24 weeks of pregnancy. This research has been
executed within the neonatal division, with a focus on the NICU.
Two trends are seen in neonatal care, which are that more newborns can be treated, and that the number
of days spent in the hospital decreases. This makes patient logistics an increasingly relevant topic, since
admissions and transferrals, both within and between hospitals, are rising in number. This increases the
importance of the patient flow throughout the department. The WKZ wants to be able to treat all newborns
that need neonatal care within its own target region. This theoretically impossible endeavor is the main
reason why this research focuses on reducing the number of newborns that have to be rejected by the WKZ.
1.2 Problem description As described above, the motivation behind the current research is the number of times the NICU is unable
to accept a patient. The management team states that this number is too high, and that they want an
exploration of the applications of patient logistics within the department. This section briefly elaborates on
the origin of the problem and include a problem tangle with the selection of the main problem that is
addressed in this research.
Figure 1: The WKZ
Acuity Measurement at the Neonatal Intensive Care Unit
12
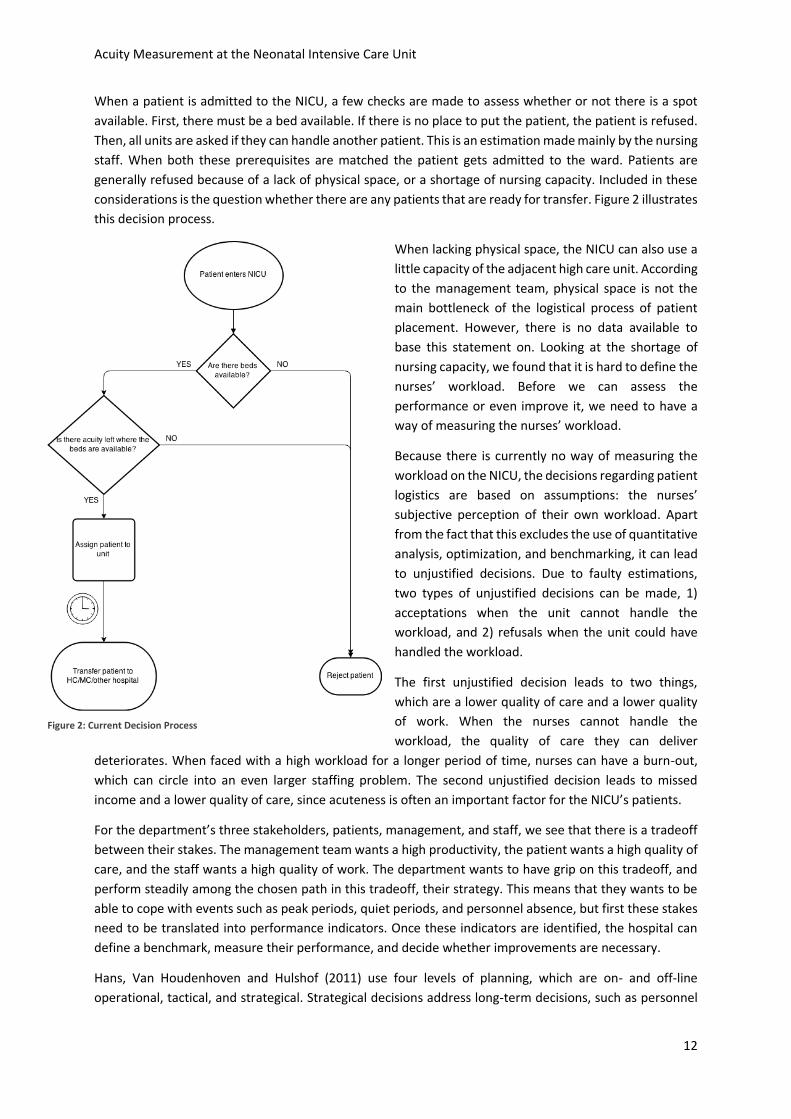
When a patient is admitted to the NICU, a few checks are made to assess whether or not there is a spot
available. First, there must be a bed available. If there is no place to put the patient, the patient is refused.
Then, all units are asked if they can handle another patient. This is an estimation made mainly by the nursing
staff. When both these prerequisites are matched the patient gets admitted to the ward. Patients are
generally refused because of a lack of physical space, or a shortage of nursing capacity. Included in these
considerations is the question whether there are any patients that are ready for transfer. Figure 2 illustrates
this decision process.
When lacking physical space, the NICU can also use a
little capacity of the adjacent high care unit. According
to the management team, physical space is not the
main bottleneck of the logistical process of patient
placement. However, there is no data available to
base this statement on. Looking at the shortage of
nursing capacity, we found that it is hard to define the
nurses’ workload. Before we can assess the
performance or even improve it, we need to have a
way of measuring the nurses’ workload.
Because there is currently no way of measuring the
workload on the NICU, the decisions regarding patient
logistics are based on assumptions: the nurses’
subjective perception of their own workload. Apart
from the fact that this excludes the use of quantitative
analysis, optimization, and benchmarking, it can lead
to unjustified decisions. Due to faulty estimations,
two types of unjustified decisions can be made, 1)
acceptations when the unit cannot handle the
workload, and 2) refusals when the unit could have
handled the workload.
The first unjustified decision leads to two things,
which are a lower quality of care and a lower quality
of work. When the nurses cannot handle the
workload, the quality of care they can deliver
deteriorates. When faced with a high workload for a longer period of time, nurses can have a burn-out,
which can circle into an even larger staffing problem. The second unjustified decision leads to missed
income and a lower quality of care, since acuteness is often an important factor for the NICU’s patients.
For the department’s three stakeholders, patients, management, and staff, we see that there is a tradeoff
between their stakes. The management team wants a high productivity, the patient wants a high quality of
care, and the staff wants a high quality of work. The department wants to have grip on this tradeoff, and
perform steadily among the chosen path in this tradeoff, their strategy. This means that they wants to be
able to cope with events such as peak periods, quiet periods, and personnel absence, but first these stakes
need to be translated into performance indicators. Once these indicators are identified, the hospital can
define a benchmark, measure their performance, and decide whether improvements are necessary.
Hans, Van Houdenhoven and Hulshof (2011) use four levels of planning, which are on- and off-line
operational, tactical, and strategical. Strategical decisions address long-term decisions, such as personnel
Figure 2: Current Decision Process
Acuity Measurement at the Neonatal Intensive Care Unit
13
and the number of beds. Operational decisions are short-term decisions, for example which patient is
treated by which nurse. Off-line operational decisions are operational decisions that are made in advance
of operations and are fixed, while on-line operational decisions react on unforeseen situations and can
change during operations. Tactical decisions regard the usage of resources between the operational and
strategical level. Policies on how to assign operational decisions within the strategically determined setting
are tactical decisions.
As stated above, before improvement projects regarding these healthcare logistics topics on the NICU can
be done, we need to be able to measure the workload on the units. We have also seen that being able to
base decisions on a more objective basis may in itself be beneficial to the performance of the division.
Objectifying the decision-making processes can thus result in an immediate improvement on the
operational level, and enable improvements regarding the tactical planning level, which is currently
practically ignored at the NICU. As can be seen in the problem tangle, the lack of information and objectivity
in the decision-making process is a root problem. It has therefore been selected as the main problem to be
addressed in this study.
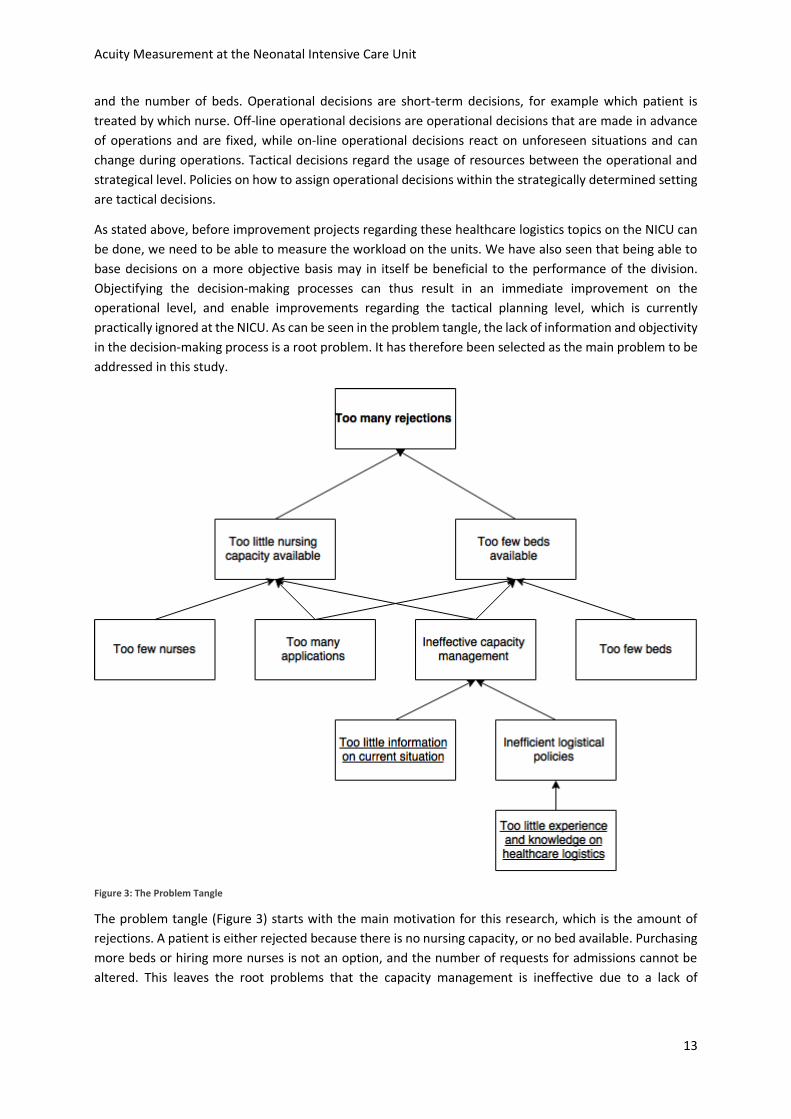
Figure 3: The Problem Tangle
The problem tangle (Figure 3) starts with the main motivation for this research, which is the amount of
rejections. A patient is either rejected because there is no nursing capacity, or no bed available. Purchasing
more beds or hiring more nurses is not an option, and the number of requests for admissions cannot be
altered. This leaves the root problems that the capacity management is ineffective due to a lack of
Acuity Measurement at the Neonatal Intensive Care Unit
14
information on the current situation on the units regarding the nurses workload, and the fact that little
planning methodology or strategies are used. This research focuses on these two root problems.
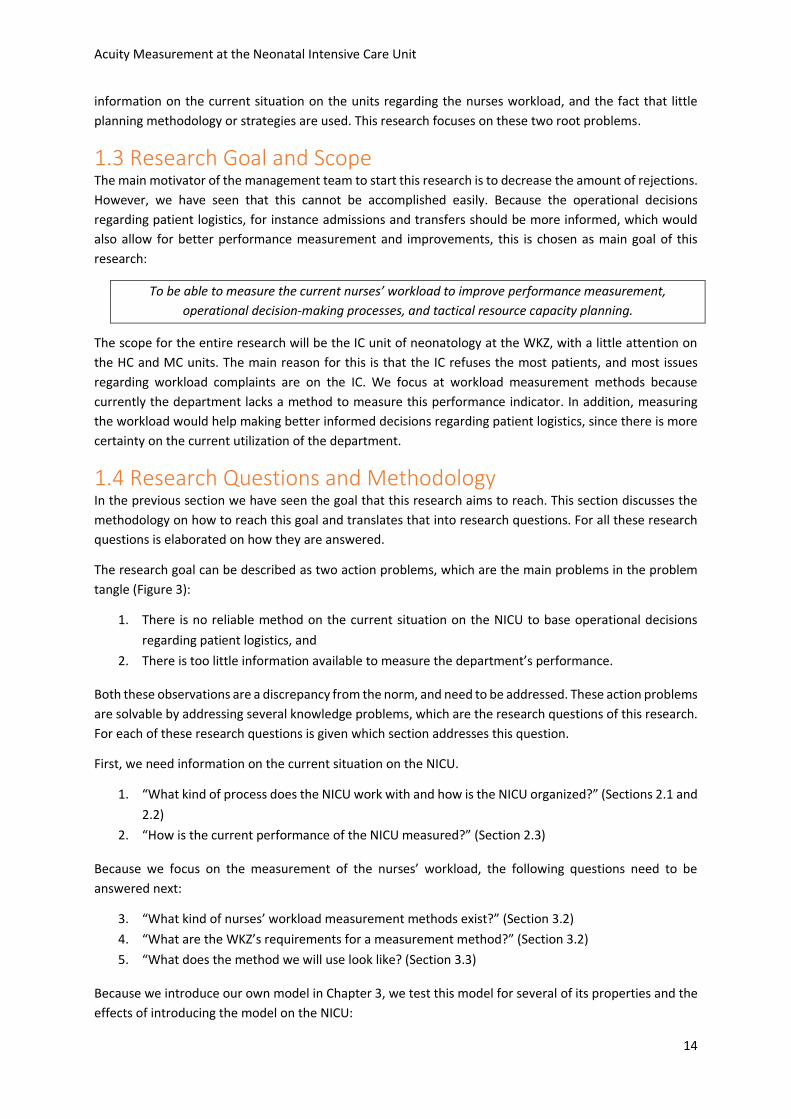
1.3 Research Goal and Scope The main motivator of the management team to start this research is to decrease the amount of rejections.
However, we have seen that this cannot be accomplished easily. Because the operational decisions
regarding patient logistics, for instance admissions and transfers should be more informed, which would
also allow for better performance measurement and improvements, this is chosen as main goal of this
research:
To be able to measure the current nurses’ workload to improve performance measurement,
operational decision-making processes, and tactical resource capacity planning.
The scope for the entire research will be the IC unit of neonatology at the WKZ, with a little attention on
the HC and MC units. The main reason for this is that the IC refuses the most patients, and most issues
regarding workload complaints are on the IC. We focus at workload measurement methods because
currently the department lacks a method to measure this performance indicator. In addition, measuring
the workload would help making better informed decisions regarding patient logistics, since there is more
certainty on the current utilization of the department.
1.4 Research Questions and Methodology In the previous section we have seen the goal that this research aims to reach. This section discusses the
methodology on how to reach this goal and translates that into research questions. For all these research
questions is elaborated on how they are answered.
The research goal can be described as two action problems, which are the main problems in the problem
tangle (Figure 3):
1. There is no reliable method on the current situation on the NICU to base operational decisions
regarding patient logistics, and
2. There is too little information available to measure the department’s performance.
Both these observations are a discrepancy from the norm, and need to be addressed. These action problems
are solvable by addressing several knowledge problems, which are the research questions of this research.
For each of these research questions is given which section addresses this question.
First, we need information on the current situation on the NICU.
1. “What kind of process does the NICU work with and how is the NICU organized?” (Sections 2.1 and
2.2)
2. “How is the current performance of the NICU measured?” (Section 2.3)
Because we focus on the measurement of the nurses’ workload, the following questions need to be
answered next:
3. “What kind of nurses’ workload measurement methods exist?” (Section 3.2)
4. “What are the WKZ’s requirements for a measurement method?” (Section 3.2)
5. “What does the method we will use look like? (Section 3.3)
Because we introduce our own model in Chapter 3, we test this model for several of its properties and the
effects of introducing the model on the NICU:

Acuity Measurement at the Neonatal Intensive Care Unit
15
6. “How practically applicable is our own model?” (Chapter 4)
7. “What are the prospected effects of implementing the model?” (Chapter 5)
The first two questions are answered by interviews and discussions with NICU staff, observation days, and
formal documents. Question 3 is answered through a literature review. Question 4 and 5 are answered on
the basis of discussions with experts. Question 6 is answered through empirical tests, and question 7 is
answered using an analytical test done via a computer simulation.
Acuity Measurement at the Neonatal Intensive Care Unit
16
2. The NICU This chapter introduces the neonatal department of the WKZ, with its focus on the NICU. From these
insights the problem analysis is drawn and the research focus is determined. Section 2.1 describes the main
processes on the NICU. Section 2.2 explains how these processes are organized. Section 2.3 assesses the
current performance, and Section 2.4 analyzes the situation and identifies the main problem of this
research.
Several methods were used to collect information regarding the neonatal department. Discussions with
staff members and formal documentation of the organization were used, as well as several observation
days.
2.1 Process Description In order to understand the research problems as given in the previous chapter, we first need to understand
the NICU environment. This section introduces the three units within the unit, the patient flow, and the
types of staff members that work on the units daily, along with their tasks and responsibilities.
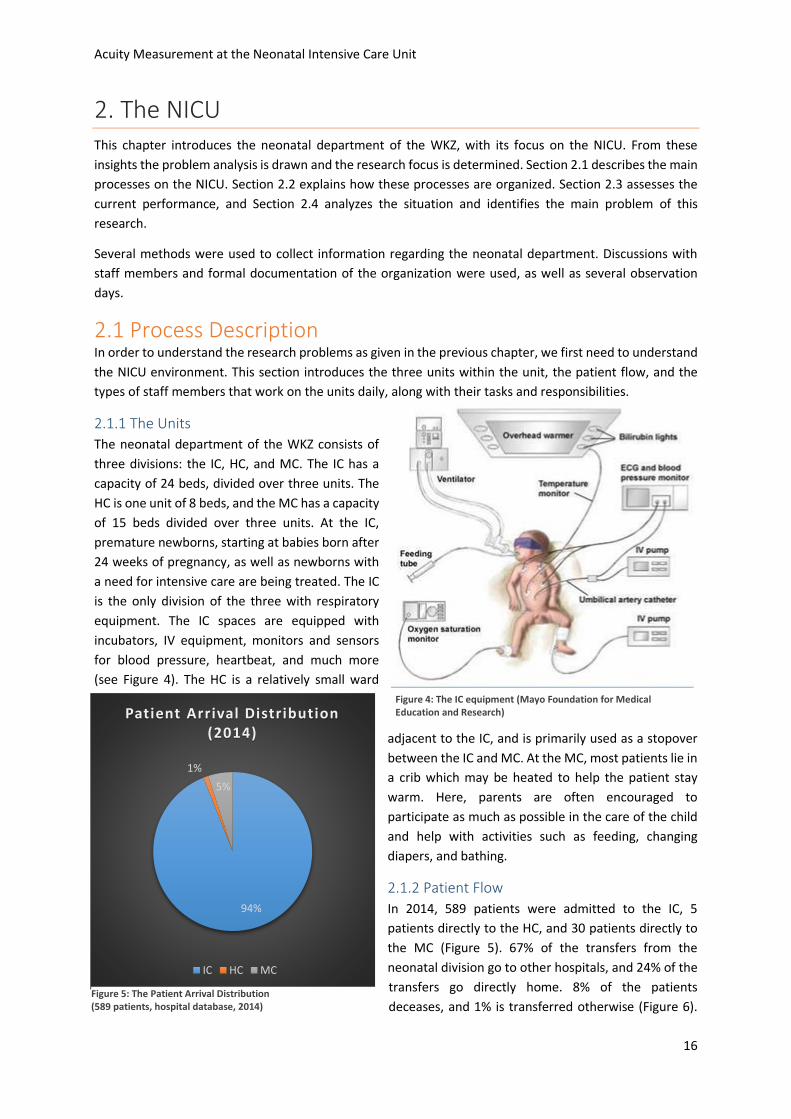
2.1.1 The Units
The neonatal department of the WKZ consists of
three divisions: the IC, HC, and MC. The IC has a
capacity of 24 beds, divided over three units. The
HC is one unit of 8 beds, and the MC has a capacity
of 15 beds divided over three units. At the IC,
premature newborns, starting at babies born after
24 weeks of pregnancy, as well as newborns with
a need for intensive care are being treated. The IC
is the only division of the three with respiratory
equipment. The IC spaces are equipped with
incubators, IV equipment, monitors and sensors
for blood pressure, heartbeat, and much more
(see Figure 4). The HC is a relatively small ward
adjacent to the IC, and is primarily used as a stopover
between the IC and MC. At the MC, most patients lie in
a crib which may be heated to help the patient stay
warm. Here, parents are often encouraged to
participate as much as possible in the care of the child
and help with activities such as feeding, changing
diapers, and bathing.
2.1.2 Patient Flow
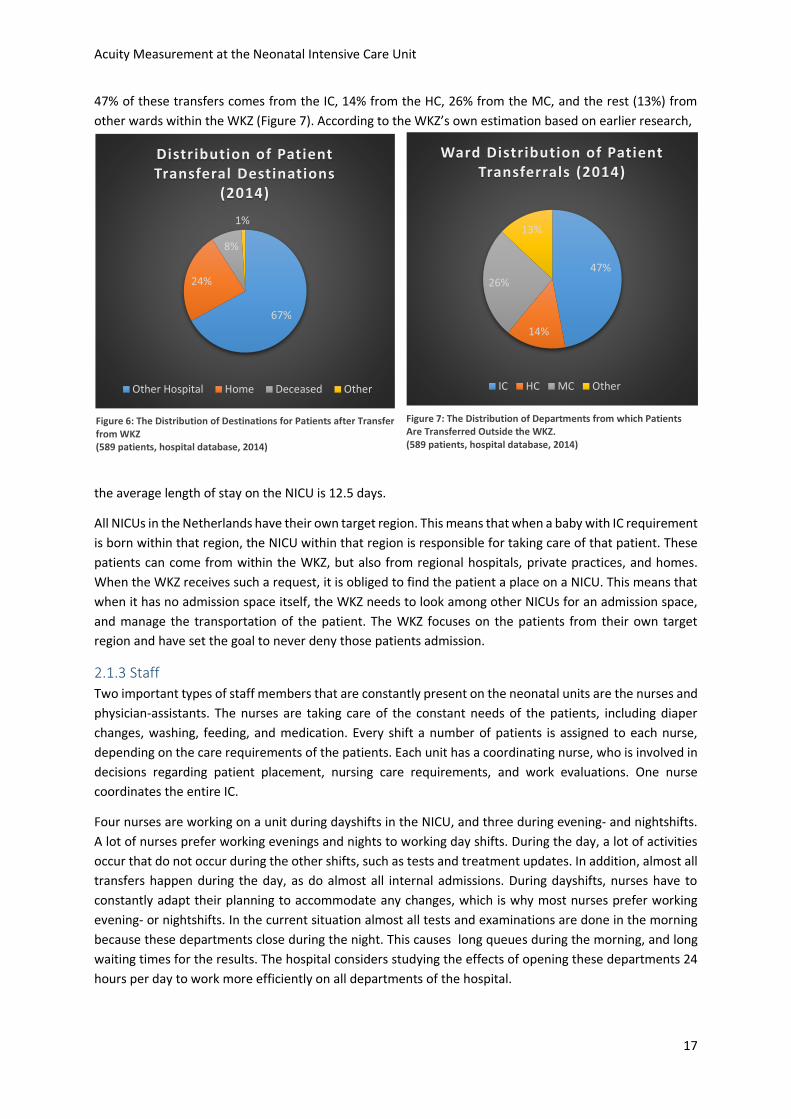
In 2014, 589 patients were admitted to the IC, 5
patients directly to the HC, and 30 patients directly to
the MC (Figure 5). 67% of the transfers from the
neonatal division go to other hospitals, and 24% of the
transfers go directly home. 8% of the patients
deceases, and 1% is transferred otherwise (Figure 6).
94%
1%
5%
Patient Arrival Distribution (2014)
IC HC MC
Figure 4: The IC equipment (Mayo Foundation for Medical Education and Research)
Figure 5: The Patient Arrival Distribution (589 patients, hospital database, 2014)
Acuity Measurement at the Neonatal Intensive Care Unit
17
47% of these transfers comes from the IC, 14% from the HC, 26% from the MC, and the rest (13%) from
other wards within the WKZ (Figure 7). According to the WKZ’s own estimation based on earlier research,
the average length of stay on the NICU is 12.5 days.
All NICUs in the Netherlands have their own target region. This means that when a baby with IC requirement
is born within that region, the NICU within that region is responsible for taking care of that patient. These
patients can come from within the WKZ, but also from regional hospitals, private practices, and homes.
When the WKZ receives such a request, it is obliged to find the patient a place on a NICU. This means that
when it has no admission space itself, the WKZ needs to look among other NICUs for an admission space,
and manage the transportation of the patient. The WKZ focuses on the patients from their own target
region and have set the goal to never deny those patients admission.
2.1.3 Staff
Two important types of staff members that are constantly present on the neonatal units are the nurses and
physician-assistants. The nurses are taking care of the constant needs of the patients, including diaper
changes, washing, feeding, and medication. Every shift a number of patients is assigned to each nurse,
depending on the care requirements of the patients. Each unit has a coordinating nurse, who is involved in
decisions regarding patient placement, nursing care requirements, and work evaluations. One nurse
coordinates the entire IC.
Four nurses are working on a unit during dayshifts in the NICU, and three during evening- and nightshifts.
A lot of nurses prefer working evenings and nights to working day shifts. During the day, a lot of activities
occur that do not occur during the other shifts, such as tests and treatment updates. In addition, almost all
transfers happen during the day, as do almost all internal admissions. During dayshifts, nurses have to
constantly adapt their planning to accommodate any changes, which is why most nurses prefer working
evening- or nightshifts. In the current situation almost all tests and examinations are done in the morning
because these departments close during the night. This causes long queues during the morning, and long
waiting times for the results. The hospital considers studying the effects of opening these departments 24
hours per day to work more efficiently on all departments of the hospital.
47%
14%
26%
13%
Ward Distribution of Patient Transferrals (2014)
IC HC MC Other
67%
24%
8%
1%
Distribution of Patient Transferal Destinations
(2014)
Other Hospital Home Deceased Other
Figure 7: The Distribution of Departments from which Patients Are Transferred Outside the WKZ. (589 patients, hospital database, 2014)
Figure 6: The Distribution of Destinations for Patients after Transfer from WKZ (589 patients, hospital database, 2014)
589 patients, hospital database, 2014
Acuity Measurement at the Neonatal Intensive Care Unit
18
This idea can also work on the NICU. When nurses prefer night shifts above day shifts, it can be worth
researching whether the nurses´ workload is higher during the day or whether it is the nature of the extra
activities during the day that causes this. Either cause can be an interesting reason to shift some activities
from the day shifts to the other two shifts.
In addition to the patient care there are other necessary activities to be done by the nurses, for example
administration and operational improvement projects. If the workload on a unit is low, nurses should be
able to spend some time on these activities. However, it appears to be hard to identify when the workload
allows one nurse to leave the unit for a while. The department is introducing some lean projects, clearing
time for nurses to do the complementary things. It is hard, however, to efficiently use the extra time
because of the lack of insight in the amount of patient care required. Especially at the end of a shift when
the workload is not that high, the nurses have finished the necessities and can spare some time.
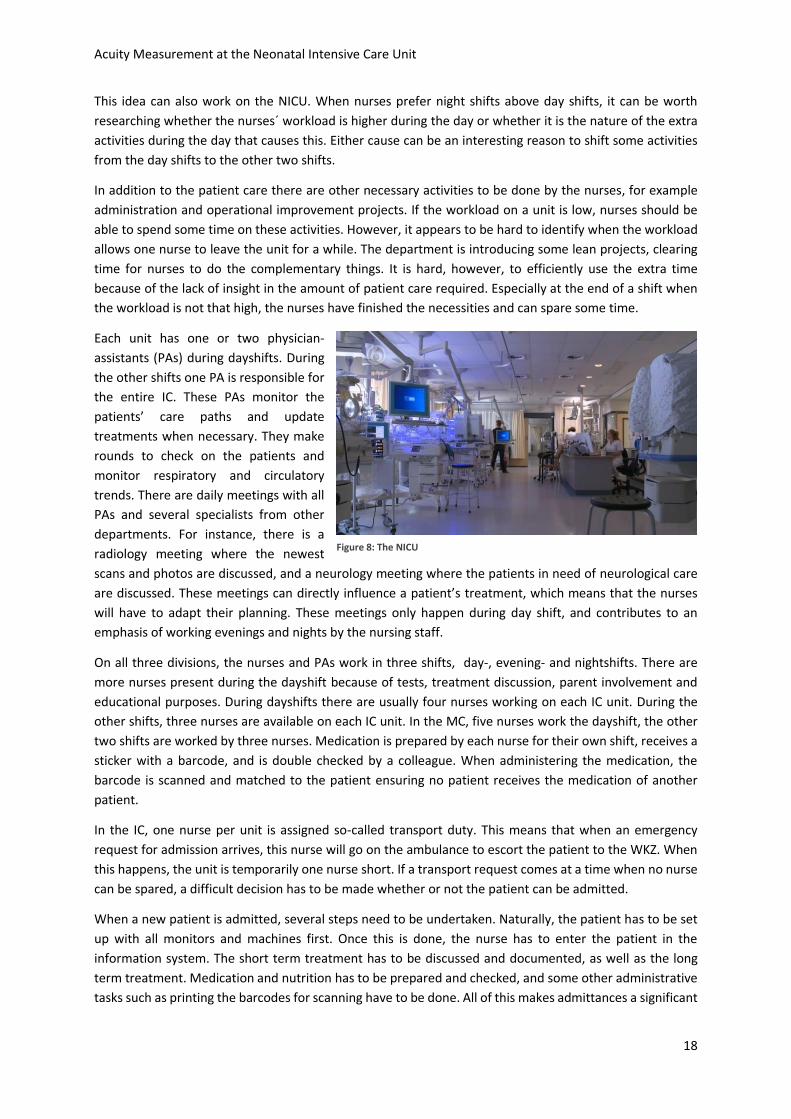
Each unit has one or two physician-
assistants (PAs) during dayshifts. During
the other shifts one PA is responsible for
the entire IC. These PAs monitor the
patients’ care paths and update
treatments when necessary. They make
rounds to check on the patients and
monitor respiratory and circulatory
trends. There are daily meetings with all
PAs and several specialists from other
departments. For instance, there is a
radiology meeting where the newest
scans and photos are discussed, and a neurology meeting where the patients in need of neurological care
are discussed. These meetings can directly influence a patient’s treatment, which means that the nurses
will have to adapt their planning. These meetings only happen during day shift, and contributes to an
emphasis of working evenings and nights by the nursing staff.
On all three divisions, the nurses and PAs work in three shifts, day-, evening- and nightshifts. There are
more nurses present during the dayshift because of tests, treatment discussion, parent involvement and
educational purposes. During dayshifts there are usually four nurses working on each IC unit. During the
other shifts, three nurses are available on each IC unit. In the MC, five nurses work the dayshift, the other
two shifts are worked by three nurses. Medication is prepared by each nurse for their own shift, receives a
sticker with a barcode, and is double checked by a colleague. When administering the medication, the
barcode is scanned and matched to the patient ensuring no patient receives the medication of another
patient.
In the IC, one nurse per unit is assigned so-called transport duty. This means that when an emergency
request for admission arrives, this nurse will go on the ambulance to escort the patient to the WKZ. When
this happens, the unit is temporarily one nurse short. If a transport request comes at a time when no nurse
can be spared, a difficult decision has to be made whether or not the patient can be admitted.
When a new patient is admitted, several steps need to be undertaken. Naturally, the patient has to be set
up with all monitors and machines first. Once this is done, the nurse has to enter the patient in the
information system. The short term treatment has to be discussed and documented, as well as the long
term treatment. Medication and nutrition has to be prepared and checked, and some other administrative
tasks such as printing the barcodes for scanning have to be done. All of this makes admittances a significant
Figure 8: The NICU
Acuity Measurement at the Neonatal Intensive Care Unit
19
amount of work for a nurse. This is in contrast to a transfer to the HC or MC, which does not entail much
more than physically transferring the patient and asking the administrative staff to transfer the system
entry to the new spot.
2.2 Process Organization Section 2.1 described the daily pursuits of the IC, HC, and MC. Organizing these processes takes a lot of
effort and is a complex process in itself. In order to assess the current situation on the NICU, this section
discusses the ways in which several important processes are organized. Section 2.2.1 discusses the staff,
Section 2.2.2 the logistics, and Section 2.2.3 the information systems. The latter are important processes of
which the organization is relevant for answering our research questions.
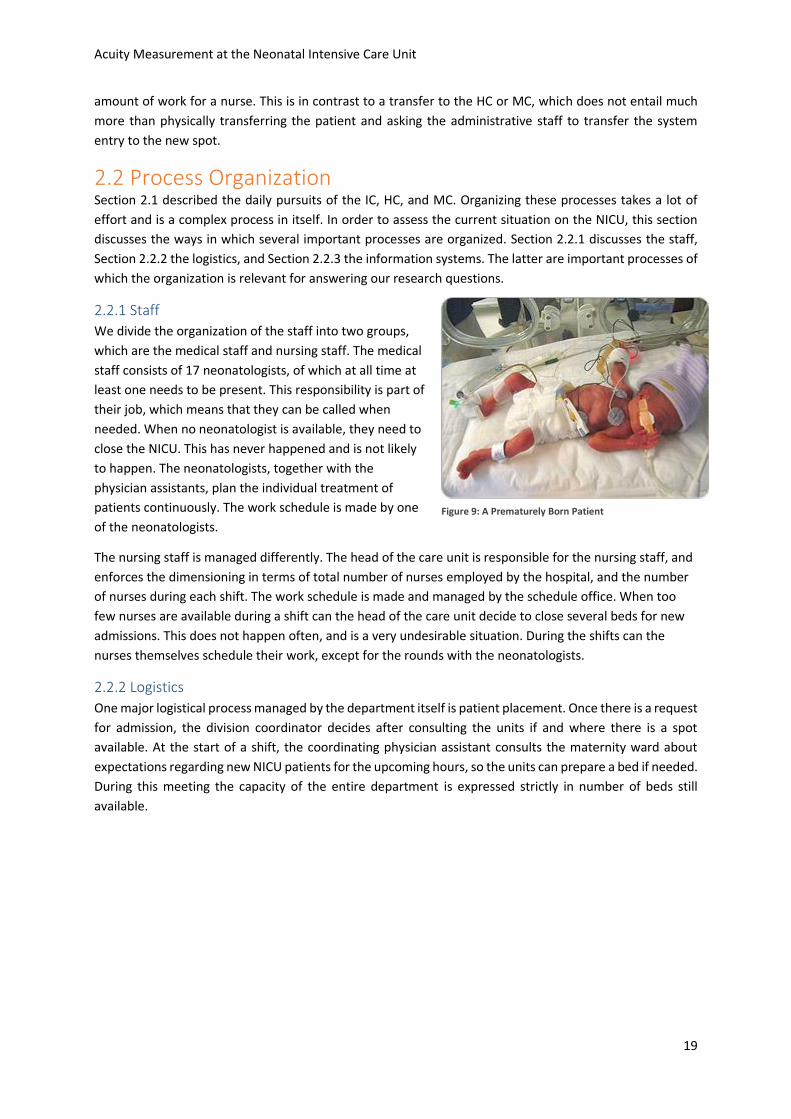
2.2.1 Staff
We divide the organization of the staff into two groups,
which are the medical staff and nursing staff. The medical
staff consists of 17 neonatologists, of which at all time at
least one needs to be present. This responsibility is part of
their job, which means that they can be called when
needed. When no neonatologist is available, they need to
close the NICU. This has never happened and is not likely
to happen. The neonatologists, together with the
physician assistants, plan the individual treatment of
patients continuously. The work schedule is made by one
of the neonatologists.
The nursing staff is managed differently. The head of the care unit is responsible for the nursing staff, and
enforces the dimensioning in terms of total number of nurses employed by the hospital, and the number
of nurses during each shift. The work schedule is made and managed by the schedule office. When too
few nurses are available during a shift can the head of the care unit decide to close several beds for new
admissions. This does not happen often, and is a very undesirable situation. During the shifts can the
nurses themselves schedule their work, except for the rounds with the neonatologists.
2.2.2 Logistics
One major logistical process managed by the department itself is patient placement. Once there is a request
for admission, the division coordinator decides after consulting the units if and where there is a spot
available. At the start of a shift, the coordinating physician assistant consults the maternity ward about
expectations regarding new NICU patients for the upcoming hours, so the units can prepare a bed if needed.
During this meeting the capacity of the entire department is expressed strictly in number of beds still
available.
Figure 9: A Prematurely Born Patient
Acuity Measurement at the Neonatal Intensive Care Unit
20
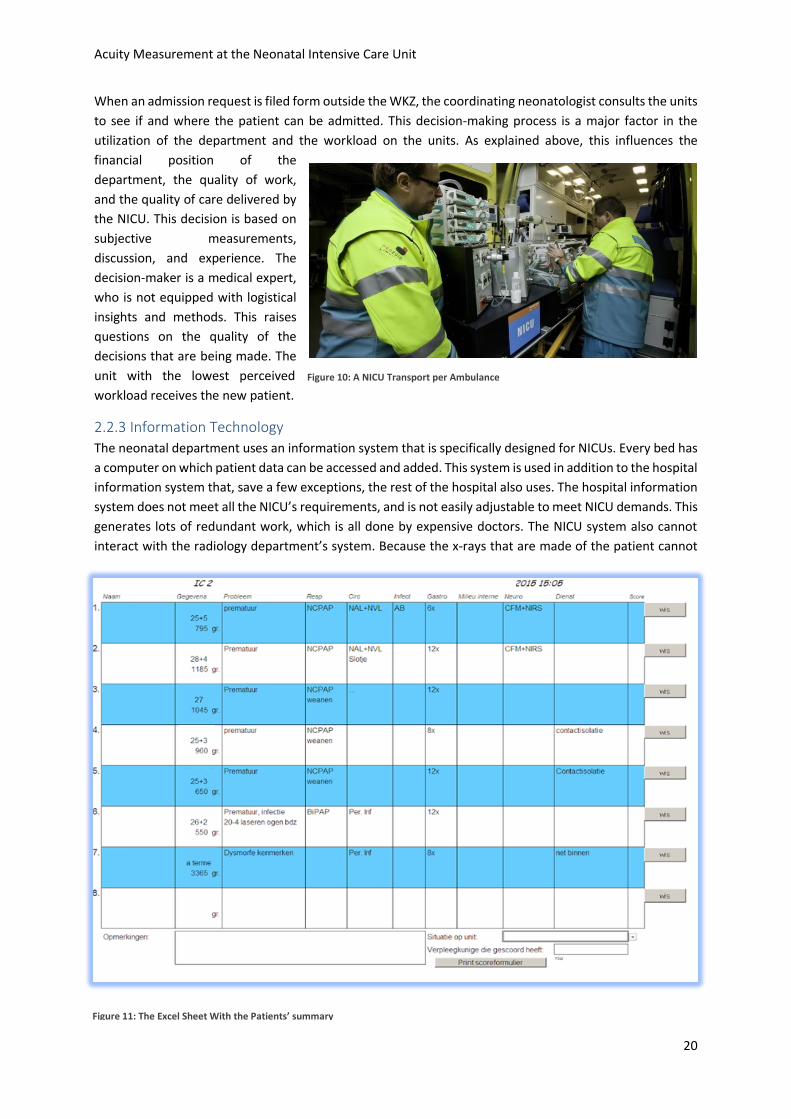
When an admission request is filed form outside the WKZ, the coordinating neonatologist consults the units
to see if and where the patient can be admitted. This decision-making process is a major factor in the
utilization of the department and the workload on the units. As explained above, this influences the
financial position of the
department, the quality of work,
and the quality of care delivered by
the NICU. This decision is based on
subjective measurements,
discussion, and experience. The
decision-maker is a medical expert,
who is not equipped with logistical
insights and methods. This raises
questions on the quality of the
decisions that are being made. The
unit with the lowest perceived
workload receives the new patient.
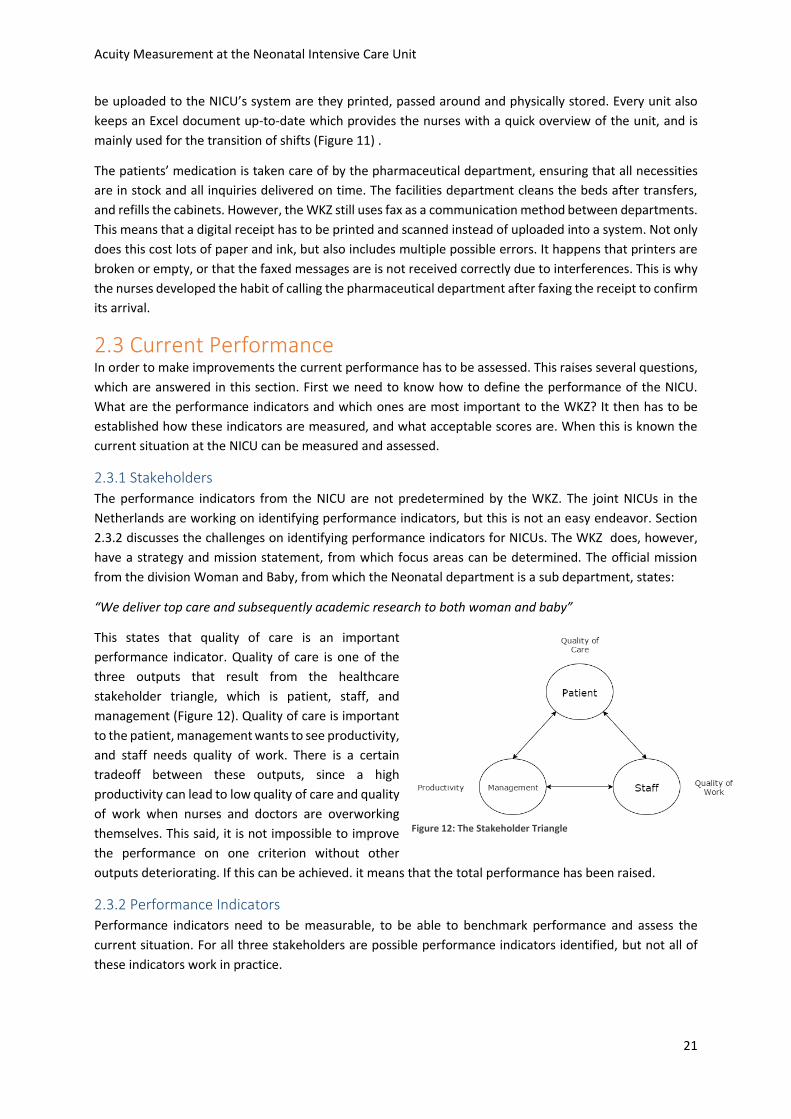
2.2.3 Information Technology
The neonatal department uses an information system that is specifically designed for NICUs. Every bed has
a computer on which patient data can be accessed and added. This system is used in addition to the hospital
information system that, save a few exceptions, the rest of the hospital also uses. The hospital information
system does not meet all the NICU’s requirements, and is not easily adjustable to meet NICU demands. This
generates lots of redundant work, which is all done by expensive doctors. The NICU system also cannot
interact with the radiology department’s system. Because the x-rays that are made of the patient cannot
Figure 10: A NICU Transport per Ambulance
Figure 11: The Excel Sheet With the Patients’ summary
Acuity Measurement at the Neonatal Intensive Care Unit
21
be uploaded to the NICU’s system are they printed, passed around and physically stored. Every unit also
keeps an Excel document up-to-date which provides the nurses with a quick overview of the unit, and is
mainly used for the transition of shifts (Figure 11) .
The patients’ medication is taken care of by the pharmaceutical department, ensuring that all necessities
are in stock and all inquiries delivered on time. The facilities department cleans the beds after transfers,
and refills the cabinets. However, the WKZ still uses fax as a communication method between departments.
This means that a digital receipt has to be printed and scanned instead of uploaded into a system. Not only
does this cost lots of paper and ink, but also includes multiple possible errors. It happens that printers are
broken or empty, or that the faxed messages are is not received correctly due to interferences. This is why
the nurses developed the habit of calling the pharmaceutical department after faxing the receipt to confirm
its arrival.
2.3 Current Performance In order to make improvements the current performance has to be assessed. This raises several questions,
which are answered in this section. First we need to know how to define the performance of the NICU.
What are the performance indicators and which ones are most important to the WKZ? It then has to be
established how these indicators are measured, and what acceptable scores are. When this is known the
current situation at the NICU can be measured and assessed.
2.3.1 Stakeholders
The performance indicators from the NICU are not predetermined by the WKZ. The joint NICUs in the
Netherlands are working on identifying performance indicators, but this is not an easy endeavor. Section
2.3.2 discusses the challenges on identifying performance indicators for NICUs. The WKZ does, however,
have a strategy and mission statement, from which focus areas can be determined. The official mission
from the division Woman and Baby, from which the Neonatal department is a sub department, states:
“We deliver top care and subsequently academic research to both woman and baby”
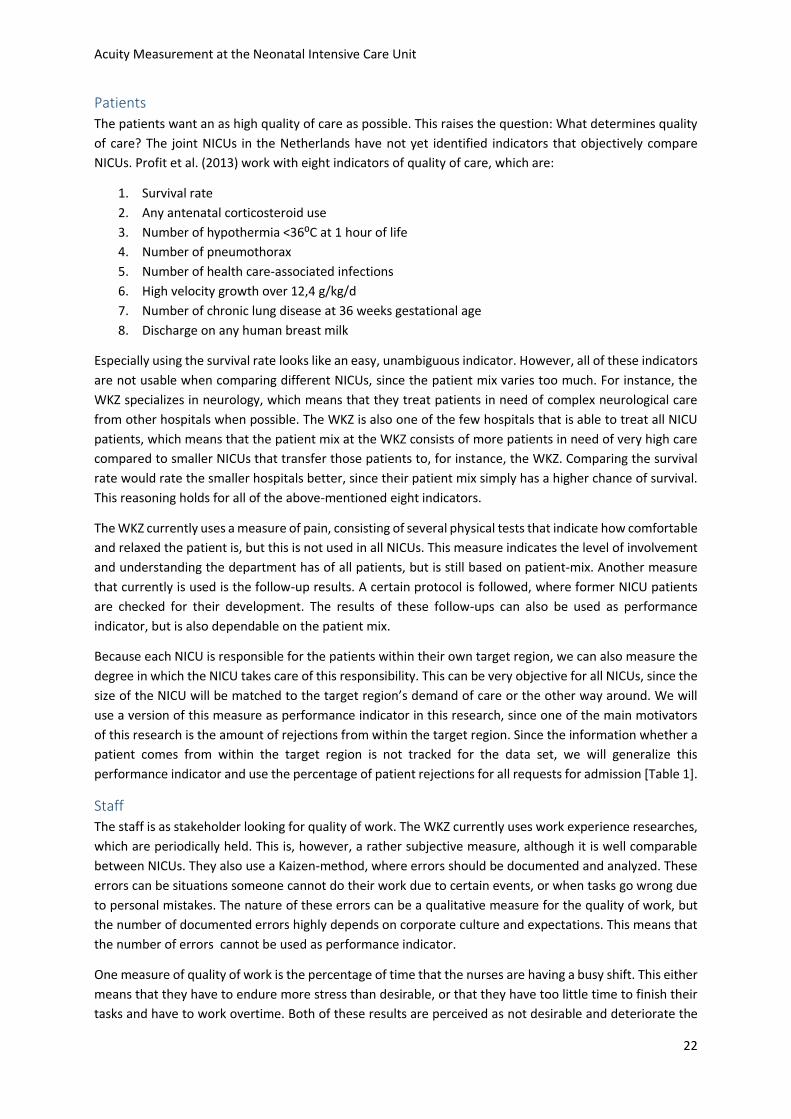
This states that quality of care is an important
performance indicator. Quality of care is one of the
three outputs that result from the healthcare
stakeholder triangle, which is patient, staff, and
management (Figure 12). Quality of care is important
to the patient, management wants to see productivity,
and staff needs quality of work. There is a certain
tradeoff between these outputs, since a high
productivity can lead to low quality of care and quality
of work when nurses and doctors are overworking
themselves. This said, it is not impossible to improve
the performance on one criterion without other
outputs deteriorating. If this can be achieved. it means that the total performance has been raised.
2.3.2 Performance Indicators
Performance indicators need to be measurable, to be able to benchmark performance and assess the
current situation. For all three stakeholders are possible performance indicators identified, but not all of
these indicators work in practice.
Figure 12: The Stakeholder Triangle
Acuity Measurement at the Neonatal Intensive Care Unit
22
Patients
The patients want an as high quality of care as possible. This raises the question: What determines quality
of care? The joint NICUs in the Netherlands have not yet identified indicators that objectively compare
NICUs. Profit et al. (2013) work with eight indicators of quality of care, which are:
1. Survival rate
2. Any antenatal corticosteroid use
3. Number of hypothermia <36⁰C at 1 hour of life
4. Number of pneumothorax
5. Number of health care-associated infections
6. High velocity growth over 12,4 g/kg/d
7. Number of chronic lung disease at 36 weeks gestational age
8. Discharge on any human breast milk
Especially using the survival rate looks like an easy, unambiguous indicator. However, all of these indicators
are not usable when comparing different NICUs, since the patient mix varies too much. For instance, the
WKZ specializes in neurology, which means that they treat patients in need of complex neurological care
from other hospitals when possible. The WKZ is also one of the few hospitals that is able to treat all NICU
patients, which means that the patient mix at the WKZ consists of more patients in need of very high care
compared to smaller NICUs that transfer those patients to, for instance, the WKZ. Comparing the survival
rate would rate the smaller hospitals better, since their patient mix simply has a higher chance of survival.
This reasoning holds for all of the above-mentioned eight indicators.
The WKZ currently uses a measure of pain, consisting of several physical tests that indicate how comfortable
and relaxed the patient is, but this is not used in all NICUs. This measure indicates the level of involvement
and understanding the department has of all patients, but is still based on patient-mix. Another measure
that currently is used is the follow-up results. A certain protocol is followed, where former NICU patients
are checked for their development. The results of these follow-ups can also be used as performance
indicator, but is also dependable on the patient mix.
Because each NICU is responsible for the patients within their own target region, we can also measure the
degree in which the NICU takes care of this responsibility. This can be very objective for all NICUs, since the
size of the NICU will be matched to the target region’s demand of care or the other way around. We will
use a version of this measure as performance indicator in this research, since one of the main motivators
of this research is the amount of rejections from within the target region. Since the information whether a
patient comes from within the target region is not tracked for the data set, we will generalize this
performance indicator and use the percentage of patient rejections for all requests for admission [Table 1].
Staff
The staff is as stakeholder looking for quality of work. The WKZ currently uses work experience researches,
which are periodically held. This is, however, a rather subjective measure, although it is well comparable
between NICUs. They also use a Kaizen-method, where errors should be documented and analyzed. These
errors can be situations someone cannot do their work due to certain events, or when tasks go wrong due
to personal mistakes. The nature of these errors can be a qualitative measure for the quality of work, but
the number of documented errors highly depends on corporate culture and expectations. This means that
the number of errors cannot be used as performance indicator.
One measure of quality of work is the percentage of time that the nurses are having a busy shift. This either
means that they have to endure more stress than desirable, or that they have too little time to finish their
tasks and have to work overtime. Both of these results are perceived as not desirable and deteriorate the
Acuity Measurement at the Neonatal Intensive Care Unit
23
quality of work. This research uses the percentage of busy shifts for nurses as performance indicator for
quality of work, since it is quantifiable and important for the actual work perception. [Table 1]
Management
As seen in Figure 12 the productivity of the department is the main focus of the management. In the hospital
the budgets are fixed with a so-called ‘0-line’. This means that, regardless of the predicted and realized cash
flow, the budget of the NICU is almost entirely independent of the actual performance of the department.
This makes the management’s main focus not the financial performance, but the productivity itself. The
management wants to manage the processes as efficiently as possible in order to fulfill their role as provider
of care as good as possible.
Of course will the financial performance on the long run be kept in eye, but when the department makes
profit will their budget likely be cut since they apparently do not need that much money. This is the problem
when working with budgets, and is a reason why efficiently is often not important for the management.
This research will use the average utilization of the department in terms of percentage of occupied beds as
performance indicator, but will also translate the results of this to the impact on the financial performance.
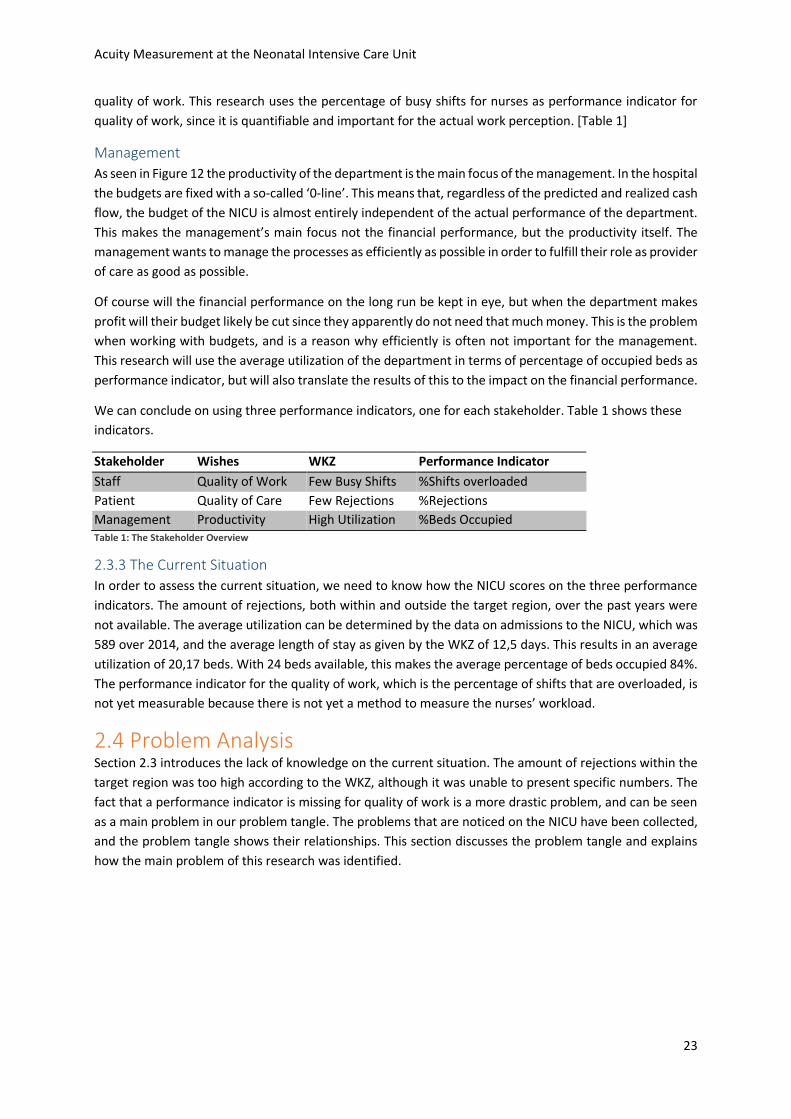
We can conclude on using three performance indicators, one for each stakeholder. Table 1 shows these
indicators.
Stakeholder Wishes WKZ Performance Indicator
Staff Quality of Work Few Busy Shifts %Shifts overloaded
Patient Quality of Care Few Rejections %Rejections
Management Productivity High Utilization %Beds Occupied Table 1: The Stakeholder Overview
2.3.3 The Current Situation
In order to assess the current situation, we need to know how the NICU scores on the three performance
indicators. The amount of rejections, both within and outside the target region, over the past years were
not available. The average utilization can be determined by the data on admissions to the NICU, which was
589 over 2014, and the average length of stay as given by the WKZ of 12,5 days. This results in an average
utilization of 20,17 beds. With 24 beds available, this makes the average percentage of beds occupied 84%.
The performance indicator for the quality of work, which is the percentage of shifts that are overloaded, is
not yet measurable because there is not yet a method to measure the nurses’ workload.
2.4 Problem Analysis Section 2.3 introduces the lack of knowledge on the current situation. The amount of rejections within the
target region was too high according to the WKZ, although it was unable to present specific numbers. The
fact that a performance indicator is missing for quality of work is a more drastic problem, and can be seen
as a main problem in our problem tangle. The problems that are noticed on the NICU have been collected,
and the problem tangle shows their relationships. This section discusses the problem tangle and explains
how the main problem of this research was identified.
Acuity Measurement at the Neonatal Intensive Care Unit
24
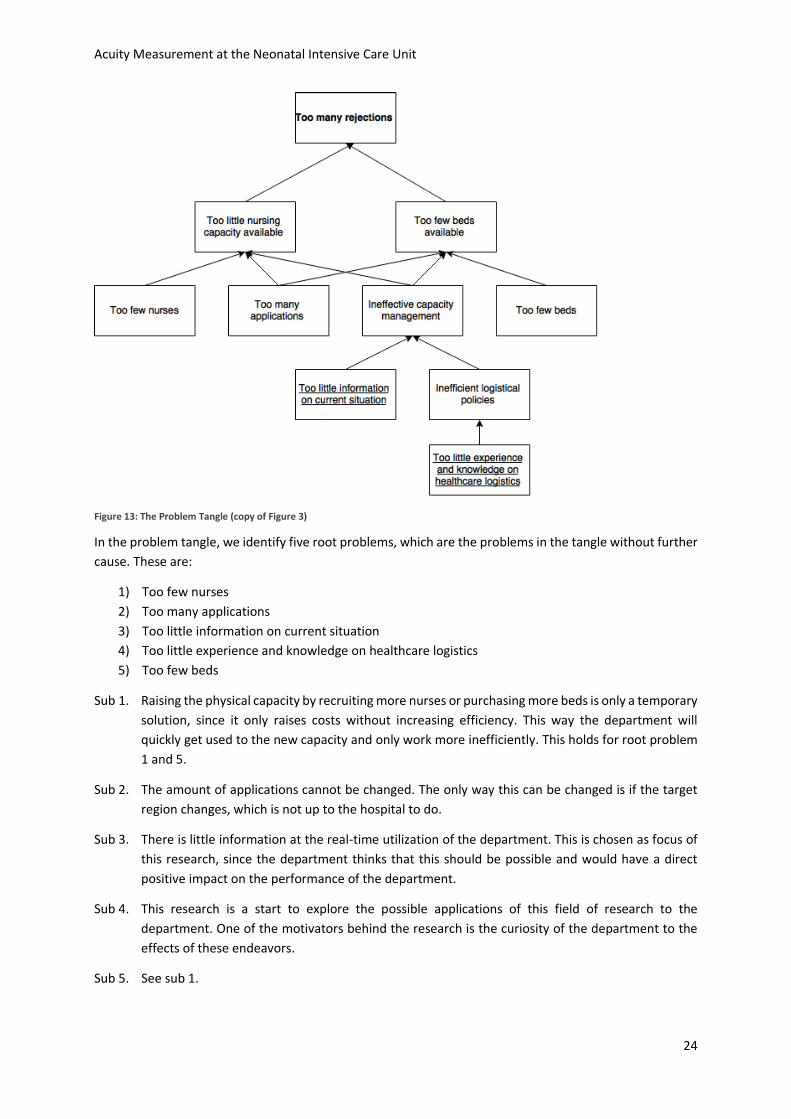
Figure 13: The Problem Tangle (copy of Figure 3)
In the problem tangle, we identify five root problems, which are the problems in the tangle without further
cause. These are:
1) Too few nurses
2) Too many applications
3) Too little information on current situation
4) Too little experience and knowledge on healthcare logistics
5) Too few beds
Sub 1. Raising the physical capacity by recruiting more nurses or purchasing more beds is only a temporary
solution, since it only raises costs without increasing efficiency. This way the department will
quickly get used to the new capacity and only work more inefficiently. This holds for root problem
1 and 5.
Sub 2. The amount of applications cannot be changed. The only way this can be changed is if the target
region changes, which is not up to the hospital to do.
Sub 3. There is little information at the real-time utilization of the department. This is chosen as focus of
this research, since the department thinks that this should be possible and would have a direct
positive impact on the performance of the department.
Sub 4. This research is a start to explore the possible applications of this field of research to the
department. One of the motivators behind the research is the curiosity of the department to the
effects of these endeavors.
Sub 5. See sub 1.

Acuity Measurement at the Neonatal Intensive Care Unit
25
Root problems 3 and 4 both lead to ineffective capacity management, which leads to either too few beds
or too little nursing capacity available. This leads to rejections. In other words, targeting the main problems
will lead to fewer rejections. The shortness of information on the current situation is described above as
shortcoming of performance indicators. These performance indicators can both on long and short term
improve operations. When the indicators are known, measurable and are benchmarked, the department
will be able to better inform their decisions regarding patient placement, nursing care capacity distribution.
Besides this will the information enable optimization and quantitative analysis.
This chapter introduced the neonatal department of the WKZ, and focused on the NICU in particular.
Organizing this specialized care is a complex process. Patient care is delivered by doctors and nurses, and
they have a large influence on the way in which that care is organized. Because the amount of rejections
was perceived as too high are we looking at the current performance of the department. Since the current
situation lacks a method to measure the nursing workload, which is required to benchmark the quality of
work, this research focuses on finding a method to do so and proving its value. This also highlights the value
of introducing knowledge on healthcare logistics on the NICU.
Acuity Measurement at the Neonatal Intensive Care Unit
26
3. The Neonatal Acuity-based Patient Scoring System In order to be able to measure the current workload on the NICU we need a measurement tool. This chapter
discusses how and why we created our own measurement system. Section 3.1 emphasizes the need to
measure workload and introduces possible types of measurement systems. Section 3.2 explains why there
are no existing models directly applicable to the WKZ’s NICU. Section 3.3 discusses our acuity system, the
factors we included, and the use of the system. We named our new system the Neonatal Acuity-based
Patient Scoring System (NAPSS).
3.1 Introduction and Literature on Acuity Systems To understand why we created our own measurement model, we need to explain three things: 1) Why do
we want to measure workload?, 2) Why are current systems not applicable?, and 3) How does our model
look like? The first question is answered in Chapter 2, but will be elaborated on some more throughout this
section. This section introduces Patient Classification Systems (PCSs) and Acuity Systems and emphasizes
the need to measure the nurses’ workload.
Chapter 2 concluded that being able to measure nursing care requirements could not only improve the
units’ performance on the short-term, but also enable tactical planning improvements. But how can this
requirement be measured? The amount of beds occupied is not a realistic measurement of the amount of
work during a certain shift, since the composition of the patients can differ a lot. This means that we need
to find a measure that classifies patients according to the intensity of the care they need.
This kind of system is called a Patient Classification System. A PCS is generally used for monitoring the use
of overtime, gathering data for utilization review, and providing necessary information for patient program
planning and monitoring quality improvement activities (Martorella, 1996). PCSs are generally divided into
two categories: prototype evaluation systems and factor evaluation systems (Van Slyck & Bermas, 1984).
Prototype evaluation systems are systems that use a characterization of the patient where the user can
choose between mutually exclusive and collectively exhaustive categories to categorize a patient. This may,
for example, be done by establishing the severity of the patient’s condition, or by measuring the hours of
care needed by nurses per day. Factor evaluation systems evaluate a set of patent indicators that determine
the intensity his condition and rate those indicators accordingly. A combination of these ratings, often
numeric, constitute a patient’s classification (Bigbee, Collins & Deeds, 1992).
Prototype evaluation systems benefit from the ease of use, and quickness of determining the patient
classification. A disadvantage is that they do not allow for a great level of detail, which results in a
measurement that is not very accurate. Factor evaluation systems perform just the other way around. Their
benefit is that they can include a lot of details, but can take a long time to use (Bigbee, Collins & Deeds,
1992). The choice of system depends on its intended purpose. Prototype evaluation systems carry sufficient
amount of detail for our cause, because we only need a reliable estimation of the nursing care requirements
per patient, not the details of these requirements. Because we do not want the use of the model to be too
much of a burden in itself, we only consider prototype evaluation systems.
Since we want to measure the workload on the work units, we can limit the scope of searching a PCS to
acuity systems. Patient acuity is defined by Harper and McCully (2007) as “the categorization of patients
according to an assessment of their nursing care requirements”. A system that uses these requirements to
classify patients can predict the total workload on the division, and thus help support patient placement
decisions.
Acuity Measurement at the Neonatal Intensive Care Unit
27
3.2 Must-have Features for Acuity Models by Garcia (2013) In order to qualify for the selection for the WKZ, models need to meet certain prerequisites. Garcia
(2013), identifies 10 must-have features for acuity models. A model can be implemented if it possesses
all these features. Which one of the models is most suited for the WKZ is based on selection criteria.
Section 3.3 discusses this.
1. Reliable & Objective. When determining the nursing care requirements, it should be noted that not
all nurses have the same productivity or the same interpretation of whether a shift is busy or not.
Acuity models should provide objective scores, resulting in a reliable measurement of the nursing
care requirements.
2. Valid. The results of an acuity model should accurately represent the nurses’ workload. If the model
indicates a busy shift, the observed situation should be busy too. This can be tested by correlating
the scores with the nurses’ perception of workload that shift.
3. Patient-centered. The acuity model should include all nursing time required to address all care
needed by a patient.
4. Efficient. Using the system should not take too much time.
5. Inclusive and Collaborative. Information from other departments should be present and used to
help the scoring.
6. Aligned. The results from the scores should be aligned with the actual length of stay and in the long
run be a reliable forecast of remaining length of stay.
7. Predictive. Knowing the total acuity on the unit can help predict nursing care requirements.
8. Outcomes driven. The model should be able to alarm irregular patient behavior
9. Actionable. The acuity model should be updated when necessary and provide up to date
information.
10. Informative. Long-term trends and data should be derived from the model to improve the value of
the model. Examples of these trends are nursing care requirements throughout the year to help
plan vacation days or extra staffing, estimate the financial value of one hour of nursing care, and
benchmark nurses’ performance.
3.3 Evaluation of Existing Models Now that we have seen that we need to find an acuity system to measure the nursing care requirements,
we can explore the requirements of the NICU and match them to known acuity models. This section
describes this process. First the system requirements are stated, after which several existing acuity models
are presented. When scoring the systems to the WKZ’s requirements, no system is found to promise a
sufficient performance for the WKZ’s NICU.
3.3.1 Suitability Criteria
The acuity model we want to use for measuring the current state of the NICU and representing the system
in a simulation model needs to fulfill a couple of criteria, which are:
1) Accurately representing the complete neonatal nursing care requirements (inclusive)
2) Easy to use
3) Applicable to the entire perinatal division
4) Quantifiable
These criteria were derived from discussions with the problem owners.
Sub 1. The first criterion, that the system must be inclusive of all relevant factors, is important because
the WKZ wants to be able to identify the amount of work required of a nurse to handle a [atient
Acuity Measurement at the Neonatal Intensive Care Unit
28
accurately. Acuity is not simply definable by clinical parameters, but all activities and disturbances
caused by a patient need to be taken into account, since it all feeds into the nurses’ perception of
work pressure. For instance, the time a nurse is busy with educational activities, since the WKZ is
an academic hospital, and the time spent communicating with the patients’ family are hard to
include in hard parameters. Harper and McCulley (2007), call these influences educational and
psychosocial factors.
Sub 2. The second criterion is that the acuity system needs to be easy to use. In order to gain acceptance
on the work floor, as well as not letting the model deteriorate the nurses’ productivity by
requesting too much time from them, it is important that the model is easy to use. A system that
uses hard data and already exists in a computer system works best for this, as it immediately
generates results. However, such a system does not fulfill the first criterion, since only clinical data
can be generated this way. This means that we need to find a model that uses little time from the
nurses, but still represent the entire nurses’ workload accurately. The threshold for this usage time
is unclear, but we eliminate extensive methods beforehand.
Sub 3. The third criterion is that the model needs to be applicable to the entire perinatal division. Models
that rely on clinical parameters need to be specialized for the IC, HC, and MC. We are looking for a
model that is either compatible with all divisions, or easily adaptable. The focus of this research is
the IC, but having all divisions of the neonatal department use the same measurement system can
enhance the holistic view of the department and enable planners to inform their decisions even
more.
Sub 4. Because we want to calculate not only the workload of one single patient, but also of units or entire
divisions, we want the acuity model to be quantifiable. This is the fourth criterion. if a classification
is given by the model, we want to know how it relates to other classifications in terms of ratios. The
model being quantifiable is also crucial for the purpose of making a simulation of the NICU.
3.3.2 Existing Acuity Models
Now that it is clear the WKZ’s requirements are for an acuity model, we can look for applicable systems
Papers reporting on potentially useful systems were searched using mostly Google Scholar, but also Scopus
and Web of Science were used. Search terms used were “neonatal”, “NICU”, “patient classification system”,
and “acuity”, in various combinations. This led to a very large amount of papers and researches, of which
we did a quick scan on which papers seemed usable based on their title. After this search, forward and
backward search from the usable papers led to the final paper selection. This resulted in 14 papers that
introduce new methods of measurement, or discuss the applicability of several methods.
Two models will prove to be relevant in the remainder of this research and are therefore elaborated on in
this section. The first system is the Winnipeg Assessment of Neonatal Nursing Needs Tool (WANNNT)
(Sawatzky-Dickson & Bodnaryk, 2009). This model works with six levels, each with its own criteria. The
highest level for which a patient matches one criterion will be the assigned class, and the authors identified
the amount of nurses it takes to take care of the patients of all six levels. The criteria are determined by
medical experts and the authors claim them to be collectively exhaustive. An example of this model is added
in Appendix A.
The second system is the PCS tool of Harper and McCulley (2007). They identify five criteria on which nurses
spend time. These five criteria are scored through predetermined identifiers, and the average of these
criteria is the category in which the patient is classified. The criteria are medication, complex procedures,
education, psychosocial, and intravenous medication. An example of this tool is added in Appendix B.
Acuity Measurement at the Neonatal Intensive Care Unit
29
The first one of the systems that were also considered is the Neonatal Acuity System (NAS) of Mullinax and
Lawley (2002). Almeida and Persson, 1998, discuss four models that are used on NICUs in Sweden. These
four models are:
The Neonatal Therapeutic Intervention Scoring System (NTISS) (Gray et al., 1992)
The NICU risk model (Horbar et al.,1993)
The Score for Neonatal acute Physiology (SNAP), (Richardson et al., 1993)
The Clinical Risk Index for Babies (CRIB) (Tarnow-Mordi et al., 1993)
How these models score on applicability will be shown in the next section, but since they prove to be
irrelevant for the remainder of this research are they not discussed in more detail.
3.3.3 Acuity Models Suitability
The previous sections discussed the model requirements for the WKZ and introduced several models that
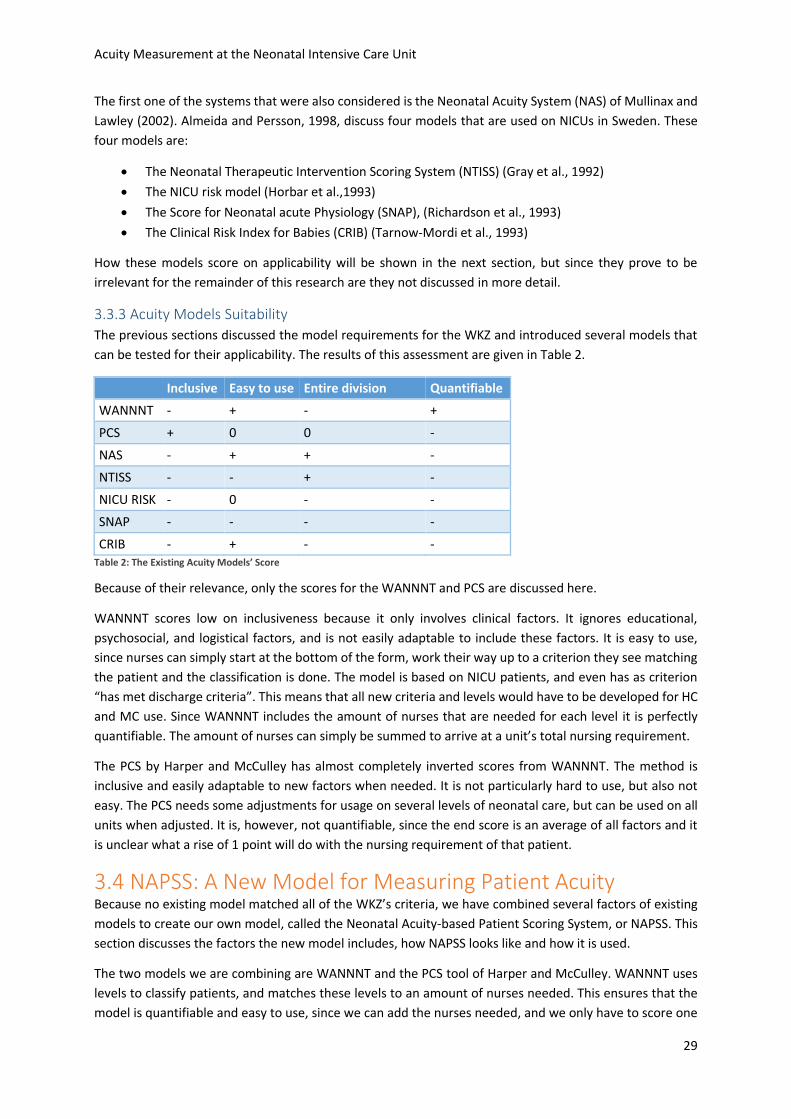
can be tested for their applicability. The results of this assessment are given in Table 2.
Inclusive Easy to use Entire division Quantifiable
WANNNT - + - +
PCS + 0 0 -
NAS - + + -
NTISS - - + -
NICU RISK - 0 - -
SNAP - - - -
CRIB - + - - Table 2: The Existing Acuity Models’ Score
Because of their relevance, only the scores for the WANNNT and PCS are discussed here.
WANNNT scores low on inclusiveness because it only involves clinical factors. It ignores educational,
psychosocial, and logistical factors, and is not easily adaptable to include these factors. It is easy to use,
since nurses can simply start at the bottom of the form, work their way up to a criterion they see matching
the patient and the classification is done. The model is based on NICU patients, and even has as criterion
“has met discharge criteria”. This means that all new criteria and levels would have to be developed for HC
and MC use. Since WANNNT includes the amount of nurses that are needed for each level it is perfectly
quantifiable. The amount of nurses can simply be summed to arrive at a unit’s total nursing requirement.
The PCS by Harper and McCulley has almost completely inverted scores from WANNNT. The method is
inclusive and easily adaptable to new factors when needed. It is not particularly hard to use, but also not
easy. The PCS needs some adjustments for usage on several levels of neonatal care, but can be used on all
units when adjusted. It is, however, not quantifiable, since the end score is an average of all factors and it
is unclear what a rise of 1 point will do with the nursing requirement of that patient.
3.4 NAPSS: A New Model for Measuring Patient Acuity Because no existing model matched all of the WKZ’s criteria, we have combined several factors of existing
models to create our own model, called the Neonatal Acuity-based Patient Scoring System, or NAPSS. This
section discusses the factors the new model includes, how NAPSS looks like and how it is used.
The two models we are combining are WANNNT and the PCS tool of Harper and McCulley. WANNNT uses
levels to classify patients, and matches these levels to an amount of nurses needed. This ensures that the
model is quantifiable and easy to use, since we can add the nurses needed, and we only have to score one
Acuity Measurement at the Neonatal Intensive Care Unit
30
number. The PCS tool of Harper and McCulley identifies criteria to be taken into account when scoring.
These criteria are originally individually scored and added, weighted equally.
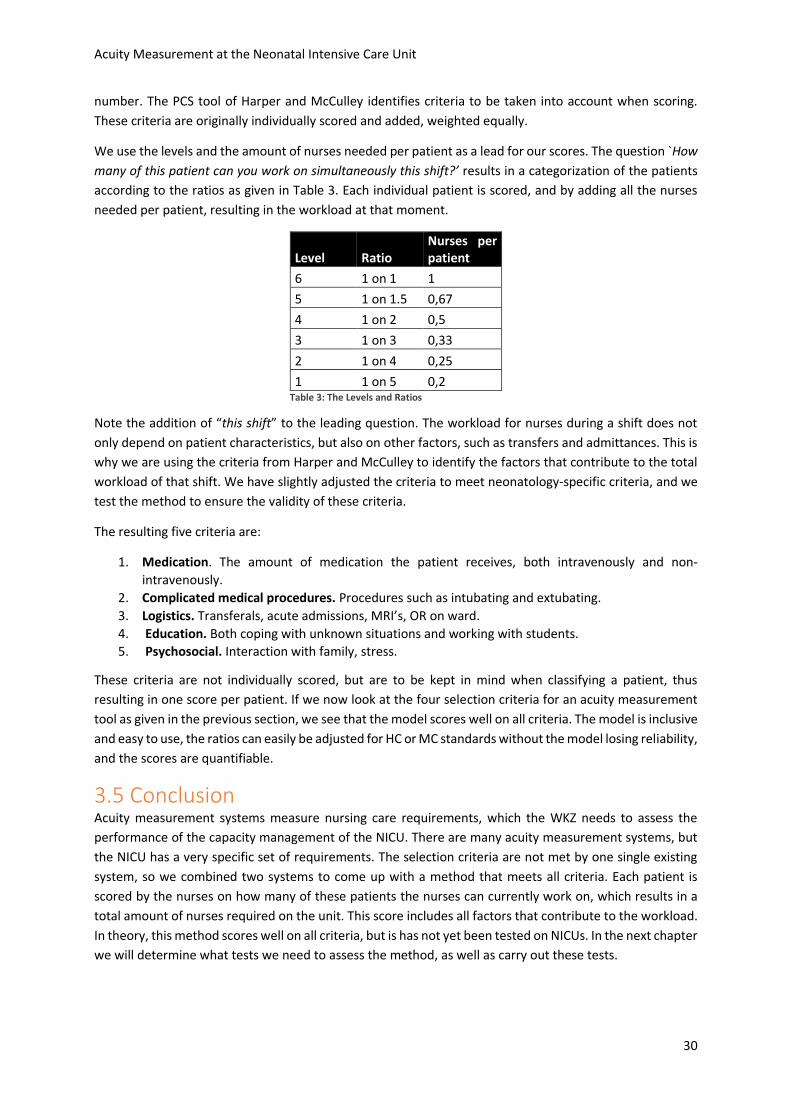
We use the levels and the amount of nurses needed per patient as a lead for our scores. The question `How
many of this patient can you work on simultaneously this shift?’ results in a categorization of the patients
according to the ratios as given in Table 3. Each individual patient is scored, and by adding all the nurses
needed per patient, resulting in the workload at that moment.
Level Ratio Nurses per patient
6 1 on 1 1
5 1 on 1.5 0,67
4 1 on 2 0,5
3 1 on 3 0,33
2 1 on 4 0,25
1 1 on 5 0,2 Table 3: The Levels and Ratios
Note the addition of “this shift” to the leading question. The workload for nurses during a shift does not
only depend on patient characteristics, but also on other factors, such as transfers and admittances. This is
why we are using the criteria from Harper and McCulley to identify the factors that contribute to the total
workload of that shift. We have slightly adjusted the criteria to meet neonatology-specific criteria, and we
test the method to ensure the validity of these criteria.
The resulting five criteria are:
1. Medication. The amount of medication the patient receives, both intravenously and non-
intravenously.
2. Complicated medical procedures. Procedures such as intubating and extubating.
3. Logistics. Transferals, acute admissions, MRI’s, OR on ward.
4. Education. Both coping with unknown situations and working with students.
5. Psychosocial. Interaction with family, stress.
These criteria are not individually scored, but are to be kept in mind when classifying a patient, thus
resulting in one score per patient. If we now look at the four selection criteria for an acuity measurement
tool as given in the previous section, we see that the model scores well on all criteria. The model is inclusive
and easy to use, the ratios can easily be adjusted for HC or MC standards without the model losing reliability,
and the scores are quantifiable.
3.5 Conclusion Acuity measurement systems measure nursing care requirements, which the WKZ needs to assess the
performance of the capacity management of the NICU. There are many acuity measurement systems, but
the NICU has a very specific set of requirements. The selection criteria are not met by one single existing
system, so we combined two systems to come up with a method that meets all criteria. Each patient is
scored by the nurses on how many of these patients the nurses can currently work on, which results in a
total amount of nurses required on the unit. This score includes all factors that contribute to the workload.
In theory, this method scores well on all criteria, but is has not yet been tested on NICUs. In the next chapter
we will determine what tests we need to assess the method, as well as carry out these tests.
Acuity Measurement at the Neonatal Intensive Care Unit
31
4. Model Experiments Chapter 3 introduced our acuity model. Before this model can be used we should assess the feasibility of
using the model in practice. This chapter follows a couple of steps to assess the model. Section 4.1
introduces ten must-have features for acuity models, and evaluates NAPSS on basis of these features. Three
features are not easily assumed to be features of NAPSS and need to be tested. These features are
alignment, reliability, and validity. Section 4.2 elaborates on these features and introduces tests associated
with these feature: pairwise comparison, Cohen’s kappa, Pearson’s r, and a Markov chain analysis. Section
4.3 explains how these tests are executed and how we use the test results to assess the model. All tests
score within a range from sufficient to very good, so we conclude the model to be feasible to use.
4.1 Model Tests When assessing the model, we need to test several properties of the model. This section discusses 10 must-
have features identified by Garcia (2013) that all acuity systems should have. For seven of these features
do we argue why the model scores sufficiently, for the other three features why additional testing is
required.
4.1.1 Sufficient Features
Seven features are assumed to be sufficiently present in our acuity model. What these features are and
how each feature is included in our acuity model is discussed below.
Patient-centered. NAPSS includes all nursing time required to address all care needed for a patient
in the total nursing care required ratios.
Efficient. The use of NAPSS is simply one score per patient and updating the status will take little
time.
Inclusive and Collaborative. It is very well possible when the HC and MC are included in the system
that the information from other departments is implemented in the system to raise the quality of
the information.
Predictive. The total score from NAPSS can indicate the number of nurses that are needed at any
time.
Outcome driven. NAPSS will be able to compare average scores and length of stay from patients to
individual patients. When the score of an individual patient is an outlier, the model can recognize
this and notify the nurses.
Actionable. NAPSS can be updated and rescored at any moment.
Informative. By keeping track of the scores in NAPSS, trends can be discovered and analyzed. Busy
periods and quiet periods can be predicted, and the value of extra hours of nursing capacity
available can be derived.
4.1.2 Features That Have to Be Tested
Three features are not immediatly assumed to be sufficiently represented in our acuity model. What these
features are and how they can be tested is discussed below. Section 4.2 will further discuss these tests.
Aligned. This can be tested by creating a transition diagram in which for all scores the chance of
transitioning to another score the next shift is given. A Markov chain analysis can predict the length
of stay and thus the alignment of the scores and the predicted situation. Appendix E explains and
executes this analysis.
Acuity Measurement at the Neonatal Intensive Care Unit
32
Reliable & Objective. This can be tested by comparing the individual scores of nurses for the same
observed patients to each other. These comparisons are called pairwise comparisons and are
further discussed in Section 4.2.2.
Valid. This can be tested by correlating the scores with the nurses’ perception of workload that
shift. Section 4.2.3 discusses and tests validity in more detail.
4.2 Alignment, Reliability, and Validity tests Because three necessary features for acuity models are not directly assumed to be present in NAPSS these
are to be tested. This section elaborates more on these features (alignment, reliability, and validity) and
introduces tests on how to prove the presence of these features.
4.2.1 Alignment
As seen in Section 4.1.2, alignment is the extent to which the results of the acuity model agree with the
actual performance of the department. The average length of stay of patients is one way to compare these
two situations, and will in this report be used to assess the alignment. The method that is used to make this
comparison is performing a Markov chain analysis.
A Markov chain is a process that can be represented by states, where each state has a probability of
transitioning into the other states. Our Markov chain has the absorbing characteristic, meaning that one of
the states has the property that once that state is reached, you will not leave (Winston, 2004). For us,
leaving the NICU is the absorbing state. In reality, patients can return to the NICU, which is represented by
a new entry in the system.
For an absorbing Markov chain it can be calculated what the average amount of steps is before the
absorbing state will be reached. Translated to the NICU we can find the average amount of nurses’ shifts it
will take on average for patients to leave the NICU. Section 4.3.2 shows these calculations and the Markov
representation of our system.
4.2.2 Reliability
There is a couple of ways in which reliability can been measured. The reliability of the acuity model is also
called inter-rater agreement, which simply means the degree to which two separate raters perceive the
subject identically. Graham et al. (2012) identify three ways to measure inter-rater agreement, which are
Cohen’s Kappa, Intra-class correlation (ICC), and the percentage of absolute agreement.
Cohen’s Kappa is a statistical test that compares two forms and assesses the probability that two raters rate
the same subject. This is done by looking at the amount of options a rater has, which results in a probability
that two raters accidentally agree, and the amount of subjects that are rated. When scoring high above the
probability of accidental agreement, the test indicates a significant reliability. For instance, when two
people rate the same number when having 100 options to choose from, the probability is lower than when
choosing from 10 options, and agreeing once can be chance, but agreeing multiple times is a sign of
reliability. Cohen’s kappa can only be used to compare individuals, so it is not a good measure to use on a
large scale. The number of comparisons will be low, but can be used to identify personal differences and
possible outliers, positive or negative. The test works with a level of significance, which we set at 5%.
The ICC depends on the variation of the observations. However, since the mean score of all subjects is
different, the variation of the observations cannot easily be generalized. This means that this test is not
suitable for our purpose.
The percentage of absolute agreement is simply the comparison of all individual observations of the same
subjects. The percentage that these observations agree is the outcome of this measure. An example for
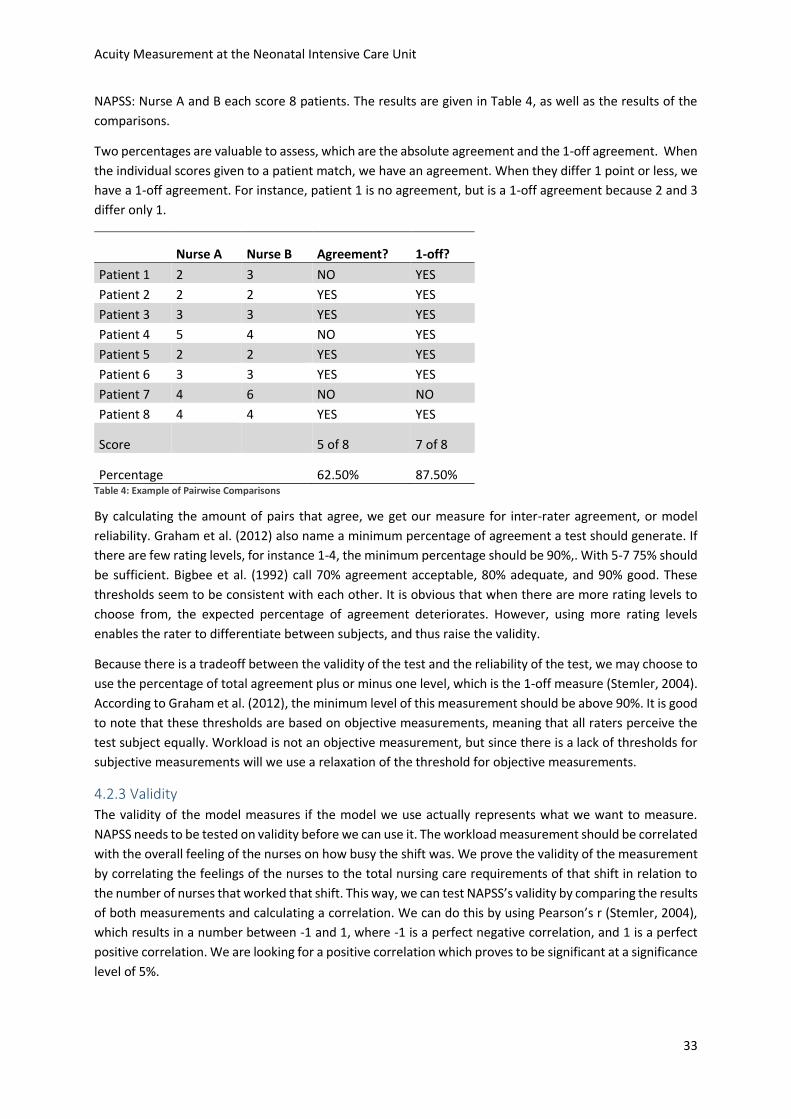
Acuity Measurement at the Neonatal Intensive Care Unit
33
NAPSS: Nurse A and B each score 8 patients. The results are given in Table 4, as well as the results of the
comparisons.
Two percentages are valuable to assess, which are the absolute agreement and the 1-off agreement. When
the individual scores given to a patient match, we have an agreement. When they differ 1 point or less, we
have a 1-off agreement. For instance, patient 1 is no agreement, but is a 1-off agreement because 2 and 3
differ only 1.
Nurse A Nurse B Agreement? 1-off?
Patient 1 2 3 NO YES
Patient 2 2 2 YES YES
Patient 3 3 3 YES YES
Patient 4 5 4 NO YES
Patient 5 2 2 YES YES
Patient 6 3 3 YES YES
Patient 7 4 6 NO NO
Patient 8 4 4 YES YES
Score
5 of 8 7 of 8
Percentage
62.50% 87.50% Table 4: Example of Pairwise Comparisons
By calculating the amount of pairs that agree, we get our measure for inter-rater agreement, or model
reliability. Graham et al. (2012) also name a minimum percentage of agreement a test should generate. If
there are few rating levels, for instance 1-4, the minimum percentage should be 90%,. With 5-7 75% should
be sufficient. Bigbee et al. (1992) call 70% agreement acceptable, 80% adequate, and 90% good. These
thresholds seem to be consistent with each other. It is obvious that when there are more rating levels to
choose from, the expected percentage of agreement deteriorates. However, using more rating levels
enables the rater to differentiate between subjects, and thus raise the validity.
Because there is a tradeoff between the validity of the test and the reliability of the test, we may choose to
use the percentage of total agreement plus or minus one level, which is the 1-off measure (Stemler, 2004).
According to Graham et al. (2012), the minimum level of this measurement should be above 90%. It is good
to note that these thresholds are based on objective measurements, meaning that all raters perceive the
test subject equally. Workload is not an objective measurement, but since there is a lack of thresholds for
subjective measurements will we use a relaxation of the threshold for objective measurements.
4.2.3 Validity
The validity of the model measures if the model we use actually represents what we want to measure.
NAPSS needs to be tested on validity before we can use it. The workload measurement should be correlated
with the overall feeling of the nurses on how busy the shift was. We prove the validity of the measurement
by correlating the feelings of the nurses to the total nursing care requirements of that shift in relation to
the number of nurses that worked that shift. This way, we can test NAPSS’s validity by comparing the results
of both measurements and calculating a correlation. We can do this by using Pearson’s r (Stemler, 2004),
which results in a number between -1 and 1, where -1 is a perfect negative correlation, and 1 is a perfect
positive correlation. We are looking for a positive correlation which proves to be significant at a significance
level of 5%.
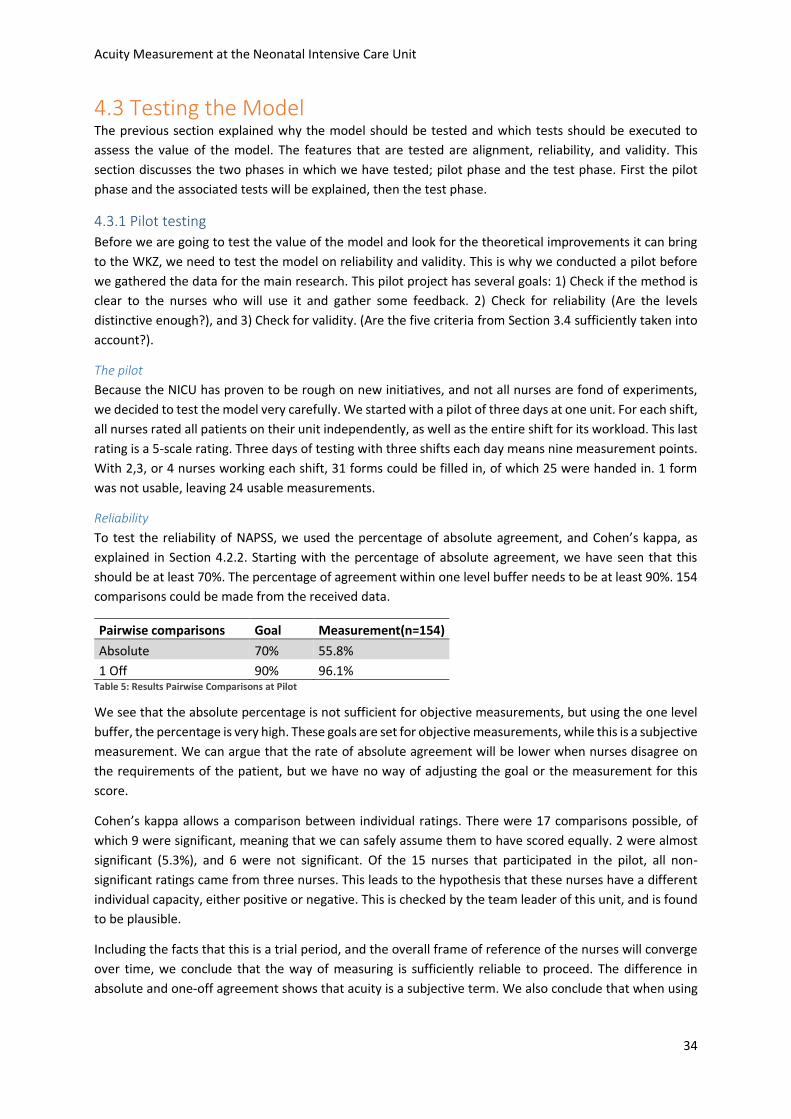
Acuity Measurement at the Neonatal Intensive Care Unit
34
4.3 Testing the Model The previous section explained why the model should be tested and which tests should be executed to
assess the value of the model. The features that are tested are alignment, reliability, and validity. This
section discusses the two phases in which we have tested; pilot phase and the test phase. First the pilot
phase and the associated tests will be explained, then the test phase.
4.3.1 Pilot testing
Before we are going to test the value of the model and look for the theoretical improvements it can bring
to the WKZ, we need to test the model on reliability and validity. This is why we conducted a pilot before
we gathered the data for the main research. This pilot project has several goals: 1) Check if the method is
clear to the nurses who will use it and gather some feedback. 2) Check for reliability (Are the levels
distinctive enough?), and 3) Check for validity. (Are the five criteria from Section 3.4 sufficiently taken into
account?).
The pilot
Because the NICU has proven to be rough on new initiatives, and not all nurses are fond of experiments,
we decided to test the model very carefully. We started with a pilot of three days at one unit. For each shift,
all nurses rated all patients on their unit independently, as well as the entire shift for its workload. This last
rating is a 5-scale rating. Three days of testing with three shifts each day means nine measurement points.
With 2,3, or 4 nurses working each shift, 31 forms could be filled in, of which 25 were handed in. 1 form
was not usable, leaving 24 usable measurements.
Reliability
To test the reliability of NAPSS, we used the percentage of absolute agreement, and Cohen’s kappa, as
explained in Section 4.2.2. Starting with the percentage of absolute agreement, we have seen that this
should be at least 70%. The percentage of agreement within one level buffer needs to be at least 90%. 154
comparisons could be made from the received data.
Pairwise comparisons Goal Measurement(n=154)
Absolute 70% 55.8%
1 Off 90% 96.1% Table 5: Results Pairwise Comparisons at Pilot
We see that the absolute percentage is not sufficient for objective measurements, but using the one level
buffer, the percentage is very high. These goals are set for objective measurements, while this is a subjective
measurement. We can argue that the rate of absolute agreement will be lower when nurses disagree on
the requirements of the patient, but we have no way of adjusting the goal or the measurement for this
score.
Cohen’s kappa allows a comparison between individual ratings. There were 17 comparisons possible, of
which 9 were significant, meaning that we can safely assume them to have scored equally. 2 were almost
significant (5.3%), and 6 were not significant. Of the 15 nurses that participated in the pilot, all non-
significant ratings came from three nurses. This leads to the hypothesis that these nurses have a different
individual capacity, either positive or negative. This is checked by the team leader of this unit, and is found
to be plausible.
Including the facts that this is a trial period, and the overall frame of reference of the nurses will converge
over time, we conclude that the way of measuring is sufficiently reliable to proceed. The difference in
absolute and one-off agreement shows that acuity is a subjective term. We also conclude that when using
Acuity Measurement at the Neonatal Intensive Care Unit
35
the model, when one person will rate for the entire team, the rater is carefully chosen to be representable
for all the team members in terms of individual capacity.
Validity
The validity is tested in order to know that we actually measure the workload. Because workload is an
interpretation by each individual nurse, it is a subjective term. We asked each participant to rate the
workload of the shift on a five point scale, ranging from very quiet to very busy. We used this to correlate
the acuity score to. The acuity score is measured in the following way. Each nurse scored all patients
according to the ratios. We add the amount of nurses required, resulting in a total amount of nurses
required. Once we divide that with the amount of nurses that are present that shift, we get a measurement
of nurse utilization.
Nurse utilization = number of nurses required / number of nurses present
When measuring the acuity, the nurse utilization should be correlated to the nurses’ individual rating of the
shift. We found this to be significant during the pilot period, with a correlation score of 0.445 and a
significance of 2.9%. The correlation score indicates the effect of changing one score on the result of the
other, and the significance is the measure for certainty of assuming the correlation to be present. We
assume scores <5% to be sufficient. We used Pearson’s r for this test, in IBM SPSS Statistics 22.
4.3.2 Test period
The main goal of the pilot project was to see how the nurses would handle the measurement system, and
to test the system for its reliability and validity. The results were evaluated, and some feedback from the
nurses was used to change the way the model was introduced and explained. The model itself did not need
any adjustments, so we started the two-weeks test period. One of the goals of the test period is to gather
data for the simulation of Chapter 5. In addition to serving as input for this, the test period will be used for
some empirical analyses. In this section, we will first explain the test in more detail, then discuss the
feedback from the nurses when using the model for a longer period of time, and repeat the tests done at
the pilot for a larger test group.
The Test Period
During a two week period, all available nurses on all three units measured their acuity every shift. This
results in a maximum number of single patient observations of 3024, where every observation is made on
average by four nurses, having 1008 unique patient scores. During these two weeks, all nurses filled in the
same form as during the test period. Some shifts forgot to measure, some individual nurses forgot or were
otherwise occupied, which resulted in 1248 observations of which 533 were unique patient scores. 68
nurses in total participated in the test.
Feedback
At the bottom of the form the nurses used to score the patients was an open box for thoughts and
suggestions. Remarkable was that a lot of nurses wrote down why that shift was busy or not. This created
a list of events that contribute to the acuity of the unit. We see that all factors were listed as causes for a
high acuity, except for complicated medical procedures. This is explained by the fact that both medicine
and complicated medical procedures are automatically included in the patient categorization by the nurse,
while the other factors are not directly patient related.
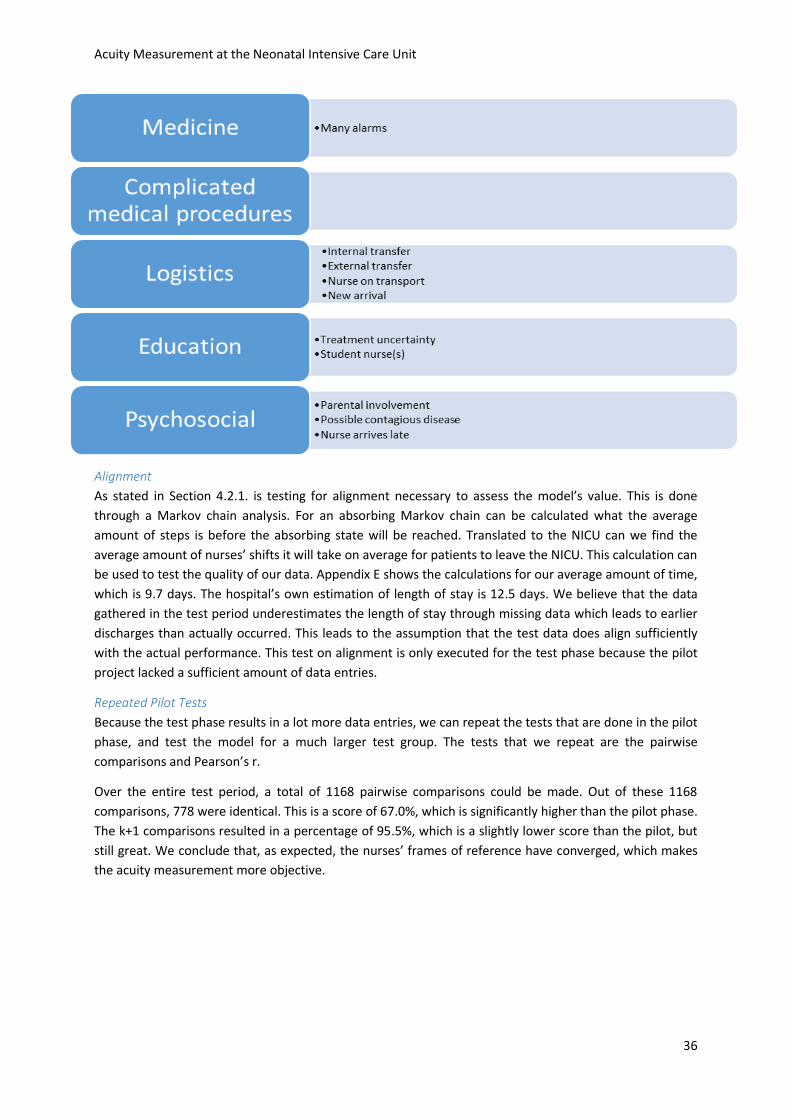
Acuity Measurement at the Neonatal Intensive Care Unit
36
Alignment
As stated in Section 4.2.1. is testing for alignment necessary to assess the model’s value. This is done
through a Markov chain analysis. For an absorbing Markov chain can be calculated what the average
amount of steps is before the absorbing state will be reached. Translated to the NICU can we find the
average amount of nurses’ shifts it will take on average for patients to leave the NICU. This calculation can
be used to test the quality of our data. Appendix E shows the calculations for our average amount of time,
which is 9.7 days. The hospital’s own estimation of length of stay is 12.5 days. We believe that the data
gathered in the test period underestimates the length of stay through missing data which leads to earlier
discharges than actually occurred. This leads to the assumption that the test data does align sufficiently
with the actual performance. This test on alignment is only executed for the test phase because the pilot
project lacked a sufficient amount of data entries.
Repeated Pilot Tests
Because the test phase results in a lot more data entries, we can repeat the tests that are done in the pilot
phase, and test the model for a much larger test group. The tests that we repeat are the pairwise
comparisons and Pearson’s r.
Over the entire test period, a total of 1168 pairwise comparisons could be made. Out of these 1168
comparisons, 778 were identical. This is a score of 67.0%, which is significantly higher than the pilot phase.
The k+1 comparisons resulted in a percentage of 95.5%, which is a slightly lower score than the pilot, but
still great. We conclude that, as expected, the nurses’ frames of reference have converged, which makes
the acuity measurement more objective.
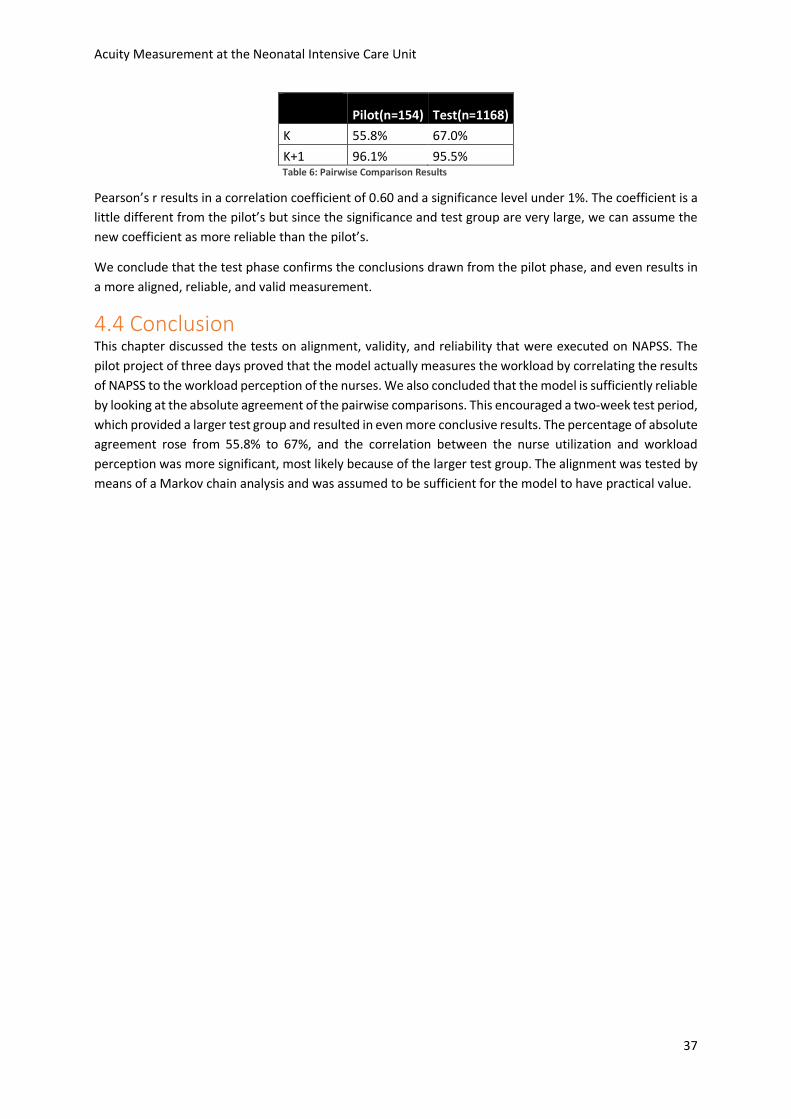
Acuity Measurement at the Neonatal Intensive Care Unit
37
Pilot(n=154) Test(n=1168)
K 55.8% 67.0%
K+1 96.1% 95.5% Table 6: Pairwise Comparison Results
Pearson’s r results in a correlation coefficient of 0.60 and a significance level under 1%. The coefficient is a
little different from the pilot’s but since the significance and test group are very large, we can assume the
new coefficient as more reliable than the pilot’s.
We conclude that the test phase confirms the conclusions drawn from the pilot phase, and even results in
a more aligned, reliable, and valid measurement.
4.4 Conclusion This chapter discussed the tests on alignment, validity, and reliability that were executed on NAPSS. The
pilot project of three days proved that the model actually measures the workload by correlating the results
of NAPSS to the workload perception of the nurses. We also concluded that the model is sufficiently reliable
by looking at the absolute agreement of the pairwise comparisons. This encouraged a two-week test period,
which provided a larger test group and resulted in even more conclusive results. The percentage of absolute
agreement rose from 55.8% to 67%, and the correlation between the nurse utilization and workload
perception was more significant, most likely because of the larger test group. The alignment was tested by
means of a Markov chain analysis and was assumed to be sufficient for the model to have practical value.
Acuity Measurement at the Neonatal Intensive Care Unit
38
5. Simulation Experiments Now that NAPSS is tested for feasibility and practical use is it necessary to research the practical value of
using the model. This chapter introduces discrete event simulation and describes how experimenting within
such a simulation model is used as a quantitative analysis method. Section 5.1 introduces simulation models
and explains why discrete event simulation is used in this research. Section 5.2 describes our simulation
model and the decisions made to create the model. Section 5.3 describes the experiments done in the
simulation. Section 5.4 shows the results of the experiments and analyzes the outcomes. The experiments
show a tradeoff between utilization and patient rejections, for which the application of the acuity
measurement model helps to align the department’s strategy for this tradeoff with the actual performance
of the department.
5.1 Introduction Simulation Acuity measurement allows us to gather data over a longer period of time, which was not possible before.
In this research, this data is enables a discrete event simulation model in which experiments can be run on
several policy decisions regarding patient placement. This includes the choice to base the decision on acuity,
not on beds available, but also which unit to place the new patient and the acuity level to fill the units. The
factors addressed in the experiments directly affect the amount of refusals and overloaded days, which are
the problems this research aims to solve. Chapter 6 discusses several other options that can now be
researched and may prove to be valuable to the NICU, but are outside the scope of this research.
In the simulation, the NICU is represented as a system of processing units and buffers, which together form
the path a patient follows throughout his stay. This is called the simulation model. This model is based on a
set of assumptions that Section 5.2 elaborates on to represent the real world system as accurately as
possible within a certain level of detail. The computer evaluates this model numerically, and gathered data
is used to estimate the desired true characteristics of the model (Law, 2007). By changing input parameters
or policies, we can forecast the effect of possible changes in the represented system. The forecasts will
always be at best an estimation of the effects, but simulation has proven to be a reliable method, provided
that the model is a reliable representation of the real system.
Within healthcare it is especially hard to experiment with system settings in real life. There is always a risk
of failure, and the consequences can be enormous. On the NICU, these risks can mean life or death for the
patients. This is why simulation is an appropriate way to experiment for the NICU. With a certain level of
significance, simulation can statistically compare two scenarios, and forecast the risks and perks. This
research uses the simulation software Technomatix Plant Simulation 11. This is a discrete event simulation
tool, which means that the simulation follows a sequence of events based on the input parameters, and the
system changes its state event by event.
There are many other ways to do quantitative analysis on these kind of systems, but discrete event
simulation proved to be the most convenient method for this research. The experiments that are done,
which are explained in Section 5.3, involve changes in work policy. Simulation works excellently with these
kinds of experiments, since the system is modelled and programmed through coding, which allows these
types of changes in the system to be made. Markov chain analysis, for instance, works well for numerical
changes in, for instance, processing time or number of processing units and analyzing the effects on the
other parameters. When looking for an optimal number of nurses, beds, hours of overtime, or expected
Acuity Measurement at the Neonatal Intensive Care Unit
39
casualties, integer programming seem to be a very suitable method as well. However, this method does
hardly allow policy changes and is therefore less applicable for this research.
Law (2007) describes a 10 step plan to create a sound simulation study. These steps are all present in this
documentation:
1) Formulate the problem and plan the study.
The goals of the simulation are given in the Section 5.2.1 as part of the conceptual model.
2) Collect data and define a model.
The conceptual model includes the process-flow diagram and flowcharts, as well as the summaries
of the input data.
3) Is the assumptions document valid?
The model has a low level of complexity, which strengthens the validity of the assumptions, since
there are only few to be made. The process-flow diagram and flowcharts are checked by the
problem-owners.
4) Construct a computer program and verify.
See Figure 17 for a screenshot of the program.
5) Make pilot runs.
This is done, and the results of the pilot runs are used in Section 5.4.2 for the purpose of checking
the validity and compared to the expected values.
6) Is the programmed model valid?
The pilot runs are shown, including the animation, to the supervisors. Section 5.4.6 also describes
the sensitivity analysis that will prove the robustness of the conclusions.
7) Design experiments.
Section 5.3 describes all experiments conducted with the program.
8) Make production runs.
The outputs from one experiment are given in Appendix C as illustration.
9) Analyze output data.
This is done in Section 5.4.
10) Document, present, and use results.
5.2 Conceptual Model The basis of the simulation is the conceptual model, also called the assumptions document. The conceptual
model contains the documentation of all model concepts, assumptions, algorithms, and data summaries
(Law, 2007). Following Law, the following section will elaborate on all of these points.
5.2.1 Simulation goals
As mentioned in Section 5.1, the goal of the simulation is to compare several policy decisions regarding
patient admission and placement. The first comparison will be that of basing admission decisions on acuity,
rather than on beds available. In addition, we want to analyze the effect of changing the threshold on
patient admissions on refusals and acuity overload. Finally, we want to compare different methods of
distributing for patients over the three units, comparing an even distribution with a largest-gap method.
These experiments will be discussed further in the next section.
The output of the simulation will be the number of refusals during the run, the number of shifts during
which there is an acuity overload, and the average occupation. Although the amount of refusals is
correlated with the average occupation, both outputs are necessary to analyze. The amount of refusals is a
measure of quality of care, and the average occupation directly translates into the department’s
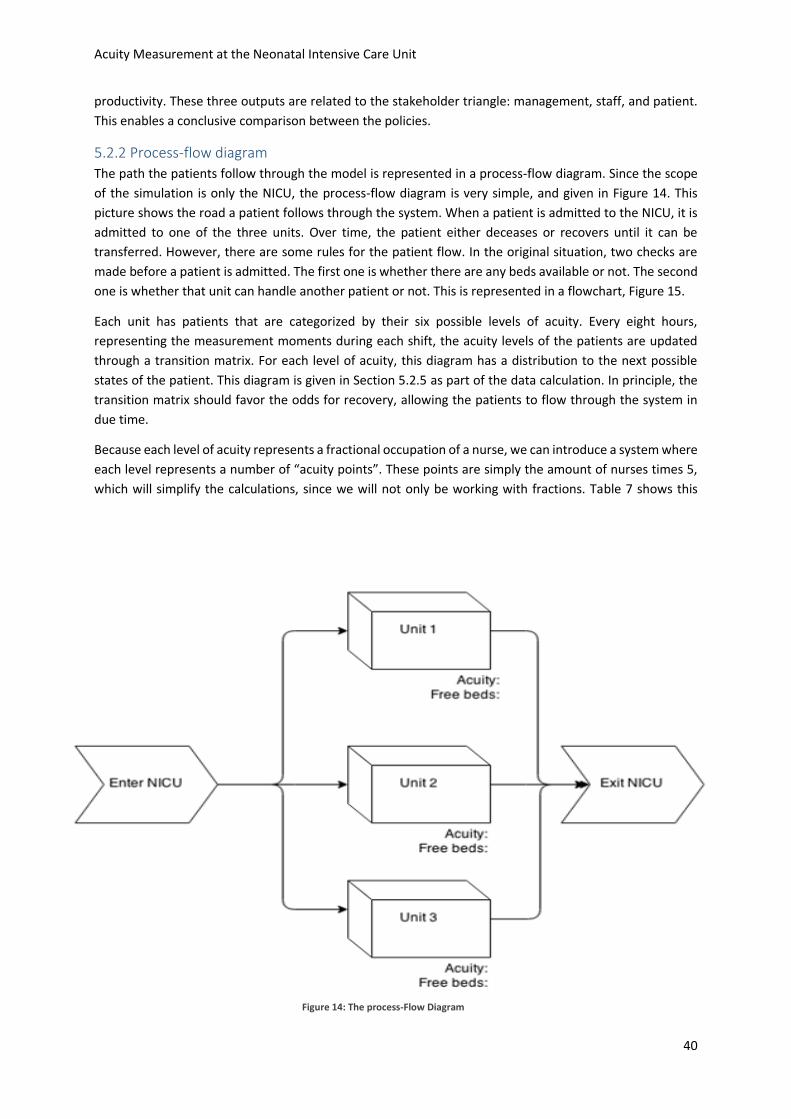
Acuity Measurement at the Neonatal Intensive Care Unit
40
productivity. These three outputs are related to the stakeholder triangle: management, staff, and patient.
This enables a conclusive comparison between the policies.
5.2.2 Process-flow diagram
The path the patients follow through the model is represented in a process-flow diagram. Since the scope
of the simulation is only the NICU, the process-flow diagram is very simple, and given in Figure 14. This
picture shows the road a patient follows through the system. When a patient is admitted to the NICU, it is
admitted to one of the three units. Over time, the patient either deceases or recovers until it can be
transferred. However, there are some rules for the patient flow. In the original situation, two checks are
made before a patient is admitted. The first one is whether there are any beds available or not. The second
one is whether that unit can handle another patient or not. This is represented in a flowchart, Figure 15.
Each unit has patients that are categorized by their six possible levels of acuity. Every eight hours,
representing the measurement moments during each shift, the acuity levels of the patients are updated
through a transition matrix. For each level of acuity, this diagram has a distribution to the next possible
states of the patient. This diagram is given in Section 5.2.5 as part of the data calculation. In principle, the
transition matrix should favor the odds for recovery, allowing the patients to flow through the system in
due time.
Because each level of acuity represents a fractional occupation of a nurse, we can introduce a system where
each level represents a number of “acuity points”. These points are simply the amount of nurses times 5,
which will simplify the calculations, since we will not only be working with fractions. Table 7 shows this
Figure 14: The process-Flow Diagram
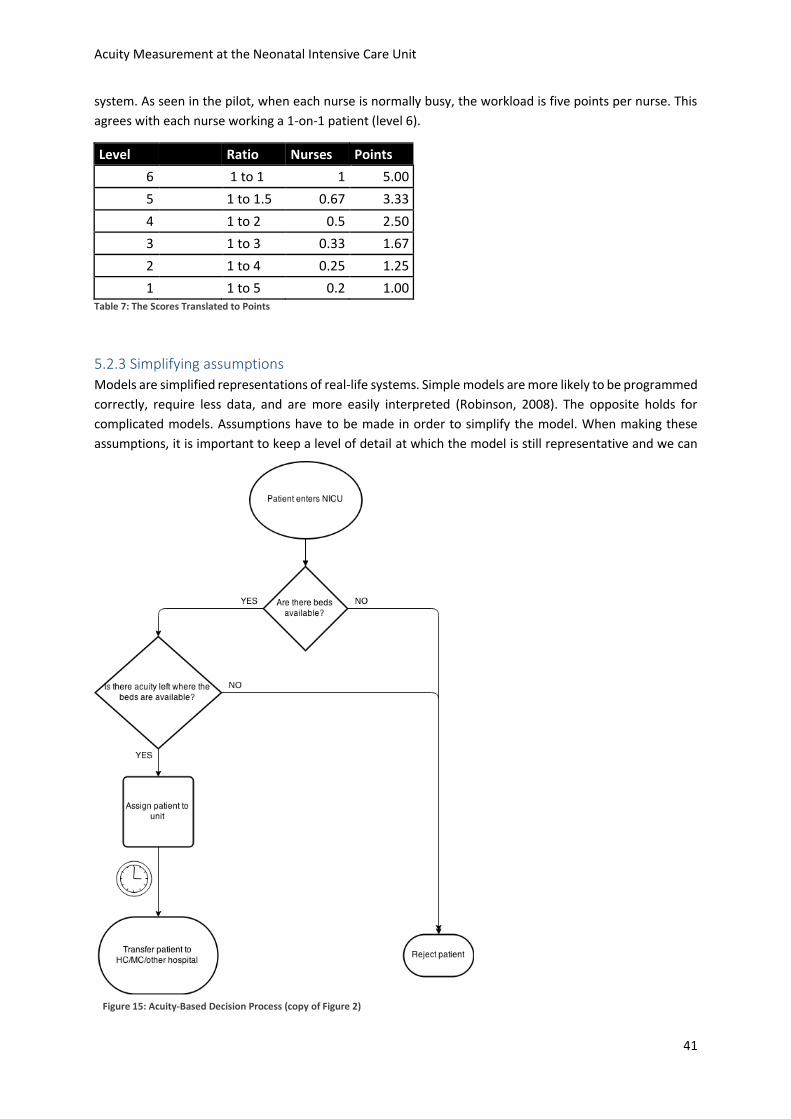
Acuity Measurement at the Neonatal Intensive Care Unit
41
system. As seen in the pilot, when each nurse is normally busy, the workload is five points per nurse. This
agrees with each nurse working a 1-on-1 patient (level 6).
Level Ratio Nurses Points
6 1 to 1 1 5.00
5 1 to 1.5 0.67 3.33
4 1 to 2 0.5 2.50
3 1 to 3 0.33 1.67
2 1 to 4 0.25 1.25
1 1 to 5 0.2 1.00 Table 7: The Scores Translated to Points
5.2.3 Simplifying assumptions
Models are simplified representations of real-life systems. Simple models are more likely to be programmed
correctly, require less data, and are more easily interpreted (Robinson, 2008). The opposite holds for
complicated models. Assumptions have to be made in order to simplify the model. When making these
assumptions, it is important to keep a level of detail at which the model is still representative and we can
Figure 15: Acuity-Based Decision Process (copy of Figure 2)
Acuity Measurement at the Neonatal Intensive Care Unit
42
draw conclusions from the experiments with confidence. We assume for all simplifications that the
deviation from reality will not significantly impact our conclusions.
The first assumption is that the data that has been collected in the first two weeks in June reliably represents
the yearly patient mix. If this assumption does not hold, the transition matrix can change. The effect of this
will be that the outputs change, but we assume that this changes equally throughout our experiments,
resulting in no effect on out conclusions.
The second assumption is that the maximum acuity a unit can handle is always equal. This, however,
completely depends on the nurses who are working the shift. We assume that the total capacity of the
teams of nurses does not fluctuate enough to impact the conclusions of our simulation.
The third assumption is that we treat all patients equally. In reality, the patient mix consists of patients from
the WKZ, patients from within the WKZ’s target region, patients from outside this region, and internal and
external transferals. Especially internal transferals can be foreseen and anticipated, but we assume one
homogenous patient mix. The fourth simplification is the fact that we always assume four nurses to be
available during all shifts. In reality, three to five nurses will be scheduled, depending on the period and
shift.
5.2.4 Limitations of the model
Either the simplifications that are applied to the model, or the complexity of the system the model
represents leads to limitations of the model. These can be solved with further development of the model,
but this is not necessary for our research goal. We do not distinguish between the three different shifts in
the model. The input data will provide a mix of busy and quiet shifts, which can be translated into either
busy and quiet periods or the different shifts.
The model also does not allow nurses to help each other. In reality, when one unit is quiet, nurses can help
other units. The model cannot lower the threshold of acuity on one unit to help other units. The threshold
is always four nurses who do not want to be more busy than “reasonably busy”, which was four points on
the five-point scale we used to inquire about the nurses’ perception of workload. This agrees with the
limitation that there are always four nurses available to every shift.
5.2.5 Summaries of the data
Three entries in the model are based on data. These are: 1) the arrival distribution of the patients, 2) the
distribution of acuity level on arrival, and 3) the transition matrix. This section will summarize these inputs
and refer to the accompanying appendix for the calculations.
The arrival distribution of the patients is derived from the arrivals during the test period. As stated in Section
5.2.4, we assume the data we use for the transition matrix to be representable for the entire year. This
generalization includes the arrival rate. During the 18 days of the test, 34 new patients arrived. This would
result in a Poisson arrival process with lambda 18/34 in days, but Plant Simulation does not accept lambda
values over 700, which have to be seconds. That is why the approximation of the Poisson distribution
through the normal distribution is used, with lambda as mean and variance. These are respectively 12.7
hours and 3.52 hours. In 2014 the NICU admitted 589 patients. This would mean 29 patients in 18 days,
which is why in the sensitivity analysis we test the influence of this deviation on the results of the
experiments.
The distribution of the acuity level on arrival is directly derived from the test data. During this period, 34
patients were admitted to the NICU. Table 8 shows the distribution of the patients’ associated acuity levels
upon arrival. For six of the new patients no score on entry was available. The reliability of this distribution
Acuity Measurement at the Neonatal Intensive Care Unit
43
is, due to the small number of entries, discussed with the management team of the WKZ, and is found to
be sufficiently reliable.
Level: Entries: Probability:
1 0 0
2 1 0.04
3 11 0.39
4 7 0.25
5 7 0.25
6 2 0.07
Total 28
Table 8: Acuity Distribution Among Entries
The transition matrix is the main result of the test period. For all patients, for every data entry during the
test period, the transition of one acuity level to another is counted. This combined forms for every level of
acuity the amount of times that it transitions to all other possible levels or leaves the system. We can
transform these numbers into the probability of a patient being at a certain level the next shift on the basis
of the current shift. The original transition matrix is given in Table 9. Appendix D shows the calculations for
this matrix.
1 2 3 4 5 6 Transfer
1 0 0 0 0.5 0 0 0.5
2 0.025641 0.205128 0.512821 0.230769 0 0 0.02564103
3 0 0.214876 0.553719 0.206612 0.008264 0 0.01652893
4 0.010309 0.123711 0.453608 0.329897 0.041237 0.020619 0.02061856
5 0 0.0625 0.375 0.375 0.1875 0 0
6 0 0 0.166667 0.833333 0 0 0
Transfer 0 0 0 0 0 0 1 Table 9: Original Transition Matrix
We can see the system as represented by the transition matrix as a Markov chain. A Markov chain,
introduced in Section 4.1.2, is a process that can be represented by states, in which each state has a
probability of transitioning into the other states. Our Markov chain has the absorbing characteristic,
meaning that one of the states has the property that once you reach that state, you will not leave (Winston,
2004). For us, leaving the NICU is the absorbing state. In reality, patients can return to the NICU, which in
the model is represented by a new entry in the system.
For an absorbing Markov chain we calculated what the average amount of steps is before the absorbing
state will be reached. Translated to the NICU can we find the average amount of nurses’ shifts it will take
for patients to leave the NICU. This calculation can be used to test the quality of our data. Appendix E shows
the calculations for the average length of stay during the test period, which was found to be 9.7 days. In
this calculation, the amount of leaving patients is overestimated because for a few leaving patients, we
have no transition data, meaning that they may have left the system on a later moment. At the same time,
while leaving the system, it is likely that they recovered further over the following shifts before leaving. This
means that we overestimate both the amount of patients leaving as well as the average level of acuity.
Because of this, we adjust the leaving distribution and numbers as in Table 10. This adjustment is done in
agreement with the hospital, who agree that the new amounts are more representative of the yearly
patient mix.
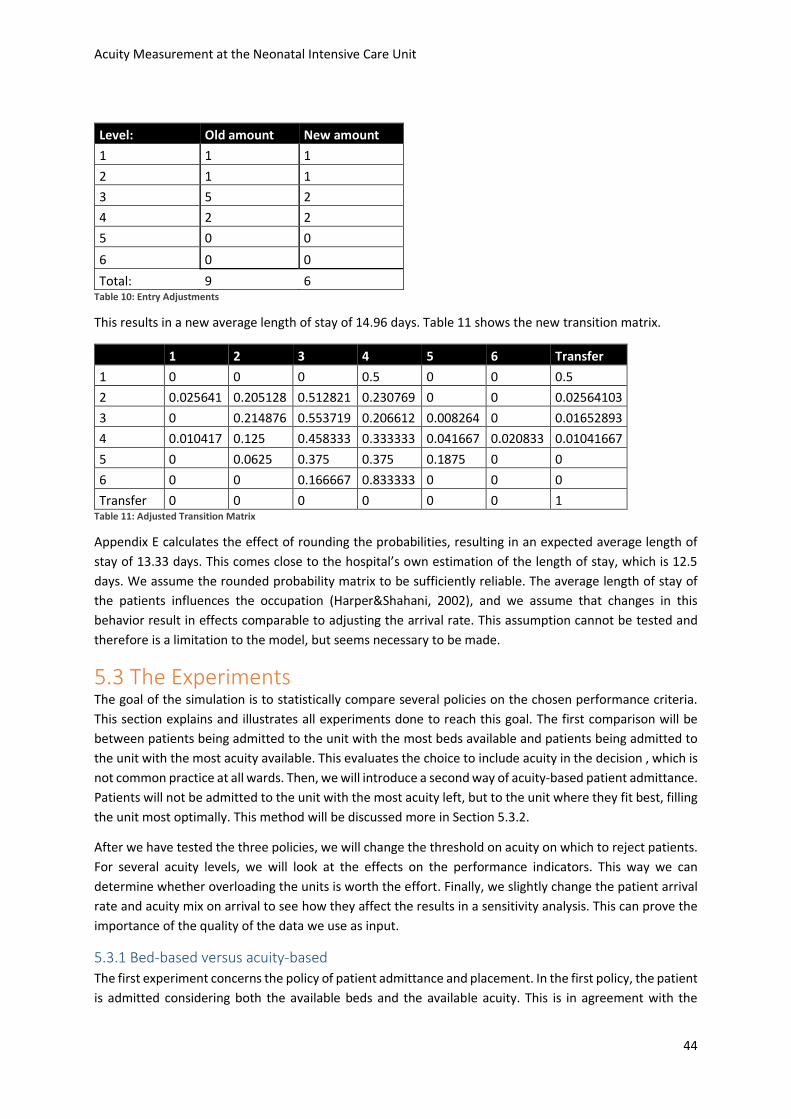
Acuity Measurement at the Neonatal Intensive Care Unit
44
Level: Old amount New amount
1 1 1
2 1 1
3 5 2
4 2 2
5 0 0
6 0 0
Total: 9 6 Table 10: Entry Adjustments
This results in a new average length of stay of 14.96 days. Table 11 shows the new transition matrix.
1 2 3 4 5 6 Transfer
1 0 0 0 0.5 0 0 0.5
2 0.025641 0.205128 0.512821 0.230769 0 0 0.02564103
3 0 0.214876 0.553719 0.206612 0.008264 0 0.01652893
4 0.010417 0.125 0.458333 0.333333 0.041667 0.020833 0.01041667
5 0 0.0625 0.375 0.375 0.1875 0 0
6 0 0 0.166667 0.833333 0 0 0
Transfer 0 0 0 0 0 0 1 Table 11: Adjusted Transition Matrix
Appendix E calculates the effect of rounding the probabilities, resulting in an expected average length of
stay of 13.33 days. This comes close to the hospital’s own estimation of the length of stay, which is 12.5
days. We assume the rounded probability matrix to be sufficiently reliable. The average length of stay of
the patients influences the occupation (Harper&Shahani, 2002), and we assume that changes in this
behavior result in effects comparable to adjusting the arrival rate. This assumption cannot be tested and
therefore is a limitation to the model, but seems necessary to be made.
5.3 The Experiments The goal of the simulation is to statistically compare several policies on the chosen performance criteria.
This section explains and illustrates all experiments done to reach this goal. The first comparison will be
between patients being admitted to the unit with the most beds available and patients being admitted to
the unit with the most acuity available. This evaluates the choice to include acuity in the decision , which is
not common practice at all wards. Then, we will introduce a second way of acuity-based patient admittance.
Patients will not be admitted to the unit with the most acuity left, but to the unit where they fit best, filling
the unit most optimally. This method will be discussed more in Section 5.3.2.
After we have tested the three policies, we will change the threshold on acuity on which to reject patients.
For several acuity levels, we will look at the effects on the performance indicators. This way we can
determine whether overloading the units is worth the effort. Finally, we slightly change the patient arrival
rate and acuity mix on arrival to see how they affect the results in a sensitivity analysis. This can prove the
importance of the quality of the data we use as input.
5.3.1 Bed-based versus acuity-based
The first experiment concerns the policy of patient admittance and placement. In the first policy, the patient
is admitted considering both the available beds and the available acuity. This is in agreement with the
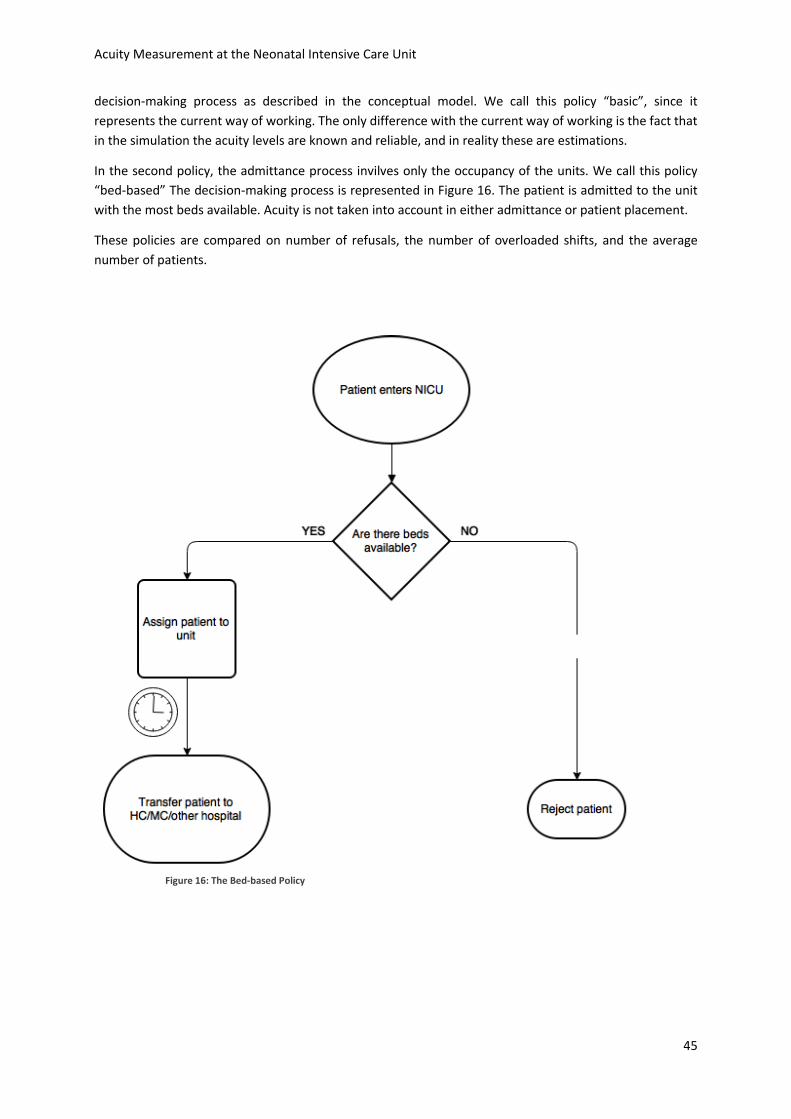
Acuity Measurement at the Neonatal Intensive Care Unit
45
decision-making process as described in the conceptual model. We call this policy “basic”, since it
represents the current way of working. The only difference with the current way of working is the fact that
in the simulation the acuity levels are known and reliable, and in reality these are estimations.
In the second policy, the admittance process invilves only the occupancy of the units. We call this policy
“bed-based” The decision-making process is represented in Figure 16. The patient is admitted to the unit
with the most beds available. Acuity is not taken into account in either admittance or patient placement.
These policies are compared on number of refusals, the number of overloaded shifts, and the average
number of patients.
Figure 16: The Bed-based Policy
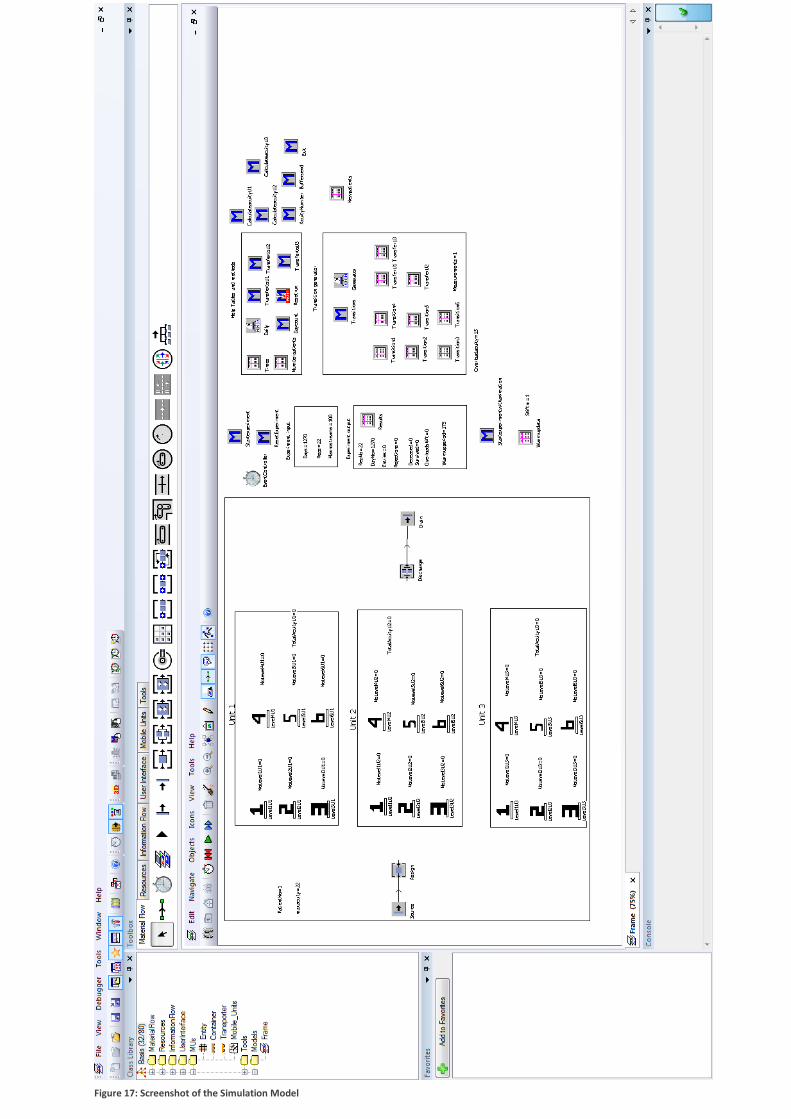
Acuity Measurement at the Neonatal Intensive Care Unit
46
Figure 17: Screenshot of the Simulation Model
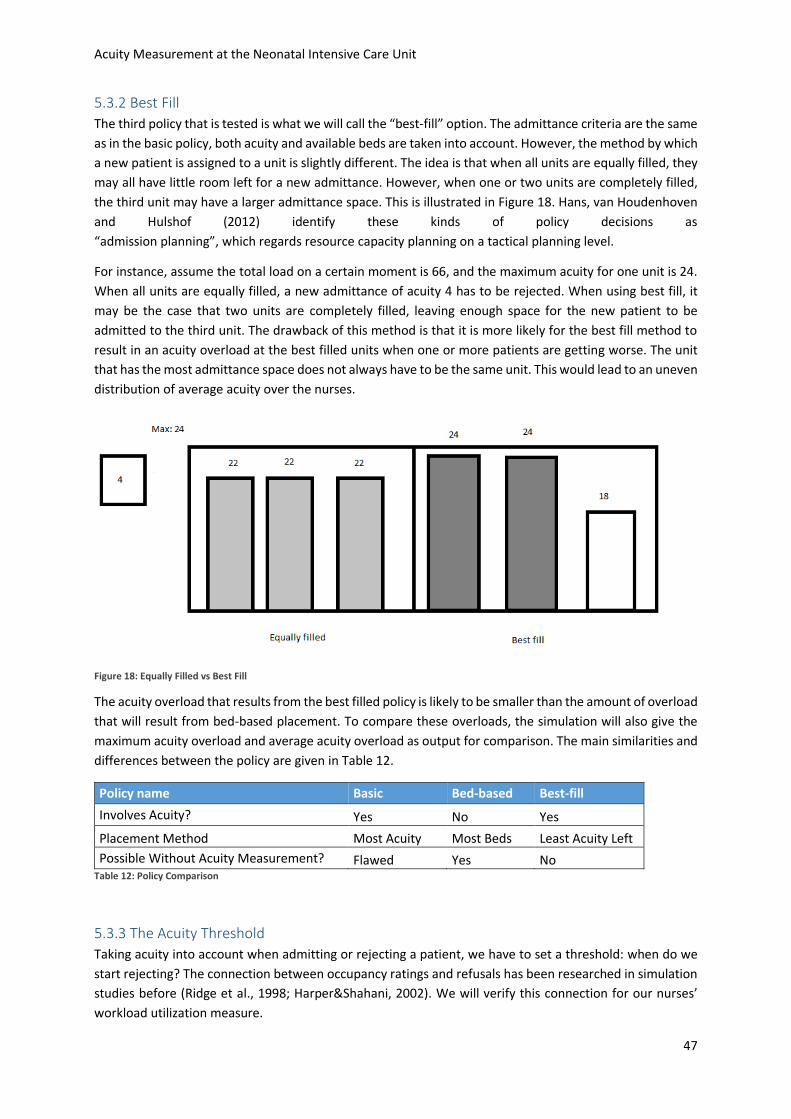
Acuity Measurement at the Neonatal Intensive Care Unit
47
5.3.2 Best Fill The third policy that is tested is what we will call the “best-fill” option. The admittance criteria are the same
as in the basic policy, both acuity and available beds are taken into account. However, the method by which
a new patient is assigned to a unit is slightly different. The idea is that when all units are equally filled, they
may all have little room left for a new admittance. However, when one or two units are completely filled,
the third unit may have a larger admittance space. This is illustrated in Figure 18. Hans, van Houdenhoven
and Hulshof (2012) identify these kinds of policy decisions as
“admission planning”, which regards resource capacity planning on a tactical planning level.
For instance, assume the total load on a certain moment is 66, and the maximum acuity for one unit is 24.
When all units are equally filled, a new admittance of acuity 4 has to be rejected. When using best fill, it
may be the case that two units are completely filled, leaving enough space for the new patient to be
admitted to the third unit. The drawback of this method is that it is more likely for the best fill method to
result in an acuity overload at the best filled units when one or more patients are getting worse. The unit
that has the most admittance space does not always have to be the same unit. This would lead to an uneven
distribution of average acuity over the nurses.
Figure 18: Equally Filled vs Best Fill
The acuity overload that results from the best filled policy is likely to be smaller than the amount of overload
that will result from bed-based placement. To compare these overloads, the simulation will also give the
maximum acuity overload and average acuity overload as output for comparison. The main similarities and
differences between the policy are given in Table 12.
Policy name Basic Bed-based Best-fill
Involves Acuity? Yes No Yes
Placement Method Most Acuity Most Beds Least Acuity Left
Possible Without Acuity Measurement? Flawed Yes No Table 12: Policy Comparison
5.3.3 The Acuity Threshold
Taking acuity into account when admitting or rejecting a patient, we have to set a threshold: when do we
start rejecting? The connection between occupancy ratings and refusals has been researched in simulation
studies before (Ridge et al., 1998; Harper&Shahani, 2002). We will verify this connection for our nurses’
workload utilization measure.
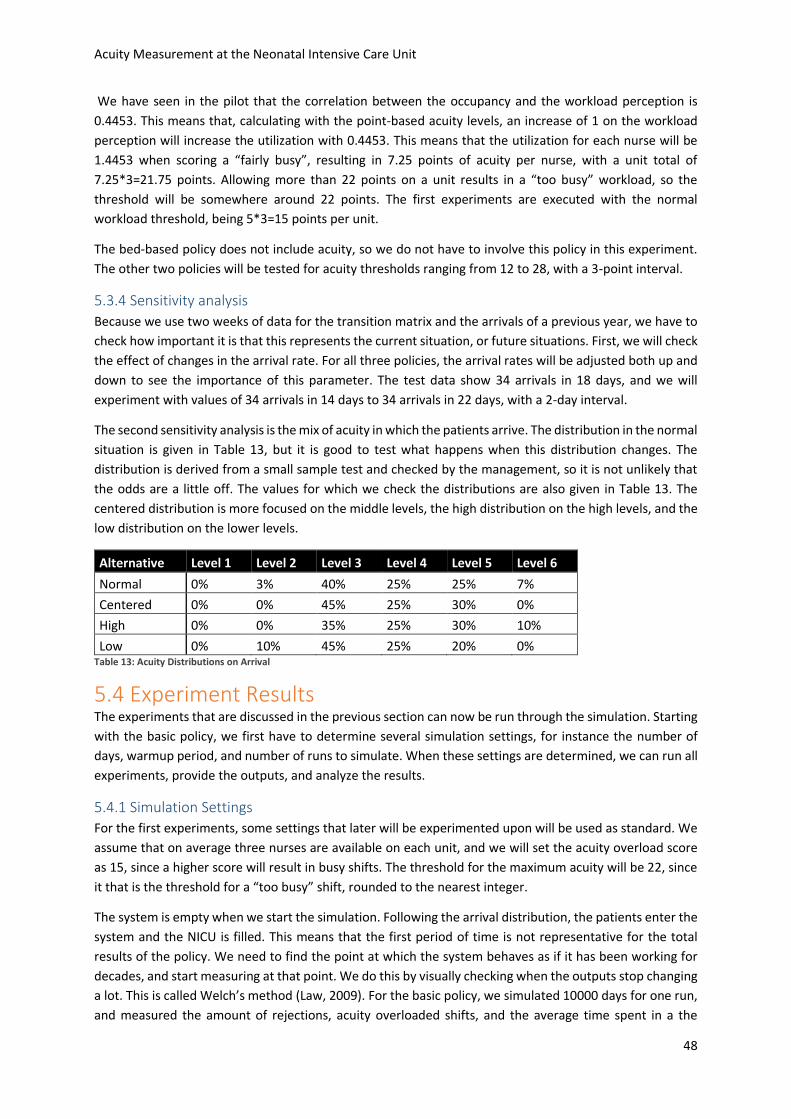
Acuity Measurement at the Neonatal Intensive Care Unit
48
We have seen in the pilot that the correlation between the occupancy and the workload perception is
0.4453. This means that, calculating with the point-based acuity levels, an increase of 1 on the workload
perception will increase the utilization with 0.4453. This means that the utilization for each nurse will be
1.4453 when scoring a “fairly busy”, resulting in 7.25 points of acuity per nurse, with a unit total of
7.25*3=21.75 points. Allowing more than 22 points on a unit results in a “too busy” workload, so the
threshold will be somewhere around 22 points. The first experiments are executed with the normal
workload threshold, being 5*3=15 points per unit.
The bed-based policy does not include acuity, so we do not have to involve this policy in this experiment.
The other two policies will be tested for acuity thresholds ranging from 12 to 28, with a 3-point interval.
5.3.4 Sensitivity analysis
Because we use two weeks of data for the transition matrix and the arrivals of a previous year, we have to
check how important it is that this represents the current situation, or future situations. First, we will check
the effect of changes in the arrival rate. For all three policies, the arrival rates will be adjusted both up and
down to see the importance of this parameter. The test data show 34 arrivals in 18 days, and we will
experiment with values of 34 arrivals in 14 days to 34 arrivals in 22 days, with a 2-day interval.
The second sensitivity analysis is the mix of acuity in which the patients arrive. The distribution in the normal
situation is given in Table 13, but it is good to test what happens when this distribution changes. The
distribution is derived from a small sample test and checked by the management, so it is not unlikely that
the odds are a little off. The values for which we check the distributions are also given in Table 13. The
centered distribution is more focused on the middle levels, the high distribution on the high levels, and the
low distribution on the lower levels.
Alternative Level 1 Level 2 Level 3 Level 4 Level 5 Level 6
Normal 0% 3% 40% 25% 25% 7%
Centered 0% 0% 45% 25% 30% 0%
High 0% 0% 35% 25% 30% 10%
Low 0% 10% 45% 25% 20% 0% Table 13: Acuity Distributions on Arrival
5.4 Experiment Results The experiments that are discussed in the previous section can now be run through the simulation. Starting
with the basic policy, we first have to determine several simulation settings, for instance the number of
days, warmup period, and number of runs to simulate. When these settings are determined, we can run all
experiments, provide the outputs, and analyze the results.
5.4.1 Simulation Settings
For the first experiments, some settings that later will be experimented upon will be used as standard. We
assume that on average three nurses are available on each unit, and we will set the acuity overload score
as 15, since a higher score will result in busy shifts. The threshold for the maximum acuity will be 22, since
it that is the threshold for a “too busy” shift, rounded to the nearest integer.
The system is empty when we start the simulation. Following the arrival distribution, the patients enter the
system and the NICU is filled. This means that the first period of time is not representative for the total
results of the policy. We need to find the point at which the system behaves as if it has been working for
decades, and start measuring at that point. We do this by visually checking when the outputs stop changing
a lot. This is called Welch’s method (Law, 2009). For the basic policy, we simulated 10000 days for one run,
and measured the amount of rejections, acuity overloaded shifts, and the average time spent in a the
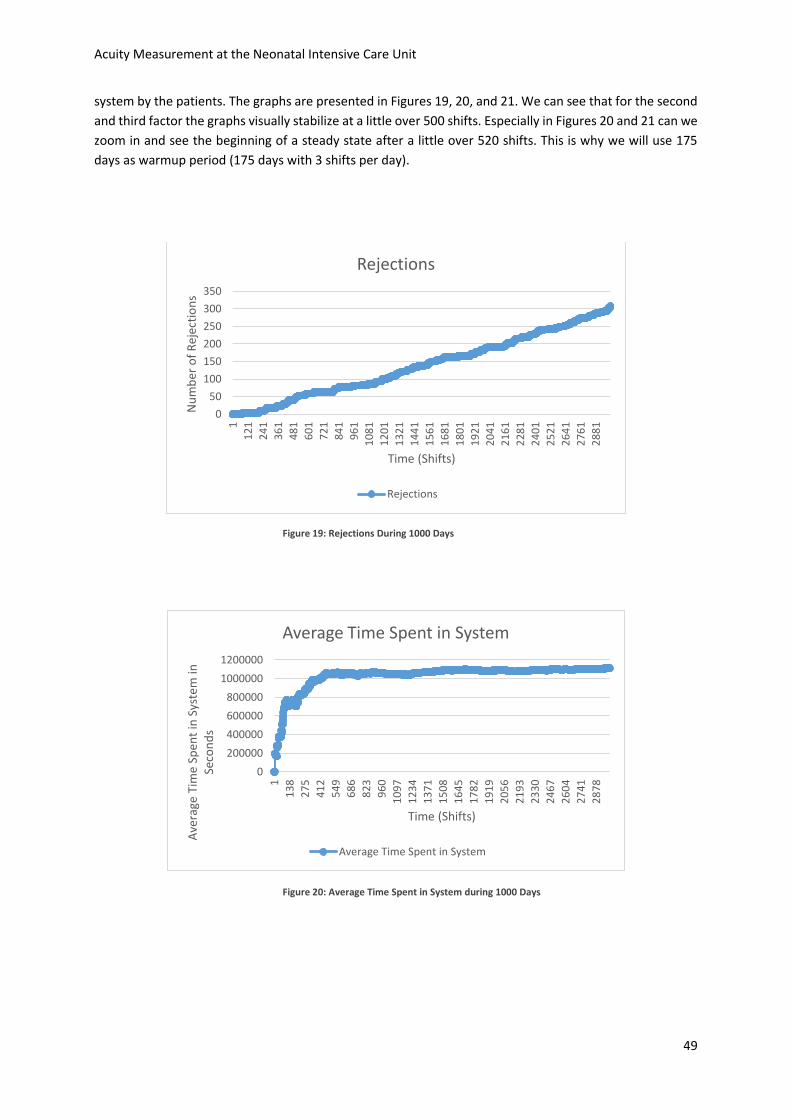
Acuity Measurement at the Neonatal Intensive Care Unit
49
system by the patients. The graphs are presented in Figures 19, 20, and 21. We can see that for the second
and third factor the graphs visually stabilize at a little over 500 shifts. Especially in Figures 20 and 21 can we
zoom in and see the beginning of a steady state after a little over 520 shifts. This is why we will use 175
days as warmup period (175 days with 3 shifts per day).
Figure 19: Rejections During 1000 Days
Figure 20: Average Time Spent in System during 1000 Days
0
50
100
150
200
250
300
350
1
12
1
24
1
36
1
48
1
60
1
72
1
84
1
96
1
10
81
12
01
13
21
14
41
15
61
16
81
18
01
19
21
20
41
21
61
22
81
24
01
25
21
26
41
27
61
28
81
Nu
mb
er o
f R
ejec
tio
ns
Time (Shifts)
Rejections
Rejections
0
200000
400000
600000
800000
1000000
1200000
1
13
8
27
5
41
2
54
9
68
6
82
3
96
0
10
97
12
34
13
71
15
08
16
45
17
82
19
19
20
56
21
93
23
30
24
67
26
04
27
41
28
78
Ave
rage
Tim
e Sp
ent
in S
yste
m in
Se
con
ds
Time (Shifts)
Average Time Spent in System
Average Time Spent in System
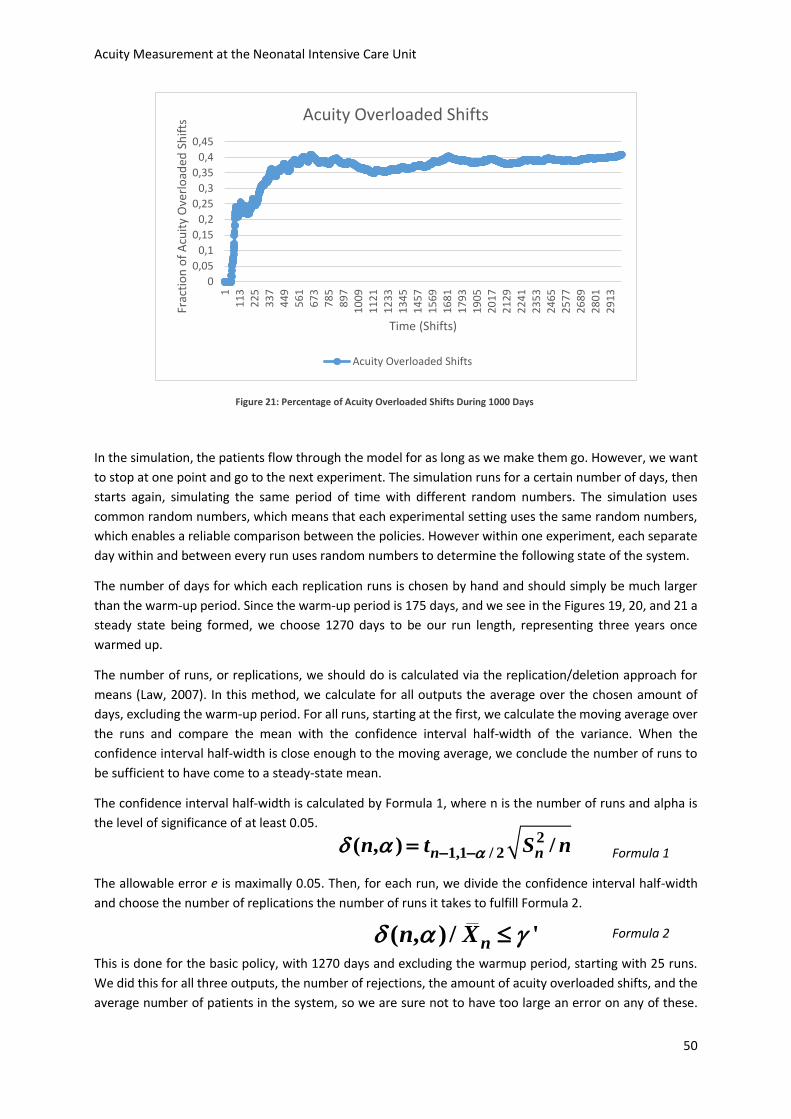
Acuity Measurement at the Neonatal Intensive Care Unit
50
Figure 21: Percentage of Acuity Overloaded Shifts During 1000 Days
In the simulation, the patients flow through the model for as long as we make them go. However, we want
to stop at one point and go to the next experiment. The simulation runs for a certain number of days, then
starts again, simulating the same period of time with different random numbers. The simulation uses
common random numbers, which means that each experimental setting uses the same random numbers,
which enables a reliable comparison between the policies. However within one experiment, each separate
day within and between every run uses random numbers to determine the following state of the system.
The number of days for which each replication runs is chosen by hand and should simply be much larger
than the warm-up period. Since the warm-up period is 175 days, and we see in the Figures 19, 20, and 21 a
steady state being formed, we choose 1270 days to be our run length, representing three years once
warmed up.
The number of runs, or replications, we should do is calculated via the replication/deletion approach for
means (Law, 2007). In this method, we calculate for all outputs the average over the chosen amount of
days, excluding the warm-up period. For all runs, starting at the first, we calculate the moving average over
the runs and compare the mean with the confidence interval half-width of the variance. When the
confidence interval half-width is close enough to the moving average, we conclude the number of runs to
be sufficient to have come to a steady-state mean.
The confidence interval half-width is calculated by Formula 1, where n is the number of runs and alpha is
the level of significance of at least 0.05.
Formula 1
The allowable error e is maximally 0.05. Then, for each run, we divide the confidence interval half-width
and choose the number of replications the number of runs it takes to fulfill Formula 2.
Formula 2
This is done for the basic policy, with 1270 days and excluding the warmup period, starting with 25 runs.
We did this for all three outputs, the number of rejections, the amount of acuity overloaded shifts, and the
average number of patients in the system, so we are sure not to have too large an error on any of these.
0
0,05
0,1
0,15
0,2
0,25
0,3
0,35
0,4
0,45
11
13
22
53
37
44
95
61
67
37
85
89
71
00
91
12
11
23
31
34
51
45
71
56
91
68
11
79
31
90
52
01
72
12
92
24
12
35
32
46
52
57
72
68
92
80
12
91
3
Frac
tio
n o
f A
cuit
y O
verl
oad
ed S
hif
ts
Time (Shifts)
Acuity Overloaded Shifts
Acuity Overloaded Shifts
21,1 / 2( , ) /n nn t S n
( , ) / 'nn X
Acuity Measurement at the Neonatal Intensive Care Unit
51
For all calculations, see appendix F. From the tables we can see that the number of replications should be
22 to get a steady-state mean for the number of rejections, 11 for the number of shifts with an acuity
overload, and 2 for the average number of patients. This is why 22 should be the minimum amount of
replications to be made. This number of replications is used in all experiments.
5.4.2 Verifying the Simulation
Because we want to know how well the simulation represents the actual system, we will do three tests to
compare the simulation model to the real system. This is the validation of the simulation model. Two factors
will be compared: the average number of patients in the system, and the average number of time spent in
the system. The third method of validation is checking the simulation model through animation.
The average amount of patients in the system for the basic policy over 25 runs is 20.42. With a mean arrival
time of 12.7 hours, the total amount of patients to enter the system is 2069. Of this 2069, an average
number of 357 is rejected. This results in an average interarrival time to the units of 15.35 hours. We can
use Little’s law (Little, 1961) to calculate the average amount of patients in the system. Little’s law states
that the expected amount of products in a system is the average time spent in the system times the arrival
rate. The average time spent in the system is 13.24 days, and the arrival rate is 1.56 per day. This results in
an average amount of patients in the system of 20.65. This is close to the 20.42 from the simulation. The
difference may be explained by the fact that the interarrival time in the simulation does not use a Poisson
distribution, but an approximation via the normal distribution.
The second check is the average amount of time patients spend in the system. The average amount of time
spent by patients in the system is 13.24 days in the simulation, whereas we calculated an expected average
of 14.96 days in Section 4.2. This difference can be explained by the rounding of the transition matrix. The
transition matrix used in the simulation uses integers as percentages, which means all probabilities are
rounded to the nearest integer. Using the Markov analysis for the transition matrix with rounded
probabilities, we see an expected average stay of 13.33 (See Appendix E). The difference in average length
of stay may be explained by the fact that this does not include rejected patients, and that rejected patients
will have a high acuity level on average. Patients with a high acuity level have a longer average stay than
low-level patients, so the rejections will lead to a higher average length of stay.
The third check is visually checking the way the moving units in the simulation behave through simulation.
Starting the simulation very slowly, the main screen as displayed in Figure 17 shows the arrival, placement,
and exit of patient. By checking visually whether the acuity levels change and the placement method is
followed correctly the validity of the simulation model can be confirmed. The simulation behaved as it was
supposed to, which means that the experiments can be executed.
5.4.3 Acuity-based Versus Bed-based
The first experiment compares the basic situation to a bed-based strategy. The results of the 22 runs for
the three outputs are given in Figures 22, 23, and 24. What can be observed is that the use of common
random numbers, as introduced in Section 5.4.1, is represented in the outputs.
None of the graphs cross lines, which means that the results are consistent every run it can be visually
determined that the tests for a shared distribution can be executed for a one-sided deviation. Seeing the
three graphs next to each other clearly illustrates the tradeoff between busy shifts and overtime, and
rejections. Table 14 shows the average results over all runs for the two experiments.
A t-test is done for all outputs to check for likeliness of an agreeing mean. These t-tests are two-sided and
assume an unequal variance. These t-tests are done in Excel. For this experiment, all results of the t-tests
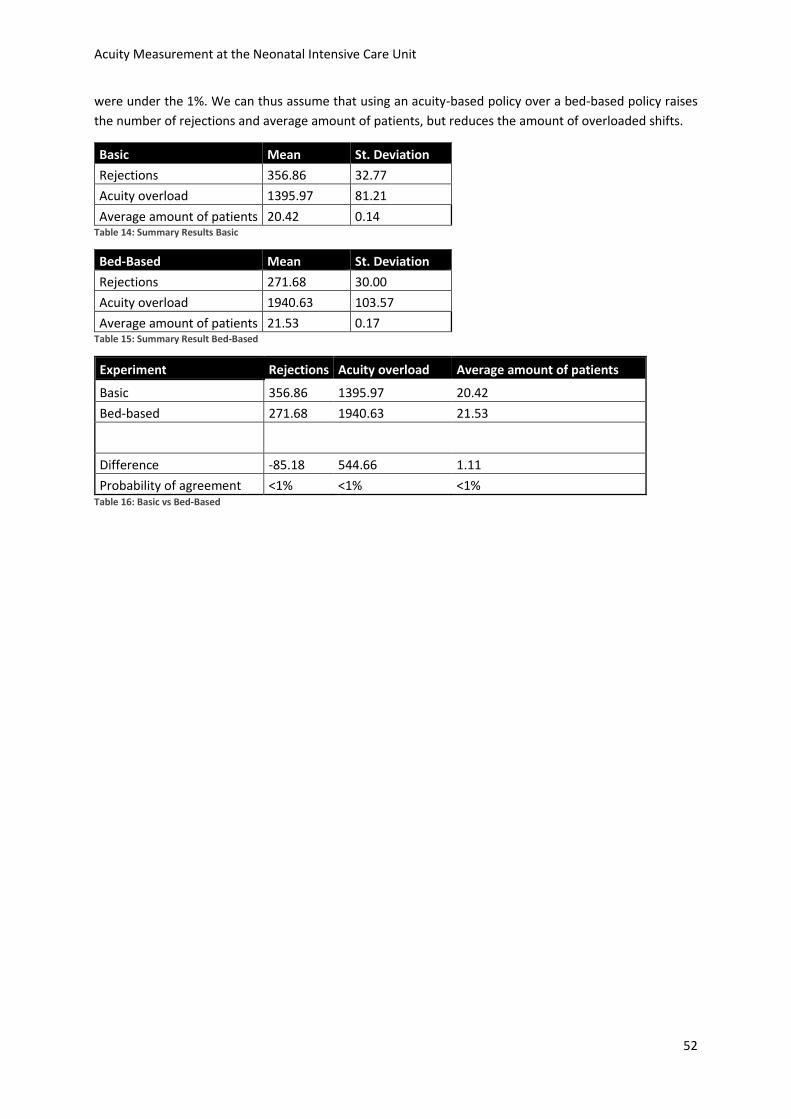
Acuity Measurement at the Neonatal Intensive Care Unit
52
were under the 1%. We can thus assume that using an acuity-based policy over a bed-based policy raises
the number of rejections and average amount of patients, but reduces the amount of overloaded shifts.
Basic Mean St. Deviation
Rejections 356.86 32.77
Acuity overload 1395.97 81.21
Average amount of patients 20.42 0.14 Table 14: Summary Results Basic
Bed-Based Mean St. Deviation
Rejections 271.68 30.00
Acuity overload 1940.63 103.57
Average amount of patients 21.53 0.17 Table 15: Summary Result Bed-Based
Experiment Rejections Acuity overload Average amount of patients
Basic 356.86 1395.97 20.42
Bed-based 271.68 1940.63 21.53
Difference -85.18 544.66 1.11
Probability of agreement <1% <1% <1% Table 16: Basic vs Bed-Based
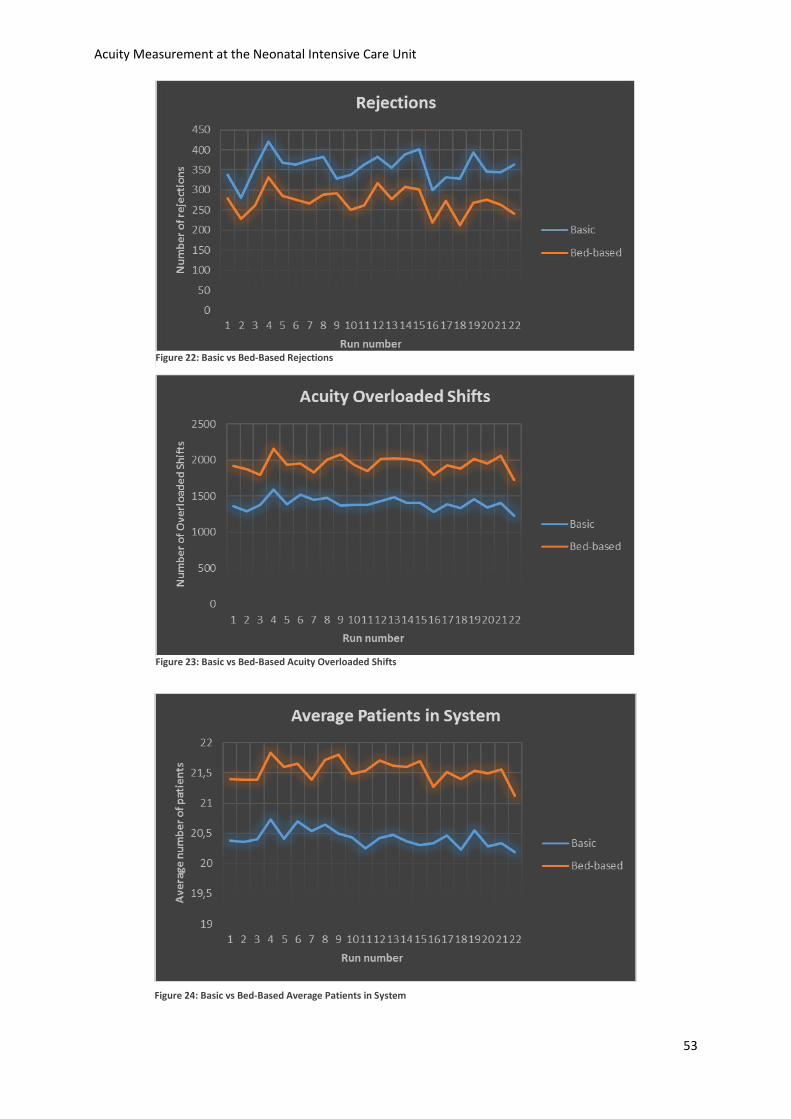
Acuity Measurement at the Neonatal Intensive Care Unit
53
Figure 22: Basic vs Bed-Based Rejections
Figure 23: Basic vs Bed-Based Acuity Overloaded Shifts
Figure 24: Basic vs Bed-Based Average Patients in System
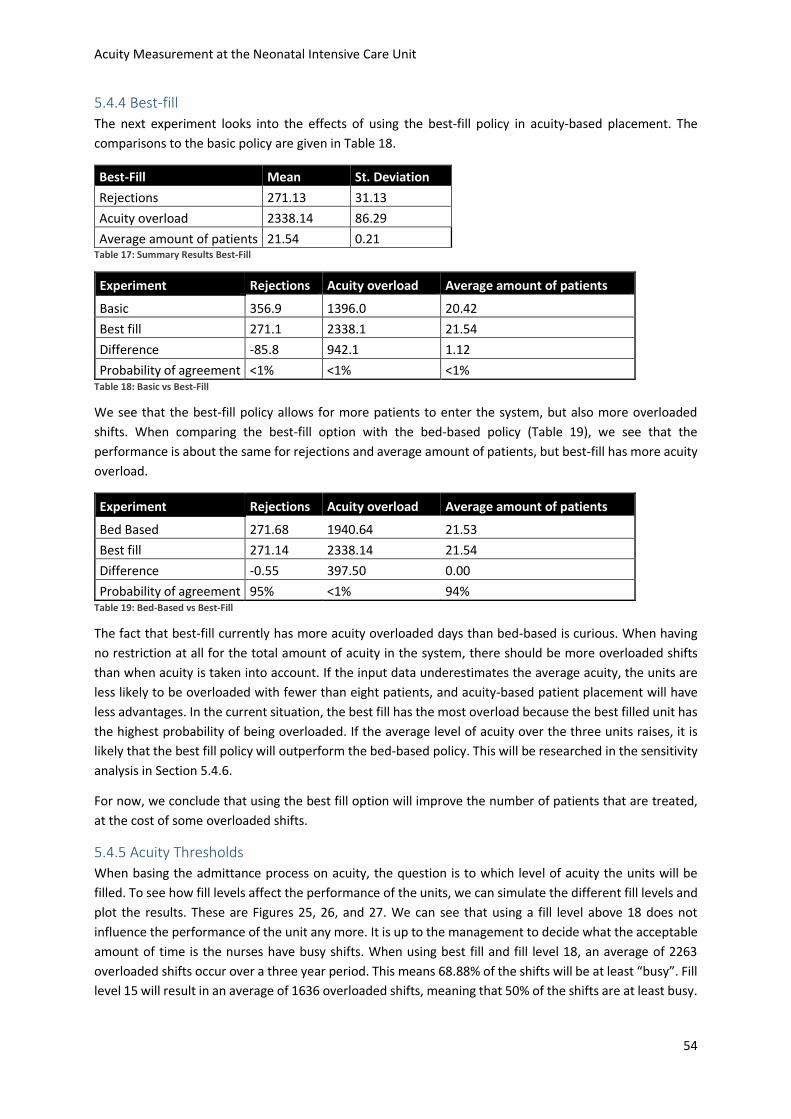
Acuity Measurement at the Neonatal Intensive Care Unit
54
5.4.4 Best-fill
The next experiment looks into the effects of using the best-fill policy in acuity-based placement. The
comparisons to the basic policy are given in Table 18.
Best-Fill Mean St. Deviation
Rejections 271.13 31.13
Acuity overload 2338.14 86.29
Average amount of patients 21.54 0.21 Table 17: Summary Results Best-Fill
Experiment Rejections Acuity overload Average amount of patients
Basic 356.9 1396.0 20.42
Best fill 271.1 2338.1 21.54
Difference -85.8 942.1 1.12
Probability of agreement <1% <1% <1% Table 18: Basic vs Best-Fill
We see that the best-fill policy allows for more patients to enter the system, but also more overloaded
shifts. When comparing the best-fill option with the bed-based policy (Table 19), we see that the
performance is about the same for rejections and average amount of patients, but best-fill has more acuity
overload.
Experiment Rejections Acuity overload Average amount of patients
Bed Based 271.68 1940.64 21.53
Best fill 271.14 2338.14 21.54
Difference -0.55 397.50 0.00
Probability of agreement 95% <1% 94% Table 19: Bed-Based vs Best-Fill
The fact that best-fill currently has more acuity overloaded days than bed-based is curious. When having
no restriction at all for the total amount of acuity in the system, there should be more overloaded shifts
than when acuity is taken into account. If the input data underestimates the average acuity, the units are
less likely to be overloaded with fewer than eight patients, and acuity-based patient placement will have
less advantages. In the current situation, the best fill has the most overload because the best filled unit has
the highest probability of being overloaded. If the average level of acuity over the three units raises, it is
likely that the best fill policy will outperform the bed-based policy. This will be researched in the sensitivity
analysis in Section 5.4.6.
For now, we conclude that using the best fill option will improve the number of patients that are treated,
at the cost of some overloaded shifts.
5.4.5 Acuity Thresholds
When basing the admittance process on acuity, the question is to which level of acuity the units will be
filled. To see how fill levels affect the performance of the units, we can simulate the different fill levels and
plot the results. These are Figures 25, 26, and 27. We can see that using a fill level above 18 does not
influence the performance of the unit any more. It is up to the management to decide what the acceptable
amount of time is the nurses have busy shifts. When using best fill and fill level 18, an average of 2263
overloaded shifts occur over a three year period. This means 68.88% of the shifts will be at least “busy”. Fill
level 15 will result in an average of 1636 overloaded shifts, meaning that 50% of the shifts are at least busy.
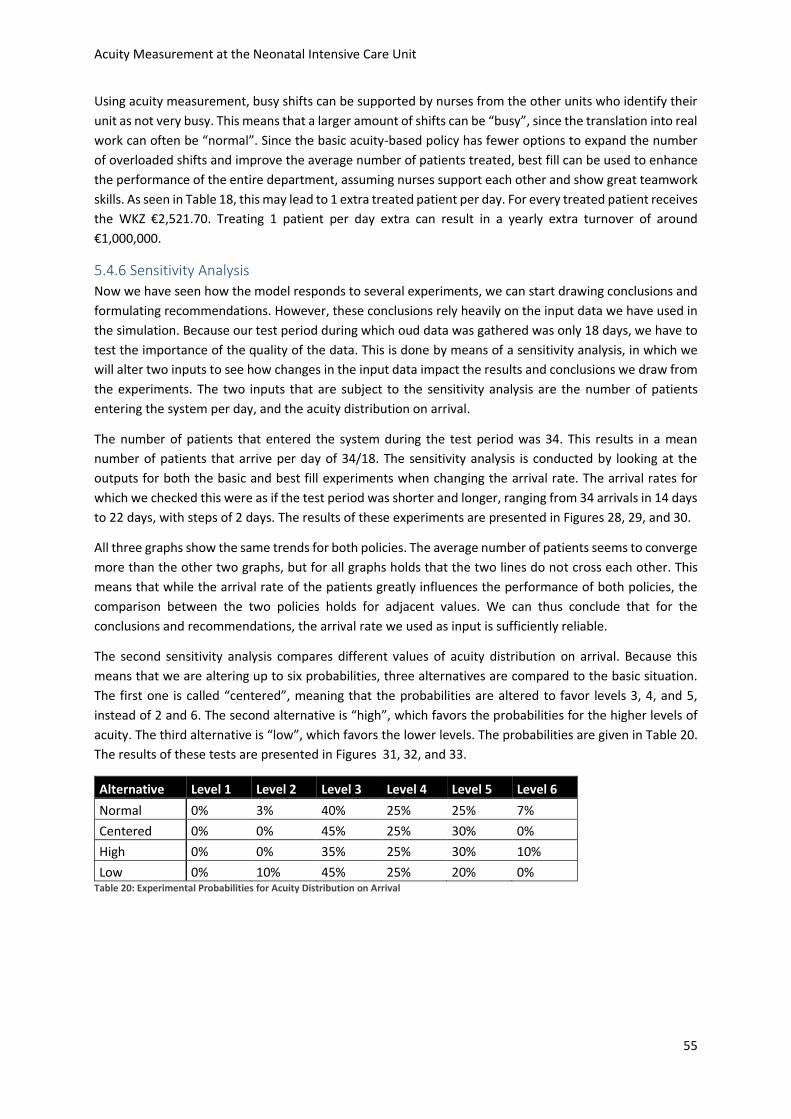
Acuity Measurement at the Neonatal Intensive Care Unit
55
Using acuity measurement, busy shifts can be supported by nurses from the other units who identify their
unit as not very busy. This means that a larger amount of shifts can be “busy”, since the translation into real
work can often be “normal”. Since the basic acuity-based policy has fewer options to expand the number
of overloaded shifts and improve the average number of patients treated, best fill can be used to enhance
the performance of the entire department, assuming nurses support each other and show great teamwork
skills. As seen in Table 18, this may lead to 1 extra treated patient per day. For every treated patient receives
the WKZ €2,521.70. Treating 1 patient per day extra can result in a yearly extra turnover of around
€1,000,000.
5.4.6 Sensitivity Analysis
Now we have seen how the model responds to several experiments, we can start drawing conclusions and
formulating recommendations. However, these conclusions rely heavily on the input data we have used in
the simulation. Because our test period during which oud data was gathered was only 18 days, we have to
test the importance of the quality of the data. This is done by means of a sensitivity analysis, in which we
will alter two inputs to see how changes in the input data impact the results and conclusions we draw from
the experiments. The two inputs that are subject to the sensitivity analysis are the number of patients
entering the system per day, and the acuity distribution on arrival.
The number of patients that entered the system during the test period was 34. This results in a mean
number of patients that arrive per day of 34/18. The sensitivity analysis is conducted by looking at the
outputs for both the basic and best fill experiments when changing the arrival rate. The arrival rates for
which we checked this were as if the test period was shorter and longer, ranging from 34 arrivals in 14 days
to 22 days, with steps of 2 days. The results of these experiments are presented in Figures 28, 29, and 30.
All three graphs show the same trends for both policies. The average number of patients seems to converge
more than the other two graphs, but for all graphs holds that the two lines do not cross each other. This
means that while the arrival rate of the patients greatly influences the performance of both policies, the
comparison between the two policies holds for adjacent values. We can thus conclude that for the
conclusions and recommendations, the arrival rate we used as input is sufficiently reliable.
The second sensitivity analysis compares different values of acuity distribution on arrival. Because this
means that we are altering up to six probabilities, three alternatives are compared to the basic situation.
The first one is called “centered”, meaning that the probabilities are altered to favor levels 3, 4, and 5,
instead of 2 and 6. The second alternative is “high”, which favors the probabilities for the higher levels of
acuity. The third alternative is “low”, which favors the lower levels. The probabilities are given in Table 20.
The results of these tests are presented in Figures 31, 32, and 33.
Alternative Level 1 Level 2 Level 3 Level 4 Level 5 Level 6
Normal 0% 3% 40% 25% 25% 7%
Centered 0% 0% 45% 25% 30% 0%
High 0% 0% 35% 25% 30% 10%
Low 0% 10% 45% 25% 20% 0% Table 20: Experimental Probabilities for Acuity Distribution on Arrival
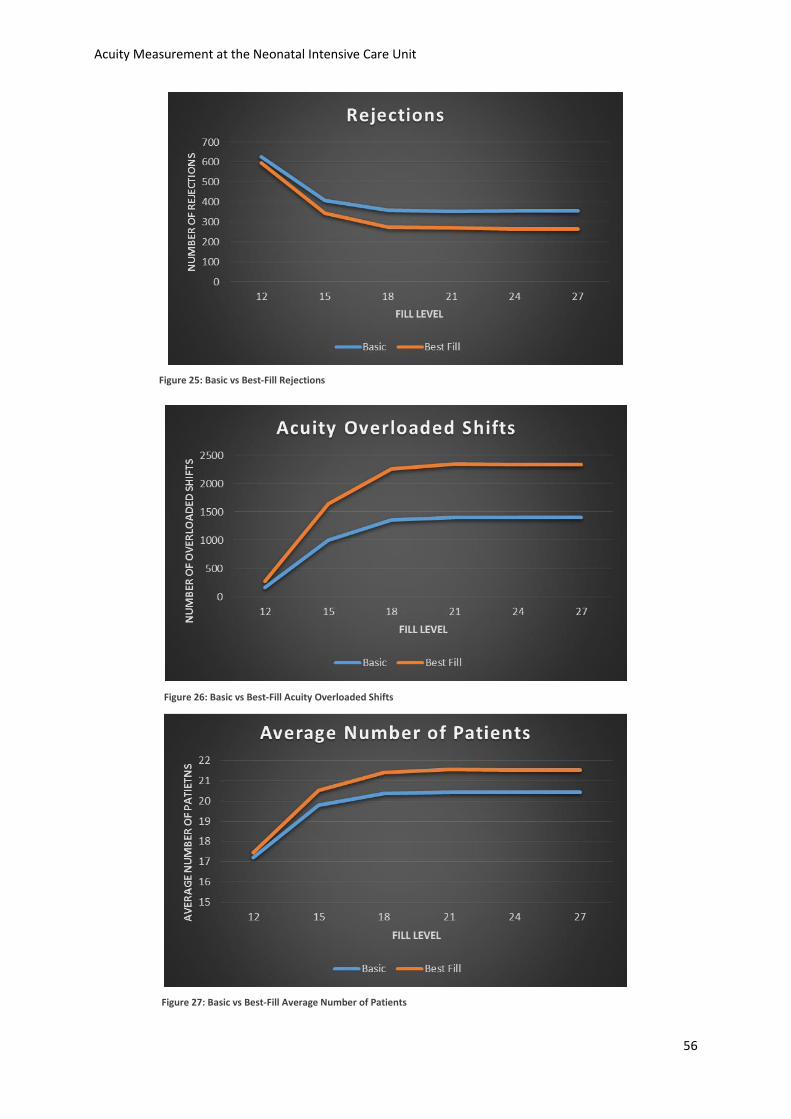
Acuity Measurement at the Neonatal Intensive Care Unit
56
Figure 25: Basic vs Best-Fill Rejections
Figure 26: Basic vs Best-Fill Acuity Overloaded Shifts
Figure 27: Basic vs Best-Fill Average Number of Patients
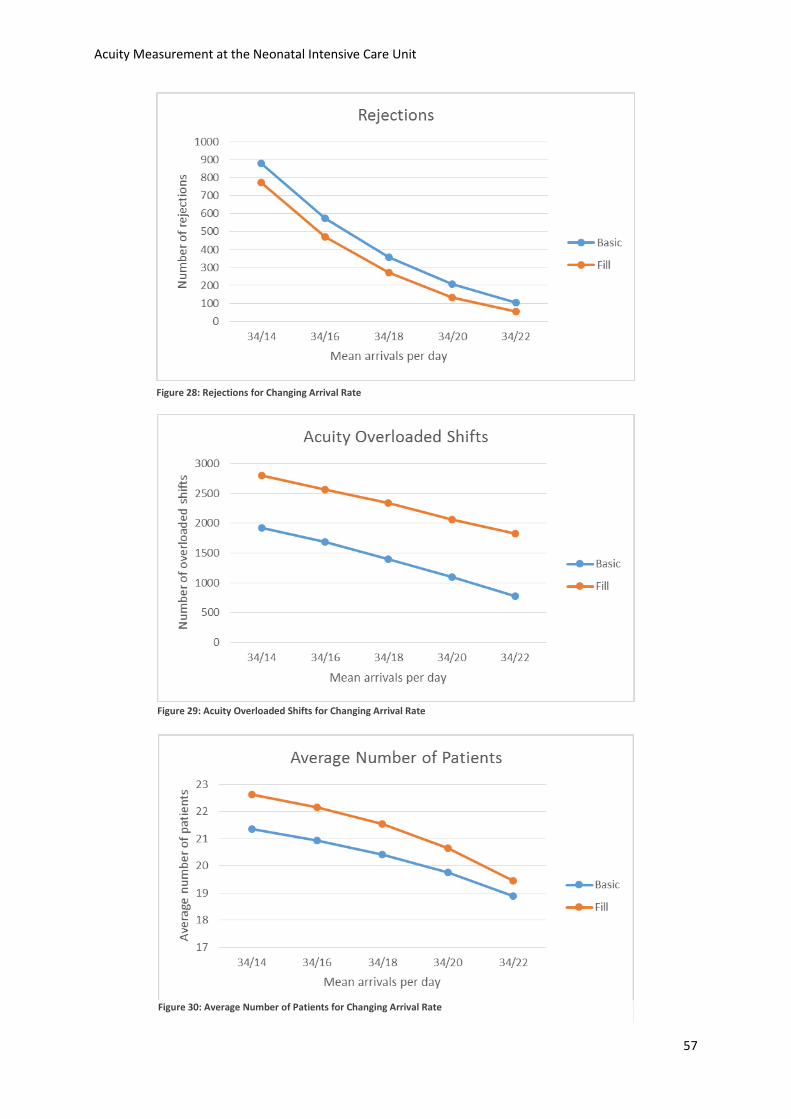
Acuity Measurement at the Neonatal Intensive Care Unit
57
Figure 28: Rejections for Changing Arrival Rate
Figure 29: Acuity Overloaded Shifts for Changing Arrival Rate
Figure 30: Average Number of Patients for Changing Arrival Rate
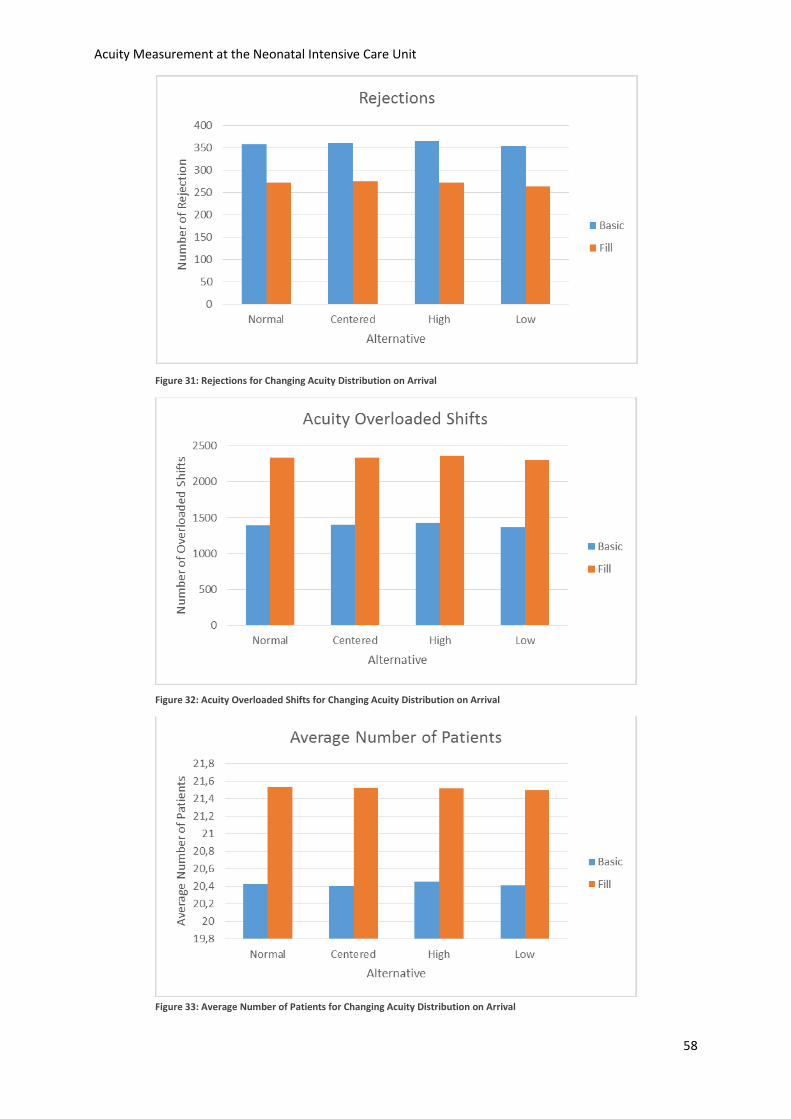
Acuity Measurement at the Neonatal Intensive Care Unit
58
Figure 31: Rejections for Changing Acuity Distribution on Arrival
Figure 32: Acuity Overloaded Shifts for Changing Acuity Distribution on Arrival
Figure 33: Average Number of Patients for Changing Acuity Distribution on Arrival
Acuity Measurement at the Neonatal Intensive Care Unit
59
On basis of the figures, we verify visually that the outputs of all alternatives are not very different. We can
assume that the acuity distribution among arrivals is not important for the absolute results, and therefore
does not affect the conclusions and recommendations we draw from the experiments.
5.5 Conclusion This chapter explained that the acuity measurement enables a simulation model to statistically compare
several policies. The experiments in this chapter showed that using acuity as support for the decisions
regarding patient placement and NICU capacity management has several implications for the performance
of the NICU. When not minding the acuity at all and just focusing on the available beds, the units will end
up with more patients, more busy shifts, but fewer rejections than when using acuity. When using acuity to
decide to which unit the patient should be admitted, the hospital can choose between an equal filling level
and a best fill option. There are more policies possible, but we chose to experiment with these two. The
best fill option results in more busy shifts then the equal filling, but has fewer rejections and a higher
average number of patients.
Because the acuity measurement enables nurses to identify the moments at which they help other units
when they themselves have time to spare, the overloaded shifts in the best fill policy are likely to be coped
with by simply transferring nurses between units during shifts. When one unit is quiet, it can spare one
nurse to support a busy unit. The experiments in this simulation shows that the average number of patients
can potentially rise with 1.12 patient, while the number of rejections can be reduced by 25%. Since one
additional patient for one day results in an extra revenue of €2,521,70, the total amount of extra revenue
per year can amount to a little over €1,000,000.
The level of acuity to which each unit is filled is a tradeoff between utilization and rejections, but this
tradeoff is the same for both the best fill and equal filling options. The data we have gathered is slightly
adjusted to enhance the validity of the dataset. The transition matrix that is used in the simulation is a little
different from the observations. The other inputs, the arrival rate and the acuity distribution among new
patients were proven to not be significantly important to impact the conclusions we have drawn above.
Acuity Measurement at the Neonatal Intensive Care Unit
60
6. Conclusions and Recommendations This chapter summarizes the previous chapters and provides the answers to the research questions. The
limitations of this research will follow the conclusions. Practical recommendations for the NICU are given,
as well as some recommendations for further research.
6.1 Research Questions Chapter 1 discusses seven research questions that are answered throughout the other chapters. This
section will summarize the conclusions of all chapters and answer the research questions.
In Chapter 2 we saw that the NICU is a complex work environment where prematurely born babies and
babies born in need of IC care are treated. The organization of care is done by medical professionals, with
help from supporting departments. Important decisions regarding patient logistics and scheduling are also
made by medical experts. There are two important drawbacks of the current decision-making process: the
medical experts having a limited knowledge of and insight in logistical processes, and the lack of objectivity
in current workload approximations. Research question 1 is answered throughout this chapter. Research
question 2 is answered by introducing the three stakeholders staff, patients, and management. Each of
these stakeholders has its own performance indicator, but we conclude that a main problem of the NICU is
that quality of work, the staff’s measure of performance, cannot yet be measured.
Chapter 3 introduced acuity and patient classification models. A lot of models exist, but due to several
requirements, only few are applicable to the WKZ. This was the answer to research question 3. The model
we can use should be easy to use, quantifiable, accurately representing the nurses’ workload, and be
applicable to the entire perinatal division (research question 4). We combined two models to create a
classification system that fulfills all requirements. Each patient will be scored for that shift for the number
of similar patients a nurse can work on simultaneously, including several factors. This results in a total
number of nurses that are needed for a unit or the entire division (research question 5).
The performance of the model can be measured by tests on alignment, reliability, and validity. These
features are tested in a three-day pilot, followed by a two-week test period. Reliability means that the
model is generalizable for all nurses. This is measured by the percentage of absolute agreement of pairwise
comparisons of the patient classifications. This was 55.8% during the pilot, and 67.0% during the test period.
Both were judged to be sufficient. Validity was measured by comparing the results of the classifications to
the perception of workload. This proved to be significantly correlated for both tests. Alignment is the way
the model’s results agree with the actual performance. This answers research question 6.
Chapter 5 discussed the simulation experiments in which several policy changes were tested and compared
statistically. Using an acuity measurement system enables the nurses to better use their capacity, and to
identify idle time during which they can either help each other or work outside the ward. The experiments
indicated that basing decisions on acuity causes fewer overloaded shifts, but costs utilization and rejections.
These effects can be countered by not distributing the patients equally over all units and, instead using a
best-fill policy. This way a higher utilization and a lower number of yearly rejections can be realized, while
coping with the overloaded shifts by identifying idle nurse time. The fill level can be used to tune the actual
situation, reach the maximum number of overloaded shifts accepted, and obtain the maximal utilization
(research question 7).
Acuity Measurement at the Neonatal Intensive Care Unit
61
6.2 Limitations and Assumptions A couple of limitations to this research should be mentioned. The first limitation is the dataset that is used
for the simulation experiments. It is proven that the reliability of the transition matrix is very important for
the expected time a patient spends in the system, and can influence the experiments significantly. Section
5.2.5 assumes the effect to be comparable to changing the arrival rate, but this is not tested. It is hard to
research the effect of changes in the matrix on the recommendations that can be made from the
experiments. We have to assume that the transition matrix represents the patient flow throughout the
year. This assumption could be verified by using a longer period of data gathering.
The experiments do not take into account that the NICU works with three shifts, which we have proven to
differ significantly from each other in average acuity level. Another factor is the number of available nurses,
which is fixed in the experiments, but in reality varies from shift to shift. The effects of these factors on the
conclusions of this research cannot be predicted. The simulation also does not allow patients to be
transferred over units when admitted, which happens sometimes.
6.3 Recommendations From the conclusions from Section 6.1 we can draw several recommendations:
Introduce the acuity measurement system. Tests have proven that the model is reliable and valid,
and that it introduces several benefits on the operational planning level. Firstly, it prevents
unjustified refusals and unjustified admittances. This helps the department plan the organization
of care and reduce variability in demand. Secondly, the model helps the nurses identify time they
can spend supporting others, doing administrative tasks, or working on projects. The accuracy and
value of the system will improve over time as nurses get more acquainted to the classifications and
agree on a benchmark or performance indicator based on the acuity measurement. For the
implementation of the system are several factors to be coped with:
o Loss of autonomy. During and after the test period were there nurses who were afraid that
using acuity measurement would be leading in the determination of the requirements of
nurses. Acuity measurement will not be introduced at the WKZ for this reason, but to
better utilize the existing number of nurses. This should be emphasized when introducing
the model and is crucial for the nurses to understand to secure their involvement.
o Scoring too busy. When the nurses think that the measurement can have such an impact
on the management that the number of nurses attending each shift will change can the
nurses score too busy. When the average scores are higher than acceptable should be
analyzed how this can be adjusted, but hiring more nurses should be considered a last
option. The involvement of the nurses should make them understand that they themselves
benefit the most from truthful ratings.
o Scoring too quiet. When the nurses believe that the measurement will be used to evaluate
their performance can they score too quiet, overestimating their own capacity. This is
obviously undesirable. Because not every single nurse needs to score, but only the
coordinating nurse, will this not be possible. This is important to communicate
immediately to the nurses, since it can help reduce their resistance to using acuity
measurement.
Acuity Measurement at the Neonatal Intensive Care Unit
62
Benchmark all performance indicators. In order to improve the performance of the NICU, it is
important to not only measure the performance, but to also benchmark this performance. This
research enables measurement of all performance indicators, so the recommendation is to do so,
and agree on acceptable scores and target scores for all indicators. This helps setting goals, which
makes improvements more easily accomplished.
Use a best-fill policy. Because the use of the measurement system helps nurses support each other
overloaded shifts can be better coped with. A best-fill policy comes with more overloaded shifts,
but also leaves at least one unit with spare time. The benefits of introducing this assignment policy
can be up to 30% less refusals and over €1,000,000 of raised revenue.
Explore more research areas within healthcare logistics. This research was an exploratory first
project to see whether the department could benefit from healthcare logistics. The introduction of
the measurement system introduces several opportunities to do further research on the tactical
planning level, all of which could be very valuable for the NICU. My experience on the NICU was
that those involved with the research were enthusiastic and motivated to reach the research goals,
but I also experienced the resistance against new research opportunities and change. This
stretched the timespan of the research, particularly since the main motivation was to make an
actual contribution to the department. I would like to emphasize the mission statement of the
department, which clearly states that the department wants to “deliver top care and subsequently
academic research to both woman and baby”. I am convinced that this research contributes to
facilitating top care, and would like to encourage the department to expand their efforts in this
research area.
6.4 Further Research As stated above, the department could benefit from more research in the field of healthcare logistics. The
current research introduces the acuity measurement model, and explores the use of a best-fill policy, both
of which are improvements. However, there are several other factors that can influence the NICU’s
performance and may be worth researching further, based on the results of this research.
Include the MC and HC in the simulation. A lot of patients go to the MC and HC when transferred
from the NICU. This means that availability at the MC and HC is a contributing factor in the patient
flow. These units do not have the equipment or specialized nurses to provide all care necessary for
NICU patients. Training these nurses and purchasing equipment may promote patient flow. These
factors could contribute to a more efficient NICU, and may be worth researching.
Shifting patients between units. This already happens sometimes, for instance to place twins next
to each other. If for every admittance we allow a certain number of inter-unit transfers, could the
units better be filled. This flexibility may be worth the trouble, but it is hard to predict how often
the department will benefit from the transfers, and how large the benefits will be.
Assigning some activities to the evening- and nightshifts. We have seen that nurses prefer the
evening- and nightshifts over the dayshifts. Researching which activities can be shifted to the other
shifts can ultimately lead to fewer overloaded shifts. This will in time allow the management to re-
evaluate the fill-level, in order to raise utilization and further reduce rejections.
Acuity Measurement at the Neonatal Intensive Care Unit
63
Bibliography Bigbee, J., Collins, J., & Deeds, K. (1992). Patient Classification Systems: A New Approach to Computing
Reliability. Applied Nursing Research, 32-53.
Garcia, A. (2013). A Patient Acuity Checklist for the Digital Age. Nursing Critital Care.
Graham et al. (2012). Measuring and Promoting Inter-Rater Agreement of Teacher and Principal
Performance Ratings. Center for Educator Compensation Reform.
Gray et al. (1992). Neonatal therapeutic intervention scoring system: a therapy-based severity-of-illness
index. Pediatrics, 561-567.
Hamilton, K., Redshaw, M., & Tarnow-Mordi, W. (2007). Nurse Staffing in Relation to Risk-Adjusted
Mortality in Neonatal Care. Archives of Disease in Childhood. Fetal and Neonatal Edition., 99-103.
Hans, van Houdenhoven, & Hulshof. (2012). A Framework for Health Care Planning and Control.
Handbook of Healthcare Systems Scheduling, 303-320.
Harper, C., & McCulley, C. (2007). Acuity Systems Dialogue and Patient Classification System Essentials.
Nursing Administration Quarterly, 284-299.
Harper, P., & Shahani, A. (2002). Modelling for the Planning and Management of Bed Capacities in
Hospitals. The Journal of Operational Research Society, 11-18.
Horbar et al. (1993). Predicting Mortality Risk for Infants Weighing 501 to 1500 Grams at Birth: A National
Institutes of Health Neonatal Research Network Report. Critical Care Medicine, 12-18.
Law, A. (2007). Simulation Modeling & Analysis. McGraw-Hill.
Little, J. (1961). A Proof for the Queuing Formula L=λ/W. Operations Research, 383-387.
Martorella, C. (1996). Implementing a Patient Classification System. Nursing Management, 29-31.
Mullinax, C., & Lawley, M. (2002). Assigning Patients to Nurses in Neonatal Intensive Care. The Journal of
Operational Research Society, 25-35.
Northern Neonatal Network. (1993). Measuring Neonatal Nursing Workload. Archives of Disease in
Childhood, 539-543.
Persson, J., & Almeida, R. T. (1998). The Use of and Need for Patient Classification Systems in Swedish
Neonatal Care. Scandinavian University Press.
Profit, J et al. (2013). Correlation of Neonatal Intensive Care Unit Performance Across Multiple Measures
of Quality Care. JAMA Pediatrics, 47-54.
Richardson et al. (1993). Score for Neonatal Acute Physiology: A Physiologic Severity Index for Neonatal
Intensive Care. Pediatrics, 617-623.
Ridge et al. (1998). Capacity Planning for Intensive Care Units. European Journal of Operational Research,
346-355.
Robinson, S. (2008). Conceptual Modeling for Simulation Part 1: Definition and Requirements. The Journal
of Operations Research Society, 278-290.

Acuity Measurement at the Neonatal Intensive Care Unit
64
Sawatzky-Dickson, D., & Bodnaryk, K. (2009). Validation of a Tool to Measure Neonatal Nursing Workload.
Journal of Nursing Management, 84-91.
Spence et al. (2006). Measuring Nursing Workload in Neonatal Intensive Care. Journal of Nursing
Management, 227-234.
Stemler, A. (2004). A Comparison of Consensus, Consistency, and Measurement Approaches to Estimating
Interrater Reliability. Practical Assessment, Research & Evaluation.
Tarnow-Modi et al. (1993). The CRIB score: a Tool for Assessing Initial Neonatal Risk and Comparing
Performance of Neonatal Intensive Care Units. The Lancet, 193-198.
Tierney, L., & Conroy, K. (2014). Optimal Occupancy in the ICU: a Literature Review. Australian Critical
Care, 77-84.
UMC. (2014). Media Factsheet UMC Utrecht. Utrecht: Afdeling Marketing en Communicatie.
van Slyck, A., & Bermas, N. F. (1984). Patient Classification Systems and the Nursing Department.
Hospitals, 99-100.
Winston, W. (2004). Operations Research: Applications and Algorithms. Thomson Learning.
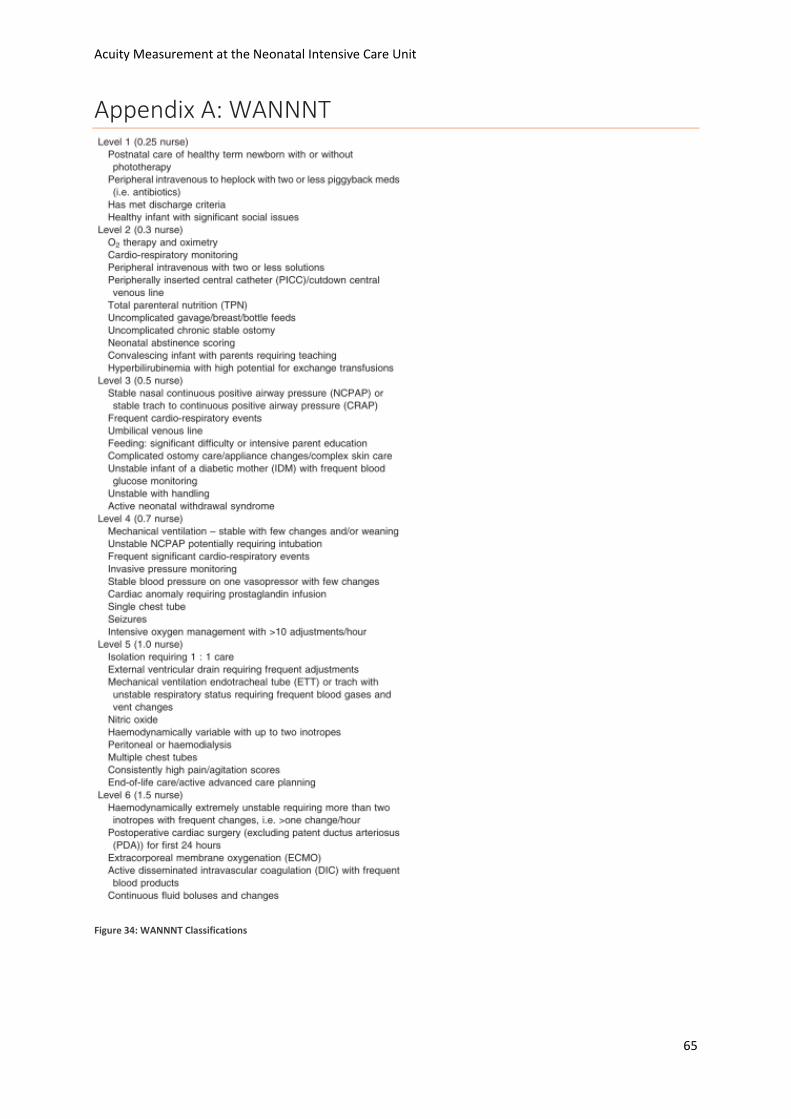
Acuity Measurement at the Neonatal Intensive Care Unit
65
Appendix A: WANNNT
Figure 34: WANNNT Classifications
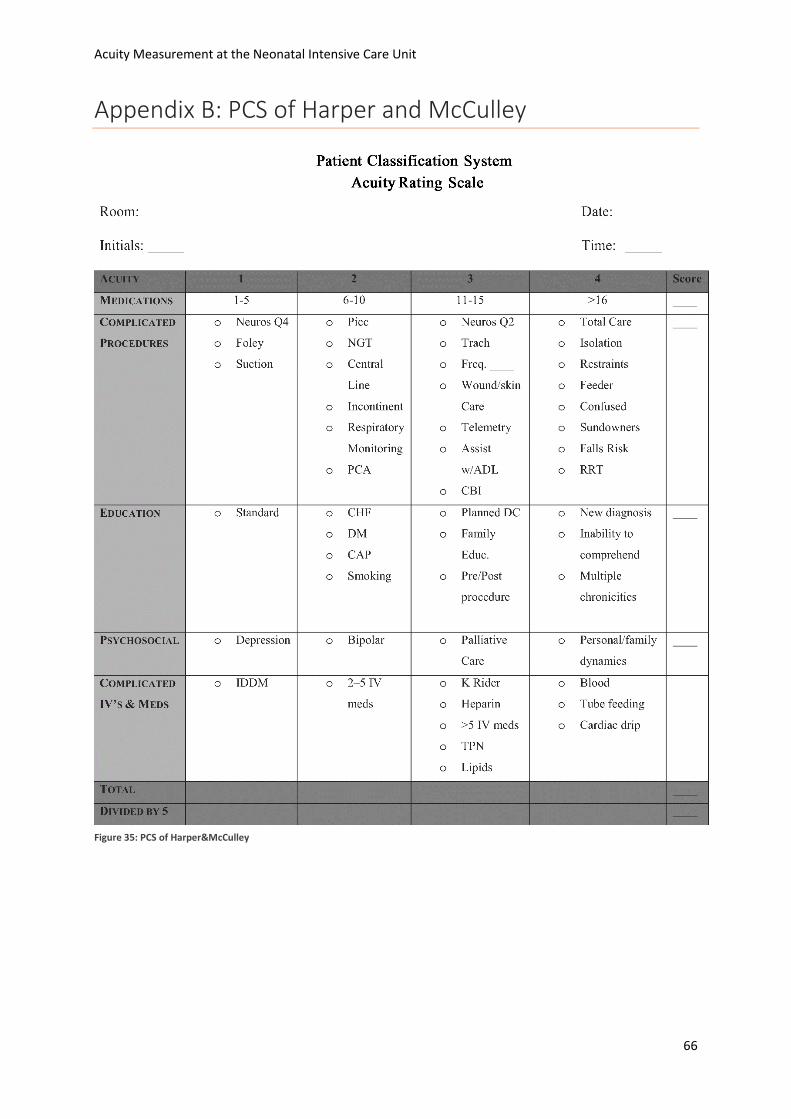
Acuity Measurement at the Neonatal Intensive Care Unit
66
Appendix B: PCS of Harper and McCulley
Figure 35: PCS of Harper&McCulley
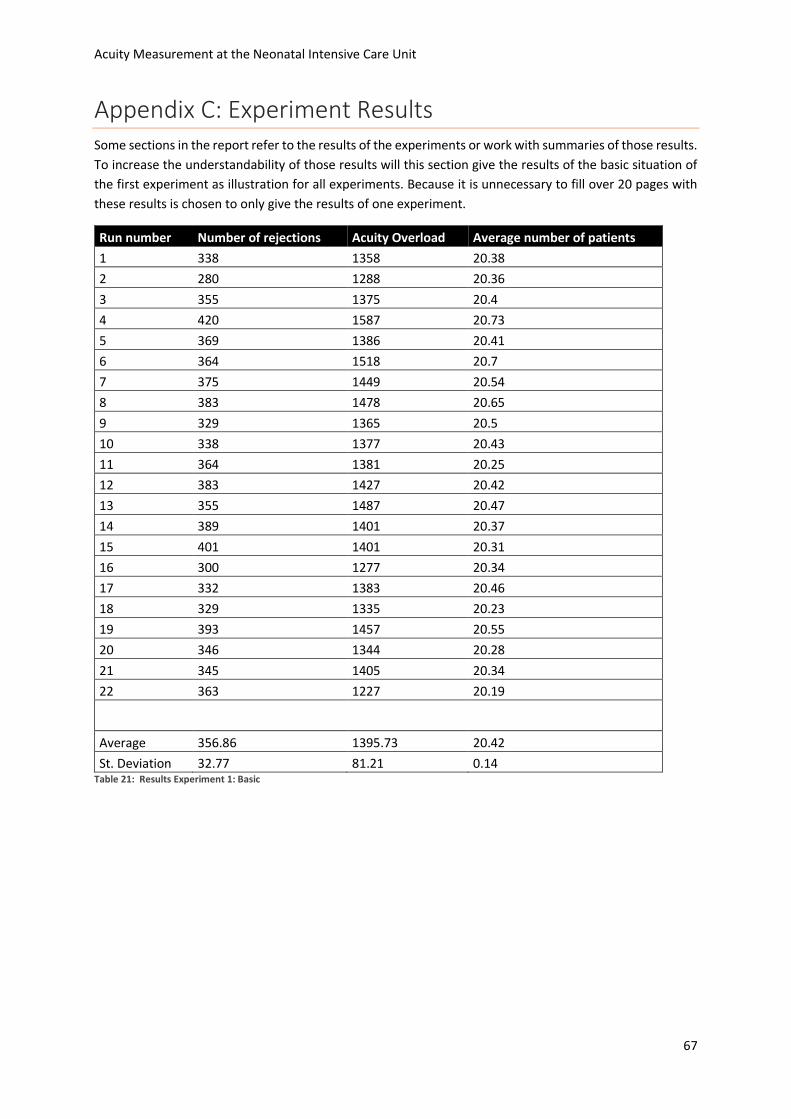
Acuity Measurement at the Neonatal Intensive Care Unit
67
Appendix C: Experiment Results Some sections in the report refer to the results of the experiments or work with summaries of those results.
To increase the understandability of those results will this section give the results of the basic situation of
the first experiment as illustration for all experiments. Because it is unnecessary to fill over 20 pages with
these results is chosen to only give the results of one experiment.
Run number Number of rejections Acuity Overload Average number of patients
1 338 1358 20.38
2 280 1288 20.36
3 355 1375 20.4
4 420 1587 20.73
5 369 1386 20.41
6 364 1518 20.7
7 375 1449 20.54
8 383 1478 20.65
9 329 1365 20.5
10 338 1377 20.43
11 364 1381 20.25
12 383 1427 20.42
13 355 1487 20.47
14 389 1401 20.37
15 401 1401 20.31
16 300 1277 20.34
17 332 1383 20.46
18 329 1335 20.23
19 393 1457 20.55
20 346 1344 20.28
21 345 1405 20.34
22 363 1227 20.19
Average 356.86 1395.73 20.42
St. Deviation 32.77 81.21 0.14 Table 21: Results Experiment 1: Basic
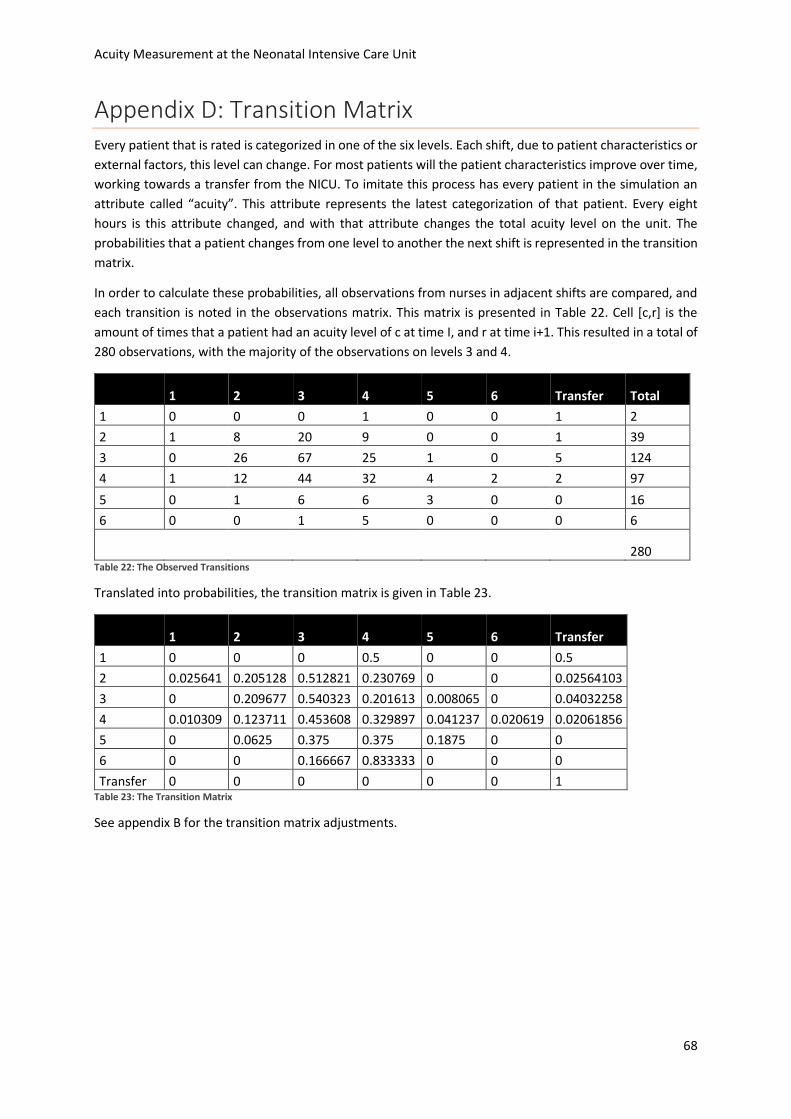
Acuity Measurement at the Neonatal Intensive Care Unit
68
Appendix D: Transition Matrix Every patient that is rated is categorized in one of the six levels. Each shift, due to patient characteristics or
external factors, this level can change. For most patients will the patient characteristics improve over time,
working towards a transfer from the NICU. To imitate this process has every patient in the simulation an
attribute called “acuity”. This attribute represents the latest categorization of that patient. Every eight
hours is this attribute changed, and with that attribute changes the total acuity level on the unit. The
probabilities that a patient changes from one level to another the next shift is represented in the transition
matrix.
In order to calculate these probabilities, all observations from nurses in adjacent shifts are compared, and
each transition is noted in the observations matrix. This matrix is presented in Table 22. Cell [c,r] is the
amount of times that a patient had an acuity level of c at time I, and r at time i+1. This resulted in a total of
280 observations, with the majority of the observations on levels 3 and 4.
1 2 3 4 5 6 Transfer Total
1 0 0 0 1 0 0 1 2
2 1 8 20 9 0 0 1 39
3 0 26 67 25 1 0 5 124
4 1 12 44 32 4 2 2 97
5 0 1 6 6 3 0 0 16
6 0 0 1 5 0 0 0 6
280
Table 22: The Observed Transitions
Translated into probabilities, the transition matrix is given in Table 23.
1 2 3 4 5 6 Transfer
1 0 0 0 0.5 0 0 0.5
2 0.025641 0.205128 0.512821 0.230769 0 0 0.02564103
3 0 0.209677 0.540323 0.201613 0.008065 0 0.04032258
4 0.010309 0.123711 0.453608 0.329897 0.041237 0.020619 0.02061856
5 0 0.0625 0.375 0.375 0.1875 0 0
6 0 0 0.166667 0.833333 0 0 0
Transfer 0 0 0 0 0 0 1 Table 23: The Transition Matrix
See appendix B for the transition matrix adjustments.

Acuity Measurement at the Neonatal Intensive Care Unit
69
Appendix E: Absorbing Markov Chain Calculations Each patient will over time be scored for several levels of acuity, until eventually the patient leaves the
NICU. This process can be represented in a Markov chain. A Markov chain is a process that jumps from state
to state within a predetermined series of states. For each state is there a different set of probabilities in
which the process can be at the next moment. The transition matrix can be seen as a Markov Chain. Each
patient finds itself to be in a certain state, and has a probability of being a different level of acuity the next
shift.
The transition matrix is a special kind of Markov chain, it is an absorbing Markov chain. This means that
there is one state where, once reached, the process never leaves that state. When a patient leaves the
NICU, we end the chain and never leave that state again. Returning patients can be treated as new patients
in this theory. For absorbing Markov chains can be calculated what the average amount of steps is from
each single state to reach the absorbing state. Translating to the NICU can we calculate for each level of
acuity what the expected time is for a patient to be in the ward.
The calculations for this amount of steps is as follows. First, name the probability matrix for all transient
(non-absorbing) states, Q. Subtract this matrix from the pivot matrix I, and take the inverse:
𝑁 = (𝐼 − 𝑄)−1
These calculations are done in excel. Table 24 gives Q, Table 25 N.
1 2 3 4 5 6 Transfer
1 0 0 0 0.5 0 0 0.5
2 0.025641 0.205128 0.512821 0.230769 0 0 0.025641
3 0 0.209677 0.540323 0.201613 0.008065 0 0.0403226
4 0.010309 0.123711 0.453608 0.329897 0.041237 0.020619 0.0206186
5 0 0.0625 0.375 0.375 0.1875 0 0
6 0 0 0.166667 0.833333 0 0 0 Table 24: Q
1.1093567 2.5880116 7.2655929 4.1707531 0.2837948 0.0859949
0.2318057 6.1900565 14.36429 7.0893683 0.5023829 0.1461725
0.2054099 5.1859766 15.362336 7.0263053 0.5090884 0.1448723
0.2187135 5.1760232 14.531186 8.3415063 0.5675897 0.1719898
0.2135804 5.2586196 14.901955 7.6381721 1.7663424 0.1574881
0.2164962 5.1776821 14.669711 8.1223061 0.5578395 1.1674702 Table 25: N
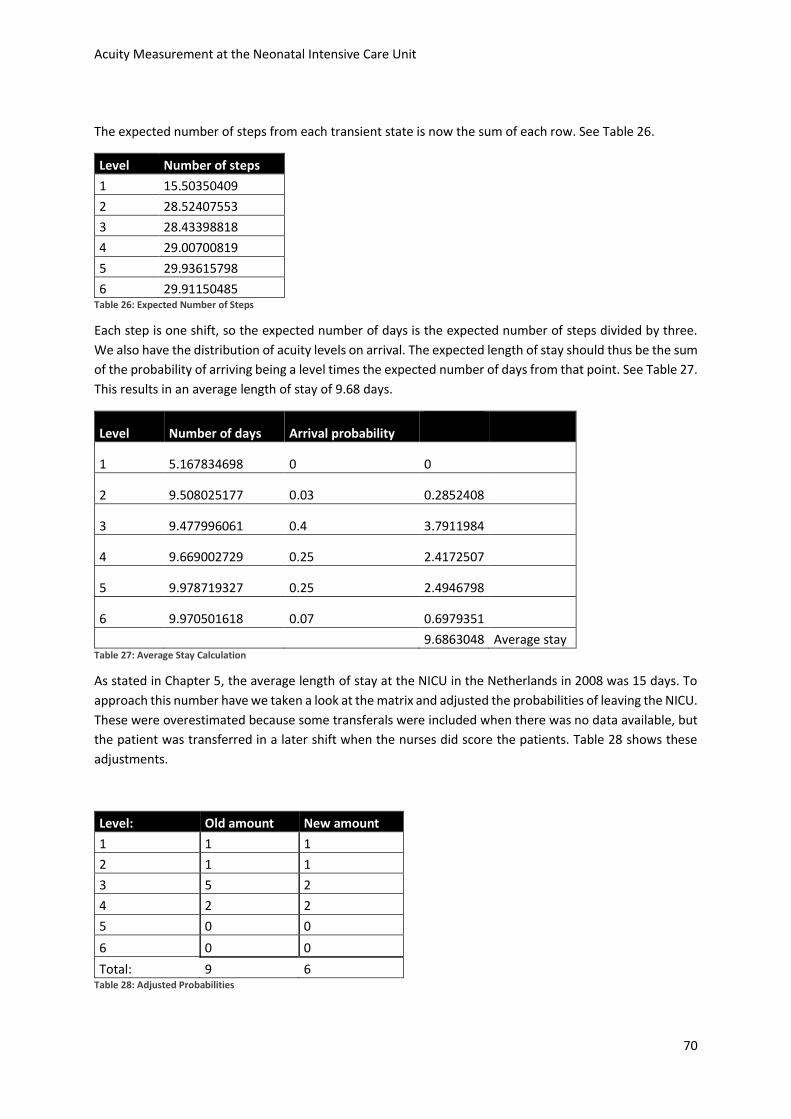
Acuity Measurement at the Neonatal Intensive Care Unit
70
The expected number of steps from each transient state is now the sum of each row. See Table 26.
Level Number of steps
1 15.50350409
2 28.52407553
3 28.43398818
4 29.00700819
5 29.93615798
6 29.91150485 Table 26: Expected Number of Steps
Each step is one shift, so the expected number of days is the expected number of steps divided by three.
We also have the distribution of acuity levels on arrival. The expected length of stay should thus be the sum
of the probability of arriving being a level times the expected number of days from that point. See Table 27.
This results in an average length of stay of 9.68 days.
Level Number of days Arrival probability
1 5.167834698 0 0
2 9.508025177 0.03 0.2852408
3 9.477996061 0.4 3.7911984
4 9.669002729 0.25 2.4172507
5 9.978719327 0.25 2.4946798
6 9.970501618 0.07 0.6979351
9.6863048 Average stay Table 27: Average Stay Calculation
As stated in Chapter 5, the average length of stay at the NICU in the Netherlands in 2008 was 15 days. To
approach this number have we taken a look at the matrix and adjusted the probabilities of leaving the NICU.
These were overestimated because some transferals were included when there was no data available, but
the patient was transferred in a later shift when the nurses did score the patients. Table 28 shows these
adjustments.
Level: Old amount New amount
1 1 1
2 1 1
3 5 2
4 2 2
5 0 0
6 0 0
Total: 9 6 Table 28: Adjusted Probabilities
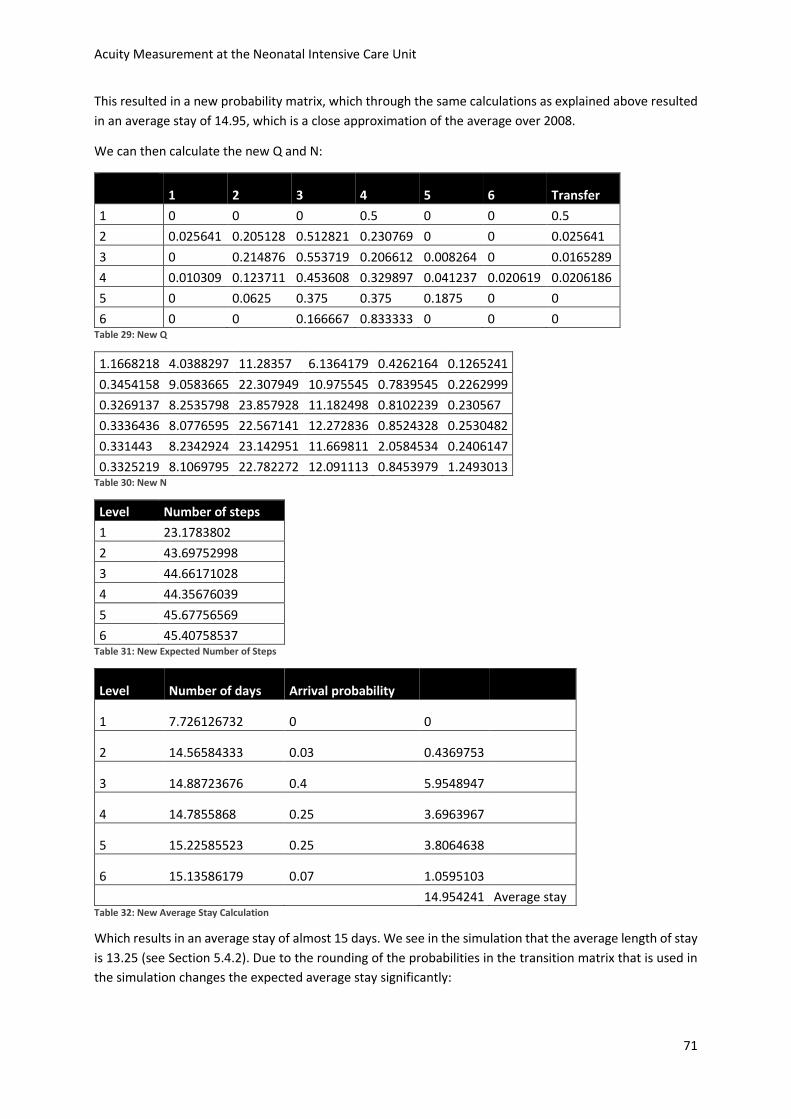
Acuity Measurement at the Neonatal Intensive Care Unit
71
This resulted in a new probability matrix, which through the same calculations as explained above resulted
in an average stay of 14.95, which is a close approximation of the average over 2008.
We can then calculate the new Q and N:
1 2 3 4 5 6 Transfer
1 0 0 0 0.5 0 0 0.5
2 0.025641 0.205128 0.512821 0.230769 0 0 0.025641
3 0 0.214876 0.553719 0.206612 0.008264 0 0.0165289
4 0.010309 0.123711 0.453608 0.329897 0.041237 0.020619 0.0206186
5 0 0.0625 0.375 0.375 0.1875 0 0
6 0 0 0.166667 0.833333 0 0 0 Table 29: New Q
1.1668218 4.0388297 11.28357 6.1364179 0.4262164 0.1265241
0.3454158 9.0583665 22.307949 10.975545 0.7839545 0.2262999
0.3269137 8.2535798 23.857928 11.182498 0.8102239 0.230567
0.3336436 8.0776595 22.567141 12.272836 0.8524328 0.2530482
0.331443 8.2342924 23.142951 11.669811 2.0584534 0.2406147
0.3325219 8.1069795 22.782272 12.091113 0.8453979 1.2493013 Table 30: New N
Level Number of steps
1 23.1783802
2 43.69752998
3 44.66171028
4 44.35676039
5 45.67756569
6 45.40758537 Table 31: New Expected Number of Steps
Level Number of days Arrival probability
1 7.726126732 0 0
2 14.56584333 0.03 0.4369753
3 14.88723676 0.4 5.9548947
4 14.7855868 0.25 3.6963967
5 15.22585523 0.25 3.8064638
6 15.13586179 0.07 1.0595103
14.954241 Average stay Table 32: New Average Stay Calculation
Which results in an average stay of almost 15 days. We see in the simulation that the average length of stay
is 13.25 (see Section 5.4.2). Due to the rounding of the probabilities in the transition matrix that is used in
the simulation changes the expected average stay significantly:
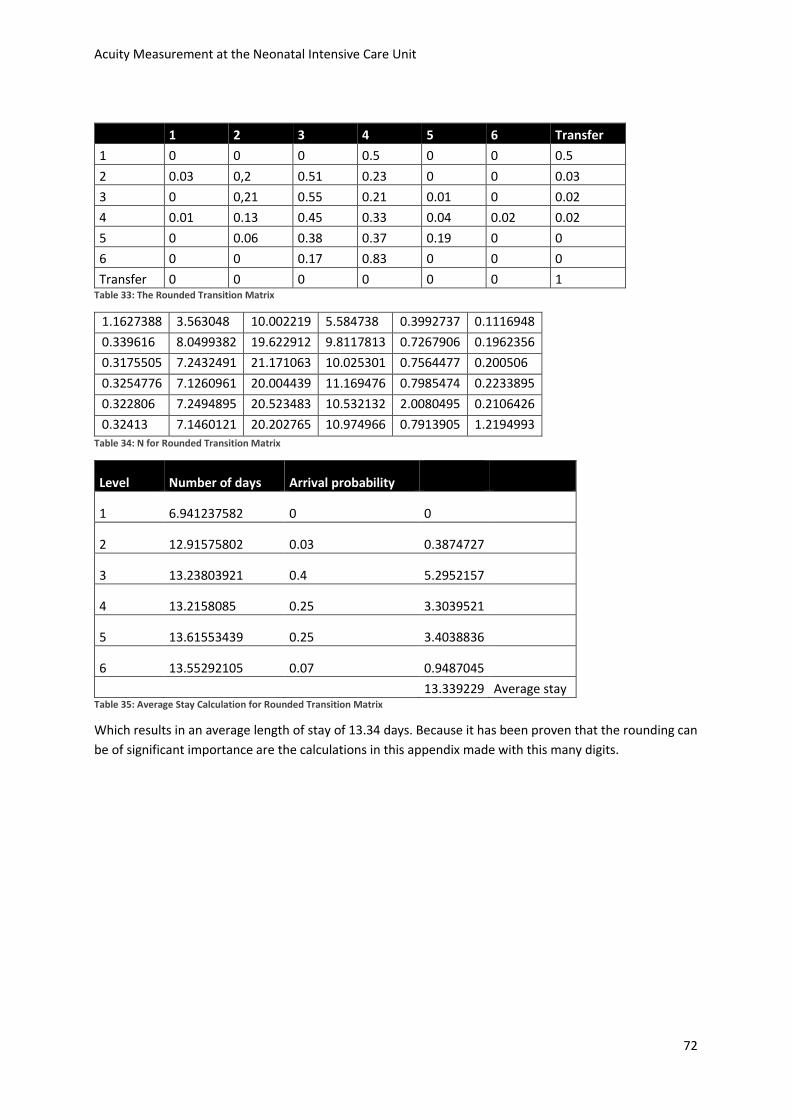
Acuity Measurement at the Neonatal Intensive Care Unit
72
1 2 3 4 5 6 Transfer
1 0 0 0 0.5 0 0 0.5
2 0.03 0,2 0.51 0.23 0 0 0.03
3 0 0,21 0.55 0.21 0.01 0 0.02
4 0.01 0.13 0.45 0.33 0.04 0.02 0.02
5 0 0.06 0.38 0.37 0.19 0 0
6 0 0 0.17 0.83 0 0 0
Transfer 0 0 0 0 0 0 1 Table 33: The Rounded Transition Matrix
1.1627388 3.563048 10.002219 5.584738 0.3992737 0.1116948
0.339616 8.0499382 19.622912 9.8117813 0.7267906 0.1962356
0.3175505 7.2432491 21.171063 10.025301 0.7564477 0.200506
0.3254776 7.1260961 20.004439 11.169476 0.7985474 0.2233895
0.322806 7.2494895 20.523483 10.532132 2.0080495 0.2106426
0.32413 7.1460121 20.202765 10.974966 0.7913905 1.2194993
Table 34: N for Rounded Transition Matrix
Level Number of days Arrival probability
1 6.941237582 0 0
2 12.91575802 0.03 0.3874727
3 13.23803921 0.4 5.2952157
4 13.2158085 0.25 3.3039521
5 13.61553439 0.25 3.4038836
6 13.55292105 0.07 0.9487045
13.339229 Average stay Table 35: Average Stay Calculation for Rounded Transition Matrix
Which results in an average length of stay of 13.34 days. Because it has been proven that the rounding can
be of significant importance are the calculations in this appendix made with this many digits.
Acuity Measurement at the Neonatal Intensive Care Unit
73
Appendix F: Replications Each experiment that is simulated runs for a certain amount of days, for a certain amount of runs. Each run
is another simulation of that amount of days with different random numbers. To determine the amount of
runs that is necessary for a reliable result, we use the replication/deletion method (Law, 2009).
In this method, start by determining a large number of runs, which we will do for one experiment. For the
three outputs, we take the running mean of all runs so far, and compare the 95% confidence interval half-
width to that running mean. When the confidence interval half-width is smaller than 5% of the running
mean, we have a sufficient amount of runs.
The formula for the confidence interval half-width:
Where n is the run number, a is the confidence level, and Sn is the standard deviation of the results up to
run number n.
And we look for the first run to suffice:
Where Xn is the running mean until run n and gamma is the error (5%).
For our basic scenario, this resulted in Tables 36, 37, and 38
. The number of rejections needs the largest number of runs to suffice the error margin, so we use that
number of replications, which is 22 (see Table 36).
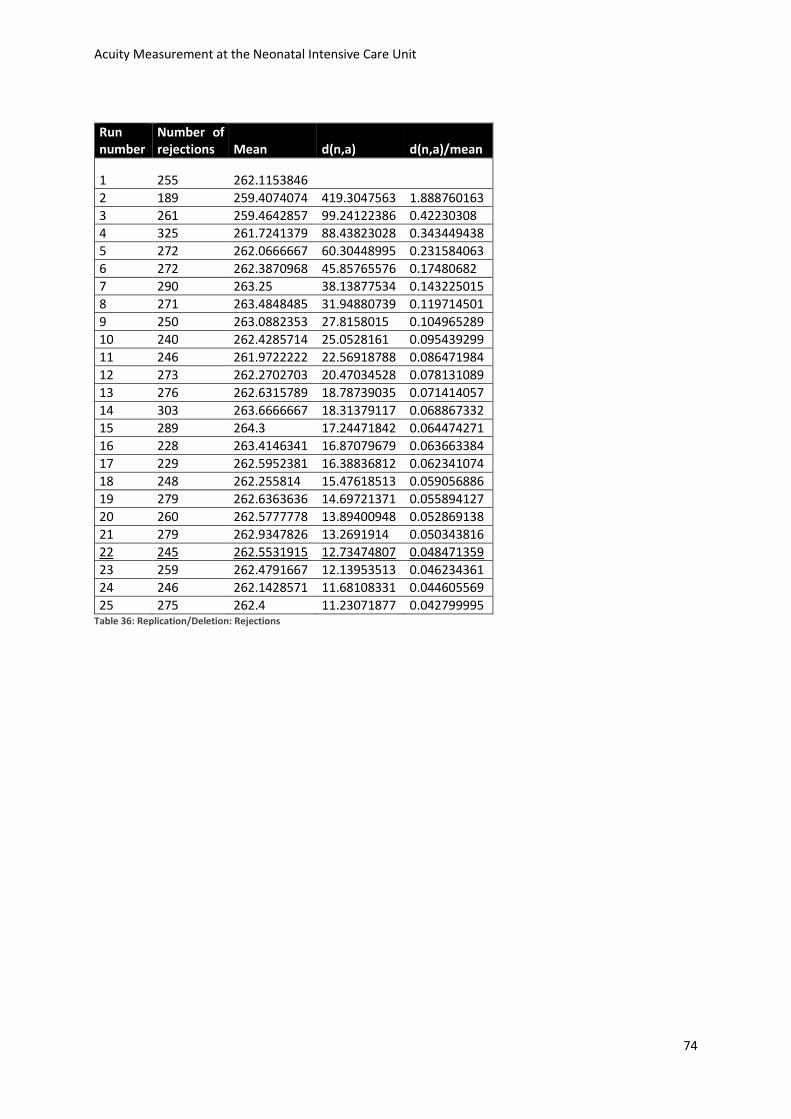
Acuity Measurement at the Neonatal Intensive Care Unit
74
Run number
Number of rejections Mean d(n,a) d(n,a)/mean
1 255 262.1153846
2 189 259.4074074 419.3047563 1.888760163
3 261 259.4642857 99.24122386 0.42230308 4 325 261.7241379 88.43823028 0.343449438
5 272 262.0666667 60.30448995 0.231584063
6 272 262.3870968 45.85765576 0.17480682
7 290 263.25 38.13877534 0.143225015
8 271 263.4848485 31.94880739 0.119714501
9 250 263.0882353 27.8158015 0.104965289
10 240 262.4285714 25.0528161 0.095439299
11 246 261.9722222 22.56918788 0.086471984
12 273 262.2702703 20.47034528 0.078131089
13 276 262.6315789 18.78739035 0.071414057
14 303 263.6666667 18.31379117 0.068867332
15 289 264.3 17.24471842 0.064474271
16 228 263.4146341 16.87079679 0.063663384
17 229 262.5952381 16.38836812 0.062341074
18 248 262.255814 15.47618513 0.059056886
19 279 262.6363636 14.69721371 0.055894127
20 260 262.5777778 13.89400948 0.052869138
21 279 262.9347826 13.2691914 0.050343816
22 245 262.5531915 12.73474807 0.048471359
23 259 262.4791667 12.13953513 0.046234361
24 246 262.1428571 11.68108331 0.044605569
25 275 262.4 11.23071877 0.042799995 Table 36: Replication/Deletion: Rejections
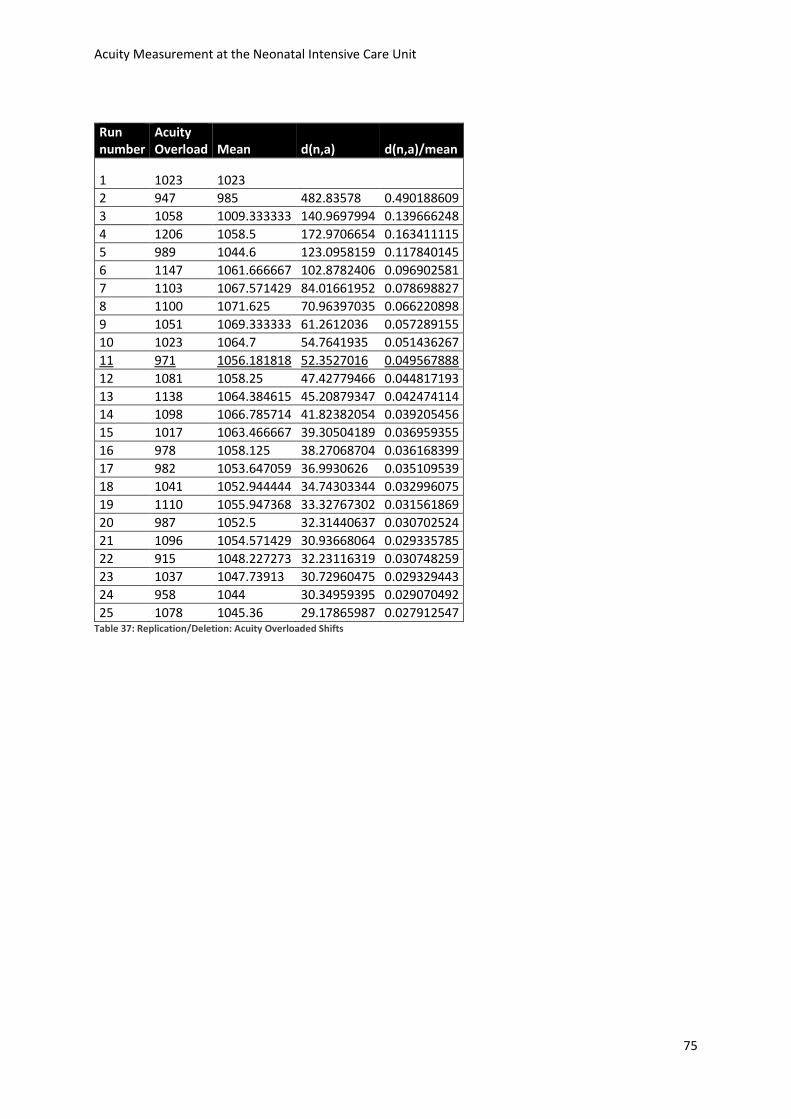
Acuity Measurement at the Neonatal Intensive Care Unit
75
Run number
Acuity Overload Mean d(n,a) d(n,a)/mean
1 1023 1023
2 947 985 482.83578 0.490188609
3 1058 1009.333333 140.9697994 0.139666248
4 1206 1058.5 172.9706654 0.163411115
5 989 1044.6 123.0958159 0.117840145
6 1147 1061.666667 102.8782406 0.096902581
7 1103 1067.571429 84.01661952 0.078698827
8 1100 1071.625 70.96397035 0.066220898
9 1051 1069.333333 61.2612036 0.057289155
10 1023 1064.7 54.7641935 0.051436267
11 971 1056.181818 52.3527016 0.049567888
12 1081 1058.25 47.42779466 0.044817193
13 1138 1064.384615 45.20879347 0.042474114
14 1098 1066.785714 41.82382054 0.039205456
15 1017 1063.466667 39.30504189 0.036959355
16 978 1058.125 38.27068704 0.036168399
17 982 1053.647059 36.9930626 0.035109539
18 1041 1052.944444 34.74303344 0.032996075
19 1110 1055.947368 33.32767302 0.031561869
20 987 1052.5 32.31440637 0.030702524
21 1096 1054.571429 30.93668064 0.029335785
22 915 1048.227273 32.23116319 0.030748259
23 1037 1047.73913 30.72960475 0.029329443
24 958 1044 30.34959395 0.029070492
25 1078 1045.36 29.17865987 0.027912547 Table 37: Replication/Deletion: Acuity Overloaded Shifts
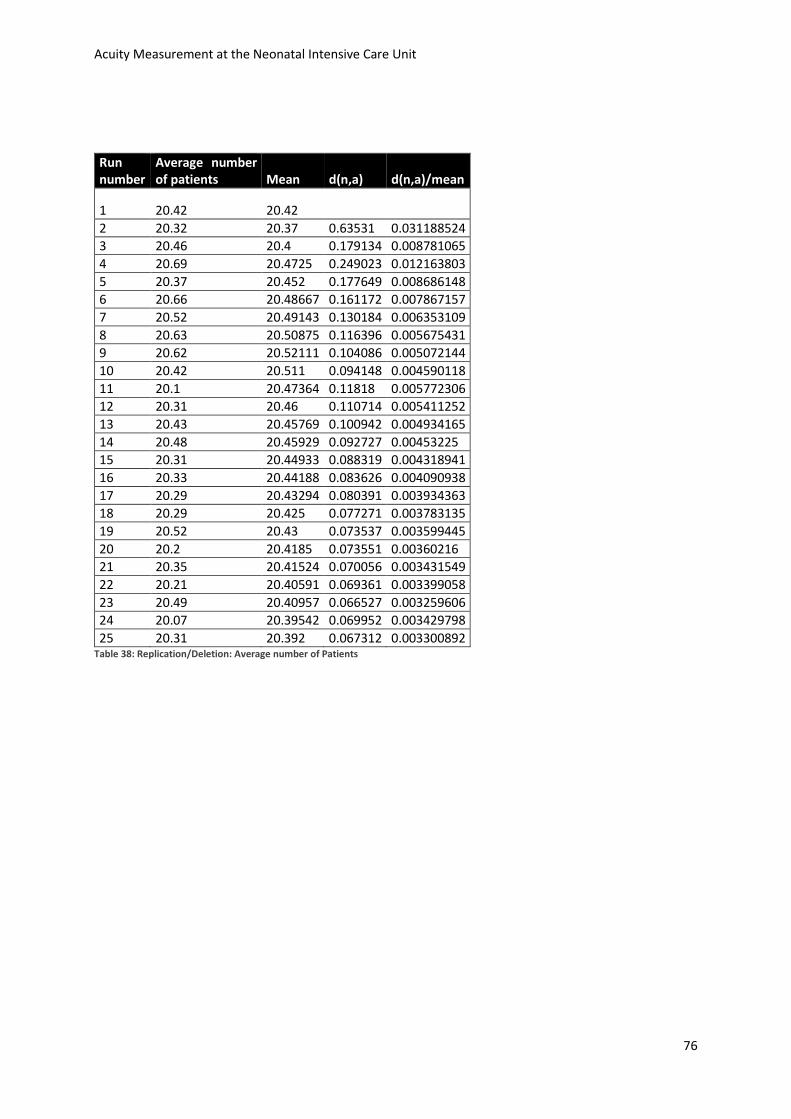
Acuity Measurement at the Neonatal Intensive Care Unit
76
Run number
Average number of patients Mean d(n,a) d(n,a)/mean
1 20.42 20.42
2 20.32 20.37 0.63531 0.031188524
3 20.46 20.4 0.179134 0.008781065
4 20.69 20.4725 0.249023 0.012163803
5 20.37 20.452 0.177649 0.008686148
6 20.66 20.48667 0.161172 0.007867157
7 20.52 20.49143 0.130184 0.006353109
8 20.63 20.50875 0.116396 0.005675431
9 20.62 20.52111 0.104086 0.005072144
10 20.42 20.511 0.094148 0.004590118
11 20.1 20.47364 0.11818 0.005772306
12 20.31 20.46 0.110714 0.005411252
13 20.43 20.45769 0.100942 0.004934165
14 20.48 20.45929 0.092727 0.00453225
15 20.31 20.44933 0.088319 0.004318941
16 20.33 20.44188 0.083626 0.004090938
17 20.29 20.43294 0.080391 0.003934363
18 20.29 20.425 0.077271 0.003783135
19 20.52 20.43 0.073537 0.003599445
20 20.2 20.4185 0.073551 0.00360216
21 20.35 20.41524 0.070056 0.003431549
22 20.21 20.40591 0.069361 0.003399058
23 20.49 20.40957 0.066527 0.003259606
24 20.07 20.39542 0.069952 0.003429798
25 20.31 20.392 0.067312 0.003300892 Table 38: Replication/Deletion: Average number of Patients


![Intensive Care - Neonatal / Special Care NurseryB-0390] Intensive Care... · The Intensive Care – Neonatal / Special Care Nursery HPU was originally developed for NSW Health and](https://img.pdfslide.us/doc/110x75/5e206e3f4ac3f2591909ccbf/intensive-care-neonatal-special-care-nursery-b-0390-intensive-care-the.jpg)