Embed Size (px)
Citation preview
ACTUARIAL PROJECTIONS FOR THENATIONAL RELIGIOUS RETIREMENTOFFICEMAY 5, 2016
ACTUARIAL PROJECTIONS FOR THE NATIONAL RELIGIOUSRETIREMENT OFFICE
THE NATIONAL RELIGIOUS RETIREMENT OFFICE
MERCER
u:\ret\cons\wdc\natrio\2016\8yr\specialproj\cost projections\actuarial projections report final.docx
i
CONTENTS
1. Introduction ............................................................................................................... 1
2. Actuarial Assumptions ............................................................................................... 4
3. Demographic Data and Projections ........................................................................... 9
4. Social Security Benefit Projections .......................................................................... 11
5. Cost of Care Projections ......................................................................................... 13
6. Retirement Fund Projections and Retirement Liabilities .......................................... 15

ACTUARIAL PROJECTIONS FOR THE NATIONAL RELIGIOUSRETIREMENT OFFICE
THE NATIONAL RELIGIOUS RETIREMENT OFFICE
MERCER
u:\ret\cons\wdc\natrio\2016\8yr\specialproj\cost projections\actuarial projections report final.docx
1
1IntroductionMercer has prepared this report exclusively for the National Religious Retirement Office (NRRO)for the following purposes:
• Present projections of the costs of caring for retired members over the 20-year periodbeginning on January 1, 2015. As all Social Security benefits received are used to offset thecosts of caring for retired members, projections of Social Security benefits received bymembers are also presented.
• Present projections of assets available to cover retired members’ costs. These projectionsare presented on two different bases, one reflecting only those assets currently designatedfor retirement purposes and the other reflecting all assets that could possibly be used forretirement purposes.
• Present projections of the numbers of active and retired members over the next 20 years.• Identify the present value of retirement care costs that will still remain as of December 31,
2034.• Compare some of the results of these projections to projection results obtained in a 2012
study.
This valuation report may not be used or relied upon by any other party or for any other purpose;Mercer is not responsible for the consequences of any unauthorized use.
This report is based on a snapshot of the estimated financial condition of the religious institutes,in aggregate, with regard to their retirement assets and costs at a particular point in time. Theprojections are based on financial and census data reported to the NRRO as of December 31,2014. The projections of asset levels and retirement costs over the next 20 years represent onescenario resulting from current asset and cost levels and assumptions about how those amountsmight change in the future. Any deviations between the assumptions used and actualexperience will lead to future asset and cost levels that are different from those projected in thisreport.
Over time, the actual ability to cover retirement costs depends on a number of factors, includingchanges in annual retirement cost levels, the number of retired members, the level of SocialSecurity benefits received, and the amount earned on any assets invested to cover retirementcosts. These amounts and other variables are uncertain and unknowable at the valuation date,but are likely to fall within a reasonable range of possibilities.
This study includes projections of future costs and other related results. To prepare theseprojections or results, various actuarial assumptions, as described in this report were used to
ACTUARIAL PROJECTIONS FOR THE NATIONAL RELIGIOUSRETIREMENT OFFICE
THE NATIONAL RELIGIOUS RETIREMENT OFFICE
MERCER
u:\ret\cons\wdc\natrio\2016\8yr\specialproj\cost projections\actuarial projections report final.docx
2
project a limited number of scenarios from a range of possibilities. However, the future isuncertain, and actual experience will likely differ from the assumptions utilized and the scenariospresented; these differences may be significant or material. In addition, different assumptions ofscenarios may also be within the reasonable range and results based on those assumptionswould be different. This study has been created for a limited purpose, is presented at a particularpoint in time, and should not be viewed as a prediction of the future financial condition of theassets and associated liabilities for women and men religious (“Religious”).
This study is based on census data provided by the NRRO. The Office is solely responsible forthe validity, accuracy, and comprehensiveness of this information; the results can be expectedto differ and may need to be revised if the underlying data supplied is incomplete or inaccurate.
Mercer has prepared this report exclusively for the NRRO. Mercer is not responsible for use ofthis report by any other party.
Mercer has prepared this report to identify the current and projected retirement costs of womenand men religious. This report may not be used for any other purpose; Mercer is not responsiblefor the consequences of any unauthorized use. Its content may not be modified, incorporatedinto or used in other material, sold or otherwise provided, in whole or in part, to any other personor entity, without Mercer’s permission.
This report was prepared in accordance with generally accepted actuarial principles andprocedures. Based on the information provided to us, we believe that the actuarial assumptionsare reasonable for the purposes described in this report.
All parts of this report, including any documents incorporated by reference, are integral tounderstanding and explaining its contents; no part may be taken out of context, used or reliedupon without reference to the report as a whole.
Decisions at the individual institutes and congregations about benefit changes, granting newbenefits, investment policy and/or funding policy, benefit security and/or benefit related issuesshould not be made solely on the basis of this report, but only after careful consideration ofalternative economic, financial, demographic and societal factors, including financial scenariosthat assume future sustained investment losses.
The NRRO should notify Mercer promptly after receipt of this report if the NRRO disagrees withanything contained herein or is aware of any information that would affect these results that hasnot been communicated to Mercer or incorporated herein.
The congregations reporting assets to the NRRO are solely responsible for selecting theinvestment policies, asset allocations and individual investments for their respective assets,including those designated for retirement. The Mercer actuaries who prepared this report have
ACTUARIAL PROJECTIONS FOR THE NATIONAL RELIGIOUSRETIREMENT OFFICE
THE NATIONAL RELIGIOUS RETIREMENT OFFICE
MERCER
u:\ret\cons\wdc\natrio\2016\8yr\specialproj\cost projections\actuarial projections report final.docx
3
not provided any investment advice to the NRRO or to the congregations reporting assets to theNRRO.
We used financial data submitted by the NRRO as of the valuation date without further audit.Customarily, this information would not be verified by the actuary. We have reviewed theinformation for internal consistency and general reasonableness.
Professional QualificationsI am available to answer any questions on the material in this report or to provide explanationsor further details as appropriate. The undersigned credentialed actuary meets the QualificationStandards of the American Academy of Actuaries to render the actuarial opinion contained inthis report. I am not aware of any direct or material indirect financial interest or relationship,including investments or other services, that could create a conflict of interest that would impairthe objectivity of this work.
May 5, 2016James Baughman, ASA, EA, MAAAEnrolled Actuary (No. 14-06714)
Date
Mercer (US) Inc.1050 Connecticut Avenue NWSuite 700Washington, DC 20036-5386
+1 202 331 5200
ACTUARIAL PROJECTIONS FOR THE NATIONAL RELIGIOUSRETIREMENT OFFICE
THE NATIONAL RELIGIOUS RETIREMENT OFFICE
MERCER
u:\ret\cons\wdc\natrio\2016\8yr\specialproj\cost projections\actuarial projections report final.docx
4
2Actuarial AssumptionsBasis and Significance of SelectionIn anticipating the future financial needs of the Religious, it is necessary to have expectationsconcerning the future characteristics of the Religious population and the levels of those itemsthat generate revenue and expense for the Religious. To prepare future estimates of this type,assumptions need to be made concerning the frequency and timing of certain future events. Forthose events that are economic in nature, rates of future increases need to be approximated.
Actuarial assumptions are a significant component of any projections into the future. In order forthe projections to be at all reliable, the assumptions used need to be reasonable based on thosefacts that are already known. Slight deviations between future experience and the assumptionsused will not generally decrease the reliability of the projection results. However, significantdeviations will harm the credibility of the projections, so any user of the projections needs to beaware of how the Religious experience since the date of the study is comparing to the assumedexperience. In judging whether or not there have been deviations, consider that the assumptionsused are long-term assumptions; they represent the best guess estimate of future experienceover a 20-year period. Actual experience may differ from the assumptions each year, but overthe longer 20-year period, the assumptions are intended to represent the average experience.
Demographic assumptions are those assumptions related to future Religious populationchanges. These assumptions are based on past NRRO analyses of member congregationexperience and expectations of how that experience will change in the future. Generally, futureexperience has been assumed to be the same as recent past experience. The assumptionselections are also based on our understanding of member congregation experience and how itmight change. Although the member congregations do occasionally have new members andterminations, the incidence of such population changes is so small that they have been deemedto have an immaterial impact on the projections. We have found in our work with other religiousorganizations that this is often a very reasonable assumption.
The economic assumptions are based on past trends and current indicators. For the investmentyield assumption, we have used an assumption of 6.25% as selected by the NRRO. We believethat the investment yield assumption is reasonable for the purposes described in the report,based on the assumption that all congregations in aggregate were held in a balance of 55%equity investments and 45% fixed income investments.
For the cost of care, actual cost of care cost increases have been under 5% in five of the pastsix years. In fact, increases to the annual cost of care have averaged 2.4% for men and 3.1% for
ACTUARIAL PROJECTIONS FOR THE NATIONAL RELIGIOUSRETIREMENT OFFICE
THE NATIONAL RELIGIOUS RETIREMENT OFFICE
MERCER
u:\ret\cons\wdc\natrio\2016\8yr\specialproj\cost projections\actuarial projections report final.docx
5
women during the past 10 years. In the 2012 study, the cost of care was assumed to increaseby 5% per year. After taking the recent historical information into account, the NRRO hasreduced the assumption to 4.25%. However, since there could be significant variability in futurecosts and this assumption will have a significant impact on the results presented in this actuarialanalysis, we also presented certain results assuming future costs would increase by 3.25%annually. With this information, the NRRO will have some indication of the impact of future costincrease deviations on the projections in this report.
The mortality assumptions for men and women were updated from the 2012 study, which werebased on rates developed in the 1990’s. The updated assumptions incorporate an updated basetable and a scale to project future longevity improvements.
The updated base table is based on results from a mortality experience study which Mercerprepared for The Resource Center for Religious Institutes (RCRI) in 2014. The study reflectedmortality experience from January 1, 2003 to December 31, 2013 for both men and women.
In addition, recent studies by the Society of Actuaries and the Social Security Administration(SSA) indicate that people continue to live longer than previous generations, and these longevityimprovements are expected to continue. Whether these trends would continue into the future isspeculative. However, it is difficult to challenge the evidence of past improvements. Agenerational mortality projection scale is incorporated in this study. The projection scale is two-dimensional, in that the forecasted rates of improved longevity vary based on both a member’sage and date of birth (for example, the rate of improvement for a 70 year old born in 1950 isdifferent from a 70 year old born in 1970). The scale is based on projected rates of longevityimprovement published by the SSA in its 2014 Trustees report. More detail on the assumptionsis provided under Demographic Assumptions in this section.
ACTUARIAL PROJECTIONS FOR THE NATIONAL RELIGIOUSRETIREMENT OFFICE
THE NATIONAL RELIGIOUS RETIREMENT OFFICE
MERCER
u:\ret\cons\wdc\natrio\2016\8yr\specialproj\cost projections\actuarial projections report final.docx
6
Defining retirement for a group of this type can be difficult since many individuals who might beconsidered to be retired using certain criteria, might not consider themselves to be retiredbecause of certain tasks they still complete and their participation in certain other activities. Formany individuals, the phase-down from active to being fully retired can be very gradual. Forpurposes of these projections, the retired group has been defined as those who have left full-time compensated ministry. For both men and women, the assumed retirement age using thisdefinition is 75. As with the other demographic assumptions, this reflects recent experience andan expectation that the factors that affect when members retire will not lead to retirement timingchanges in the future.
Demographic AssumptionsMortality: Mercer Mortality Tables for Men Religious and Women Religious
(2014), projected generationally with the MSS-2007 projection scalebeginning in 2008.
The Mercer Mortality Tables for Men Religious and Women Religious(2014) are Mercer tables that were developed based on a mortalityexperience study that Mercer prepared for RCRI in 2014. The studywas based on mortality experience for men and women for the 11-year period from January 1, 2003 to December 31, 2013. This is usedas a baseline mortality table as of 2008, to reflect the median year ofthe study.
We have assumed that future mortality improvement after 2008 willfollow the 2014 Trustees Report of the SSA, Intermediate Alternativeas reflected in the MSS-2007 improvement scale. The improvementrates implied by the report’s mortality projections are based on ananalysis of the specific factors that impact mortality improvement aswell as potential long term trends for those factors. The SSA hasmany years of experience reviewing, analyzing and projectingchanges in mortality. We recognize there are widely varying opinionsregarding mortality improvement, but believe the Trustees Reportrepresents a reasonable estimate.
Illustrative examples are included at the end of Section 2 of thisreport.
New Members: The projections assumed no new members. The assumption wasselected by the NRRO.
Turnover: The projections assumed no withdrawals. The assumption wasselected by the NRRO.
ACTUARIAL PROJECTIONS FOR THE NATIONAL RELIGIOUSRETIREMENT OFFICE
THE NATIONAL RELIGIOUS RETIREMENT OFFICE
MERCER
u:\ret\cons\wdc\natrio\2016\8yr\specialproj\cost projections\actuarial projections report final.docx
7
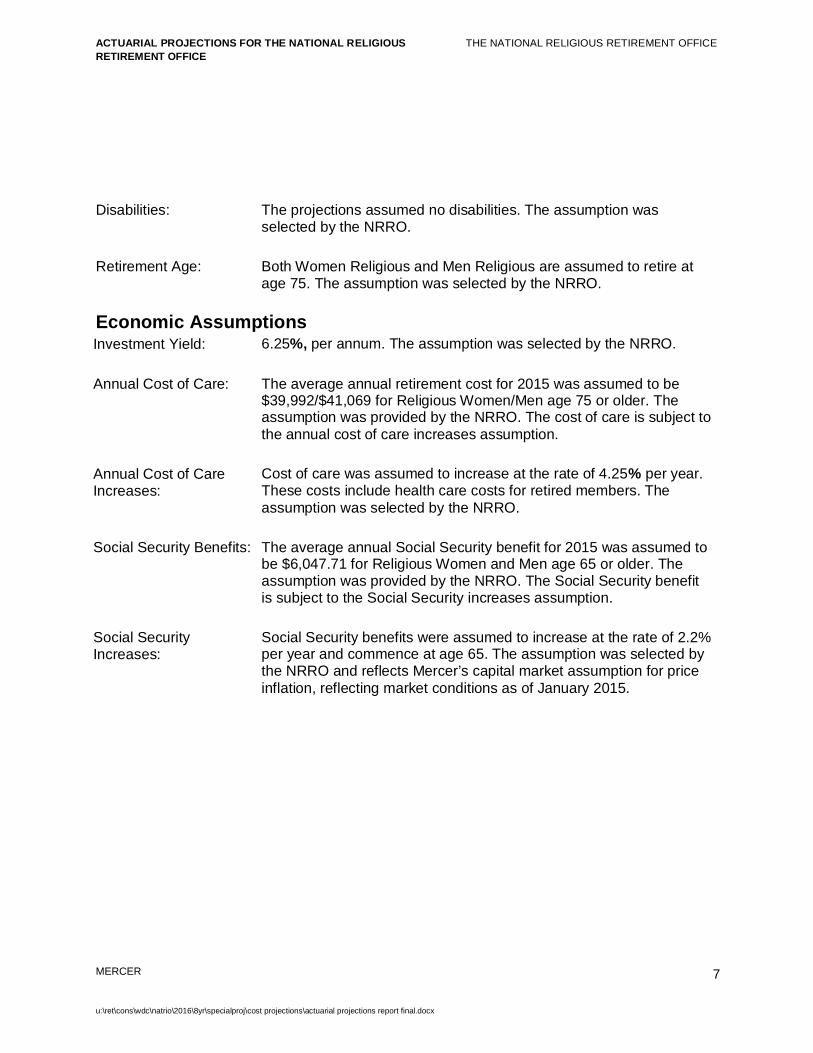
Disabilities: The projections assumed no disabilities. The assumption wasselected by the NRRO.
Retirement Age: Both Women Religious and Men Religious are assumed to retire atage 75. The assumption was selected by the NRRO.
Economic AssumptionsInvestment Yield: 6.25%, per annum. The assumption was selected by the NRRO.
Annual Cost of Care: The average annual retirement cost for 2015 was assumed to be$39,992/$41,069 for Religious Women/Men age 75 or older. Theassumption was provided by the NRRO. The cost of care is subject tothe annual cost of care increases assumption.
Annual Cost of CareIncreases:
Cost of care was assumed to increase at the rate of 4.25% per year.These costs include health care costs for retired members. Theassumption was selected by the NRRO.
Social Security Benefits: The average annual Social Security benefit for 2015 was assumed tobe $6,047.71 for Religious Women and Men age 65 or older. Theassumption was provided by the NRRO. The Social Security benefitis subject to the Social Security increases assumption.
Social SecurityIncreases:
Social Security benefits were assumed to increase at the rate of 2.2%per year and commence at age 65. The assumption was selected bythe NRRO and reflects Mercer’s capital market assumption for priceinflation, reflecting market conditions as of January 2015.
ACTUARIAL PROJECTIONS FOR THE NATIONAL RELIGIOUSRETIREMENT OFFICE
THE NATIONAL RELIGIOUS RETIREMENT OFFICE
MERCER
u:\ret\cons\wdc\natrio\2016\8yr\specialproj\cost projections\actuarial projections report final.docx
8
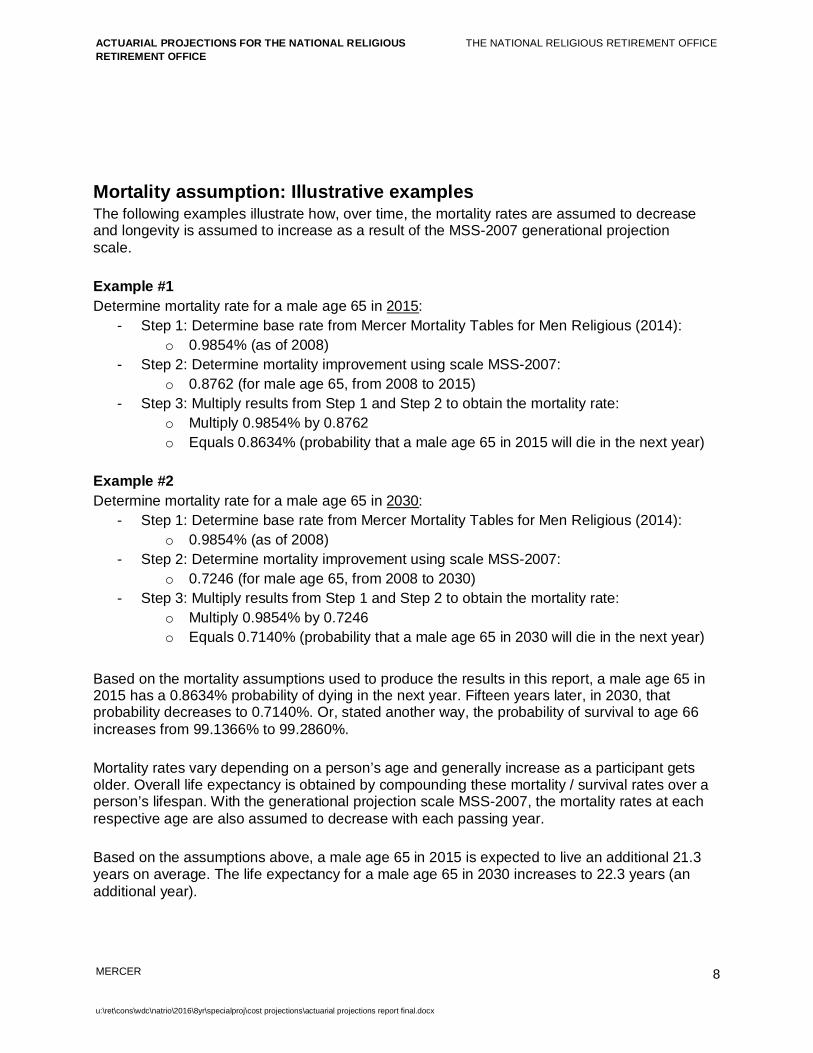
Mortality assumption: Illustrative examplesThe following examples illustrate how, over time, the mortality rates are assumed to decreaseand longevity is assumed to increase as a result of the MSS-2007 generational projectionscale.
Example #1Determine mortality rate for a male age 65 in 2015:
- Step 1: Determine base rate from Mercer Mortality Tables for Men Religious (2014):o 0.9854% (as of 2008)
- Step 2: Determine mortality improvement using scale MSS-2007:o 0.8762 (for male age 65, from 2008 to 2015)
- Step 3: Multiply results from Step 1 and Step 2 to obtain the mortality rate:o Multiply 0.9854% by 0.8762o Equals 0.8634% (probability that a male age 65 in 2015 will die in the next year)
Example #2Determine mortality rate for a male age 65 in 2030:
- Step 1: Determine base rate from Mercer Mortality Tables for Men Religious (2014):o 0.9854% (as of 2008)
- Step 2: Determine mortality improvement using scale MSS-2007:o 0.7246 (for male age 65, from 2008 to 2030)
- Step 3: Multiply results from Step 1 and Step 2 to obtain the mortality rate:o Multiply 0.9854% by 0.7246o Equals 0.7140% (probability that a male age 65 in 2030 will die in the next year)
Based on the mortality assumptions used to produce the results in this report, a male age 65 in2015 has a 0.8634% probability of dying in the next year. Fifteen years later, in 2030, thatprobability decreases to 0.7140%. Or, stated another way, the probability of survival to age 66increases from 99.1366% to 99.2860%.
Mortality rates vary depending on a person’s age and generally increase as a participant getsolder. Overall life expectancy is obtained by compounding these mortality / survival rates over aperson’s lifespan. With the generational projection scale MSS-2007, the mortality rates at eachrespective age are also assumed to decrease with each passing year.
Based on the assumptions above, a male age 65 in 2015 is expected to live an additional 21.3years on average. The life expectancy for a male age 65 in 2030 increases to 22.3 years (anadditional year).
ACTUARIAL PROJECTIONS FOR THE NATIONAL RELIGIOUSRETIREMENT OFFICE
THE NATIONAL RELIGIOUS RETIREMENT OFFICE
MERCER
u:\ret\cons\wdc\natrio\2016\8yr\specialproj\cost projections\actuarial projections report final.docx
9
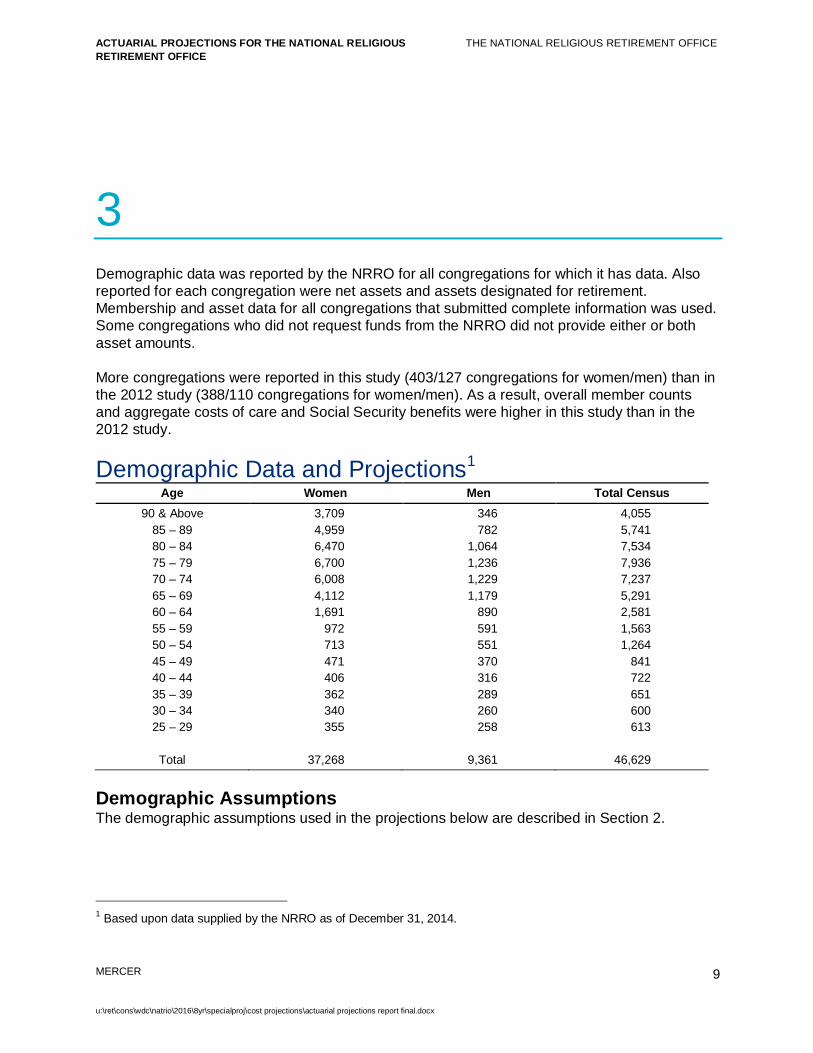
3Demographic data was reported by the NRRO for all congregations for which it has data. Alsoreported for each congregation were net assets and assets designated for retirement.Membership and asset data for all congregations that submitted complete information was used.Some congregations who did not request funds from the NRRO did not provide either or bothasset amounts.
More congregations were reported in this study (403/127 congregations for women/men) than inthe 2012 study (388/110 congregations for women/men). As a result, overall member countsand aggregate costs of care and Social Security benefits were higher in this study than in the2012 study.
Demographic Data and Projections1
Age Women Men Total Census90 & Above
85 – 8980 – 8475 – 7970 – 7465 – 6960 – 6455 – 5950 – 5445 – 4940 – 4435 – 3930 – 3425 – 29
Total
3,7094,9596,4706,7006,0084,1121,691
972713471406362340355
37,268
346782
1,0641,2361,2291,179
890591551370316289260258
9,361
4,0555,7417,5347,9367,2375,2912,5811,5631,264
841722651600613
46,629
Demographic AssumptionsThe demographic assumptions used in the projections below are described in Section 2.
1 Based upon data supplied by the NRRO as of December 31, 2014.
ACTUARIAL PROJECTIONS FOR THE NATIONAL RELIGIOUSRETIREMENT OFFICE
THE NATIONAL RELIGIOUS RETIREMENT OFFICE
MERCER
u:\ret\cons\wdc\natrio\2016\8yr\specialproj\cost projections\actuarial projections report final.docx
10
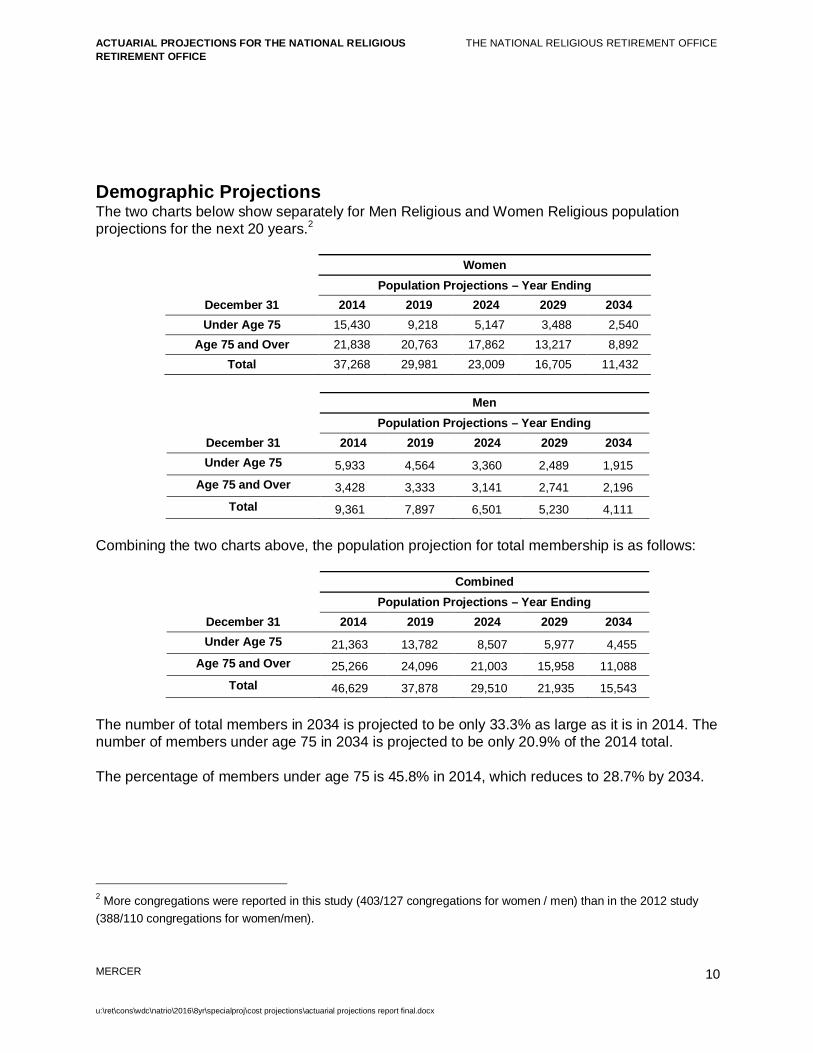
Demographic ProjectionsThe two charts below show separately for Men Religious and Women Religious populationprojections for the next 20 years.2
WomenPopulation Projections – Year Ending
December 31 2014 2019 2024 2029 2034Under Age 75 15,430 9,218 5,147 3,488 2,540
Age 75 and Over 21,838 20,763 17,862 13,217 8,892Total 37,268 29,981 23,009 16,705 11,432
MenPopulation Projections – Year Ending
December 31 2014 2019 2024 2029 2034Under Age 75 5,933 4,564 3,360 2,489 1,915
Age 75 and Over 3,428 3,333 3,141 2,741 2,196Total 9,361 7,897 6,501 5,230 4,111
Combining the two charts above, the population projection for total membership is as follows:
CombinedPopulation Projections – Year Ending
December 31 2014 2019 2024 2029 2034Under Age 75 21,363 13,782 8,507 5,977 4,455
Age 75 and Over 25,266 24,096 21,003 15,958 11,088Total 46,629 37,878 29,510 21,935 15,543
The number of total members in 2034 is projected to be only 33.3% as large as it is in 2014. Thenumber of members under age 75 in 2034 is projected to be only 20.9% of the 2014 total.
The percentage of members under age 75 is 45.8% in 2014, which reduces to 28.7% by 2034.
2 More congregations were reported in this study (403/127 congregations for women / men) than in the 2012 study(388/110 congregations for women/men).
ACTUARIAL PROJECTIONS FOR THE NATIONAL RELIGIOUSRETIREMENT OFFICE
THE NATIONAL RELIGIOUS RETIREMENT OFFICE
MERCER
u:\ret\cons\wdc\natrio\2016\8yr\specialproj\cost projections\actuarial projections report final.docx
11
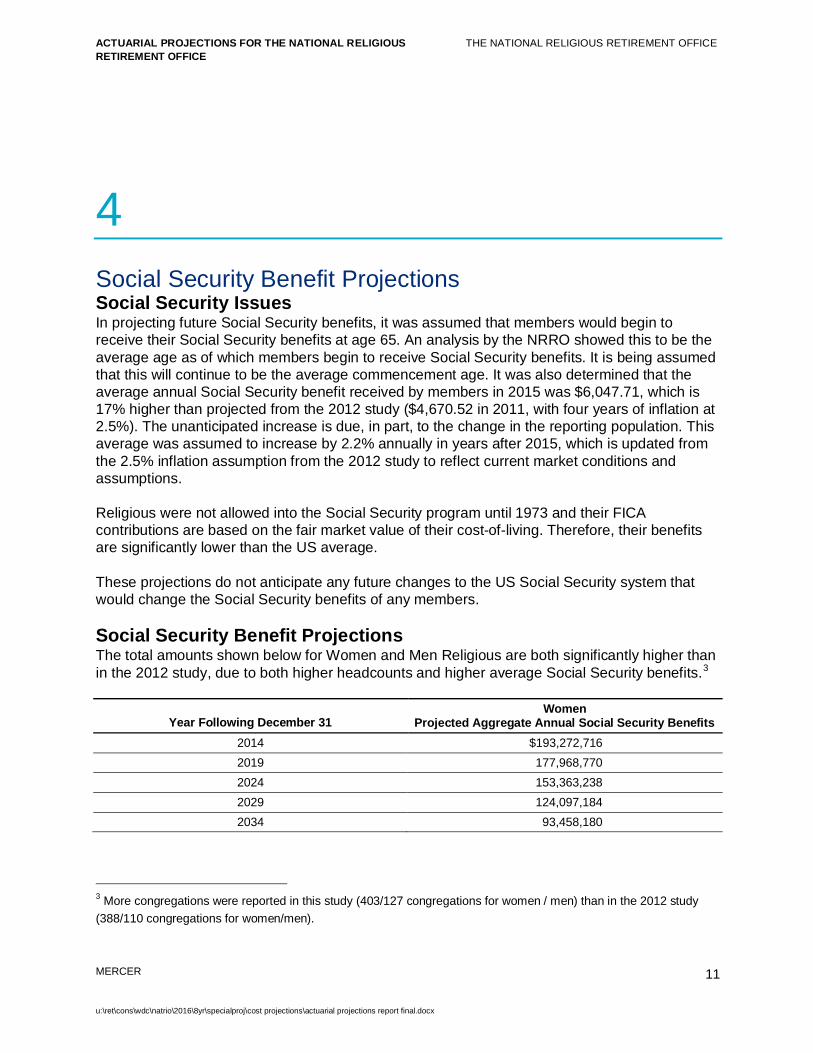
4Social Security Benefit ProjectionsSocial Security IssuesIn projecting future Social Security benefits, it was assumed that members would begin toreceive their Social Security benefits at age 65. An analysis by the NRRO showed this to be theaverage age as of which members begin to receive Social Security benefits. It is being assumedthat this will continue to be the average commencement age. It was also determined that theaverage annual Social Security benefit received by members in 2015 was $6,047.71, which is17% higher than projected from the 2012 study ($4,670.52 in 2011, with four years of inflation at2.5%). The unanticipated increase is due, in part, to the change in the reporting population. Thisaverage was assumed to increase by 2.2% annually in years after 2015, which is updated fromthe 2.5% inflation assumption from the 2012 study to reflect current market conditions andassumptions.
Religious were not allowed into the Social Security program until 1973 and their FICAcontributions are based on the fair market value of their cost-of-living. Therefore, their benefitsare significantly lower than the US average.
These projections do not anticipate any future changes to the US Social Security system thatwould change the Social Security benefits of any members.
Social Security Benefit ProjectionsThe total amounts shown below for Women and Men Religious are both significantly higher thanin the 2012 study, due to both higher headcounts and higher average Social Security benefits.3
Year Following December 31Women
Projected Aggregate Annual Social Security Benefits2014 $193,272,7162019 177,968,7702024 153,363,2382029 124,097,1842034 93,458,180
3 More congregations were reported in this study (403/127 congregations for women / men) than in the 2012 study(388/110 congregations for women/men).
ACTUARIAL PROJECTIONS FOR THE NATIONAL RELIGIOUSRETIREMENT OFFICE
THE NATIONAL RELIGIOUS RETIREMENT OFFICE
MERCER
u:\ret\cons\wdc\natrio\2016\8yr\specialproj\cost projections\actuarial projections report final.docx
12
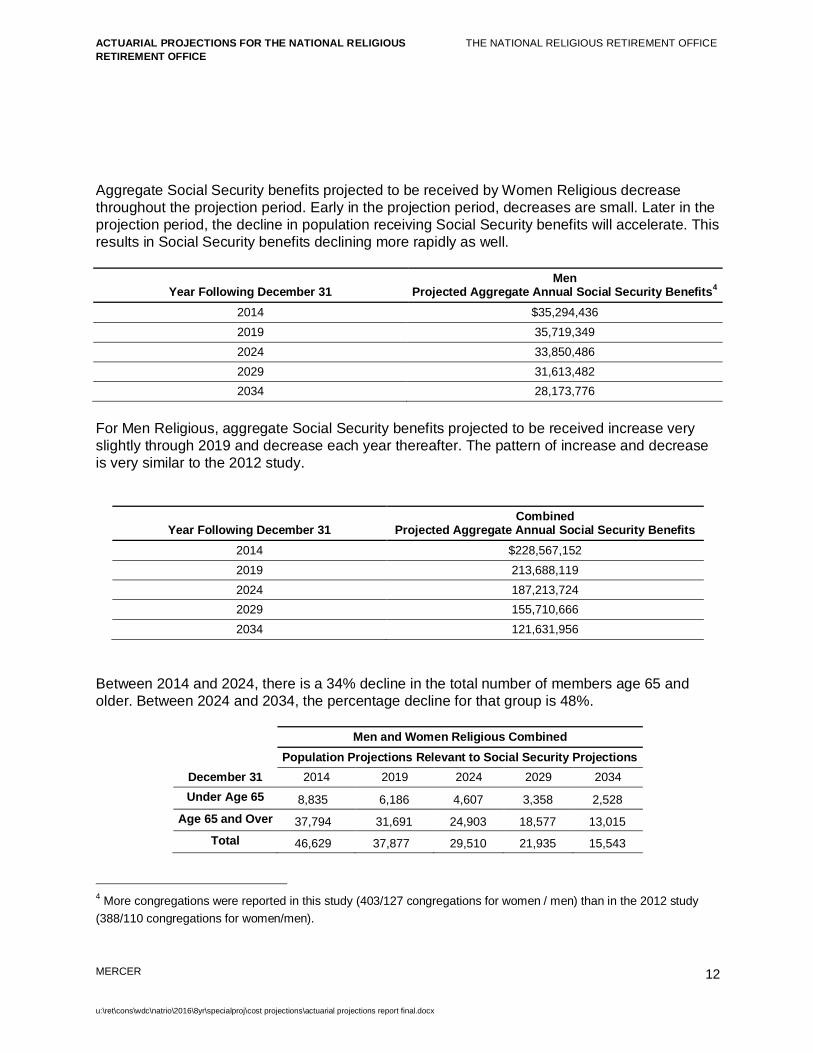
Aggregate Social Security benefits projected to be received by Women Religious decreasethroughout the projection period. Early in the projection period, decreases are small. Later in theprojection period, the decline in population receiving Social Security benefits will accelerate. Thisresults in Social Security benefits declining more rapidly as well.
Year Following December 31Men
Projected Aggregate Annual Social Security Benefits4
2014 $35,294,4362019 35,719,3492024 33,850,4862029 31,613,4822034 28,173,776
For Men Religious, aggregate Social Security benefits projected to be received increase veryslightly through 2019 and decrease each year thereafter. The pattern of increase and decreaseis very similar to the 2012 study.
Between 2014 and 2024, there is a 34% decline in the total number of members age 65 andolder. Between 2024 and 2034, the percentage decline for that group is 48%.
Men and Women Religious CombinedPopulation Projections Relevant to Social Security Projections
December 31 2014 2019 2024 2029 2034Under Age 65 8,835 6,186 4,607 3,358 2,528
Age 65 and Over 37,794 31,691 24,903 18,577 13,015Total 46,629 37,877 29,510 21,935 15,543
4 More congregations were reported in this study (403/127 congregations for women / men) than in the 2012 study(388/110 congregations for women/men).
Year Following December 31Combined
Projected Aggregate Annual Social Security Benefits2014 $228,567,1522019 213,688,1192024 187,213,7242029 155,710,6662034 121,631,956
ACTUARIAL PROJECTIONS FOR THE NATIONAL RELIGIOUSRETIREMENT OFFICE
THE NATIONAL RELIGIOUS RETIREMENT OFFICE
MERCER
u:\ret\cons\wdc\natrio\2016\8yr\specialproj\cost projections\actuarial projections report final.docx
13
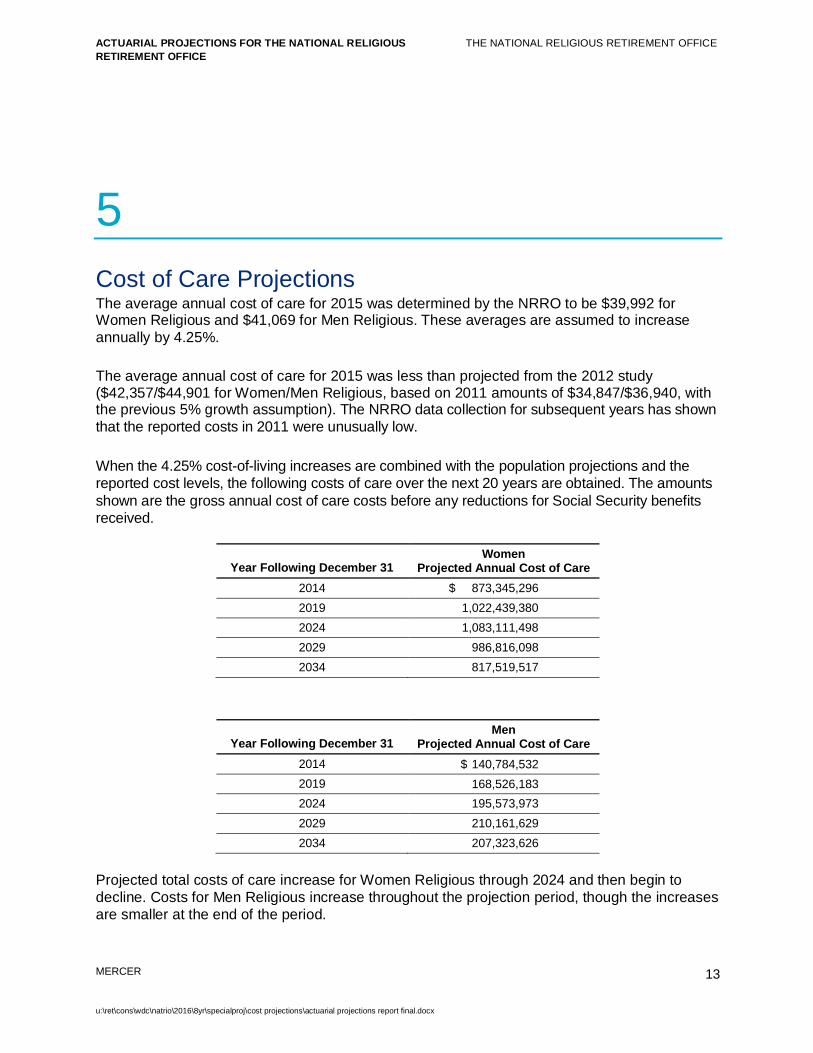
5Cost of Care ProjectionsThe average annual cost of care for 2015 was determined by the NRRO to be $39,992 forWomen Religious and $41,069 for Men Religious. These averages are assumed to increaseannually by 4.25%.
The average annual cost of care for 2015 was less than projected from the 2012 study($42,357/$44,901 for Women/Men Religious, based on 2011 amounts of $34,847/$36,940, withthe previous 5% growth assumption). The NRRO data collection for subsequent years has shownthat the reported costs in 2011 were unusually low.
When the 4.25% cost-of-living increases are combined with the population projections and thereported cost levels, the following costs of care over the next 20 years are obtained. The amountsshown are the gross annual cost of care costs before any reductions for Social Security benefitsreceived.
Year Following December 31Women
Projected Annual Cost of Care2014 $ 873,345,2962019 1,022,439,3802024 1,083,111,4982029 986,816,0982034 817,519,517
Year Following December 31Men
Projected Annual Cost of Care2014 $ 140,784,5322019 168,526,1832024 195,573,9732029 210,161,6292034 207,323,626
Projected total costs of care increase for Women Religious through 2024 and then begin todecline. Costs for Men Religious increase throughout the projection period, though the increasesare smaller at the end of the period.
ACTUARIAL PROJECTIONS FOR THE NATIONAL RELIGIOUSRETIREMENT OFFICE
THE NATIONAL RELIGIOUS RETIREMENT OFFICE
MERCER
u:\ret\cons\wdc\natrio\2016\8yr\specialproj\cost projections\actuarial projections report final.docx
14
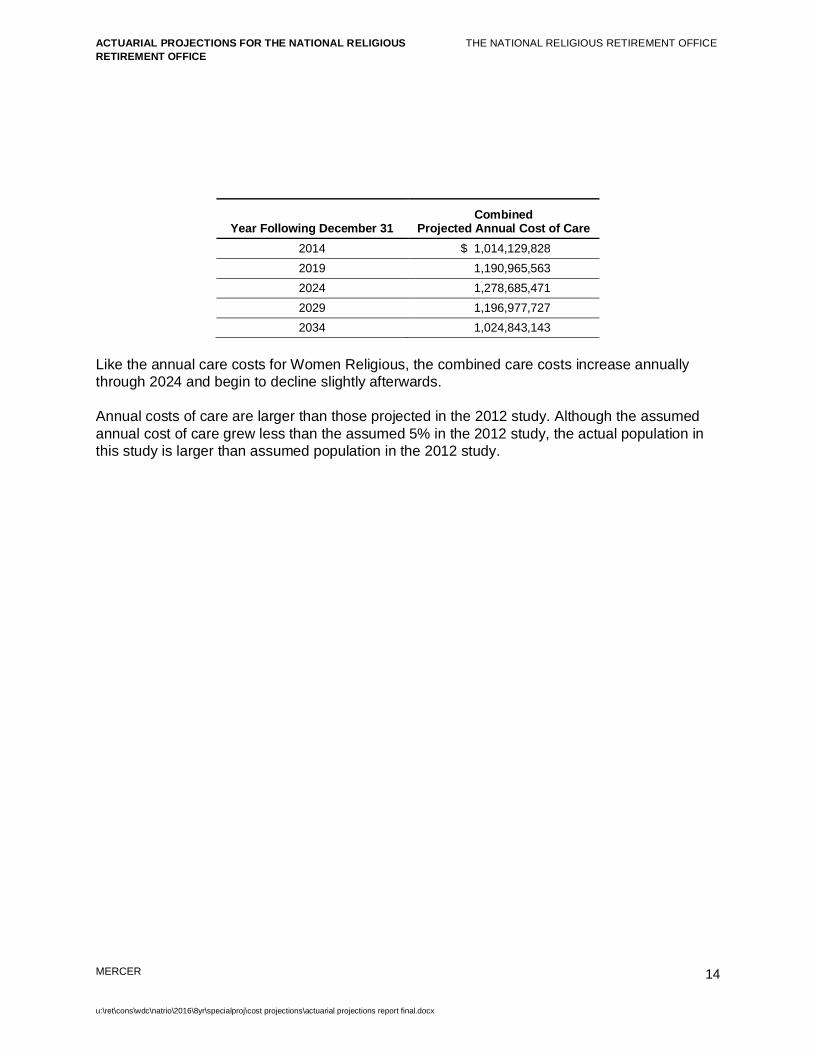
Year Following December 31Combined
Projected Annual Cost of Care2014 $ 1,014,129,8282019 1,190,965,5632024 1,278,685,4712029 1,196,977,7272034 1,024,843,143
Like the annual care costs for Women Religious, the combined care costs increase annuallythrough 2024 and begin to decline slightly afterwards.
Annual costs of care are larger than those projected in the 2012 study. Although the assumedannual cost of care grew less than the assumed 5% in the 2012 study, the actual population inthis study is larger than assumed population in the 2012 study.
ACTUARIAL PROJECTIONS FOR THE NATIONAL RELIGIOUSRETIREMENT OFFICE
THE NATIONAL RELIGIOUS RETIREMENT OFFICE
MERCER
u:\ret\cons\wdc\natrio\2016\8yr\specialproj\cost projections\actuarial projections report final.docx
15
6Retirement Fund Projections and Retirement LiabilitiesRetirement Fund Balance Projections
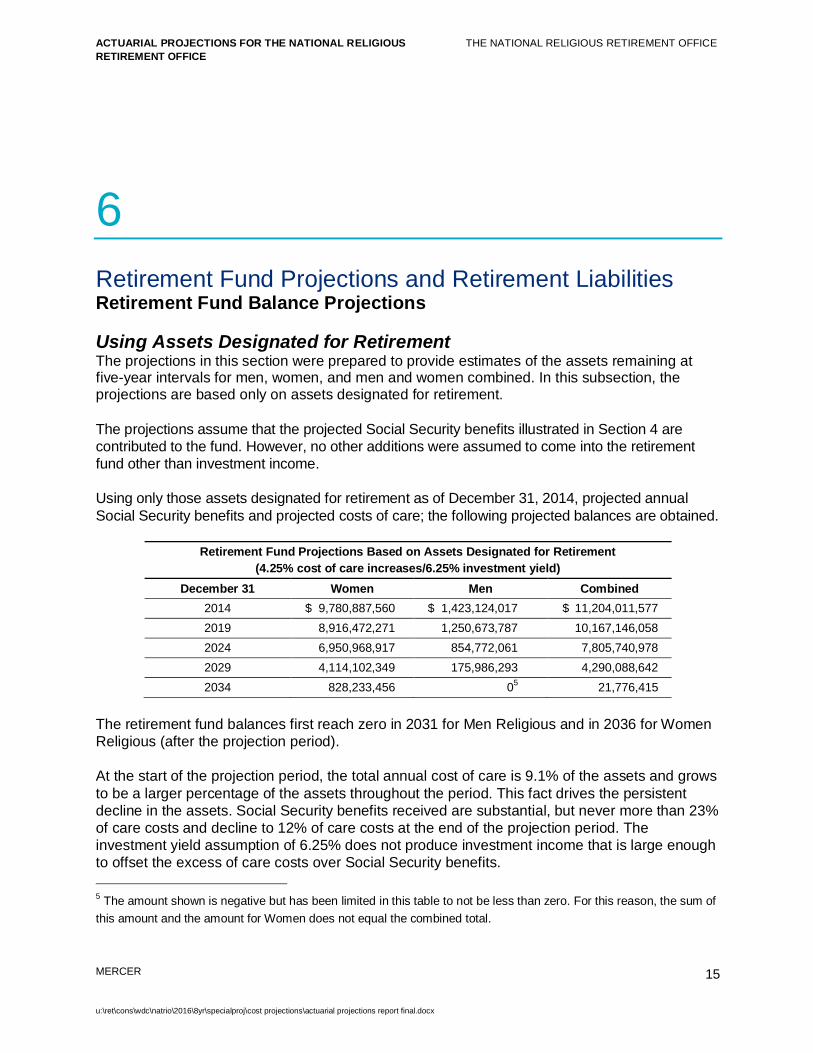
Using Assets Designated for RetirementThe projections in this section were prepared to provide estimates of the assets remaining atfive-year intervals for men, women, and men and women combined. In this subsection, theprojections are based only on assets designated for retirement.
The projections assume that the projected Social Security benefits illustrated in Section 4 arecontributed to the fund. However, no other additions were assumed to come into the retirementfund other than investment income.
Using only those assets designated for retirement as of December 31, 2014, projected annualSocial Security benefits and projected costs of care; the following projected balances are obtained.
Retirement Fund Projections Based on Assets Designated for Retirement(4.25% cost of care increases/6.25% investment yield)
December 31 Women Men Combined2014 $ 9,780,887,560 $ 1,423,124,017 $ 11,204,011,5772019 8,916,472,271 1,250,673,787 10,167,146,0582024 6,950,968,917 854,772,061 7,805,740,9782029 4,114,102,349 175,986,293 4,290,088,6422034 828,233,456 05 21,776,415
The retirement fund balances first reach zero in 2031 for Men Religious and in 2036 for WomenReligious (after the projection period).
At the start of the projection period, the total annual cost of care is 9.1% of the assets and growsto be a larger percentage of the assets throughout the period. This fact drives the persistentdecline in the assets. Social Security benefits received are substantial, but never more than 23%of care costs and decline to 12% of care costs at the end of the projection period. Theinvestment yield assumption of 6.25% does not produce investment income that is large enoughto offset the excess of care costs over Social Security benefits.
5 The amount shown is negative but has been limited in this table to not be less than zero. For this reason, the sum ofthis amount and the amount for Women does not equal the combined total.
ACTUARIAL PROJECTIONS FOR THE NATIONAL RELIGIOUSRETIREMENT OFFICE
THE NATIONAL RELIGIOUS RETIREMENT OFFICE
MERCER
u:\ret\cons\wdc\natrio\2016\8yr\specialproj\cost projections\actuarial projections report final.docx
16
The fund balance going to zero is not surprising. Projections we have completed for many otherreligious organizations often show the fund balance falling to zero before the end of theprojection period. Projections that we completed for the NRRO in 2012 showed the fund balancefalling to zero in 2026 for Women Religious and 2025 for Men Religious.
The fund balances reach zero in these projections later than in the 2012 projections, it appears,due to asset growth through December 31, 2014, lower average cost of care than previouslyprojected, lower cost of care increase assumption, and higher Social Security benefits thanpreviously projected.
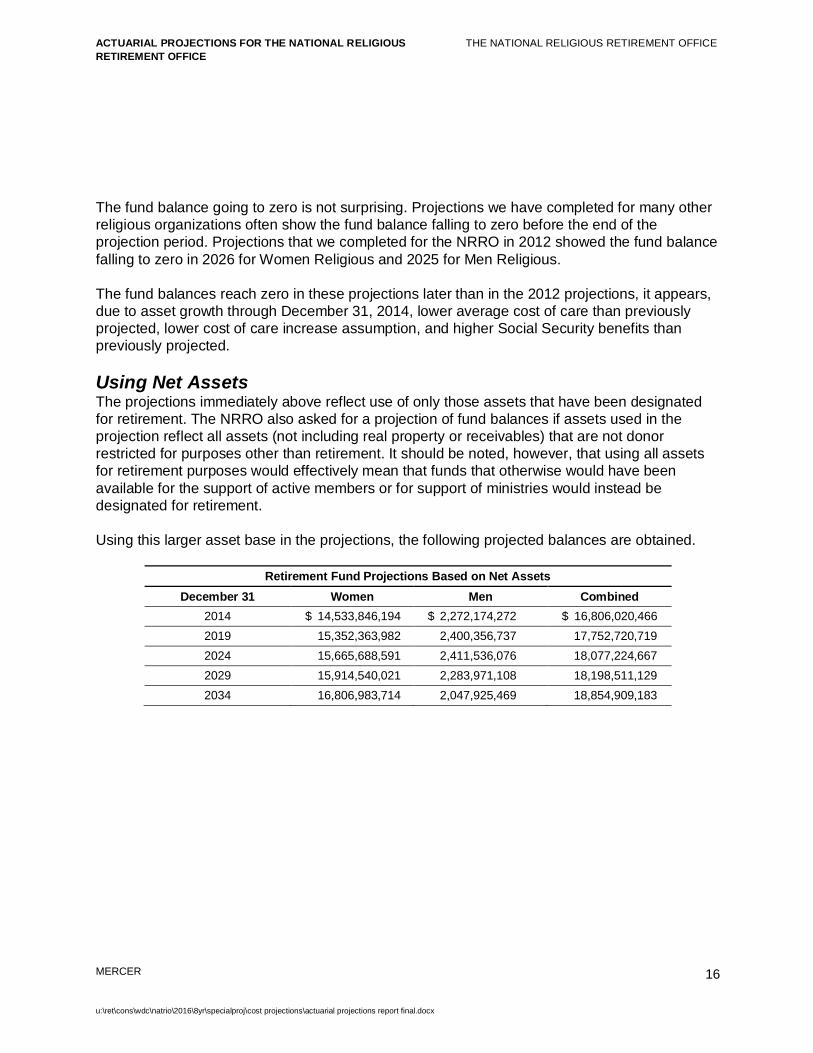
Using Net AssetsThe projections immediately above reflect use of only those assets that have been designatedfor retirement. The NRRO also asked for a projection of fund balances if assets used in theprojection reflect all assets (not including real property or receivables) that are not donorrestricted for purposes other than retirement. It should be noted, however, that using all assetsfor retirement purposes would effectively mean that funds that otherwise would have beenavailable for the support of active members or for support of ministries would instead bedesignated for retirement.
Using this larger asset base in the projections, the following projected balances are obtained.
Retirement Fund Projections Based on Net AssetsDecember 31 Women Men Combined
2014 $ 14,533,846,194 $ 2,272,174,272 $ 16,806,020,4662019 15,352,363,982 2,400,356,737 17,752,720,7192024 15,665,688,591 2,411,536,076 18,077,224,6672029 15,914,540,021 2,283,971,108 18,198,511,1292034 16,806,983,714 2,047,925,469 18,854,909,183
ACTUARIAL PROJECTIONS FOR THE NATIONAL RELIGIOUSRETIREMENT OFFICE
THE NATIONAL RELIGIOUS RETIREMENT OFFICE
MERCER
u:\ret\cons\wdc\natrio\2016\8yr\specialproj\cost projections\actuarial projections report final.docx
17
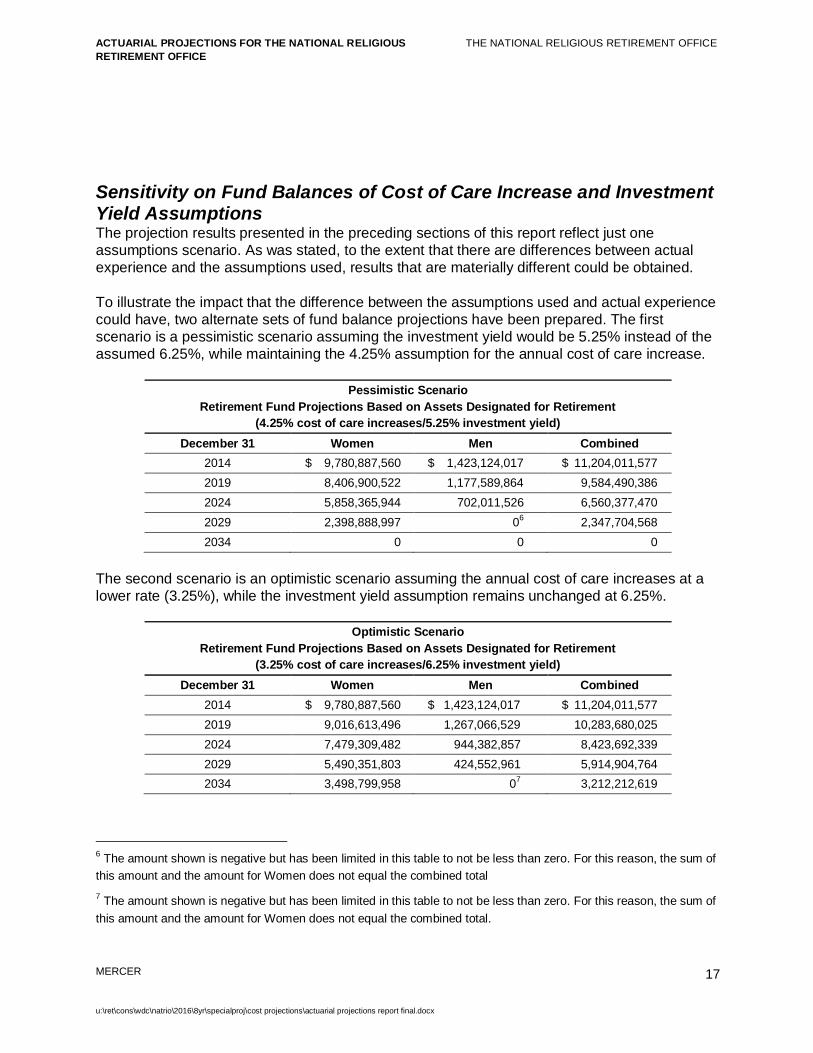
Sensitivity on Fund Balances of Cost of Care Increase and InvestmentYield AssumptionsThe projection results presented in the preceding sections of this report reflect just oneassumptions scenario. As was stated, to the extent that there are differences between actualexperience and the assumptions used, results that are materially different could be obtained.
To illustrate the impact that the difference between the assumptions used and actual experiencecould have, two alternate sets of fund balance projections have been prepared. The firstscenario is a pessimistic scenario assuming the investment yield would be 5.25% instead of theassumed 6.25%, while maintaining the 4.25% assumption for the annual cost of care increase.
Pessimistic ScenarioRetirement Fund Projections Based on Assets Designated for Retirement
(4.25% cost of care increases/5.25% investment yield)December 31 Women Men Combined
2014 $ 9,780,887,560 $ 1,423,124,017 $ 11,204,011,5772019 8,406,900,522 1,177,589,864 9,584,490,3862024 5,858,365,944 702,011,526 6,560,377,4702029 2,398,888,997 06 2,347,704,5682034 0 0 0
The second scenario is an optimistic scenario assuming the annual cost of care increases at alower rate (3.25%), while the investment yield assumption remains unchanged at 6.25%.
Optimistic ScenarioRetirement Fund Projections Based on Assets Designated for Retirement
(3.25% cost of care increases/6.25% investment yield)December 31 Women Men Combined
2014 $ 9,780,887,560 $ 1,423,124,017 $ 11,204,011,5772019 9,016,613,496 1,267,066,529 10,283,680,0252024 7,479,309,482 944,382,857 8,423,692,3392029 5,490,351,803 424,552,961 5,914,904,7642034 3,498,799,958 07 3,212,212,619
6 The amount shown is negative but has been limited in this table to not be less than zero. For this reason, the sum ofthis amount and the amount for Women does not equal the combined total7 The amount shown is negative but has been limited in this table to not be less than zero. For this reason, the sum ofthis amount and the amount for Women does not equal the combined total.
ACTUARIAL PROJECTIONS FOR THE NATIONAL RELIGIOUSRETIREMENT OFFICE
THE NATIONAL RELIGIOUS RETIREMENT OFFICE
MERCER
u:\ret\cons\wdc\natrio\2016\8yr\specialproj\cost projections\actuarial projections report final.docx
18
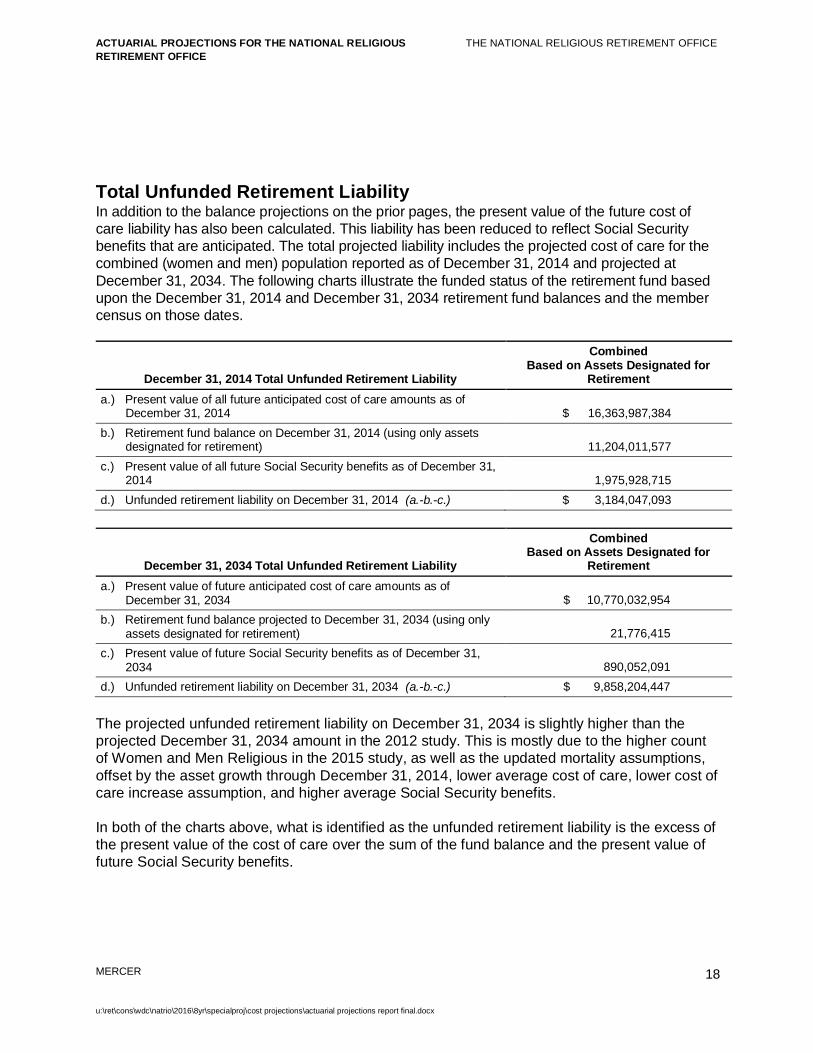
Total Unfunded Retirement LiabilityIn addition to the balance projections on the prior pages, the present value of the future cost ofcare liability has also been calculated. This liability has been reduced to reflect Social Securitybenefits that are anticipated. The total projected liability includes the projected cost of care for thecombined (women and men) population reported as of December 31, 2014 and projected atDecember 31, 2034. The following charts illustrate the funded status of the retirement fund basedupon the December 31, 2014 and December 31, 2034 retirement fund balances and the membercensus on those dates.
December 31, 2014 Total Unfunded Retirement Liability
CombinedBased on Assets Designated for
Retirementa.) Present value of all future anticipated cost of care amounts as of
December 31, 2014 $ 16,363,987,384b.) Retirement fund balance on December 31, 2014 (using only assets
designated for retirement) 11,204,011,577c.) Present value of all future Social Security benefits as of December 31,
2014 1,975,928,715d.) Unfunded retirement liability on December 31, 2014 (a.-b.-c.) $ 3,184,047,093
December 31, 2034 Total Unfunded Retirement Liability
CombinedBased on Assets Designated for
Retirementa.) Present value of future anticipated cost of care amounts as of
December 31, 2034 $ 10,770,032,954b.) Retirement fund balance projected to December 31, 2034 (using only
assets designated for retirement) 21,776,415c.) Present value of future Social Security benefits as of December 31,
2034 890,052,091d.) Unfunded retirement liability on December 31, 2034 (a.-b.-c.) $ 9,858,204,447
The projected unfunded retirement liability on December 31, 2034 is slightly higher than theprojected December 31, 2034 amount in the 2012 study. This is mostly due to the higher countof Women and Men Religious in the 2015 study, as well as the updated mortality assumptions,offset by the asset growth through December 31, 2014, lower average cost of care, lower cost ofcare increase assumption, and higher average Social Security benefits.
In both of the charts above, what is identified as the unfunded retirement liability is the excess ofthe present value of the cost of care over the sum of the fund balance and the present value offuture Social Security benefits.
ACTUARIAL PROJECTIONS FOR THE NATIONAL RELIGIOUSRETIREMENT OFFICE
THE NATIONAL RELIGIOUS RETIREMENT OFFICE
MERCER
u:\ret\cons\wdc\natrio\2016\8yr\specialproj\cost projections\actuarial projections report final.docx
19
When considering the liability and zero fund balance that exists in 2034, what should also beconsidered is that if the fund balance becomes zero before 2034, costs between the date whena zero balance first occurs and 2034 will also need to be covered.
Mercer (US) Inc.1050 Connecticut Avenue, NW, Suite 700Washington, DC 20036+1 202 331 5200