Embed Size (px)
Citation preview
Actuarial IQ(Information Quality)
CAS Data Management Educational Materials Working Party
Actuarial IQ Introduction
“IQ” stands for “Information Quality” Introduction to Data Quality and Data
Management being written by the CAS Data Management Educational Materials Working Party
Directed at actuarial analysts as much as actuarial data managers: what every actuary should know about
data quality and data management

Objectives
Introduce Working Party Paper “Actuarial IQ” Justify our care about information quality:
industry horror stories Explain that information quality is not just
about input data quality: depends on all stages: input process, analysis
process, output process Suggest what can be done to improve
information quality: (it starts with YOU!)
Encourage actuaries to become data quality advocates
Why do we care?
Information quality horror stories: Insolvencies Run-offs Mis-pricing Over-reserving (Loss of bonuses)
GIRO working party on data quality survey: On average any consultant, company or
reinsurance actuary: spends 26% of their time on data quality
issues 32% of projects affected by data quality
problems

Actuarial IQ Key Ideas
Information Quality concerns not only bad data: information which is poorly processed or poorly
presented is also of low quality
Cleansing data helps: but is just a band aid
There are plenty of things actuarial analysts can do to improve their IQ
There are even more things actuarial data managers can do
Actuaries are uniquely positioned to become information quality advocates
Why Actuaries?
both: information consumers and
information providers both:
have knowledge of data and high stakes in quality
both: skillful and influential
No one else is better

Working Party Publications
Book reviews of data management and data quality texts in the Actuarial Review starting with the August 2006 edition
These reviews are combined and compared in “Survey of Data Management and Data Quality Texts,” CAS Forum, Winter 2007, www.casact.org
This presentation is based on our Upcoming paper: “Actuarial IQ (Information
Quality)” to be published in the Winter 2008 edition of the CAS Forum
Data Quality vs Information Quality
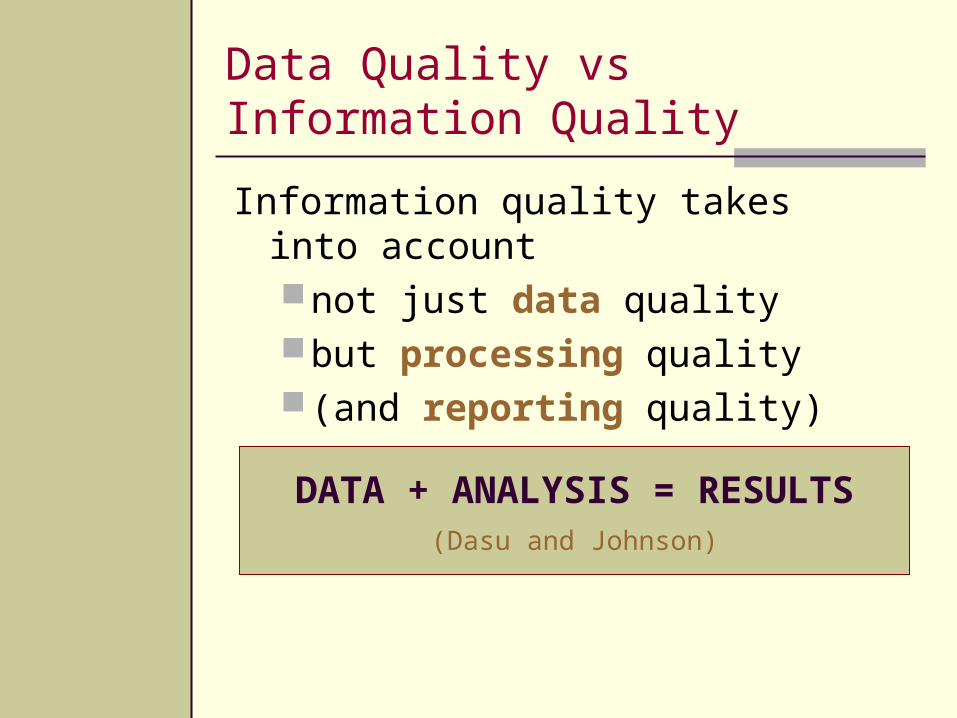
Information quality takes into account not just data quality but processing quality (and reporting quality)
DATA + ANALYSIS = RESULTS(Dasu and Johnson)
What is Data Quality?
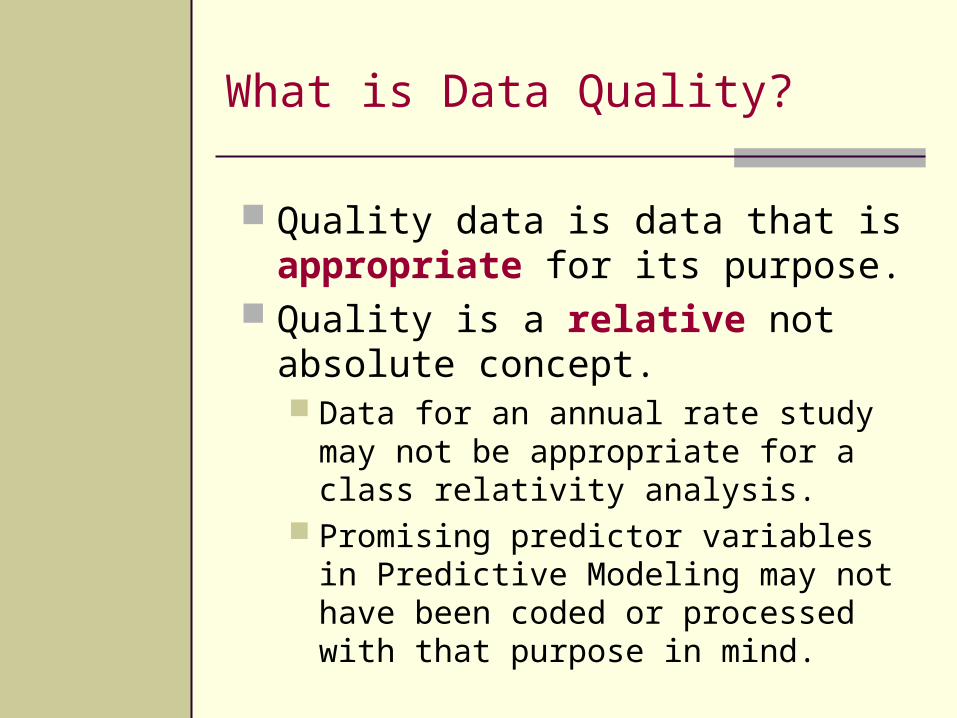
Quality data is data that is appropriate for its purpose.
Quality is a relative not absolute concept. Data for an annual rate study may not be
appropriate for a class relativity analysis. Promising predictor variables in Predictive
Modeling may not have been coded or processed with that purpose in mind.

Data Flow
Step 2
TransformationsAggregations
Step 3
Analysis
Step 4
Presentation of Results
Step 1
Data Collection
Step 0
Data Requirements
Final Step
Decisions
Information Quality involves all steps:Data RequirementsData CollectionTransformations & AggregationsActuarial AnalysisPresentation of Results
To improve Final Step:Making Decisions
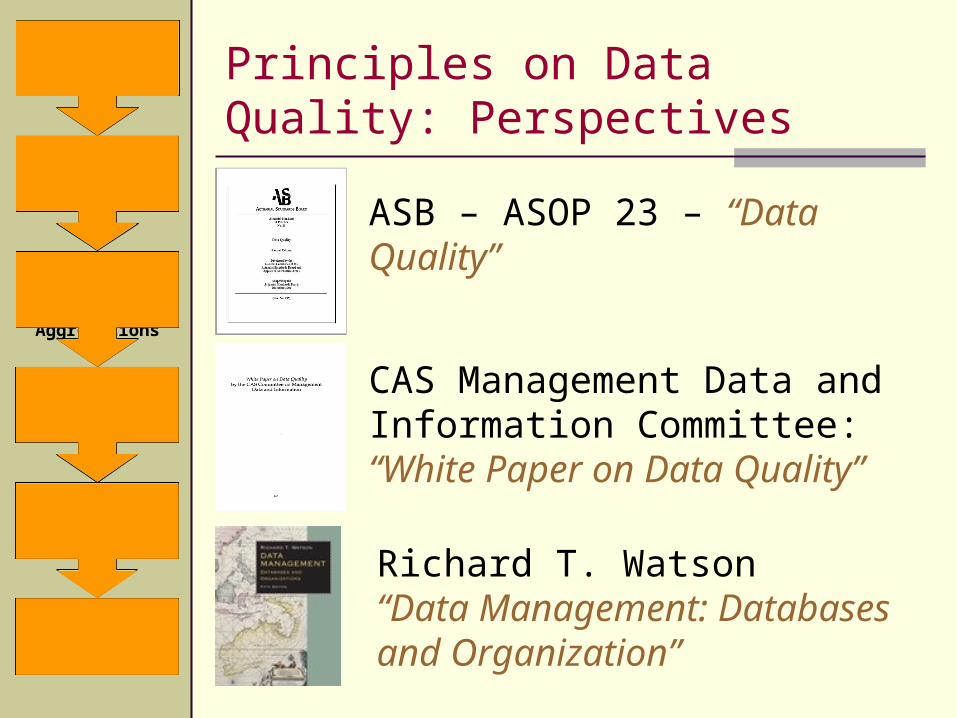
Principles on Data Quality: Perspectives
ASB – ASOP 23 – “Data Quality”
CAS Management Data and Information Committee: “White Paper on Data Quality”
Richard T. Watson“Data Management: Databases and Organization”
Step 2
TransformationsAggregations
Step 3
Analysis
Step 4
Presentation of Results
Step 1
Data Collection
Step 0
Data Requirements
Final Step
Decisions
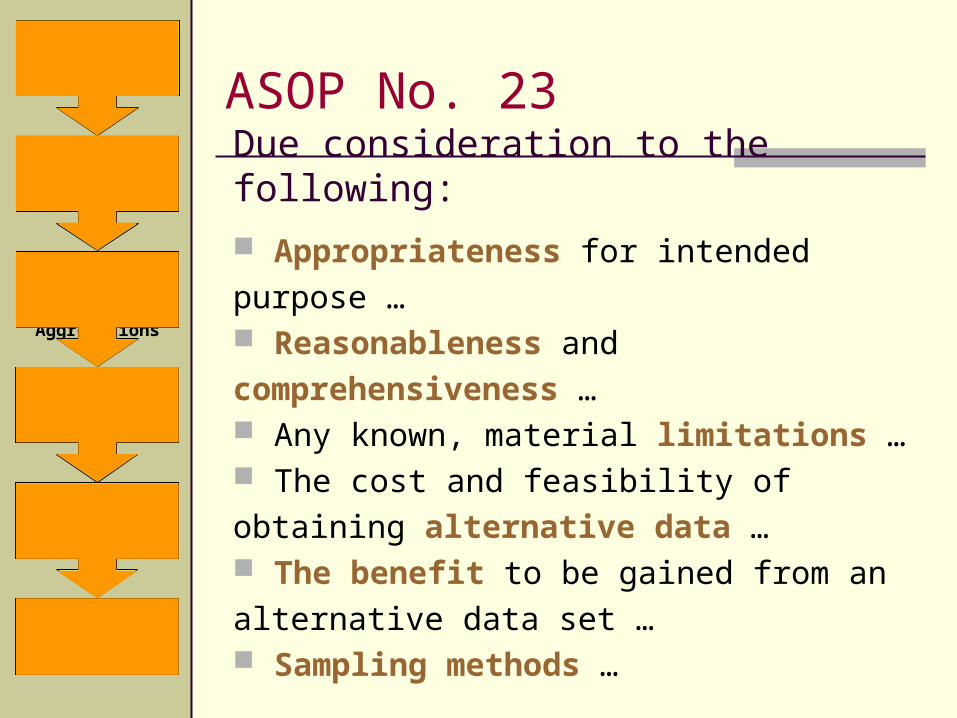
ASOP No. 23
Due consideration to the following:
Appropriateness for intended purpose … Reasonableness and comprehensiveness … Any known, material limitations … The cost and feasibility of obtaining alternative
data … The benefit to be gained from an alternative
data set … Sampling methods …
Step 2
TransformationsAggregations
Step 3
Analysis
Step 4
Presentation of Results
Step 1
Data Collection
Step 0
Data Requirements
Final Step
Decisions
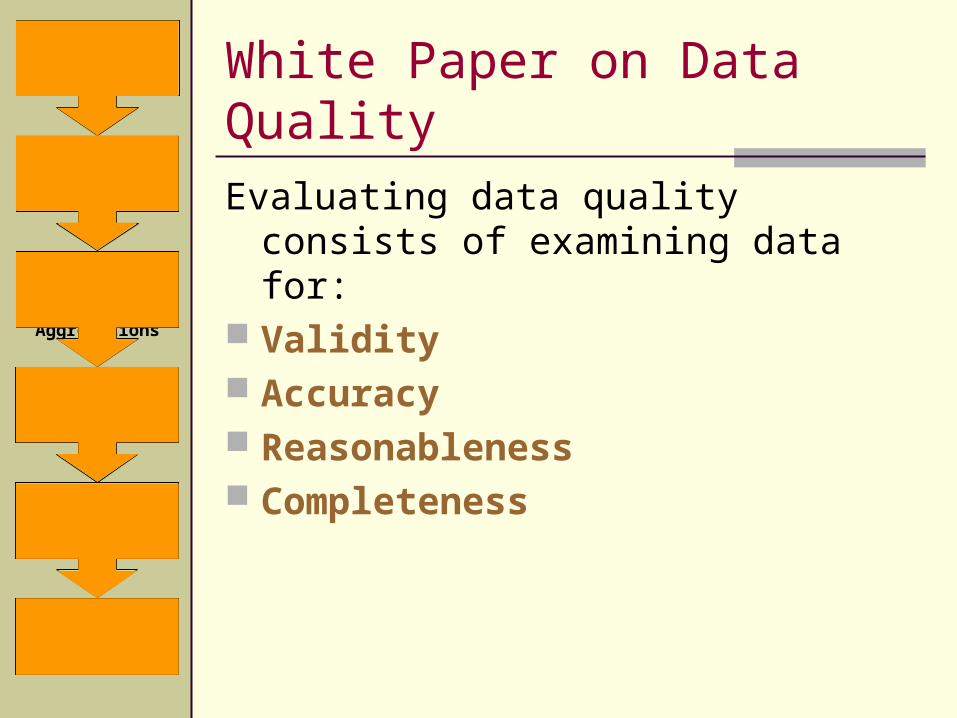
White Paper on Data Quality
Step 2
TransformationsAggregations
Step 3
Analysis
Step 4
Presentation of Results
Step 1
Data Collection
Step 0
Data Requirements
Final Step
Decisions
Evaluating data quality consists of examining data for:
Validity Accuracy Reasonableness Completeness
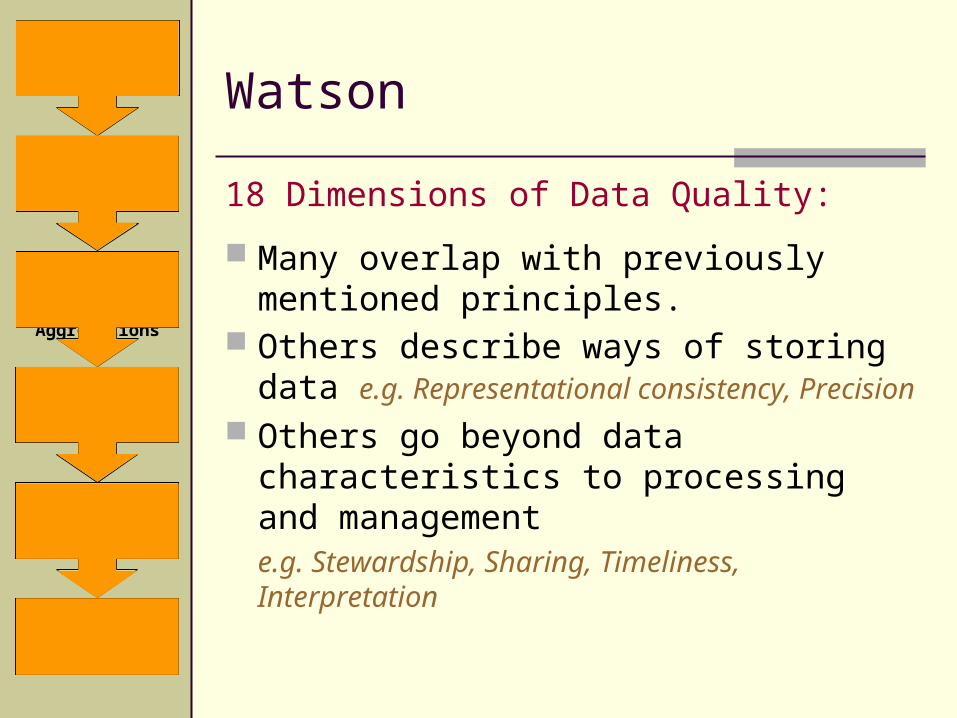
Watson
Step 2
TransformationsAggregations
Step 3
Analysis
Step 4
Presentation of Results
Step 1
Data Collection
Step 0
Data Requirements
Final Step
Decisions
18 Dimensions of Data Quality:
Many overlap with previously mentioned principles.
Others describe ways of storing data e.g. Representational consistency, Precision
Others go beyond data characteristics to processing and management e.g. Stewardship, Sharing, Timeliness, Interpretation
Step 2
TransformationsAggregations
Step 3
Analysis
Step 4
Presentation of Results
Step 1
Data Collection
Step 0
Data Requirements
Final Step
Decisions
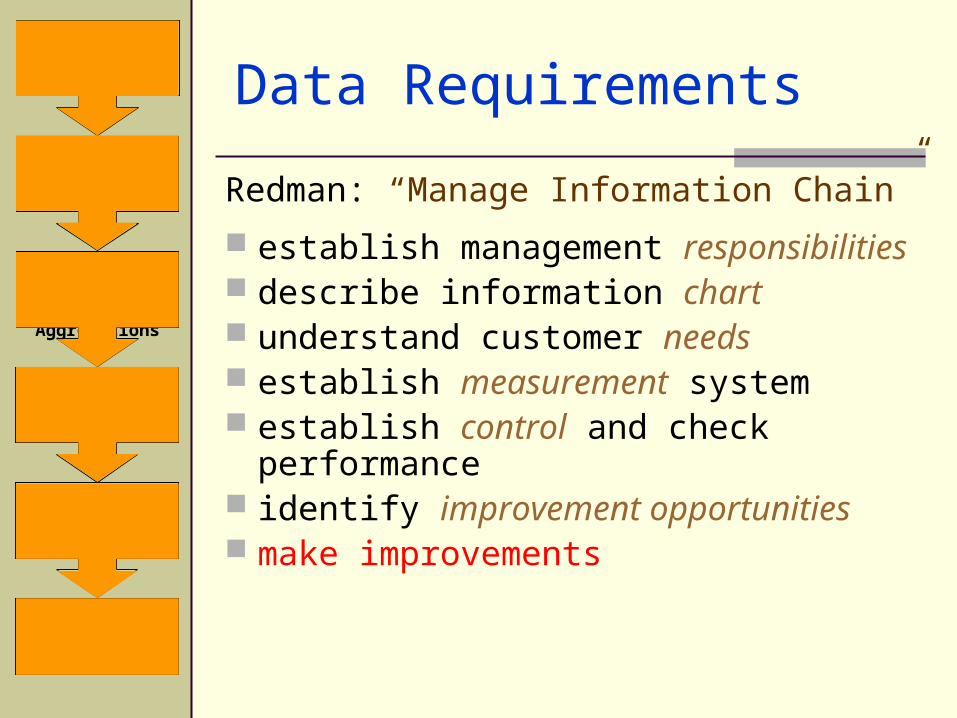
Data Requirements
Redman: “Manage Information Chain”
establish management responsibilities describe information chart understand customer needs establish measurement system establish control and check
performance identify improvement opportunities make improvements
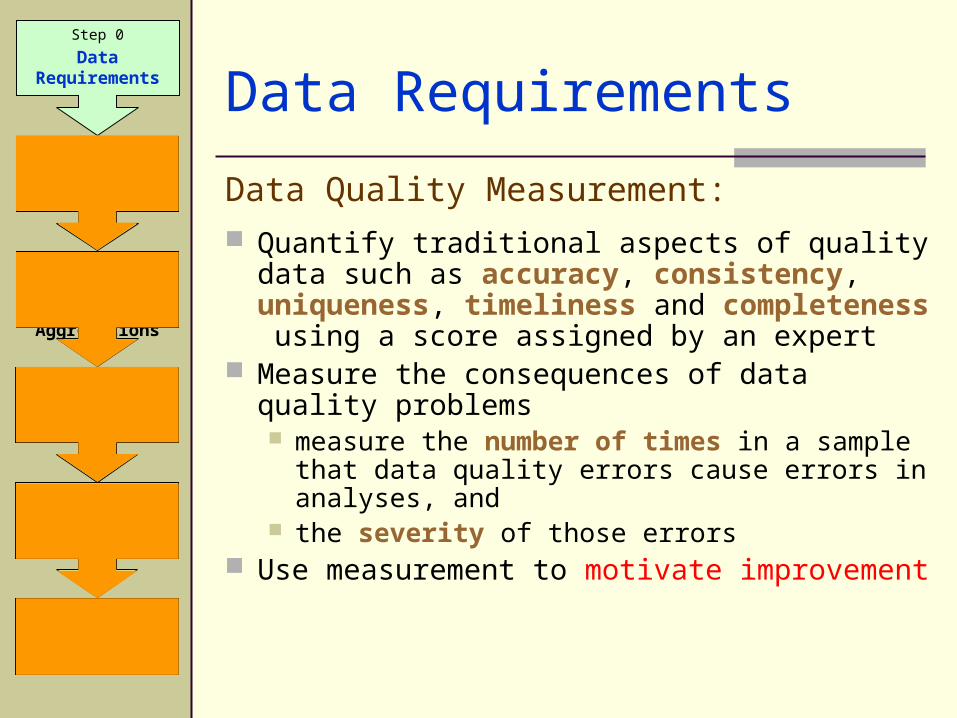
Data Requirements
Data Quality Measurement:
Quantify traditional aspects of quality data such as accuracy, consistency, uniqueness, timeliness and completeness using a score assigned by an expert
Measure the consequences of data quality problems measure the number of times in a sample that
data quality errors cause errors in analyses, and the severity of those errors
Use measurement to motivate improvement
Step 2
TransformationsAggregations
Step 3
Analysis
Step 4
Presentation of Results
Step 1
Data Collection
Step 0
Data Requirements
Final Step
Decisions

Metadata
Big help in describing Data Requirements – Metadata!
Data that Describes the Data Key Data Management Tool
Step 2
TransformationsAggregations
Step 3
Analysis
Step 4
Presentation of Results
Step 1
Data Collection
Step 0
Data Requirements
Final Step
Decisions
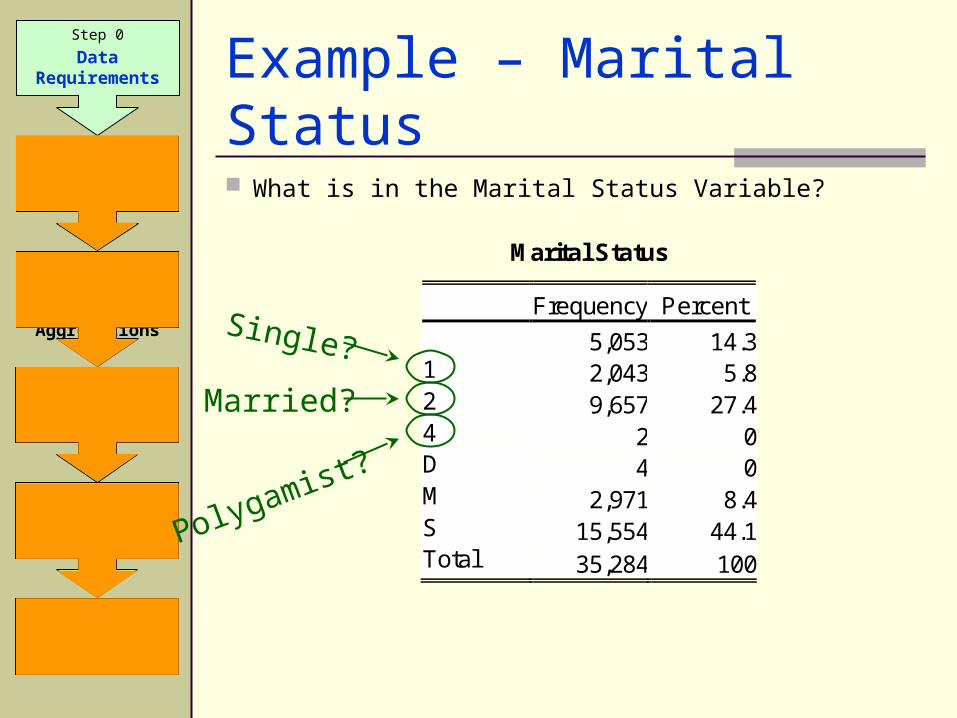
Example – Marital Status
What is in the Marital Status Variable?
Step 2
TransformationsAggregations
Step 3
Analysis
Step 4
Presentation of Results
Step 1
Data Collection
Step 0
Data Requirements
Final Step
Decisions
Marital Status
Frequency Percent 5,053 14.3 1 2,043 5.8 2 9,657 27.4 4 2 0 D 4 0 M 2,971 8.4 S 15,554 44.1 Total 35,284 100
Single?
Married?
Polygamist?
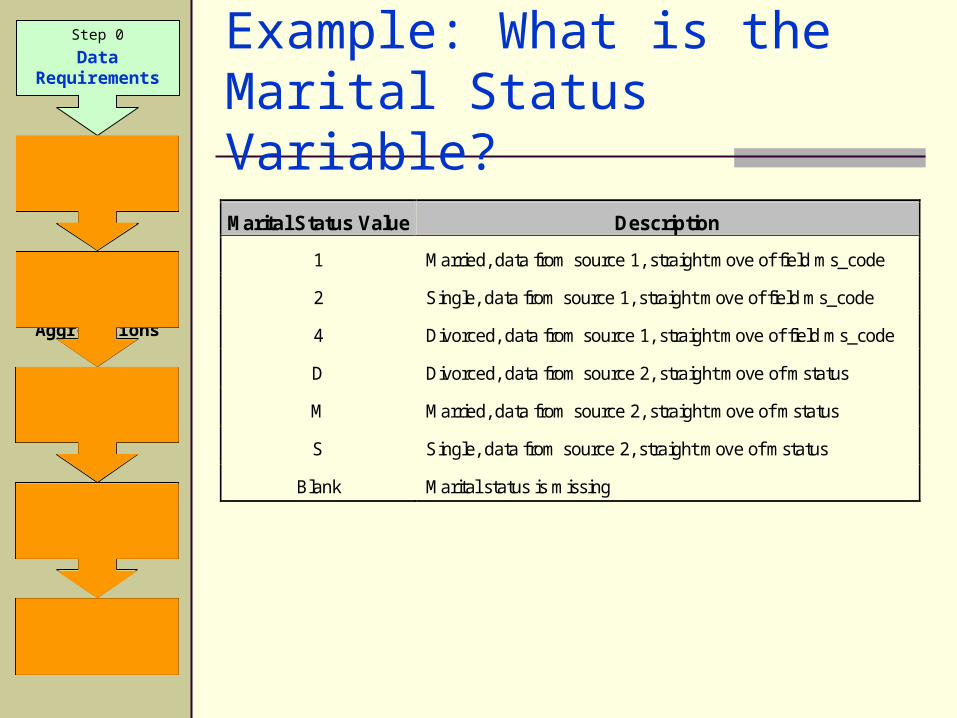
Example: What is the Marital Status Variable?
Marital Status Value Description
1 Married, data from source 1, straight move of field ms_code
2 Single, data from source 1, straight move of field ms_code
4 Divorced, data from source 1, straight move of field ms_code
D Divorced, data from source 2, straight move of mstatus
M Married, data from source 2, straight move of mstatus
S Single, data from source 2, straight move of mstatus
Blank Marital status is missing
Step 2
TransformationsAggregations
Step 3
Analysis
Step 4
Presentation of Results
Step 1
Data Collection
Step 0
Data Requirements
Final Step
Decisions
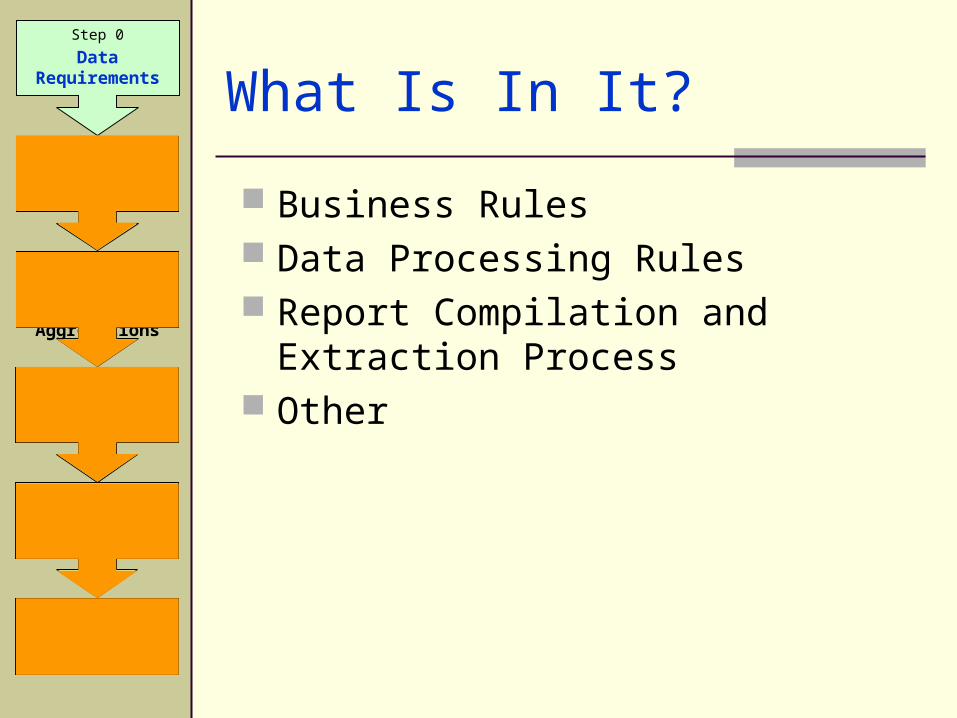
What Is In It?
Business Rules Data Processing Rules Report Compilation and Extraction
Process Other
Step 2
TransformationsAggregations
Step 3
Analysis
Step 4
Presentation of Results
Step 1
Data Collection
Step 0
Data Requirements
Final Step
Decisions
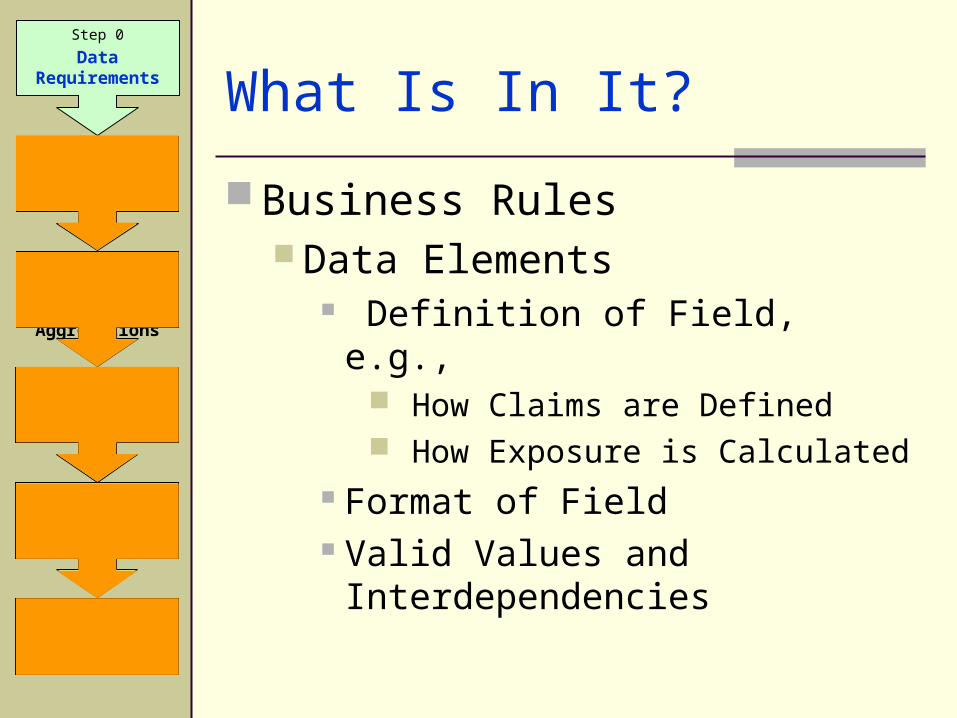
What Is In It?
Business Rules Data Elements
Definition of Field, e.g., How Claims are Defined How Exposure is Calculated
Format of Field Valid Values and
Interdependencies
Step 2
TransformationsAggregations
Step 3
Analysis
Step 4
Presentation of Results
Step 1
Data Collection
Step 0
Data Requirements
Final Step
Decisions
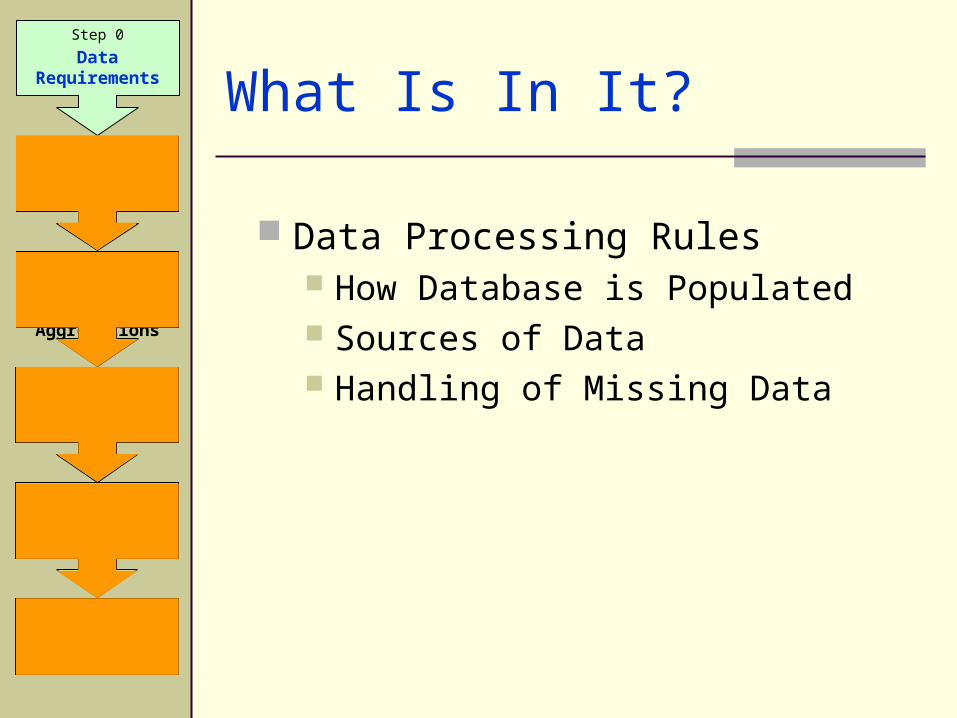
What Is In It?
Data Processing Rules How Database is Populated Sources of Data Handling of Missing Data
Step 2
TransformationsAggregations
Step 3
Analysis
Step 4
Presentation of Results
Step 1
Data Collection
Step 0
Data Requirements
Final Step
Decisions
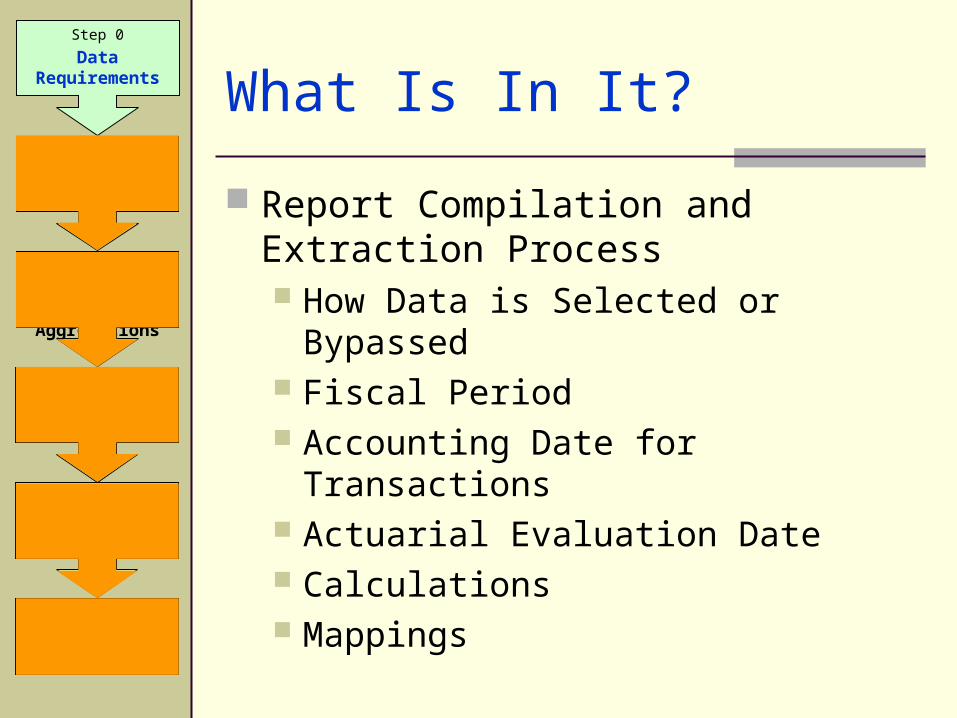
What Is In It?
Report Compilation and Extraction Process How Data is Selected or Bypassed Fiscal Period Accounting Date for Transactions Actuarial Evaluation Date Calculations Mappings
Step 2
TransformationsAggregations
Step 3
Analysis
Step 4
Presentation of Results
Step 1
Data Collection
Step 0
Data Requirements
Final Step
Decisions

What Is In It?
Other Process Flow Documentation Versioning
Step 2
TransformationsAggregations
Step 3
Analysis
Step 4
Presentation of Results
Step 1
Data Collection
Step 0
Data Requirements
Final Step
Decisions

Why Actuaries Need Metadata?
Better Analysis Avoid Being Mis-Informed about Data
Variable and What it Represents Did Anything Change During the
Experience Period
Step 2
TransformationsAggregations
Step 3
Analysis
Step 4
Presentation of Results
Step 1
Data Collection
Step 0
Data Requirements
Final Step
Decisions
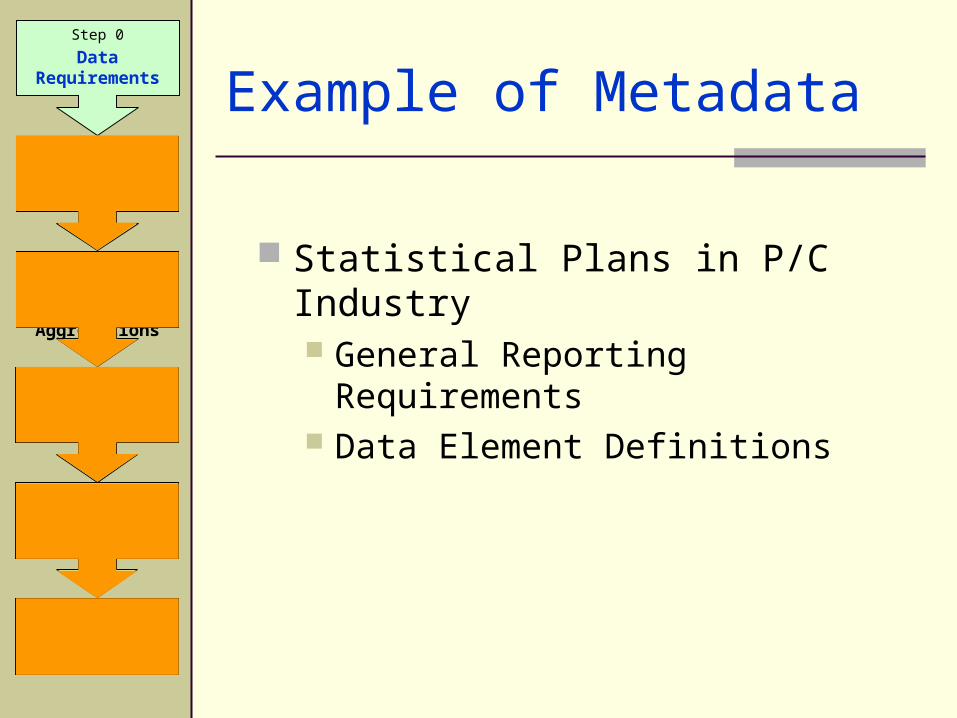
Example of Metadata
Statistical Plans in P/C Industry General Reporting Requirements Data Element Definitions
Step 2
TransformationsAggregations
Step 3
Analysis
Step 4
Presentation of Results
Step 1
Data Collection
Step 0
Data Requirements
Final Step
Decisions
Data Collection
Step 2
TransformationsAggregations
Step 3
Analysis
Step 4
Presentation of Results
Step 1
Data Collection
Step 0
Data Requirements
Final Step
Decisions
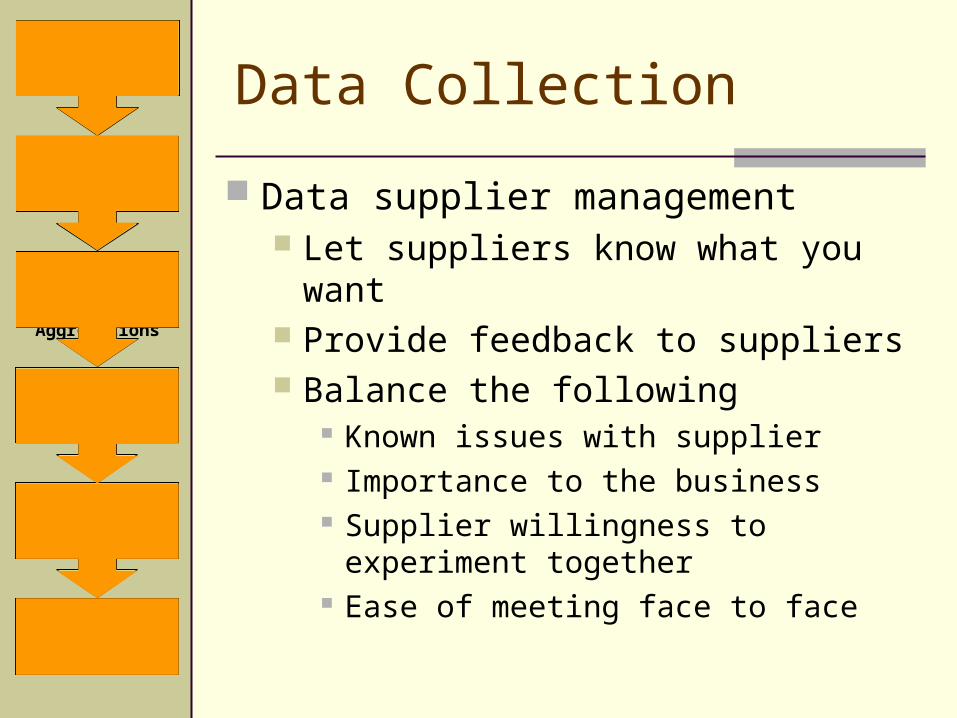
Data supplier management Let suppliers know what you want Provide feedback to suppliers Balance the following
Known issues with supplier Importance to the business Supplier willingness to experiment
together Ease of meeting face to face
Transformations and Aggregations
Step 2
TransformationsAggregations
Step 3
Analysis
Step 4
Presentation of Results
Step 1
Data Collection
Step 0
Data Requirements
Final Step
Decisions
In this step data is put into standardized structures and then combined into larger, more centralized data sets
“Actuarial IQ” introduces two ways to improve IQ in this step: Exploratory Data Analysis (EDA) Data Audits
EDA: Data Preprocessing
Step 2
TransformationsAggregations
Step 3
Analysis
Step 4
Presentation of Results
Step 1
Data Collection
Step 0
Data Requirements
Final Step
Decisions
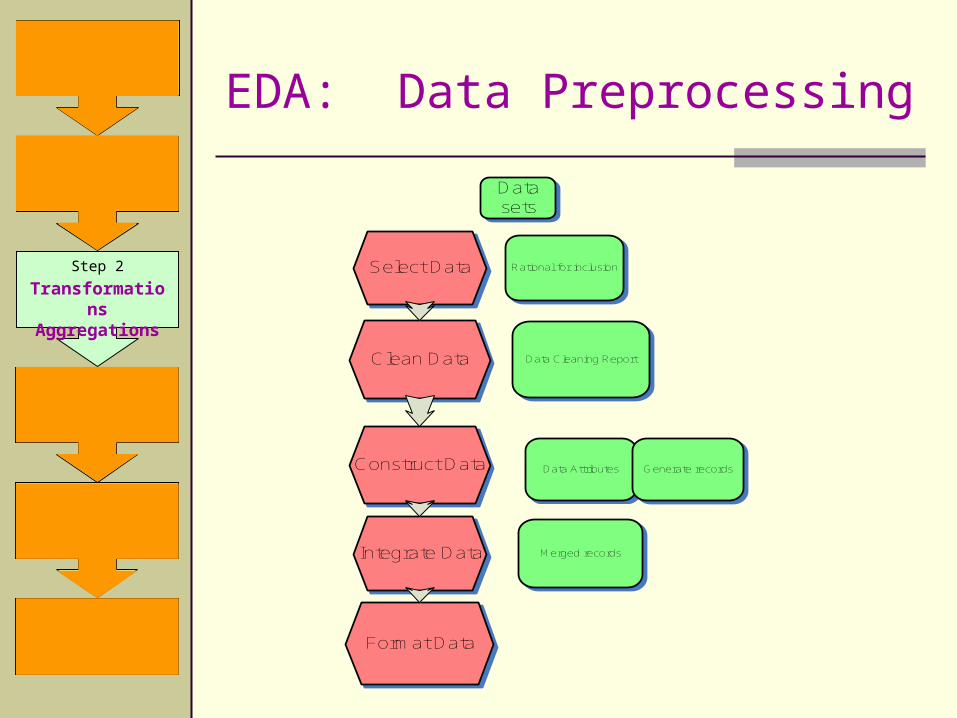
Select Data
Clean Data
Construct Data
Rational for inclusion
Data Cleaning Report
Data Attributes Generate records
Integrate Data Merged records
Format Data
Data sets
EDA: Overview
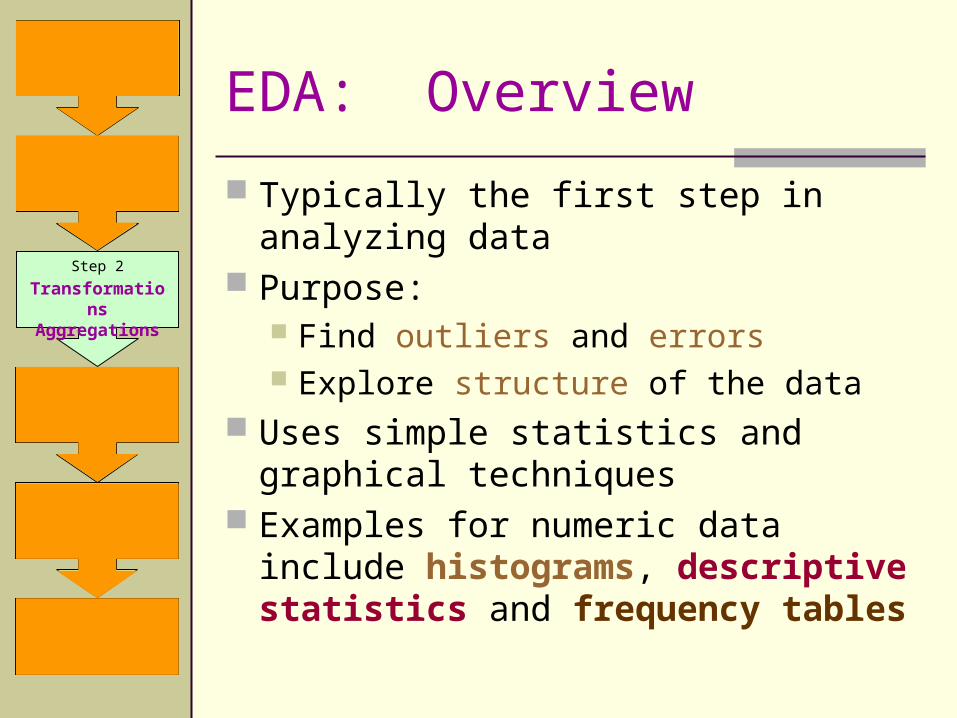
Typically the first step in analyzing data Purpose:
Find outliers and errors Explore structure of the data
Uses simple statistics and graphical techniques
Examples for numeric data include histograms, descriptive statistics and frequency tables
Step 2
TransformationsAggregations
Step 3
Analysis
Step 4
Presentation of Results
Step 1
Data Collection
Step 0
Data Requirements
Final Step
Decisions
EDA: Histograms
Step 2
TransformationsAggregations
Step 3
Analysis
Step 4
Presentation of Results
Step 1
Data Collection
Step 0
Data Requirements
Final Step
Decisions
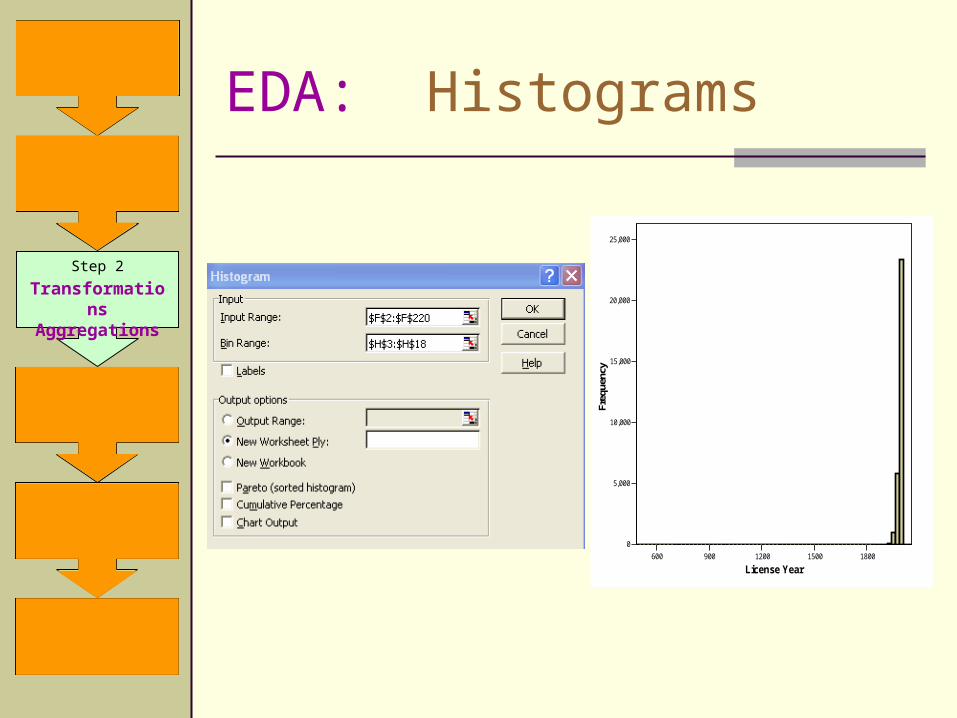
600 900 1200 1500 1800
License Year
0
5,000
10,000
15,000
20,000
25,000
Freq
uenc
y
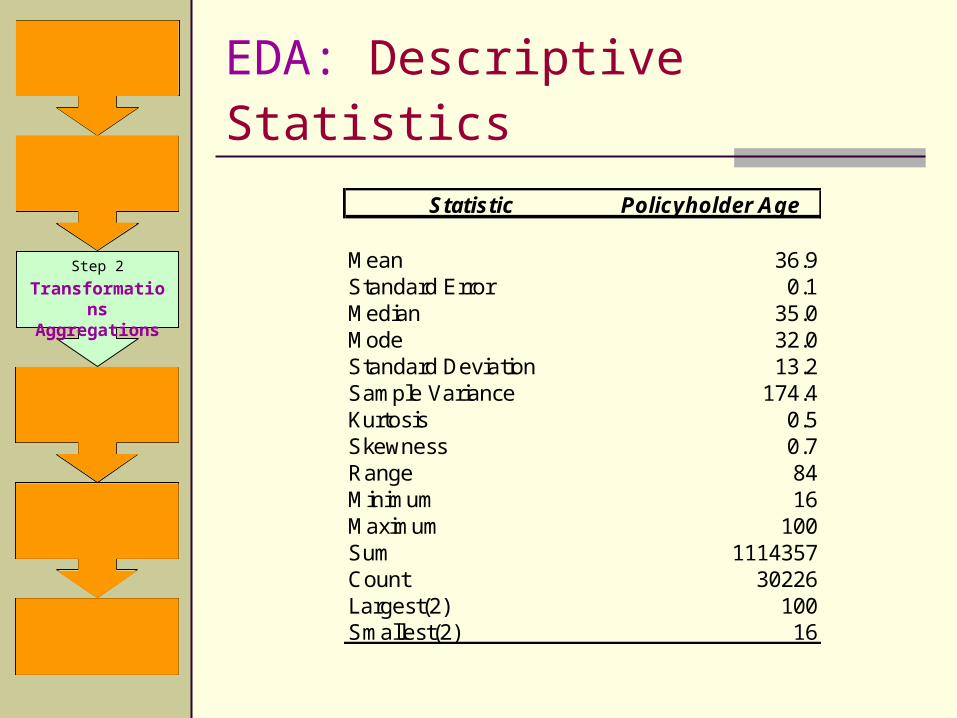
EDA: Descriptive Statistics
Step 2
TransformationsAggregations
Step 3
Analysis
Step 4
Presentation of Results
Step 1
Data Collection
Step 0
Data Requirements
Final Step
Decisions
Statistic Policyholder Age
Mean 36.9Standard Error 0.1Median 35.0Mode 32.0Standard Deviation 13.2Sample Variance 174.4Kurtosis 0.5Skewness 0.7Range 84Minimum 16Maximum 100Sum 1114357Count 30226Largest(2) 100Smallest(2) 16
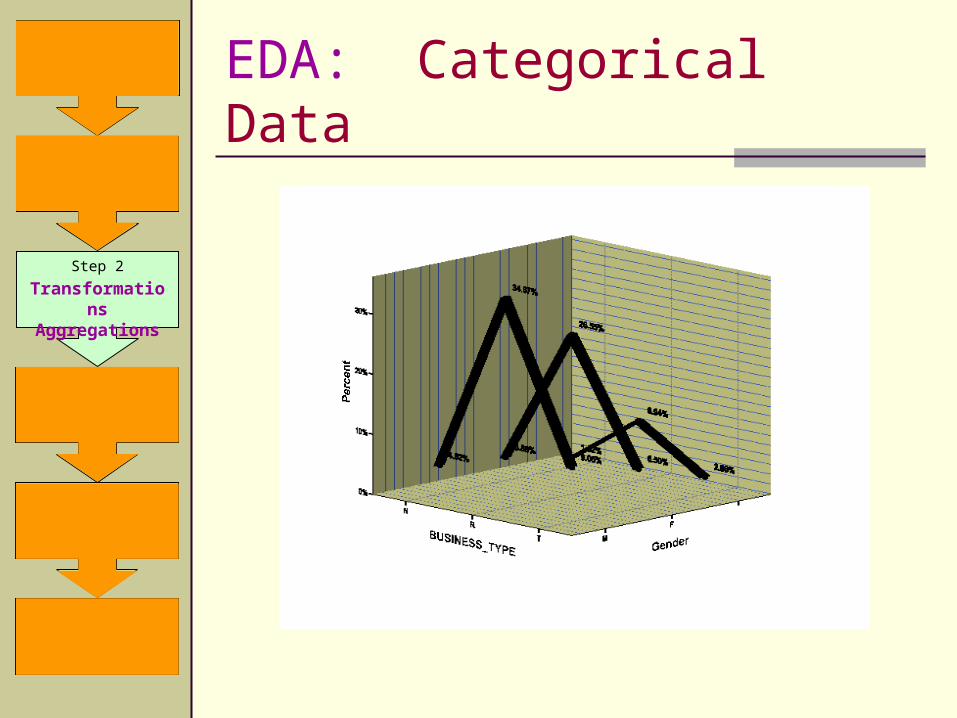
EDA: Categorical Data
Step 2
TransformationsAggregations
Step 3
Analysis
Step 4
Presentation of Results
Step 1
Data Collection
Step 0
Data Requirements
Final Step
Decisions
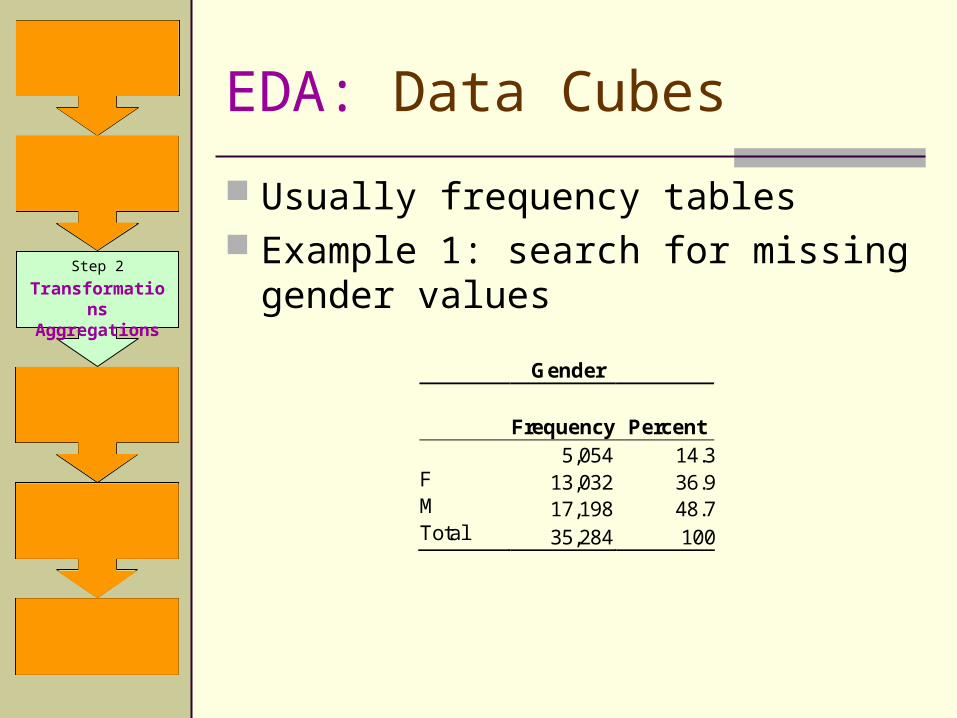
EDA: Data Cubes
Usually frequency tables Example 1: search for missing gender
valuesStep 2
TransformationsAggregations
Step 3
Analysis
Step 4
Presentation of Results
Step 1
Data Collection
Step 0
Data Requirements
Final Step
Decisions
Gender
Frequency Percent 5,054 14.3 F 13,032 36.9 M 17,198 48.7 Total 35,284 100

EDA: Data Cubes
Example 2: identify inconsistent coding of marital status
Step 2
TransformationsAggregations
Step 3
Analysis
Step 4
Presentation of Results
Step 1
Data Collection
Step 0
Data Requirements
Final Step
Decisions
Marital Status
Frequency Percent 5,053 14.3 1 2,043 5.8 2 9,657 27.4 4 2 0 D 4 0 M 2,971 8.4 S 15,554 44.1 Total 35,284 100
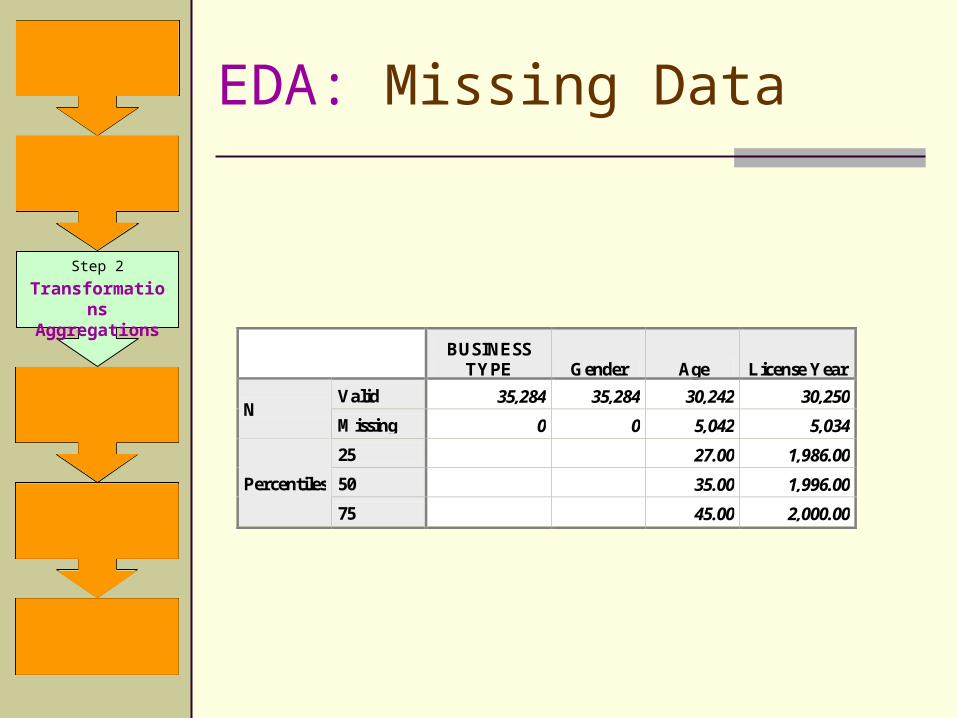
EDA: Missing Data
Step 2
TransformationsAggregations
Step 3
Analysis
Step 4
Presentation of Results
Step 1
Data Collection
Step 0
Data Requirements
Final Step
Decisions
BUSINESS
TYPE Gender Age License Year
Valid 35,284 35,284 30,242 30,250 N
Missing 0 0 5,042 5,034
25 27.00 1,986.00
50 35.00 1,996.00 Percentiles
75 45.00 2,000.00
EDA: Summary
Before data is analyzed, it must be gathered, cleaned and integrated
Techniques from Exploratory Data Analysis can be used to explore the data, and to detect missing values, invalid values and outliers
We have briefly covered histograms, descriptive statistics and frequency tables
Step 2
TransformationsAggregations
Step 3
Analysis
Step 4
Presentation of Results
Step 1
Data Collection
Step 0
Data Requirements
Final Step
Decisions
Data Audits
ASOP No. 23 does not require actuaries to audit, but good to understand
Main Idea: compare the data intended for use to its original source, e.g., policy applications or notices of loss
Top-Down: check that totals from one source match the totals from a reliable source
Bottom-Up: follow a sample of input records through all the processing to the final report
Step 2
TransformationsAggregations
Step 3
Analysis
Step 4
Presentation of Results
Step 1
Data Collection
Step 0
Data Requirements
Final Step
Decisions

Analysis Quality
Step 2
TransformationsAggregations
Step 3
Analysis
Step 4
Presentation of Results
Step 1
Data Collection
Step 0
Data Requirements
Final Step
Decisions
On its way to results data can be: Rejected
wrong Format
Underutilized wrong Model
Distorted wrong Settings
Models
ResultsData
Analysis is a crucial component in the overall process quality

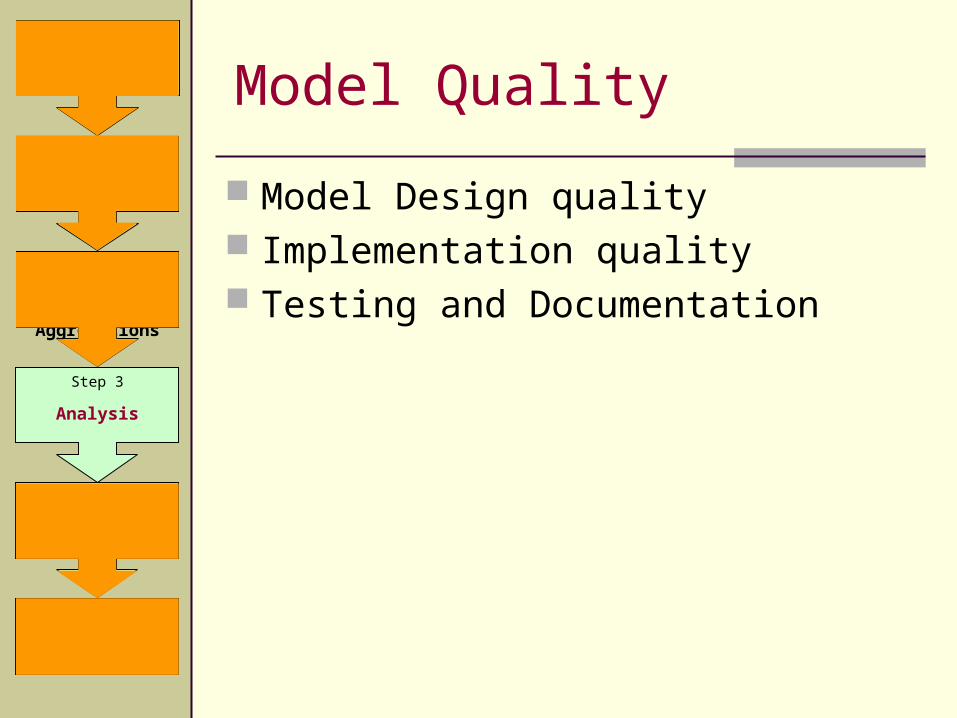
Model Quality
Model Design quality Implementation quality Testing and Documentation
Step 2
TransformationsAggregations
Step 3
Analysis
Step 4
Presentation of Results
Step 1
Data Collection
Step 0
Data Requirements
Final Step
Decisions

Model Quality
Model Design quality Model Selection and Validation Parameters Estimation Verification
Step 2
TransformationsAggregations
Step 3
Analysis
Step 4
Presentation of Results
Step 1
Data Collection
Step 0
Data Requirements
Final Step
Decisions
Did I use the right model ?
Did I use the model right ?
Model Performance
Model Quality
Model Performance
Models predict observable events.
Outcomes can be compared to predictions leading to…
Model’s Improvements Model’s Recalibration Model’s Rejection
leading to… higher process quality.
Step 2
TransformationsAggregations
Step 3
Analysis
Step 4
Presentation of Results
Step 1
Data Collection
Step 0
Data Requirements
Final Step
Decisions

Model Quality
Model Design quality Implementation quality Testing and Documentation
Step 2
TransformationsAggregations
Step 3
Analysis
Step 4
Presentation of Results
Step 1
Data Collection
Step 0
Data Requirements
Final Step
Decisions
Implementation quality Programming languages: C++, VBA, SQL
many books on good design patterns
Formulae in a Spreadsheet - also programmingno books on good design patterns
Need good software design to simplify: Usage Testing Modifications / Improvements Recovery
Model Quality
Step 2
TransformationsAggregations
Step 3
Analysis
Step 4
Presentation of Results
Step 1
Data Collection
Step 0
Data Requirements
Final Step
Decisions(side benefit)
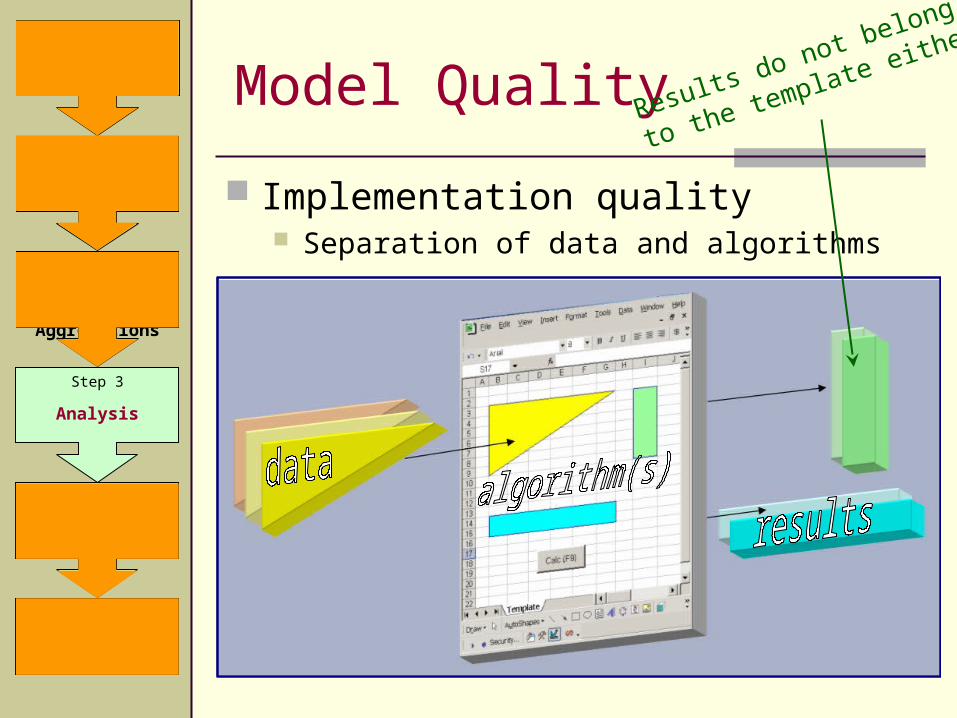
Implementation quality Separation of data and algorithms
Model Quality
Step 2
TransformationsAggregations
Step 3
Analysis
Step 4
Presentation of Results
Step 1
Data Collection
Step 0
Data Requirements
Final Step
Decisions
Results do not belong
to the template either

Implementation quality Layering
simplifies Navigation optimizes Workflow shortens Learning Curve
Model Quality
Step 2
TransformationsAggregations
Step 3
Analysis
Step 4
Presentation of Results
Step 1
Data Collection
Step 0
Data Requirements
Final Step
Decisions
Each Step on its own tab
Model Quality
Model Design quality Implementation quality Testing and Documentation
Step 2
TransformationsAggregations
Step 3
Analysis
Step 4
Presentation of Results
Step 1
Data Collection
Step 0
Data Requirements
Final Step
Decisions
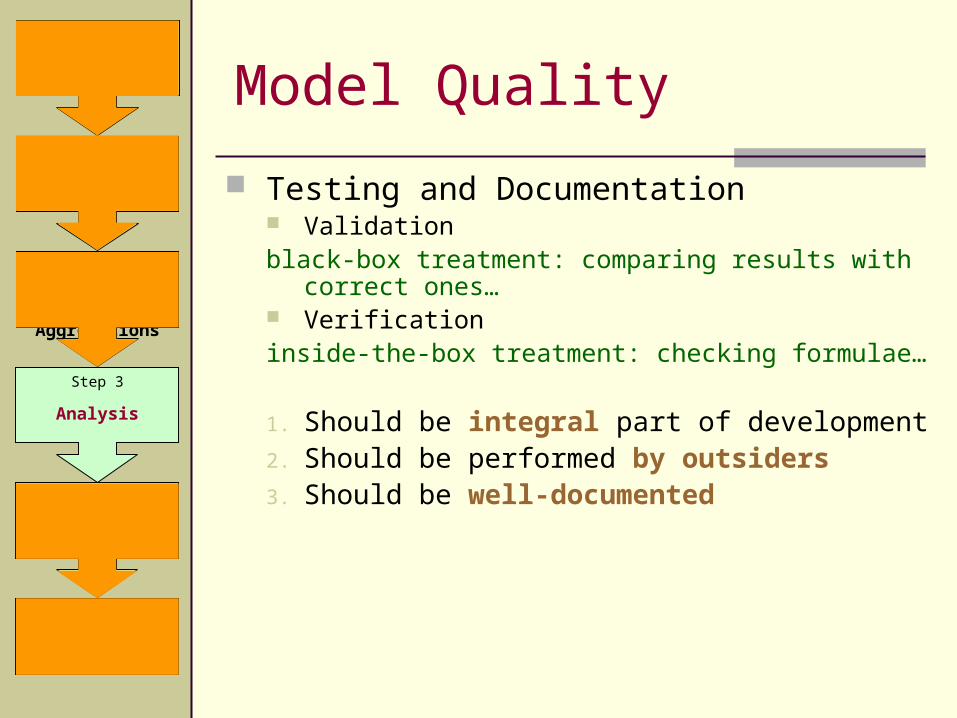
Testing and Documentation Validationblack-box treatment: comparing results with
correct ones… Verificationinside-the-box treatment: checking formulae…
1. Should be integral part of development2. Should be performed by outsiders3. Should be well-documented
Model Quality
Step 2
TransformationsAggregations
Step 3
Analysis
Step 4
Presentation of Results
Step 1
Data Collection
Step 0
Data Requirements
Final Step
Decisions
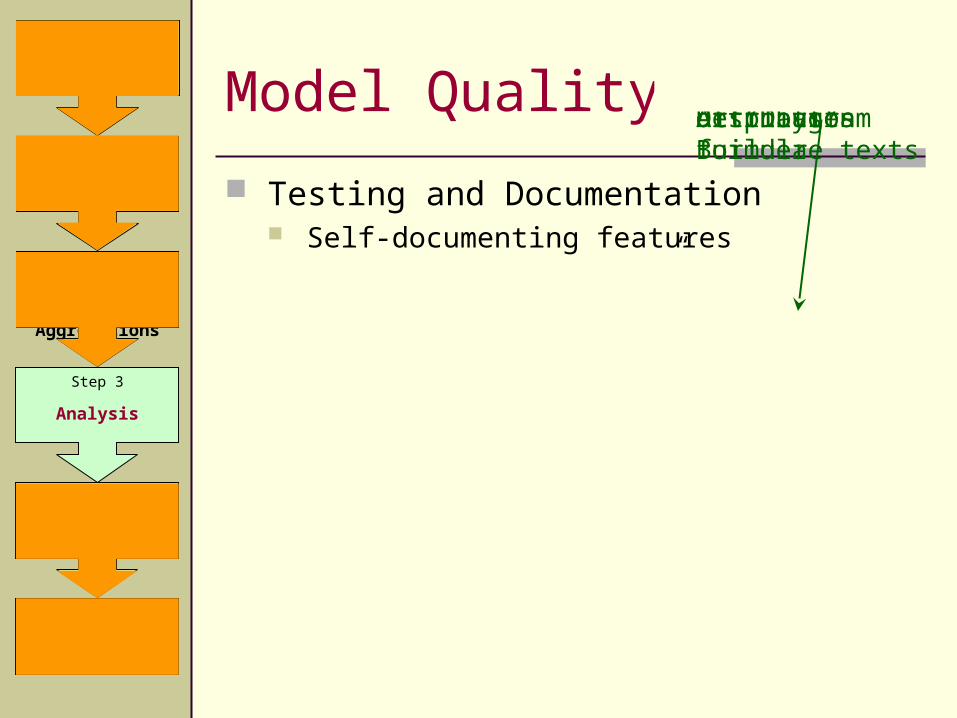
Model Quality
Testing and Documentation Self-documenting features
Database “Documenter” Excel’s named ranges and expressions External Data Range definitions Structured comments
Step 2
TransformationsAggregations
Step 3
Analysis
Step 4
Presentation of Results
Step 1
Data Collection
Step 0
Data Requirements
Final Step
Decisions
Database “Documenter”or “Diagram Builder”
AY\Age 12 24 36 48 60
1994 112,605$ 100,406$ 107,847$ 115,288$ 124,592$
1995 111,644$ 113,215$ 110,271$ 112,562$
1996 115,551$ 106,665$ 104,029$
1997 111,442$ 108,581$
1998 105,647$
<State>: CT<LOB>: WC...Shape --> TriangleAmount--> LossesCumulative- True
Excel’s “CTRL ~”Displays formulae texts
External Data Sourcedefinition
Comments asStructured Attributes
Model Quality
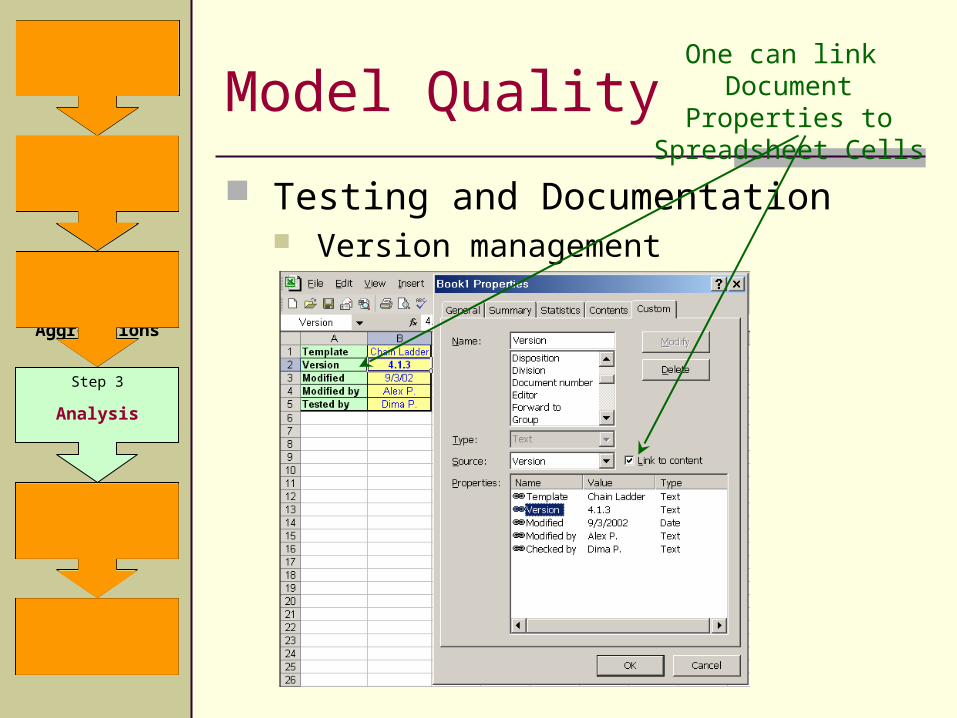
Testing and Documentation Version management
Step 2
TransformationsAggregations
Step 3
Analysis
Step 4
Presentation of Results
Step 1
Data Collection
Step 0
Data Requirements
Final Step
Decisions
One can link Document
Properties to Spreadsheet Cells

Model Quality
Testing and Documentation Documenting Workflow
Step 2
TransformationsAggregations
Step 3
Analysis
Step 4
Presentation of Results
Step 1
Data Collection
Step 0
Data Requirements
Final Step
Decisions
“Smart diagrams” can be automated
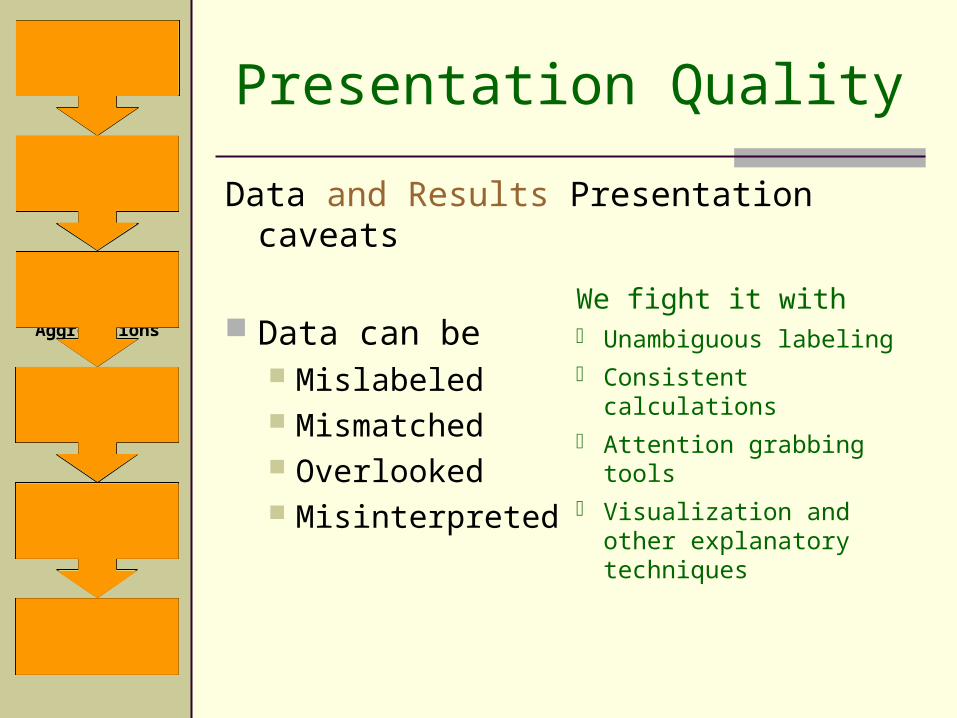
Data and Results Presentation caveats
Data can be Mislabeled Mismatched Overlooked Misinterpreted
Step 2
TransformationsAggregations
Step 3
Analysis
Step 4
Presentation of Results
Step 1
Data Collection
Step 0
Data Requirements
Final Step
Decisions
Presentation Quality
We fight it with Unambiguous labeling Consistent calculations Attention grabbing
tools Visualization and other
explanatory techniques
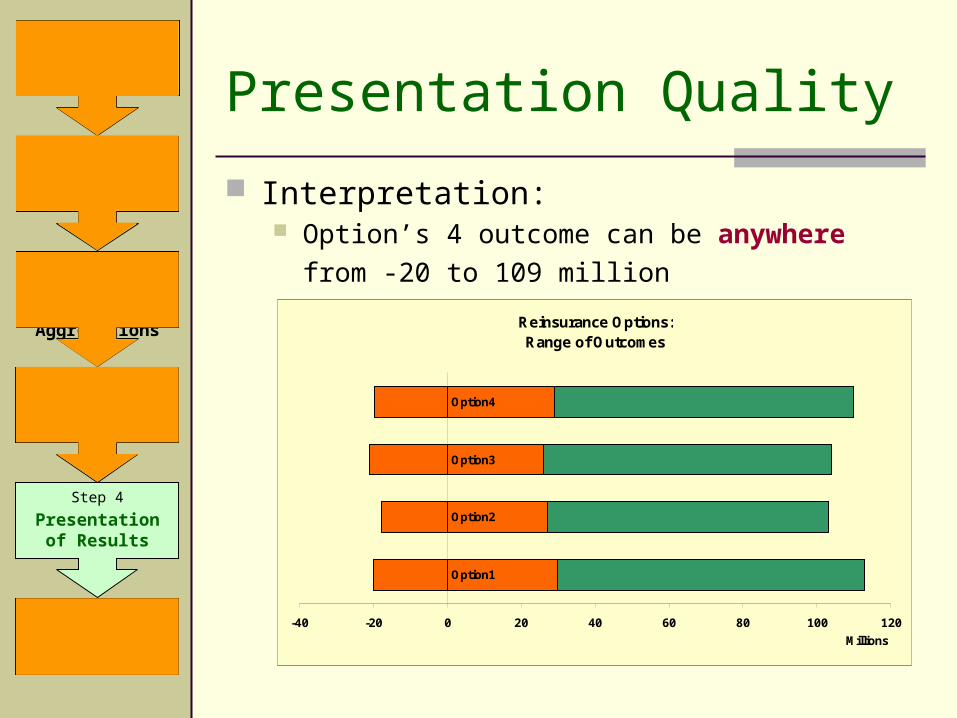
Interpretation: Option’s 4 outcome can be anywhere
from -20 to 109 million
Presentation Quality
Step 2
TransformationsAggregations
Step 3
Analysis
Step 4
Presentation of Results
Step 1
Data Collection
Step 0
Data Requirements
Final Step
Decisions
Reinsurance Options:Range of Outcomes
Option1
Option2
Option3
Option4
-40 -20 0 20 40 60 80 100 120
Millions
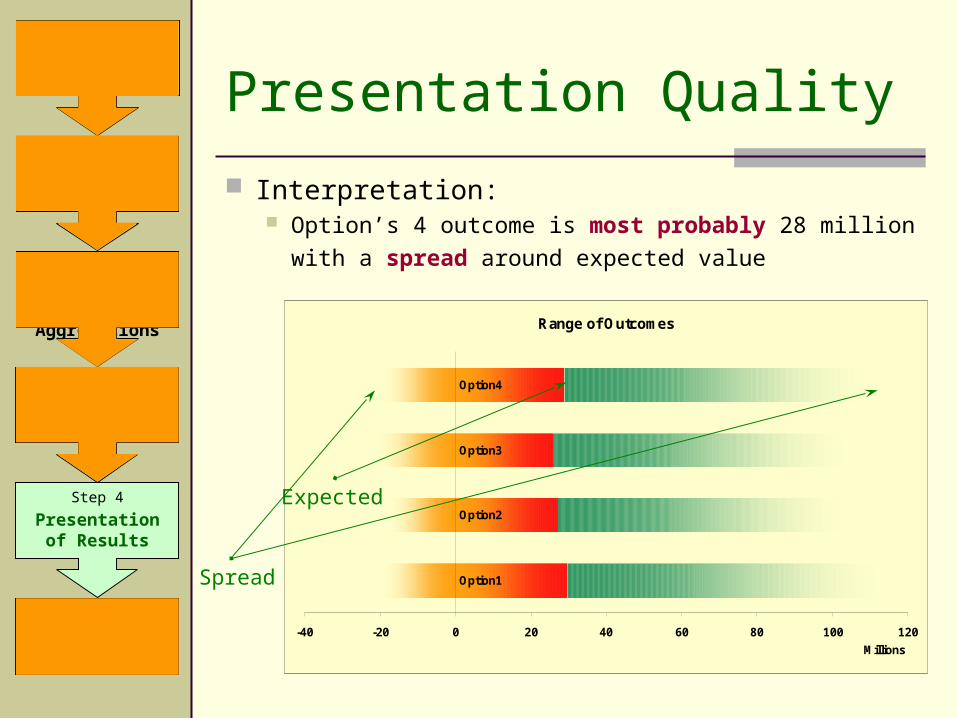
Interpretation: Option’s 4 outcome is most probably 28 million
with a spread around expected value
Presentation Quality
Step 2
TransformationsAggregations
Step 3
Analysis
Step 4
Presentation of Results
Step 1
Data Collection
Step 0
Data Requirements
Final Step
Decisions
Range of Outcomes
Option1
Option2
Option3
Option4
-40 -20 0 20 40 60 80 100 120
Millions
Expected
Spread
Step 2
TransformationsAggregations
Step 3
Analysis
Step 4
Presentation of Results
Step 1
Data Collection
Step 0
Data Requirements
Final Step
Decisions
Decisions, Decisions
It is a great feeling to know that YOU play a part (an important part!) in the Decision Making process
The main goal of the fight for Information Quality is to provide solid
foundation for Quality Decision Making
Actuarial Data Management
Bridge between data requirements, datacollection, data transformation and
aggregation, and data usage
Step 2
TransformationsAggregations
Step 3
Analysis
Step 4
Presentation of Results
Step 1
Data Collection
Step 0
Data Requirements
Final Step
Decisions

Critical Data Management Issues
Appropriateness of the collected data elements for the related analyses
Quality of the collected statistical experience for the related analyses
Step 2
TransformationsAggregations
Step 3
Analysis
Step 4
Presentation of Results
Step 1
Data Collection
Step 0
Data Requirements
Final Step
Decisions
Data Management Best Practices & Guiding Principles
1. Data must be fit for the intended business use:
Even high quality data when repurposed may result in lessened data quality
2. Data should be obtained from the authoritative and appropriate source:
Data should flow from underlying business processes – example, expecting claim adjusters to create injury diagnoses
Know your data sources and their data quality and data management processes
Step 2
TransformationsAggregations
Step 3
Analysis
Step 4
Presentation of Results
Step 1
Data Collection
Step 0
Data Requirements
Final Step
Decisions
Data Management Best Practices & Guiding Principles
3. Common data elements must have a single documented definition and be supported by documented business rules: B.I.: business intelligence, bodily injury,
business interruption, ... Incurred Loss: net as to deductible, net
as to reinsurance, loss and expense, …4. Metadata must be readily available to all
authorized users of the data:
Step 2
TransformationsAggregations
Step 3
Analysis
Step 4
Presentation of Results
Step 1
Data Collection
Step 0
Data Requirements
Final Step
Decisions
Data Management Best Practices & Guiding Principles
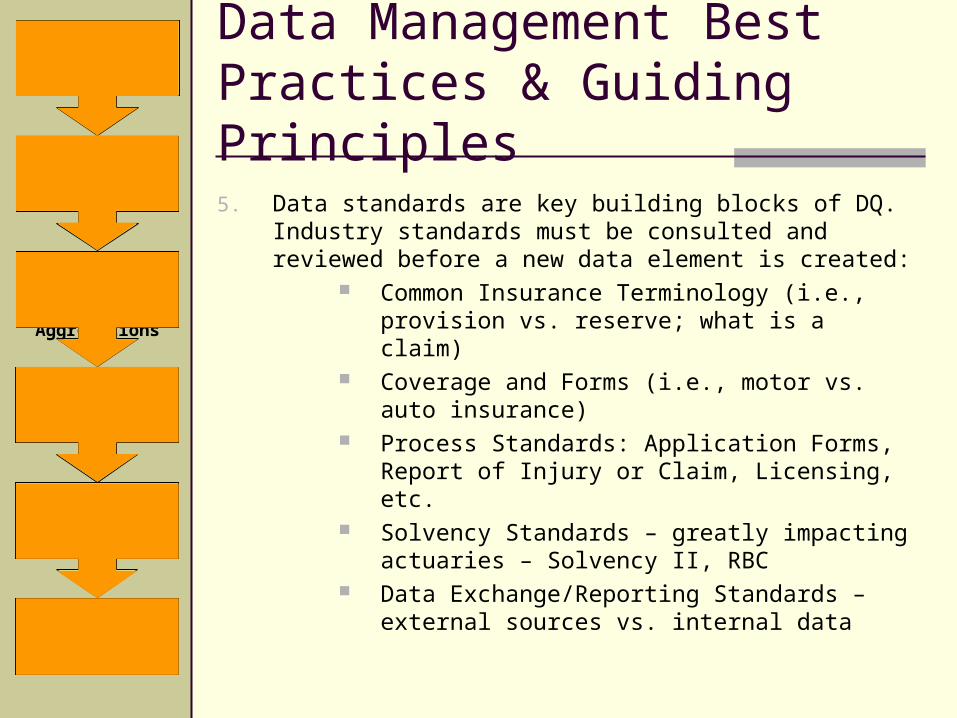
5. Data standards are key building blocks of DQ. Industry standards must be consulted and reviewed before a new data element is created:
Common Insurance Terminology (i.e., provision vs. reserve; what is a claim)
Coverage and Forms (i.e., motor vs. auto insurance)
Process Standards: Application Forms, Report of Injury or Claim, Licensing, etc.
Solvency Standards – greatly impacting actuaries – Solvency II, RBC
Data Exchange/Reporting Standards – external sources vs. internal data
Step 2
TransformationsAggregations
Step 3
Analysis
Step 4
Presentation of Results
Step 1
Data Collection
Step 0
Data Requirements
Final Step
Decisions

Data Management Best Practices & Guiding Principles
Data Quality Standards – industry DQ tools and report cards
Data Element and Code List Definitions Step 2
TransformationsAggregations
Step 3
Analysis
Step 4
Presentation of Results
Step 1
Data Collection
Step 0
Data Requirements
Final Step
Decisions

How to communicate?
How to exchange data?
Need standards!
Benefits of Industry Data Standards
Reinsurer
Insurance Carriers
Regulatory Authorities
Service Providers
Agent/Producer
Insurance Agency
Claims Management Applications
Auditing
Regulatory Compliance
Payment transactions
Premium transactions
Claims
Ins/Reinsurer
Broker/Insurer
Submissions
STRAIGHTTHROUGH
PROCESSING
Step 2
TransformationsAggregations
Step 3
Analysis
Step 4
Presentation of Results
Step 1
Data Collection
Step 0
Data Requirements
Final Step
Decisions

Data Management Best Practices & Guiding Principles
6. Data should have a steward responsible for defining the data, identifying and enforcing the business rules, reconciling the data to the benchmark
source, assuring completeness, and managing data quality.
7. Data should be input only once and edited, validated, and corrected at the point of entry.
Step 2
TransformationsAggregations
Step 3
Analysis
Step 4
Presentation of Results
Step 1
Data Collection
Step 0
Data Requirements
Final Step
Decisions
Data Management Best Practices & Guiding Principles
8. Data should be captured and stored as informational values, not codes.
9. Data must be readily available to all appropriate users and protected against inappropriate access and use.
Step 2
TransformationsAggregations
Step 3
Analysis
Step 4
Presentation of Results
Step 1
Data Collection
Step 0
Data Requirements
Final Step
Decisions
PWC 2004 Study
“The key is to understand the impact data is having on your business and do something about it.”
“Data quality is at the core – if you improve your data you will directly impact your overall business results.”
Global Data Management Survey 2004, PriceWaterhouseCoopers
Step 2
TransformationsAggregations
Step 3
Analysis
Step 4
Presentation of Results
Step 1
Data Collection
Step 0
Data Requirements
Final Step
Decisions

Conclusion
Data Quality is a core issue affecting the quality and usefulness of the actuarial work product
Data Quality is not just about how data is coded: phrase ‘information quality’ is coined to emphasize the impact of processes on the quality of final product
Step 2
TransformationsAggregations
Step 3
Analysis
Step 4
Presentation of Results
Step 1
Data Collection
Step 0
Data Requirements
Final Step
Decisions

Conclusion
Ways to improve actuarial IQ Applying Data Quality principles Defining and using Metadata Measuring data quality to track progress and
awareness of quality audit Utilizing Exploratory Data Analysis to identify
outliers and explore the structure of a dataset
Testing the quality of actuarial models Clarifying actuarial presentations and reports Employing Actuarial Data Management best
practices
Step 2
TransformationsAggregations
Step 3
Analysis
Step 4
Presentation of Results
Step 1
Data Collection
Step 0
Data Requirements
Final Step
Decisions
Conclusion
Expansions of actuarial frame of reference Data is a corporate asset that needs to
be managed and actuaries can play a role
Data needs to be appropriate for all of its intended uses
Expansion of data quality principles to support these broader perspectives
Step 2
TransformationsAggregations
Step 3
Analysis
Step 4
Presentation of Results
Step 1
Data Collection
Step 0
Data Requirements
Final Step
Decisions

Acknowledgement
The working party would like to thank the Insurance Data Management Association (www.idma.org) for their help in: Developing a shortlist of texts that would be
relevant to actuaries Reviewing our papers, and Providing some of the slides of this
presentation
Author, Author…
This presentation is a publication of CAS
Data Management and Information
Educational Materials Working Party: Keith P. Allen Robert Neil Campbell, Chairperson Louise A. Francis David Dennis Hudson Gary W. Knoble Rudy A. Palenik Aleksey Popelyukhin Ph.D. Virginia R. Prevosto Lijuan Zhang


![APPLICATIONS OF RESAMPLING METHODS IN ...job no. 1969 casualty actuarial society CAS journal 1969D04 [3] 11-08-01 4:58 pm 324 APPLICATIONS OF RESAMPLING METHODS IN ACTUARIAL PRACTICE](https://img.pdfslide.us/doc/110x75/5f4b05fed79eb544f85821f2/applications-of-resampling-methods-in-job-no-1969-casualty-actuarial-society.jpg)