Embed Size (px)
Citation preview
Budget and Research 3/19/2019
17-18 Act to 8 Month 8 Month Revised 18-19 Rev Est 19/20 Base
Actuals Actuals Actuals Actuals Actuals 16-17 Act Actuals Actuals % Change Estimate to 17-18 Act. Base to 18/19 Est
Revenue Source 2013-14 2014-15 2015-16 2016-17 2017-18 % Change 2017-18 2018-19 from PY 2018-19 % Change FY2019-20 % Change
Local Taxes
Primary Property Tax 143,930$ 138,244$ 141,309$ 146,121$ 154,560$ 5.8% 89,969$ 94,506$ 5.0% 161,586$ 4.5% 169,213$ 4.7%
Sales Taxes 410,970 407,014 416,522 421,239 432,358 2.6% 289,235 309,193 6.9% 460,963 6.6% 483,874 5.0%
Privilege License Fees 2,483 2,477 2,476 1,485 2,893 94.8% 2,366 2,214 -6.4% 2,780 -3.9% 2,779 0.0%
Other General Fund Excise Taxes 7,187 17,174 17,832 17,984 18,138 0.9% 12,156 12,498 2.8% 18,390 1.4% 18,580 1.0%
Subtotal 564,570$ 564,909$ 578,139$ 586,829$ 607,949$ 3.6% 393,726$ 418,411$ 6.3% 643,719$ 5.9% 674,446$ 4.8%
Non Taxes
Licenses & Permits 2,775 2,783 2,754 2,879 2,872 -0.2% 1,778 1,773 -0.3% 3,003 4.6% 2,998 -0.2%
Cable Communications 9,720 9,574 10,028 10,391 10,884 4.7% 5,514 5,594 1.5% 10,500 -3.5% 10,600 1.0%
Fines & Forfeitures 17,540 15,676 13,460 12,039 12,711 5.6% 8,546 8,102 -5.2% 12,856 1.1% 12,854 0.0%
Court Default Fee 1,013 897 1,047 1,164 1,273 9.4% 725 783 8.0% 1,446 13.6% 1,446 0.0%
Parks & Libraries 9,207 8,937 8,308 8,272 18,221 120.3% 13,295 4,865 -63.4% 7,779 -57.3% 7,733 -0.6%
Planning 1,251 1,312 1,647 1,690 1,752 3.7% 1,188 1,084 -8.8% 1,754 0.1% 1,805 2.9%
Police 13,111 14,687 13,729 13,720 14,347 4.6% 9,362 9,123 -2.6% 14,278 -0.5% 14,230 -0.3%
Street Transportation 4,426 4,672 4,369 5,194 5,863 12.9% 4,553 3,924 -13.8% 4,577 -21.9% 4,798 4.8%
Emergency Transportation 30,785 34,502 37,005 34,518 35,884 4.0% 23,874 24,232 1.5% 36,258 1.0% 36,964 1.9%
Hazardous Materials Inspection Fee 1,239 1,312 1,358 1,388 1,364 -1.7% 620 550 -11.3% 1,400 2.6% 1,400 0.0%
Other Service Charges 13,935 14,710 17,245 16,752 20,302 21.2% 14,087 15,661 11.2% 22,053 8.6% 22,460 1.8%
All Others 16,351 15,923 14,052 14,168 16,456 16.1% 11,943 10,462 -12.4% 15,487 -5.9% 15,455 -0.2%
Subtotal 121,353$ 124,985$ 125,002$ 122,175$ 141,929$ 16.2% 95,485$ 86,153$ -9.8% 131,391$ -7.4% 132,743$ 1.0%
State Shared Revenues
Sales Tax 127,005 132,218 137,544 143,976 155,998 8.4% 101,213 106,999 5.7% 164,226 5.3% 172,557 5.1%
Income Tax 161,580 175,184 174,234 191,225 200,036 4.6% 133,357 131,278 -1.6% 196,918 -1.6% 215,228 9.3%
Vehicle License Tax 51,689 55,293 59,801 61,586 66,784 8.4% 44,050 45,954 4.3% 71,590 7.2% 76,370 6.7%
Subtotal 340,274$ 362,695$ 371,579$ 396,787$ 422,818$ 6.6% 278,620$ 284,231$ 2.0% 432,734$ 2.3% 464,155$ 7.3%
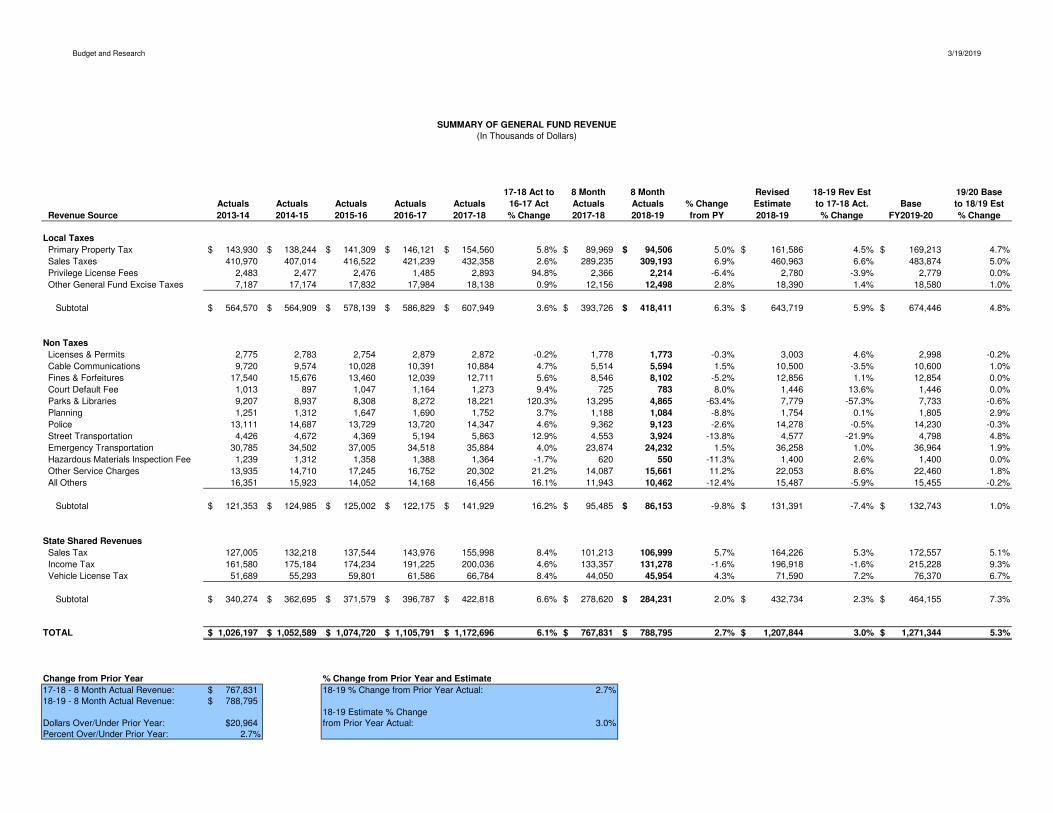
TOTAL 1,026,197$ 1,052,589$ 1,074,720$ 1,105,791$ 1,172,696$ 6.1% 767,831$ 788,795$ 2.7% 1,207,844$ 3.0% 1,271,344$ 5.3%
Change from Prior Year % Change from Prior Year and Estimate
17-18 - 8 Month Actual Revenue: 767,831$ 18-19 % Change from Prior Year Actual: 2.7%18-19 - 8 Month Actual Revenue: 788,795$
18-19 Estimate % Change Dollars Over/Under Prior Year: $20,964 from Prior Year Actual: 3.0%Percent Over/Under Prior Year: 2.7%
SUMMARY OF GENERAL FUND REVENUE
(In Thousands of Dollars)
Budget & Research 15-Mar-19
:plt1908 03:40 PM
CITY PLT BY MONTH(In Thousands)
(8+4)
2017-18 2018-19 2018-19 % Change 2018-19 % Change 2019-20 % ChangeActual Budget Actual from PY Estimate from PY Estimate from PY
July $37,065 $37,216 $38,000 2.5% $38,000 2.5% $40,676 7.0%
August 36,182 38,023 39,071 8.0% 39,071 8.0% 40,377 3.3%
September 36,412 36,874 39,531 8.6% 39,531 8.6% 39,893 0.9%
October 36,451 38,397 38,640 6.0% 38,640 6.0% 41,719 8.0%
November 35,071 36,246 38,370 9.4% 38,370 9.4% 39,755 3.6%
December 34,067 35,894 37,085 8.9% 37,085 8.9% 38,590 4.1%
January 39,254 40,303 41,824 6.5% 41,824 6.5% 44,233 5.8%
February 34,733 34,425 36,673 5.6% 36,673 5.6% 37,405 2.0%
March 34,205 35,460 0 NA 35,591 4.1% 38,100 7.1%
April 39,392 39,143 0 NA 40,108 1.8% 43,001 7.2%
May 36,082 36,505 0 NA 37,148 3.0% 39,869 7.3%
June 37,538 36,977 0 NA 37,962 1.1% 40,600 6.9%
Subtotal: $436,453 $445,463 $309,193 NA $460,003 5.4% $484,218 5.3%
Year End Adjustments (4,095) (900) 0 NA 960 NA (344) NA
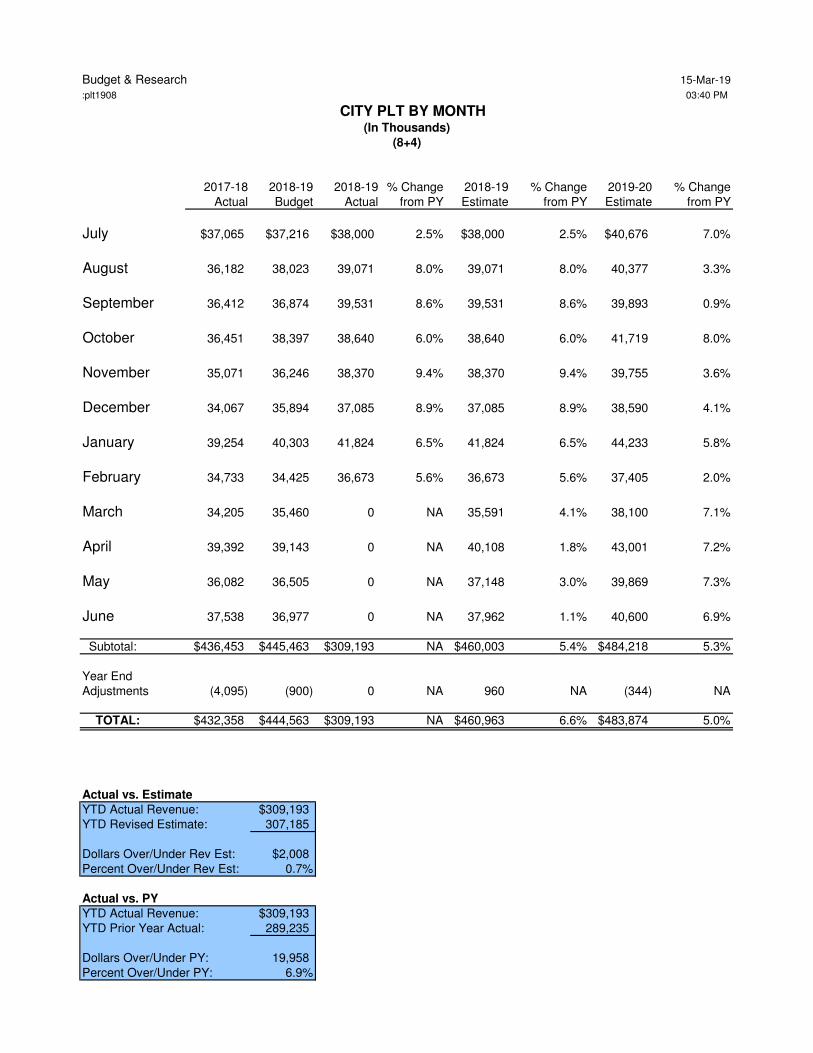
TOTAL: $432,358 $444,563 $309,193 NA $460,963 6.6% $483,874 5.0%
Actual vs. Estimate
YTD Actual Revenue: $309,193YTD Revised Estimate: 307,185
Dollars Over/Under Rev Est: $2,008Percent Over/Under Rev Est: 0.7%
Actual vs. PY
YTD Actual Revenue: $309,193YTD Prior Year Actual: 289,235
Dollars Over/Under PY: 19,958Percent Over/Under PY: 6.9%
Budget & Research 15-Mar-19
:plt1908
% Change
Jul Aug Sep1 Oct1 Nov Dec Jan Feb Mar Apr May Jun TOTAL from PY
Category (Act) (Act) (Act) (Act) (Act) (Act) (Act) (Act) (Est) (Est) (Est) (Est) (Act/Est) TOTAL ACTUAL
Advertising 0 0 0 0 0 0 0 0 0 0 0 0 0 0 NA
Contracting 1,995 1,680 1,980 1,792 1,912 1,670 2,381 1,898 1,545 1,784 1,766 1,958 22,361 22,361 25.0% (% change from prior year) 32.0% 49.8% 44.2% 39.7% 29.5% 6.5% 52.2% 32.8% 7.1% 6.8% -2.1% 19.0% 25.0%
Job Printing 55 42 71 66 65 78 76 58 51 54 52 53 721 721 2.3% (% change from prior year) 0.6% -15.2% 17.9% 14.5% -2.4% 43.4% 33.2% -19.1% -10.1% -13.8% -8.0% -6.2% 2.3%
Publishing 12 14 13 13 18 3 5 4 18 19 23 16 157 157 4.6% (% change from prior year) 8.9% 13.2% 25.5% 13.0% 13.7% -77.9% -66.7% -54.1% 46.4% 53.4% 37.4% 44.3% 4.6%
Transportation & Towing 2 2 0 1 1 0 0 0 0 0 0 (0) 7 7 46.7% (% change from prior year) 551.2% 458.1% 224.2% 29.2% 380.8% 9.1% -36.8% -40.6% -100.0% -100.0% -100.0% -136.1% 46.7%
Restaurants & Bars 2,085 2,005 1,971 2,135 2,251 2,215 2,259 2,354 2,561 2,851 2,756 2,536 27,979 27,979 7.7% (% change from prior year) 10.9% 12.9% 6.3% 5.4% 5.8% 10.7% -7.2% 8.7% 12.2% 7.2% 10.8% 11.0% 7.7%
Leases & Rentals (Property) 1,440 1,509 1,469 1,450 1,695 1,615 1,722 1,798 1,827 2,224 1,805 1,721 20,274 20,274 7.9% (% change from prior year) 2.5% 13.9% 8.6% 7.0% 9.5% 3.0% 13.6% 11.1% -0.9% 11.9% 5.4% 10.6% 7.9%
Commercial Rentals 3,592 3,344 3,223 3,396 3,398 3,495 3,935 3,396 3,267 3,442 3,406 3,489 41,385 41,385 4.9% (% change from prior year) 11.1% 11.2% 11.2% -2.1% 3.5% 14.5% 5.1% 7.4% 3.0% -3.1% -4.9% 6.0% 4.9%
Hotel/Motel 649 561 548 732 1,063 915 692 691 1,594 2,075 1,427 1,016 11,963 11,963 16.0% (% change from prior year) 15.0% 27.9% 11.9% 19.5% 21.8% 16.4% -10.2% -29.9% 31.3% 23.0% 36.4% 20.1% 16.0%
Residential Property Rentals 1,969 2,139 2,052 2,049 1,971 2,341 2,287 2,101 1,919 1,918 1,876 1,925 24,547 24,547 4.8% (% change from prior year) 4.2% 18.9% -3.4% 5.5% 1.3% 24.0% 15.0% 7.6% -7.4% -5.4% 0.5% -0.1% 4.8%
Retail 16,193 15,458 16,137 15,992 16,420 16,637 20,063 15,760 15,061 17,340 16,106 16,551 197,717 197,717 4.9% (% change from prior year) -2.1% 6.6% 8.8% 7.3% 14.7% 12.3% 6.3% 5.9% 1.4% -1.4% 2.3% -0.5% 4.9%
Food 0 19 1 0 0 0 (0) 0 0 0 0 (19) 0 0 NA (% change from prior year) -75.0% -98721.1% 525900.0% -100.0% -100.0% -100.0% -223.6% -100.0% -100.0% -100.0% -100.0% -11262.8% -101.1%
Amusements 388 342 411 381 329 350 402 402 396 574 392 428 4,794 4,794 0.0% (% change from prior year) 13.9% 5.9% -16.9% -4.7% -7.1% -16.3% 35.2% 8.6% 2.2% -2.1% -0.2% -0.6% 0.0%
Telecommunications 1,034 1,027 1,132 946 952 914 921 941 975 974 990 971 11,777 11,777 -10.4% (% change from prior year) -20.4% 2.7% -0.2% -14.5% -16.4% -13.8% -15.8% -16.8% -3.4% -8.3% -6.4% -7.5% -10.4%
Other Utilities1
6,225 8,880 8,405 7,637 6,250 4,726 4,556 4,940 4,563 4,688 4,848 5,563 71,280 71,280 0.0% (% change from prior year) -5.5% -3.0% 3.5% 0.9% -1.8% -5.9% -1.1% 3.4% 18.0% 3.8% 6.3% -9.4% 0.0%
Use 2,186 1,887 1,919 1,855 1,898 1,963 2,403 2,162 1,666 2,047 1,566 1,630 23,182 23,182 14.8% (% change from prior year) 41.2% 27.1% 25.9% 16.9% 30.7% 15.3% 15.1% 6.9% -9.8% 10.0% 0.4% 7.5% 14.8%
Penalty & Interest 177 162 199 196 147 163 121 168 149 119 136 123 1,859 1,859 0.0%
Subtotal $38,000 $39,072 $39,531 $38,640 $38,371 $37,085 41,823 36,673 35,591 40,108 37,148 37,961 460,003 460,003 5.4%
Increase over PY 2.5% 8.0% 8.6% 6.0% 9.4% 8.8% 6.5% 5.6% 4.1% 1.8% 3.0% 1.1% 5.4% 5.4%
Balance to Cash 0 (1) 0 0 (1) 0 1 0 0 0 0 1 0 0 NA
TOTAL $38,000 $39,071 $39,531 $38,640 $38,370 $37,085 $41,824 $36,673 $35,591 $40,108 $37,148 $37,962 $460,003 $460,003 5.4%
(% change from prior year) 2.5% 8.0% 8.6% 6.0% 9.4% 8.9% 6.5% 5.6% 4.1% 1.8% 3.0% 11.3%
REVISED ESTIMATE $38,000 $39,071 $39,531 $38,640 $38,370 $37,085 $41,824 $36,673 $35,591 $40,108 $37,148 $37,962 $460,003
Year End (A/R) (2,500) NA
GASB 3,460 10801.7%
Clearing Account/Adj 0 NATOTAL: $460,963 6.6%
PLT CATEGORY ANALYSIS
FY 2018-19 ACTUALS
(8+4)
(000's)
1. Growth rates for utilities in September and October 2017 were impacted by timing issues that occurred due to the transition of several large utility providers
to the ADOR collection system in September 2016, which delayed receipt of payments until October 2016. Growth rates in other categories may be similarly
impacted in September and October due to other taxpayers transition to the State collection system.
Budget & Research 15-Mar-19
:plt1908
2017-18 2018-19 Actual/Actual Actual/Estimate
Category Actual Budget Estimate Actual Amount Percent Amount Percent
Contracting 1,429 1,098 1,512 1,898 469 32.8% 386 25.5%
Job Printing 72 61 57 58 (14) -19.1% 1 2.5%
Publishing 9 15 17 4 (5) -54.1% (12) -73.8%
Transportation & Towing 1 0 0 0 (0) -40.6% 0 NA
Restaurants & Bars 2,166 2,212 2,413 2,354 188 8.7% (59) -2.4%
Leases & Rentals (Property) 1,618 1,633 1,736 1,798 180 11.1% 62 3.6%
Commercial Rentals 3,162 3,031 3,178 3,396 235 7.4% 218 6.9%
Hotel/Motel 986 1,063 1,196 691 (294) -29.9% (504) -42.2%
Residential Property Rentals 1,953 1,806 1,836 2,101 148 7.6% 265 14.4%
Retail 14,884 14,991 14,892 15,760 876 5.9% 868 5.8%
Food 0 0 0 0 (0) -100.0% 0 NA
Amusements 370 430 386 402 32 8.6% 16 4.0%
Telecommunications 1,131 1,045 1,009 941 (190) -16.8% (68) -6.8%
Other Utilities 4,775 5,053 5,051 4,940 164 3.4% (111) -2.2%
Use 2,023 1,820 1,982 2,162 140 6.9% 180 9.1%
Penalty & Interest 154 167 140 168 14 9.3% 28 20.0%
Subtotal $34,733 $34,425 $35,404 $36,673 $1,941 5.6% 1,269 3.6%
Balance to Cash 0 0 0 0 0 NA 0 NA
TOTAL $34,733 $34,425 $35,404 $36,673 $1,941 5.6% $1,269 3.6%
GENERAL FUND PLT CATEGORY ANALYSIS
February 2019
Budget & Research
:plt1908
Category Jul Aug Sep Oct Nov Dec Jan Feb Mar Apr May Jun Est
Advertising N/A N/A N/A N/A N/A N/A N/A N/A N/A N/A N/A N/A NA
Contracting 32.0% 40.5% 41.8% 41.3% 38.7% 32.6% 35.7% 35.3% --- --- --- --- 25.0%
Job Printing 0.6% -6.9% 2.1% 5.3% 3.5% 9.8% 13.2% 8.2% --- --- --- --- 2.3%
Publishing 8.9% 11.2% 15.6% 14.9% 14.6% -2.6% -13.0% -17.0% --- --- --- --- 4.6%
Transportation & Towing 551.2% 496.0% 459.0% 304.8% 317.3% 255.4% 173.0% 134.7% --- --- --- --- 54.0%
Restaurants & Bars 10.9% 11.9% 10.0% 8.8% 8.1% 8.6% 5.8% 6.2% --- --- --- --- 7.7%
Leases & Rentals (Property) 2.5% 8.0% 8.2% 7.9% 8.3% 7.3% 8.2% 8.6% --- --- --- --- 7.9%
Commercial Rentals 11.1% 11.1% 9.5% 6.3% 5.7% 7.1% 6.8% 6.9% --- --- --- --- 4.9%
Hotel/Motel 15.0% 20.6% 17.8% 18.3% 19.3% 18.7% 13.8% 6.0% --- --- --- --- 16.0%
Residential Property Rentals 4.2% 11.4% 6.0% 5.8% 4.9% 8.0% 9.1% 8.9% --- --- --- --- 4.8%
Retail -2.1% 2.0% 4.2% 4.9% 6.8% 7.7% 7.5% 7.3% --- --- --- --- 4.9%
Food -75.0% 11015.4% 11326.6% 2137.7% 1622.7% 1382.0% 1298.0% 1176.4% --- --- --- --- NA
Amusements 13.9% 10.0% -1.5% -2.3% -3.2% -5.6% -0.9% 0.2% --- --- --- --- 0.0%
Telecommunications -20.4% -10.4% -7.0% -8.8% -10.4% -10.9% -11.6% -12.3% --- --- --- --- -10.4%
Other Utility -5.5% -4.0% -1.5% -0.9% -1.0% -1.6% -1.6% -1.1% --- --- --- --- 0.0%
Use 41.2% 34.3% 31.5% 27.7% 28.3% 25.9% 23.9% 21.4% --- --- --- --- 14.8%
Penalty & Interest -14.7% -13.6% 0.9% 10.6% 14.0% 17.4% 6.8% 7.1% --- --- --- --- 0.0%
Subtotal 2.5% 5.2% 6.3% 6.3% 6.9% 7.2% 7.1% 6.9% --- --- --- --- 5.4%
Balance to Cash NA NA NA NA NA NA NA NA NA NA NA NA NA
SUBTOTAL 2.5% 5.2% 6.3% 6.2% 6.9% 7.2% 7.1% 6.9% --- --- --- --- 5.4%
Year End Adj. NA
TOTAL 2.5% 5.2% 6.3% 6.2% 6.9% 7.2% 7.1% 6.9% --- --- --- --- 6.6%
PLT CATEGORY ANALYSIS
CUMULATIVE YEAR-TO-DATE PERCENTAGE CHANGE
2018-19 ACTUALS COMPARED TO 2017-18
(8+4)
Budget & Research 15-Mar-19
:plt1908 03:40 PM
CONVENTION CENTER EXCISE TAX BY MONTH(In Thousands)
(8+4)
2017-18 2018-19 2018-19 % Change 2018-19 % Change 2019-20 % ChangeActual Budget Actual from PY Estimate from PY Estimate from PY
July $3,664 $3,718 $4,280 16.8% $4,280 16.8% $4,768 11.4%
August 3,065 3,440 3,829 24.9% 3,829 24.9% 4,280 11.8%
September 3,436 3,516 4,007 16.6% 4,007 16.6% 4,343 8.4%
October 3,717 3,816 4,383 17.9% 4,383 17.9% 4,801 9.5%
November 4,395 4,379 5,220 18.8% 5,220 18.8% 5,580 6.9%
December 4,220 4,256 4,719 11.8% 4,719 11.8% 5,212 10.4%
January 4,678 4,593 4,828 3.2% 4,828 3.2% 5,900 22.2%
February 4,527 4,068 5,987 32.2% 5,987 32.2% 5,505 -8.0%
March 5,046 4,761 0 NA 5,631 11.6% 6,233 10.7%
April 6,276 5,306 0 NA 6,933 10.5% 7,643 10.2%
May 5,187 4,734 0 NA 5,616 8.3% 6,263 11.5%
June 4,523 4,077 0 NA 5,128 13.4% 5,785 12.8%
Subtotal: $52,735 $50,666 $37,253 NA $60,561 14.8% $66,311 9.5%
Year EndAdjustment (5) 241 0 NA 1,050 NA 315 -70%
TOTAL: $52,730 $50,907 $37,253 NA $61,611 16.8% $66,626 8.1%
Actual vs. Estimate
YTD Actual Revenue: $37,253YTD Revised Estimate: 36,789
Dollars Over/Under Rev Est: $465Percent Over/Under Rev Est: 1.3%
Actual vs. Prior Year
YTD Actual Revenue: $37,253YTD Prior Year Actual: 31,703
Dollars Over/Under PY: 5,550Percent Over/Under PY: 17.5%
Budget & Research 15-Mar-19
:plt1908
% Change
Jul Aug Sep Oct Nov Dec Jan Feb Mar Apr May Jun TOTAL from PY
Category (Act) (Act) (Act) (Act) (Act) (Act) (Act) (Act) (Est) (Est) (Est) (Est) (Act/Est) Total ACTUAL
Advertising $158 $157 $163 $243 $357 $279 $277 $187 $138 $128 $162 $158 $2,407 $2,407 9.6%-23.5% -18.3% -20.5% 26.0% 91.5% 43.2% 50.6% 33.3% -15.4% -15.4% -15.4% -15.7% 9.6%
Contracting 1,425 1,200 1,414 1,280 1,366 1,193 1,701 1,355 1,103 1,274 1,261 1,399 15,972 15,972 25.0%32.0% 49.8% 44.2% 39.7% 29.5% 6.5% 52.2% 32.8% 7.1% 6.8% -2.1% 19.0% 25.0%
Job Printing 39 30 50 47 46 55 55 41 37 39 37 38 515 515 2.3%0.6% -15.2% 17.9% 14.5% -2.4% 43.4% 33.2% -19.1% -10.1% -13.8% -8.0% -6.2% 2.3%
Publishing 8 10 9 9 13 2 3 3 13 13 16 12 112 112 4.6%8.9% 13.2% 25.5% 13.0% 13.7% -77.9% -66.7% -54.1% 46.4% 53.4% 37.4% 44.3% 4.6%
Transportation & Towing 1 1 0 0 1 0 0 0 0 0 0 (0) 5 5 46.7%551.2% 458.1% 224.2% 29.2% 380.8% 9.1% -36.8% -40.6% -100.0% -100.0% -100.0% -136.1% 46.7%
Restaurants & Bars 1,489 1,432 1,408 1,525 1,608 1,582 1,614 1,681 1,829 2,036 1,968 1,812 19,985 19,985 7.7%10.9% 12.9% 6.3% 5.4% 5.8% 10.7% -7.2% 8.7% 12.2% 7.2% 10.8% 11.0% 7.7%
Hotel/Motel 1,159 997 962 1,278 1,830 1,607 1,180 2,717 2,511 3,442 2,171 1,711 21,565 21,565 16.0%17.2% 31.5% 9.9% 15.0% 16.2% 12.6% -25.6% 54.4% 15.6% 15.6% 15.6% 15.6% 16.0%
Other 0 0 0 0 0 0 0 0 0 0 0 0 0 0 NA
Subtotal $4,280 $3,828 $4,007 $4,383 $5,220 $4,719 $4,829 $5,986 $5,631 $6,933 $5,616 $5,129 $60,561 $60,561 14.8%
16.8% 24.9% 16.6% 17.9% 18.8% 11.8% 3.2% 32.3% 11.6% 10.5% 8.3% 13.4%
Balance to Cash 0 1 0 0 0 0 (1) 1 0 0 0 (1) 0 0 -100.0%
TOTAL $4,280 $3,829 $4,007 $4,383 $5,220 $4,719 $4,828 $5,987 $5,631 $6,933 $5,616 $5,128 $60,561 $60,561 14.8%
(% change from prior year) 16.8% 24.9% 16.6% 17.9% 18.8% 11.8% 3.2% 32.2% 11.6% 10.5% 8.3% 13.4%
REVISED ESTIMATE $4,280 $3,829 $4,007 $4,383 $5,220 $4,719 $4,828 $5,987 $5,631 $6,933 $5,616 $5,128 60,561
Year End
Adjustment 1,050 NA
TOTAL $61,611 16.8%
CONVENTION CENTER EXCISE TAX CATEGORY ANALYSIS
FY 2018-19 ACTUALS
(8+4)
(000'S)
Budget & Research 15-Mar-19
:plt1908 03:40 PM
SPORTS FACILITIES EXCISE TAX BY MONTH(In Thousands)
(8+4)
2017-18 2018-19 2018-19 % Change 2018-19 % Change 2019-20 % ChangeActual Budget Actual from PY Estimate from PY Estimate from PY
July $1,187 $1,169 $1,257 5.9% $1,257 5.9% $1,369 8.9%
August 994 993 1,144 15.1% 1,144 15.1% 1,141 -0.2%
September 1,081 1,059 1,154 6.7% 1,154 6.7% 1,244 7.9%
October 1,177 1,218 1,340 13.9% 1,340 13.9% 1,364 1.8%
November 1,678 1,652 1,877 11.9% 1,877 11.9% 1,944 3.6%
December 1,591 1,521 1,647 3.6% 1,647 3.6% 1,840 11.7%
January 1,472 1,465 1,330 -9.6% 1,330 -9.6% 1,718 29.2%
February 1,733 1,500 2,234 28.9% 2,234 28.9% 2,016 -9.7%
March 2,187 1,891 0 NA 2,441 11.6% 2,543 4.2%
April 3,087 2,522 0 NA 3,439 11.4% 3,582 4.2%
May 2,074 1,924 0 NA 2,307 11.2% 2,400 4.0%
June 1,591 1,301 0 NA 1,770 11.3% 1,842 4.0%
Subtotal: $19,851 $18,216 $11,984 NA $21,941 10.5% $23,005 4.9%
Year EndAdjustment 128 71 0 NA 200 56.3% 58 -71.0%
TOTAL: $19,979 $18,287 $11,984 NA $22,141 10.8% $23,063 4.2%
Actual vs. Estimate
YTD Actual Revenue: $11,984YTD Revised Estimate: 12,059
Dollars Over/Under Rev Est: ($75)Percent Over/Under Rev Est: -0.6%
Actual vs. Prior Year
YTD Actual Revenue: $11,984YTD Prior Year Actual: 10,912
Dollars Over/Under PY: 1,072Percent Over/Under PY: 9.8%
Budget & Research 15-Mar-19
:plt1908
% Change
Jul Aug Sep Oct Nov Dec Jan Feb Mar Apr May Jun TOTAL from PY
Category (Act) (Act) (Act) (Act) (Act) (Act) (Act) (Act) (Est) (Est) (Est) (Est) (Act/Est) Total ACTUAL
Hotel/Motel $579 $499 $481 $639 $915 $804 $590 $1,359 $1,256 $1,721 $1,086 $856 $10,783 $10,783 16.0%17.2% 31.5% 9.9% 15.0% 16.2% 12.6% -25.6% 54.5% 15.6% 15.6% 15.6% 15.6%
Car Rental 678 645 674 701 962 844 740 875 1,186 1,718 1,221 914 11,158 11,158 5.7%-2.2% 4.9% 4.7% 12.9% 8.1% -3.8% 9.1% 2.6% 7.6% 7.6% 7.6% 7.6%
Other 0 0 0 0 0 0 0 0 0 0 0 0 0 0 NA
Subtotal $1,257 $1,144 $1,155 $1,340 $1,877 $1,647 $1,330 $2,234 $2,441 $3,439 $2,307 $1,769 $21,941 $21,941 10.5%5.9% 15.1% 6.8% 13.9% 11.9% 3.6% -9.6% 28.9% 11.6% 11.4% 11.2% 11.3%
Balance to Cash 0 0 (1) 0 0 0 0 0 0 0 0 1 0 0 -99.9%
TOTAL $1,257 $1,144 $1,154 $1,340 $1,877 $1,647 $1,330 $2,234 $2,441 $3,439 $2,307 $1,770 $21,941 $21,941 10.5%
(% change from prior year) 5.9% 15.1% 6.7% 13.9% 11.9% 3.6% -9.6% 28.9% 11.6% 11.4% 11.2% 11.3%
REVISED ESTIMATE $1,257 $1,144 $1,154 $1,340 $1,877 $1,647 $1,330 $2,234 $2,441 $3,439 $2,307 $1,770 $21,941
Year EndAdjustment 200 56.3%
TOTAL: $22,141 10.8%
SPORTS FACILITIES EXCISE TAX CATEGORY ANALYSIS
FY 2018-19 ACTUALS
(8+4)
(000'S)
Budget & Research 04-Jan-19
:plt1908 03:51 PM
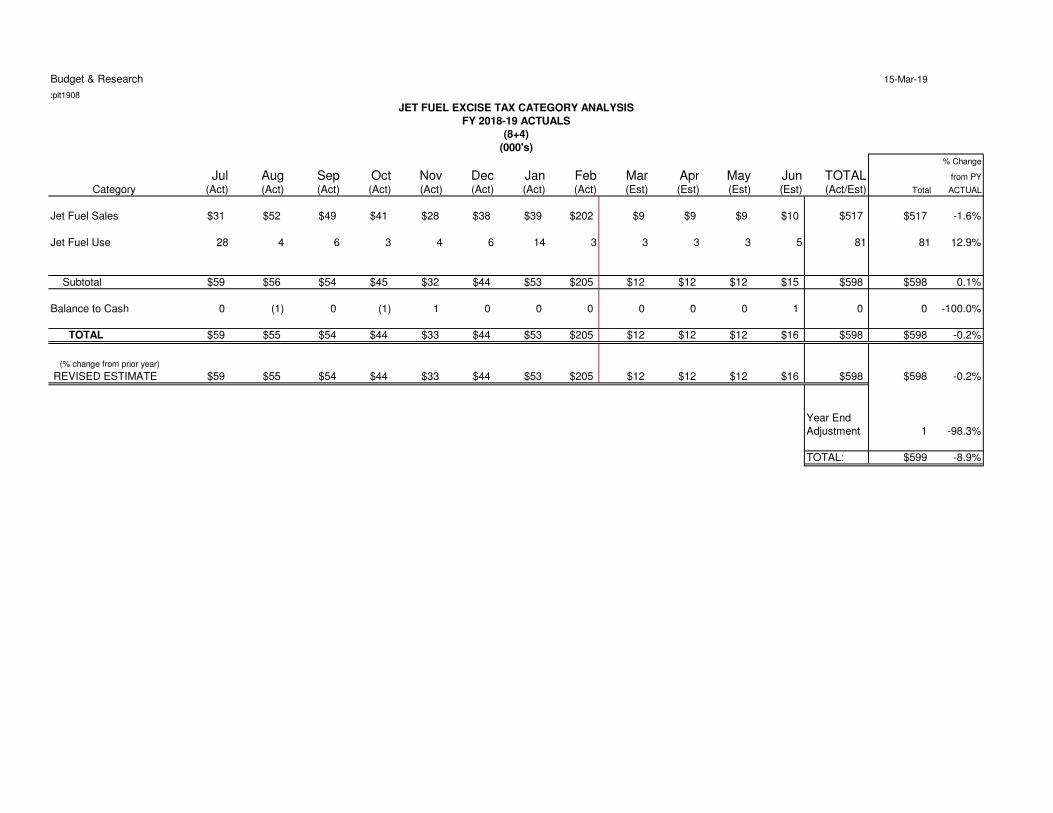
JET FUEL EXCISE TAX BY MONTH(In Thousands)
(8+4)
2017-18 2018-19 2018-19 % Change 2018-19 % Change 2019-20 % ChangeActual Budget Actual from PY Estimate from PY Estimate from PY
July $0 $58 $59 NA $59 NA $59 0.6%
August 0 89 55 NA 55 NA 57 2.8%
September 0 89 54 NA 54 NA 55 1.2%
October 0 89 44 NA 44 NA 45 3.2%
November 0 89 33 NA 33 NA 48 45.9%
December 63 89 44 -30.9% 44 -30.9% 48 9.7%
January 68 89 53 -22.9% 53 -22.9% 48 -8.6%
February 185 117 205 10.3% 205 10.3% 48 -76.5%
March 58 89 0 NA 12 -79.2% 48 300.0%
April 96 89 0 NA 12 -87.4% 48 300.0%
May 64 89 0 NA 12 -81.2% 48 300.0%
June 66 89 0 NA 16 -75.6% 52 224.4%
Subtotal: $600 $1,066 $546 NA $598 -0.3% $604 1.0%
Year EndAdjustment 58 0 0 NA 1 -98.3% 0 NA
TOTAL: $658 $1,066 $546 NA $599 -8.9% $604 0.9%
Actual vs. Estimate
YTD Actual Revenue: $546YTD Revised Estimate: 404
Dollars Over/Under Rev Est: $142Percent Over/Under Rev Est: 35.1%
Actual vs. Prior Year
YTD Actual Revenue: $546YTD Prior Year Actual: 317
Dollars Over/Under PY: $229Percent Over/Under PY: 72.2%
Budget & Research 15-Mar-19
:plt1908
(8+4)
(000's)
% Change
Jul Aug Sep Oct Nov Dec Jan Feb Mar Apr May Jun TOTAL from PY
Category (Act) (Act) (Act) (Act) (Act) (Act) (Act) (Act) (Est) (Est) (Est) (Est) (Act/Est) Total ACTUAL
Jet Fuel Sales $31 $52 $49 $41 $28 $38 $39 $202 $9 $9 $9 $10 $517 $517 -1.6%
Jet Fuel Use 28 4 6 3 4 6 14 3 3 3 3 5 81 81 12.9%
Subtotal $59 $56 $54 $45 $32 $44 $53 $205 $12 $12 $12 $15 $598 $598 0.1%
Balance to Cash 0 (1) 0 (1) 1 0 0 0 0 0 0 1 0 0 -100.0%
TOTAL $59 $55 $54 $44 $33 $44 $53 $205 $12 $12 $12 $16 $598 $598 -0.2%
(% change from prior year)
REVISED ESTIMATE $59 $55 $54 $44 $33 $44 $53 $205 $12 $12 $12 $16 $598 $598 -0.2%
Year End
Adjustment 1 -98.3%
TOTAL: $599 -8.9%
JET FUEL EXCISE TAX CATEGORY ANALYSIS
FY 2018-19 ACTUALS
Budget & Research 15-Mar-19
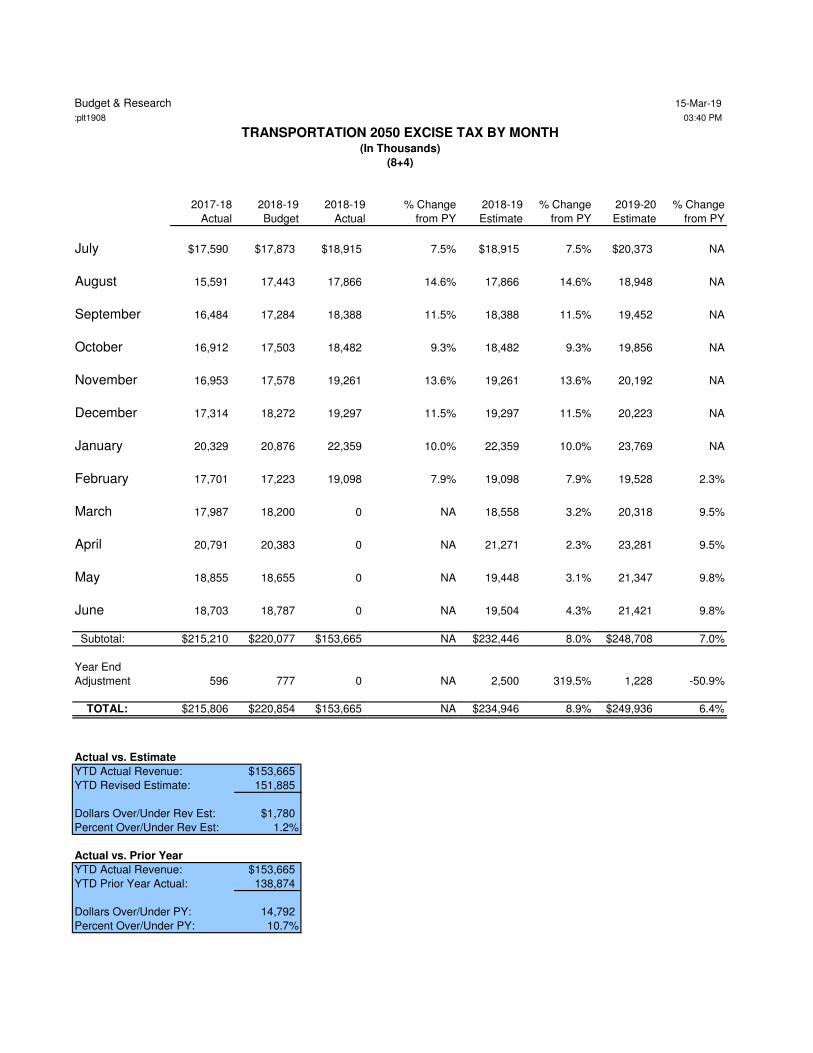
:plt1908 03:40 PM
TRANSPORTATION 2050 EXCISE TAX BY MONTH(In Thousands)
(8+4)
2017-18 2018-19 2018-19 % Change 2018-19 % Change 2019-20 % Change
Actual Budget Actual from PY Estimate from PY Estimate from PY
July $17,590 $17,873 $18,915 7.5% $18,915 7.5% $20,373 NA
August 15,591 17,443 17,866 14.6% 17,866 14.6% 18,948 NA
September 16,484 17,284 18,388 11.5% 18,388 11.5% 19,452 NA
October 16,912 17,503 18,482 9.3% 18,482 9.3% 19,856 NA
November 16,953 17,578 19,261 13.6% 19,261 13.6% 20,192 NA
December 17,314 18,272 19,297 11.5% 19,297 11.5% 20,223 NA
January 20,329 20,876 22,359 10.0% 22,359 10.0% 23,769 NA
February 17,701 17,223 19,098 7.9% 19,098 7.9% 19,528 2.3%
March 17,987 18,200 0 NA 18,558 3.2% 20,318 9.5%
April 20,791 20,383 0 NA 21,271 2.3% 23,281 9.5%
May 18,855 18,655 0 NA 19,448 3.1% 21,347 9.8%
June 18,703 18,787 0 NA 19,504 4.3% 21,421 9.8%
Subtotal: $215,210 $220,077 $153,665 NA $232,446 8.0% $248,708 7.0%
Year End
Adjustment 596 777 0 NA 2,500 319.5% 1,228 -50.9%
TOTAL: $215,806 $220,854 $153,665 NA $234,946 8.9% $249,936 6.4%
Actual vs. Estimate
YTD Actual Revenue: $153,665
YTD Revised Estimate: 151,885
Dollars Over/Under Rev Est: $1,780
Percent Over/Under Rev Est: 1.2%
Actual vs. Prior Year
YTD Actual Revenue: $153,665
YTD Prior Year Actual: 138,874
Dollars Over/Under PY: 14,792
Percent Over/Under PY: 10.7%
Budget & Research 15-Mar-19
:plt1908
% Change
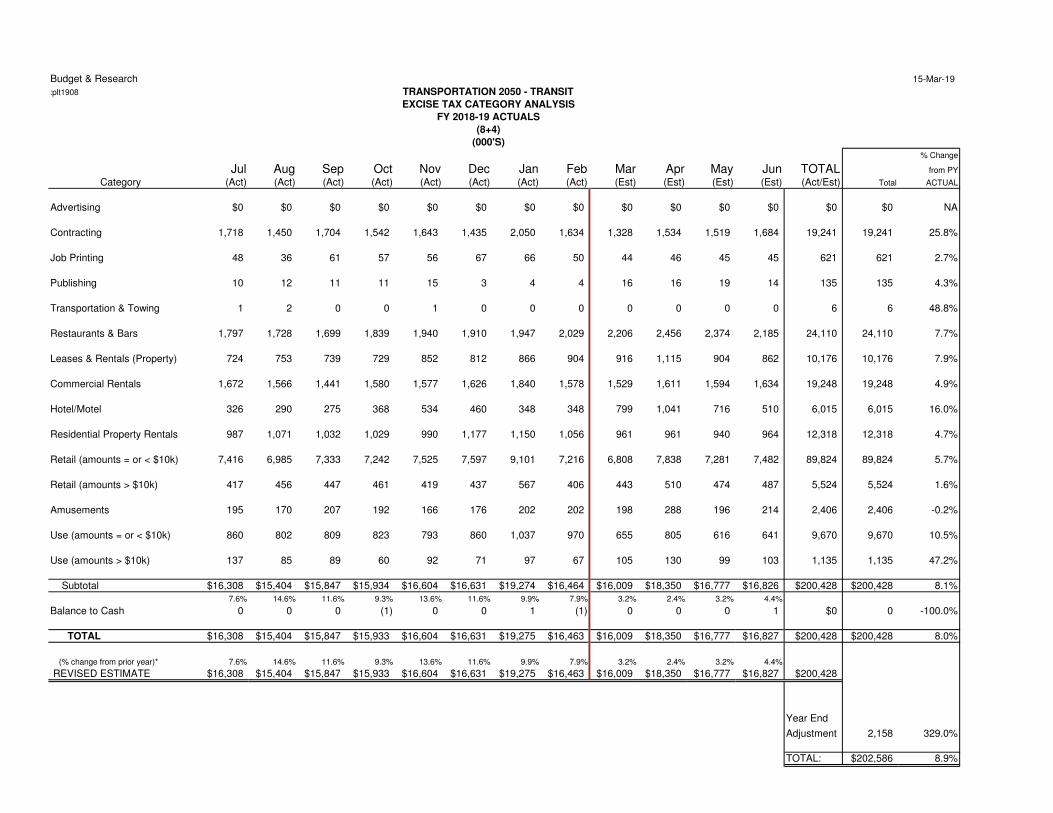
Jul Aug Sep Oct Nov Dec Jan Feb Mar Apr May Jun TOTAL from PY
Category (Act) (Act) (Act) (Act) (Act) (Act) (Act) (Act) (Est) (Est) (Est) (Est) (Act/Est) Total ACTUAL
Advertising $0 $0 $0 $0 $0 $0 $0 $0 $0 $0 $0 $0 $0 $0 NA
Contracting 1,718 1,450 1,704 1,542 1,643 1,435 2,050 1,634 1,328 1,534 1,519 1,684 19,241 19,241 25.8%
Job Printing 48 36 61 57 56 67 66 50 44 46 45 45 621 621 2.7%
Publishing 10 12 11 11 15 3 4 4 16 16 19 14 135 135 4.3%
Transportation & Towing 1 2 0 0 1 0 0 0 0 0 0 0 6 6 48.8%
Restaurants & Bars 1,797 1,728 1,699 1,839 1,940 1,910 1,947 2,029 2,206 2,456 2,374 2,185 24,110 24,110 7.7%
Leases & Rentals (Property) 724 753 739 729 852 812 866 904 916 1,115 904 862 10,176 10,176 7.9%
Commercial Rentals 1,672 1,566 1,441 1,580 1,577 1,626 1,840 1,578 1,529 1,611 1,594 1,634 19,248 19,248 4.9%
Hotel/Motel 326 290 275 368 534 460 348 348 799 1,041 716 510 6,015 6,015 16.0%
Residential Property Rentals 987 1,071 1,032 1,029 990 1,177 1,150 1,056 961 961 940 964 12,318 12,318 4.7%
Retail (amounts = or < $10k) 7,416 6,985 7,333 7,242 7,525 7,597 9,101 7,216 6,808 7,838 7,281 7,482 89,824 89,824 5.7%
Retail (amounts > $10k) 417 456 447 461 419 437 567 406 443 510 474 487 5,524 5,524 1.6%
Amusements 195 170 207 192 166 176 202 202 198 288 196 214 2,406 2,406 -0.2%
Use (amounts = or < $10k) 860 802 809 823 793 860 1,037 970 655 805 616 641 9,670 9,670 10.5%
Use (amounts > $10k) 137 85 89 60 92 71 97 67 105 130 99 103 1,135 1,135 47.2%
Subtotal $16,308 $15,404 $15,847 $15,934 $16,604 $16,631 $19,274 $16,464 $16,009 $18,350 $16,777 $16,826 $200,428 $200,428 8.1%
7.6% 14.6% 11.6% 9.3% 13.6% 11.6% 9.9% 7.9% 3.2% 2.4% 3.2% 4.4%
Balance to Cash 0 0 0 (1) 0 0 1 (1) 0 0 0 1 $0 0 -100.0%
TOTAL $16,308 $15,404 $15,847 $15,933 $16,604 $16,631 $19,275 $16,463 $16,009 $18,350 $16,777 $16,827 $200,428 $200,428 8.0%
(% change from prior year)* 7.6% 14.6% 11.6% 9.3% 13.6% 11.6% 9.9% 7.9% 3.2% 2.4% 3.2% 4.4%
REVISED ESTIMATE $16,308 $15,404 $15,847 $15,933 $16,604 $16,631 $19,275 $16,463 $16,009 $18,350 $16,777 $16,827 $200,428
Year End
Adjustment 2,158 329.0%
TOTAL: $202,586 8.9%
TRANSPORTATION 2050 - TRANSIT
EXCISE TAX CATEGORY ANALYSIS
FY 2018-19 ACTUALS
(8+4)
(000'S)
Budget & Research 15-Mar-19
:plt1908
% Change
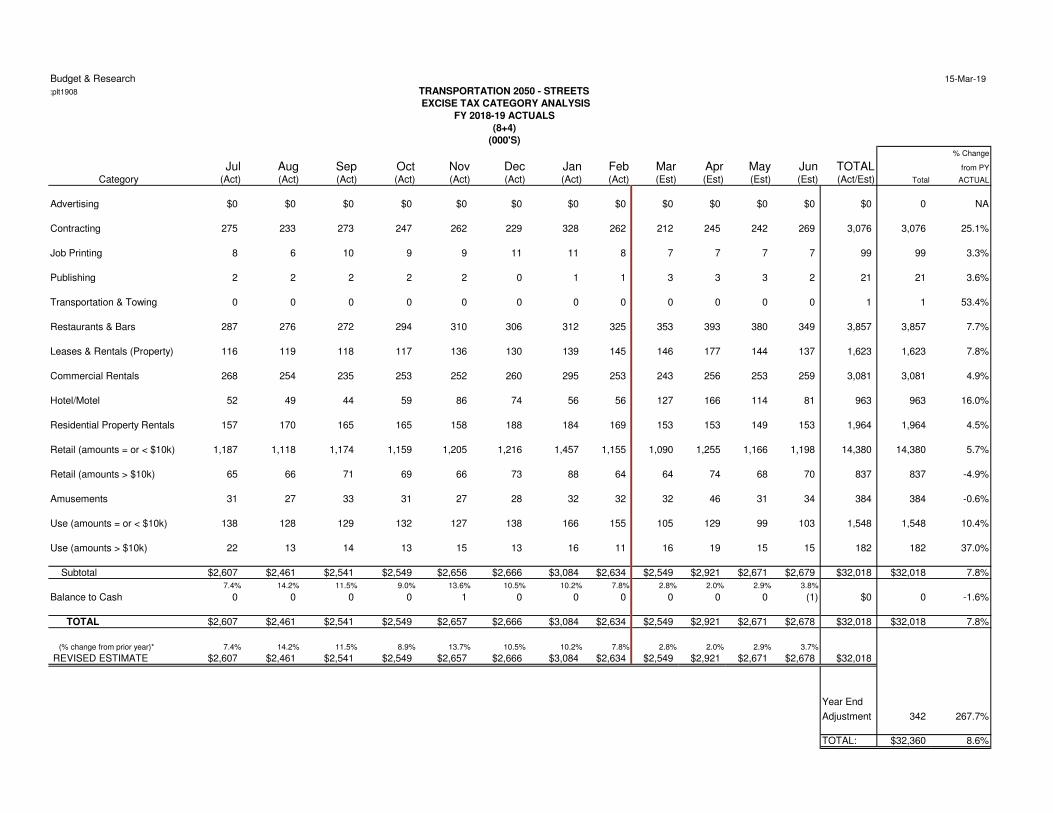
Jul Aug Sep Oct Nov Dec Jan Feb Mar Apr May Jun TOTAL from PY
Category (Act) (Act) (Act) (Act) (Act) (Act) (Act) (Act) (Est) (Est) (Est) (Est) (Act/Est) Total ACTUAL
Advertising $0 $0 $0 $0 $0 $0 $0 $0 $0 $0 $0 $0 $0 0 NA
Contracting 275 233 273 247 262 229 328 262 212 245 242 269 3,076 3,076 25.1%
Job Printing 8 6 10 9 9 11 11 8 7 7 7 7 99 99 3.3%
Publishing 2 2 2 2 2 0 1 1 3 3 3 2 21 21 3.6%
Transportation & Towing 0 0 0 0 0 0 0 0 0 0 0 0 1 1 53.4%
Restaurants & Bars 287 276 272 294 310 306 312 325 353 393 380 349 3,857 3,857 7.7%
Leases & Rentals (Property) 116 119 118 117 136 130 139 145 146 177 144 137 1,623 1,623 7.8%
Commercial Rentals 268 254 235 253 252 260 295 253 243 256 253 259 3,081 3,081 4.9%
Hotel/Motel 52 49 44 59 86 74 56 56 127 166 114 81 963 963 16.0%
Residential Property Rentals 157 170 165 165 158 188 184 169 153 153 149 153 1,964 1,964 4.5%
Retail (amounts = or < $10k) 1,187 1,118 1,174 1,159 1,205 1,216 1,457 1,155 1,090 1,255 1,166 1,198 14,380 14,380 5.7%
Retail (amounts > $10k) 65 66 71 69 66 73 88 64 64 74 68 70 837 837 -4.9%
Amusements 31 27 33 31 27 28 32 32 32 46 31 34 384 384 -0.6%
Use (amounts = or < $10k) 138 128 129 132 127 138 166 155 105 129 99 103 1,548 1,548 10.4%
Use (amounts > $10k) 22 13 14 13 15 13 16 11 16 19 15 15 182 182 37.0%
Subtotal $2,607 $2,461 $2,541 $2,549 $2,656 $2,666 $3,084 $2,634 $2,549 $2,921 $2,671 $2,679 $32,018 $32,018 7.8%
7.4% 14.2% 11.5% 9.0% 13.6% 10.5% 10.2% 7.8% 2.8% 2.0% 2.9% 3.8%
Balance to Cash 0 0 0 0 1 0 0 0 0 0 0 (1) $0 0 -1.6%
TOTAL $2,607 $2,461 $2,541 $2,549 $2,657 $2,666 $3,084 $2,634 $2,549 $2,921 $2,671 $2,678 $32,018 $32,018 7.8%
(% change from prior year)* 7.4% 14.2% 11.5% 8.9% 13.7% 10.5% 10.2% 7.8% 2.8% 2.0% 2.9% 3.7%
REVISED ESTIMATE $2,607 $2,461 $2,541 $2,549 $2,657 $2,666 $3,084 $2,634 $2,549 $2,921 $2,671 $2,678 $32,018
Year End
Adjustment 342 267.7%
TOTAL: $32,360 8.6%
TRANSPORTATION 2050 - STREETS
EXCISE TAX CATEGORY ANALYSIS
FY 2018-19 ACTUALS
(8+4)
(000'S)
Budget & Research 15-Mar-19
:plt1908 03:40 PM
PARKS & PRESERVES EXCISE TAX BY MONTH(In Thousands)
(8+4)
2017-18 2018-19 2018-19 % Change 2018-19 % Change 2019-20 % Change
Actual Budget Actual from PY Estimate from PY Estimate from PY
July $2,584 $2,621 $2,772 7.3% $2,772 7.3% $2,980 7.5%
August 2,294 2,565 2,620 14.2% 2,620 14.2% 2,778 6.0%
September1
2,419 2,543 2,691 11.2% 2,691 11.2% 2,850 5.9%
October 2,479 2,577 2,706 9.2% 2,706 9.2% 2,909 7.5%
November 2,483 2,586 2,816 13.4% 2,816 13.4% 2,953 4.9%
December 2,520 2,679 2,821 12.0% 2,821 12.0% 2,957 4.8%
January 2,998 3,081 3,277 9.3% 3,277 9.3% 3,491 6.5%
February 2,589 2,529 2,787 7.7% 2,787 7.7% 2,857 2.5%
March 2,638 2,672 0 NA 2,723 3.2% 2,975 9.2%
April 3,048 3,005 0 NA 3,122 2.4% 3,411 9.3%
May 2,760 2,754 0 NA 2,853 3.4% 3,128 9.6%
June 2,733 2,765 0 NA 2,860 4.6% 3,134 9.6%
Subtotal: $31,546 $32,378 $22,490 NA $34,048 7.9% $36,422 7.0%
Year End
Adjustment 48 139 0 NA 359 647.9% 197 -45.1%
TOTAL: $31,594 $32,517 $22,490 NA $34,407 8.9% $36,619 6.4%
Actual vs. Estimate
YTD Actual Revenue: $22,490
YTD Revised Estimate: 22,257
Dollars Over/Under Rev Est: $233
Percent Over/Under Rev Est: 1.0%
Actual vs. Prior Year
YTD Actual Revenue: $22,490
YTD Prior Year Actual: 20,367
Dollars Over/Under PY: 2,123
Percent Over/Under PY: 10.4%
Budget & Research
:plt1908
% Change
Jul Aug Sep Oct Nov Dec Jan Feb Mar Apr May Jun TOTAL from PY
Category (Act) (Act) (Act) (Act) (Act) (Act) (Act) (Act) (Est) (Est) (Est) (Est) (Act/Est) Total ACTUAL
Advertising $0 $0 $0 $0 $0 $0 $0 $0 $0 $0 $0 $0 $0 $0 NA
Contracting 285 240 283 256 273 239 340 271 221 255 252 280 3,194 $3,194 25.0%
Job Printing 8 6 10 9 9 11 11 8 7 8 7 8 103 $103 2.3%
Publishing 2 2 2 2 3 0 1 1 3 3 3 2 22 $22 4.6%
Transportation & Towing 0 0 0 0 0 0 0 0 0 0 0 (0) 1 $1 46.7%
Restaurants & Bars 298 286 282 305 322 316 323 336 366 407 394 362 3,997 $3,997 7.7%
Leases & Rentals (Property) 120 126 122 121 141 135 144 150 152 185 150 143 1,690 $1,690 7.9%
Commercial Rentals 277 258 236 262 262 270 305 261 254 268 265 272 3,190 $3,190 4.9%
Hotel/Motel 54 47 46 61 89 76 58 58 133 173 119 85 997 $997 16.0%
Residential Property Rentals 164 178 171 171 164 195 191 175 160 160 156 160 2,046 $2,046 4.8%
Retail 1,349 1,288 1,345 1,333 1,368 1,386 1,672 1,313 1,255 1,445 1,342 1,379 16,477 $16,477 5.2%
Food 0 3 0 0 0 0 (0) 0 0 0 0 (3) 0 $0 NA
Amusements 32 28 34 32 27 29 33 33 33 48 33 36 400 $400 0.0%
Use 182 157 160 155 158 164 200 180 139 171 131 136 1,932 $1,932 15.2%
Subtotal $2,772 $2,620 $2,691 $2,706 $2,816 $2,821 $3,277 $2,787 $2,723 $3,122 $2,853 $2,860 $34,048 $34,048 7.9%
7.3% 14.2% 11.2% 9.1% 13.4% 12.0% 9.3% 7.7% 3.2% 2.4% 3.4% 4.6%
Balance to Cash 0 0 0 0 0 0 0 0 0 0 0 0 0 0 -13.4%
TOTAL $2,772 $2,620 $2,691 $2,706 $2,816 $2,821 $3,277 $2,787 $2,723 $3,122 $2,853 $2,860 $34,048 $34,048 7.9%
(% change from prior year)* 7.3% 14.2% 11.2% 9.1% 13.4% 12.0% 9.3% 7.7% 3.2% 2.4% 3.4% 4.6%
REVISED ESTIMATE $2,772 $2,620 $2,691 $2,706 $2,816 $2,821 $3,277 $2,787 $2,723 $3,122 $2,853 $2,860 $34,048
Year End
Adjustment 359 647.9%
TOTAL: $34,407 8.9%
PARKS AND PRESERVES EXCISE TAX CATEGORY ANALYSIS
FY 2018-19 ACTUALS
(8+4)
(000'S)
Budget & Research 15-Mar-19
:plt1908 03:40 PM
NEIGHBORHOOD PROTECTION EXCISE TAX BY MONTH(In Thousands)
(8+4)
2017-18 2018-19 2018-19 % Change 2018-19 % Change 2019-20 % Change
Actual Budget Actual from PY Estimate from PY Estimate from PY
July $2,584 $2,621 $2,772 7.3% $2,772 7.3% $2,980 7.5%
August 2,293 2,565 2,620 14.2% 2,620 14.2% 2,778 6.0%
September 2,419 2,543 2,690 11.2% 2,690 11.2% 2,850 5.9%
October 2,478 2,577 2,707 9.2% 2,707 9.2% 2,909 7.5%
November 2,484 2,586 2,814 13.3% 2,814 13.3% 2,953 4.9%
December 2,520 2,679 2,822 12.0% 2,822 12.0% 2,957 4.8%
January 2,998 3,081 3,278 9.3% 3,278 9.3% 3,491 6.5%
February 2,589 2,529 2,786 7.6% 2,786 7.6% 2,857 2.5%
March 2,638 2,672 0 NA 2,723 3.2% 2,975 9.2%
April 3,047 3,005 0 NA 3,122 2.4% 3,411 9.3%
May 2,761 2,754 0 NA 2,853 3.3% 3,128 9.6%
June 2,734 2,764 0 NA 2,860 4.6% 3,133 9.5%
Subtotal: $31,546 $32,377 $22,489 NA $34,047 7.9% $36,422 7.0%
Year End
Adjustment 47 139 0 NA 359 663.8% 197 -45.1%
TOTAL: $31,593 $32,516 $22,489 NA $34,406 8.9% $36,619 6.4%
Actual vs. Estimate
YTD Actual Revenue: $22,489
YTD Revised Estimate: 22,257
Dollars Over/Under Rev Est: $232
Percent Over/Under Rev Est: 1.0%
Actual vs. Prior Year
YTD Actual Revenue: $22,489
YTD Prior Year Actual: 20,366
Dollars Over/Under PY: 2,123
Percent Over/Under PY: 10.4%
Budget & Research 00-Jan-00
:plt1908
% Change
Jul Aug Sep Oct Nov Dec Jan Feb Mar Apr May Jun TOTAL from PY
Category (Act) (Act) (Act) (Act) (Act) (Act) (Act) (Act) (Est) (Est) (Est) (Est) (Act/Est) Total ACTUAL
Advertising 0 0 0 0 0 0 0 0 0 0 0 0 $0 0 NA
Contracting 200 168 198 179 191 167 238 190 154 178 177 196 2,236 2,236 25.0%
Job Printing 6 4 7 7 6 8 8 6 5 5 5 5 72 72 2.3%
Publishing 1 1 1 1 2 0 0 0 2 2 2 2 16 16 4.6%
Transportation & Towing 0 0 0 0 0 0 0 0 0 0 0 (0) 1 1 46.7%
Restaurants & Bars 209 201 197 213 225 222 226 235 256 285 276 254 2,798 2,798 7.7%
Leases & Rentals (Property) 84 88 86 85 99 94 100 105 107 130 105 100 1,183 1,183 7.9%
Commercial Rentals 194 180 165 183 183 189 213 183 178 188 186 190 2,233 2,233 4.9%
Hotel/Motel 38 33 32 43 62 53 40 40 93 121 83 59 698 698 16.0%
Residential Property Rentals 115 125 120 120 115 137 133 123 112 112 109 112 1,432 1,432 4.8%
Retail 945 902 941 933 958 970 1,170 919 879 1,011 940 965 11,534 11,534 5.2%
Food 0 2 0 0 0 0 (0) 0 0 0 0 (2) 0 0 NA
Amusements 23 20 24 22 19 20 23 23 23 33 23 25 280 280 0.0%
Use 128 110 112 108 111 115 140 126 97 119 91 95 1,352 1,352 15.2%
Subtotal $1,940 $1,834 $1,883 $1,894 $1,971 $1,975 $2,294 $1,951 $1,906 $2,185 $1,997 $2,002 $23,833 23,833 7.9%
7.3% 14.2% 11.2% 9.1% 13.4% 12.0% 9.3% 7.7% 3.2% 2.4% 3.4% 4.6%
Balance to Cash 0 0 (1) 1 (1) 0 0 0 0 0 0 1 0 0 -99.8%
TOTAL $1,940 $1,834 $1,882 $1,895 $1,970 $1,975 $2,294 $1,951 $1,906 $2,185 $1,997 $2,003 $23,833 23,833 7.9%
(% change from prior year)* 7.3% 14.3% 11.2% 9.2% 13.3% 12.0% 9.3% 7.7% 3.2% 2.5% 3.3% 4.7%
REVISED ESTIMATE $1,940 $1,834 $1,882 $1,895 $1,970 $1,975 $2,294 $1,951 $1,906 $2,185 $1,997 $2,003 $23,833
Year End
Adjustment 251 638.2%
TOTAL: 24,084 8.9%
POLICE NEIGHBORHOOD PROTECTION EXCISE TAX CATEGORY ANALYSIS
FY 2018-19 ACTUALS
(8+4)
(000'S)
Budget & Research 00-Jan-00
:plt1908
% Change
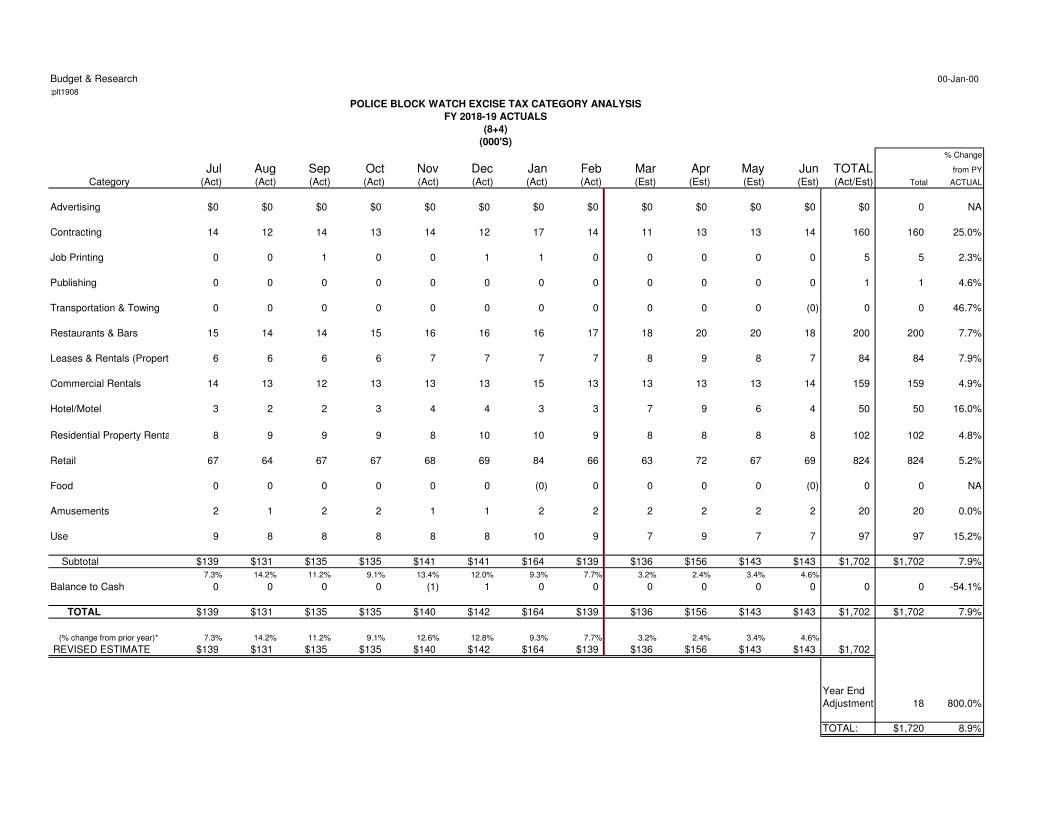
Jul Aug Sep Oct Nov Dec Jan Feb Mar Apr May Jun TOTAL from PY
Category (Act) (Act) (Act) (Act) (Act) (Act) (Act) (Act) (Est) (Est) (Est) (Est) (Act/Est) Total ACTUAL
Advertising $0 $0 $0 $0 $0 $0 $0 $0 $0 $0 $0 $0 $0 0 NA
Contracting 14 12 14 13 14 12 17 14 11 13 13 14 160 160 25.0%
Job Printing 0 0 1 0 0 1 1 0 0 0 0 0 5 5 2.3%
Publishing 0 0 0 0 0 0 0 0 0 0 0 0 1 1 4.6%
Transportation & Towing 0 0 0 0 0 0 0 0 0 0 0 (0) 0 0 46.7%
Restaurants & Bars 15 14 14 15 16 16 16 17 18 20 20 18 200 200 7.7%
Leases & Rentals (Property) 6 6 6 6 7 7 7 7 8 9 8 7 84 84 7.9%
Commercial Rentals 14 13 12 13 13 13 15 13 13 13 13 14 159 159 4.9%
Hotel/Motel 3 2 2 3 4 4 3 3 7 9 6 4 50 50 16.0%
Residential Property Rentals 8 9 9 9 8 10 10 9 8 8 8 8 102 102 4.8%
Retail 67 64 67 67 68 69 84 66 63 72 67 69 824 824 5.2%
Food 0 0 0 0 0 0 (0) 0 0 0 0 (0) 0 0 NA
Amusements 2 1 2 2 1 1 2 2 2 2 2 2 20 20 0.0%
Use 9 8 8 8 8 8 10 9 7 9 7 7 97 97 15.2%
Subtotal $139 $131 $135 $135 $141 $141 $164 $139 $136 $156 $143 $143 $1,702 $1,702 7.9%
7.3% 14.2% 11.2% 9.1% 13.4% 12.0% 9.3% 7.7% 3.2% 2.4% 3.4% 4.6%
Balance to Cash 0 0 0 0 (1) 1 0 0 0 0 0 0 0 0 -54.1%
TOTAL $139 $131 $135 $135 $140 $142 $164 $139 $136 $156 $143 $143 $1,702 $1,702 7.9%
(% change from prior year)* 7.3% 14.2% 11.2% 9.1% 12.6% 12.8% 9.3% 7.7% 3.2% 2.4% 3.4% 4.6%
REVISED ESTIMATE $139 $131 $135 $135 $140 $142 $164 $139 $136 $156 $143 $143 $1,702
Year End
Adjustment 18 800.0%
TOTAL: $1,720 8.9%
POLICE BLOCK WATCH EXCISE TAX CATEGORY ANALYSIS
FY 2018-19 ACTUALS
(8+4)
(000'S)
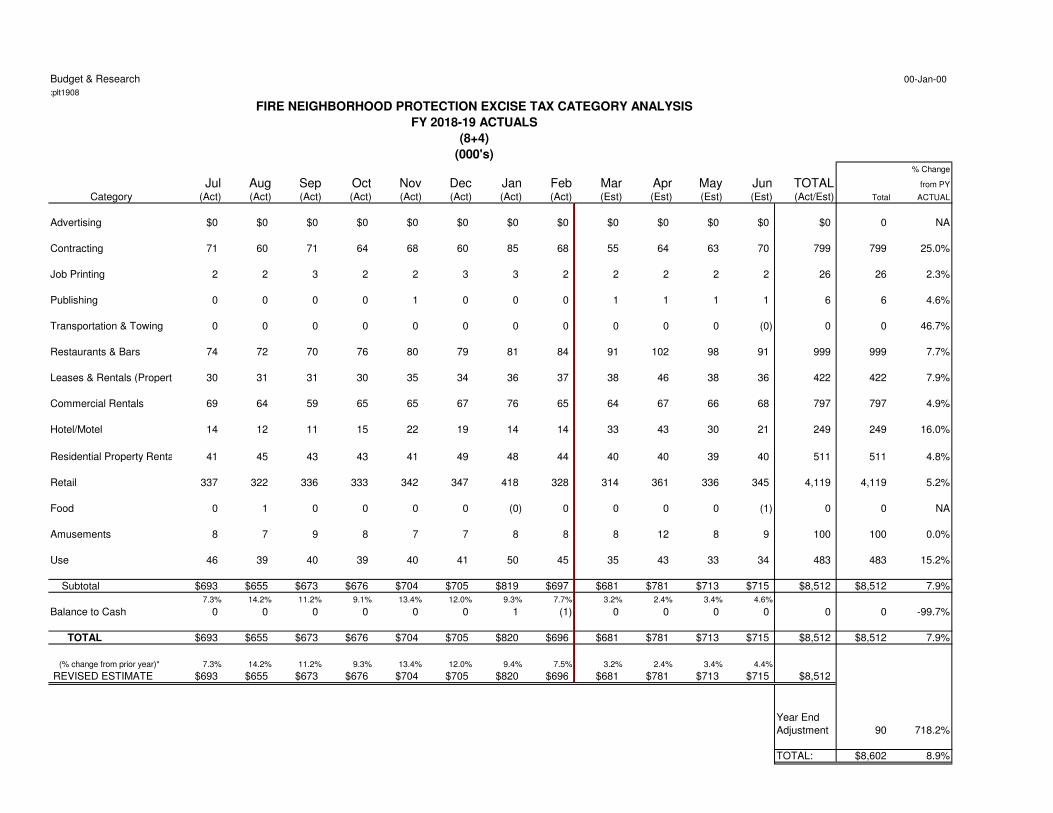
Budget & Research 00-Jan-00
:plt1908
% Change
Jul Aug Sep Oct Nov Dec Jan Feb Mar Apr May Jun TOTAL from PY
Category (Act) (Act) (Act) (Act) (Act) (Act) (Act) (Act) (Est) (Est) (Est) (Est) (Act/Est) Total ACTUAL
Advertising $0 $0 $0 $0 $0 $0 $0 $0 $0 $0 $0 $0 $0 0 NA
Contracting 71 60 71 64 68 60 85 68 55 64 63 70 799 799 25.0%
Job Printing 2 2 3 2 2 3 3 2 2 2 2 2 26 26 2.3%
Publishing 0 0 0 0 1 0 0 0 1 1 1 1 6 6 4.6%
Transportation & Towing 0 0 0 0 0 0 0 0 0 0 0 (0) 0 0 46.7%
Restaurants & Bars 74 72 70 76 80 79 81 84 91 102 98 91 999 999 7.7%
Leases & Rentals (Property) 30 31 31 30 35 34 36 37 38 46 38 36 422 422 7.9%
Commercial Rentals 69 64 59 65 65 67 76 65 64 67 66 68 797 797 4.9%
Hotel/Motel 14 12 11 15 22 19 14 14 33 43 30 21 249 249 16.0%
Residential Property Rentals 41 45 43 43 41 49 48 44 40 40 39 40 511 511 4.8%
Retail 337 322 336 333 342 347 418 328 314 361 336 345 4,119 4,119 5.2%
Food 0 1 0 0 0 0 (0) 0 0 0 0 (1) 0 0 NA
Amusements 8 7 9 8 7 7 8 8 8 12 8 9 100 100 0.0%
Use 46 39 40 39 40 41 50 45 35 43 33 34 483 483 15.2%
Subtotal $693 $655 $673 $676 $704 $705 $819 $697 $681 $781 $713 $715 $8,512 $8,512 7.9%
7.3% 14.2% 11.2% 9.1% 13.4% 12.0% 9.3% 7.7% 3.2% 2.4% 3.4% 4.6%
Balance to Cash 0 0 0 0 0 0 1 (1) 0 0 0 0 0 0 -99.7%
TOTAL $693 $655 $673 $676 $704 $705 $820 $696 $681 $781 $713 $715 $8,512 $8,512 7.9%
(% change from prior year)* 7.3% 14.2% 11.2% 9.3% 13.4% 12.0% 9.4% 7.5% 3.2% 2.4% 3.4% 4.4%
REVISED ESTIMATE $693 $655 $673 $676 $704 $705 $820 $696 $681 $781 $713 $715 $8,512
Year End
Adjustment 90 718.2%
TOTAL: $8,602 8.9%
FIRE NEIGHBORHOOD PROTECTION EXCISE TAX CATEGORY ANALYSIS
FY 2018-19 ACTUALS
(8+4)
(000's)

Budget & Research 15-Mar-19
:plt1908 03:40 PM
CAPITAL CONSTRUCTION EXCISE TAX BY MONTH(In Thousands)
(8+4)
2017-18 2018-19 2018-19 % Change 2018-19 % Change 2019-20 % Change
Actual Budget Actual from PY Estimate from PY Estimate from PY
July $963 $777 $766 -20.5% $766 -20.5% $787 2.7%
August 740 790 761 2.8% 761 2.8% 727 -4.5%
September 840 780 838 -0.2% 838 -0.2% 756 -9.8%
October 820 768 701 -14.5% 701 -14.5% 744 6.1%
November 844 772 705 -16.5% 705 -16.5% 752 6.7%
December 785 771 677 -13.8% 677 -13.8% 744 9.9%
January 811 735 683 -15.8% 683 -15.8% 741 8.5%
February 838 774 696 -16.9% 696 -16.9% 722 3.7%
March 747 721 0 NA 722 -3.3% 686 -5.0%
April 787 708 0 NA 722 -8.3% 685 -5.1%
May 783 710 0 NA 733 -6.4% 696 -5.0%
June 779 700 0 NA 720 -7.6% 684 -5.0%
.
Subtotal: $9,737 $9,006 $5,827 NA $8,724 -10.4% $8,724 0.0%
Year End
Adjustment (163) 28 0 NA 10 NA 19 90.0%
TOTAL: $9,574 $9,034 $5,827 NA $8,734 -8.8% $8,743 0.1%
Actual vs. Estimate
YTD Actual Revenue: $5,827
YTD Revised Estimate: 5,999
Dollars Over/Under Rev Est: ($172)
Percent Over/Under Rev Est: -2.9%
Actual vs. Prior Year
YTD Actual Revenue: $5,827
YTD Prior Year Actual: 6,641
Dollars Over/Under PY: (814)
Percent Over/Under PY: -12.3%
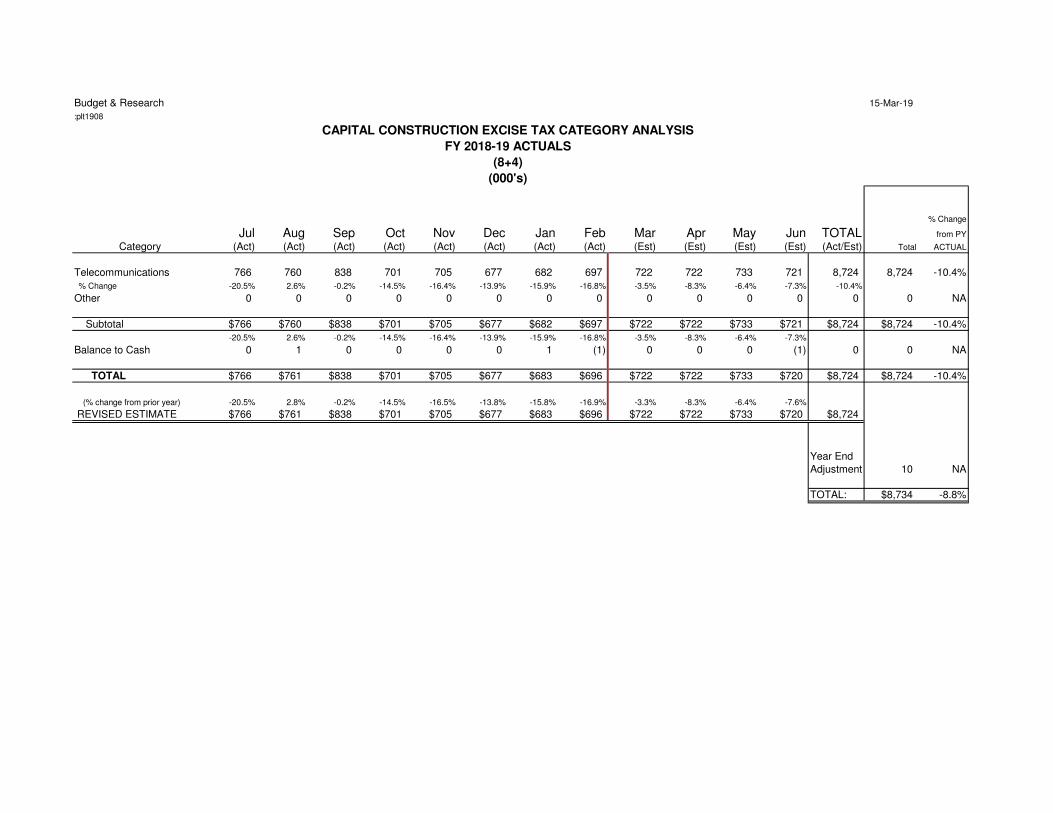
Budget & Research 15-Mar-19
:plt1908
% Change
Jul Aug Sep Oct Nov Dec Jan Feb Mar Apr May Jun TOTAL from PY
Category (Act) (Act) (Act) (Act) (Act) (Act) (Act) (Act) (Est) (Est) (Est) (Est) (Act/Est) Total ACTUAL
Telecommunications 766 760 838 701 705 677 682 697 722 722 733 721 8,724 8,724 -10.4%
% Change -20.5% 2.6% -0.2% -14.5% -16.4% -13.9% -15.9% -16.8% -3.5% -8.3% -6.4% -7.3% -10.4%
Other 0 0 0 0 0 0 0 0 0 0 0 0 0 0 NA
Subtotal $766 $760 $838 $701 $705 $677 $682 $697 $722 $722 $733 $721 $8,724 $8,724 -10.4%
-20.5% 2.6% -0.2% -14.5% -16.4% -13.9% -15.9% -16.8% -3.5% -8.3% -6.4% -7.3%
Balance to Cash 0 1 0 0 0 0 1 (1) 0 0 0 (1) 0 0 NA
TOTAL $766 $761 $838 $701 $705 $677 $683 $696 $722 $722 $733 $720 $8,724 $8,724 -10.4%
(% change from prior year) -20.5% 2.8% -0.2% -14.5% -16.5% -13.8% -15.8% -16.9% -3.3% -8.3% -6.4% -7.6%
REVISED ESTIMATE $766 $761 $838 $701 $705 $677 $683 $696 $722 $722 $733 $720 $8,724
Year End
Adjustment 10 NA
TOTAL: $8,734 -8.8%
CAPITAL CONSTRUCTION EXCISE TAX CATEGORY ANALYSIS
FY 2018-19 ACTUALS
(8+4)
(000's)
Budget & Research 15-Mar-19
:plt1908 03:40 PM
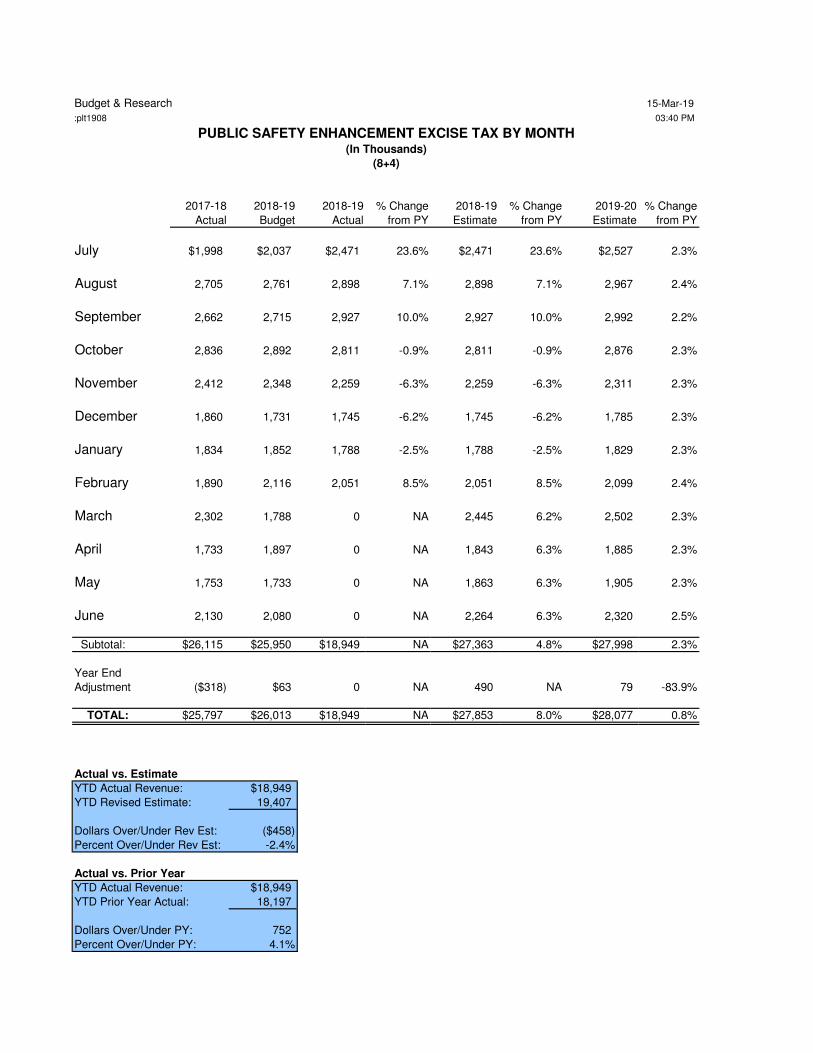
PUBLIC SAFETY ENHANCEMENT EXCISE TAX BY MONTH(In Thousands)
(8+4)
2017-18 2018-19 2018-19 % Change 2018-19 % Change 2019-20 % Change
Actual Budget Actual from PY Estimate from PY Estimate from PY
July $1,998 $2,037 $2,471 23.6% $2,471 23.6% $2,527 2.3%
August 2,705 2,761 2,898 7.1% 2,898 7.1% 2,967 2.4%
September 2,662 2,715 2,927 10.0% 2,927 10.0% 2,992 2.2%
October 2,836 2,892 2,811 -0.9% 2,811 -0.9% 2,876 2.3%
November 2,412 2,348 2,259 -6.3% 2,259 -6.3% 2,311 2.3%
December 1,860 1,731 1,745 -6.2% 1,745 -6.2% 1,785 2.3%
January 1,834 1,852 1,788 -2.5% 1,788 -2.5% 1,829 2.3%
February 1,890 2,116 2,051 8.5% 2,051 8.5% 2,099 2.4%
March 2,302 1,788 0 NA 2,445 6.2% 2,502 2.3%
April 1,733 1,897 0 NA 1,843 6.3% 1,885 2.3%
May 1,753 1,733 0 NA 1,863 6.3% 1,905 2.3%
June 2,130 2,080 0 NA 2,264 6.3% 2,320 2.5%
Subtotal: $26,115 $25,950 $18,949 NA $27,363 4.8% $27,998 2.3%
Year End
Adjustment ($318) $63 0 NA 490 NA 79 -83.9%
TOTAL: $25,797 $26,013 $18,949 NA $27,853 8.0% $28,077 0.8%
Actual vs. Estimate
YTD Actual Revenue: $18,949
YTD Revised Estimate: 19,407
Dollars Over/Under Rev Est: ($458)
Percent Over/Under Rev Est: -2.4%
Actual vs. Prior Year
YTD Actual Revenue: $18,949
YTD Prior Year Actual: 18,197
Dollars Over/Under PY: 752
Percent Over/Under PY: 4.1%
Budget & Research 15-Mar-19
:plt1908
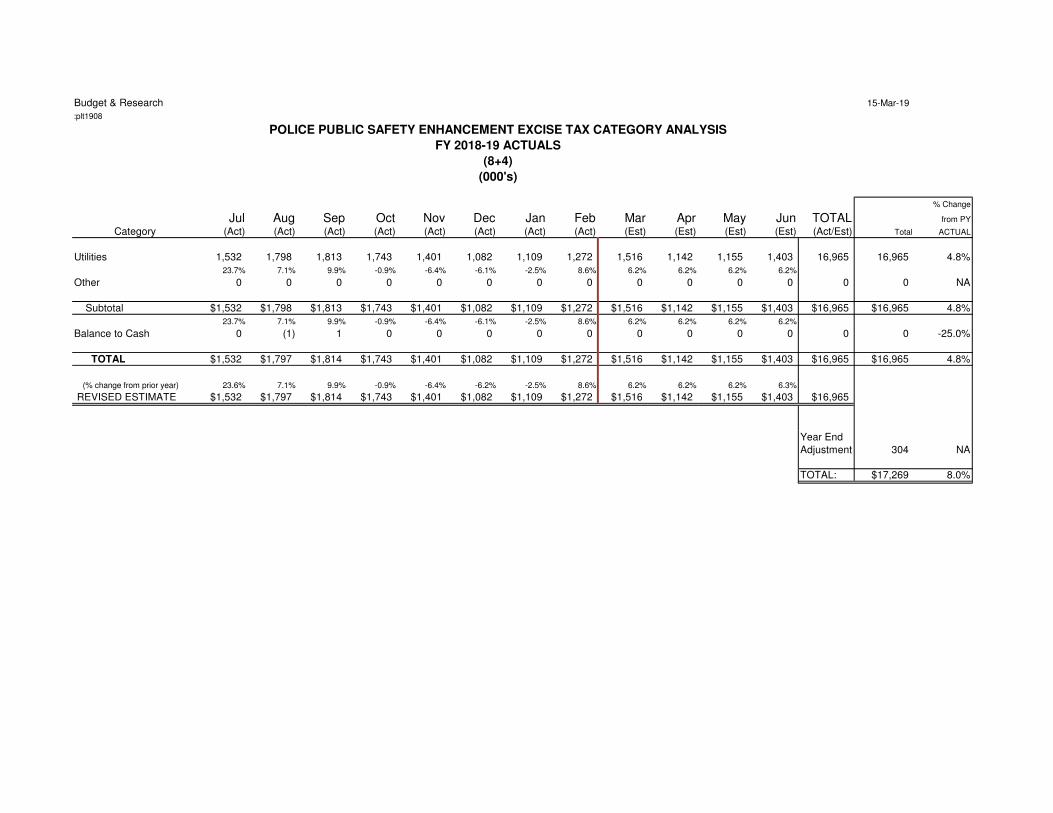
% Change
Jul Aug Sep Oct Nov Dec Jan Feb Mar Apr May Jun TOTAL from PY
Category (Act) (Act) (Act) (Act) (Act) (Act) (Act) (Act) (Est) (Est) (Est) (Est) (Act/Est) Total ACTUAL
Utilities 1,532 1,798 1,813 1,743 1,401 1,082 1,109 1,272 1,516 1,142 1,155 1,403 16,965 16,965 4.8%
23.7% 7.1% 9.9% -0.9% -6.4% -6.1% -2.5% 8.6% 6.2% 6.2% 6.2% 6.2%
Other 0 0 0 0 0 0 0 0 0 0 0 0 0 0 NA
Subtotal $1,532 $1,798 $1,813 $1,743 $1,401 $1,082 $1,109 $1,272 $1,516 $1,142 $1,155 $1,403 $16,965 $16,965 4.8%
23.7% 7.1% 9.9% -0.9% -6.4% -6.1% -2.5% 8.6% 6.2% 6.2% 6.2% 6.2%
Balance to Cash 0 (1) 1 0 0 0 0 0 0 0 0 0 0 0 -25.0%
TOTAL $1,532 $1,797 $1,814 $1,743 $1,401 $1,082 $1,109 $1,272 $1,516 $1,142 $1,155 $1,403 $16,965 $16,965 4.8%
(% change from prior year) 23.6% 7.1% 9.9% -0.9% -6.4% -6.2% -2.5% 8.6% 6.2% 6.2% 6.2% 6.3%
REVISED ESTIMATE $1,532 $1,797 $1,814 $1,743 $1,401 $1,082 $1,109 $1,272 $1,516 $1,142 $1,155 $1,403 $16,965
Year End
Adjustment 304 NA
TOTAL: $17,269 8.0%
POLICE PUBLIC SAFETY ENHANCEMENT EXCISE TAX CATEGORY ANALYSIS
FY 2018-19 ACTUALS
(8+4)
(000's)
Budget & Research 15-Mar-19
:plt1908
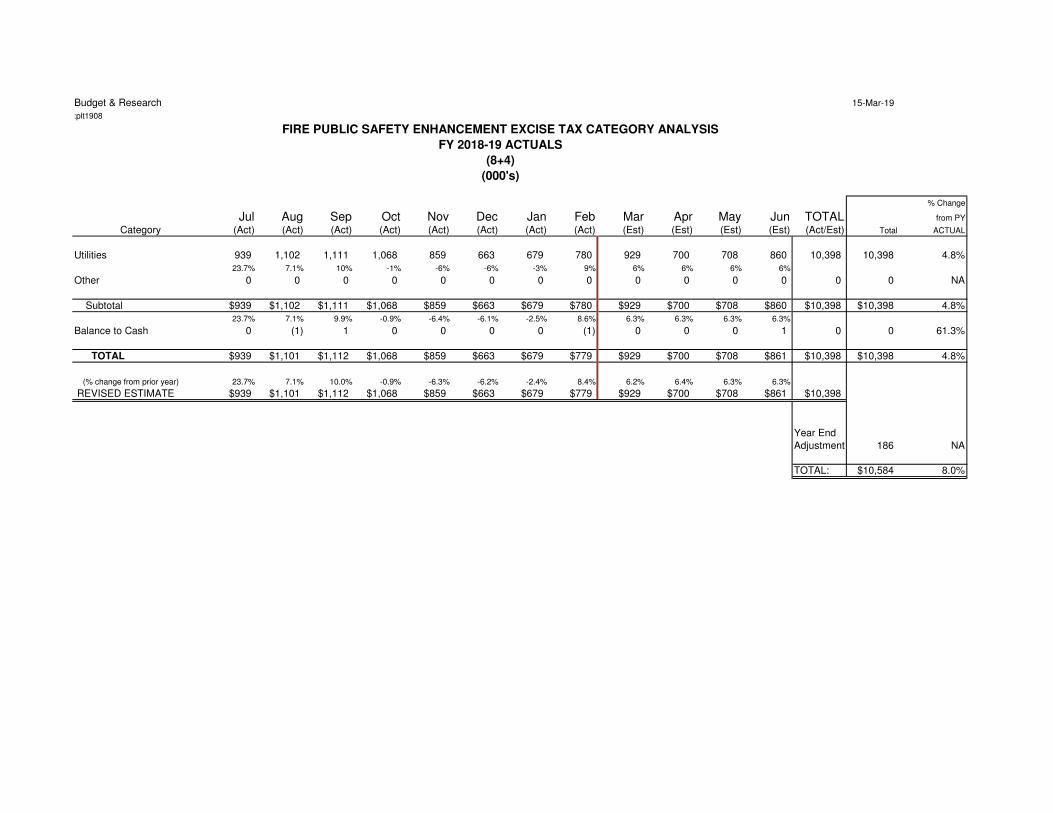
% Change
Jul Aug Sep Oct Nov Dec Jan Feb Mar Apr May Jun TOTAL from PY
Category (Act) (Act) (Act) (Act) (Act) (Act) (Act) (Act) (Est) (Est) (Est) (Est) (Act/Est) Total ACTUAL
Utilities 939 1,102 1,111 1,068 859 663 679 780 929 700 708 860 10,398 10,398 4.8%
23.7% 7.1% 10% -1% -6% -6% -3% 9% 6% 6% 6% 6%
Other 0 0 0 0 0 0 0 0 0 0 0 0 0 0 NA
Subtotal $939 $1,102 $1,111 $1,068 $859 $663 $679 $780 $929 $700 $708 $860 $10,398 $10,398 4.8%
23.7% 7.1% 9.9% -0.9% -6.4% -6.1% -2.5% 8.6% 6.3% 6.3% 6.3% 6.3%
Balance to Cash 0 (1) 1 0 0 0 0 (1) 0 0 0 1 0 0 61.3%
TOTAL $939 $1,101 $1,112 $1,068 $859 $663 $679 $779 $929 $700 $708 $861 $10,398 $10,398 4.8%
(% change from prior year) 23.7% 7.1% 10.0% -0.9% -6.3% -6.2% -2.4% 8.4% 6.2% 6.4% 6.3% 6.3%
REVISED ESTIMATE $939 $1,101 $1,112 $1,068 $859 $663 $679 $779 $929 $700 $708 $861 $10,398
Year End
Adjustment 186 NA
TOTAL: $10,584 8.0%
FIRE PUBLIC SAFETY ENHANCEMENT EXCISE TAX CATEGORY ANALYSIS
FY 2018-19 ACTUALS
(8+4)
(000's)

Budget & Research 15-Mar-19
:plt1908 03:40 PM
2007 PUBLIC SAFETY EXPANSION EXCISE TAX BY MONTH(In Thousands)
(8+4)
2017-18 2018-19 2018-19 % Change 2018-19 % Change 2019-20 % Change
Actual Budget Actual from PY Estimate from PY Estimate from PY
July $5,169 $5,243 $5,544 7.3% $5,544 7.3% $5,961 7.5%
August 4,589 5,130 5,246 14.3% 5,246 14.3% 5,557 5.9%
September1
4,838 5,087 5,381 11.2% 5,381 11.2% 5,700 5.9%
October 4,958 5,154 5,411 9.1% 5,411 9.1% 5,819 7.5%
November 4,966 5,171 5,633 13.4% 5,633 13.4% 5,906 4.8%
December 5,040 5,358 5,642 11.9% 5,642 11.9% 5,914 4.8%
January 5,997 6,162 6,554 9.3% 6,554 9.3% 6,982 6.5%
February 5,178 5,059 5,575 7.7% 5,575 7.7% 5,713 2.5%
March 5,275 5,344 0 NA 5,445 3.2% 5,949 9.2%
April 6,098 6,009 0 NA 6,244 2.4% 6,823 9.3%
May 5,519 5,508 0 NA 5,706 3.4% 6,255 9.6%
June 5,467 5,529 0 NA 5,721 4.7% 6,266 9.5%
Subtotal: $63,092 $64,755 $44,985 NA $68,101 7.9% $72,844 7.0%
Year End
Adjustment 96 276 0 NA 718 647.9% 393 -45.3%
TOTAL: $63,188 $65,031 $44,985 NA $68,819 8.9% $73,237 6.4%
Actual vs. Estimate
YTD Actual Revenue: $44,985
YTD Revised Estimate: 44,520
Dollars Over/Under Rev Est: $465
Percent Over/Under Rev Est: 1.0%
Actual vs. Prior Year
YTD Actual Revenue: $44,985
YTD Prior Year Actual: 40,734
Dollars Over/Under PY: 4,251
Percent Over/Under PY: 10.4%
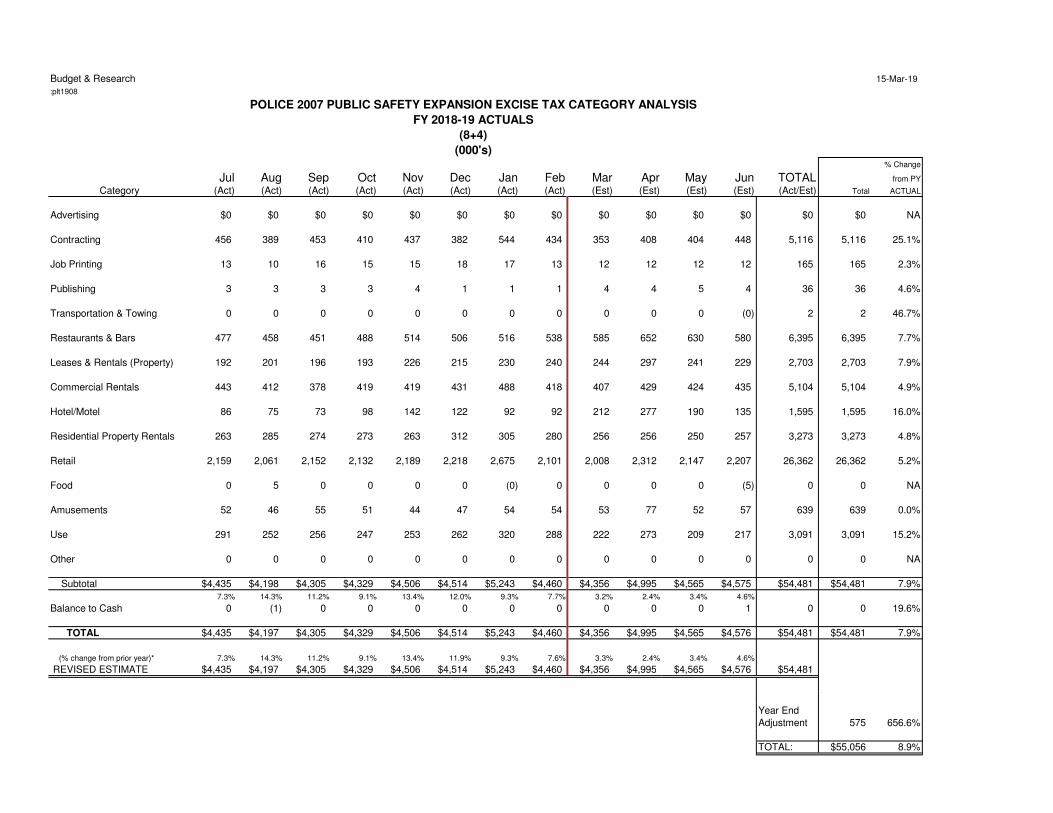
Budget & Research 15-Mar-19
:plt1908
% Change
Jul Aug Sep Oct Nov Dec Jan Feb Mar Apr May Jun TOTAL from PY
Category (Act) (Act) (Act) (Act) (Act) (Act) (Act) (Act) (Est) (Est) (Est) (Est) (Act/Est) Total ACTUAL
Advertising $0 $0 $0 $0 $0 $0 $0 $0 $0 $0 $0 $0 $0 $0 NA
Contracting 456 389 453 410 437 382 544 434 353 408 404 448 5,116 5,116 25.1%
Job Printing 13 10 16 15 15 18 17 13 12 12 12 12 165 165 2.3%
Publishing 3 3 3 3 4 1 1 1 4 4 5 4 36 36 4.6%
Transportation & Towing 0 0 0 0 0 0 0 0 0 0 0 (0) 2 2 46.7%
Restaurants & Bars 477 458 451 488 514 506 516 538 585 652 630 580 6,395 6,395 7.7%
Leases & Rentals (Property) 192 201 196 193 226 215 230 240 244 297 241 229 2,703 2,703 7.9%
Commercial Rentals 443 412 378 419 419 431 488 418 407 429 424 435 5,104 5,104 4.9%
Hotel/Motel 86 75 73 98 142 122 92 92 212 277 190 135 1,595 1,595 16.0%
Residential Property Rentals 263 285 274 273 263 312 305 280 256 256 250 257 3,273 3,273 4.8%
Retail 2,159 2,061 2,152 2,132 2,189 2,218 2,675 2,101 2,008 2,312 2,147 2,207 26,362 26,362 5.2%
Food 0 5 0 0 0 0 (0) 0 0 0 0 (5) 0 0 NA
Amusements 52 46 55 51 44 47 54 54 53 77 52 57 639 639 0.0%
Use 291 252 256 247 253 262 320 288 222 273 209 217 3,091 3,091 15.2%
Other 0 0 0 0 0 0 0 0 0 0 0 0 0 0 NA
Subtotal $4,435 $4,198 $4,305 $4,329 $4,506 $4,514 $5,243 $4,460 $4,356 $4,995 $4,565 $4,575 $54,481 $54,481 7.9%
7.3% 14.3% 11.2% 9.1% 13.4% 12.0% 9.3% 7.7% 3.2% 2.4% 3.4% 4.6%
Balance to Cash 0 (1) 0 0 0 0 0 0 0 0 0 1 0 0 19.6%
TOTAL $4,435 $4,197 $4,305 $4,329 $4,506 $4,514 $5,243 $4,460 $4,356 $4,995 $4,565 $4,576 $54,481 $54,481 7.9%
(% change from prior year)* 7.3% 14.3% 11.2% 9.1% 13.4% 11.9% 9.3% 7.6% 3.3% 2.4% 3.4% 4.6%
REVISED ESTIMATE $4,435 $4,197 $4,305 $4,329 $4,506 $4,514 $5,243 $4,460 $4,356 $4,995 $4,565 $4,576 $54,481
Year End
Adjustment 575 656.6%
TOTAL: $55,056 8.9%
POLICE 2007 PUBLIC SAFETY EXPANSION EXCISE TAX CATEGORY ANALYSIS
FY 2018-19 ACTUALS
(8+4)
(000's)
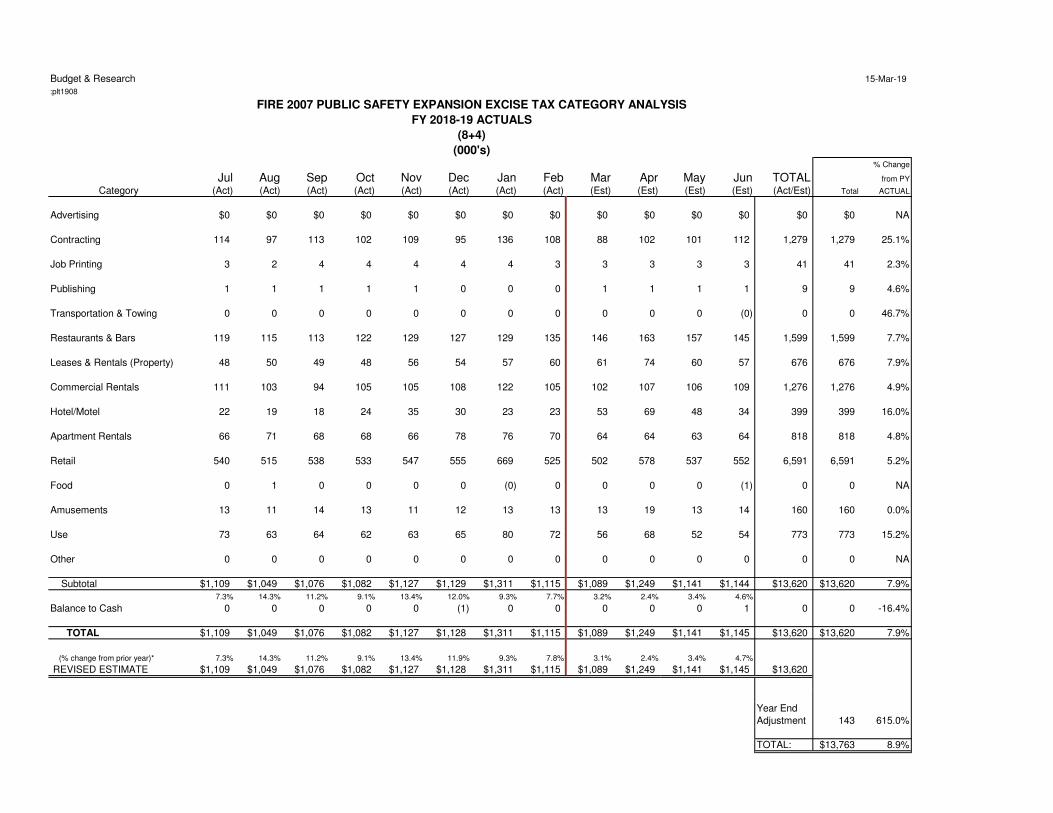
Budget & Research 15-Mar-19
:plt1908
% Change
Jul Aug Sep Oct Nov Dec Jan Feb Mar Apr May Jun TOTAL from PY
Category (Act) (Act) (Act) (Act) (Act) (Act) (Act) (Act) (Est) (Est) (Est) (Est) (Act/Est) Total ACTUAL
Advertising $0 $0 $0 $0 $0 $0 $0 $0 $0 $0 $0 $0 $0 $0 NA
Contracting 114 97 113 102 109 95 136 108 88 102 101 112 1,279 1,279 25.1%
Job Printing 3 2 4 4 4 4 4 3 3 3 3 3 41 41 2.3%
Publishing 1 1 1 1 1 0 0 0 1 1 1 1 9 9 4.6%
Transportation & Towing 0 0 0 0 0 0 0 0 0 0 0 (0) 0 0 46.7%
Restaurants & Bars 119 115 113 122 129 127 129 135 146 163 157 145 1,599 1,599 7.7%
Leases & Rentals (Property) 48 50 49 48 56 54 57 60 61 74 60 57 676 676 7.9%
Commercial Rentals 111 103 94 105 105 108 122 105 102 107 106 109 1,276 1,276 4.9%
Hotel/Motel 22 19 18 24 35 30 23 23 53 69 48 34 399 399 16.0%
Apartment Rentals 66 71 68 68 66 78 76 70 64 64 63 64 818 818 4.8%
Retail 540 515 538 533 547 555 669 525 502 578 537 552 6,591 6,591 5.2%
Food 0 1 0 0 0 0 (0) 0 0 0 0 (1) 0 0 NA
Amusements 13 11 14 13 11 12 13 13 13 19 13 14 160 160 0.0%
Use 73 63 64 62 63 65 80 72 56 68 52 54 773 773 15.2%
Other 0 0 0 0 0 0 0 0 0 0 0 0 0 0 NA
Subtotal $1,109 $1,049 $1,076 $1,082 $1,127 $1,129 $1,311 $1,115 $1,089 $1,249 $1,141 $1,144 $13,620 $13,620 7.9%
7.3% 14.3% 11.2% 9.1% 13.4% 12.0% 9.3% 7.7% 3.2% 2.4% 3.4% 4.6%
Balance to Cash 0 0 0 0 0 (1) 0 0 0 0 0 1 0 0 -16.4%
TOTAL $1,109 $1,049 $1,076 $1,082 $1,127 $1,128 $1,311 $1,115 $1,089 $1,249 $1,141 $1,145 $13,620 $13,620 7.9%
(% change from prior year)* 7.3% 14.3% 11.2% 9.1% 13.4% 11.9% 9.3% 7.8% 3.1% 2.4% 3.4% 4.7%
REVISED ESTIMATE $1,109 $1,049 $1,076 $1,082 $1,127 $1,128 $1,311 $1,115 $1,089 $1,249 $1,141 $1,145 $13,620
Year End
Adjustment 143 615.0%
TOTAL: $13,763 8.9%
FIRE 2007 PUBLIC SAFETY EXPANSION EXCISE TAX CATEGORY ANALYSIS
FY 2018-19 ACTUALS
(8+4)
(000's)
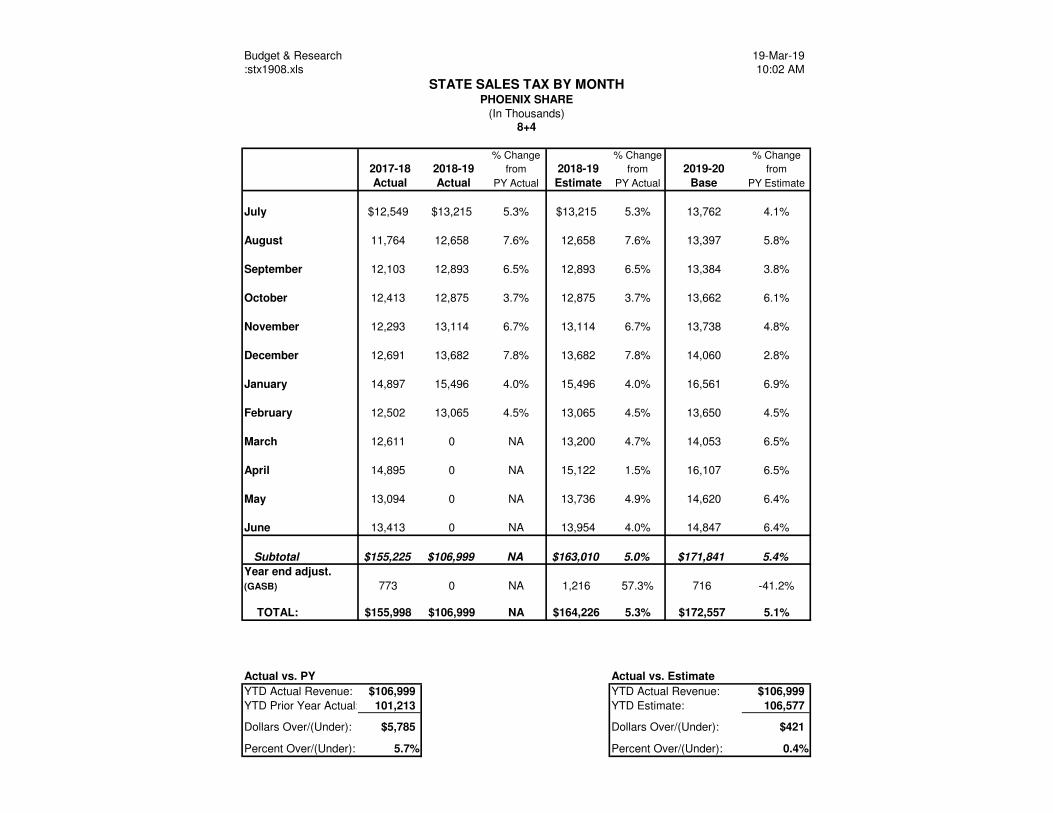
Budget & Research 19-Mar-19:stx1908.xls 10:02 AM
% Change % Change % Change
2017-18 2018-19 from 2018-19 from 2019-20 from
Actual Actual PY Actual Estimate PY Actual Base PY Estimate
July $12,549 $13,215 5.3% $13,215 5.3% 13,762 4.1%
August 11,764 12,658 7.6% 12,658 7.6% 13,397 5.8%
September 12,103 12,893 6.5% 12,893 6.5% 13,384 3.8%
October 12,413 12,875 3.7% 12,875 3.7% 13,662 6.1%
November 12,293 13,114 6.7% 13,114 6.7% 13,738 4.8%
December 12,691 13,682 7.8% 13,682 7.8% 14,060 2.8%
January 14,897 15,496 4.0% 15,496 4.0% 16,561 6.9%
February 12,502 13,065 4.5% 13,065 4.5% 13,650 4.5%
March 12,611 0 NA 13,200 4.7% 14,053 6.5%
April 14,895 0 NA 15,122 1.5% 16,107 6.5%
May 13,094 0 NA 13,736 4.9% 14,620 6.4%
June 13,413 0 NA 13,954 4.0% 14,847 6.4%
Subtotal $155,225 $106,999 NA $163,010 5.0% $171,841 5.4%
Year end adjust.
(GASB) 773 0 NA 1,216 57.3% 716 -41.2%
TOTAL: $155,998 $106,999 NA $164,226 5.3% $172,557 5.1%
Actual vs. PY Actual vs. Estimate
YTD Actual Revenue: $106,999 YTD Actual Revenue: $106,999
YTD Prior Year Actual: 101,213 YTD Estimate: 106,577
Dollars Over/(Under): $5,785 Dollars Over/(Under): $421
Percent Over/(Under): 5.7% Percent Over/(Under): 0.4%
8+4(In Thousands)
STATE SALES TAX BY MONTHPHOENIX SHARE
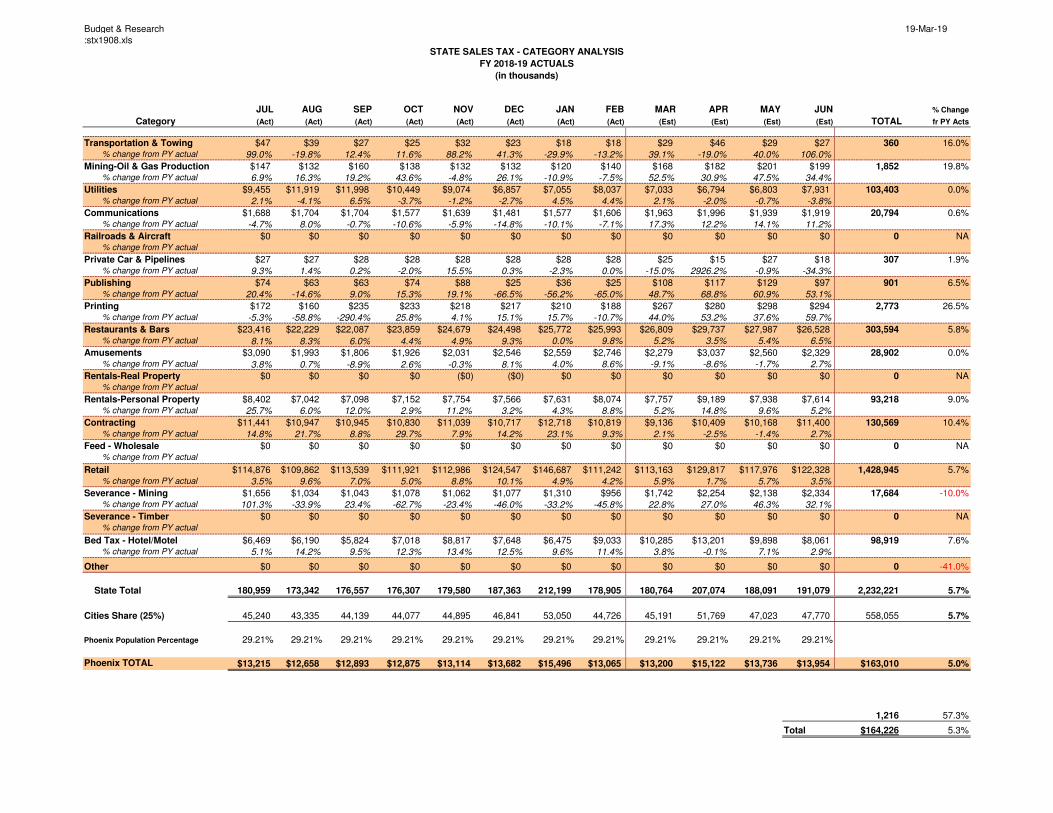
Budget & Research 19-Mar-19:stx1908.xls
JUL AUG SEP OCT NOV DEC JAN FEB MAR APR MAY JUN % Change
Category (Act) (Act) (Act) (Act) (Act) (Act) (Act) (Act) (Est) (Est) (Est) (Est) TOTAL fr PY Acts
Transportation & Towing $47 $39 $27 $25 $32 $23 $18 $18 $29 $46 $29 $27 360 16.0% % change from PY actual 99.0% -19.8% 12.4% 11.6% 88.2% 41.3% -29.9% -13.2% 39.1% -19.0% 40.0% 106.0%
Mining-Oil & Gas Production $147 $132 $160 $138 $132 $132 $120 $140 $168 $182 $201 $199 1,852 19.8% % change from PY actual 6.9% 16.3% 19.2% 43.6% -4.8% 26.1% -10.9% -7.5% 52.5% 30.9% 47.5% 34.4%
Utilities $9,455 $11,919 $11,998 $10,449 $9,074 $6,857 $7,055 $8,037 $7,033 $6,794 $6,803 $7,931 103,403 0.0% % change from PY actual 2.1% -4.1% 6.5% -3.7% -1.2% -2.7% 4.5% 4.4% 2.1% -2.0% -0.7% -3.8%
Communications $1,688 $1,704 $1,704 $1,577 $1,639 $1,481 $1,577 $1,606 $1,963 $1,996 $1,939 $1,919 20,794 0.6% % change from PY actual -4.7% 8.0% -0.7% -10.6% -5.9% -14.8% -10.1% -7.1% 17.3% 12.2% 14.1% 11.2%
Railroads & Aircraft $0 $0 $0 $0 $0 $0 $0 $0 $0 $0 $0 $0 0 NA % change from PY actual
Private Car & Pipelines $27 $27 $28 $28 $28 $28 $28 $28 $25 $15 $27 $18 307 1.9% % change from PY actual 9.3% 1.4% 0.2% -2.0% 15.5% 0.3% -2.3% 0.0% -15.0% 2926.2% -0.9% -34.3%
Publishing $74 $63 $63 $74 $88 $25 $36 $25 $108 $117 $129 $97 901 6.5% % change from PY actual 20.4% -14.6% 9.0% 15.3% 19.1% -66.5% -56.2% -65.0% 48.7% 68.8% 60.9% 53.1%
Printing $172 $160 $235 $233 $218 $217 $210 $188 $267 $280 $298 $294 2,773 26.5% % change from PY actual -5.3% -58.8% -290.4% 25.8% 4.1% 15.1% 15.7% -10.7% 44.0% 53.2% 37.6% 59.7%
Restaurants & Bars $23,416 $22,229 $22,087 $23,859 $24,679 $24,498 $25,772 $25,993 $26,809 $29,737 $27,987 $26,528 303,594 5.8% % change from PY actual 8.1% 8.3% 6.0% 4.4% 4.9% 9.3% 0.0% 9.8% 5.2% 3.5% 5.4% 6.5%
Amusements $3,090 $1,993 $1,806 $1,926 $2,031 $2,546 $2,559 $2,746 $2,279 $3,037 $2,560 $2,329 28,902 0.0% % change from PY actual 3.8% 0.7% -8.9% 2.6% -0.3% 8.1% 4.0% 8.6% -9.1% -8.6% -1.7% 2.7%
Rentals-Real Property $0 $0 $0 $0 ($0) ($0) $0 $0 $0 $0 $0 $0 0 NA % change from PY actual
Rentals-Personal Property $8,402 $7,042 $7,098 $7,152 $7,754 $7,566 $7,631 $8,074 $7,757 $9,189 $7,938 $7,614 93,218 9.0% % change from PY actual 25.7% 6.0% 12.0% 2.9% 11.2% 3.2% 4.3% 8.8% 5.2% 14.8% 9.6% 5.2%
Contracting $11,441 $10,947 $10,945 $10,830 $11,039 $10,717 $12,718 $10,819 $9,136 $10,409 $10,168 $11,400 130,569 10.4% % change from PY actual 14.8% 21.7% 8.8% 29.7% 7.9% 14.2% 23.1% 9.3% 2.1% -2.5% -1.4% 2.7%
Feed - Wholesale $0 $0 $0 $0 $0 $0 $0 $0 $0 $0 $0 $0 0 NA % change from PY actual
Retail $114,876 $109,862 $113,539 $111,921 $112,986 $124,547 $146,687 $111,242 $113,163 $129,817 $117,976 $122,328 1,428,945 5.7% % change from PY actual 3.5% 9.6% 7.0% 5.0% 8.8% 10.1% 4.9% 4.2% 5.9% 1.7% 5.7% 3.5%
Severance - Mining $1,656 $1,034 $1,043 $1,078 $1,062 $1,077 $1,310 $956 $1,742 $2,254 $2,138 $2,334 17,684 -10.0% % change from PY actual 101.3% -33.9% 23.4% -62.7% -23.4% -46.0% -33.2% -45.8% 22.8% 27.0% 46.3% 32.1%
Severance - Timber $0 $0 $0 $0 $0 $0 $0 $0 $0 $0 $0 $0 0 NA % change from PY actual
Bed Tax - Hotel/Motel $6,469 $6,190 $5,824 $7,018 $8,817 $7,648 $6,475 $9,033 $10,285 $13,201 $9,898 $8,061 98,919 7.6% % change from PY actual 5.1% 14.2% 9.5% 12.3% 13.4% 12.5% 9.6% 11.4% 3.8% -0.1% 7.1% 2.9%
Other $0 $0 $0 $0 $0 $0 $0 $0 $0 $0 $0 $0 0 -41.0%
State Total 180,959 173,342 176,557 176,307 179,580 187,363 212,199 178,905 180,764 207,074 188,091 191,079 2,232,221 5.7%
Cities Share (25%) 45,240 43,335 44,139 44,077 44,895 46,841 53,050 44,726 45,191 51,769 47,023 47,770 558,055 5.7%
Phoenix Population Percentage 29.21% 29.21% 29.21% 29.21% 29.21% 29.21% 29.21% 29.21% 29.21% 29.21% 29.21% 29.21%
Phoenix TOTAL $13,215 $12,658 $12,893 $12,875 $13,114 $13,682 $15,496 $13,065 $13,200 $15,122 $13,736 $13,954 $163,010 5.0%
1,216 57.3%
Total $164,226 5.3%
STATE SALES TAX - CATEGORY ANALYSIS
FY 2018-19 ACTUALS
(in thousands)
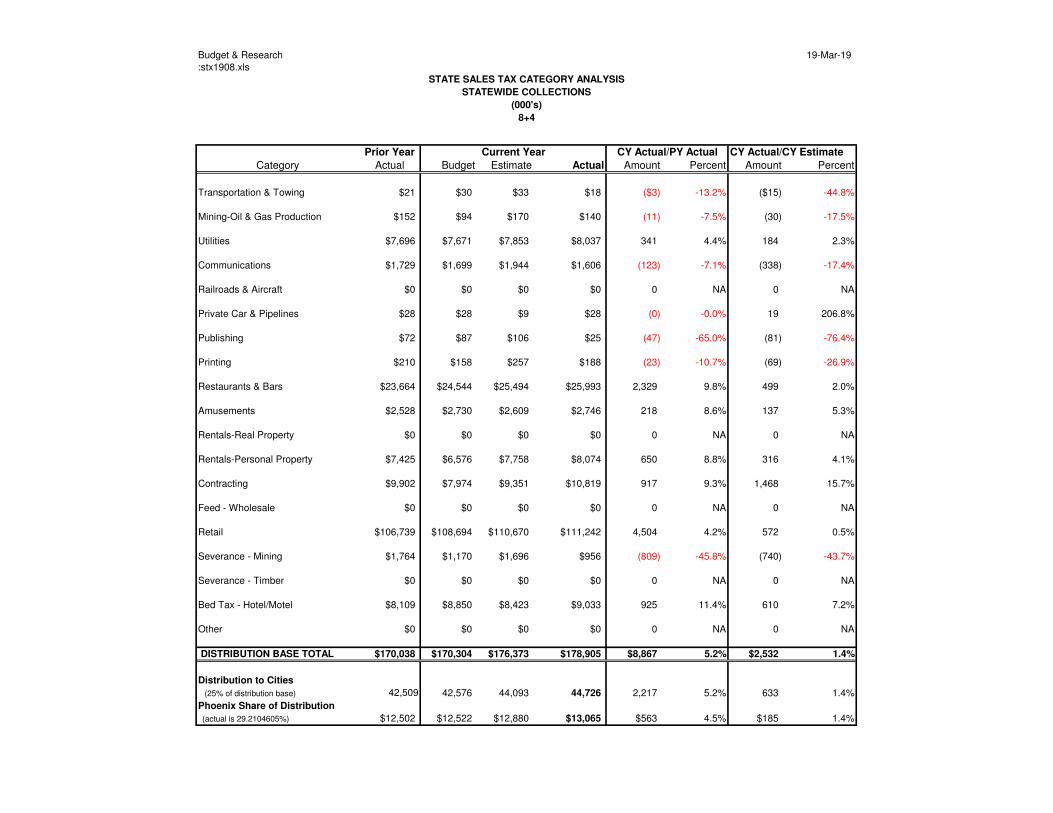
Budget & Research 19-Mar-19
:stx1908.xls
STATE SALES TAX CATEGORY ANALYSIS
STATEWIDE COLLECTIONS
(000's)
8+4
Prior Year Current Year CY Actual/CY Estimate
Category Actual Budget Estimate Actual Amount Percent Amount Percent
Transportation & Towing $21 $30 $33 $18 ($3) -13.2% ($15) -44.8%
Mining-Oil & Gas Production $152 $94 $170 $140 (11) -7.5% (30) -17.5%
Utilities $7,696 $7,671 $7,853 $8,037 341 4.4% 184 2.3%
Communications $1,729 $1,699 $1,944 $1,606 (123) -7.1% (338) -17.4%
Railroads & Aircraft $0 $0 $0 $0 0 NA 0 NA
Private Car & Pipelines $28 $28 $9 $28 (0) -0.0% 19 206.8%
Publishing $72 $87 $106 $25 (47) -65.0% (81) -76.4%
Printing $210 $158 $257 $188 (23) -10.7% (69) -26.9%
Restaurants & Bars $23,664 $24,544 $25,494 $25,993 2,329 9.8% 499 2.0%
Amusements $2,528 $2,730 $2,609 $2,746 218 8.6% 137 5.3%
Rentals-Real Property $0 $0 $0 $0 0 NA 0 NA
Rentals-Personal Property $7,425 $6,576 $7,758 $8,074 650 8.8% 316 4.1%
Contracting $9,902 $7,974 $9,351 $10,819 917 9.3% 1,468 15.7%
Feed - Wholesale $0 $0 $0 $0 0 NA 0 NA
Retail $106,739 $108,694 $110,670 $111,242 4,504 4.2% 572 0.5%
Severance - Mining $1,764 $1,170 $1,696 $956 (809) -45.8% (740) -43.7%
Severance - Timber $0 $0 $0 $0 0 NA 0 NA
Bed Tax - Hotel/Motel $8,109 $8,850 $8,423 $9,033 925 11.4% 610 7.2%
Other $0 $0 $0 $0 0 NA 0 NA
DISTRIBUTION BASE TOTAL $170,038 $170,304 $176,373 $178,905 $8,867 5.2% $2,532 1.4%
Distribution to Cities
(25% of distribution base) 42,509 42,576 44,093 44,726 2,217 5.2% 633 1.4%
Phoenix Share of Distribution
(actual is 29.2104605%) $12,502 $12,522 $12,880 $13,065 $563 4.5% $185 1.4%
CY Actual/PY Actual
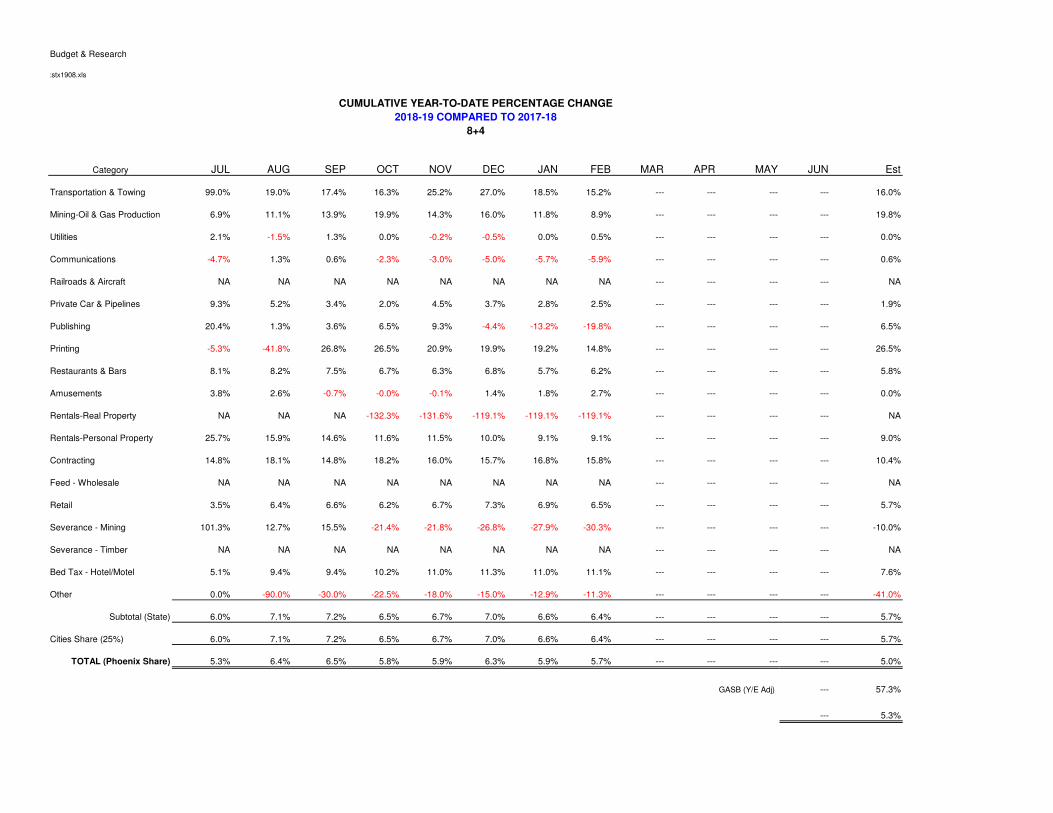
Budget & Research
:stx1908.xls
CUMULATIVE YEAR-TO-DATE PERCENTAGE CHANGE
2018-19 COMPARED TO 2017-18
Category JUL AUG SEP OCT NOV DEC JAN FEB MAR APR MAY JUN Est
Transportation & Towing 99.0% 19.0% 17.4% 16.3% 25.2% 27.0% 18.5% 15.2% --- --- --- --- 16.0%
Mining-Oil & Gas Production 6.9% 11.1% 13.9% 19.9% 14.3% 16.0% 11.8% 8.9% --- --- --- --- 19.8%
Utilities 2.1% -1.5% 1.3% 0.0% -0.2% -0.5% 0.0% 0.5% --- --- --- --- 0.0%
Communications -4.7% 1.3% 0.6% -2.3% -3.0% -5.0% -5.7% -5.9% --- --- --- --- 0.6%
Railroads & Aircraft NA NA NA NA NA NA NA NA --- --- --- --- NA
Private Car & Pipelines 9.3% 5.2% 3.4% 2.0% 4.5% 3.7% 2.8% 2.5% --- --- --- --- 1.9%
Publishing 20.4% 1.3% 3.6% 6.5% 9.3% -4.4% -13.2% -19.8% --- --- --- --- 6.5%
Printing -5.3% -41.8% 26.8% 26.5% 20.9% 19.9% 19.2% 14.8% --- --- --- --- 26.5%
Restaurants & Bars 8.1% 8.2% 7.5% 6.7% 6.3% 6.8% 5.7% 6.2% --- --- --- --- 5.8%
Amusements 3.8% 2.6% -0.7% -0.0% -0.1% 1.4% 1.8% 2.7% --- --- --- --- 0.0%
Rentals-Real Property NA NA NA -132.3% -131.6% -119.1% -119.1% -119.1% --- --- --- --- NA
Rentals-Personal Property 25.7% 15.9% 14.6% 11.6% 11.5% 10.0% 9.1% 9.1% --- --- --- --- 9.0%
Contracting 14.8% 18.1% 14.8% 18.2% 16.0% 15.7% 16.8% 15.8% --- --- --- --- 10.4%
Feed - Wholesale NA NA NA NA NA NA NA NA --- --- --- --- NA
Retail 3.5% 6.4% 6.6% 6.2% 6.7% 7.3% 6.9% 6.5% --- --- --- --- 5.7%
Severance - Mining 101.3% 12.7% 15.5% -21.4% -21.8% -26.8% -27.9% -30.3% --- --- --- --- -10.0%
Severance - Timber NA NA NA NA NA NA NA NA --- --- --- --- NA
Bed Tax - Hotel/Motel 5.1% 9.4% 9.4% 10.2% 11.0% 11.3% 11.0% 11.1% --- --- --- --- 7.6%
Other 0.0% -90.0% -30.0% -22.5% -18.0% -15.0% -12.9% -11.3% --- --- --- --- -41.0%
Subtotal (State) 6.0% 7.1% 7.2% 6.5% 6.7% 7.0% 6.6% 6.4% --- --- --- --- 5.7%
Cities Share (25%) 6.0% 7.1% 7.2% 6.5% 6.7% 7.0% 6.6% 6.4% --- --- --- --- 5.7%
TOTAL (Phoenix Share) 5.3% 6.4% 6.5% 5.8% 5.9% 6.3% 5.9% 5.7% --- --- --- --- 5.0%
GASB (Y/E Adj) --- 57.3%
--- 5.3%
8+4


![Budjet 2016-17 - kadurtown.mrc.gov.in€¦ · BUDGET FOR Budget Budget for 2016—17 u pto Actuals the December year 2015—16 4121 4128 — City Civil 4128 Circle. We] (21) - Roadside](https://img.pdfslide.us/doc/110x75/5f076c507e708231d41ce8fb/budjet-2016-17-budget-for-budget-budget-for-2016a17-u-pto-actuals-the-december.jpg)