Embed Size (px)
Citation preview

Classification: Public
Heathrow Airport Limited 2019 actual income variance analysis for Specified Facilities Year ended 31 December 2019

2
Classification: Public
Contents 1. Introduction ..................................................................................................................................... 3 2. Summary ........................................................................................................................................ 4 3. Check-in Desks .............................................................................................................................. 5 4. Baggage Systems ........................................................................................................................... 6 5. Services for passengers with reduced mobility (PRM) .................................................................... 7 6. Staff car parking ............................................................................................................................. 8 7. Staff ID cards .................................................................................................................................. 9 8. Fixed electrical ground power (FEGP) .......................................................................................... 10 9. Pre-conditioned air (PCA) ............................................................................................................. 11 10. Airside Licences ........................................................................................................................ 12 11. Waste, recycling and refuse collection ...................................................................................... 13 12. Taxi feeder park ........................................................................................................................ 14 13. Heating and Gas ....................................................................................................................... 15 14. Electricity ................................................................................................................................... 16 15. Water and sewerage ................................................................................................................. 17 16. Bus and Coach.......................................................................................................................... 18 17. Common IT infrastructure .......................................................................................................... 19 18. Airline Operators Committee (AOC) .......................................................................................... 20

3
Classification: Public
1. Introduction This report provides users with explanations of variances between 2019 actual results for ‘Specified facilities – transparency and trading statements’ document to those in the preceding regulatory year in 2018, per condition C2.6 of Heathrow’s economic Licence. In previous regulatory years (2014-2018) actual results have been compared to those included within the CAA forecast for specified facilities outlined in table G.4, page 278, ‘Economic regulation at Heathrow from April 2014: Notice granting the licence’. However, given that there is no 2019 CAA forecast for specified facilities, actual results for 2019 have been compared to the actual results in 2018. The designation of specified facilities for Q6 is derived from Annex G in the Q6 decision as follows: • Check-in desks • Baggage systems • Services for passengers with reduced mobility (PRM) • Staff car parking • Staff ID cards • Fixed electrical ground power (FEGP) • Pre-conditioned air (PCA) • Airside licences • Waste, recycling and refuse collection • Taxi feeder park • Heating & Gas • Electricity • Water and sewerage • Bus and coach facilities • Common I.T. infrastructure • HAL’s contribution to the funding of the Heathrow Airline Operators Committee (AOC) The variance analysis has been made against customer share elements of the actuals for the year ended 31 December 2019.

4
Classification: Public
2. Summary
9 months 12 months 12 months 12 months 12 months 12 months
Apr to Dec Jan to Dec Jan to Dec Jan to Dec Jan to Dec Jan to Dec
2014 2015 2016 2017 2018 2019
£'000s £'000s £'000s £'000s £'000s £'000s
CAA Forecast (11/12 Prices)
Direct Costs 133,641 163,941 158,011 158,364 159,097
Annuity 27,876 35,022 33,133 31,713 30,337
Allocated Costs 12,691 15,463 14,825 14,875 14,887
Total Income to be recovered 174,209 214,427 205,969 204,953 204,321
CAA Forecast (nominal prices)
Direct Costs 144,573 178,745 175,319 181,989 188,934
Annuity 30,157 38,152 36,730 36,413 35,996
Allocated Costs 13,729 16,851 16,440 17,085 17,670
Total Income to be recovered 188,459 233,748 228,489 235,488 242,600
Prior Year Actuals (2018)
Direct Costs 194,089
Annuity 35,996
Allocated Costs 17,669
Total Income to be recovered 247,7541
Actual (Trading Statements)
Total Income recovered 177,484 242,344 233,511 241,539 244,0322 240,628
Variance (10,974) 8,596 5,022 6,051 1,432 (7,126)
Adjustments in Scope (1,050) (4,950) (17,428) (14,021) (6,785) 0
Over/(under) recovery b/f from prior year 6,594 3,564 5,499 (1,730) (1,082) (5,330)
(Over)/under recovery to cfwd (3,564) (5,499) 1,730 1,082 5,330 24,022
Variance to explain (8,994) 1,710 (5,177) (8,617) (1,105) 11,566
2014 Commentary:
Driven pre-dominantly by Baggage and partly Electricity.
2015 Commentary:
Driven pre-dominantly by Baggage and partly Electricity.
2016 Commentary:
Driven pre-dominantly by Baggage.
2017 Commentary:
Driven pre-dominantly by Baggage.
2018 Commentary:
Driven pre-dominantly by PRM.
2019 Commentary:
Driven pre-dominantly by PRM, Baggage & PCA
1 The actual costs and therefore the revenue that should have been received in 2018. 2 The actual revenue received in 2018.

5
Classification: Public
3. Check-in Desks
9 months 12 months 12 months 12 months 12 months 12 months
Apr to Dec Jan to Dec Jan to Dec Jan to Dec Jan to Dec Jan to Dec
2014 2015 2016 2017 2018 2019
£'000s £'000s £'000s £'000s £'000s £'000s
CAA Forecast (11/12 Prices)
Direct Costs 2,943 4,008 3,997 3,739 3,751
Annuity 463 548 518 504 358
Allocated Costs 409 547 542 509 493
Total Income to be recovered 3,815 5,103 5,056 4,752 4,602
CAA Forecast (nominal prices)
Direct Costs 3,184 4,367 4,431 4,293 4,451
Annuity 500 597 574 578 424
Allocated Costs 442 596 601 585 585
Total Income to be recovered 4,127 5,559 5,605 5,456 5,460
Prior Year Actuals (2018)
Direct Costs 4,921
Annuity 424
Allocated Costs 585
Total Income to be recovered 6,432
Actual (Trading Statements)
Total Income recovered 4,237 5,603 5,435 5,557 6,432 7,047
Variances (Actuals less CAA Forecast) 110 44 (170) 101 972 615
Adjustments in Scope
Over/(under) recovery b/f from prior year 254 89 44 193 80 582
(Over)/under recovery to cfwd (89) (44) (193) (80) (582) (375)
Variance to explain 275 89 (320) 214 469 822
2014 Commentary: Driven by higher number of CUSS kiosks deployed in T2, and associated costs.
2015 Commentary:
Driven by higher number of CUSS kiosks deployed in T2, and associated costs, offset partially by early T1 closure.
2016 Commentary:
Driven by lower CUSS management charges and closure of T1.
2017 Commentary
Driven by higher number of CUSS kiosks
2018 Commentary
Driven by higher number of CUSS kiosks
2019 Commentary
Driven by higher number of CUSS kiosks & increased services

6
Classification: Public
4. Baggage Systems
9 months 12 months 12 months 12 months 12 months 12 months
Apr to Dec Jan to Dec Jan to Dec Jan to Dec Jan to Dec Jan to Dec
2014 2015 2016 2017 2018 2019
£'000s £'000s £'000s £'000s £'000s £'000s
CAA Forecast (11/12 Prices)
Direct Costs 85,587 100,549 95,311 97,730 98,845
Annuity 0 0 0 0 0
Allocated Costs 8,388 9,854 9,341 9,578 9,687
Total Income to be recovered 93,974 110,403 104,652 107,308 108,532
CAA Forecast (nominal prices)
Direct Costs 92,588 109,531 105,655 112,207 117,277
Annuity 0 0 0
Allocated Costs 9,074 10,734 10,354 10,996 11,493
Total Income to be recovered 101,661 120,265 116,010 123,203 128,770
Prior Year Actuals (2018)
Direct Costs 119,158
Annuity 0
Allocated Costs 11,493
Total Income to be recovered 132,441
Actual (Trading Statements)
Total Income recovered 91,547 126,670 124,883 136,318 132,441 129,748
Variances (Actuals less CAA Forecast) (10,114) 6,405 8,873 13,115 3,671 (2,693)
Adjustments in Scope (1,050) (4,950) (16,100) (12,257) (3,327)
Over/(under) recovery b/f from prior year 5,436 1,550 (1,161) (4,638) 3,532 5,323
(Over)/under recovery to cfwd (1,550) 1,161 4,638 (3,532) (5,323) 669
Variance to explain (7,278) 4,166 (3,749) (7,312) (1,446) 3,300
2014 Commentary: Driven primarily by O&M Tender savings, and in addition negotiations on cleaning contract, rates and T3IB costs delay.
2015 Commentary:
Tender savings have continued and are included in both Actuals and CAA Forecast. Variance driven primarily by agreed recovery of baggage resilience costs, out of guage scope and gainshare on O&M Tender savings.
2016 Commentary:
Variance driven primarily by agreed recovery of baggage resilience costs, out of guage scope and gainshare on O&M Tender savings.
2017 Commentary:
Variance driven primarily by agreed recovery of baggage resilience costs & O&M Tender savings.
2018 Commentary:
Variance driven primarily by agreed recovery of incremental IT costs.
2019 Commentary:
Minimal variance to 2018, scope change from prior years.

7
Classification: Public
5. Services for passengers with reduced mobility (PRM)
9 months 12 months 12 months 12
months 12
months 12
months
Apr to Dec Jan to Dec Jan to Dec Jan to
Dec Jan to
Dec Jan to
Dec
2014 2015 2016 2017 2018 2019
£'000s £'000s £'000s £'000s £'000s £'000s
CAA Forecast (11/12 Prices)
Direct Costs 12,648 16,587 15,924 14,275 14,138
Annuity 0 0 0 0 0
Allocated Costs 506 663 637 571 566
Total Income to be recovered 13,154 17,250 16,561 14,846 14,704
CAA Forecast (nominal prices)
Direct Costs 13,682 18,068 17,653 16,390 16,775
Annuity 0 0 0 0 0
Allocated Costs 547 723 706 656 671
Total Income to be recovered 14,230 18,791 18,359 17,046 17,446
Prior Year Actuals (2018)
Direct Costs 23,498
Annuity 0
Allocated Costs 671
Total Income to be recovered 22,020
Actual (Trading Statements)
Total Income recovered 16,233 20,673 19,782 21,589 22,020 23,792
Variances (Actuals less CAA Forecast) 2,003 1,882 1,423 4,543 4,574 1,772
Adjustments in Scope (1,328) (1,764) (3,458) Over/(under) recovery b/f from prior year (2,310) (608) (41) (278) (242) (2,391)
(Over)/under recovery to cfwd 608 41 278 242 2,391 3,670
Variance to explain 301 1,315 332 2,743 3,265 3,051
2014 Commentary: Higher costs driven by additional T2 transitioning costs and higher PRM volumes.
2015 Commentary: Higher costs driven by higher PRM volumes.
2016 Commentary: Higher costs driven by higher PRM volumes and associated costs. Also due to airline moves.
2017 Commentary: Higher costs driven by higher PRM volumes.
2018 Commentary: Higher costs driven by significantly higher PRM volumes.
2019 Commentary: Higher costs driven by higher PRM volumes

8
Classification: Public
6. Staff car parking
9 months 12 months 12 months 12 months 12 months 12 months
Apr to Dec Jan to Dec Jan to Dec Jan to Dec Jan to Dec Jan to Dec
2014 2015 2016 2017 2018 2019
£'000s £'000s £'000s £'000s £'000s £'000s
CAA Forecast (11/12 Prices)
Direct Costs 6,780 9,191 9,105 9,071 9,023
Annuity 2,970 3,737 3,610 3,369 3,258
Allocated Costs 1,053 1,396 1,373 1,343 1,326
Total Income to be recovered 10,802 14,325 14,088 13,783 13,607
CAA Forecast (nominal prices)
Direct Costs 7,334 10,012 10,093 10,415 10,705
Annuity 3,212 4,071 4,001 3,868 3,865
Allocated Costs 1,139 1,521 1,522 1,542 1,574
Total Income to be recovered 11,686 15,604 15,617 15,824 16,144
Prior Year Actuals (2018)
Direct Costs 11,533
Annuity 3,865
Allocated Costs 1,574
Total Income to be recovered 16,315
Actual (Trading Statements)
Total Income recovered 13,072 17,748 16,326 14,588 16,315 15,685
Variances (Actuals less CAA Forecast) 1,387 2,144 709 (1,236) 171 (630)
Adjustments in Scope
Over/(under) recovery b/f from prior year 325 755 1,943 674 (801) (1,458)
(Over)/under recovery to cfwd (755) (1,943) (674) 801 1,458 3,691
Variance to explain 956 956 1,978 239 828 1,603
2014 Commentary: Driven by phasing of the savings which will be realised later in the Q, resulting from negotiation of the Bussing and Management contracts.
2015 Commentary:
CAA stretch for Travel Services (including non-ORC) applied fully to Staff car parking. Variance offset in Commercial Income.
2016 Commentary:
CAA stretch for Travel Services (including non-ORC) applied fully to Staff car parking. Variance offset in Commercial Income.
2017 Commentary:
CAA stretch for Travel Services (including non-ORC) applied fully to Staff car parking. Variance offset in Commercial Income.
2018 Commentary:
CAA stretch for Travel Services (including non-ORC) applied fully to Staff car parking. Variance offset in Commercial Income.
2019 Commentary:
Driven by year on year costs of running the service

9
Classification: Public
7. Staff ID cards
9 months 12 months 12 months 12 months 12 months 12 months
Apr to Dec Jan to Dec Jan to Dec Jan to Dec Jan to Dec Jan to Dec
2014 2015 2016 2017 2018 2019
£'000s £'000s £'000s £'000s £'000s £'000s
CAA Forecast (11/12 Prices)
Direct Costs 710 923 912 905 898
Annuity 66 83 81 78 76
Allocated Costs 93 121 119 118 117
Total Income to be recovered 869 1,128 1,112 1,102 1,091
CAA Forecast (nominal prices)
Direct Costs 769 1,006 1,011 1,039 1,065
Annuity 71 91 89 90 91
Allocated Costs 101 132 132 136 139
Total Income to be recovered 940 1,228 1,233 1,265 1,295
Prior Year Actuals (2018)
Direct Costs 1,684
Annuity 91
Allocated Costs 139
Total Income to be recovered 1,581
Actual (Trading Statements)
Total Income recovered 1,784 1,134 1,264 1,711 1,581 1,595
Variances (Actuals less CAA Forecast) 844 (94) 31 446 286 14
Adjustments in Scope
Over/(under) recovery b/f from prior year 92 869 496 364 416 83
(Over)/under recovery to cfwd (869) (496) (364) (416) (83) 289
Variance to explain 67 278 163 394 619 386
2014 Commentary:
Driven by costs associated with higher number of ID passes issued for T2.
2015 Commentary:
Driven by higher number of ID passes and associated costs, as well as additional compliance training and staff training.
2016 Commentary:
Driven by higher number of full ID and temporary passes, as well as reduction in costs due to consolidation of ID centre.
2017 Commentary:
Driven by higher number of full ID and temporary passes
2018 Commentary:
Driven by increase in resource costs to support pass issuing
2019 Commentary:
Driven by change in pass application rules

10
Classification: Public
8. Fixed electrical ground power (FEGP)
9 months 12
months 12
months 12
months 12
months 12
months
Apr to
Dec Jan to Dec Jan to Dec Jan to Dec Jan to Dec Jan to Dec
2014 2015 2016 2017 2018 2019
£'000s £'000s £'000s £'000s £'000s £'000s
CAA Forecast (11/12 Prices)
Direct Costs 4,678 5,940 5,678 5,587 5,560
Annuity 2,854 3,631 3,380 3,106 3,000
Allocated Costs 301 383 362 348 342
Total Income to be recovered 7,832 9,955 9,420 9,041 8,903
CAA Forecast (nominal prices)
Direct Costs 5,060 6,471 6,294 6,415 6,597
Annuity 3,087 3,956 3,747 3,566 3,560
Allocated Costs 326 417 402 399 406
Total Income to be recovered 8,473 10,844 10,442 10,380 10,563
Prior Year Actuals (2018)
Direct Costs 6,609
Annuity 3,560
Allocated Costs 406
Total Income to be recovered 10,392
Actual (Trading Statements)
Total Income recovered 7,988 10,554 9,890 8,818 10,392 10,782
Variances (Actuals less CAA Forecast) (485) (290) (552) (1,562) (171) 390
Adjustments in Scope
Over/(under) recovery b/f from prior year (68) 377 768 1,088 (14) (197)
(Over)/under recovery to cfwd (377) (768) (1,088) 14 197 (5)
Variance to explain (930) (680) (872) (460) 12 188
2014 Commentary:
Driven by lower consumption and lower maintenance and parts costs.
2015 Commentary:
Driven by lower consumption and lower maintenance and parts costs.
2016 Commentary:
Driven by lower consumption and lower maintenance and parts costs.
2017 Commentary:
Driven by lower consumption and lower maintenance and parts costs.
2018 Commentary:
Driven by lower consumption and lower maintenance and parts costs.
2019 Commentary: Driven by electricity price rise year on year

11
Classification: Public
9. Pre-conditioned air (PCA)
9 months 12 months 12 months 12 months 12 months 12 months
Apr to Dec Jan to Dec Jan to Dec Jan to Dec Jan to Dec Jan to Dec
2014 2015 2016 2017 2018 2019
£'000s £'000s £'000s £'000s £'000s £'000s
CAA Forecast (11/12 Prices)
Direct Costs 1,340 1,649 1,449 1,355 1,260
Annuity 2,767 3,605 3,588 3,595 3,500
Allocated Costs 164 210 201 198 190
Total Income to be recovered 4,271 5,464 5,239 5,148 4,950
CAA Forecast (nominal prices)
Direct Costs 1,450 1,797 1,606 1,556 1,495
Annuity 2,993 3,927 3,978 4,128 4,153
Allocated Costs 178 229 223 227 226
Total Income to be recovered 4,621 5,952 5,807 5,911 5,873
Prior Year Actuals (2018)
Direct Costs 1,004
Annuity 4,153
Allocated Costs 226
Total Income to be recovered 2,281
Actual (Trading Statements)
Total Income recovered 3,595 5,368 5,314 4,485 2,281 369
Variances (Actuals less CAA Forecast) (1,026) (584) (493) (1,426) (3,592) (1,912)
Adjustments in Scope
Over/(under) recovery b/f from prior year 0 (394) (318) (434) (1,720) (4,822)
(Over)/under recovery to cfwd 394 318 434 1,720 4,822 9,321
Variance to explain (632) (660) (377) (140) (490) 2,587
2014 Commentary:
Driven by lower consumption and lower maintenance and parts costs.
2015 Commentary:
Driven by lower consumption and lower maintenance and parts costs.
2016 Commentary:
Driven by lower consumption and lower maintenance and parts costs.
2017 Commentary:
Driven by lower consumption
2018 Commentary:
Driven by lower consumption
2019 Commentary:
Driven by notably lower consumption of the service

12
Classification: Public
10. Airside Licences
9 months 12 months 12 months 12 months 12 months 12 months
Apr to Dec Jan to Dec Jan to Dec Jan to Dec Jan to Dec Jan to Dec
2014 2015 2016 2017 2018 2019
£'000s £'000s £'000s £'000s £'000s £'000s
CAA Forecast (11/12 Prices)
Direct Costs 611 796 793 794 795
Annuity 25 27 27 26 25
Allocated Costs 76 99 98 98 98
Total Income to be recovered 712 923 918 919 919
CAA Forecast (nominal prices)
Direct Costs 661 867 879 912 944
Annuity 27 30 29 30 30
Allocated Costs 83 108 109 113 117
Total Income to be recovered 771 1,005 1,017 1,055 1,090
Prior Year Actuals (2018)
Direct Costs 828
Annuity 30
Allocated Costs 117
Total Income to be recovered 750
Actual (Trading Statements)
Total Income recovered 922 917 1,082 804 750 924
Variances (Actuals less CAA Forecast) 152 (88) 65 (251) (340) 174
Adjustments in Scope
Over/(under) recovery b/f from prior year (27) 157 195 548 204 (106)
(Over)/under recovery to cfwd (157) (195) (548) (204) 106 666
Variance to explain (33) (126) (288) 93 (30) 734
2014 Commentary:
Driven by lower staff costs following a re-structure.
2015 Commentary:
Driven by lower staff costs following a re-structure.
2016 Commentary:
Driven by lower staff costs following a re-structure.
2017 Commentary:
Driven by increased volume of licences
2018 Commentary:
Driven by headcount changes
2019 Commentary:
Driven by headcount changes

13
Classification: Public
11. Waste, recycling and refuse collection
9 months 12 months 12 months 12 months 12 months 12 months
Apr to Dec Jan to Dec Jan to Dec Jan to Dec Jan to Dec Jan to Dec
2014 2015 2016 2017 2018 2019
£'000s £'000s £'000s £'000s £'000s £'000s
CAA Forecast (11/12 Prices)
Direct Costs 1,775 2,513 2,580 2,598 2,624
Annuity 288 357 126 122 118
Allocated Costs 83 115 108 109 110
Total Income to be recovered 2,146 2,984 2,814 2,828 2,852
CAA Forecast (nominal prices)
Direct Costs 1,921 2,737 2,860 2,983 3,114
Annuity 312 389 140 140 140
Allocated Costs 89 125 120 125 130
Total Income to be recovered 2,322 3,251 3,120 3,248 3,384
Prior Year Actuals (2018)
Direct Costs 2,689
Annuity 140
Allocated Costs 130
Total Income to be recovered 2,979
Actual (Trading Statements)
Total Income recovered 2,026 2,689 2,196 2,584 2,979 2,400
Variances (Actuals less CAA Forecast) (296) (562) (924) (664) (405) (579)
Adjustments in Scope
Over/(under) recovery b/f from prior year - (12) 159 7 35 55
(Over)/under recovery to cfwd 12 (159) (7) (35) (55) 456
Variance to explain (284) (733) (772) (692) (425) (68)
2014 Commentary:
Direct costs lower due to contract negotiation.
2015 Commentary:
Direct costs lower due to contract negotiation.
2016 Commentary:
Direct costs lower due to contract negotiation.
2017 Commentary:
Direct costs lower due to contract negotiation.
2018 Commentary:
Direct costs lower due to contract negotiation.
2019 Commentary:
Direct costs lower due to contract negotiation.

14
Classification: Public
12. Taxi feeder park
9 months 12 months 12 months 12 months 12 months 12 months
Apr to Dec Jan to Dec Jan to Dec Jan to Dec Jan to Dec Jan to Dec
2014 2015 2016 2017 2018 2019
£'000s £'000s £'000s £'000s £'000s £'000s
CAA Forecast (11/12 Prices)
Direct Costs 1,007 1,291 1,286 1,253 1,252
Annuity 315 413 412 413 413
Allocated Costs 159 204 204 200 200
Total Income to be recovered 1,481 1,909 1,902 1,865 1,865
CAA Forecast (nominal prices)
Direct Costs 1,090 1,407 1,426 1,439 1,486
Annuity 341 450 457 474 490
Allocated Costs 172 223 226 229 237
Total Income to be recovered 1,602 2,079 2,108 2,142 2,213
Prior Year Actuals (2018)
Direct Costs 1,366
Annuity 490
Allocated Costs 236
Total Income to be recovered 2,320
Actual (Trading Statements)
Total Income recovered 2,228 1,886 1,896 2,205 2,320 2,405
Variances (Actuals less CAA Forecast) 626 (193) (212) 63 107 85
Adjustments in Scope
Over/(under) recovery b/f from prior year (484) (6) (161) (323) (311) (83)
(Over)/under recovery to cfwd 6 161 323 311 83 (90)
Variance to explain 148 (38) (50) 51 (121) (88)
2014 Commentary:
Driven by re-surfacing repairs not forecasted.
2015 Commentary:
Broadly in line with CAA forecast.
2016 Commentary:
Driven by lower number of movements.
2017 Commentary:
Driven by higher number of movements.
2018 Commentary:
Driven by lower number of movements.
2019 Commentary:
Driven by number of movements.

15
Classification: Public
13. Heating and Gas
9 months 12 months 12 months 12 months 12 months 12 months
Apr to Dec Jan to Dec Jan to Dec Jan to Dec Jan to Dec Jan to Dec
2014 2015 2016 2017 2018 2019
£'000s £'000s £'000s £'000s £'000s £'000s
CAA Forecast (11/12 Prices)
Direct Costs 855 970 966 968 969
Annuity 1 0 0 0 0
Allocated Costs 4 0 0 0 0
Total Income to be recovered 860 970 966 968 969
CAA Forecast (nominal prices)
Direct Costs 925 1,217 1,230 1,277 1,319
Annuity 1 2 2 2 2
Allocated Costs 5 6 6 7 7
Total Income to be recovered 931 1,225 1,238 1,286 1,328
Prior Year Actuals (2018)
Direct Costs 1,365
Annuity 2
Allocated Costs 7
Total Income to be recovered 1,359
Actual (Trading Statements)
Total Income recovered 961 1,182 1,185 1,278 1,359 1,363
Variances (Actuals less CAA Forecast) 30 (43) (53) (8) 31 4
Adjustments in Scope
Over/(under) recovery b/f from prior year 110 104 50 26 18 3
(Over)/under recovery to cfwd (104) (50) (26) (18) (3) 59
Variance to explain 36 11 (29) (0) 46 66
2014 Commentary:
Driven by higher consumption of gas and heating.
2015 Commentary:
Driven by higher consumption of gas and heating.
2016 Commentary:
Driven by lower customer share.
2017 Commentary:
N/A
2018 Commentary:
Driven by higher consumption of gas and heating.
2019 Commentary:
Driven by higher consumption of gas and heating.
16
Classification: Public
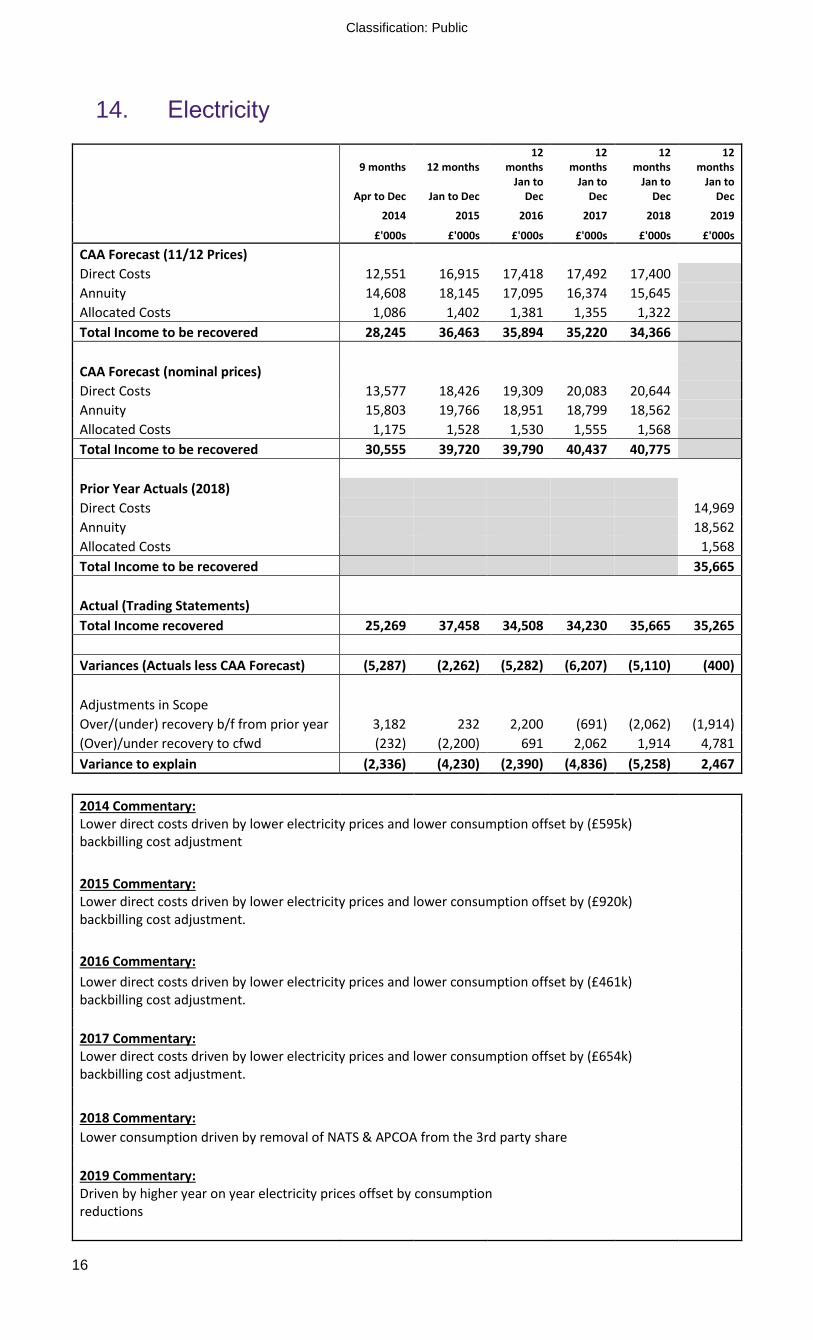
14. Electricity
9 months 12 months 12
months 12
months 12
months 12
months
Apr to Dec Jan to Dec Jan to
Dec Jan to
Dec Jan to
Dec Jan to
Dec
2014 2015 2016 2017 2018 2019
£'000s £'000s £'000s £'000s £'000s £'000s
CAA Forecast (11/12 Prices)
Direct Costs 12,551 16,915 17,418 17,492 17,400
Annuity 14,608 18,145 17,095 16,374 15,645
Allocated Costs 1,086 1,402 1,381 1,355 1,322
Total Income to be recovered 28,245 36,463 35,894 35,220 34,366
CAA Forecast (nominal prices)
Direct Costs 13,577 18,426 19,309 20,083 20,644
Annuity 15,803 19,766 18,951 18,799 18,562
Allocated Costs 1,175 1,528 1,530 1,555 1,568
Total Income to be recovered 30,555 39,720 39,790 40,437 40,775
Prior Year Actuals (2018)
Direct Costs 14,969
Annuity 18,562
Allocated Costs 1,568
Total Income to be recovered 35,665
Actual (Trading Statements)
Total Income recovered 25,269 37,458 34,508 34,230 35,665 35,265
Variances (Actuals less CAA Forecast) (5,287) (2,262) (5,282) (6,207) (5,110) (400)
Adjustments in Scope
Over/(under) recovery b/f from prior year 3,182 232 2,200 (691) (2,062) (1,914)
(Over)/under recovery to cfwd (232) (2,200) 691 2,062 1,914 4,781
Variance to explain (2,336) (4,230) (2,390) (4,836) (5,258) 2,467
2014 Commentary: Lower direct costs driven by lower electricity prices and lower consumption offset by (£595k) backbilling cost adjustment
2015 Commentary:
Lower direct costs driven by lower electricity prices and lower consumption offset by (£920k) backbilling cost adjustment.
2016 Commentary:
Lower direct costs driven by lower electricity prices and lower consumption offset by (£461k) backbilling cost adjustment.
2017 Commentary: Lower direct costs driven by lower electricity prices and lower consumption offset by (£654k) backbilling cost adjustment.
2018 Commentary:
Lower consumption driven by removal of NATS & APCOA from the 3rd party share
2019 Commentary:
Driven by higher year on year electricity prices offset by consumption reductions

17
Classification: Public
15. Water and sewerage
9 months 12 months 12
months 12
months 12
months 12
months
Apr to Dec Jan to Dec Jan to Dec Jan to Dec Jan to Dec Jan to Dec
2014 2015 2016 2017 2018 2019
£'000s £'000s £'000s £'000s £'000s £'000s
CAA Forecast (11/12 Prices)
Direct Costs 758 766 758 770 751
Annuity 2,877 3,658 3,517 3,390 3,280
Allocated Costs 145 177 171 166 161
Total Income to be recovered 3,781 4,602 4,447 4,327 4,192
CAA Forecast (nominal prices)
Direct Costs 820 835 840 884 892
Annuity 3,112 3,985 3,899 3,893 3,891
Allocated Costs 157 193 190 191 191
Total Income to be recovered 4,090 5,013 4,929 4,968 4,974
Prior Year Actuals (2018)
Direct Costs 1,203
Annuity 3,891
Allocated Costs 191
Total Income to be recovered 5,131
Actual (Trading Statements)
Total Income recovered 4,416 6,511 5,570 3,054 5,131 5,668
Variances (Actuals less CAA Forecast) 326 1,498 641 (1,914) 157 537
Adjustments in Scope Over/(under) recovery b/f from prior year 85 503 1,832 2,074 (59) (213)
(Over)/under recovery to cfwd (503) (1,832) (2,074) 59 213 300
Variance to explain (92) 170 399 219 311 624
2014 Commentary: Lower direct costs driven by lower prices and lower consumption.
2015 Commentary:
Higher direct costs driven by higher customer share.
2016 Commentary:
Higher direct costs driven by higher customer share.
2017 Commentary:
Higher direct costs driven by higher customer share.
2018 Commentary:
Higher direct costs driven by higher customer share.
2019 Commentary:
Higher direct costs driven by higher customer share.

18
Classification: Public
16. Bus and Coach 9 months 12 months 12 months 12 months 12 months 12 months
Apr to Dec Jan to Dec Jan to Dec Jan to Dec Jan to Dec Jan to Dec
2014 2015 2016 2017 2018 2019
£'000s £'000s £'000s £'000s £'000s £'000s
CAA Forecast (11/12 Prices)
Direct Costs 1,100 1,454 1,450 1,443 1,445
Annuity 396 503 478 445 385
Allocated Costs 180 235 231 227 219
Total Income to be recovered 1,676 2,192 2,159 2,115 2,049
CAA Forecast (nominal prices)
Direct Costs 1,190 1,584 1,607 1,657 1,714
Annuity 429 548 530 511 456
Allocated Costs 194 256 256 260 260
Total Income to be recovered 1,813 2,387 2,393 2,428 2,431
Prior Year Actuals (2018)
Direct Costs 2,487
Annuity 456
Allocated Costs 260
Total Income to be recovered 3,241
Actual (Trading Statements)
Total Income recovered 2,586 3,185 3,273 3,351 3,241 2,776
Variances (Actuals less CAA Forecast) 773 798 880 923 810 (465)
Adjustments in Scope
Over/(under) recovery b/f from prior year - 4 (355) (318) (39) (26)
(Over)/under recovery to cfwd (4) 355 318 39 26 179
Variance to explain 769 1,157 843 644 797 (311)
2014 Commentary: The Trading Statement includes notional public buses income giving 100% customer share. The CAA settlement applies 60% customer share and excludes the public buses.
2015 Commentary:
The Trading Statement includes notional public buses income giving 100% customer share. The CAA settlement applies 60% customer share and excludes the public buses.
2016 Commentary:
The Trading Statement includes notional public buses income giving 100% customer share. The CAA settlement applies 60% customer share and excludes the public buses.
2017 Commentary:
The Trading Statement includes notional public buses income giving 100% customer share. The CAA settlement applies 60% customer share and excludes the public buses.
2018 Commentary:
The Trading Statement includes notional public buses income giving 100% customer share. The CAA settlement applies 60% customer share and excludes the public buses.
2019 Commentary:
The Trading Statement includes notional public buses income giving 100% customer share. The CAA settlement applies 60% customer share and excludes the public buses.

19
Classification: Public
17. Common IT infrastructure
9 months 12 months 12 months 12 months 12 months 12 months
Apr to Dec Jan to Dec Jan to Dec Jan to Dec Jan to Dec Jan to Dec
2014 2015 2016 2017 2018 2019
£'000s £'000s £'000s £'000s £'000s £'000s
CAA Forecast (11/12 Prices)
Direct Costs 20 26 26 26 26
Annuity 248 313 301 292 280
Allocated Costs 11 14 13 13 12
Total Income to be recovered 279 353 340 331 319
CAA Forecast (nominal prices)
Direct Costs 22 29 29 30 31
Annuity 268 341 334 336 332
Allocated Costs 12 15 15 15 15
Total Income to be recovered 302 385 377 381 378
Prior Year Actuals (2018)
Direct Costs 1
Annuity 332
Allocated Costs 15
Total Income to be recovered 110
Actual (Trading Statements)
Total Income recovered 230 284 388 454 110 75
Variances (Actuals less CAA Forecast) (72) (101) 11 73 (268) (35)
Adjustments in Scope
Over/(under) recovery b/f from prior year 0 (51) (124) (28) 16 (222)
(Over)/under recovery to cfwd 51 124 28 (16) 222 504
Variance to explain (21) (27) (85) 29 (30) 247
2014 Commentary: Managed Service costs not recovered through Passive LAN.
2015 Commentary:
Managed Service costs not recovered through Passive LAN.
2016 Commentary:
Managed Service costs not recovered through Passive LAN.
2017 Commentary:
More ports installed
2018 Commentary:
Variance in recovery between Active & Passive Lan
2019 Commentary:
Variance in recovery between Active & Passive Lan

20
Classification: Public
18. Airline Operators Committee (AOC)
9 months 12 months 12 months 12 months 12 months 12 months
Apr to Dec Jan to Dec Jan to Dec Jan to Dec Jan to Dec Jan to Dec
2014 2015 2016 2017 2018 2019
£'000s £'000s £'000s £'000s £'000s £'000s
CAA Forecast (11/12 Prices)
Direct Costs 277 361 358 358 358
Annuity 0 0 0 0 0
Allocated Costs 33 43 43 43 43
Total Income to be recovered 310 404 401 401 401
CAA Forecast (nominal prices)
Direct Costs 300 393 397 411 425
Annuity 0 0 0 0 0
Allocated Costs 36 47 48 49 51
Total Income to be recovered 336 440 444 460 476
Prior Year Actuals (2018)
Direct Costs 774
Annuity 0
Allocated Costs 51
Total Income to be recovered 1,015
Actual (Trading Statements)
Total Income recovered 389 482 519 513 1,015 734
Variances (Actuals less CAA Forecast) 53 42 75 53 539 (281)
Adjustments in Scope
Over/(under) recovery b/f from prior year - (6) (27) 7 (135) 55
(Over)/under recovery to cfwd 6 27 (7) 135 (55) (92)
Variance to explain 59 63 41 195 349 (318)
2014 Commentary:
Driven by higher rent costs.
2015 Commentary:
Driven by higher rent costs.
2016 Commentary:
Driven by higher rent costs.
2017 Commentary:
Driven by increased scope and resource
2018 Commentary:
Driven by increased scope and resource
2019 Commentary:
Driven by increased scope and resource