Embed Size (px)
Citation preview
ACTIVITY REPORT – MOUNTAIN PASS MINE
September 2008 Dr. Erik Melchiorre, Geology Department, California State University San Bernardino, 5500 University Parkway, San Bernardino, CA 92407 Year 3: groundwater isotope geochemistry INTRODUCTION Our research group has successfully completed our third and final full year of our research on fluid flow controls and chemistry at Mountain Pass, California. Our fieldwork has consisted of many visits to the site by the principal investigator and students, and a major project in which a geology student participated in the research as part of their second year in the prestigious McNair Scholar program. We have analyzed 28 water samples from 11 regional springs, 31 water samples from wells on the Mountain Pass property, and 12 water samples from the main pit well. This new geochemical data is presented here, with interpretation. METHODS Isotope samples were collected in a borosilicate glass bottle with a polyseal cap. Water samples were prepared for isotope analyses using the standard CO2 equilibration method for oxygen isotopes (Epstein and Mayeda, 1953), and by hydrogen gas equilibration for hydrogen isotopes (e.g., Horita, 1988). Isotope values were measured using an automated sample equilibrator interfaced with a Finnigan Delta Plus Advantage gas ratio mass spectrometer at California State University, San Bernardino. Results are reported in the usual δ notation relative to Vienna Standard Mean Ocean Water (VSMOW) (Coplan, 1995). Laboratory precision is ±0.09‰ for oxygen and ±1.2‰ for hydrogen isotope values, based on duplicate analyses of internal laboratory standards.

RESULTS OF SPRING WATER ANALYSES Samples of spring water were collected from 11 sites in the Mountain Pass region, and analyzed for oxygen and hydrogen stable isotope values (Table 1). Sampling was performed early in the morning to minimize evaporative concentration. Not all sites are perennial, and one site (Whiskey Spring) may only flow directly after precipitation events. On some dates, access to spring sites was not possible. Isotope values of regional spring water is seasonally variable (Table 1). This variation is consistent with observations of springs around the world (e.g., Criss et al., 2001; Winston and Criss, 2004), and suggestive of rapid flow within karst (Frederickson and Criss, 1999). To compensate for the effect of seasonal variation, the average δ18O value for each spring is used in the following figures. It is known that waters from the Mojave Desert of southeastern California have apparent deuterium depletion, relative to meteoric waters (Friedman et al., 1992). There is also greater error in measurement of deuterium in water. For these reasons, we choose to examine the relationship between average oxygen isotope values of regional spring waters vs. elevation, but not for hydrogen isotopes.
Elevation Elevation 09/15/07 09/15/07 02/23/08 02/23/08 05/24/08 05/24/08 AVE AVE
Site (feet) (meters) δ18O
(VSMOW) δD
(VSMOW) δ18O
(VSMOW) δD
(VSMOW) δ18O
(VSMOW) δD
(VSMOW) δ18O
(VSMOW) δD
(VSMOW)
Bull Spring 3957 1206 -9.41 -85.8 -9.28 -83.2 -9.35 -84.2 -9.3 -84
Groaner Spring 4872 1485 -10.23 -88.3 -9.83 -86.7 -9.72 -85.3 -9.9 -87
Hardrock Queen Spring 4826 1471 -10.11 -88.9 -9.67 -83.8 -9.74 -86.0 -9.8 -86
Ivanpah Spring 4190 1277
no access
no access -9.40 -81.9 -9.53 -83.4 -9.5 -83
Willow Spring 4291 1308 -9.85 -85.2 -9.43 -81.5 -9.56 -82.0 -9.6 -83
Whiskey Spring 4186 1276 dry dry -9.45 -85.2 dry dry -9.5 -85
Pachalka Spring 4895 1492 -10.01 -88.4 -9.75 -83.8 -9.64 -82.7 -9.8 -85
Wheaton Spring 4157 1267
no access
no access -9.36 -85.1 -9.32 -82.6 -9.3 -84
China Spring 4780 1457 -10.38 -89.2 -9.59 -83.3 -9.61 -83.0 -9.9 -85
Whitfield Spring 5046 1538 -11.27 -91.5 -9.64 -84.7 -9.67 -83.4 -10.2 -87 Unnamed Spring, Wheaton Wash 4352 1327 dry dry -9.55 -76.8 -9.39 -89.6 -9.5 -83
Table 1. Data for spring water sampling.

Correlation of δ18O values of regional spring waters with elevation shows a decrease of –0.70‰ per 1000 feet of elevation (Figure 1). This is strikingly similar to the documented decrease of –0.70‰ per 1000 feet of elevation in the Sierra Nevada of northern California (Rose et al., 1996), and the measured decrease of –0.68‰ per 1000 feet of elevation in the Coast Ranges of central California (Melchiorre et al., 1999).
Figure 1. Plot of spring water average δ18O(VSMOW) vs. elevation (feet) for all regional spring sites. Significantly, this observed relationship is similar to the best-fit regression to data from Friedman et al., 1992 (Figure 2). The difference between the regression lines of these two data sets is most likely an artifact of the small sample size for our data (n=11) and the Friedman et al. (1992) data for the region (n=5). Never the less, the observed relationship between δ18O values of regional spring waters with elevation is supported by published data for the region, and state.
Figure 2. Plot of spring water average δ18O(VSMOW) vs. elevation (feet) for regional spring sites from Friedman et al., 1992. Best fit (solid) is for Friedman data, while dashed line shows best fit to spring data for this report (figure 1).
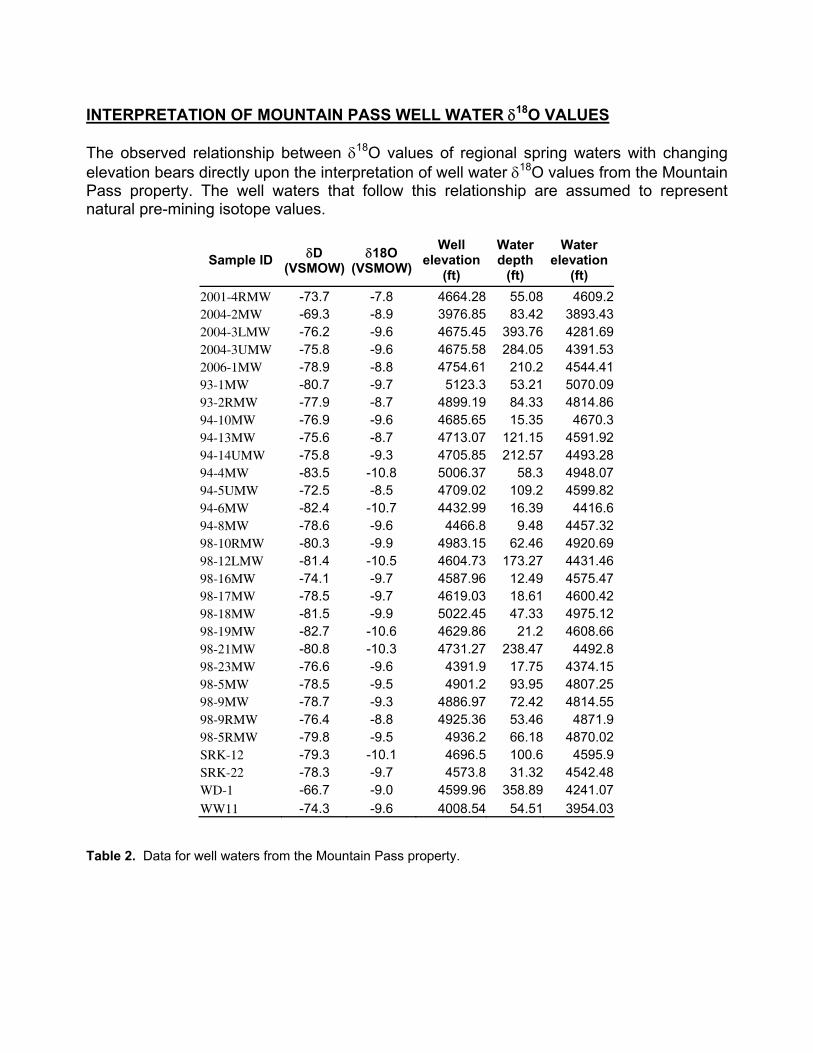
INTERPRETATION OF MOUNTAIN PASS WELL WATER δ18O VALUES The observed relationship between δ18O values of regional spring waters with changing elevation bears directly upon the interpretation of well water δ18O values from the Mountain Pass property. The well waters that follow this relationship are assumed to represent natural pre-mining isotope values.
Sample ID δD (VSMOW)
δ18O (VSMOW)
Well elevation
(ft)
Water depth
(ft)
Water elevation
(ft) 2001-4RMW -73.7 -7.8 4664.28 55.08 4609.2 2004-2MW -69.3 -8.9 3976.85 83.42 3893.43 2004-3LMW -76.2 -9.6 4675.45 393.76 4281.69 2004-3UMW -75.8 -9.6 4675.58 284.05 4391.53 2006-1MW -78.9 -8.8 4754.61 210.2 4544.41 93-1MW -80.7 -9.7 5123.3 53.21 5070.09 93-2RMW -77.9 -8.7 4899.19 84.33 4814.86 94-10MW -76.9 -9.6 4685.65 15.35 4670.3 94-13MW -75.6 -8.7 4713.07 121.15 4591.92 94-14UMW -75.8 -9.3 4705.85 212.57 4493.28 94-4MW -83.5 -10.8 5006.37 58.3 4948.07 94-5UMW -72.5 -8.5 4709.02 109.2 4599.82 94-6MW -82.4 -10.7 4432.99 16.39 4416.6 94-8MW -78.6 -9.6 4466.8 9.48 4457.32 98-10RMW -80.3 -9.9 4983.15 62.46 4920.69 98-12LMW -81.4 -10.5 4604.73 173.27 4431.46 98-16MW -74.1 -9.7 4587.96 12.49 4575.47 98-17MW -78.5 -9.7 4619.03 18.61 4600.42 98-18MW -81.5 -9.9 5022.45 47.33 4975.12 98-19MW -82.7 -10.6 4629.86 21.2 4608.66 98-21MW -80.8 -10.3 4731.27 238.47 4492.8 98-23MW -76.6 -9.6 4391.9 17.75 4374.15 98-5MW -78.5 -9.5 4901.2 93.95 4807.25 98-9MW -78.7 -9.3 4886.97 72.42 4814.55 98-9RMW -76.4 -8.8 4925.36 53.46 4871.9 98-5RMW -79.8 -9.5 4936.2 66.18 4870.02 SRK-12 -79.3 -10.1 4696.5 100.6 4595.9 SRK-22 -78.3 -9.7 4573.8 31.32 4542.48 WD-1 -66.7 -9.0 4599.96 358.89 4241.07 WW11 -74.3 -9.6 4008.54 54.51 3954.03
Table 2. Data for well waters from the Mountain Pass property.
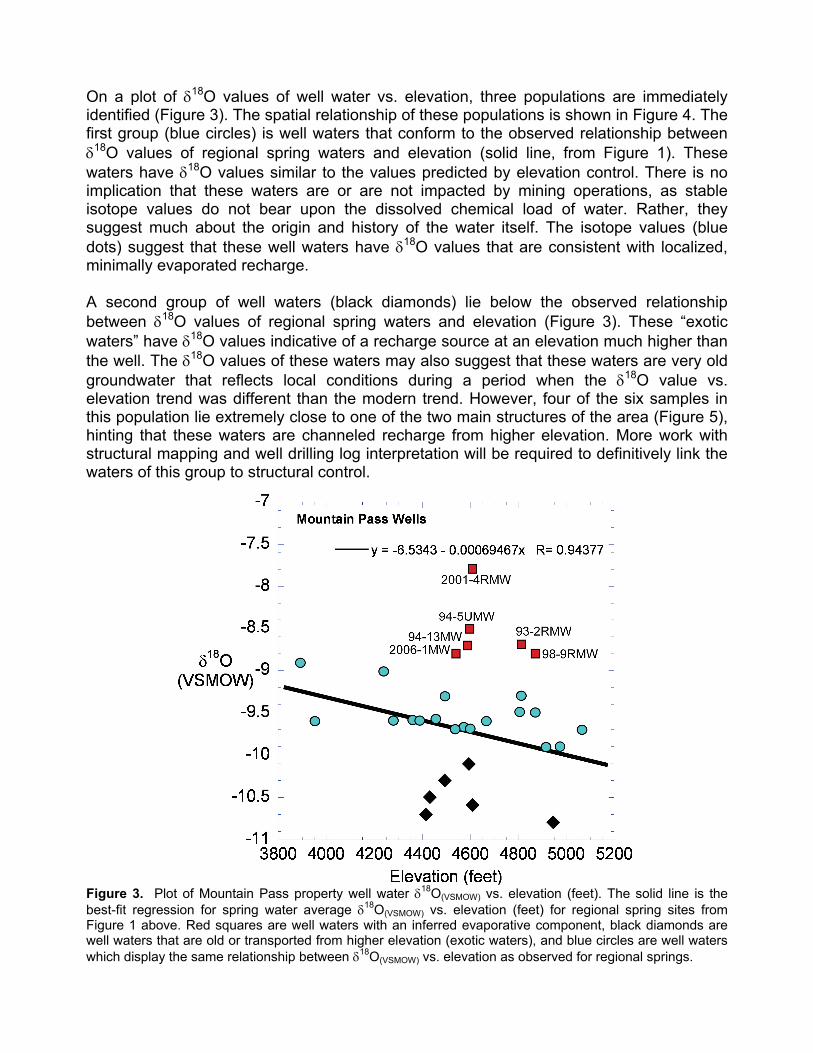
On a plot of δ18O values of well water vs. elevation, three populations are immediately identified (Figure 3). The spatial relationship of these populations is shown in Figure 4. The first group (blue circles) is well waters that conform to the observed relationship between δ18O values of regional spring waters and elevation (solid line, from Figure 1). These waters have δ18O values similar to the values predicted by elevation control. There is no implication that these waters are or are not impacted by mining operations, as stable isotope values do not bear upon the dissolved chemical load of water. Rather, they suggest much about the origin and history of the water itself. The isotope values (blue dots) suggest that these well waters have δ18O values that are consistent with localized, minimally evaporated recharge. A second group of well waters (black diamonds) lie below the observed relationship between δ18O values of regional spring waters and elevation (Figure 3). These “exotic waters” have δ18O values indicative of a recharge source at an elevation much higher than the well. The δ18O values of these waters may also suggest that these waters are very old groundwater that reflects local conditions during a period when the δ18O value vs. elevation trend was different than the modern trend. However, four of the six samples in this population lie extremely close to one of the two main structures of the area (Figure 5), hinting that these waters are channeled recharge from higher elevation. More work with structural mapping and well drilling log interpretation will be required to definitively link the waters of this group to structural control.
Figure 3. Plot of Mountain Pass property well water δ18O(VSMOW) vs. elevation (feet). The solid line is the best-fit regression for spring water average δ18O(VSMOW) vs. elevation (feet) for regional spring sites from Figure 1 above. Red squares are well waters with an inferred evaporative component, black diamonds are well waters that are old or transported from higher elevation (exotic waters), and blue circles are well waters which display the same relationship between δ18O(VSMOW) vs. elevation as observed for regional springs.
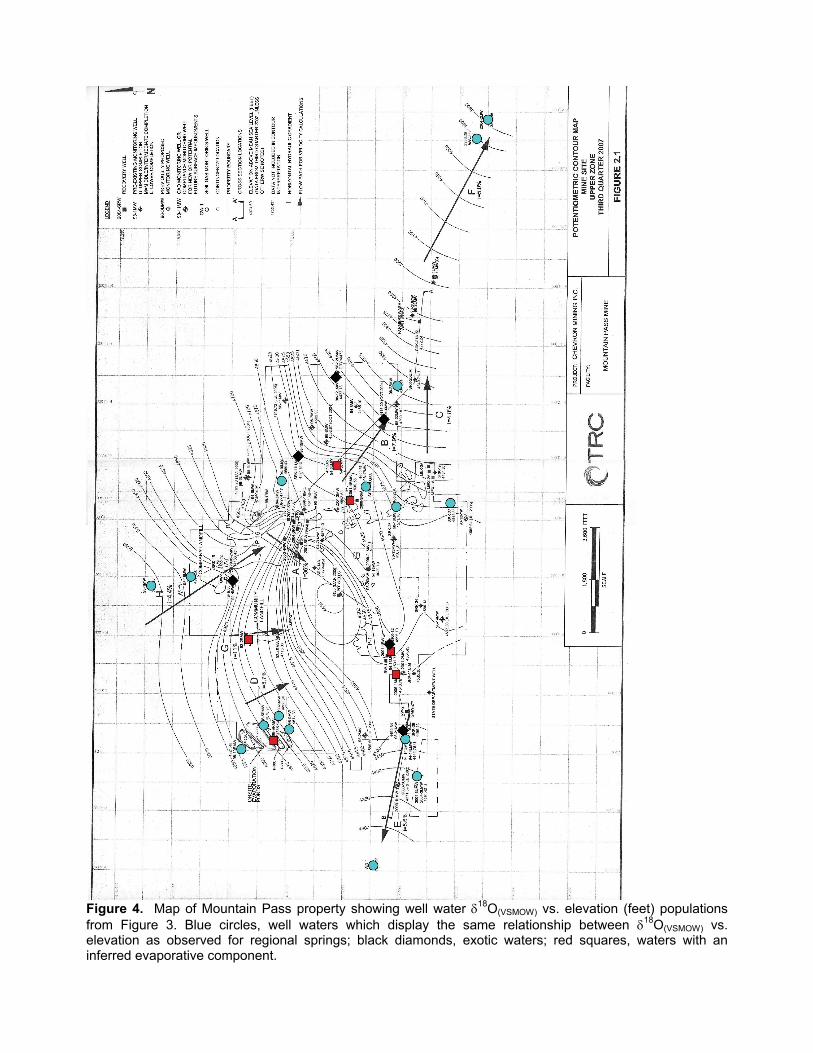
Figure 4. Map of Mountain Pass property showing well water δ18O(VSMOW) vs. elevation (feet) populations from Figure 3. Blue circles, well waters which display the same relationship between δ18O(VSMOW) vs. elevation as observed for regional springs; black diamonds, exotic waters; red squares, waters with an inferred evaporative component.
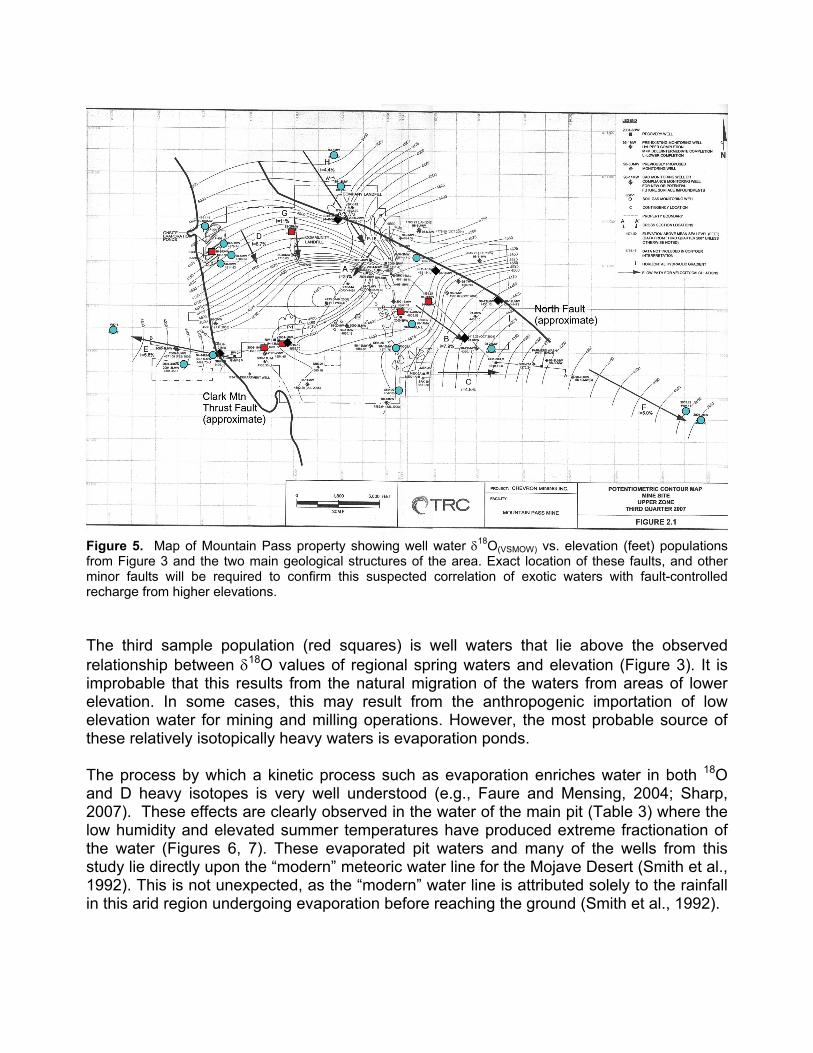
Figure 5. Map of Mountain Pass property showing well water δ18O(VSMOW) vs. elevation (feet) populations from Figure 3 and the two main geological structures of the area. Exact location of these faults, and other minor faults will be required to confirm this suspected correlation of exotic waters with fault-controlled recharge from higher elevations. The third sample population (red squares) is well waters that lie above the observed relationship between δ18O values of regional spring waters and elevation (Figure 3). It is improbable that this results from the natural migration of the waters from areas of lower elevation. In some cases, this may result from the anthropogenic importation of low elevation water for mining and milling operations. However, the most probable source of these relatively isotopically heavy waters is evaporation ponds. The process by which a kinetic process such as evaporation enriches water in both 18O and D heavy isotopes is very well understood (e.g., Faure and Mensing, 2004; Sharp, 2007). These effects are clearly observed in the water of the main pit (Table 3) where the low humidity and elevated summer temperatures have produced extreme fractionation of the water (Figures 6, 7). These evaporated pit waters and many of the wells from this study lie directly upon the “modern” meteoric water line for the Mojave Desert (Smith et al., 1992). This is not unexpected, as the “modern” water line is attributed solely to the rainfall in this arid region undergoing evaporation before reaching the ground (Smith et al., 1992).

Sample # Date δD
(VSMOW) δ18O
(VSMOW)
1 10/01/05 -5.71 -61.2 2 10/10/05 -5.65 -60.8 3 10/18/05 -5.75 -62.6 4 10/20/05 -5.82 -62.3 5 10/22/05 -6.13 -63.8 6 10/24/05 -5.94 -62.1 7 10/26/05 -5.98 -62.1 8 11/01/05 -5.74 -61.6 9 11/07/05 -5.80 -62.5 10 11/14/05 -5.72 -62.1 11 11/28/05 -5.64 -61.5 12 12/16/05 -5.59 -61.1
Table 3. Isotope data for pit water, Mountain Pass Mine.
Figure 6. δD vs. δ18O plot for Mountain Pass pit water (red circles), well waters (blue squares), and regional springs (light blue triangles) showing strong deviation from the global meteoric water line of Craig, 1961(solid line). Well waters are close to the modern regional meteoric water lines of Smith et al., 1992 (dashed line).
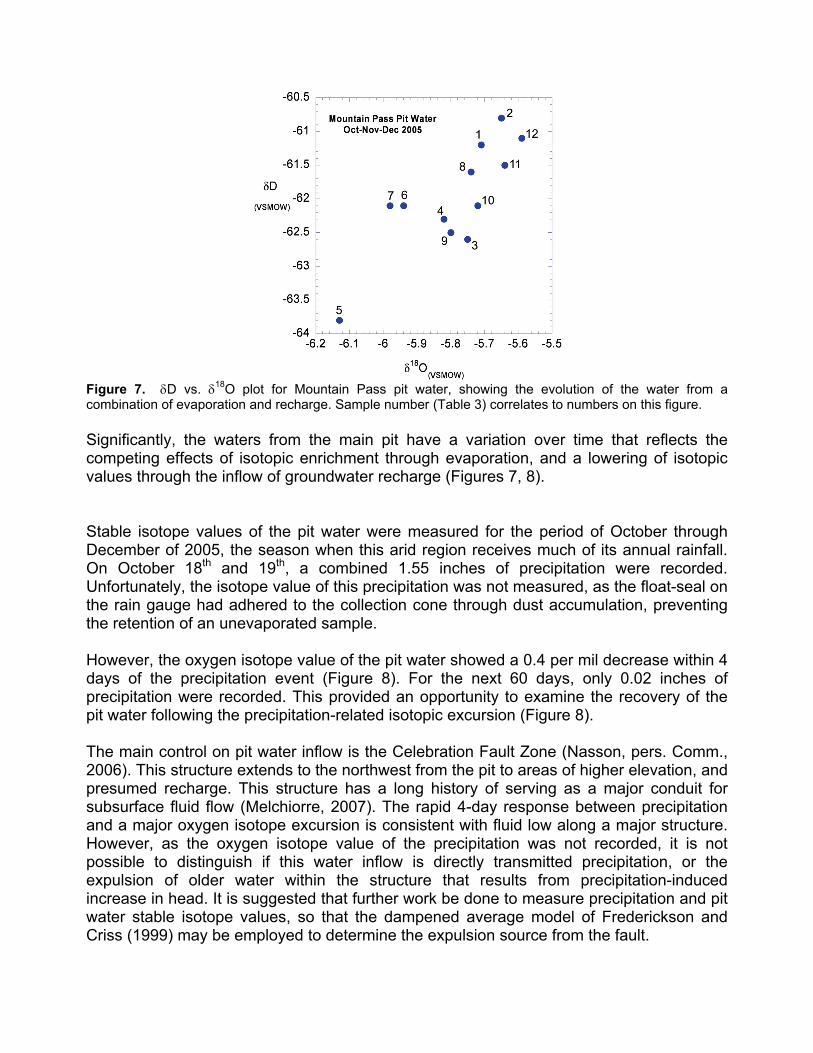
Figure 7. δD vs. δ18O plot for Mountain Pass pit water, showing the evolution of the water from a combination of evaporation and recharge. Sample number (Table 3) correlates to numbers on this figure. Significantly, the waters from the main pit have a variation over time that reflects the competing effects of isotopic enrichment through evaporation, and a lowering of isotopic values through the inflow of groundwater recharge (Figures 7, 8). Stable isotope values of the pit water were measured for the period of October through December of 2005, the season when this arid region receives much of its annual rainfall. On October 18th and 19th, a combined 1.55 inches of precipitation were recorded. Unfortunately, the isotope value of this precipitation was not measured, as the float-seal on the rain gauge had adhered to the collection cone through dust accumulation, preventing the retention of an unevaporated sample. However, the oxygen isotope value of the pit water showed a 0.4 per mil decrease within 4 days of the precipitation event (Figure 8). For the next 60 days, only 0.02 inches of precipitation were recorded. This provided an opportunity to examine the recovery of the pit water following the precipitation-related isotopic excursion (Figure 8). The main control on pit water inflow is the Celebration Fault Zone (Nasson, pers. Comm., 2006). This structure extends to the northwest from the pit to areas of higher elevation, and presumed recharge. This structure has a long history of serving as a major conduit for subsurface fluid flow (Melchiorre, 2007). The rapid 4-day response between precipitation and a major oxygen isotope excursion is consistent with fluid low along a major structure. However, as the oxygen isotope value of the precipitation was not recorded, it is not possible to distinguish if this water inflow is directly transmitted precipitation, or the expulsion of older water within the structure that results from precipitation-induced increase in head. It is suggested that further work be done to measure precipitation and pit water stable isotope values, so that the dampened average model of Frederickson and Criss (1999) may be employed to determine the expulsion source from the fault.
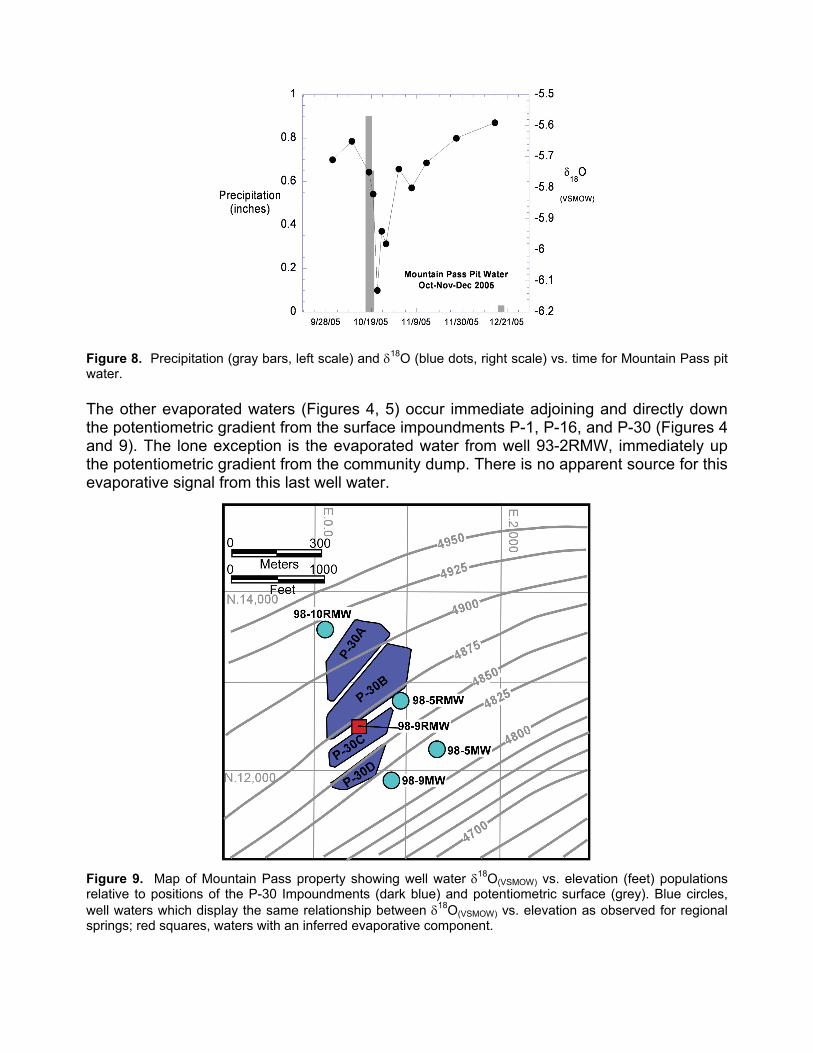
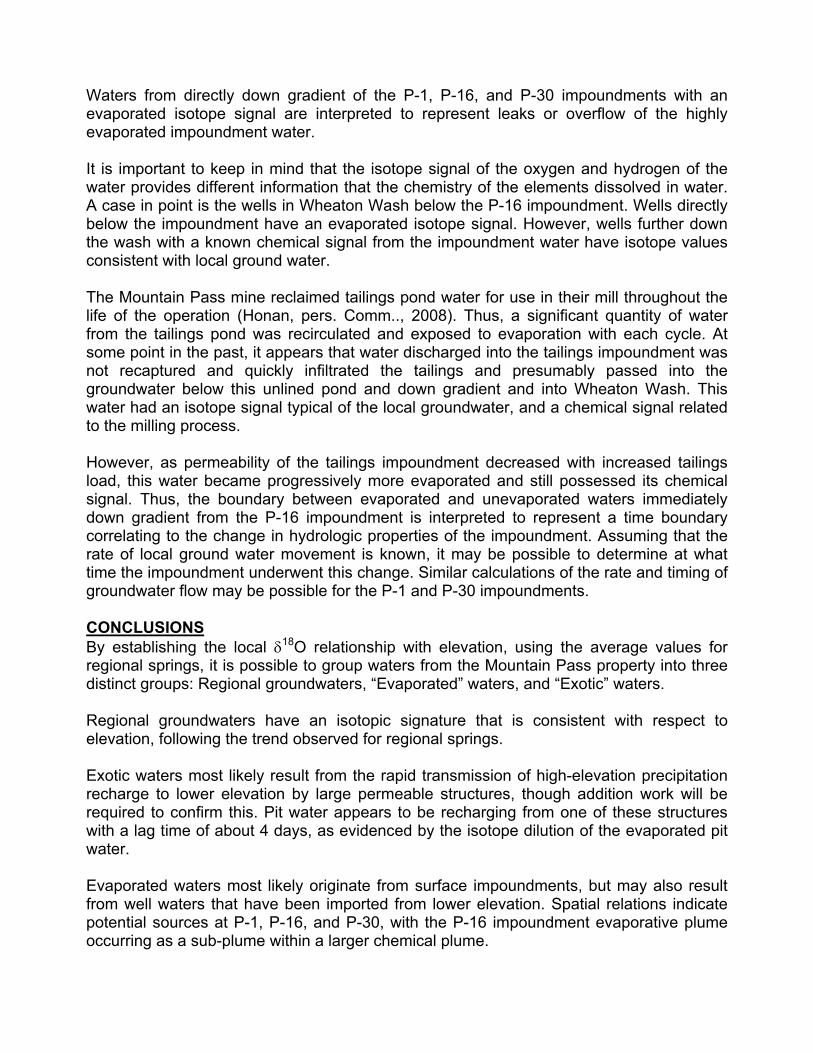
Figure 8. Precipitation (gray bars, left scale) and δ18O (blue dots, right scale) vs. time for Mountain Pass pit water. The other evaporated waters (Figures 4, 5) occur immediate adjoining and directly down the potentiometric gradient from the surface impoundments P-1, P-16, and P-30 (Figures 4 and 9). The lone exception is the evaporated water from well 93-2RMW, immediately up the potentiometric gradient from the community dump. There is no apparent source for this evaporative signal from this last well water.
Figure 9. Map of Mountain Pass property showing well water δ18O(VSMOW) vs. elevation (feet) populations relative to positions of the P-30 Impoundments (dark blue) and potentiometric surface (grey). Blue circles, well waters which display the same relationship between δ18O(VSMOW) vs. elevation as observed for regional springs; red squares, waters with an inferred evaporative component.
Waters from directly down gradient of the P-1, P-16, and P-30 impoundments with an evaporated isotope signal are interpreted to represent leaks or overflow of the highly evaporated impoundment water. It is important to keep in mind that the isotope signal of the oxygen and hydrogen of the water provides different information that the chemistry of the elements dissolved in water. A case in point is the wells in Wheaton Wash below the P-16 impoundment. Wells directly below the impoundment have an evaporated isotope signal. However, wells further down the wash with a known chemical signal from the impoundment water have isotope values consistent with local ground water. The Mountain Pass mine reclaimed tailings pond water for use in their mill throughout the life of the operation (Honan, pers. Comm.., 2008). Thus, a significant quantity of water from the tailings pond was recirculated and exposed to evaporation with each cycle. At some point in the past, it appears that water discharged into the tailings impoundment was not recaptured and quickly infiltrated the tailings and presumably passed into the groundwater below this unlined pond and down gradient and into Wheaton Wash. This water had an isotope signal typical of the local groundwater, and a chemical signal related to the milling process. However, as permeability of the tailings impoundment decreased with increased tailings load, this water became progressively more evaporated and still possessed its chemical signal. Thus, the boundary between evaporated and unevaporated waters immediately down gradient from the P-16 impoundment is interpreted to represent a time boundary correlating to the change in hydrologic properties of the impoundment. Assuming that the rate of local ground water movement is known, it may be possible to determine at what time the impoundment underwent this change. Similar calculations of the rate and timing of groundwater flow may be possible for the P-1 and P-30 impoundments. CONCLUSIONS By establishing the local δ18O relationship with elevation, using the average values for regional springs, it is possible to group waters from the Mountain Pass property into three distinct groups: Regional groundwaters, “Evaporated” waters, and “Exotic” waters. Regional groundwaters have an isotopic signature that is consistent with respect to elevation, following the trend observed for regional springs. Exotic waters most likely result from the rapid transmission of high-elevation precipitation recharge to lower elevation by large permeable structures, though addition work will be required to confirm this. Pit water appears to be recharging from one of these structures with a lag time of about 4 days, as evidenced by the isotope dilution of the evaporated pit water. Evaporated waters most likely originate from surface impoundments, but may also result from well waters that have been imported from lower elevation. Spatial relations indicate potential sources at P-1, P-16, and P-30, with the P-16 impoundment evaporative plume occurring as a sub-plume within a larger chemical plume.
REFERENCES Coplen, T.B., 1995, Discontinuance of SMOW and PDB. Nature v. 375, p. 285. Craig, H., 1961, Isotopic variations in meteoric waters: Science, v. 133, p. 1702-1703. Criss, R.E. Fernandes, S.A. and Winston, W.E., 2001, Isotopic, geochemical and biological tracing of the source of an impacted karst spring, Weldon Spring, Missouri: Environmental Forensics, v. 2, p. 99-103. Epstein, S. and Mayeda, T., 1953, Variation of 18O content of waters from natural sources: Geochim. Cosmochim. Acta, v. 4, p. 213-224. Faure, G. and Mensing, T.M., 2004, Isotopes: Principles and Applications, 3rd Edition: John Wiley, New York, NY, 928 pages. Frederickson, G.C. and Criss, R.E., 1999, Isotope hydrology and time constants of the unimpounded Meramec River basin, Missouri. Chemical Geology, v. 157, p. 303-317. Friedman, I. Smith, G.I. Gleason, J.D. Warden, A. and Harris, J.M. 1992, Stable isotope composition of waters in Southeastern California 1. Modern precipitation: Journal of Geophysical Research, v. 97, p. 5795-5812. Horita, J., 1988, Hydrogen isotope analysis of natural waters using an H2-water equilibration method; a special implication to brines: Chemical Geology, v. 72, p. 89-94. Melchiorre, E. B. Criss, R. E. and Davisson, M. L., 1999, Relationship between seismicity and subsurface fluids, central Coast Ranges, California: Journal of Geophysical Research, v. 104, no. B-1 , p 921-939. Melchiorre, E.B., 2007, Paleo-groundwater chemistry from fault zone calcites: Unpublished report, Lahontan Water District, 18 pages. Rose, T.P., Davisson, M.L., and Criss, R.E., 1996, Isotope hydrology of voluminous cold springs in fractured rocks from an active volcanic region, northeastern California, Journal of Hydrology, v. 179, p. 207-236. Sharp, Z., 2007, Principles of Stable Isotope Geochemistry, 1st Edition: Pearson Prentice Hall, New York, NY, 334 pages. Smith, G.I. Friedman, I. Gleason, J.D. and Warden, A. 1992, Stable isotope composition of waters in Southeastern California 2. Groundwaters and their relation to modern precipitation: Journal of Geophysical Research, v. 97, p. 5813-5823. Winston, W.E. and Criss, R.E., 2004, Dynamic hydrologic and geochemical response in a perennial karst spring, Water Resources Research , v. 40, 11p.
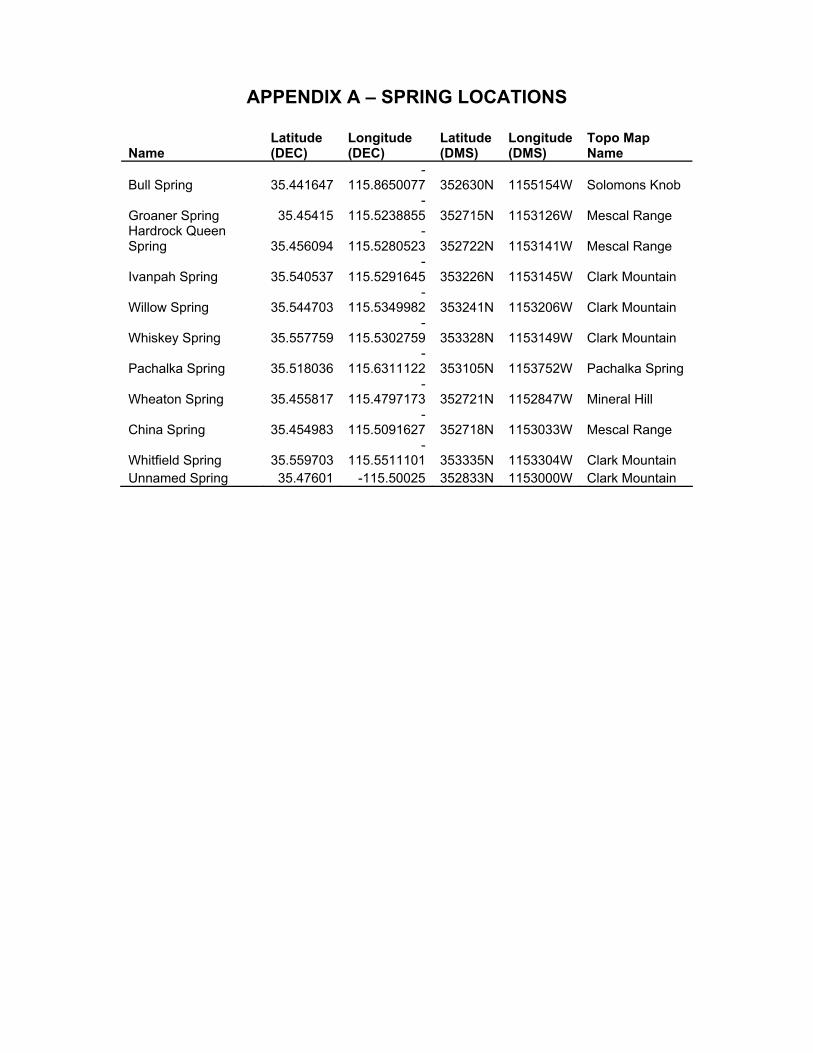
APPENDIX A – SPRING LOCATIONS
Name Latitude (DEC)
Longitude (DEC)
Latitude (DMS)
Longitude (DMS)
Topo Map Name
Bull Spring 35.441647-
115.8650077 352630N 1155154W Solomons Knob
Groaner Spring 35.45415-
115.5238855 352715N 1153126W Mescal Range Hardrock Queen Spring 35.456094
-115.5280523 352722N 1153141W Mescal Range
Ivanpah Spring 35.540537-
115.5291645 353226N 1153145W Clark Mountain
Willow Spring 35.544703-
115.5349982 353241N 1153206W Clark Mountain
Whiskey Spring 35.557759-
115.5302759 353328N 1153149W Clark Mountain
Pachalka Spring 35.518036-
115.6311122 353105N 1153752W Pachalka Spring
Wheaton Spring 35.455817-
115.4797173 352721N 1152847W Mineral Hill
China Spring 35.454983-
115.5091627 352718N 1153033W Mescal Range
Whitfield Spring 35.559703-
115.5511101 353335N 1153304W Clark Mountain Unnamed Spring 35.47601 -115.50025 352833N 1153000W Clark Mountain