Embed Size (px)
Citation preview
International Air Transport Association 800 Place Victoria, B.P. 113 Montreal, Quebec Canada H4Z 1M1 Tel: +1 (514) 874 0202 Fax: +1 (514) 874 2662 www.iata.org
Activity Forecasts for the Period 2010-2011 to 2015-2016 AIRSERVICES AUSTRALIA Final Report 13 October 2010
Activity Forecasts for the Period 2010-2011 to 2015-2016 FINAL REPORT Page 2 Airservices Australia
Preface Airservices Australia (ASA) commissioned the International Air Transport Association (IATA) to undertake this study.
This final report presents the primary assumptions considered by IATA Consulting and provides results for the main activity forecasts.
For more information about this report or IATA please contact:
Laurent Delarue [email protected] International Air Transport Association 800 square Victoria, PO Box 113 Montreal Canada H4Z1M1 DISCLAIMER. IATA Consulting has prepared this report for the sole purpose of advising Airservices Australia on Australia’s growth in aviation activity from the present to 2015-2016. IATA Consulting is not hereby making any binding recommendations regarding the pricing of Airservices Australia’s airways services. This report is not intended to serve as the only basis for any decisions that Airservices Australia may make with respect to the subjects covered in this report. Rather, this report should be considered in conjunction with all other information available to you, our valued customer. This report is based on information provided by Airservices Australia, its respective advisers and representatives, and selected third parties; it is limited in scope and content by the nature and quality of such information and the time available for the analysis. IATA Consulting has undertaken limited independent investigation of the factual or substantive accuracy or validity of such information. IATA Consulting makes no representations, warranties or other assurances, express or implied, about the accuracy of the information contained herein. The analysis and conclusions contained herein are based on many things, including certain assumptions and the analysis of Airservices Australia management of certain information available at the time this report was prepared. The estimates, assumptions and findings underlying the conclusions are inherently subject to significant economic and competitive uncertainties and contingencies, many of which are beyond the control of Airservices Australia. IATA Consulting makes no representations, warranties or other assurances, express or implied, that any of such conclusions will be realized. IATA Consulting has undertaken the preparation of this report and the analysis contained herein solely at the request of Airservices Australia pursuant to IATA Consulting’s agreement for consulting services dated July, 15th 2010 between IATA and Airservices Australia. This report is provided exclusively for the information of the senior management and key stakeholders of Airservices Australia and its representatives. Neither this report nor any information contained herein may be disclosed or furnished (in whole or in part) to any other person or entity, or quoted or referred to (in whole or in part) in any document or communication without IATA’s prior consent. Nothing may be inferred beyond the matters expressly stated in this report. This report is provided as of the date hereof and IATA Consulting undertakes no, and disclaims any, obligation to advise Airservices Australia of any change in any information set forth herein occurring after the date hereof.
Activity Forecasts for the Period 2010-2011 to 2015-2016 FINAL REPORT Page 3 Airservices Australia
Table of content Preface....................................................................................................................................... 2
Table of content ........................................................................................................................ 3
List of tables.............................................................................................................................. 4
1. Executive Summary ....................................................................................................... 6
2. Introduction .................................................................................................................. 10
3. Aviation context ........................................................................................................... 14
4. Economic Outlook........................................................................................................ 18
5. Major Domestic En-Route Forecast ............................................................................. 22
6. Major International En-Route Forecast ........................................................................ 34
7. Regional Domestic En-Route Forecast ........................................................................ 45
8. Regional International En-route forecast ..................................................................... 52
9. Other En-route forecasts............................................................................................... 53
10. Major Airports Forecasts.............................................................................................. 59
11. Regional Airports Forecasts ......................................................................................... 64
Appendices - Major Airports Individual Forecasts................................................................. 67
Activity Forecasts for the Period 2010-2011 to 2015-2016 FINAL REPORT Page 4 Airservices Australia
List of tables Table 1 - Forecasts of Annual Growth in En-route Aviation Activity (in MTOW-km) ........................ 8 Table 2 - Forecasts of Annual Growth in Terminal Activity (in MTOW landed) ................................. 9 Table 3— Relative size of En-route Markets, Fiscal Year Ending June 2010......................................10 Table 4 – Monthly passenger and freight development (in RPK and FTK) – May 2005 to July 2010 15 Table 5 – Passenger, freight and capacity growth by region (in RPK, FTK, ASK and ATK) and
passenger load factors by region – June 2009 to June 2010 and January to June 2010 ...............16 Table 6 – IATA airlines’ profitability forecasts per region ..................................................................16 Table 7 - Average Real GDP Growth Rates during Previous Decades (% per annum)........................20 Table 8 — Recent and Forecast Annual Real GDP Growth Rates (%) ................................................20 Table 9 - Quarterly Real GDP Growth Rates from Previous Quarter (%)............................................21 Table 10 — Economic Growth Forecasts Used in Traffic Forecasts (%).............................................21 Table 11 – Comparison of the actual and predicted Passenger-km Major Domestic Airline traffic ....23 Table 12 – Annual Growth in GDP and Passenger-km ........................................................................24 Table 13 — Forecasts of Real GDP, Fares and Major Domestic Passenger-Km .................................25 Table 14 - Assumptions for Future Average Load Factors and Aircraft Size for Major Domestic Air
Services ........................................................................................................................................26 Table 15 – Actual and forecasted load factors – Major Domestic Airlines ........................................27 Table 16 – Actual and forecasted average aircraft size – Major Domestic Airlines.............................27 Table 17 — Fleet size forecast Qantas Group – Domestic operations..................................................29 Table 18 — Fleet size forecast Virgin Blue – Domestic operations.....................................................30 Table 19 — Fleet size forecast Tiger Airways Australia – Domestic operations .................................31 Table 20 — Total Aircraft distance traveled according to BITRE and ASA – Major Domestic En-
Route operations...........................................................................................................................32 Table 21 — Aircraft distance and MTOW-km for aircraft above 20 tonnes – Major Domestic Airlines
......................................................................................................................................................32 Table 22 - Forecast of Major Domestic Airline En-route Traffic .........................................................33 Table 23 - Forecast of Major International Passenger Demand............................................................35 Table 24 - Assumptions for Future Average Load Factors and Aircraft Size for Major International
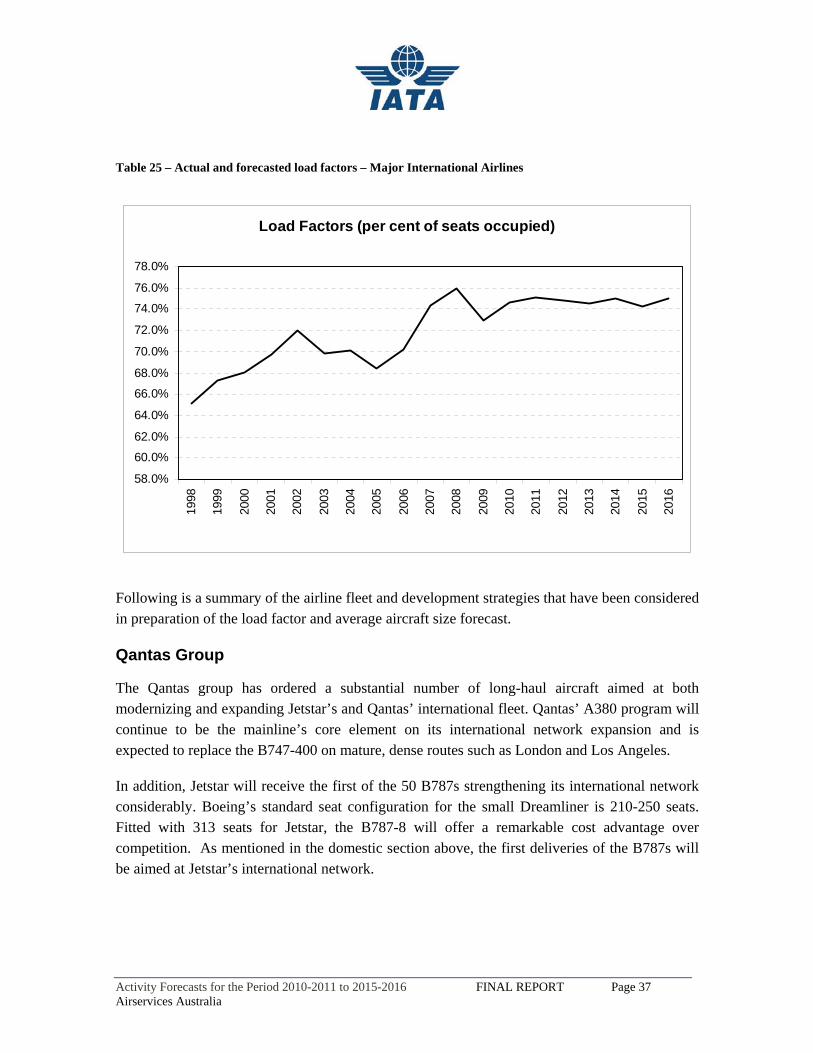
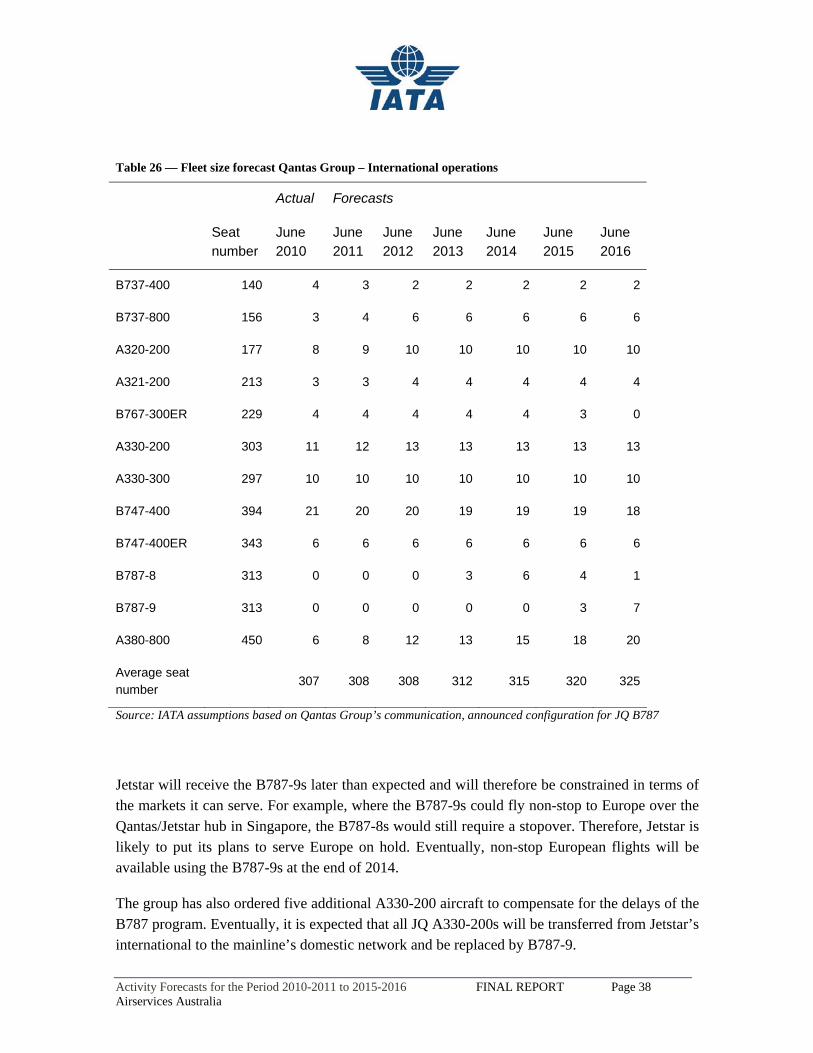
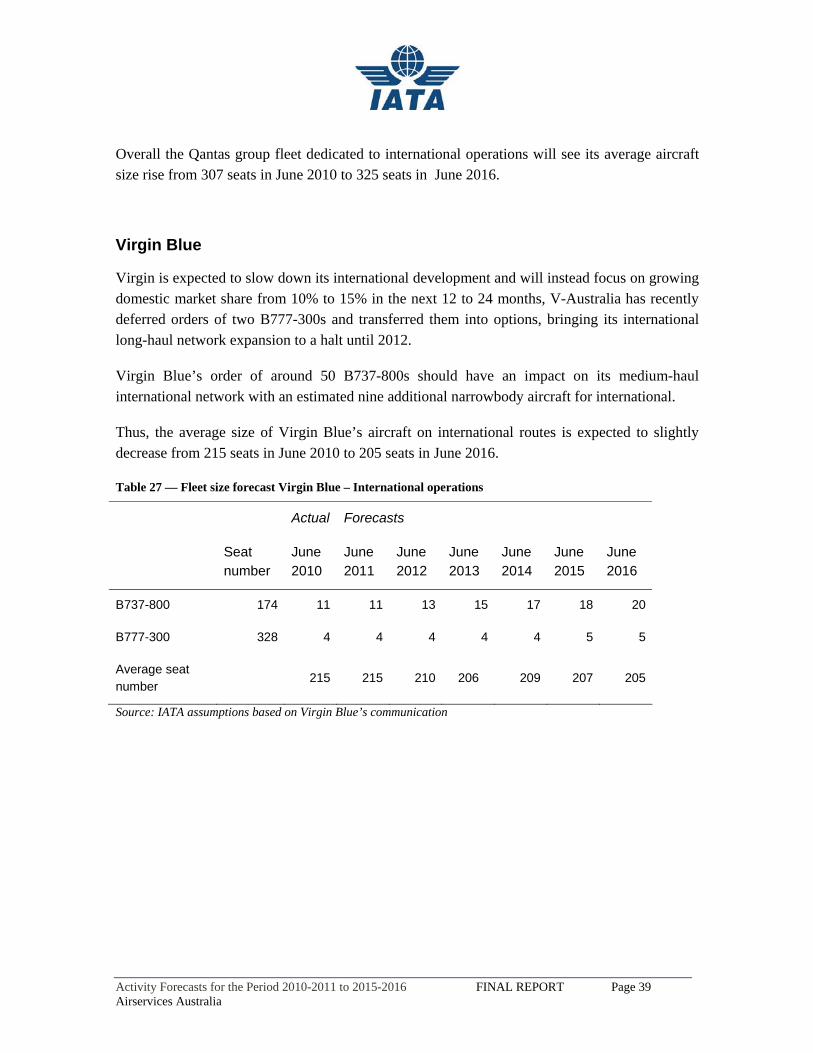
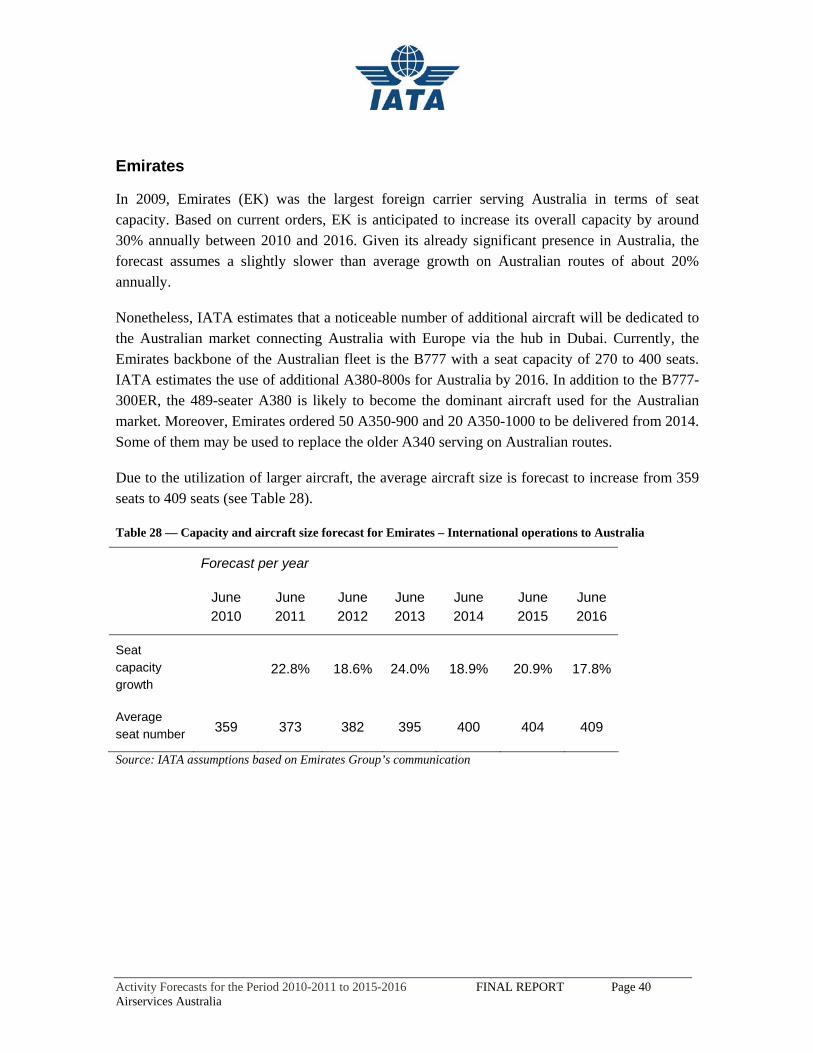
Air Services ..................................................................................................................................36 Table 25 – Actual and forecasted load factors – Major International Airlines .....................................37 Table 26 — Fleet size forecast Qantas Group – International operations ............................................38 Table 27 — Fleet size forecast Virgin Blue – International operations................................................39 Table 28 — Capacity and aircraft size forecast for Emirates – International operations to Australia..40 Table 29 — Capacity and aircraft size forecast for Singapore Airlines – International operations to
Australia .......................................................................................................................................41 Table 30 — Capacity and aircraft size forecast for Air New Zealand – International operations to
Australia .......................................................................................................................................42 Table 31 — Comparison of international En-route distance and MTOW-km......................................44 Table 32 - Forecast of Major International Airline En-route Traffic > 20 Tonnes ...............................44 Table 33 — Aircraft Providing Regional Services Above and Below 20 tonnes MTOW ...................45 Table 34 — Historical trend in Regional Domestic Passenger Traffic – 1985 to 2010........................46 Table 35- Forecast of Regional Domestic En-route Passenger Traffic – Above and below 20 tonnes
MTOW .........................................................................................................................................48 Table 36 – Trends in Domestic Aircraft-km flown by less than 20 tonnes MTOW aircraft (Jan 08 to
Jun 11)..........................................................................................................................................50 Table 37 – Trends in Total Aircraft Distance and MTOW-km – ASA measures.................................51 Table 38 - Forecast of Regional Airline En-route Traffic for aircraft below 20 tonnes MTOW..........51 Table 39 – Comparison of Historical Aircraft-km and MTOW-km for Overflight..............................53 Table 40 – Comparison of Overflights actual MTOW-km and the trend predicted by the equation....54 Table 41 – Growth in world GDP and projected MTOW-km of Overflights.......................................55
Activity Forecasts for the Period 2010-2011 to 2015-2016 FINAL REPORT Page 5 Airservices Australia
Table 42 – Comparison of historic aircraft-km and MTOW-km trends for all-cargo flights ...............56 Table 43 – Comparison of All-Cargo actual MTOW-km and the trend predicted by the equation.....57 Table 44 – Growth in world GDP and projected MTOW-km of All-Cargo flights..............................57 Table 45 – Trends in General Aviation and Australian GDP ...............................................................58 Table 46 - Airports of Interest to ASA .................................................................................................59 Table 47 - Results of Regression Equations for Individual Major Airports .........................................60 Table 48 – Historic and Forecasted traffic growth rates at the Major Airports – in passengers ...........61 Table 49 – Projection of terminal passenger demand using the en-route demand forecasts.................62 Table 50 – Terminal MTOW forecast for the 8 Major Airports (aggregated) ......................................63 Table 51 – Passenger trend at the 15 regional airports ........................................................................64 Table 52 - Forecast of Inbound Passengers at 15 Regional Airports (aggregated)...............................65 Table 53 - Forecast of Inbound Aircraft Movements at 15 Regional Airports (aggregated)................66 Table 54 - Forecast of MTOW for Regional Airports (aggregated) .....................................................66 Table 55 — Total Historic and Forecast Passengers and MTOW for Sydney Airport.........................67 Table 56 — Total Historic and Forecast Passengers and MTOW for Melbourne Airport ...................67 Table 57 — Total Historic and Forecast Passengers and MTOW for Brisbane Airport.......................68 Table 58 — Total Historic and Forecast Passengers and MTOW for Perth Airport ............................68 Table 59 — Total Historic and Forecast Passengers and MTOW for Adelaide Airport ......................69 Table 60 — Total Historic and Forecast Passengers and MTOW for Canberra Airport ......................69 Table 61 — Total Historic and Forecast Passengers and MTOW for Cairns Airport ..........................70 Table 62 — Total Historic and Forecast Passengers and MTOW for Gold Coast Airport...................70
Activity Forecasts for the Period 2010-2011 to 2015-2016 FINAL REPORT Page 6 Airservices Australia
1. Executive Summary
Purpose and approach
The purpose of the study is to advise Airservices Australia on Australia’s growth in aviation activity from the present to 2015-2016. The study will serve as an input for the pricing of airways services.
The approach undertaken is to analyze the interaction between the prospects for future demand by the customers of domestic and international air transport services on the one hand, and the supply of these services by the airlines on the other. The forecasts of aviation activity result from this analysis.
Markets
There are many air transport markets to consider, including major and regional domestic traffic, international traffic, overflights of Australian airspace by international services, all-cargo traffic and general aviation.
Both en-route and airport traffic of relevance to Airservices Australia were analyzed. The en-route markets are also categorized by aircraft of greater than or equal to 20 tonnes MTOW, and less than 20 tonnes MTOW.
Causal factors and analysis
Demand for air travel depends on such factors as income levels and airfares. At a global level, income is represented by Gross Domestic Produce (GDP) — for Australia and for the world. Trends in these measures have a powerful effect on demand. Regression analysis of the impact of GDP and airfares on traffic demand was undertaken for most of the markets. The estimated relationships, together with assumptions about the future development of the causal factors, were used as a basis for forecasting passenger numbers.
Assumptions about airline pricing and aircraft deployment strategies to meet future customer demand were incorporated into the forecasts. This process took into account the aircraft types in the existing airline fleets, the numbers and types of aircraft on order and the flexibility of the airlines to adjust delivery schedules.
Passenger forecasts were translated into aircraft movement forecasts using assumptions about average load factors and aircraft size. These latter variables were influenced by airline response to developments in passenger demand.
Activity Forecasts for the Period 2010-2011 to 2015-2016 FINAL REPORT Page 7 Airservices Australia
Data
For the past trends and the regression analysis, GDP data were obtained primarily from the Australian Bureau of Statistics (ABS), an Australian Government Statement issued in July 2010 and the International Monetary Fund (IMF). Data for passenger-kilometres, passenger numbers, and airfare indexes were obtained from the Bureau of Infrastructure, Transport and Regional Economics (BITRE).
Aggregated historic data for aircraft-km, airport movements, seats and seat-km for domestic and international passenger services were also obtained from the BITRE. Together with the passenger data, this helped to understand past trends in average load factors and aircraft size.
Detailed data on airline fleets, including aircraft numbers by aircraft type plus seating capacities for aircraft types, together with numbers of aircraft on order and estimates of delivery dates, were available from IATA databases and airline communications. This information was used to predict the airline response to passenger demand forecasts.
Data for aviation activity related to the pricing of air services was available from Airservices Australia. This information was used to observe the historic relationships between aircraft distances traveled and en-route MTOW-Km, and between the numbers of flights and terminal MTOW. These relationships formed the links between the passenger and aircraft movement analyses using BITRE data and the final forecasts of ASA’s concepts of en-route MTOW-Km and terminal MTOW. The forecasts for the 2010-11 to 2015-16 period were built from the ASA data base for 2009-10.
Recovery from the Global Financial Crisis and the further economic outlook
The economic outlook has been, and will continue to be, the major factor affecting the volume of air traffic.
As a result of the financial crisis, Australian economic growth declined significantly, from 3.7% in 2007-08 to 1.3% in 2008-09. The total world economy declined slightly in 2009. Chinese growth fell from 13% in 2007 to 8.7% in 2009.
Economic recovery is on track in Australia, with positive growth every quarter since the last quarter of 2008 — most recently a particularly strong quarterly rate of 1.2% was achieved for the 2010 June quarter. Recovery is occurring in most countries, including in the OECD as a whole and in China.
The economic forecasts used as the basis for the traffic forecasts are those published in July 2010 by the Australian Government and the International Monetary Fund.
Activity Forecasts for the Period 2010-2011 to 2015-2016 FINAL REPORT Page 8 Airservices Australia
Fleet evolution
On all segments, it was established that demand would be growing strongly over the forecast period, fueled by economic growth. Airlines are anticipated to increase capacity and match with the demand resulting in the load factor remaining at a high level.
Aircraft size is expected to increase on both domestic and international routes. On domestic routes, more of the largest narrow-body aircraft (A320 and B737-800) will be added and Qantas’ B767s will be phased out and replaced by A330s. On regional routes, larger aircraft (ERJ170 and Dash 8-Q400) are planned for delivery. International routes will see an intensified use of the A380 and the roll-out of the B787-9.
Airfare evolution
After a steep decrease in FY2008 and FY2009, domestic airfare is expected to stabilize and pick up slightly in FY2011 and FY2012 as domestic demand bounces back strongly. However, intensified competition, fleet expansion and introduction of larger and more modern aircraft will likely limit the extent of the airfare upswing and trigger a slightly decreasing trend in the later years. Specifically, airfares reached a low point in FY2010. IATA Consulting anticipates a further, moderate decrease for FY2013 and beyond after the intervening growth period.
Forecasts
The tables below summarize the overall aviation activity forecasts produced in this study. The actual or estimated traffic and traffic growth in for 2009-10 are included.
Table 1 - Forecasts of Annual Growth in En-route Aviation Activity (in MTOW-km)
Enroute traffic Fiscal Year ending June 30th Aircraft greater than 20 tonnes Aircraft less than 20 tonnes
MTOW-Km Growth MTOW-Km Growth
2010 98,384,039 5.3% 11,582,310 -7.9%
2011 102,007,682 3.7% 11,795,973 1.8%
2012 107,222,175 5.1% 12,123,507 2.8%
2013 111,225,652 3.7% 12,356,043 1.9%
2014 115,597,838 3.9% 12,669,214 2.5%
2015 120,781,559 4.5% 13,103,528 3.4%
2016 125,083,241 3.6% 13,543,286 3.4%
Activity Forecasts for the Period 2010-2011 to 2015-2016 FINAL REPORT Page 9 Airservices Australia
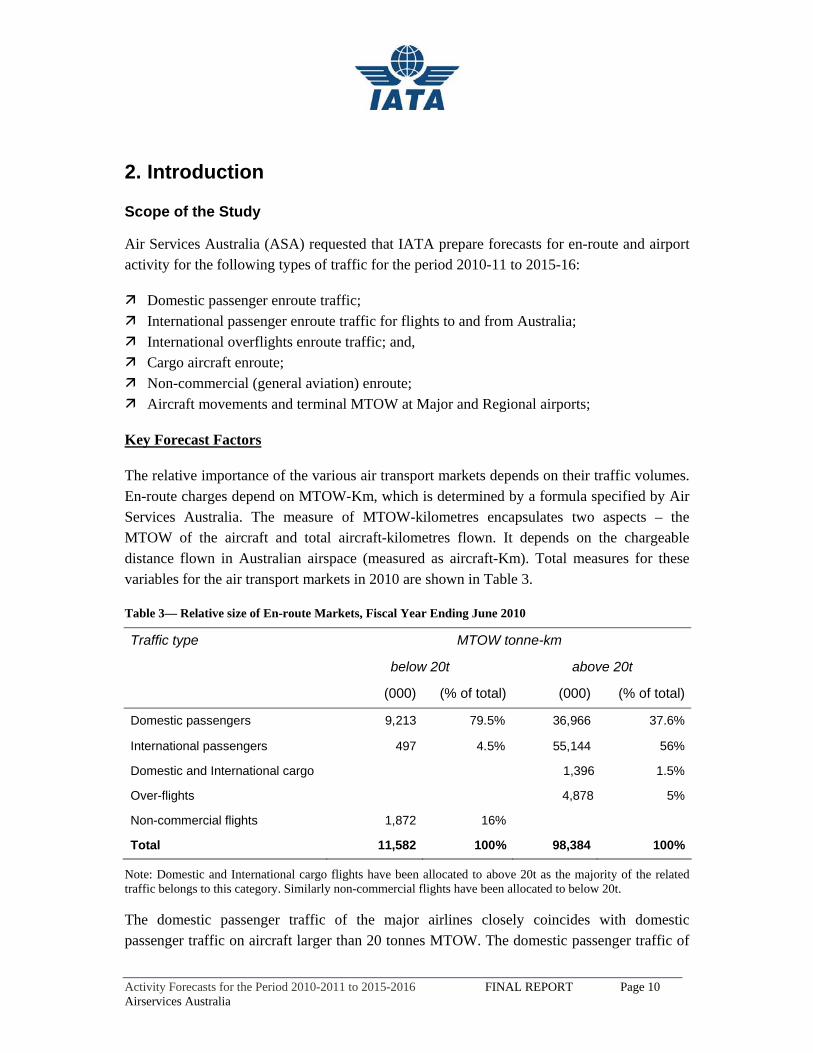
Table 2 - Forecasts of Annual Growth in Terminal Activity (in MTOW landed)
Terminal traffic Fiscal Year ending June 30th Major airports Regional airports
MTOW Growth MTOW Growth
2010 43,178,743 2.5% 2,178,869 0.2%
2011 44,980,389 4.2% 2,200,833 1.0%2012 47,391,972 5.4% 2,256,248 2.5%2013 48,934,332 3.3% 2,349,440 4.1%2014 50,913,784 4.0% 2,449,462 4.3%2015 53,111,613 4.3% 2,553,742 4.3%2016 55,078,730 3.7% 2,662,462 4.3%
Activity Forecasts for the Period 2010-2011 to 2015-2016 FINAL REPORT Page 10 Airservices Australia
2. Introduction
Scope of the Study
Air Services Australia (ASA) requested that IATA prepare forecasts for en-route and airport activity for the following types of traffic for the period 2010-11 to 2015-16:
Domestic passenger enroute traffic; International passenger enroute traffic for flights to and from Australia; International overflights enroute traffic; and, Cargo aircraft enroute; Non-commercial (general aviation) enroute; Aircraft movements and terminal MTOW at Major and Regional airports;
Key Forecast Factors
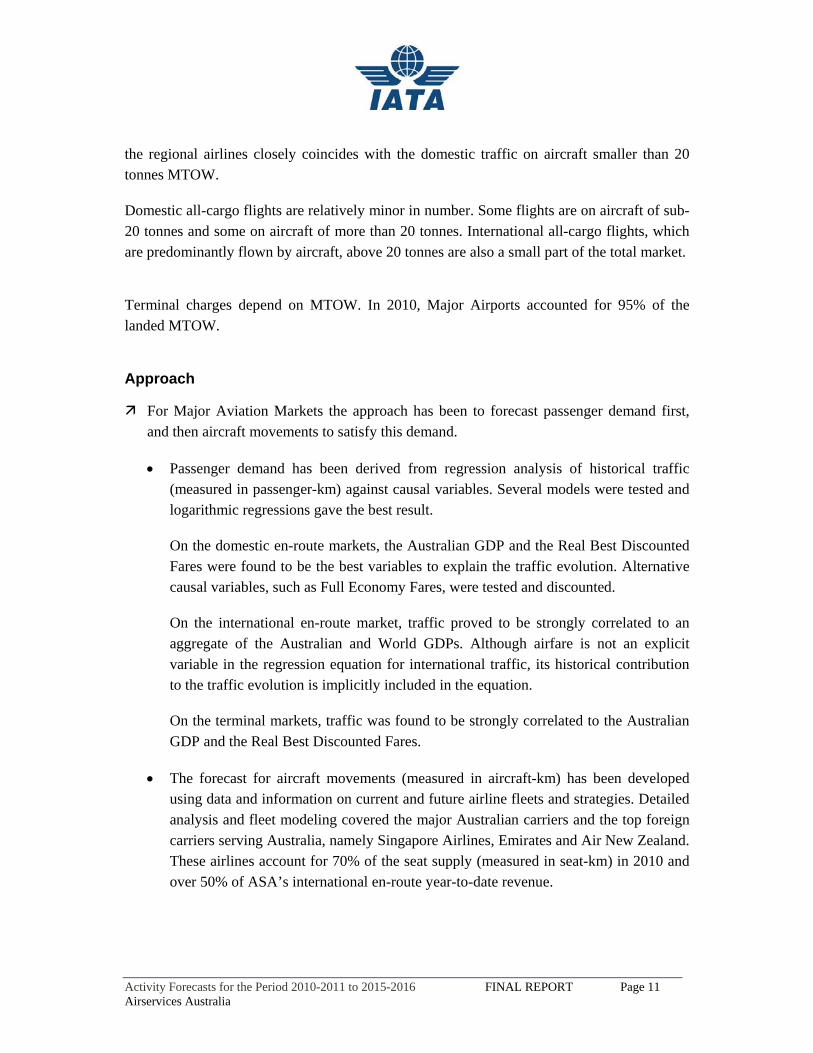
The relative importance of the various air transport markets depends on their traffic volumes. En-route charges depend on MTOW-Km, which is determined by a formula specified by Air Services Australia. The measure of MTOW-kilometres encapsulates two aspects – the MTOW of the aircraft and total aircraft-kilometres flown. It depends on the chargeable distance flown in Australian airspace (measured as aircraft-Km). Total measures for these variables for the air transport markets in 2010 are shown in Table 3.
Table 3— Relative size of En-route Markets, Fiscal Year Ending June 2010
Traffic type MTOW tonne-km
below 20t above 20t
(000) (% of total) (000) (% of total)
Domestic passengers 9,213 79.5% 36,966 37.6%
International passengers 497 4.5% 55,144 56%
Domestic and International cargo 1,396 1.5%
Over-flights 4,878 5%
Non-commercial flights 1,872 16%
Total 11,582 100% 98,384 100%
Note: Domestic and International cargo flights have been allocated to above 20t as the majority of the related traffic belongs to this category. Similarly non-commercial flights have been allocated to below 20t.
The domestic passenger traffic of the major airlines closely coincides with domestic passenger traffic on aircraft larger than 20 tonnes MTOW. The domestic passenger traffic of
Activity Forecasts for the Period 2010-2011 to 2015-2016 FINAL REPORT Page 11 Airservices Australia
the regional airlines closely coincides with the domestic traffic on aircraft smaller than 20 tonnes MTOW.
Domestic all-cargo flights are relatively minor in number. Some flights are on aircraft of sub-20 tonnes and some on aircraft of more than 20 tonnes. International all-cargo flights, which are predominantly flown by aircraft, above 20 tonnes are also a small part of the total market.
Terminal charges depend on MTOW. In 2010, Major Airports accounted for 95% of the landed MTOW.
Approach
For Major Aviation Markets the approach has been to forecast passenger demand first, and then aircraft movements to satisfy this demand.
• Passenger demand has been derived from regression analysis of historical traffic (measured in passenger-km) against causal variables. Several models were tested and logarithmic regressions gave the best result.
On the domestic en-route markets, the Australian GDP and the Real Best Discounted Fares were found to be the best variables to explain the traffic evolution. Alternative causal variables, such as Full Economy Fares, were tested and discounted.
On the international en-route market, traffic proved to be strongly correlated to an aggregate of the Australian and World GDPs. Although airfare is not an explicit variable in the regression equation for international traffic, its historical contribution to the traffic evolution is implicitly included in the equation.
On the terminal markets, traffic was found to be strongly correlated to the Australian GDP and the Real Best Discounted Fares.
• The forecast for aircraft movements (measured in aircraft-km) has been developed using data and information on current and future airline fleets and strategies. Detailed analysis and fleet modeling covered the major Australian carriers and the top foreign carriers serving Australia, namely Singapore Airlines, Emirates and Air New Zealand. These airlines account for 70% of the seat supply (measured in seat-km) in 2010 and over 50% of ASA’s international en-route year-to-date revenue.
Activity Forecasts for the Period 2010-2011 to 2015-2016 FINAL REPORT Page 12 Airservices Australia
• The final step was to derive the traffic measures of direct interest to Airservices Australia, which are the MTOW-Km and MTOW totals relating to the airspace and terminal demands on the air traffic management system.
For Overflights, All-Cargo and General Aviation, a simplified approach is used to forecast their associated MTOW-Km
Data sources
The following data sources were used to analyze traffic flows, the causal factors affecting traffic, and the outlook for the causal factors:
Bureau of Infrastructure, Transport and Regional Economics (BITRE)
For airline passenger numbers and passenger-km traveled For airline passenger aircraft movements and aircraft-kilometres traveled For airport passenger numbers and aircraft movements For trends in airfares
Airservices Australia
For aircraft flight numbers, distances flown, MTOW and MTOW-Km; for each air transport sector
IATA
For trends in fleet development For historical data and projections about the Global and Regional Aviation Industry For actual traffic and schedule data including O&D traffic and future schedules
The Australian Bureau of Statistics
For historic data on Australian Gross Domestic Product (GDP) and Australian consumer price inflation (CPI)
Organisations which produce economic forecasts for the world economy and for Australia
World Bank International Monetary Fund Australian Treasury Economist Intelligence Unit
Some of the data for the base year, 2009-10, from which the forecasts for subsequent years were developed, needed to be estimated because information for the whole of 2009-10 was incomplete. For example, air traffic data was frequently available up to April or May 2010,
Activity Forecasts for the Period 2010-2011 to 2015-2016 FINAL REPORT Page 13 Airservices Australia
and full year estimates were derived by first calculating the growth from the first 11 months of 2008-09 to the first 11 months of 2009-10. In regard to economic data, primarily GDP, reliance was placed on official estimates by the organizations identified above.
Study assumptions
The forecasts of aviation demand and traffic are based on various economic and industry assumptions. These are discussed at appropriate places in the report. The economic assumptions are expressed in terms of GDP growth which incorporates population growth and business cycle conditions, and are based on information published by official specialized agencies.
Incorporated in the forecasts are ‘business-as-usual’ assumptions. As such, no dramatic changes in taxes and in the oil price over the forecast period were incorporated.
Activity Forecasts for the Period 2010-2011 to 2015-2016 FINAL REPORT Page 14 Airservices Australia
3. Aviation context
Global Context
The impact of the recession on global air-traffic was highly visible as it hit most major economies world-wide. The decrease in international passenger traffic, initiated in the fourth quarter 2008, intensified in 2009 with a 10% decline during the first quarter. Premium markets were hit the hardest with a fall of nearly 20% during the first quarter of 2009, reflecting the sharp intensification of the recession and the contraction of world trade. As a result, capacity was cut on international routes in response to falling seat load factors..
In the first three months of 2010, however, the value of world trade was around 25% higher than in the same period of 2009, as highlighted by the World Trade Organization statistics released in June 2010. These are “year-on-year” quarterly comparisons. Air-traffic has benefited from improving demand and consumer confidence.
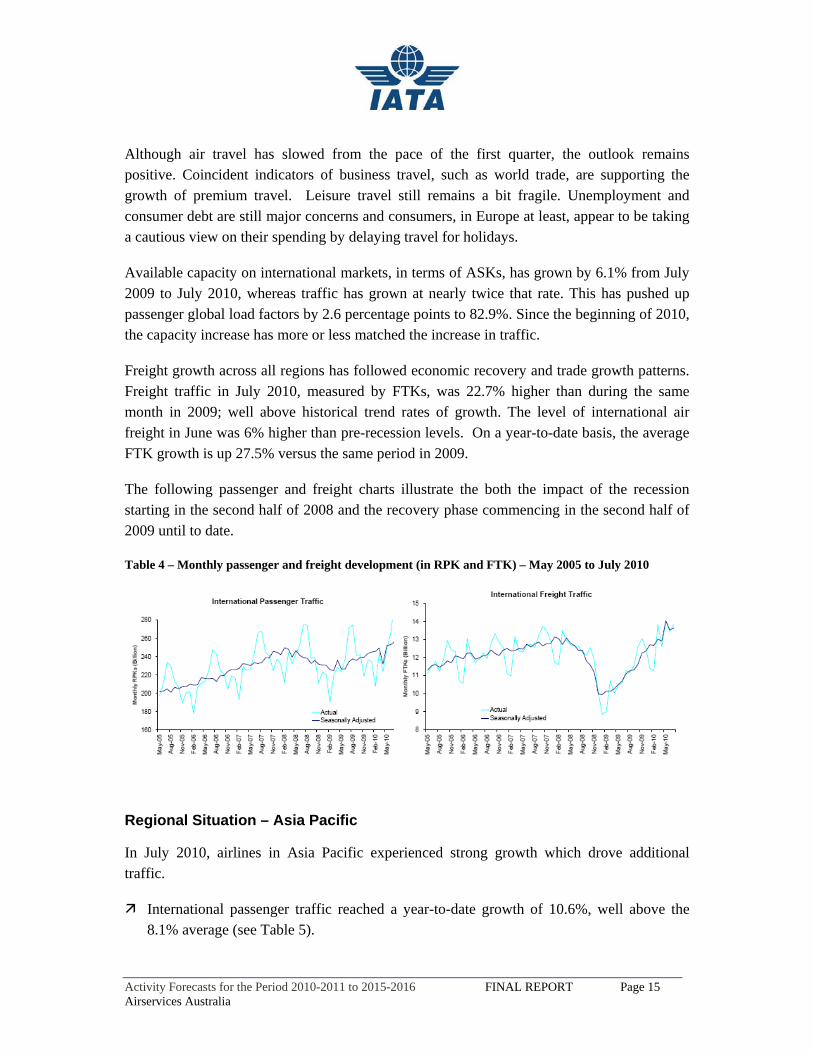
Air travel and freight markets have shown strong growth in the last 12 months. Passenger traffic on international markets, measured by RPKs, was 11.6% higher in July than a year earlier. This growth, on the back of economic recovery, has seen international passenger traffic now rise to levels 1-2% higher than their pre-recession peak in Q1 2008.
Premium demand (business class and first class) also saw a rise in the number of passengers on international air travel markets. The numbers of passengers traveling on premium seats were 16.6% higher in June 2010 than the same month in 2009. The strong business travel has driven premium and economy market segments during this upswing. Economy seats were up 9.5% in the same period of time.
However, there are signs that this very strong post-recession rebound in travel may be slowing. The expansion during the first half of 2010 has been slower than the rebound in the second half of 2009 even after adjusting for the European airspace closures. Adjusting for the airspace closures shows premium travel volumes slowing from an annualized pace of 11% during the second half of 2009, and over 20% in the first quarter, to just below 9% in the second quarter. The year-to-date 2010 growth versus 2009 is 8.1%; a slight deceleration, yet still an upward trend. Although slower growth, this is still double the average 4.5% growth rate in premium travel seen in the expansion years before the recession. A similar slowdown is visible in economy travel volumes, from 9% growth in the first quarter, to 6% second quarter growth (adjusted for the airspace closures). Economy travel is now expanding in line with the growth trend seen before the recession.
Activity Forecasts for the Period 2010-2011 to 2015-2016 FINAL REPORT Page 15 Airservices Australia
Although air travel has slowed from the pace of the first quarter, the outlook remains positive. Coincident indicators of business travel, such as world trade, are supporting the growth of premium travel. Leisure travel still remains a bit fragile. Unemployment and consumer debt are still major concerns and consumers, in Europe at least, appear to be taking a cautious view on their spending by delaying travel for holidays.
Available capacity on international markets, in terms of ASKs, has grown by 6.1% from July 2009 to July 2010, whereas traffic has grown at nearly twice that rate. This has pushed up passenger global load factors by 2.6 percentage points to 82.9%. Since the beginning of 2010, the capacity increase has more or less matched the increase in traffic.
Freight growth across all regions has followed economic recovery and trade growth patterns. Freight traffic in July 2010, measured by FTKs, was 22.7% higher than during the same month in 2009; well above historical trend rates of growth. The level of international air freight in June was 6% higher than pre-recession levels. On a year-to-date basis, the average FTK growth is up 27.5% versus the same period in 2009.
The following passenger and freight charts illustrate the both the impact of the recession starting in the second half of 2008 and the recovery phase commencing in the second half of 2009 until to date.
Table 4 – Monthly passenger and freight development (in RPK and FTK) – May 2005 to July 2010
Regional Situation – Asia Pacific
In July 2010, airlines in Asia Pacific experienced strong growth which drove additional traffic.
International passenger traffic reached a year-to-date growth of 10.6%, well above the 8.1% average (see Table 5).
Activity Forecasts for the Period 2010-2011 to 2015-2016 FINAL REPORT Page 16 Airservices Australia
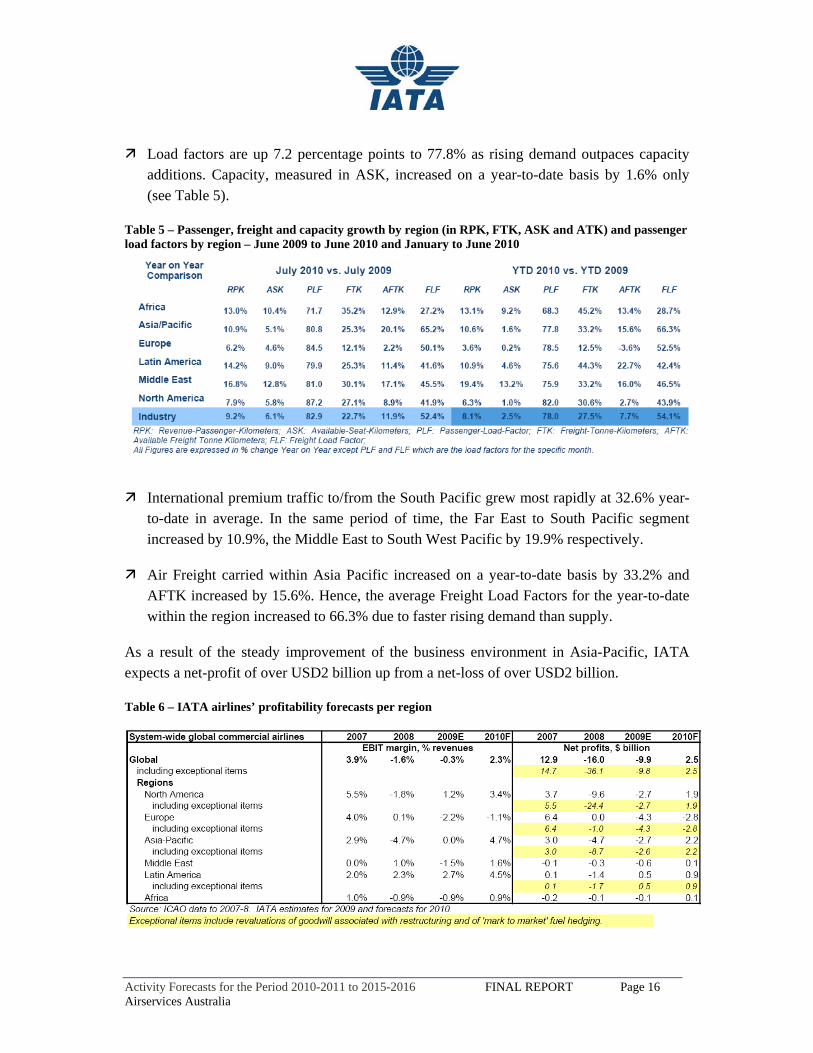
Load factors are up 7.2 percentage points to 77.8% as rising demand outpaces capacity additions. Capacity, measured in ASK, increased on a year-to-date basis by 1.6% only (see Table 5).
Table 5 – Passenger, freight and capacity growth by region (in RPK, FTK, ASK and ATK) and passenger load factors by region – June 2009 to June 2010 and January to June 2010
International premium traffic to/from the South Pacific grew most rapidly at 32.6% year-to-date in average. In the same period of time, the Far East to South Pacific segment increased by 10.9%, the Middle East to South West Pacific by 19.9% respectively.
Air Freight carried within Asia Pacific increased on a year-to-date basis by 33.2% and AFTK increased by 15.6%. Hence, the average Freight Load Factors for the year-to-date within the region increased to 66.3% due to faster rising demand than supply.
As a result of the steady improvement of the business environment in Asia-Pacific, IATA expects a net-profit of over USD2 billion up from a net-loss of over USD2 billion.
Table 6 – IATA airlines’ profitability forecasts per region
Activity Forecasts for the Period 2010-2011 to 2015-2016 FINAL REPORT Page 17 Airservices Australia
Additionally, exports of Africa, the Middle East and the Commonwealth of Independent States were more than 50% higher than in the corresponding period of 2009; much of tis fueled by Asia Pacific economic activity.
Regional outlook – Asia Pacific
In late 2009, airlines serving Asian Pacific projected a cautious +4.7% passenger traffic growth for the region in 2010 and a more sizeable traffic bounce back in 2011 and 2012; +6% and +6.1% respectively. For the same period of time, the consensual perception of airlines indicated that passenger traffic growth to and within Australia would be slightly less than the overall Asia Pacific result.
However, actual airline performance has been outpacing expectations. This is in line with the results of the global economic recovery and the associated rebound of passenger traffic. Since late 2009, the impact of the global recovery has been higher than generally anticipated. Traffic within the Asian Pacific region has already returned to pre-recession levels and is anticipated to continue to keep growing strongly for the years to come.
Activity Forecasts for the Period 2010-2011 to 2015-2016 FINAL REPORT Page 18 Airservices Australia
4. Economic Outlook
Average GDP growth rates during recent decades give a perspective on long term economic trends in Australia and the wider world.
Since 1970, average Australian economic growth over successive 10-year periods has been in the range of 3 to 3.5% per annum, despite periodic recessions (see Table 7).
Average economic growth rates for the major industrial economies as a group have tended to decline since 1970 (see Table 7).
The average growth rate of the seven major OECD countries since 2000 was seriously affected by the decline of 3.3% in 2009, the worst for many decades. (Note that annual GDP growth rates are published for calendar years, and not fiscal years.)
Although the Australian economy fared better than the major OECD countries during the global financial crisis, the rate of growth declined significantly, from 3.7% in 2007-08 to 1.2% in 2008-09. (Australia and New Zealand are the only countries to publish annual growth rates for fiscal years, and not calendar years.)
The total world economy grew at a higher average rate in the 2000 to 2009 period than in the two prior decades (IMF), despite the global financial crisis; this good performance was due primarily to the stellar performance of China, and to a less extent, India.
In 2009, the total world economy declined slightly. Chinese growth fell from 13% in 2007 to 8.7% in 2009 (see Table 8).
Economic recovery is on track in Australia, with positive growth every quarter since the December quarter of 2008. The most recent June quarter 2010 was particularly strong with a growth rate of 1.2%. This resulted in an annual rate of 2.3% in 2009-10 over 2008-09 (see Table 8 and Table 9 below).
Economic recovery is occurring in most countries, including in the OECD as a whole and in China. However, there remains some concern about the sustainability of the global economic recovery. The economic support from Government stimulus packages implemented in many countries is having to give way to consumption and investment by the private sector. This requires consumer and business confidence, and the success of reforms to banking and financial systems.
Estimates for the June quarter in China, Japan and the US suggest a cooling in their economies. However, some important EU countries show signs of improvement.
Activity Forecasts for the Period 2010-2011 to 2015-2016 FINAL REPORT Page 19 Airservices Australia
The traffic forecasts in this study are based on the GDP estimates presented in Table 10. The Australian Government Economic Statement and the IMF World Economic Update, both released in July 2010, were the sources for the traffic forecasts in this study.;
Activity Forecasts for the Period 2010-2011 to 2015-2016 FINAL REPORT Page 20 Airservices Australia
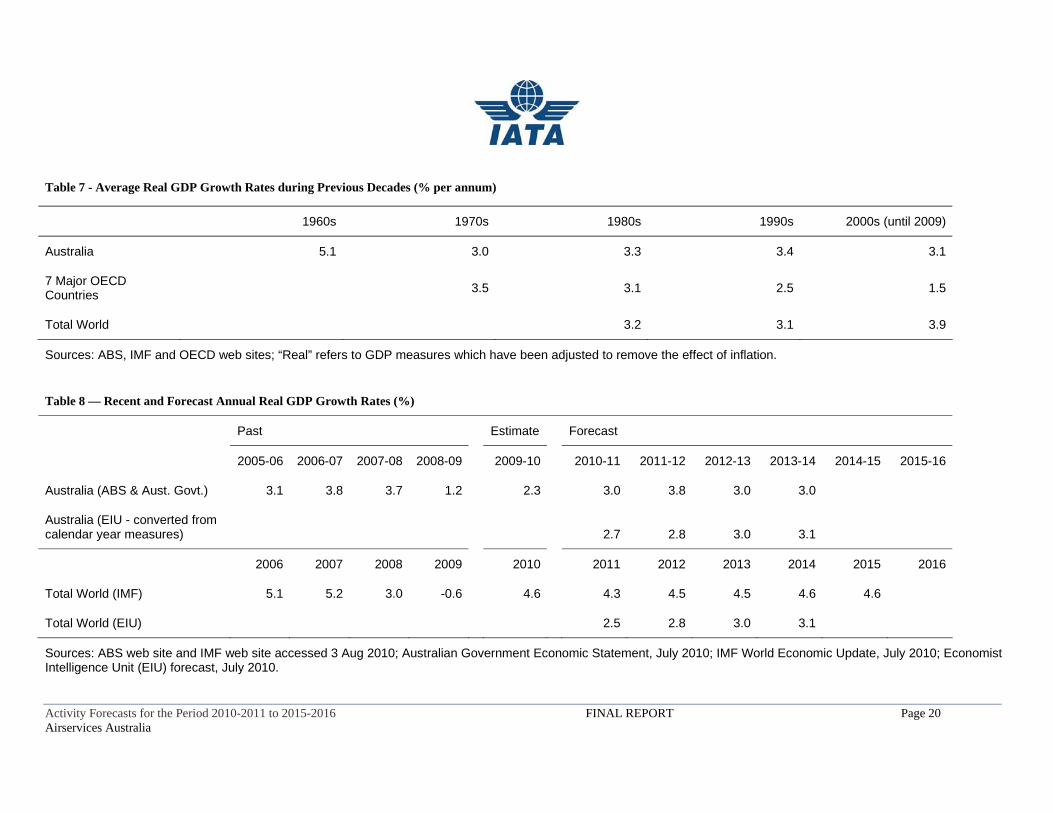
Table 7 - Average Real GDP Growth Rates during Previous Decades (% per annum)
Sources: ABS, IMF and OECD web sites; “Real” refers to GDP measures which have been adjusted to remove the effect of inflation. Table 8 — Recent and Forecast Annual Real GDP Growth Rates (%)
Past Estimate Forecast
2005-06 2006-07 2007-08 2008-09 2009-10 2010-11 2011-12 2012-13 2013-14 2014-15 2015-16
Australia (ABS & Aust. Govt.) 3.1 3.8 3.7 1.2 2.3 3.0 3.8 3.0 3.0
Australia (EIU - converted from calendar year measures) 2.7 2.8 3.0 3.1
2006 2007 2008 2009 2010 2011 2012 2013 2014 2015 2016
Total World (IMF) 5.1 5.2 3.0 -0.6 4.6 4.3 4.5 4.5 4.6 4.6
Total World (EIU) 2.5 2.8 3.0 3.1
Sources: ABS web site and IMF web site accessed 3 Aug 2010; Australian Government Economic Statement, July 2010; IMF World Economic Update, July 2010; Economist Intelligence Unit (EIU) forecast, July 2010.
1960s 1970s 1980s 1990s 2000s (until 2009)
Australia 5.1 3.0 3.3 3.4 3.1
7 Major OECD Countries 3.5 3.1 2.5 1.5
Total World 3.2 3.1 3.9
Activity Forecasts for the Period 2010-2011 to 2015-2016 FINAL REPORT Page 21 Airservices Australia
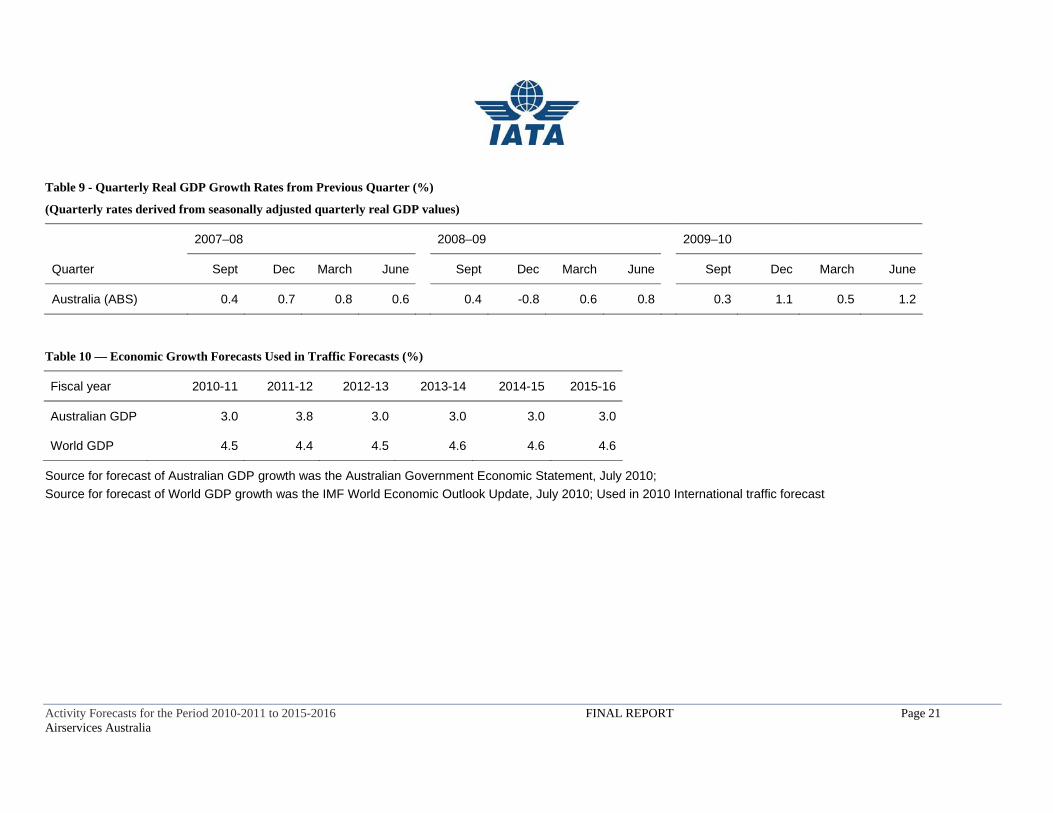
Table 9 - Quarterly Real GDP Growth Rates from Previous Quarter (%)
(Quarterly rates derived from seasonally adjusted quarterly real GDP values)
2007–08 2008–09 2009–10
Quarter Sept Dec March June Sept Dec March June Sept Dec March June
Australia (ABS) 0.4 0.7 0.8 0.6 0.4 -0.8 0.6 0.8 0.3 1.1 0.5 1.2
Table 10 — Economic Growth Forecasts Used in Traffic Forecasts (%)
Fiscal year 2010-11 2011-12 2012-13 2013-14 2014-15 2015-16
Australian GDP 3.0 3.8 3.0 3.0 3.0 3.0
World GDP 4.5 4.4 4.5 4.6 4.6 4.6
Source for forecast of Australian GDP growth was the Australian Government Economic Statement, July 2010; Source for forecast of World GDP growth was the IMF World Economic Outlook Update, July 2010; Used in 2010 International traffic forecast
Activity Forecasts for the Period 2010-2011 to 2015-2016 FINAL REPORT Page 22 Airservices Australia
5. Major Domestic En-Route Forecast
Analysis of Traffic Demand
A regression analysis of the traffic (RPK) development of the major Domestic airlines was undertaken:
The period of the analysis was 1992-93 to 2009-10;
Australian GDP, the ‘Best discount fares’ (both measured in real terms) and a dummy variable introduced for the demise of Ansett in 2002 were the explanatory variables;
The statistical significances of the explanatory variables were strong (see equation below);
The full economy fare was tested but was not statistically significant (unlike the best discount fare); furthermore it did not show a trend over the whole period.
The following regression model was estimated: Ln Passenger-Km = 9.45 + 1.41*Ln Real GDP - 0.35*Ln Real Best Discount Fare -0.14 Ansett. R2 = 0.98 tstat RealGDP = 10.8 tstat Real Best Discount Fare = -3.1 tstat Ansett Dummy = -2.3
The Bureau of Infrastructure, Transport and Regional Economics (BITRE), which publishes a range of indices of domestic air fares, has been consulted about their usefulness. BITRE advises caution because of the complexity of fare structures. However, the information is the best available and presumably gives a reasonable idea about the year-on-year movements. The Real Best Discount index is the best reflection of the market place and its effect on passenger demand. Furthermore, its statistical performance in the demand equation is relatively good, and much better than the Real Full Economy.
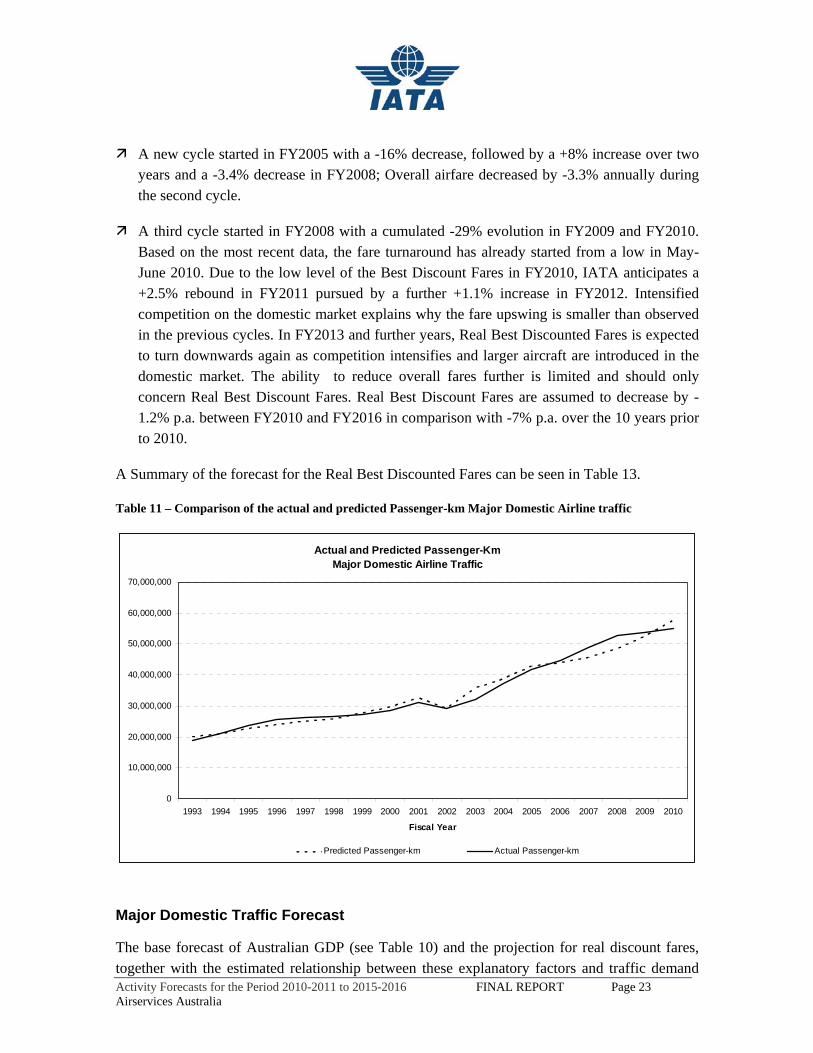
Table 11 compares actual passenger-kms with that predicted by the equation given above. It highlights the relevance of the above equation to model major domestic traffic. For several years up to fiscal year 2008, actual traffic growth exceeded the predicted growth. In 2009 and 2010, actual growth dropped below predicted growth. This was because of the impact on demand of the financial “bubble and bust” that occurred over that period. Thus, an adjustment was made to moderate the 2009 and 2010 traffic growth forecast by the regression and GDP assumptions.
Fare assumptions
The historical evolution of the Best Discounted Fares was marked by a succession of cycles, each cycle starting by a slump, followed by an upswing and a more moderate decrease.
A first cycle started in 2001. The FY2001 decrease in Real Best Discounted Fares (-16%) was followed by a +5% increase in FY2002 and a -6% annual decrease over FY2003 and FY2004. Overall airfare decreased by -6.1% annually during the first cycle.
Activity Forecasts for the Period 2010-2011 to 2015-2016 FINAL REPORT Page 23 Airservices Australia
A new cycle started in FY2005 with a -16% decrease, followed by a +8% increase over two years and a -3.4% decrease in FY2008; Overall airfare decreased by -3.3% annually during the second cycle.
A third cycle started in FY2008 with a cumulated -29% evolution in FY2009 and FY2010. Based on the most recent data, the fare turnaround has already started from a low in May-June 2010. Due to the low level of the Best Discount Fares in FY2010, IATA anticipates a +2.5% rebound in FY2011 pursued by a further +1.1% increase in FY2012. Intensified competition on the domestic market explains why the fare upswing is smaller than observed in the previous cycles. In FY2013 and further years, Real Best Discounted Fares is expected to turn downwards again as competition intensifies and larger aircraft are introduced in the domestic market. The ability to reduce overall fares further is limited and should only concern Real Best Discount Fares. Real Best Discount Fares are assumed to decrease by -1.2% p.a. between FY2010 and FY2016 in comparison with -7% p.a. over the 10 years prior to 2010.
A Summary of the forecast for the Real Best Discounted Fares can be seen in Table 13.
Table 11 – Comparison of the actual and predicted Passenger-km Major Domestic Airline traffic
Actual and Predicted Passenger-KmMajor Domestic Airline Traffic
0
10,000,000
20,000,000
30,000,000
40,000,000
50,000,000
60,000,000
70,000,000
1993 1994 1995 1996 1997 1998 1999 2000 2001 2002 2003 2004 2005 2006 2007 2008 2009 2010
Fiscal Year
Predicted Passenger-km Actual Passenger-km
Major Domestic Traffic Forecast
The base forecast of Australian GDP (see Table 10) and the projection for real discount fares, together with the estimated relationship between these explanatory factors and traffic demand
Activity Forecasts for the Period 2010-2011 to 2015-2016 FINAL REPORT Page 24 Airservices Australia
was used to produce the traffic forecast for the six years from 2010-11 to 2015-16 (see Table 13).
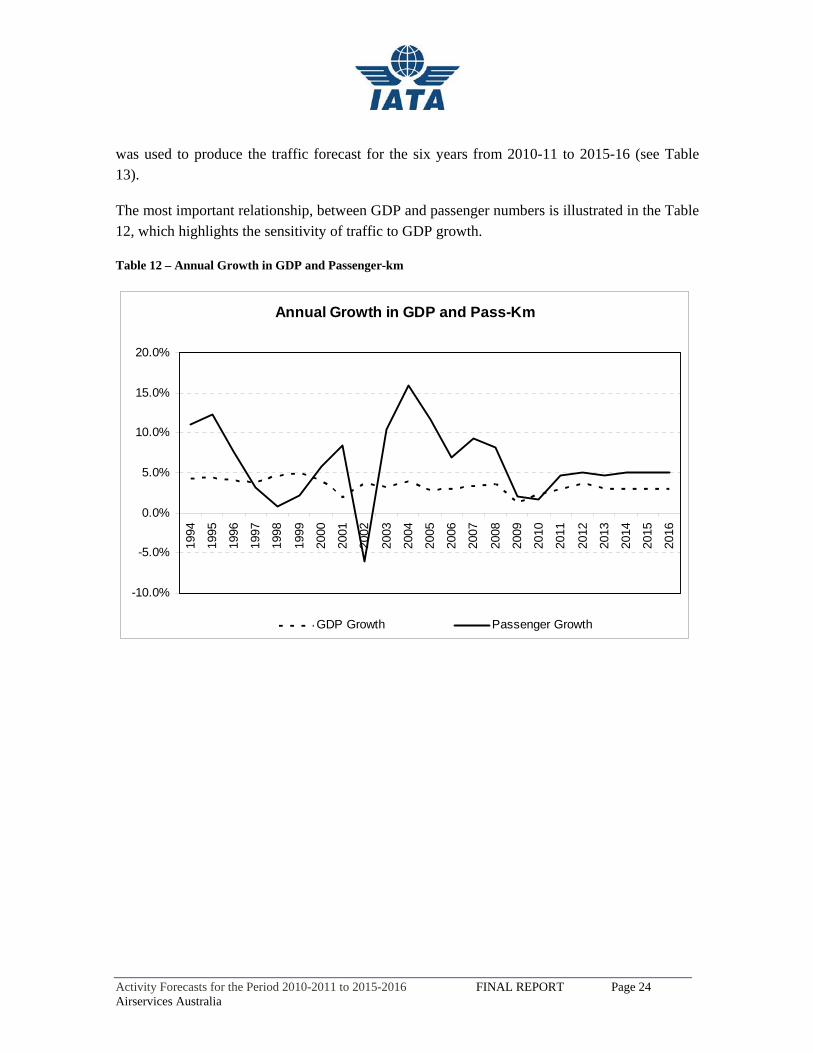
The most important relationship, between GDP and passenger numbers is illustrated in the Table 12, which highlights the sensitivity of traffic to GDP growth.
Table 12 – Annual Growth in GDP and Passenger-km
Annual Growth in GDP and Pass-Km
-10.0%
-5.0%
0.0%
5.0%
10.0%
15.0%
20.0%
1994
1995
1996
1997
1998
1999
2000
2001
2002
2003
2004
2005
2006
2007
2008
2009
2010
2011
2012
2013
2014
2015
2016
GDP Growth Passenger Growth
Activity Forecasts for the Period 2010-2011 to 2015-2016 FINAL REPORT Page 25 Airservices Australia
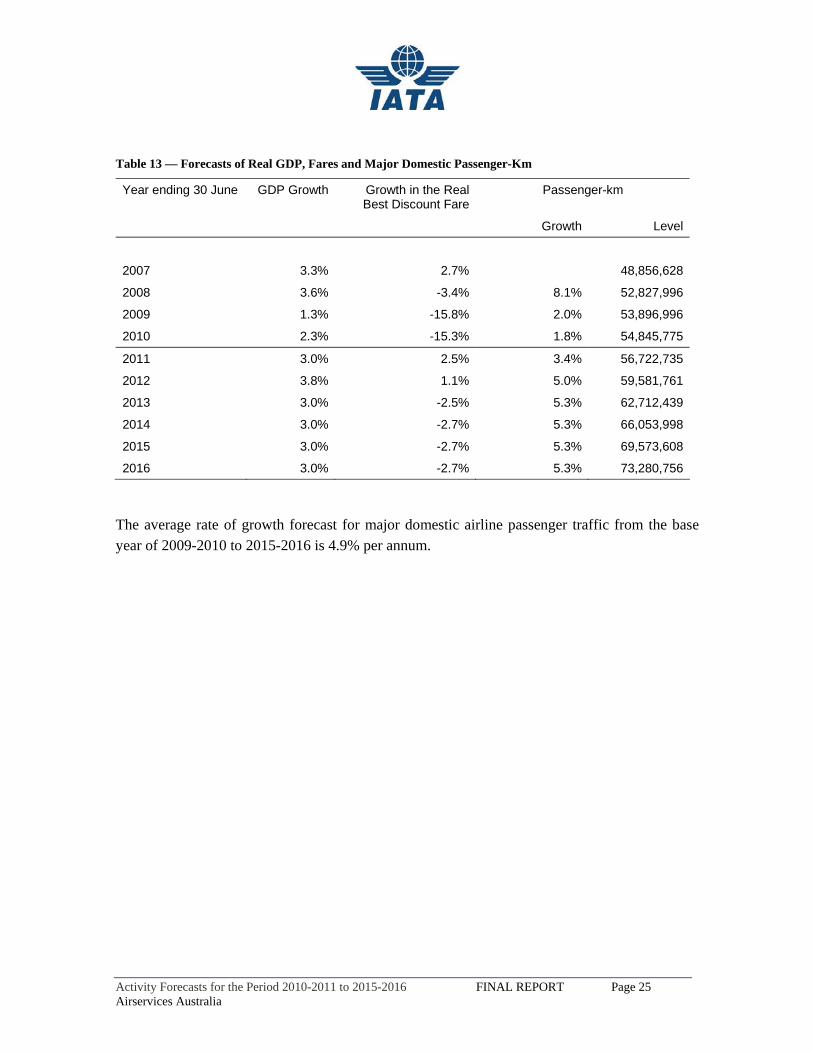
Table 13 — Forecasts of Real GDP, Fares and Major Domestic Passenger-Km
Year ending 30 June GDP Growth Growth in the Real Best Discount Fare
Passenger-km
Growth Level
2007 3.3% 2.7% 48,856,628
2008 3.6% -3.4% 8.1% 52,827,996
2009 1.3% -15.8% 2.0% 53,896,996
2010 2.3% -15.3% 1.8% 54,845,775
2011 3.0% 2.5% 3.4% 56,722,735
2012 3.8% 1.1% 5.0% 59,581,761
2013 3.0% -2.5% 5.3% 62,712,439
2014 3.0% -2.7% 5.3% 66,053,998
2015 3.0% -2.7% 5.3% 69,573,608
2016 3.0% -2.7% 5.3% 73,280,756
The average rate of growth forecast for major domestic airline passenger traffic from the base year of 2009-2010 to 2015-2016 is 4.9% per annum.
Activity Forecasts for the Period 2010-2011 to 2015-2016 FINAL REPORT Page 26 Airservices Australia
Major Domestic Airline Fleet Perspectives
Deriving a forecast of aircraft-km from the forecasts of passenger-km requires assumptions on future load factors and average aircraft size.
Domestic load factors reached a high of almost 81% in FY2010. The strong decrease in airfare together with some improvement in economic conditions allowed airlines to keep the load factor high.
Major carriers have revealed plans to add capacity by introducing new aircraft into their domestic fleets. In the short-term, the additional capacity is likely to exceed the increase in demand as airfare recovery will constrain the demand. This will result in a slight decrease in the domestic passenger load factor in the short term. As the low-fare model spreads to more domestic routes, higher load factors will likely result in the medium-term. Airlines will manage capacity to maintain their load factor above 80%.
Aircraft size is expected to increase slightly as a result of the further deliveries of A320s and B737-800s and the replacement of B767s by A330s.
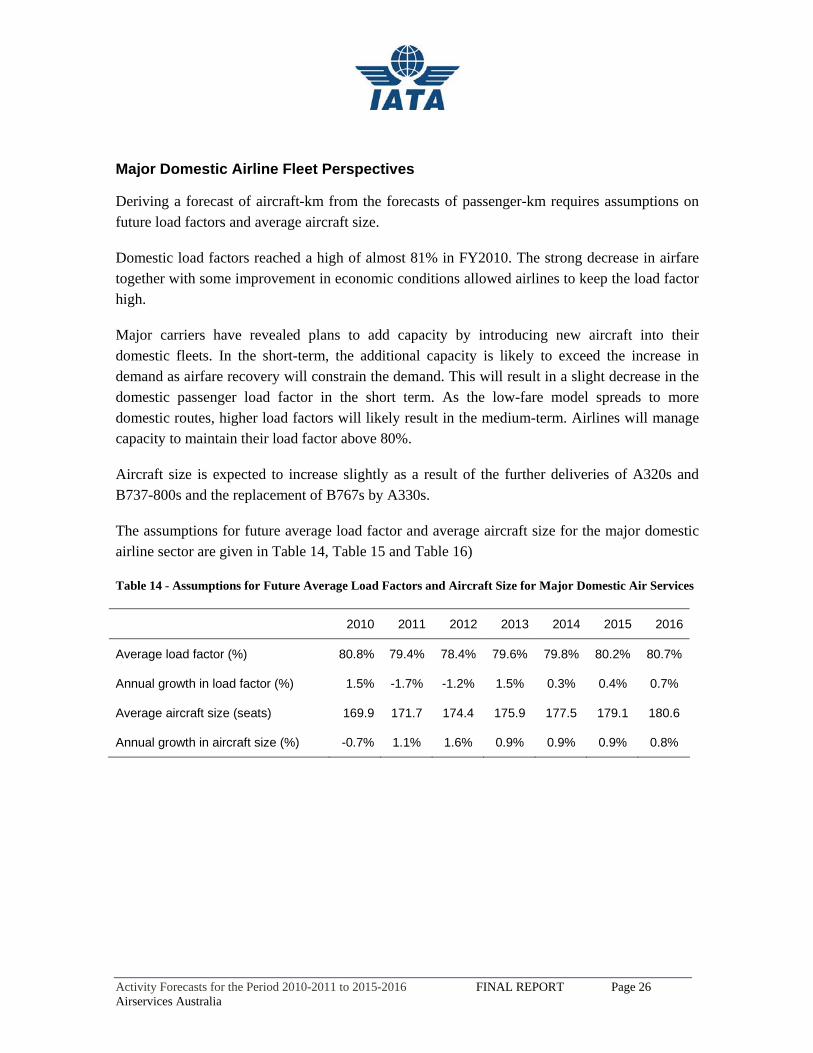
The assumptions for future average load factor and average aircraft size for the major domestic airline sector are given in Table 14, Table 15 and Table 16)
Table 14 - Assumptions for Future Average Load Factors and Aircraft Size for Major Domestic Air Services
2010 2011 2012 2013 2014 2015 2016
Average load factor (%) 80.8% 79.4% 78.4% 79.6% 79.8% 80.2% 80.7%
Annual growth in load factor (%) 1.5% -1.7% -1.2% 1.5% 0.3% 0.4% 0.7%
Average aircraft size (seats) 169.9 171.7 174.4 175.9 177.5 179.1 180.6
Annual growth in aircraft size (%) -0.7% 1.1% 1.6% 0.9% 0.9% 0.9% 0.8%
Activity Forecasts for the Period 2010-2011 to 2015-2016 FINAL REPORT Page 27 Airservices Australia
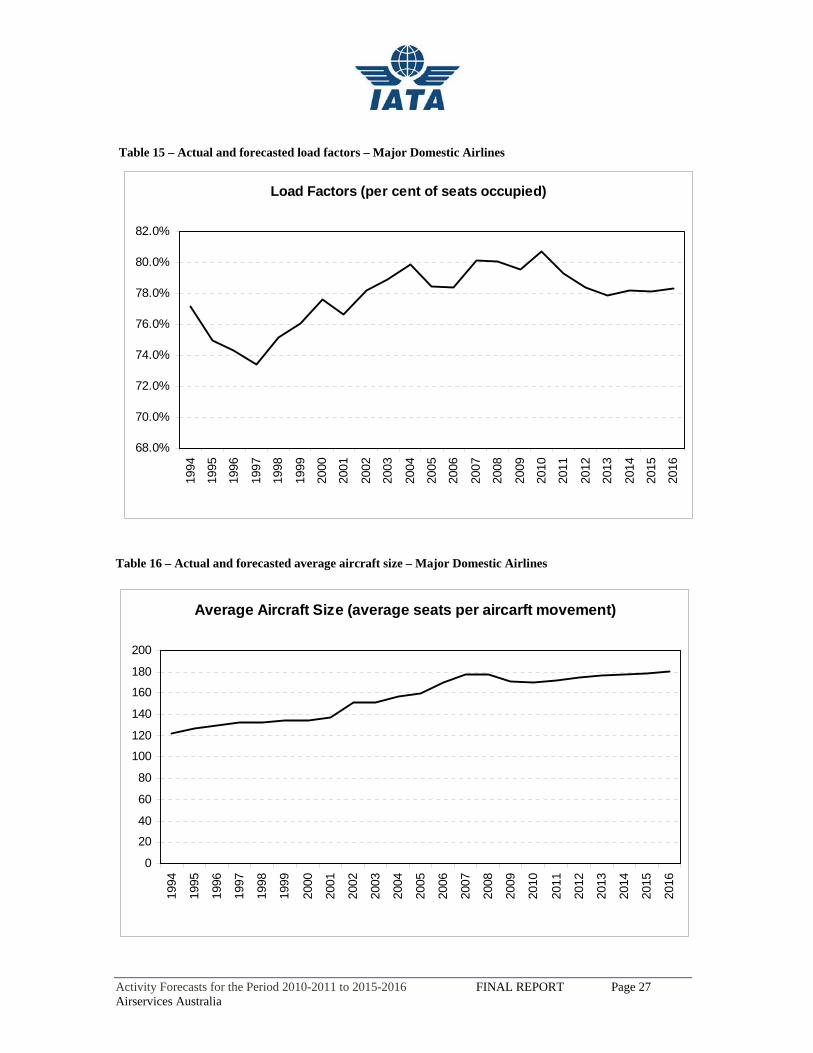
Table 15 – Actual and forecasted load factors – Major Domestic Airlines
Load Factors (per cent of seats occupied)
68.0%
70.0%
72.0%
74.0%
76.0%
78.0%
80.0%
82.0%
1994
1995
1996
1997
1998
1999
2000
2001
2002
2003
2004
2005
2006
2007
2008
2009
2010
2011
2012
2013
2014
2015
2016
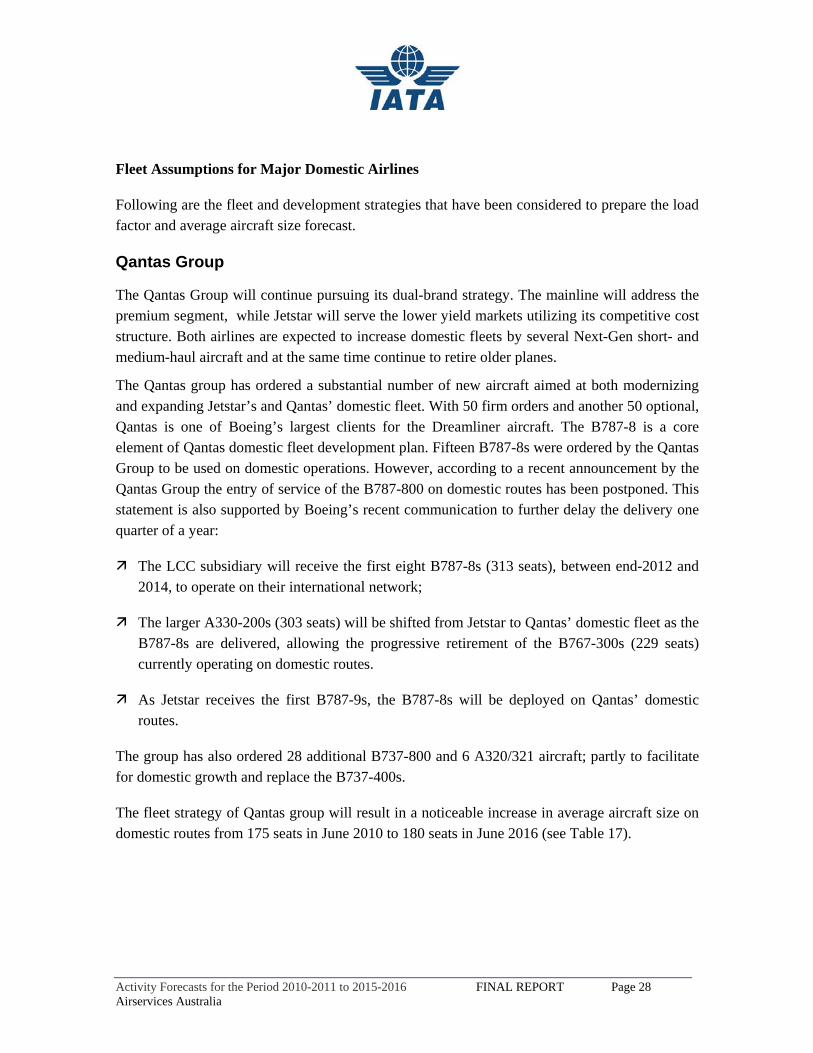
Table 16 – Actual and forecasted average aircraft size – Major Domestic Airlines
Average Aircraft Size (average seats per aircarft movement)
0
20
40
60
80
100
120
140
160
180
200
1994
1995
1996
1997
1998
1999
2000
2001
2002
2003
2004
2005
2006
2007
2008
2009
2010
2011
2012
2013
2014
2015
2016
Activity Forecasts for the Period 2010-2011 to 2015-2016 FINAL REPORT Page 28 Airservices Australia
Fleet Assumptions for Major Domestic Airlines
Following are the fleet and development strategies that have been considered to prepare the load factor and average aircraft size forecast.
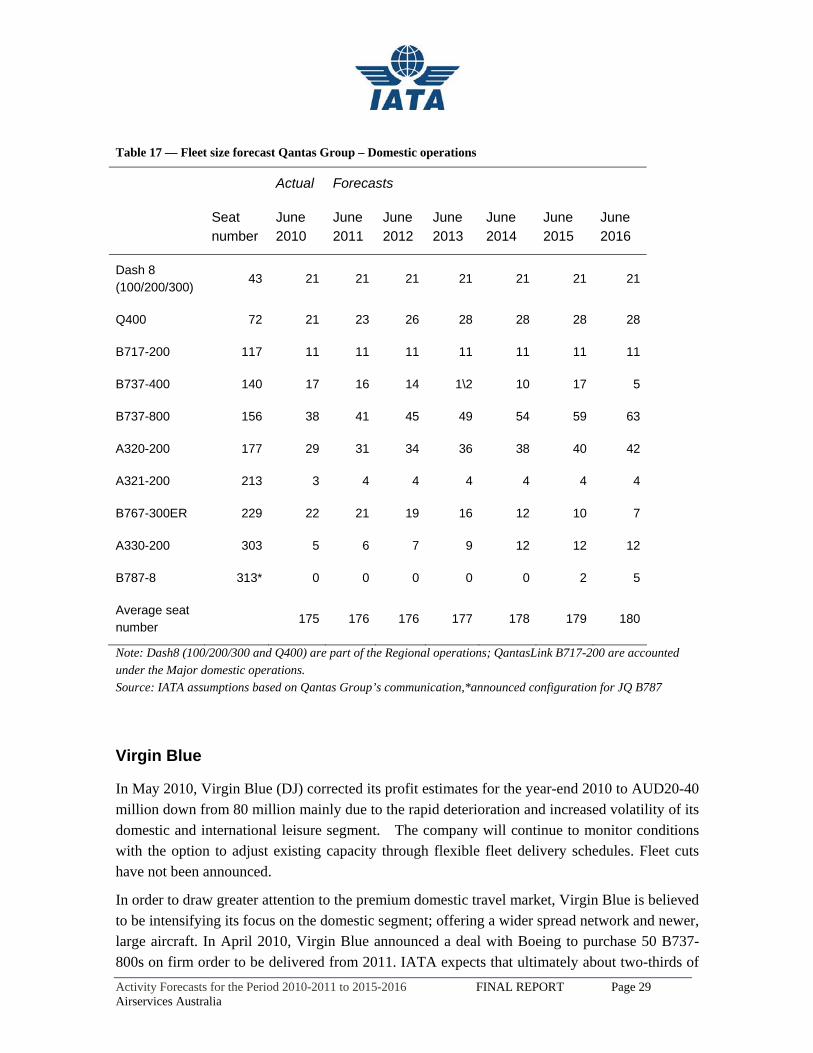
Qantas Group
The Qantas Group will continue pursuing its dual-brand strategy. The mainline will address the premium segment, while Jetstar will serve the lower yield markets utilizing its competitive cost structure. Both airlines are expected to increase domestic fleets by several Next-Gen short- and medium-haul aircraft and at the same time continue to retire older planes.
The Qantas group has ordered a substantial number of new aircraft aimed at both modernizing and expanding Jetstar’s and Qantas’ domestic fleet. With 50 firm orders and another 50 optional, Qantas is one of Boeing’s largest clients for the Dreamliner aircraft. The B787-8 is a core element of Qantas domestic fleet development plan. Fifteen B787-8s were ordered by the Qantas Group to be used on domestic operations. However, according to a recent announcement by the Qantas Group the entry of service of the B787-800 on domestic routes has been postponed. This statement is also supported by Boeing’s recent communication to further delay the delivery one quarter of a year:
The LCC subsidiary will receive the first eight B787-8s (313 seats), between end-2012 and 2014, to operate on their international network;
The larger A330-200s (303 seats) will be shifted from Jetstar to Qantas’ domestic fleet as the B787-8s are delivered, allowing the progressive retirement of the B767-300s (229 seats) currently operating on domestic routes.
As Jetstar receives the first B787-9s, the B787-8s will be deployed on Qantas’ domestic routes.
The group has also ordered 28 additional B737-800 and 6 A320/321 aircraft; partly to facilitate for domestic growth and replace the B737-400s.
The fleet strategy of Qantas group will result in a noticeable increase in average aircraft size on domestic routes from 175 seats in June 2010 to 180 seats in June 2016 (see Table 17).
Activity Forecasts for the Period 2010-2011 to 2015-2016 FINAL REPORT Page 29 Airservices Australia
Table 17 — Fleet size forecast Qantas Group – Domestic operations
Actual Forecasts
Seat number
June 2010
June 2011
June 2012
June 2013
June 2014
June 2015
June 2016
Dash 8 (100/200/300)
43 21 21 21 21 21 21 21
Q400 72 21 23 26 28 28 28 28
B717-200 117 11 11 11 11 11 11 11
B737-400 140 17 16 14 1\2 10 17 5
B737-800 156 38 41 45 49 54 59 63
A320-200 177 29 31 34 36 38 40 42
A321-200 213 3 4 4 4 4 4 4
B767-300ER 229 22 21 19 16 12 10 7
A330-200 303 5 6 7 9 12 12 12
B787-8 313* 0 0 0 0 0 2 5
Average seat number
175 176 176 177 178 179 180
Note: Dash8 (100/200/300 and Q400) are part of the Regional operations; QantasLink B717-200 are accounted under the Major domestic operations. Source: IATA assumptions based on Qantas Group’s communication,*announced configuration for JQ B787
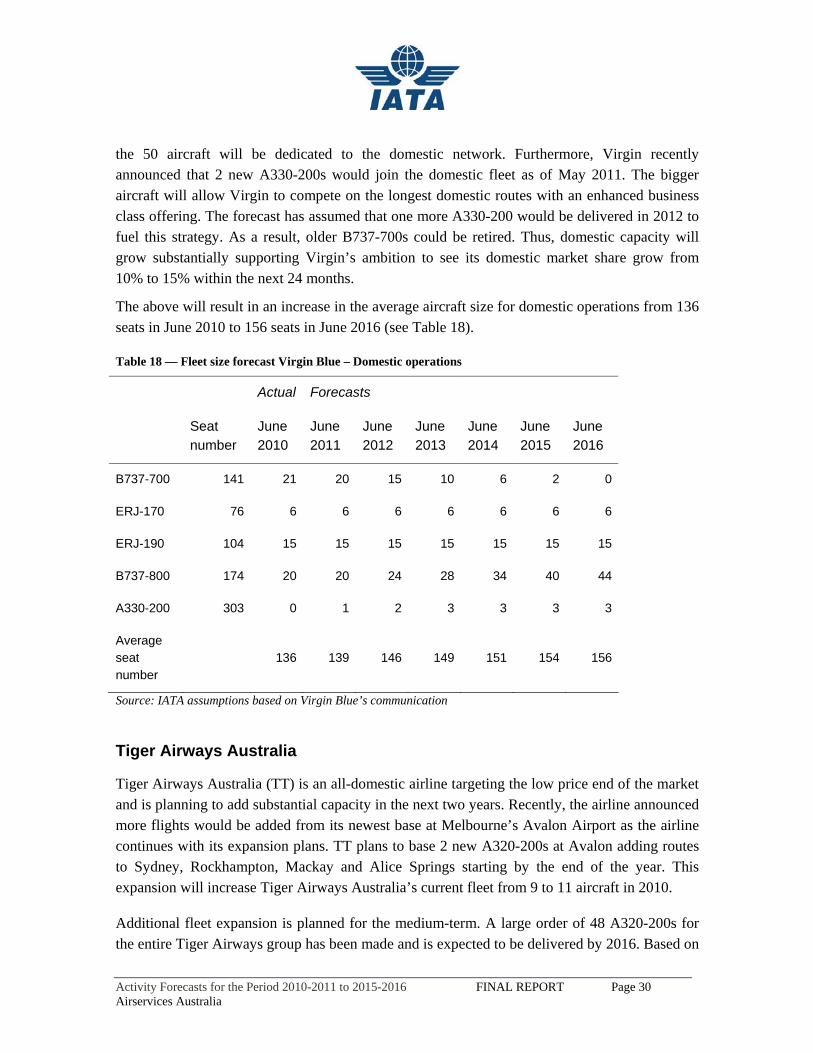
Virgin Blue
In May 2010, Virgin Blue (DJ) corrected its profit estimates for the year-end 2010 to AUD20-40 million down from 80 million mainly due to the rapid deterioration and increased volatility of its domestic and international leisure segment. The company will continue to monitor conditions with the option to adjust existing capacity through flexible fleet delivery schedules. Fleet cuts have not been announced.
In order to draw greater attention to the premium domestic travel market, Virgin Blue is believed to be intensifying its focus on the domestic segment; offering a wider spread network and newer, large aircraft. In April 2010, Virgin Blue announced a deal with Boeing to purchase 50 B737-800s on firm order to be delivered from 2011. IATA expects that ultimately about two-thirds of
Activity Forecasts for the Period 2010-2011 to 2015-2016 FINAL REPORT Page 30 Airservices Australia
the 50 aircraft will be dedicated to the domestic network. Furthermore, Virgin recently announced that 2 new A330-200s would join the domestic fleet as of May 2011. The bigger aircraft will allow Virgin to compete on the longest domestic routes with an enhanced business class offering. The forecast has assumed that one more A330-200 would be delivered in 2012 to fuel this strategy. As a result, older B737-700s could be retired. Thus, domestic capacity will grow substantially supporting Virgin’s ambition to see its domestic market share grow from 10% to 15% within the next 24 months.
The above will result in an increase in the average aircraft size for domestic operations from 136 seats in June 2010 to 156 seats in June 2016 (see Table 18).
Table 18 — Fleet size forecast Virgin Blue – Domestic operations
Actual Forecasts
Seat number
June 2010
June 2011
June 2012
June 2013
June 2014
June 2015
June 2016
B737-700 141 21 20 15 10 6 2 0
ERJ-170 76 6 6 6 6 6 6 6
ERJ-190 104 15 15 15 15 15 15 15
B737-800 174 20 20 24 28 34 40 44
A330-200 303 0 1 2 3 3 3 3
Average seat number
136 139 146 149 151 154 156
Source: IATA assumptions based on Virgin Blue’s communication
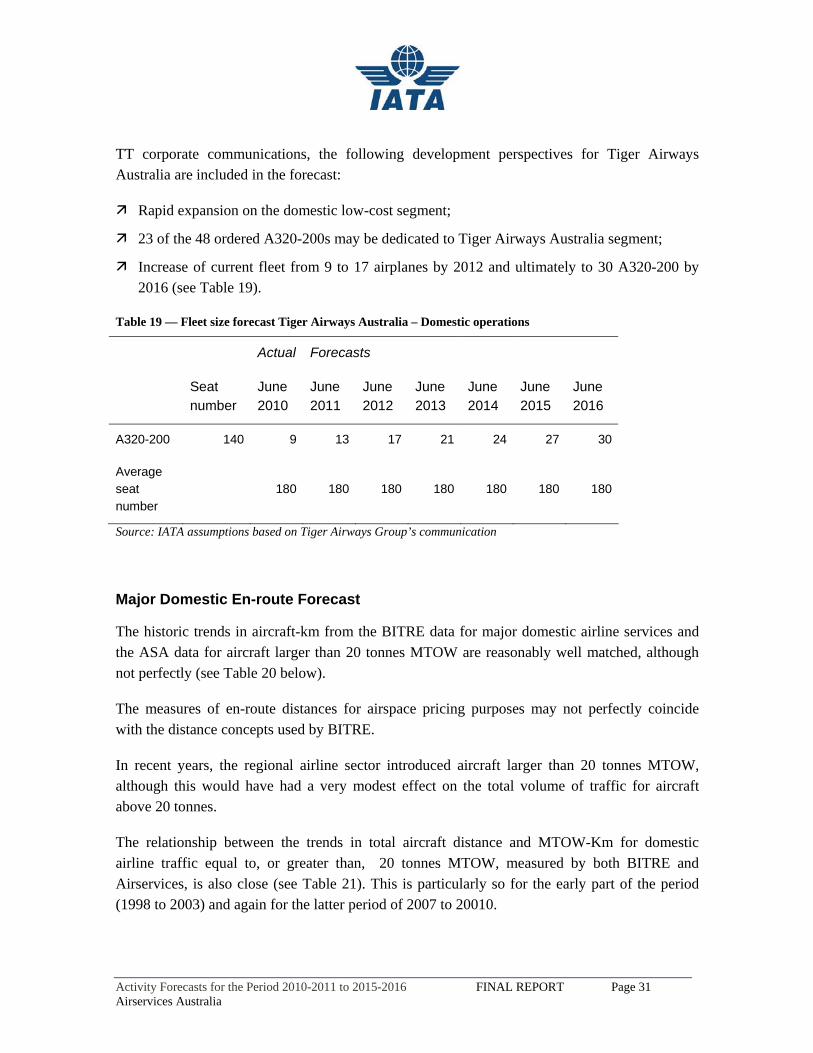
Tiger Airways Australia
Tiger Airways Australia (TT) is an all-domestic airline targeting the low price end of the market and is planning to add substantial capacity in the next two years. Recently, the airline announced more flights would be added from its newest base at Melbourne’s Avalon Airport as the airline continues with its expansion plans. TT plans to base 2 new A320-200s at Avalon adding routes to Sydney, Rockhampton, Mackay and Alice Springs starting by the end of the year. This expansion will increase Tiger Airways Australia’s current fleet from 9 to 11 aircraft in 2010.
Additional fleet expansion is planned for the medium-term. A large order of 48 A320-200s for the entire Tiger Airways group has been made and is expected to be delivered by 2016. Based on
Activity Forecasts for the Period 2010-2011 to 2015-2016 FINAL REPORT Page 31 Airservices Australia
TT corporate communications, the following development perspectives for Tiger Airways Australia are included in the forecast:
Rapid expansion on the domestic low-cost segment;
23 of the 48 ordered A320-200s may be dedicated to Tiger Airways Australia segment;
Increase of current fleet from 9 to 17 airplanes by 2012 and ultimately to 30 A320-200 by 2016 (see Table 19).
Table 19 — Fleet size forecast Tiger Airways Australia – Domestic operations
Actual Forecasts
Seat number
June 2010
June 2011
June 2012
June 2013
June 2014
June 2015
June 2016
A320-200 140 9 13 17 21 24 27 30
Average seat number
180 180 180 180 180 180 180
Source: IATA assumptions based on Tiger Airways Group’s communication
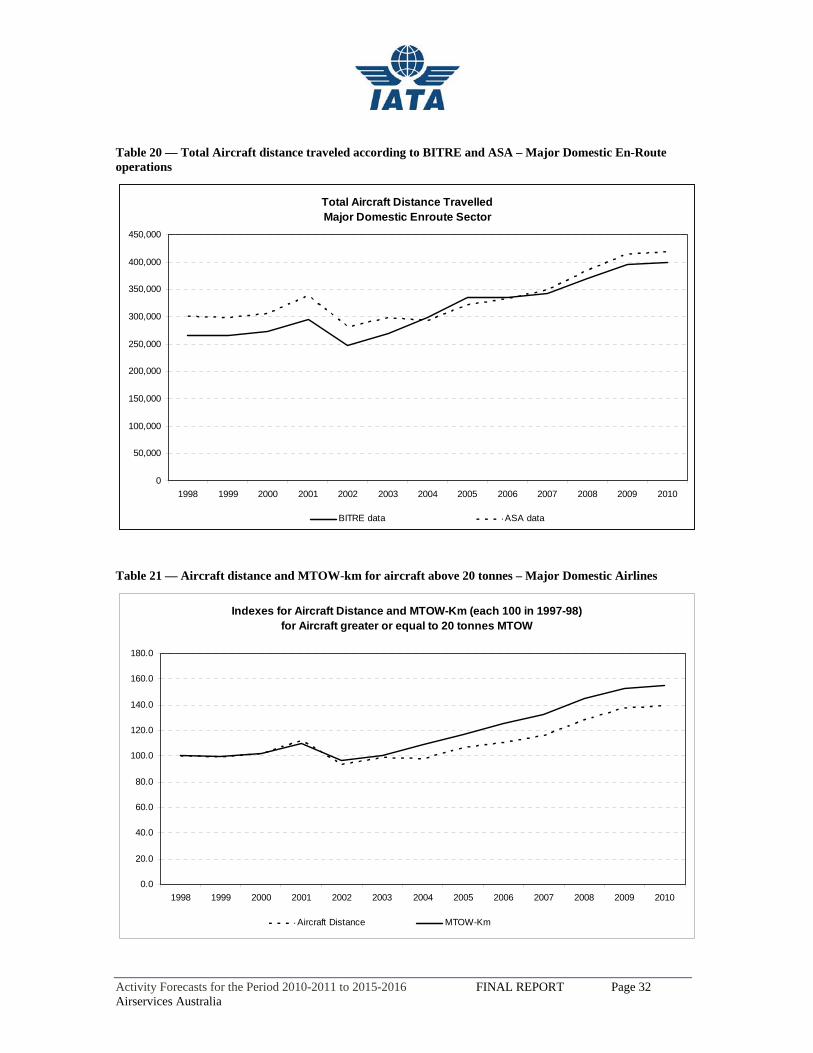
Major Domestic En-route Forecast
The historic trends in aircraft-km from the BITRE data for major domestic airline services and the ASA data for aircraft larger than 20 tonnes MTOW are reasonably well matched, although not perfectly (see Table 20 below).
The measures of en-route distances for airspace pricing purposes may not perfectly coincide with the distance concepts used by BITRE.
In recent years, the regional airline sector introduced aircraft larger than 20 tonnes MTOW, although this would have had a very modest effect on the total volume of traffic for aircraft above 20 tonnes.
The relationship between the trends in total aircraft distance and MTOW-Km for domestic airline traffic equal to, or greater than, 20 tonnes MTOW, measured by both BITRE and Airservices, is also close (see Table 21). This is particularly so for the early part of the period (1998 to 2003) and again for the latter period of 2007 to 20010.
Activity Forecasts for the Period 2010-2011 to 2015-2016 FINAL REPORT Page 32 Airservices Australia
Table 20 — Total Aircraft distance traveled according to BITRE and ASA – Major Domestic En-Route operations
Total Aircraft Distance TravelledMajor Domestic Enroute Sector
0
50,000
100,000
150,000
200,000
250,000
300,000
350,000
400,000
450,000
1998 1999 2000 2001 2002 2003 2004 2005 2006 2007 2008 2009 2010
BITRE data ASA data
Table 21 — Aircraft distance and MTOW-km for aircraft above 20 tonnes – Major Domestic Airlines
Indexes for Aircraft Distance and MTOW-Km (each 100 in 1997-98)for Aircraft greater or equal to 20 tonnes MTOW
0.0
20.0
40.0
60.0
80.0
100.0
120.0
140.0
160.0
180.0
1998 1999 2000 2001 2002 2003 2004 2005 2006 2007 2008 2009 2010
Aircraft Distance MTOW-Km
Activity Forecasts for the Period 2010-2011 to 2015-2016 FINAL REPORT Page 33 Airservices Australia
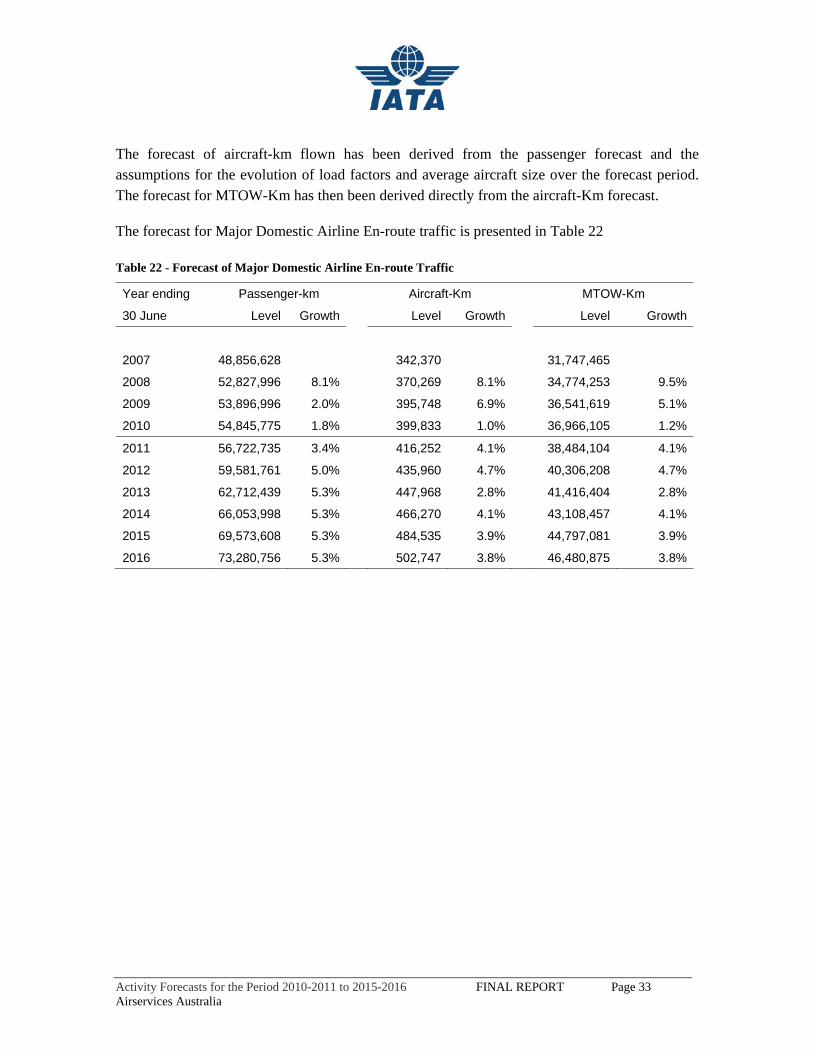
The forecast of aircraft-km flown has been derived from the passenger forecast and the assumptions for the evolution of load factors and average aircraft size over the forecast period. The forecast for MTOW-Km has then been derived directly from the aircraft-Km forecast.
The forecast for Major Domestic Airline En-route traffic is presented in Table 22 Table 22 - Forecast of Major Domestic Airline En-route Traffic
Year ending Passenger-km Aircraft-Km MTOW-Km
30 June Level Growth Level Growth Level Growth
2007 48,856,628 342,370 31,747,465
2008 52,827,996 8.1% 370,269 8.1% 34,774,253 9.5%
2009 53,896,996 2.0% 395,748 6.9% 36,541,619 5.1%
2010 54,845,775 1.8% 399,833 1.0% 36,966,105 1.2%
2011 56,722,735 3.4% 416,252 4.1% 38,484,104 4.1%
2012 59,581,761 5.0% 435,960 4.7% 40,306,208 4.7%
2013 62,712,439 5.3% 447,968 2.8% 41,416,404 2.8%
2014 66,053,998 5.3% 466,270 4.1% 43,108,457 4.1%
2015 69,573,608 5.3% 484,535 3.9% 44,797,081 3.9%
2016 73,280,756 5.3% 502,747 3.8% 46,480,875 3.8%
Activity Forecasts for the Period 2010-2011 to 2015-2016 FINAL REPORT Page 34 Airservices Australia
6. Major International En-Route Forecast
Forecast for Major International Demand
In contrast to the domestic market, the BITRE does not produce revenue passenger-km data for major international traffic. [Australian international services fly a large part of their total distance traveled within the areas and jurisdictions of other countries.] In this study, IATA has measured international demand by the numbers of international passengers, data for which was available from the BITRE.
The first step in the forecasting process was an analysis of the number of inbound plus the number of outbound international passengers. This passenger demand was examined using a regression of total passengers against a weighted average of the growth rate of Australian and the growth rate of World GDP. Higher Australian GDP encourages more Australians to travel overseas, and higher World GDP encourages more visitors to Australia.
The regression model for international passengers to and from Australia was estimated over the 1992-93 to 2009-10 period: Ln Passengers = 9.45 + 1.48*Ln (weighted average of the growths of Australian & World GDP). R2 = 0.98 tstat RealGDP = 28.1
There is no fare information for the international routes.
Exchange rates have an effect on international travel to and from Australia. An increase in the Australian dollar against another currency encourages Australians to visit that country but discourages travel to Australia by visitors from that country, and vice versa if the Australian dollar goes in the other direction. With many countries floating their currencies, there are likely to be different effects in different overseas markets. For the years to come, the EIU expects the Australian dollar to remain more or less stable against the US dollar and the Yen. However when compared to the 2005-2009 period, the value of the Australian dollar has risen against the US dollar and decreased against the Yen.
For business travel, the trade-weighted exchange rate index is a more relevant measure than the value of the Australian dollar against specific currencies. Over the period 2010-2014, the EIU forecasts a slightly decreasing value of the Australian dollar. However the expected net effect on travel to and from Australia is unclear. Moreover airlines adjust their revenue management strategies to reflect the evolutions in monetary parity, limiting the consequences of currency fluctuations on load factor. Therefore the impact of currency fluctuations on the overall demand has been discounted.
Activity Forecasts for the Period 2010-2011 to 2015-2016 FINAL REPORT Page 35 Airservices Australia
In a 2008 study, “Air passenger movements through capital city airports to 2025–26” (BITRE Working Paper 72), the trade-weighted index was included in seven models of international movements of overseas visitors at major airports and ‘other airports’. The statistical significance of the index was very weak in all except one of the equations - the one for Sydney. The index was not included in the models for international outbound Australian resident movements. This casts further doubt on the efficacy of attempting to include the exchange rate in the demand equations.
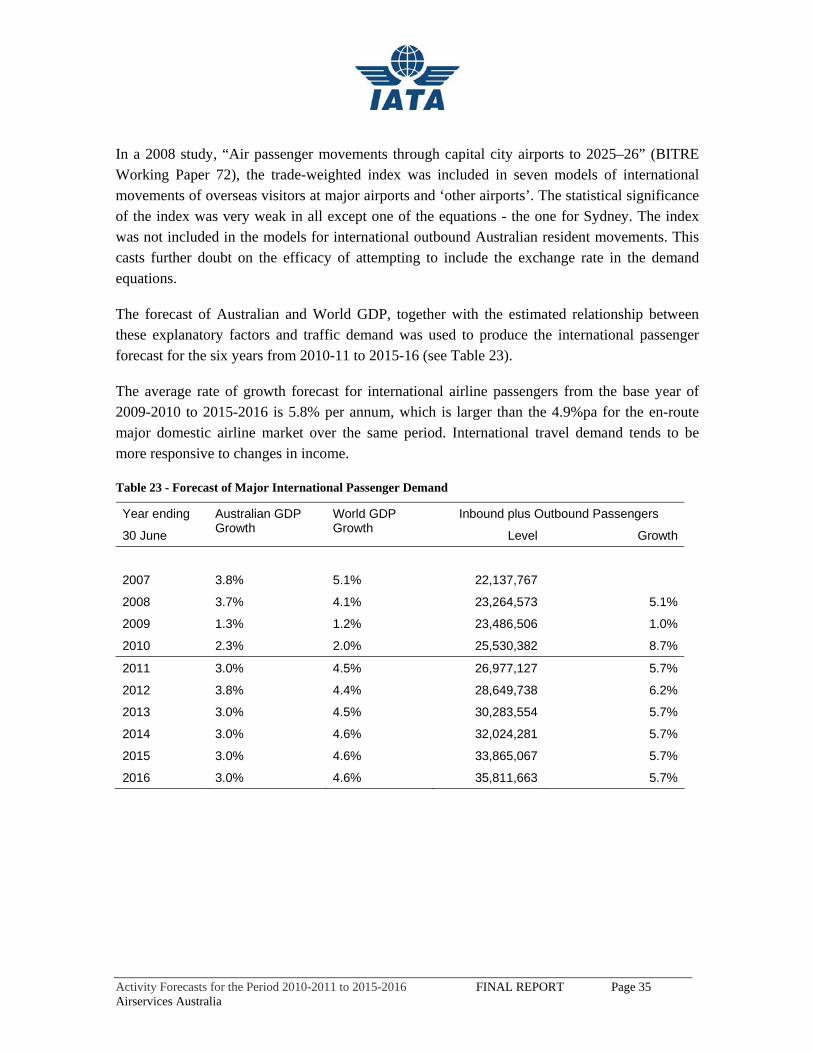
The forecast of Australian and World GDP, together with the estimated relationship between these explanatory factors and traffic demand was used to produce the international passenger forecast for the six years from 2010-11 to 2015-16 (see Table 23).
The average rate of growth forecast for international airline passengers from the base year of 2009-2010 to 2015-2016 is 5.8% per annum, which is larger than the 4.9%pa for the en-route major domestic airline market over the same period. International travel demand tends to be more responsive to changes in income.
Table 23 - Forecast of Major International Passenger Demand
Year ending Inbound plus Outbound Passengers
30 June
Australian GDP Growth
World GDP Growth Level Growth
2007 3.8% 5.1% 22,137,767
2008 3.7% 4.1% 23,264,573 5.1%
2009 1.3% 1.2% 23,486,506 1.0%
2010 2.3% 2.0% 25,530,382 8.7%
2011 3.0% 4.5% 26,977,127 5.7%
2012 3.8% 4.4% 28,649,738 6.2%
2013 3.0% 4.5% 30,283,554 5.7%
2014 3.0% 4.6% 32,024,281 5.7%
2015 3.0% 4.6% 33,865,067 5.7%
2016 3.0% 4.6% 35,811,663 5.7%
Activity Forecasts for the Period 2010-2011 to 2015-2016 FINAL REPORT Page 36 Airservices Australia
Major International Airline Fleet Perspectives
Pending fleet composition changes for the major carriers operating international services to and from Australia were also evaluated. The fleet strategies of the major Australian and foreign carriers were studied to derive the future trends in load factor and average aircraft size.
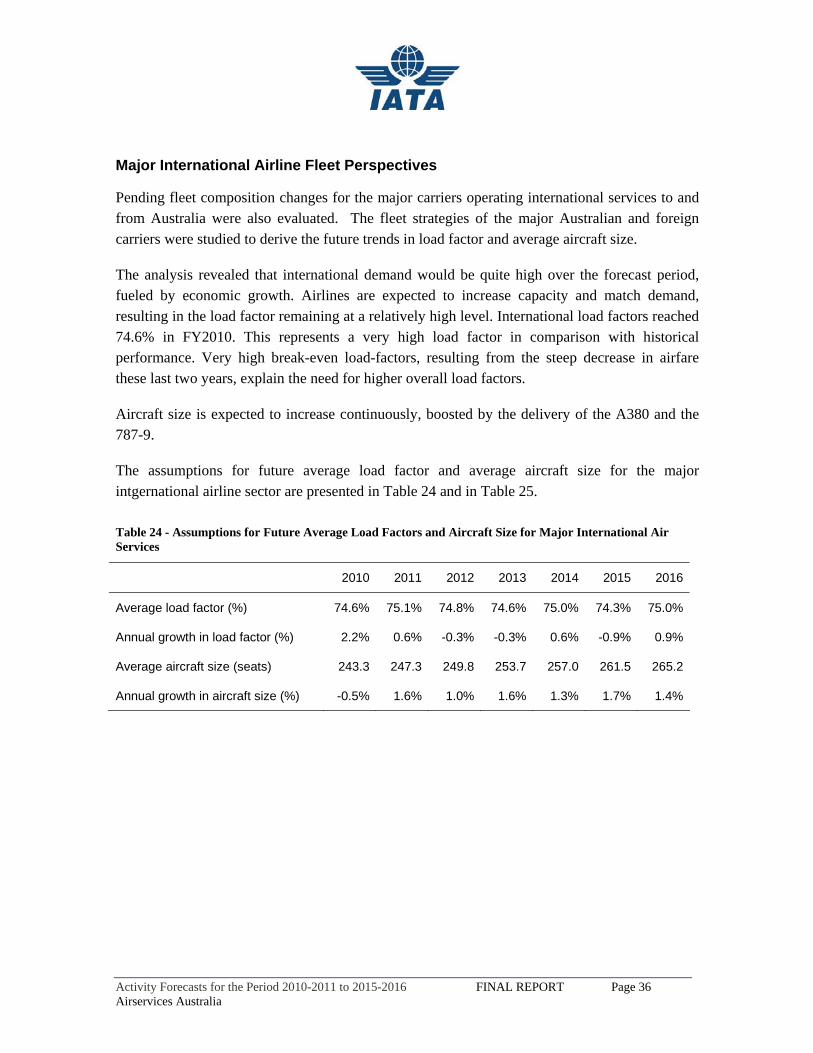
The analysis revealed that international demand would be quite high over the forecast period, fueled by economic growth. Airlines are expected to increase capacity and match demand, resulting in the load factor remaining at a relatively high level. International load factors reached 74.6% in FY2010. This represents a very high load factor in comparison with historical performance. Very high break-even load-factors, resulting from the steep decrease in airfare these last two years, explain the need for higher overall load factors.
Aircraft size is expected to increase continuously, boosted by the delivery of the A380 and the 787-9.
The assumptions for future average load factor and average aircraft size for the major intgernational airline sector are presented in Table 24 and in Table 25.
Table 24 - Assumptions for Future Average Load Factors and Aircraft Size for Major International Air Services
2010 2011 2012 2013 2014 2015 2016
Average load factor (%) 74.6% 75.1% 74.8% 74.6% 75.0% 74.3% 75.0%
Annual growth in load factor (%) 2.2% 0.6% -0.3% -0.3% 0.6% -0.9% 0.9%
Average aircraft size (seats) 243.3 247.3 249.8 253.7 257.0 261.5 265.2
Annual growth in aircraft size (%) -0.5% 1.6% 1.0% 1.6% 1.3% 1.7% 1.4%
Activity Forecasts for the Period 2010-2011 to 2015-2016 FINAL REPORT Page 37 Airservices Australia
Table 25 – Actual and forecasted load factors – Major International Airlines
Following is a summary of the airline fleet and development strategies that have been considered in preparation of the load factor and average aircraft size forecast.
Qantas Group
The Qantas group has ordered a substantial number of long-haul aircraft aimed at both modernizing and expanding Jetstar’s and Qantas’ international fleet. Qantas’ A380 program will continue to be the mainline’s core element on its international network expansion and is expected to replace the B747-400 on mature, dense routes such as London and Los Angeles.
In addition, Jetstar will receive the first of the 50 B787s strengthening its international network considerably. Boeing’s standard seat configuration for the small Dreamliner is 210-250 seats. Fitted with 313 seats for Jetstar, the B787-8 will offer a remarkable cost advantage over competition. As mentioned in the domestic section above, the first deliveries of the B787s will be aimed at Jetstar’s international network.
Load Factors (per cent of seats occupied)
58.0%
60.0%
62.0%
64.0%
66.0%
68.0%
70.0%
72.0%
74.0%
76.0%
78.0%
1998
1999
2000
2001
2002
2003
2004
2005
2006
2007
2008
2009
2010
2011
2012
2013
2014
2015
2016
Activity Forecasts for the Period 2010-2011 to 2015-2016 FINAL REPORT Page 38 Airservices Australia
Table 26 — Fleet size forecast Qantas Group – International operations
Actual Forecasts
Seat number
June 2010
June 2011
June 2012
June 2013
June 2014
June 2015
June 2016
B737-400 140 4 3 2 2 2 2 2
B737-800 156 3 4 6 6 6 6 6
A320-200 177 8 9 10 10 10 10 10
A321-200 213 3 3 4 4 4 4 4
B767-300ER 229 4 4 4 4 4 3 0
A330-200 303 11 12 13 13 13 13 13
A330-300 297 10 10 10 10 10 10 10
B747-400 394 21 20 20 19 19 19 18
B747-400ER 343 6 6 6 6 6 6 6
B787-8 313 0 0 0 3 6 4 1
B787-9 313 0 0 0 0 0 3 7
A380-800 450 6 8 12 13 15 18 20
Average seat number
307 308 308 312 315 320 325
Source: IATA assumptions based on Qantas Group’s communication, announced configuration for JQ B787
Jetstar will receive the B787-9s later than expected and will therefore be constrained in terms of the markets it can serve. For example, where the B787-9s could fly non-stop to Europe over the Qantas/Jetstar hub in Singapore, the B787-8s would still require a stopover. Therefore, Jetstar is likely to put its plans to serve Europe on hold. Eventually, non-stop European flights will be available using the B787-9s at the end of 2014.
The group has also ordered five additional A330-200 aircraft to compensate for the delays of the B787 program. Eventually, it is expected that all JQ A330-200s will be transferred from Jetstar’s international to the mainline’s domestic network and be replaced by B787-9.
Activity Forecasts for the Period 2010-2011 to 2015-2016 FINAL REPORT Page 39 Airservices Australia
Overall the Qantas group fleet dedicated to international operations will see its average aircraft size rise from 307 seats in June 2010 to 325 seats in June 2016.
Virgin Blue
Virgin is expected to slow down its international development and will instead focus on growing domestic market share from 10% to 15% in the next 12 to 24 months, V-Australia has recently deferred orders of two B777-300s and transferred them into options, bringing its international long-haul network expansion to a halt until 2012.
Virgin Blue’s order of around 50 B737-800s should have an impact on its medium-haul international network with an estimated nine additional narrowbody aircraft for international.
Thus, the average size of Virgin Blue’s aircraft on international routes is expected to slightly decrease from 215 seats in June 2010 to 205 seats in June 2016.
Table 27 — Fleet size forecast Virgin Blue – International operations
Actual Forecasts
Seat number
June 2010
June 2011
June 2012
June 2013
June 2014
June 2015
June 2016
B737-800 174 11 11 13 15 17 18 20
B777-300 328 4 4 4 4 4 5 5
Average seat number
215 215 210 206 209 207 205
Source: IATA assumptions based on Virgin Blue’s communication
Activity Forecasts for the Period 2010-2011 to 2015-2016 FINAL REPORT Page 40 Airservices Australia
Emirates
In 2009, Emirates (EK) was the largest foreign carrier serving Australia in terms of seat capacity. Based on current orders, EK is anticipated to increase its overall capacity by around 30% annually between 2010 and 2016. Given its already significant presence in Australia, the forecast assumes a slightly slower than average growth on Australian routes of about 20% annually.
Nonetheless, IATA estimates that a noticeable number of additional aircraft will be dedicated to the Australian market connecting Australia with Europe via the hub in Dubai. Currently, the Emirates backbone of the Australian fleet is the B777 with a seat capacity of 270 to 400 seats. IATA estimates the use of additional A380-800s for Australia by 2016. In addition to the B777-300ER, the 489-seater A380 is likely to become the dominant aircraft used for the Australian market. Moreover, Emirates ordered 50 A350-900 and 20 A350-1000 to be delivered from 2014. Some of them may be used to replace the older A340 serving on Australian routes.
Due to the utilization of larger aircraft, the average aircraft size is forecast to increase from 359 seats to 409 seats (see Table 28).
Table 28 — Capacity and aircraft size forecast for Emirates – International operations to Australia
Forecast per year
June 2010
June 2011
June 2012
June 2013
June 2014
June 2015
June 2016
Seat capacity growth
22.8% 18.6% 24.0% 18.9% 20.9% 17.8%
Average seat number 359 373 382 395 400 404 409
Source: IATA assumptions based on Emirates Group’s communication
Activity Forecasts for the Period 2010-2011 to 2015-2016 FINAL REPORT Page 41 Airservices Australia
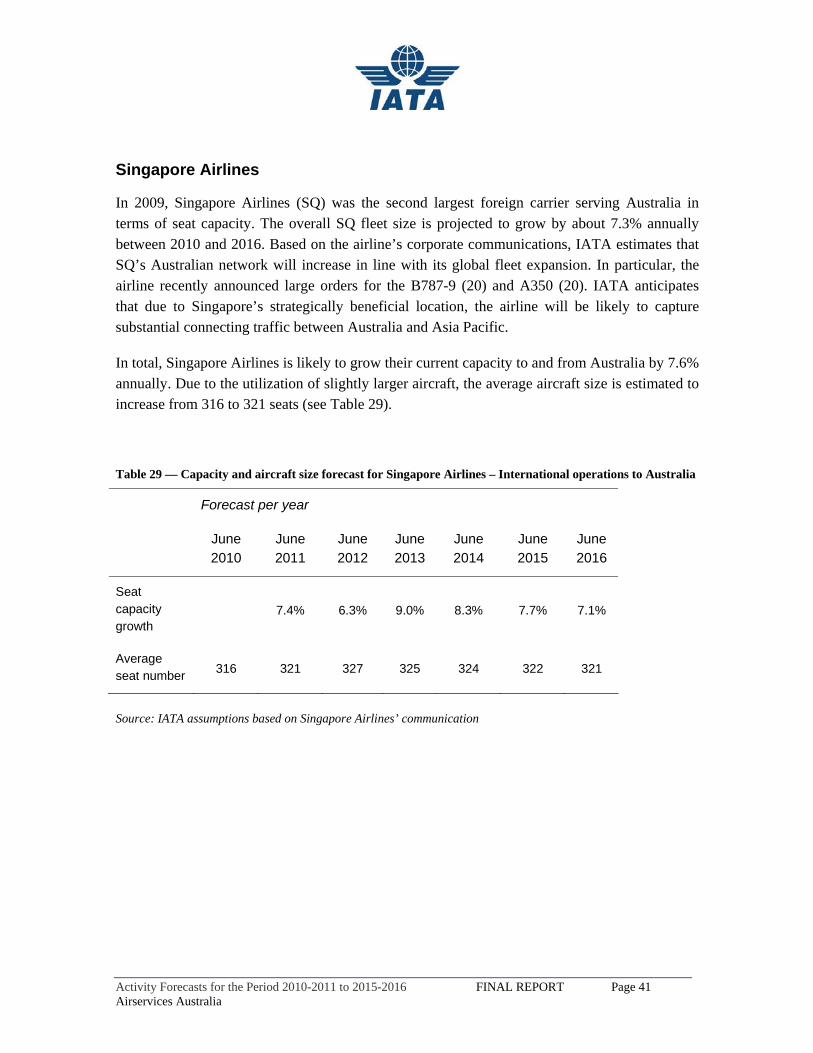
Singapore Airlines
In 2009, Singapore Airlines (SQ) was the second largest foreign carrier serving Australia in terms of seat capacity. The overall SQ fleet size is projected to grow by about 7.3% annually between 2010 and 2016. Based on the airline’s corporate communications, IATA estimates that SQ’s Australian network will increase in line with its global fleet expansion. In particular, the airline recently announced large orders for the B787-9 (20) and A350 (20). IATA anticipates that due to Singapore’s strategically beneficial location, the airline will be likely to capture substantial connecting traffic between Australia and Asia Pacific.
In total, Singapore Airlines is likely to grow their current capacity to and from Australia by 7.6% annually. Due to the utilization of slightly larger aircraft, the average aircraft size is estimated to increase from 316 to 321 seats (see Table 29).
Table 29 — Capacity and aircraft size forecast for Singapore Airlines – International operations to Australia
Forecast per year
June 2010
June 2011
June 2012
June 2013
June 2014
June 2015
June 2016
Seat capacity growth
7.4% 6.3% 9.0% 8.3% 7.7% 7.1%
Average seat number 316 321 327 325 324 322 321
Source: IATA assumptions based on Singapore Airlines’ communication
Activity Forecasts for the Period 2010-2011 to 2015-2016 FINAL REPORT Page 42 Airservices Australia
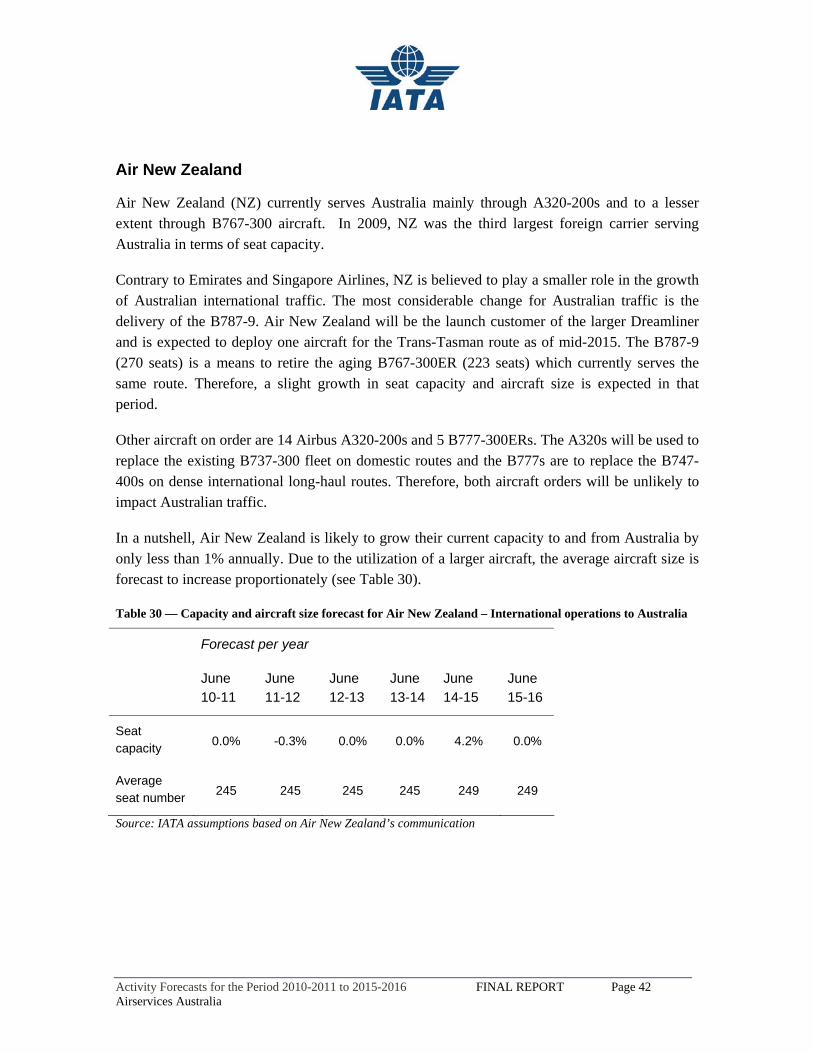
Air New Zealand
Air New Zealand (NZ) currently serves Australia mainly through A320-200s and to a lesser extent through B767-300 aircraft. In 2009, NZ was the third largest foreign carrier serving Australia in terms of seat capacity.
Contrary to Emirates and Singapore Airlines, NZ is believed to play a smaller role in the growth of Australian international traffic. The most considerable change for Australian traffic is the delivery of the B787-9. Air New Zealand will be the launch customer of the larger Dreamliner and is expected to deploy one aircraft for the Trans-Tasman route as of mid-2015. The B787-9 (270 seats) is a means to retire the aging B767-300ER (223 seats) which currently serves the same route. Therefore, a slight growth in seat capacity and aircraft size is expected in that period.
Other aircraft on order are 14 Airbus A320-200s and 5 B777-300ERs. The A320s will be used to replace the existing B737-300 fleet on domestic routes and the B777s are to replace the B747-400s on dense international long-haul routes. Therefore, both aircraft orders will be unlikely to impact Australian traffic.
In a nutshell, Air New Zealand is likely to grow their current capacity to and from Australia by only less than 1% annually. Due to the utilization of a larger aircraft, the average aircraft size is forecast to increase proportionately (see Table 30).
Table 30 — Capacity and aircraft size forecast for Air New Zealand – International operations to Australia
Forecast per year
June 10-11
June 11-12
June 12-13
June 13-14
June 14-15
June 15-16
Seat capacity 0.0% -0.3% 0.0% 0.0% 4.2% 0.0%
Average seat number 245 245 245 245 249 249
Source: IATA assumptions based on Air New Zealand’s communication
Activity Forecasts for the Period 2010-2011 to 2015-2016 FINAL REPORT Page 43 Airservices Australia
Major International En-route forecast
In addition to providing data on inbound and outbound passenger numbers for the international market, BITRE also produces in and out seats available and in and out flight numbers. This information allows the calculation of average load factors and average aircraft size.
ASA data was the source for distance (aircraft-Km). Most of the distance and MTOW-km flown in Australian airspace are by aircraft greater then 20 tonnes MTOW. The international MTOW-km generated by aircraft below 20 tonnes MTOW is negligible.
The average load factor and aircraft size for recent years are a starting point for forecasting load factors and aircraft size in future years..
Airservices data for total distance traveled in Australian airspace in 2009-10 was the starting point from which forecasts for future years were developed. The forecast growth in total distance traveled was derived from the forecasts of growth in passengers, load factors and average aircraft size. Growth in distance traveled would be higher, the higher is passenger growth, given constant average aircraft size and constant average load factor. However if load factors grow and if aircraft sizes grow, then the growth in aircraft distance traveled will be reduced (for any given passenger volume). The final forecast for each year includes the effects of changes in all three factors (passengers, load factors and aircraft size) in that year.
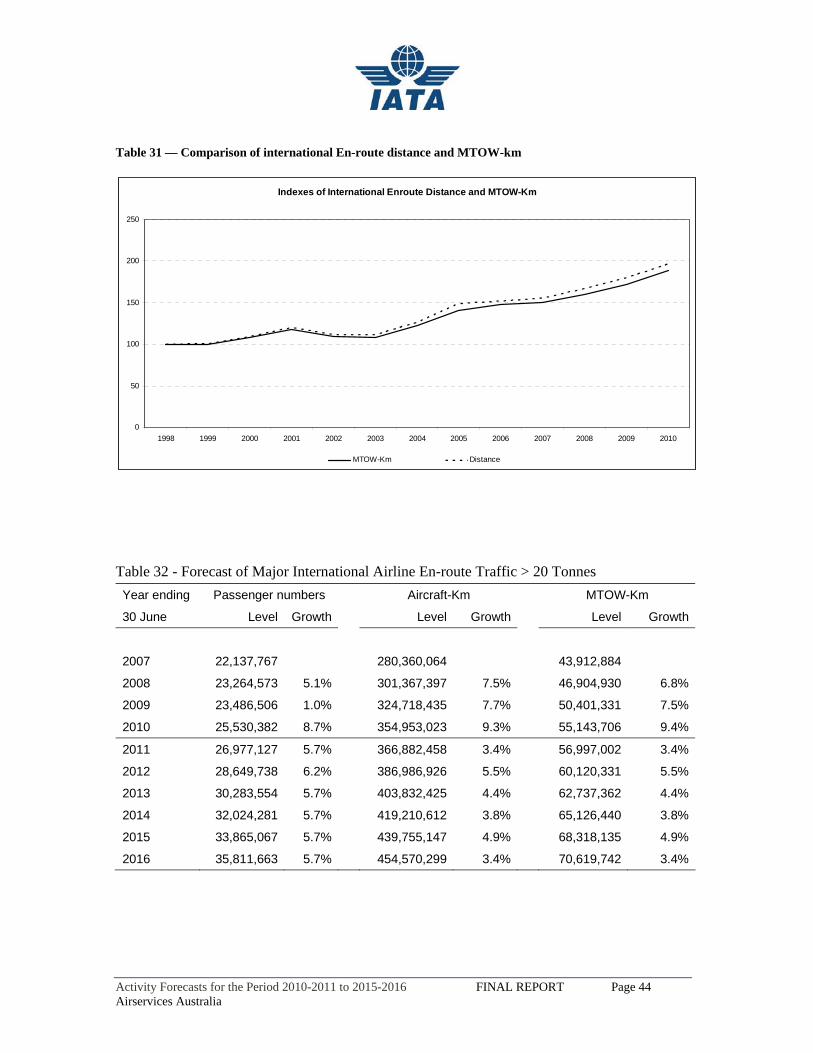
Table 31 illustrates the close relationship between distance traveled in the Australian airspace and MTOW-Km. The pattern and growth rates of the forecast for distance traveled are used to derive the forecast of MTOW-Km (see Table 32).
Activity Forecasts for the Period 2010-2011 to 2015-2016 FINAL REPORT Page 44 Airservices Australia
Table 31 — Comparison of international En-route distance and MTOW-km
Indexes of International Enroute Distance and MTOW-Km
0
50
100
150
200
250
1998 1999 2000 2001 2002 2003 2004 2005 2006 2007 2008 2009 2010
MTOW-Km Distance
Table 32 - Forecast of Major International Airline En-route Traffic > 20 Tonnes Year ending Passenger numbers Aircraft-Km MTOW-Km
30 June Level Growth Level Growth Level Growth
2007 22,137,767 280,360,064 43,912,884
2008 23,264,573 5.1% 301,367,397 7.5% 46,904,930 6.8%
2009 23,486,506 1.0% 324,718,435 7.7% 50,401,331 7.5%
2010 25,530,382 8.7% 354,953,023 9.3% 55,143,706 9.4%
2011 26,977,127 5.7% 366,882,458 3.4% 56,997,002 3.4%
2012 28,649,738 6.2% 386,986,926 5.5% 60,120,331 5.5%
2013 30,283,554 5.7% 403,832,425 4.4% 62,737,362 4.4%
2014 32,024,281 5.7% 419,210,612 3.8% 65,126,440 3.8%
2015 33,865,067 5.7% 439,755,147 4.9% 68,318,135 4.9%
2016 35,811,663 5.7% 454,570,299 3.4% 70,619,742 3.4%
Activity Forecasts for the Period 2010-2011 to 2015-2016 FINAL REPORT Page 45 Airservices Australia
7. Regional Domestic En-Route Forecast
Regional air traffic (as defined by BITRE) is carried by regional airlines flying between the major cities and regional centers or between different regional centers. Many of these services use much smaller aircraft than the major domestic services, although important regional services are provided with aircraft with a MTOW of more than 20 tonnes (see Table 33).
Table 33 — Aircraft Providing Regional Services Above and Below 20 tonnes MTOW
Aircraft type Airline Aircraft
numbersAircraft
sizeCapacity Capacity
Share Ave
aircraft size
(Seats) (Seats) (%) (Seats) Aircraft equal to or greater than 20 tonnes MTOW Fokker 100 Skywest 8 100 800 Bombardier Q400 Qantas Link 21 70 1470 Embraer E170 Air North 3 76 228 Fokker FK 50 Skywest 9 50 450
All aircraft > 20 t MTOW 41 2948 46.6 72 Aircraft less than 20 tonnes MTOW Bombardier Q300 Qantas Link 15 50 750 Bombardier Q200 Qantas Link 5 36 180 Bombardier Q100 Skytrans 11 36 396 ATR 42-500 No-one 0 45 0 SAAB SF340 Regional
Express (Rex) 46 34 1564
Embraer EMB120 Brasilia Air North 5 30 150 Fairchild SA227 Metroliner Air North,
Sharp, Brindabella
10 19 190
Raytheon Super King Air B200
West Wing, Skytrans
2 10 20
Beechcraft 1900D West Wing 2 20 40 BAe Jetstream J41 Brindabella
Airlines 3 30 90
All aircraft < 20 t MTOW 99 3380 53.4 34 Total 140 6328 45
QantasLink provides both regional services with Bombardier Q400, Q300 and Q200 aircraft, and major domestic services with 11 Boeing 717-200 jet aircraft. On the other hand, all the services of other regional airlines, which may provide some of their services with jet aircraft, are designated as regional by BITRE (for example Skywest and Airnorth).
Activity Forecasts for the Period 2010-2011 to 2015-2016 FINAL REPORT Page 46 Airservices Australia
The BITRE regional traffic data includes, but does not distinguish between, operations by both above- and below- 20 tonnes MTOW categories of aircraft. This presents a challenge, since passenger data is available only from BITRE and there is a requirement to disaggregate the forecast into these two categories of traffic.
Analysis of Traffic Demand
The trend in passenger-km for regional services is illustrated in the Table 34 below.
Table 34 — Historical trend in Regional Domestic Passenger Traffic – 1985 to 2010
Trend in Regional Domestic Passenger Traffic
0
500,000
1,000,000
1,500,000
2,000,000
2,500,000
3,000,000
1985
1986
1987
1988
1989
1990
1991
1992
1993
1994
1995
1996
1997
1998
1999
2000
2001
2002
2003
2004
2005
2006
2007
2008
2009
2010
Passenger-Km
This sector experienced very high growth throughout the 1990s until 2000-01. In 2001-02, there was a severe collapse in traffic, followed by a recovery in subsequent years.
In some centers, mining and tourism have expanded and contributed to growth in regional air transport. On the other hand, some rural areas have stagnated or declined. However, there have been other very important factors affecting the industry and its organization. In the 1990s, a major carrier, Ansett, was progressively transferring some of its services to regional airline affiliates such as Hazelton Airlines and Kendall Airlines. This was important on certain routes, for example Canberra-Sydney. It had a modest effect on the total major domestic traffic but a substantial effect on the much smaller regional sector. With the collapse of Ansett in 2001, and
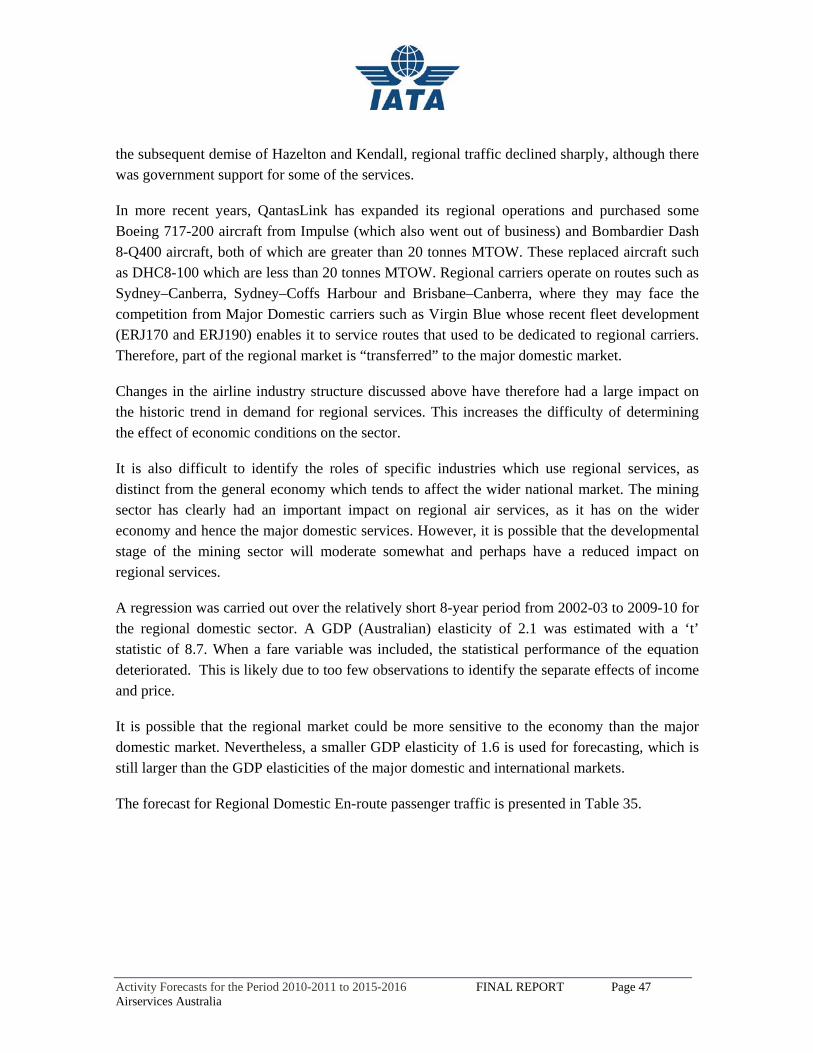
Activity Forecasts for the Period 2010-2011 to 2015-2016 FINAL REPORT Page 47 Airservices Australia
the subsequent demise of Hazelton and Kendall, regional traffic declined sharply, although there was government support for some of the services.
In more recent years, QantasLink has expanded its regional operations and purchased some Boeing 717-200 aircraft from Impulse (which also went out of business) and Bombardier Dash 8-Q400 aircraft, both of which are greater than 20 tonnes MTOW. These replaced aircraft such as DHC8-100 which are less than 20 tonnes MTOW. Regional carriers operate on routes such as Sydney–Canberra, Sydney–Coffs Harbour and Brisbane–Canberra, where they may face the competition from Major Domestic carriers such as Virgin Blue whose recent fleet development (ERJ170 and ERJ190) enables it to service routes that used to be dedicated to regional carriers. Therefore, part of the regional market is “transferred” to the major domestic market.
Changes in the airline industry structure discussed above have therefore had a large impact on the historic trend in demand for regional services. This increases the difficulty of determining the effect of economic conditions on the sector.
It is also difficult to identify the roles of specific industries which use regional services, as distinct from the general economy which tends to affect the wider national market. The mining sector has clearly had an important impact on regional air services, as it has on the wider economy and hence the major domestic services. However, it is possible that the developmental stage of the mining sector will moderate somewhat and perhaps have a reduced impact on regional services.
A regression was carried out over the relatively short 8-year period from 2002-03 to 2009-10 for the regional domestic sector. A GDP (Australian) elasticity of 2.1 was estimated with a ‘t’ statistic of 8.7. When a fare variable was included, the statistical performance of the equation deteriorated. This is likely due to too few observations to identify the separate effects of income and price.
It is possible that the regional market could be more sensitive to the economy than the major domestic market. Nevertheless, a smaller GDP elasticity of 1.6 is used for forecasting, which is still larger than the GDP elasticities of the major domestic and international markets.
The forecast for Regional Domestic En-route passenger traffic is presented in Table 35.
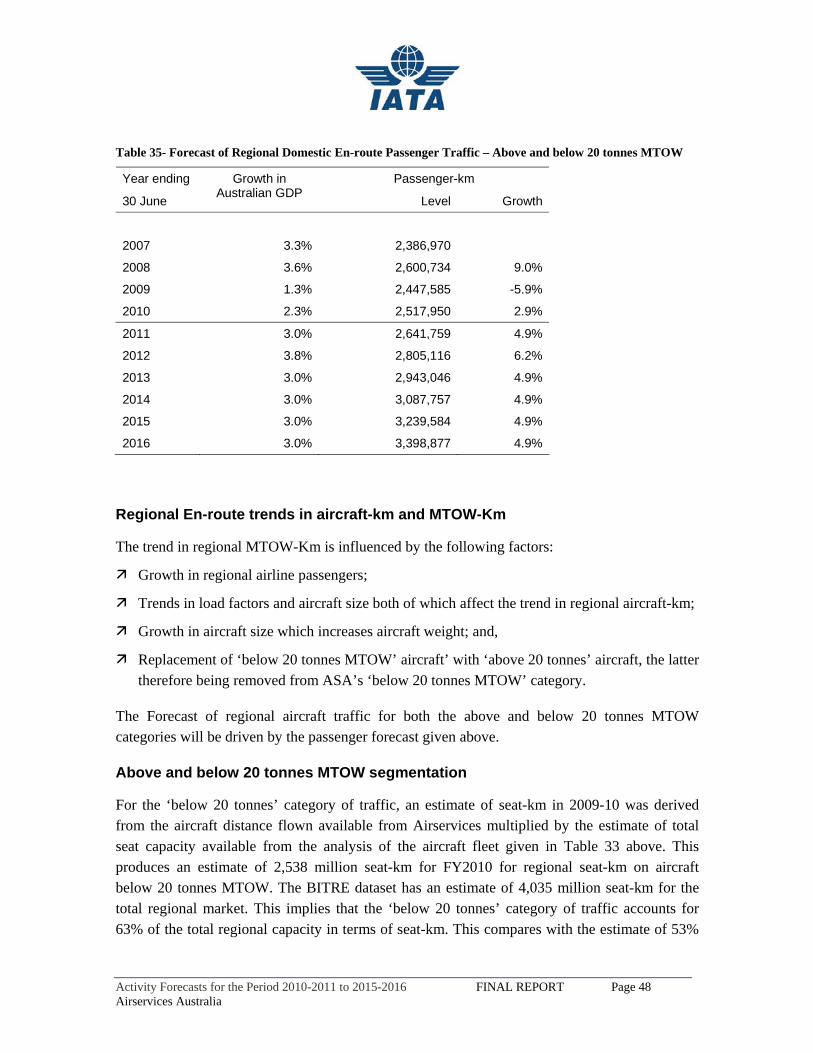
Activity Forecasts for the Period 2010-2011 to 2015-2016 FINAL REPORT Page 48 Airservices Australia
Table 35- Forecast of Regional Domestic En-route Passenger Traffic – Above and below 20 tonnes MTOW
Year ending Passenger-km
30 June
Growth in Australian GDP Level Growth
2007 3.3% 2,386,970
2008 3.6% 2,600,734 9.0%
2009 1.3% 2,447,585 -5.9%
2010 2.3% 2,517,950 2.9%
2011 3.0% 2,641,759 4.9%
2012 3.8% 2,805,116 6.2%
2013 3.0% 2,943,046 4.9%
2014 3.0% 3,087,757 4.9%
2015 3.0% 3,239,584 4.9%
2016 3.0% 3,398,877 4.9%
Regional En-route trends in aircraft-km and MTOW-Km
The trend in regional MTOW-Km is influenced by the following factors:
Growth in regional airline passengers;
Trends in load factors and aircraft size both of which affect the trend in regional aircraft-km;
Growth in aircraft size which increases aircraft weight; and,
Replacement of ‘below 20 tonnes MTOW’ aircraft’ with ‘above 20 tonnes’ aircraft, the latter therefore being removed from ASA’s ‘below 20 tonnes MTOW’ category.
The Forecast of regional aircraft traffic for both the above and below 20 tonnes MTOW categories will be driven by the passenger forecast given above.
Above and below 20 tonnes MTOW segmentation
For the ‘below 20 tonnes’ category of traffic, an estimate of seat-km in 2009-10 was derived from the aircraft distance flown available from Airservices multiplied by the estimate of total seat capacity available from the analysis of the aircraft fleet given in Table 33 above. This produces an estimate of 2,538 million seat-km for FY2010 for regional seat-km on aircraft below 20 tonnes MTOW. The BITRE dataset has an estimate of 4,035 million seat-km for the total regional market. This implies that the ‘below 20 tonnes’ category of traffic accounts for 63% of the total regional capacity in terms of seat-km. This compares with the estimate of 53%
Activity Forecasts for the Period 2010-2011 to 2015-2016 FINAL REPORT Page 49 Airservices Australia
based solely on the analysis of the capacity shares of the fleet of aircraft supplying regional services as defined by BITRE.
If about 45% of the regional seat-km provided by regional services (as defined by BITRE) were on ‘above 20 tonnes’ aircraft, the effect of adding this traffic to BITRE’s figure for major domestic seat-km would be to increase it by about 2.7%. Differences in the assumptions used for forecasting the ‘above 20 tonnes’ traffic currently included in regional services would have very little impact on the forecast of major domestic traffic presented earlier in the report.
The aircraft-km for BITRE’s regional services and for ASA’s domestic passenger operations by aircraft below 20 tonnes are much closer together than the seat-kms discussed above. This is because fewer aircraft-km are required to provide seat-km when larger aircraft are used.
In regard to the forecasts for ‘below 20 tonnes’ aircraft, there is no additional information to change the assumptions built in to the wider regional passenger forecast.
Regional load factor and aircraft size
Load factors have been quite stable since 2002-2003, varying between 60% and 67% with an average of 64%. In 2010, the regional load factor was 62.4%, slightly behind the average. For future years, considerate is conservatively assumed that regional load factors will return to the historical average over the next three years as demand grows.
The aircraft size of the regional airlines has been increasing continuously since 2002-2003, from 35 seats to almost 50 seats (+5% p.a. derived from BITRE seat-km and aircraft-km and including both below and above 20 tonnes MTOW aircraft). QantasLink fleet strategy to expand their fleet with higher capacity and heavier models (B717 and Dash 8-Q400) contributed to this increase. Therefore it is estimated that the growth trend for aircraft below 20 tonnes MTOW has been slower, only half of the total growth (i.e. +2.5% p.a.). For future years, a continuous 2.5% growth trend is anticipated.
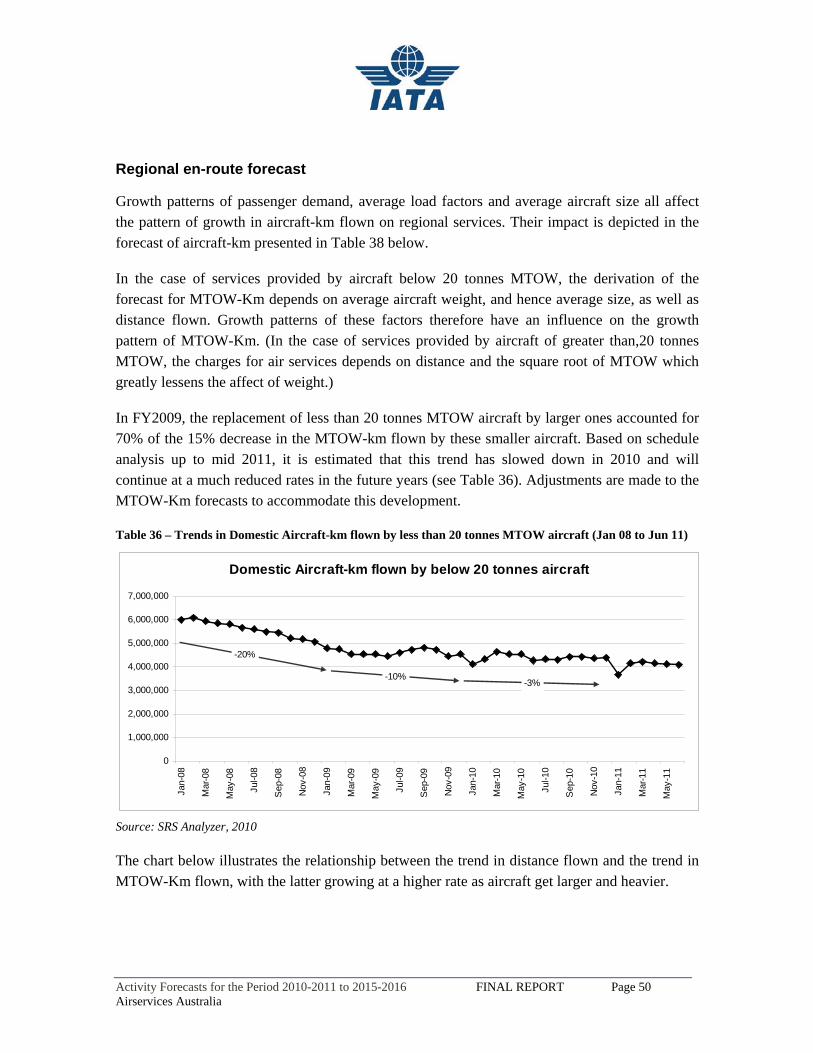
Activity Forecasts for the Period 2010-2011 to 2015-2016 FINAL REPORT Page 50 Airservices Australia
Regional en-route forecast
Growth patterns of passenger demand, average load factors and average aircraft size all affect the pattern of growth in aircraft-km flown on regional services. Their impact is depicted in the forecast of aircraft-km presented in Table 38 below.
In the case of services provided by aircraft below 20 tonnes MTOW, the derivation of the forecast for MTOW-Km depends on average aircraft weight, and hence average size, as well as distance flown. Growth patterns of these factors therefore have an influence on the growth pattern of MTOW-Km. (In the case of services provided by aircraft of greater than,20 tonnes MTOW, the charges for air services depends on distance and the square root of MTOW which greatly lessens the affect of weight.)
In FY2009, the replacement of less than 20 tonnes MTOW aircraft by larger ones accounted for 70% of the 15% decrease in the MTOW-km flown by these smaller aircraft. Based on schedule analysis up to mid 2011, it is estimated that this trend has slowed down in 2010 and will continue at a much reduced rates in the future years (see Table 36). Adjustments are made to the MTOW-Km forecasts to accommodate this development.
Table 36 – Trends in Domestic Aircraft-km flown by less than 20 tonnes MTOW aircraft (Jan 08 to Jun 11)
Source: SRS Analyzer, 2010
The chart below illustrates the relationship between the trend in distance flown and the trend in MTOW-Km flown, with the latter growing at a higher rate as aircraft get larger and heavier.
Domestic Aircraft-km flown by below 20 tonnes aircraft
0
1,000,000
2,000,000
3,000,000
4,000,000
5,000,000
6,000,000
7,000,000
Jan-
08
Mar
-08
May
-08
Jul-0
8
Sep
-08
Nov
-08
Jan-
09
Mar
-09
May
-09
Jul-0
9
Sep
-09
Nov
-09
Jan-
10
Mar
-10
May
-10
Jul-1
0
Sep
-10
Nov
-10
Jan-
11
Mar
-11
May
-11
-20%
-10%-3%
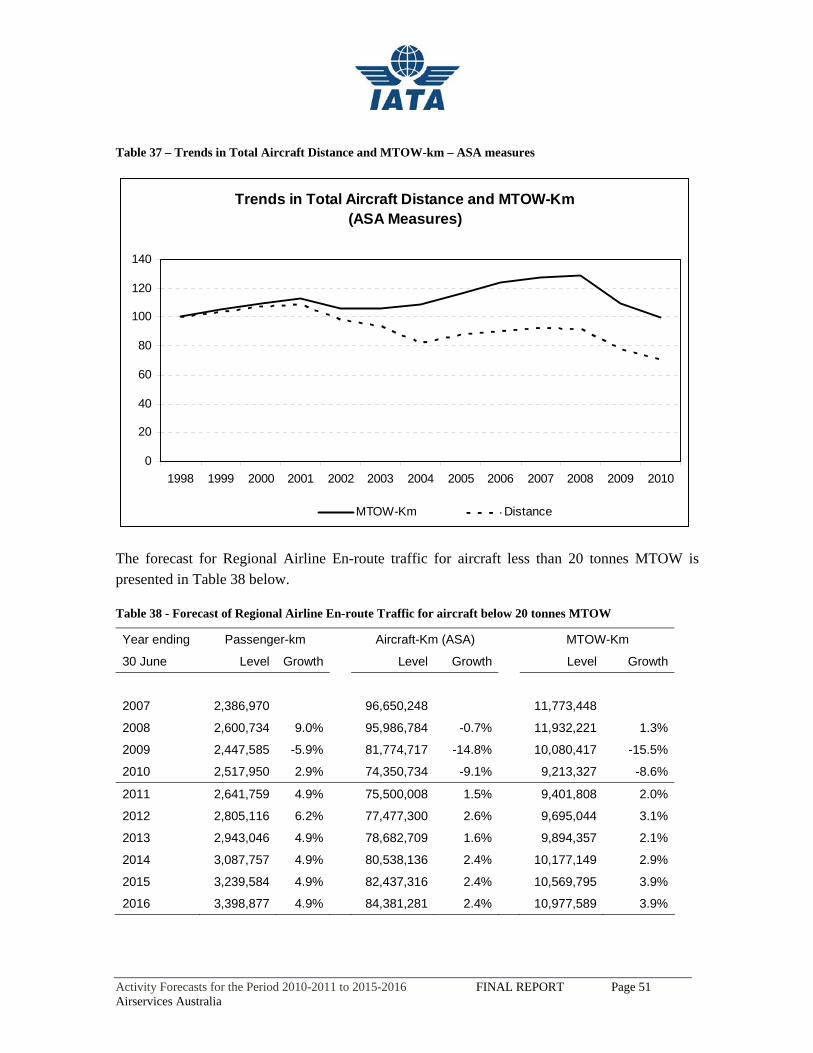
Activity Forecasts for the Period 2010-2011 to 2015-2016 FINAL REPORT Page 51 Airservices Australia
Table 37 – Trends in Total Aircraft Distance and MTOW-km – ASA measures
Trends in Total Aircraft Distance and MTOW-Km(ASA Measures)
0
20
40
60
80
100
120
140
1998 1999 2000 2001 2002 2003 2004 2005 2006 2007 2008 2009 2010
MTOW-Km Distance
The forecast for Regional Airline En-route traffic for aircraft less than 20 tonnes MTOW is presented in Table 38 below.
Table 38 - Forecast of Regional Airline En-route Traffic for aircraft below 20 tonnes MTOW
Year ending Passenger-km Aircraft-Km (ASA) MTOW-Km
30 June Level Growth Level Growth Level Growth
2007 2,386,970 96,650,248 11,773,448
2008 2,600,734 9.0% 95,986,784 -0.7% 11,932,221 1.3%
2009 2,447,585 -5.9% 81,774,717 -14.8% 10,080,417 -15.5%
2010 2,517,950 2.9% 74,350,734 -9.1% 9,213,327 -8.6%
2011 2,641,759 4.9% 75,500,008 1.5% 9,401,808 2.0%
2012 2,805,116 6.2% 77,477,300 2.6% 9,695,044 3.1%
2013 2,943,046 4.9% 78,682,709 1.6% 9,894,357 2.1%
2014 3,087,757 4.9% 80,538,136 2.4% 10,177,149 2.9%
2015 3,239,584 4.9% 82,437,316 2.4% 10,569,795 3.9%
2016 3,398,877 4.9% 84,381,281 2.4% 10,977,589 3.9%
Activity Forecasts for the Period 2010-2011 to 2015-2016 FINAL REPORT Page 52 Airservices Australia
8. Regional International En-route forecast
The international traffic using aircraft less than 20 tonnes MTOW is the smallest category of traffic, representing about 0.5% of total MTOW-Km. It is about 1% of the total MTOW-Km of all international traffic.
The forecast of this traffic assumes the same rate of passenger growth as for major international traffic and also a similar pattern of development of the average load factor. The forecast of regional international MTOW-Km is included in the total MTOW-Km forecast for aircraft less than 20 tonnes MTOW.
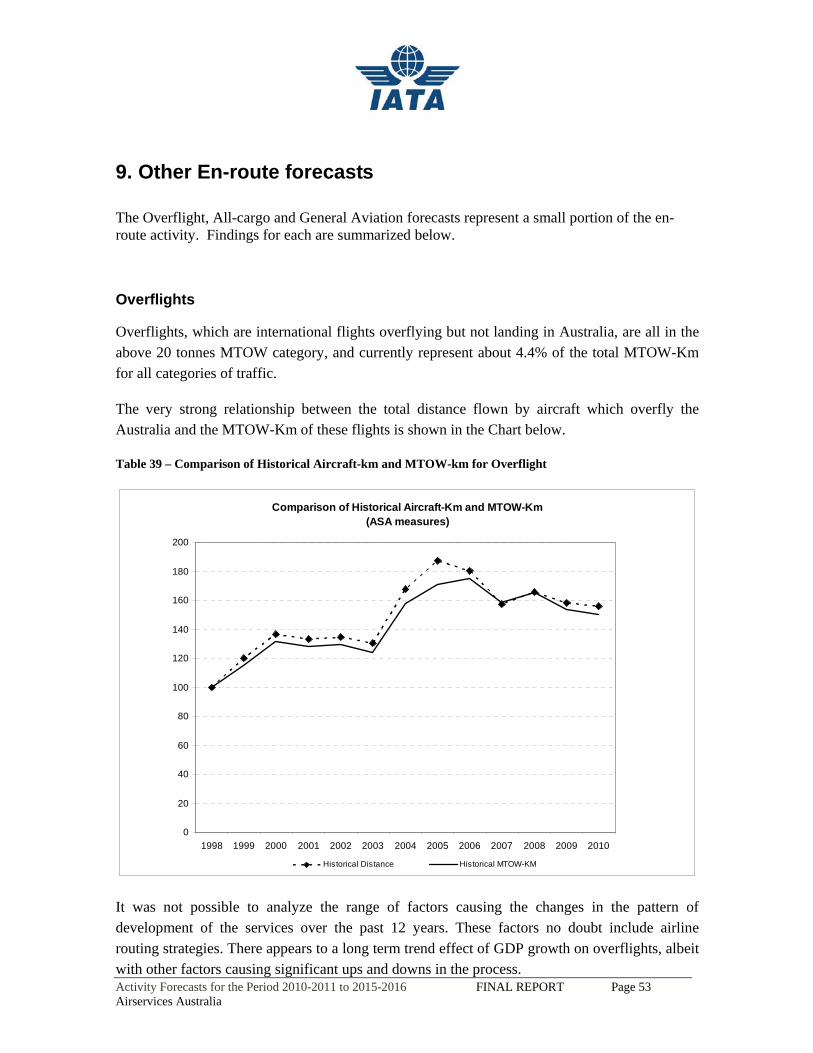
Activity Forecasts for the Period 2010-2011 to 2015-2016 FINAL REPORT Page 53 Airservices Australia
9. Other En-route forecasts The Overflight, All-cargo and General Aviation forecasts represent a small portion of the en-route activity. Findings for each are summarized below.
Overflights
Overflights, which are international flights overflying but not landing in Australia, are all in the above 20 tonnes MTOW category, and currently represent about 4.4% of the total MTOW-Km for all categories of traffic.
The very strong relationship between the total distance flown by aircraft which overfly the Australia and the MTOW-Km of these flights is shown in the Chart below.
Table 39 – Comparison of Historical Aircraft-km and MTOW-km for Overflight
Comparison of Historical Aircraft-Km and MTOW-Km(ASA measures)
0
20
40
60
80
100
120
140
160
180
200
1998 1999 2000 2001 2002 2003 2004 2005 2006 2007 2008 2009 2010
Historical Distance Historical MTOW-KM
It was not possible to analyze the range of factors causing the changes in the pattern of development of the services over the past 12 years. These factors no doubt include airline routing strategies. There appears to a long term trend effect of GDP growth on overflights, albeit with other factors causing significant ups and downs in the process.
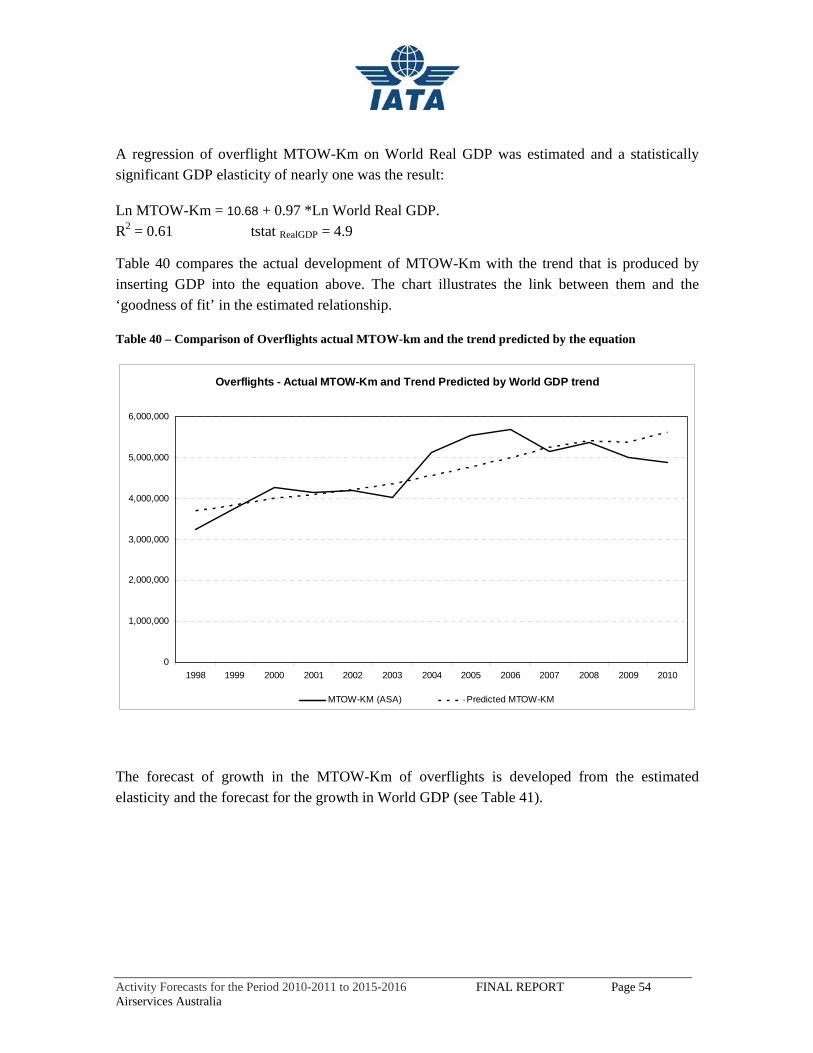
Activity Forecasts for the Period 2010-2011 to 2015-2016 FINAL REPORT Page 54 Airservices Australia
A regression of overflight MTOW-Km on World Real GDP was estimated and a statistically significant GDP elasticity of nearly one was the result:
Ln MTOW-Km = 10.68 + 0.97 *Ln World Real GDP. R2 = 0.61 tstat RealGDP = 4.9
Table 40 compares the actual development of MTOW-Km with the trend that is produced by inserting GDP into the equation above. The chart illustrates the link between them and the ‘goodness of fit’ in the estimated relationship.
Table 40 – Comparison of Overflights actual MTOW-km and the trend predicted by the equation
Overflights - Actual MTOW-Km and Trend Predicted by World GDP trend
0
1,000,000
2,000,000
3,000,000
4,000,000
5,000,000
6,000,000
1998 1999 2000 2001 2002 2003 2004 2005 2006 2007 2008 2009 2010
MTOW-KM (ASA) Predicted MTOW-KM
The forecast of growth in the MTOW-Km of overflights is developed from the estimated elasticity and the forecast for the growth in World GDP (see Table 41).
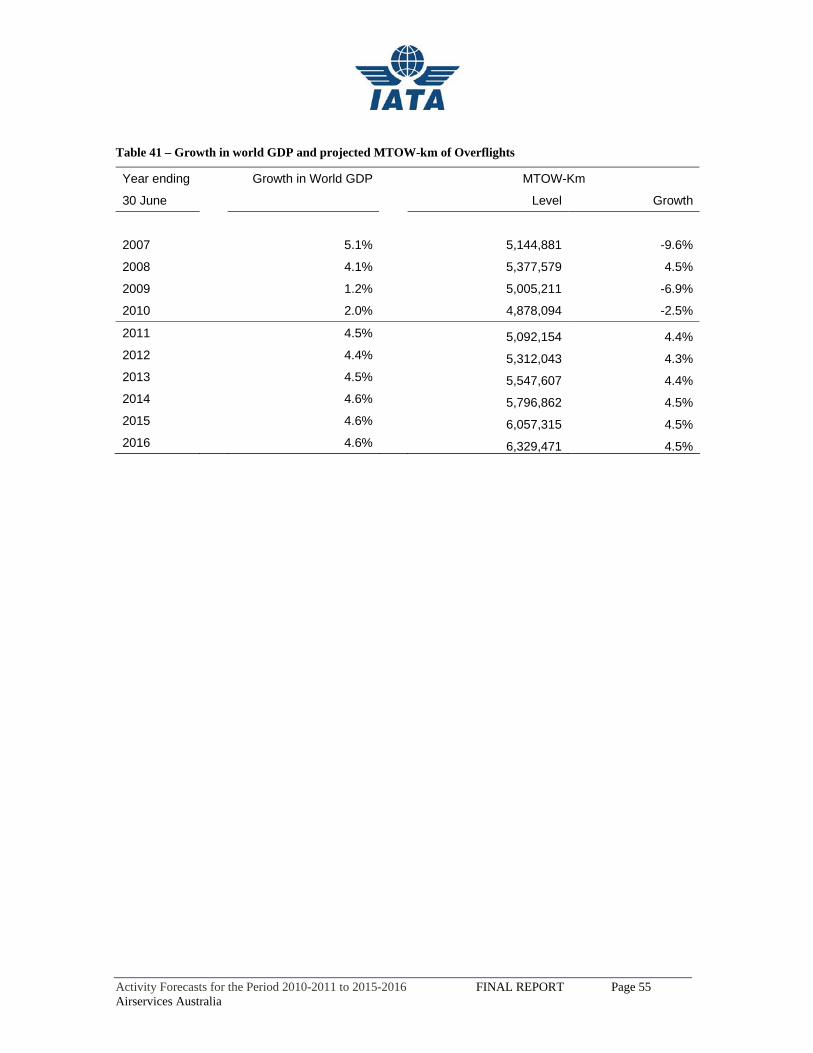
Activity Forecasts for the Period 2010-2011 to 2015-2016 FINAL REPORT Page 55 Airservices Australia
Table 41 – Growth in world GDP and projected MTOW-km of Overflights
Year ending Growth in World GDP MTOW-Km
30 June Level Growth
2007 5.1% 5,144,881 -9.6%
2008 4.1% 5,377,579 4.5%
2009 1.2% 5,005,211 -6.9%
2010 2.0% 4,878,094 -2.5%
2011 4.5% 5,092,154 4.4%2012 4.4% 5,312,043 4.3%2013 4.5% 5,547,607 4.4%2014 4.6% 5,796,862 4.5%2015 4.6% 6,057,315 4.5%2016 4.6% 6,329,471 4.5%
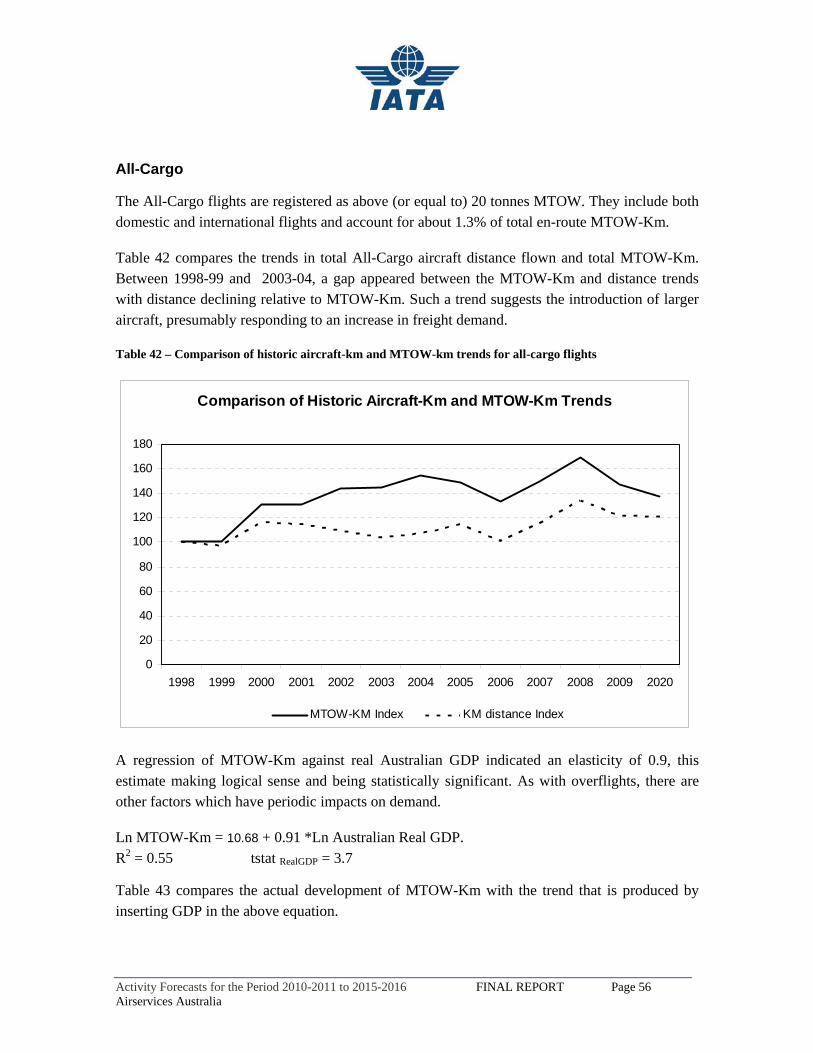
Activity Forecasts for the Period 2010-2011 to 2015-2016 FINAL REPORT Page 56 Airservices Australia
All-Cargo
The All-Cargo flights are registered as above (or equal to) 20 tonnes MTOW. They include both domestic and international flights and account for about 1.3% of total en-route MTOW-Km.
Table 42 compares the trends in total All-Cargo aircraft distance flown and total MTOW-Km. Between 1998-99 and 2003-04, a gap appeared between the MTOW-Km and distance trends with distance declining relative to MTOW-Km. Such a trend suggests the introduction of larger aircraft, presumably responding to an increase in freight demand.
Table 42 – Comparison of historic aircraft-km and MTOW-km trends for all-cargo flights
Comparison of Historic Aircraft-Km and MTOW-Km Trends
0
20
40
60
80
100
120
140
160
180
1998 1999 2000 2001 2002 2003 2004 2005 2006 2007 2008 2009 2020
MTOW-KM Index KM distance Index
A regression of MTOW-Km against real Australian GDP indicated an elasticity of 0.9, this estimate making logical sense and being statistically significant. As with overflights, there are other factors which have periodic impacts on demand.
Ln MTOW-Km = 10.68 + 0.91 *Ln Australian Real GDP. R2 = 0.55 tstat RealGDP = 3.7
Table 43 compares the actual development of MTOW-Km with the trend that is produced by inserting GDP in the above equation.
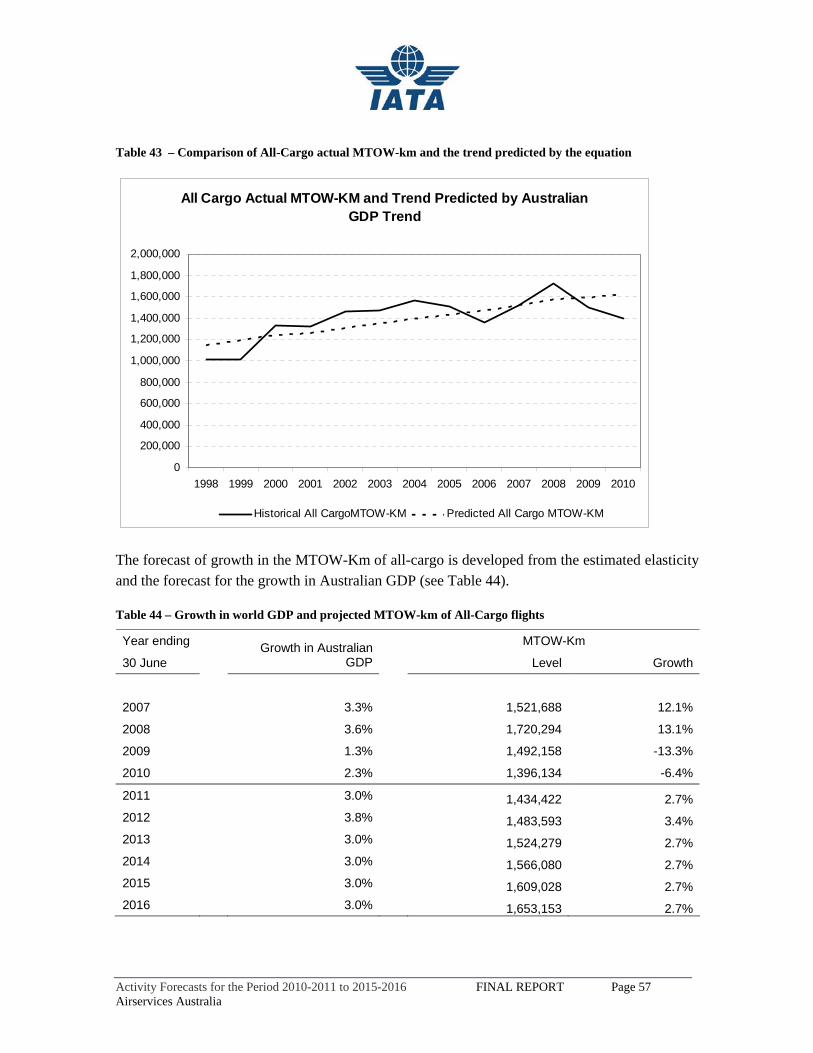
Activity Forecasts for the Period 2010-2011 to 2015-2016 FINAL REPORT Page 57 Airservices Australia
Table 43 – Comparison of All-Cargo actual MTOW-km and the trend predicted by the equation
All Cargo Actual MTOW-KM and Trend Predicted by Australian GDP Trend
0
200,000
400,000
600,000
800,000
1,000,000
1,200,000
1,400,000
1,600,000
1,800,000
2,000,000
1998 1999 2000 2001 2002 2003 2004 2005 2006 2007 2008 2009 2010
Historical All CargoMTOW-KM Predicted All Cargo MTOW-KM
The forecast of growth in the MTOW-Km of all-cargo is developed from the estimated elasticity and the forecast for the growth in Australian GDP (see Table 44).
Table 44 – Growth in world GDP and projected MTOW-km of All-Cargo flights
Year ending MTOW-Km
30 June Growth in Australian
GDP Level Growth
2007 3.3% 1,521,688 12.1%
2008 3.6% 1,720,294 13.1%
2009 1.3% 1,492,158 -13.3%
2010 2.3% 1,396,134 -6.4%
2011 3.0% 1,434,422 2.7%2012 3.8% 1,483,593 3.4%2013 3.0% 1,524,279 2.7%2014 3.0% 1,566,080 2.7%2015 3.0% 1,609,028 2.7%2016 3.0% 1,653,153 2.7%
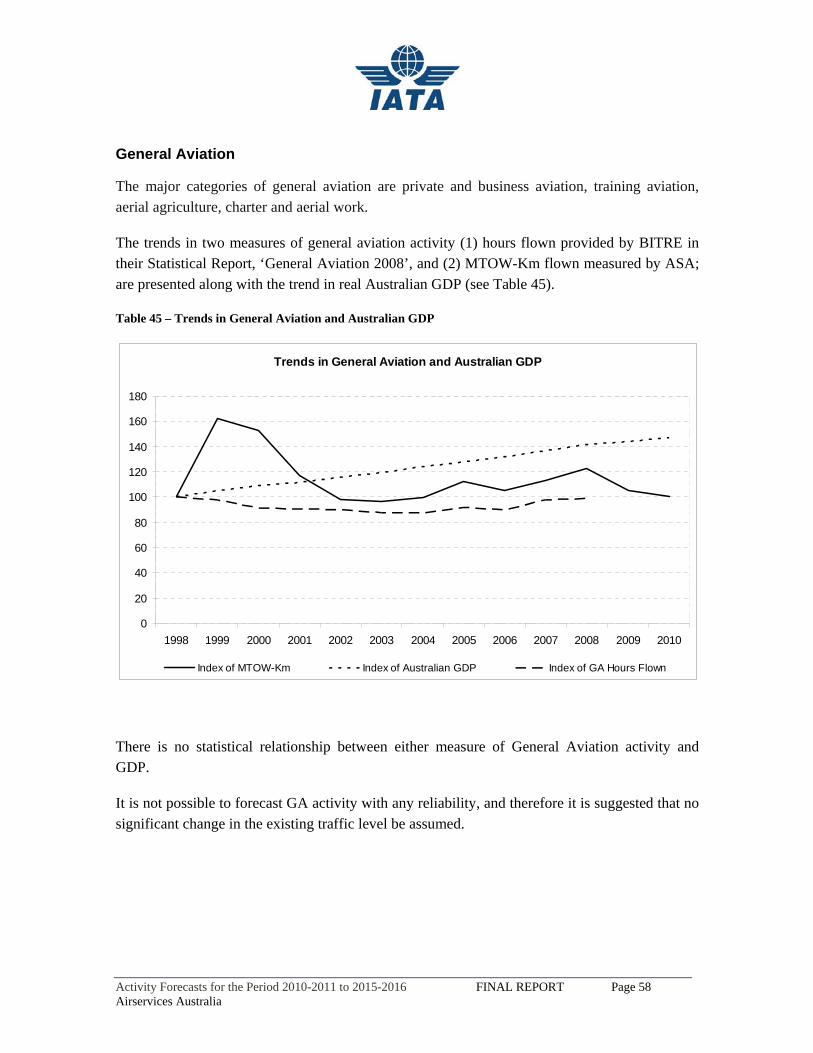
Activity Forecasts for the Period 2010-2011 to 2015-2016 FINAL REPORT Page 58 Airservices Australia
General Aviation
The major categories of general aviation are private and business aviation, training aviation, aerial agriculture, charter and aerial work.
The trends in two measures of general aviation activity (1) hours flown provided by BITRE in their Statistical Report, ‘General Aviation 2008’, and (2) MTOW-Km flown measured by ASA; are presented along with the trend in real Australian GDP (see Table 45).
Table 45 – Trends in General Aviation and Australian GDP
Trends in General Aviation and Australian GDP
0
20
40
60
80
100
120
140
160
180
1998 1999 2000 2001 2002 2003 2004 2005 2006 2007 2008 2009 2010
Index of MTOW-Km Index of Australian GDP Index of GA Hours Flown
There is no statistical relationship between either measure of General Aviation activity and GDP.
It is not possible to forecast GA activity with any reliability, and therefore it is suggested that no significant change in the existing traffic level be assumed.
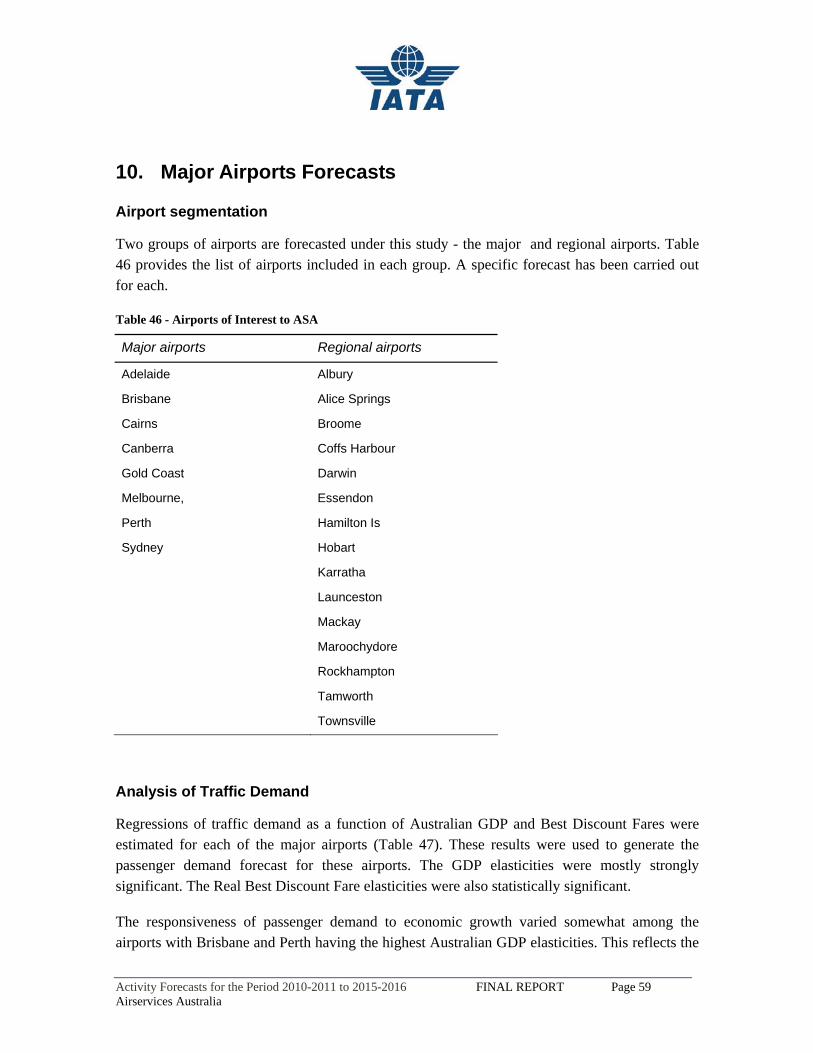
Activity Forecasts for the Period 2010-2011 to 2015-2016 FINAL REPORT Page 59 Airservices Australia
10. Major Airports Forecasts
Airport segmentation
Two groups of airports are forecasted under this study - the major and regional airports. Table 46 provides the list of airports included in each group. A specific forecast has been carried out for each.
Table 46 - Airports of Interest to ASA
Major airports Regional airports
Adelaide Albury
Brisbane Alice Springs
Cairns Broome
Canberra Coffs Harbour
Gold Coast Darwin
Melbourne, Essendon
Perth Hamilton Is
Sydney Hobart
Karratha
Launceston
Mackay
Maroochydore
Rockhampton
Tamworth
Townsville
Analysis of Traffic Demand
Regressions of traffic demand as a function of Australian GDP and Best Discount Fares were estimated for each of the major airports (Table 47). These results were used to generate the passenger demand forecast for these airports. The GDP elasticities were mostly strongly significant. The Real Best Discount Fare elasticities were also statistically significant.
The responsiveness of passenger demand to economic growth varied somewhat among the airports with Brisbane and Perth having the highest Australian GDP elasticities. This reflects the
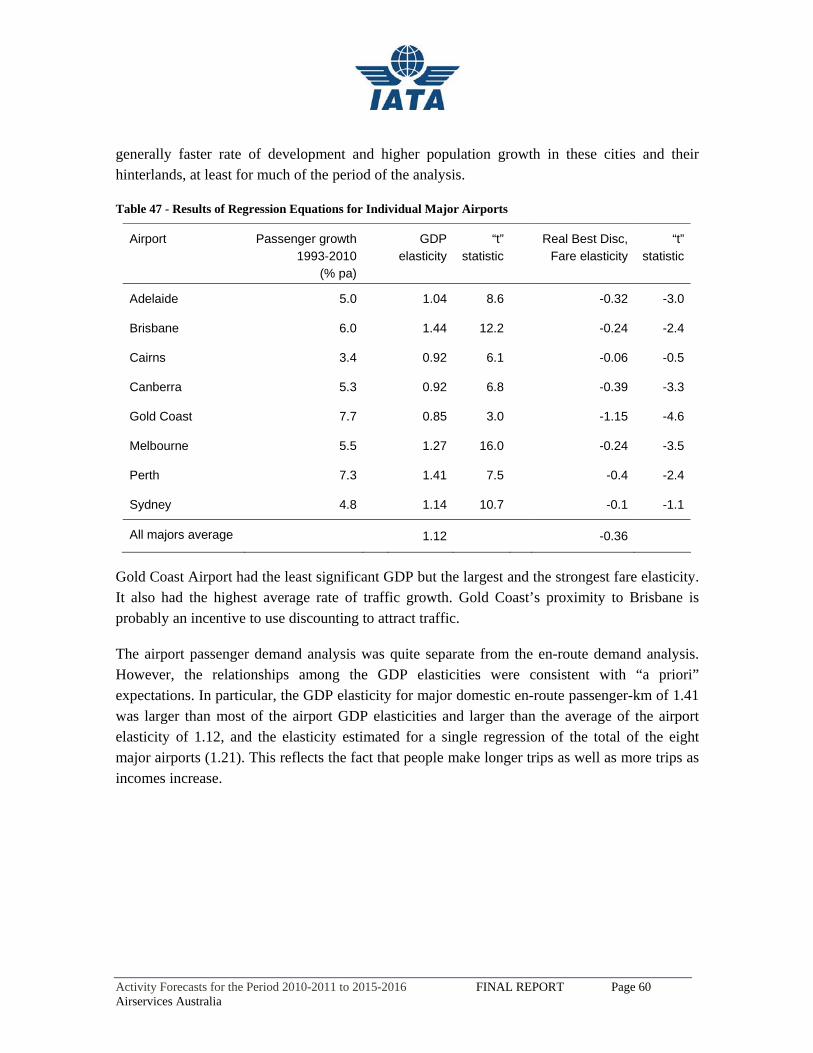
Activity Forecasts for the Period 2010-2011 to 2015-2016 FINAL REPORT Page 60 Airservices Australia
generally faster rate of development and higher population growth in these cities and their hinterlands, at least for much of the period of the analysis.
Table 47 - Results of Regression Equations for Individual Major Airports
Airport Passenger growth 1993-2010
(% pa)
GDP elasticity
“t” statistic
Real Best Disc, Fare elasticity
“t” statistic
Adelaide 5.0 1.04 8.6 -0.32 -3.0
Brisbane 6.0 1.44 12.2 -0.24 -2.4
Cairns 3.4 0.92 6.1 -0.06 -0.5
Canberra 5.3 0.92 6.8 -0.39 -3.3
Gold Coast 7.7 0.85 3.0 -1.15 -4.6
Melbourne 5.5 1.27 16.0 -0.24 -3.5
Perth 7.3 1.41 7.5 -0.4 -2.4
Sydney 4.8 1.14 10.7 -0.1 -1.1
All majors average 1.12 -0.36
Gold Coast Airport had the least significant GDP but the largest and the strongest fare elasticity. It also had the highest average rate of traffic growth. Gold Coast’s proximity to Brisbane is probably an incentive to use discounting to attract traffic.
The airport passenger demand analysis was quite separate from the en-route demand analysis. However, the relationships among the GDP elasticities were consistent with “a priori” expectations. In particular, the GDP elasticity for major domestic en-route passenger-km of 1.41 was larger than most of the airport GDP elasticities and larger than the average of the airport elasticity of 1.12, and the elasticity estimated for a single regression of the total of the eight major airports (1.21). This reflects the fact that people make longer trips as well as more trips as incomes increase.
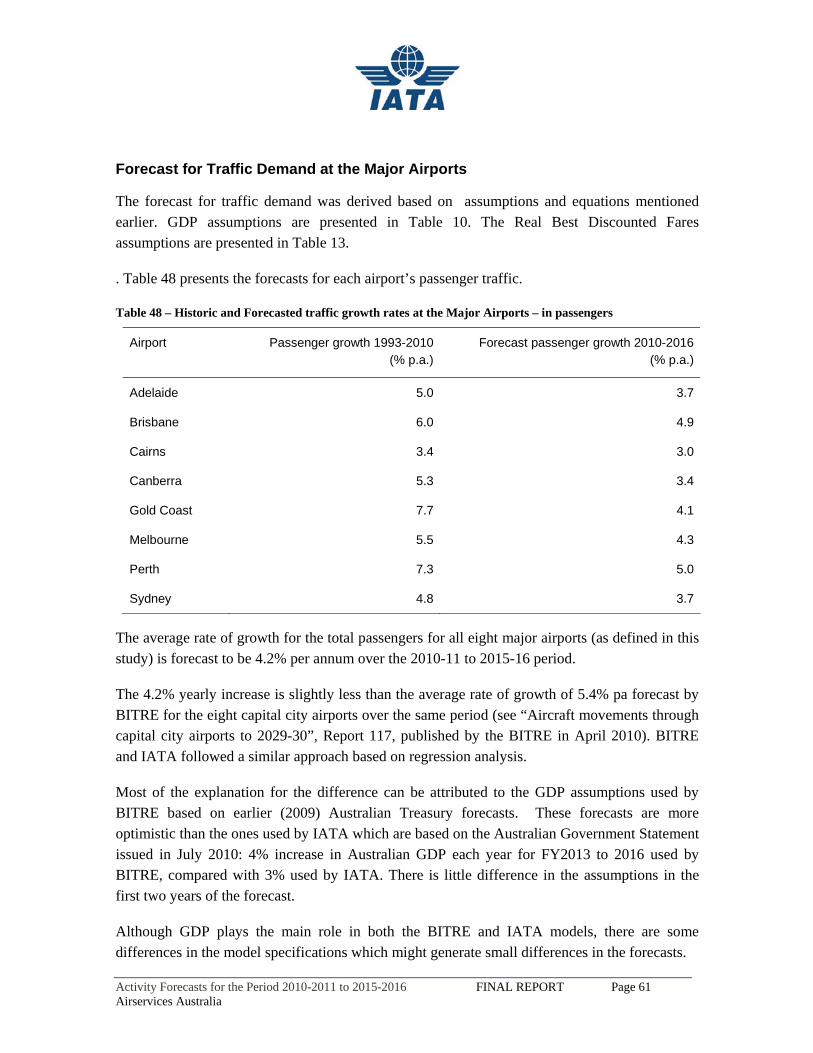
Activity Forecasts for the Period 2010-2011 to 2015-2016 FINAL REPORT Page 61 Airservices Australia
Forecast for Traffic Demand at the Major Airports
The forecast for traffic demand was derived based on assumptions and equations mentioned earlier. GDP assumptions are presented in Table 10. The Real Best Discounted Fares assumptions are presented in Table 13.
. Table 48 presents the forecasts for each airport’s passenger traffic.
Table 48 – Historic and Forecasted traffic growth rates at the Major Airports – in passengers
Airport Passenger growth 1993-2010 (% p.a.)
Forecast passenger growth 2010-2016(% p.a.)
Adelaide 5.0 3.7
Brisbane 6.0 4.9
Cairns 3.4 3.0
Canberra 5.3 3.4
Gold Coast 7.7 4.1
Melbourne 5.5 4.3
Perth 7.3 5.0
Sydney 4.8 3.7
The average rate of growth for the total passengers for all eight major airports (as defined in this study) is forecast to be 4.2% per annum over the 2010-11 to 2015-16 period.
The 4.2% yearly increase is slightly less than the average rate of growth of 5.4% pa forecast by BITRE for the eight capital city airports over the same period (see “Aircraft movements through capital city airports to 2029-30”, Report 117, published by the BITRE in April 2010). BITRE and IATA followed a similar approach based on regression analysis.
Most of the explanation for the difference can be attributed to the GDP assumptions used by BITRE based on earlier (2009) Australian Treasury forecasts. These forecasts are more optimistic than the ones used by IATA which are based on the Australian Government Statement issued in July 2010: 4% increase in Australian GDP each year for FY2013 to 2016 used by BITRE, compared with 3% used by IATA. There is little difference in the assumptions in the first two years of the forecast.
Although GDP plays the main role in both the BITRE and IATA models, there are some differences in the model specifications which might generate small differences in the forecasts.
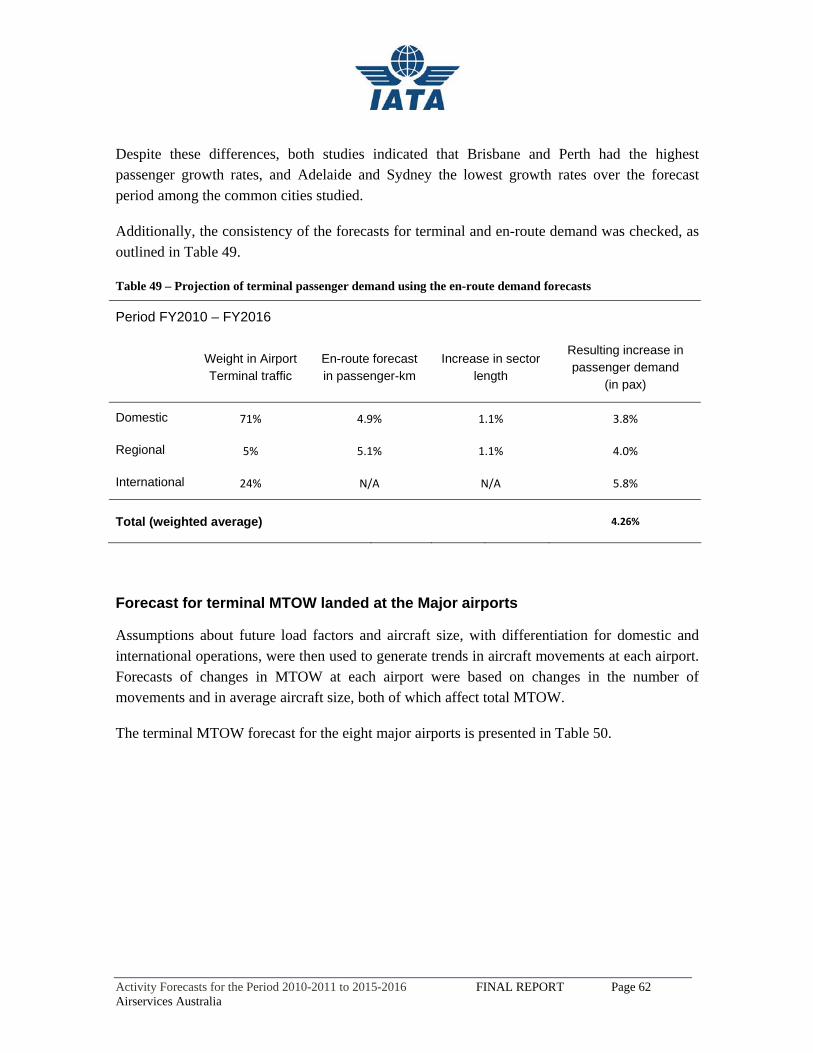
Activity Forecasts for the Period 2010-2011 to 2015-2016 FINAL REPORT Page 62 Airservices Australia
Despite these differences, both studies indicated that Brisbane and Perth had the highest passenger growth rates, and Adelaide and Sydney the lowest growth rates over the forecast period among the common cities studied.
Additionally, the consistency of the forecasts for terminal and en-route demand was checked, as outlined in Table 49.
Table 49 – Projection of terminal passenger demand using the en-route demand forecasts
Period FY2010 – FY2016
Weight in Airport Terminal traffic
En-route forecast in passenger-km
Increase in sector length
Resulting increase in passenger demand
(in pax)
Domestic 71% 4.9% 1.1% 3.8%
Regional 5% 5.1% 1.1% 4.0%
International 24% N/A N/A 5.8%
Total (weighted average)
4.26%
Forecast for terminal MTOW landed at the Major airports
Assumptions about future load factors and aircraft size, with differentiation for domestic and international operations, were then used to generate trends in aircraft movements at each airport. Forecasts of changes in MTOW at each airport were based on changes in the number of movements and in average aircraft size, both of which affect total MTOW.
The terminal MTOW forecast for the eight major airports is presented in Table 50.
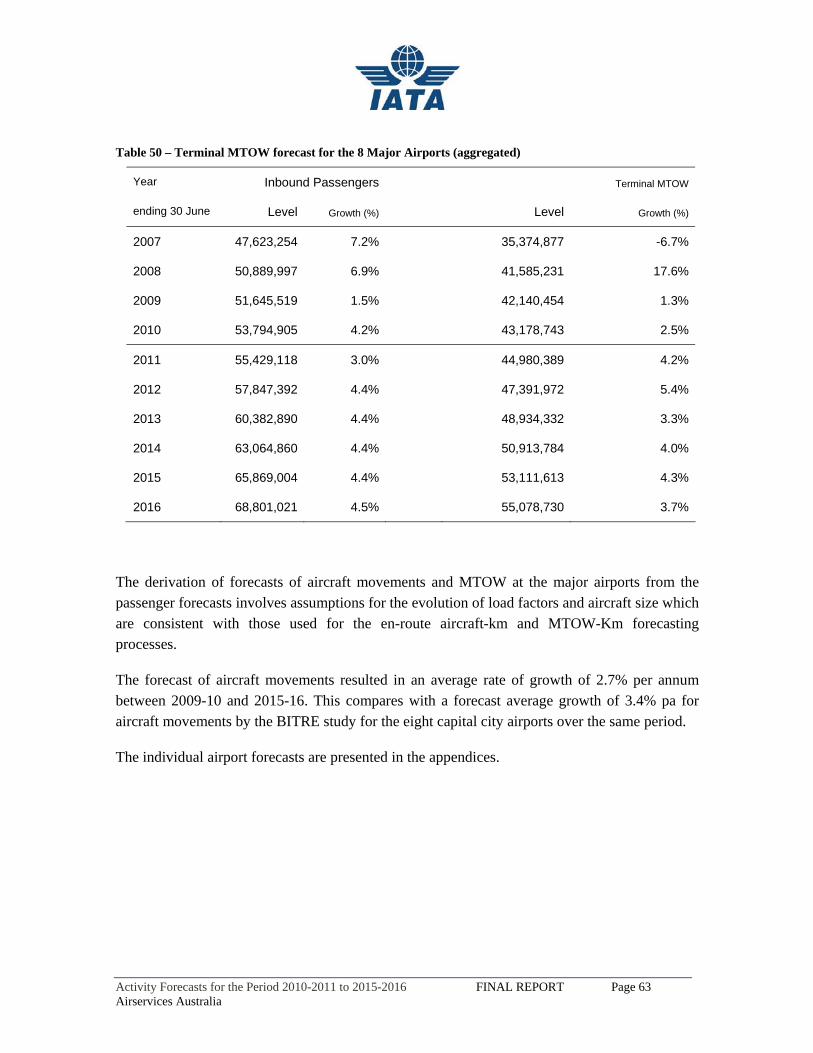
Activity Forecasts for the Period 2010-2011 to 2015-2016 FINAL REPORT Page 63 Airservices Australia
Table 50 – Terminal MTOW forecast for the 8 Major Airports (aggregated)
Year Inbound Passengers Terminal MTOW
ending 30 June Level Growth (%) Level Growth (%)
2007 47,623,254 7.2% 35,374,877 -6.7%
2008 50,889,997 6.9% 41,585,231 17.6%
2009 51,645,519 1.5% 42,140,454 1.3%
2010 53,794,905 4.2% 43,178,743 2.5%
2011 55,429,118 3.0% 44,980,389 4.2%
2012 57,847,392 4.4% 47,391,972 5.4%
2013 60,382,890 4.4% 48,934,332 3.3%
2014 63,064,860 4.4% 50,913,784 4.0%
2015 65,869,004 4.4% 53,111,613 4.3%
2016 68,801,021 4.5% 55,078,730 3.7%
The derivation of forecasts of aircraft movements and MTOW at the major airports from the passenger forecasts involves assumptions for the evolution of load factors and aircraft size which are consistent with those used for the en-route aircraft-km and MTOW-Km forecasting processes.
The forecast of aircraft movements resulted in an average rate of growth of 2.7% per annum between 2009-10 and 2015-16. This compares with a forecast average growth of 3.4% pa for aircraft movements by the BITRE study for the eight capital city airports over the same period.
The individual airport forecasts are presented in the appendices.
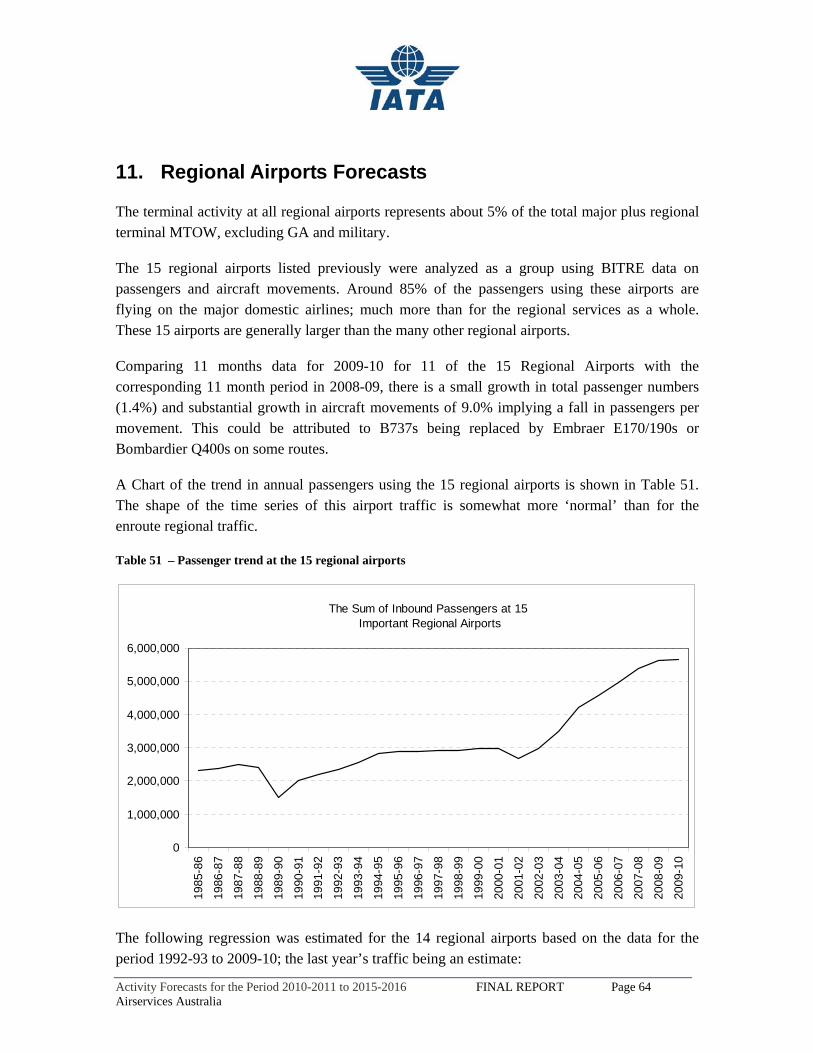
Activity Forecasts for the Period 2010-2011 to 2015-2016 FINAL REPORT Page 64 Airservices Australia
11. Regional Airports Forecasts
The terminal activity at all regional airports represents about 5% of the total major plus regional terminal MTOW, excluding GA and military.
The 15 regional airports listed previously were analyzed as a group using BITRE data on passengers and aircraft movements. Around 85% of the passengers using these airports are flying on the major domestic airlines; much more than for the regional services as a whole. These 15 airports are generally larger than the many other regional airports.
Comparing 11 months data for 2009-10 for 11 of the 15 Regional Airports with the corresponding 11 month period in 2008-09, there is a small growth in total passenger numbers (1.4%) and substantial growth in aircraft movements of 9.0% implying a fall in passengers per movement. This could be attributed to B737s being replaced by Embraer E170/190s or Bombardier Q400s on some routes.
A Chart of the trend in annual passengers using the 15 regional airports is shown in Table 51. The shape of the time series of this airport traffic is somewhat more ‘normal’ than for the enroute regional traffic.
Table 51 – Passenger trend at the 15 regional airports
The Sum of Inbound Passengers at 15 Important Regional Airports
0
1,000,000
2,000,000
3,000,000
4,000,000
5,000,000
6,000,000
1985
-86
1986
-87
1987
-88
1988
-89
1989
-90
1990
-91
1991
-92
1992
-93
1993
-94
1994
-95
1995
-96
1996
-97
1997
-98
1998
-99
1999
-00
2000
-01
2001
-02
2002
-03
2003
-04
2004
-05
2005
-06
2006
-07
2007
-08
2008
-09
2009
-10
The following regression was estimated for the 14 regional airports based on the data for the period 1992-93 to 2009-10; the last year’s traffic being an estimate:
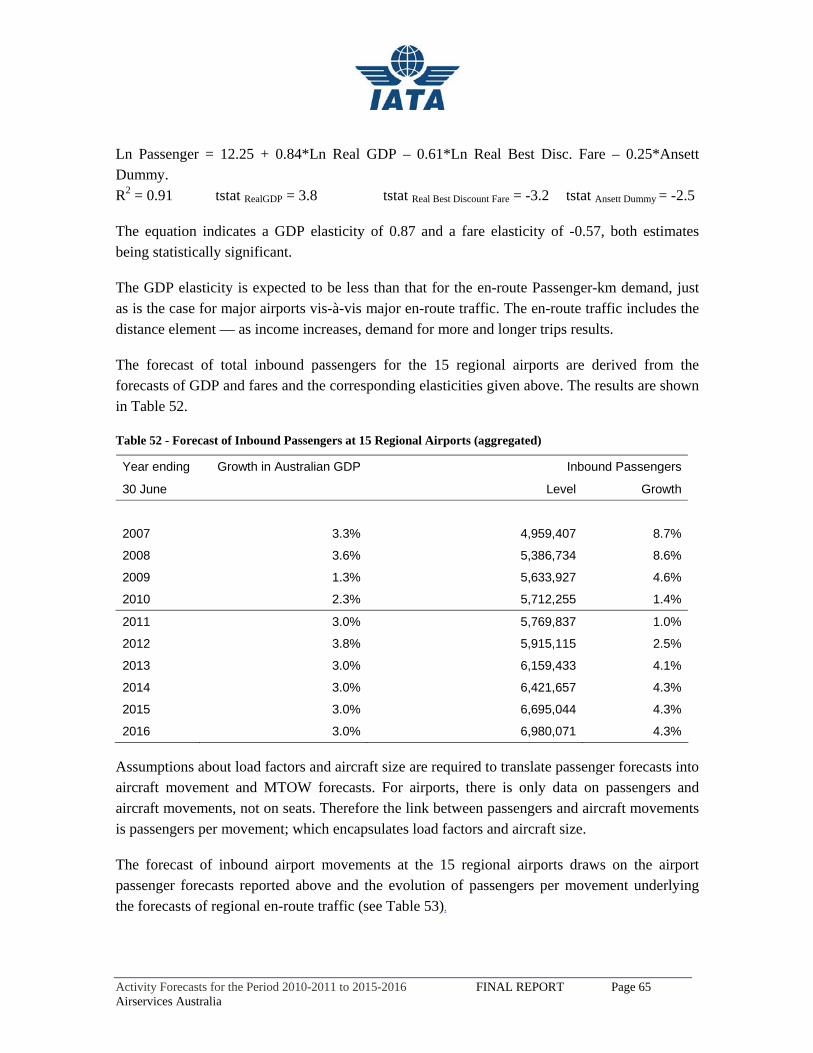
Activity Forecasts for the Period 2010-2011 to 2015-2016 FINAL REPORT Page 65 Airservices Australia
Ln Passenger = 12.25 + 0.84*Ln Real GDP – 0.61*Ln Real Best Disc. Fare – 0.25*Ansett Dummy. R2 = 0.91 tstat RealGDP = 3.8 tstat Real Best Discount Fare = -3.2 tstat Ansett Dummy = -2.5
The equation indicates a GDP elasticity of 0.87 and a fare elasticity of -0.57, both estimates being statistically significant.
The GDP elasticity is expected to be less than that for the en-route Passenger-km demand, just as is the case for major airports vis-à-vis major en-route traffic. The en-route traffic includes the distance element — as income increases, demand for more and longer trips results.
The forecast of total inbound passengers for the 15 regional airports are derived from the forecasts of GDP and fares and the corresponding elasticities given above. The results are shown in Table 52.
Table 52 - Forecast of Inbound Passengers at 15 Regional Airports (aggregated)
Year ending Inbound Passengers
30 June
Growth in Australian GDP
Level Growth
2007 3.3% 4,959,407 8.7%
2008 3.6% 5,386,734 8.6%
2009 1.3% 5,633,927 4.6%
2010 2.3% 5,712,255 1.4%
2011 3.0% 5,769,837 1.0%
2012 3.8% 5,915,115 2.5%
2013 3.0% 6,159,433 4.1%
2014 3.0% 6,421,657 4.3%
2015 3.0% 6,695,044 4.3%
2016 3.0% 6,980,071 4.3%
Assumptions about load factors and aircraft size are required to translate passenger forecasts into aircraft movement and MTOW forecasts. For airports, there is only data on passengers and aircraft movements, not on seats. Therefore the link between passengers and aircraft movements is passengers per movement; which encapsulates load factors and aircraft size.
The forecast of inbound airport movements at the 15 regional airports draws on the airport passenger forecasts reported above and the evolution of passengers per movement underlying the forecasts of regional en-route traffic (see Table 53).
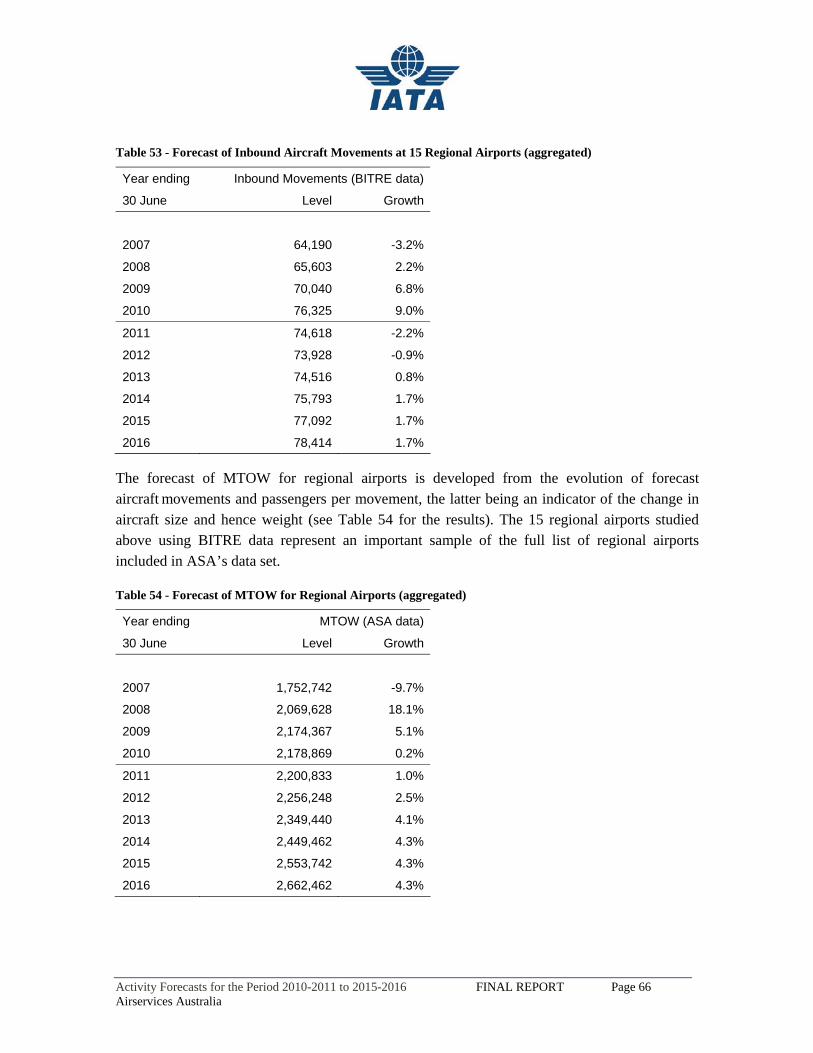
Activity Forecasts for the Period 2010-2011 to 2015-2016 FINAL REPORT Page 66 Airservices Australia
Table 53 - Forecast of Inbound Aircraft Movements at 15 Regional Airports (aggregated)
Year ending Inbound Movements (BITRE data)
30 June Level Growth
2007 64,190 -3.2%
2008 65,603 2.2%
2009 70,040 6.8%
2010 76,325 9.0%
2011 74,618 -2.2%
2012 73,928 -0.9%
2013 74,516 0.8%
2014 75,793 1.7%
2015 77,092 1.7%
2016 78,414 1.7%
The forecast of MTOW for regional airports is developed from the evolution of forecast aircraft movements and passengers per movement, the latter being an indicator of the change in aircraft size and hence weight (see Table 54 for the results). The 15 regional airports studied above using BITRE data represent an important sample of the full list of regional airports included in ASA’s data set.
Table 54 - Forecast of MTOW for Regional Airports (aggregated)
Year ending MTOW (ASA data)
30 June Level Growth
2007 1,752,742 -9.7%
2008 2,069,628 18.1%
2009 2,174,367 5.1%
2010 2,178,869 0.2%
2011 2,200,833 1.0%
2012 2,256,248 2.5%
2013 2,349,440 4.1%
2014 2,449,462 4.3%
2015 2,553,742 4.3%
2016 2,662,462 4.3%
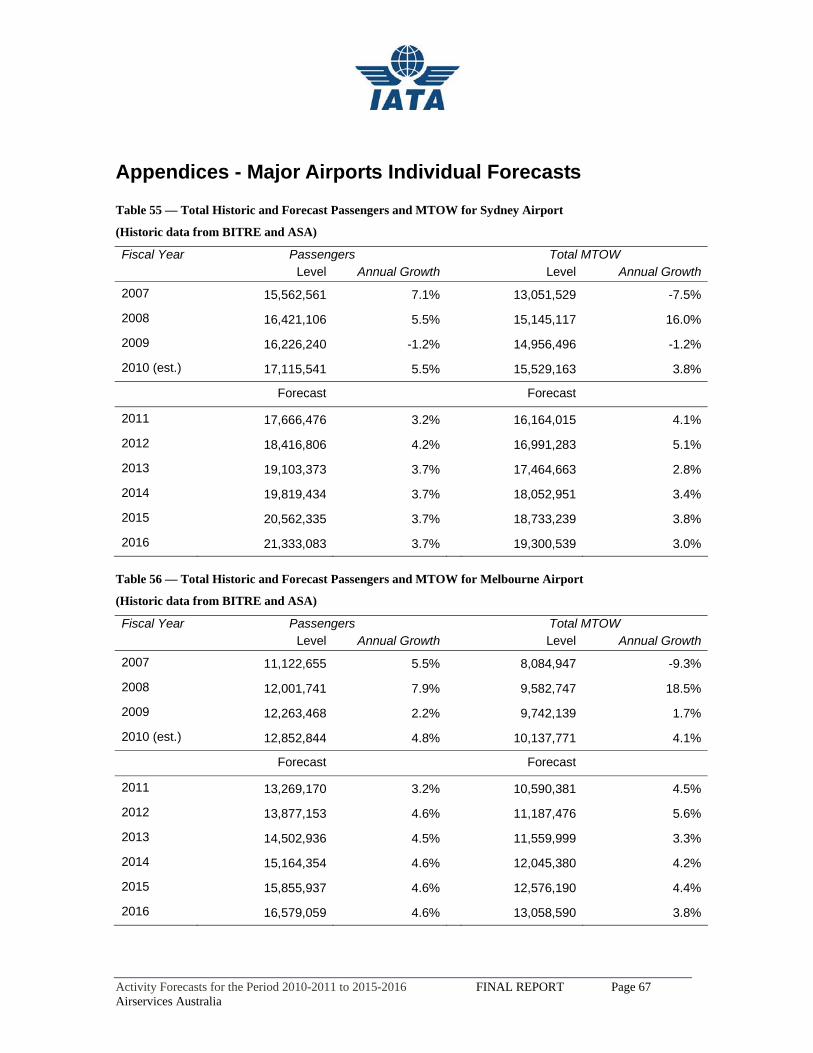
Activity Forecasts for the Period 2010-2011 to 2015-2016 FINAL REPORT Page 67 Airservices Australia
Appendices - Major Airports Individual Forecasts
Table 55 — Total Historic and Forecast Passengers and MTOW for Sydney Airport
(Historic data from BITRE and ASA)
Fiscal Year Passengers Total MTOW Level Annual Growth Level Annual Growth
2007 15,562,561 7.1% 13,051,529 -7.5%
2008 16,421,106 5.5% 15,145,117 16.0%
2009 16,226,240 -1.2% 14,956,496 -1.2%
2010 (est.) 17,115,541 5.5% 15,529,163 3.8%
Forecast Forecast
2011 17,666,476 3.2% 16,164,015 4.1%
2012 18,416,806 4.2% 16,991,283 5.1%
2013 19,103,373 3.7% 17,464,663 2.8%
2014 19,819,434 3.7% 18,052,951 3.4%
2015 20,562,335 3.7% 18,733,239 3.8%
2016 21,333,083 3.7% 19,300,539 3.0%
Table 56 — Total Historic and Forecast Passengers and MTOW for Melbourne Airport
(Historic data from BITRE and ASA)
Fiscal Year Passengers Total MTOW Level Annual Growth Level Annual Growth
2007 11,122,655 5.5% 8,084,947 -9.3%
2008 12,001,741 7.9% 9,582,747 18.5%
2009 12,263,468 2.2% 9,742,139 1.7%
2010 (est.) 12,852,844 4.8% 10,137,771 4.1%
Forecast Forecast
2011 13,269,170 3.2% 10,590,381 4.5%
2012 13,877,153 4.6% 11,187,476 5.6%
2013 14,502,936 4.5% 11,559,999 3.3%
2014 15,164,354 4.6% 12,045,380 4.2%
2015 15,855,937 4.6% 12,576,190 4.4%
2016 16,579,059 4.6% 13,058,590 3.8%

Activity Forecasts for the Period 2010-2011 to 2015-2016 FINAL REPORT Page 68 Airservices Australia
Table 57 — Total Historic and Forecast Passengers and MTOW for Brisbane Airport
(Historic data from BITRE and ASA)
Fiscal Year Passengers Total MTOW Level Annual Growth Level Annual Growth
2007 8,715,512 8.4% 5,823,681 -5.9%
2008 9,167,624 5.2% 6,797,392 16.7%
2009 9,381,174 2.3% 7,015,192 3.2%
2010 (est.) 9,374,910 -0.1% 6,881,555 -1.9%
Forecast Forecast
2011 9,728,401 3.8% 7,218,733 4.9%
2012 10,239,727 5.3% 7,668,945 6.2%
2013 10,756,751 5.0% 7,968,099 3.9%
2014 11,305,417 5.1% 8,346,193 4.7%
2015 11,882,068 5.1% 8,761,066 5.0%
2016 12,488,132 5.1% 9,145,950 4.4%
Table 58 — Total Historic and Forecast Passengers and MTOW for Perth Airport
(Historic data from BITRE and ASA)
Fiscal Year Passengers Total MTOW Level Annual Growth Level Annual Growth
2007 4,003,972 13.8% 3,327,679 4.2%
2008 4,501,902 12.4% 4,027,522 21.0%
2009 4,707,482 4.6% 4,265,675 5.9%
2010 (est.) 4,983,981 5.9% 4,453,234 4.4%
Forecast Forecast
2011 5,147,288 3.3% 4,642,443 4.2%
2012 5,402,903 5.0% 4,916,564 5.9%
2013 5,693,575 5.4% 5,131,162 4.4%
2014 6,004,726 5.5% 5,391,851 5.1%
2015 6,332,880 5.5% 5,685,296 5.4%
2016 6,678,969 5.5% 5,954,021 4.7%
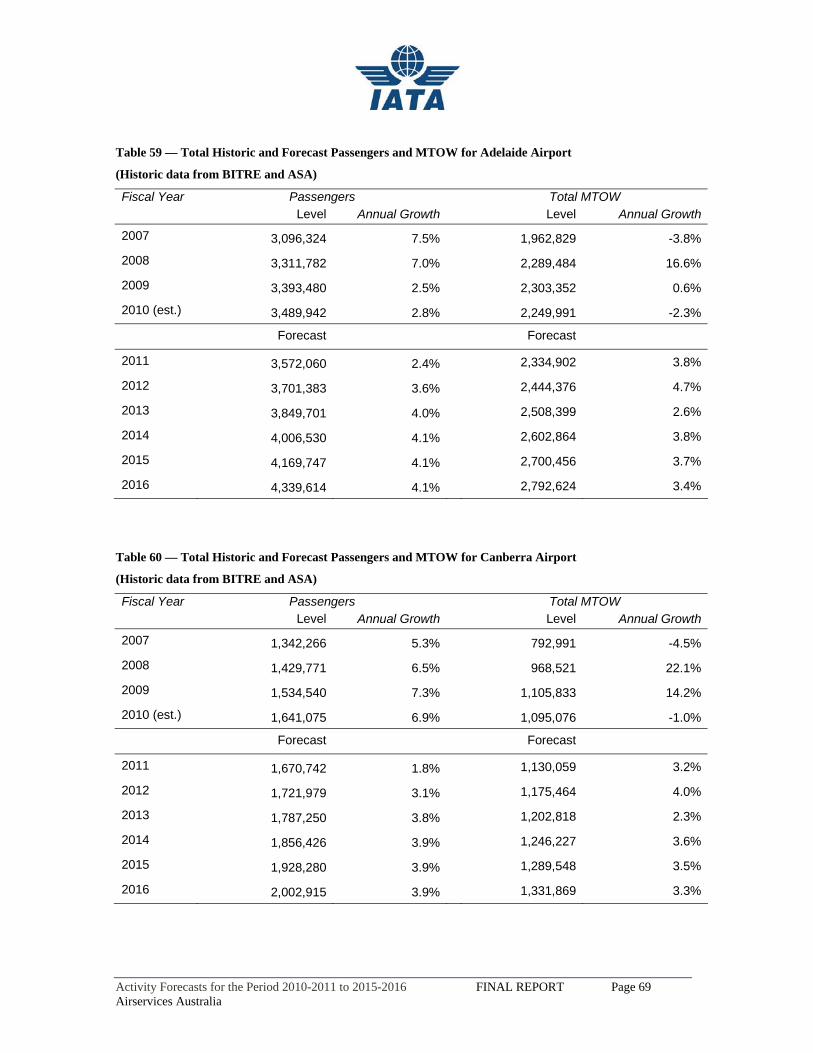
Activity Forecasts for the Period 2010-2011 to 2015-2016 FINAL REPORT Page 69 Airservices Australia
Table 59 — Total Historic and Forecast Passengers and MTOW for Adelaide Airport
(Historic data from BITRE and ASA)
Fiscal Year Passengers Total MTOW Level Annual Growth Level Annual Growth
2007 3,096,324 7.5% 1,962,829 -3.8%
2008 3,311,782 7.0% 2,289,484 16.6%
2009 3,393,480 2.5% 2,303,352 0.6%
2010 (est.) 3,489,942 2.8% 2,249,991 -2.3%
Forecast Forecast
2011 3,572,060 2.4% 2,334,902 3.8%
2012 3,701,383 3.6% 2,444,376 4.7%
2013 3,849,701 4.0% 2,508,399 2.6%
2014 4,006,530 4.1% 2,602,864 3.8%
2015 4,169,747 4.1% 2,700,456 3.7%
2016 4,339,614 4.1% 2,792,624 3.4%
Table 60 — Total Historic and Forecast Passengers and MTOW for Canberra Airport
(Historic data from BITRE and ASA)
Fiscal Year Passengers Total MTOW Level Annual Growth Level Annual Growth
2007 1,342,266 5.3% 792,991 -4.5%
2008 1,429,771 6.5% 968,521 22.1%
2009 1,534,540 7.3% 1,105,833 14.2%
2010 (est.) 1,641,075 6.9% 1,095,076 -1.0%
Forecast Forecast
2011 1,670,742 1.8% 1,130,059 3.2%
2012 1,721,979 3.1% 1,175,464 4.0%
2013 1,787,250 3.8% 1,202,818 2.3%
2014 1,856,426 3.9% 1,246,227 3.6%
2015 1,928,280 3.9% 1,289,548 3.5%
2016 2,002,915 3.9% 1,331,869 3.3%

Activity Forecasts for the Period 2010-2011 to 2015-2016 FINAL REPORT Page 70 Airservices Australia
Table 61 — Total Historic and Forecast Passengers and MTOW for Cairns Airport
(Historic data from BITRE and ASA)
Fiscal Year Passengers Total MTOW Level Annual Growth Level Annual Growth
2007 1,897,319 1.8% 1,406,495 -11.5%
2008 1,892,949 -0.2% 1,595,774 13.5%
2009 1,828,434 -3.4% 1,423,619 -10.8%
2010 (est.) 1,748,089 -4.4% 1,306,059 -8.3%
Forecast Forecast
2011 1,794,246 2.6% 1,357,146 3.9%
2012 1,856,037 3.4% 1,417,181 4.4%
2013 1,911,084 3.0% 1,441,006 1.7%
2014 1,968,012 3.0% 1,479,471 2.7%
2015 2,026,635 3.0% 1,519,777 2.7%
2016 2,087,005 3.0% 1,555,198 2.3%
Table 62 — Total Historic and Forecast Passengers and MTOW for Gold Coast Airport
(Historic data from BITRE and ASA)
Fiscal Year Passengers Total MTOW Level Annual Growth Level Annual Growth
2007 1,882,645 7.1% 924,725 -10.4%
2008 2,163,122 14.9% 1,178,672 27.5%
2009 2,310,701 6.8% 1,328,149 12.7%
2010 (est.) 2,588,522 12.0% 1,525,894 14.9%
Forecast Forecast
2011 2,580,735 -0.3% 1,542,709 1.1%
2012 2,631,403 2.0% 1,590,682 3.1%
2013 2,778,221 5.6% 1,658,187 4.2%
2014 2,939,963 5.8% 1,748,849 5.5%
2015 3,111,121 5.8% 1,846,043 5.6%
2016 3,292,243 5.8% 1,939,940 5.1%
IATA CONSULTING THE GLOBAL AIR TRANSPORT EXPERTS
For more information, please contact us.
Laurent DELARUE
Head of Airport Consulting Tel: +1 (514) 8740202 x 3041
Fax: +1 (514) 390 6707 [email protected]
International Air Transport Association
800 Place Victoria, P.O. Box 113
Montreal, Quebec Canada H4Z 1M1
www.iata.org/consulting