Embed Size (px)
Citation preview

Activity Based Costing ProjectActivity Based Costing Project 2003 - 2005 2003 - 2005
Executive SummaryExecutive Summary
Activity Based Costing ProjectActivity Based Costing Project 2003 - 2005 2003 - 2005
Executive SummaryExecutive Summary

USQ Student Enrolments 2004
USQ Delivery Channels
On CampusIndividualDistributed
Learning Centres
Standard DE Off Shore
Primarily Online On ShoreWide Bay SpringfieldToowoomba
IndividualOff Campus
Channel
On CampusChannel
Distributed Learning Centre
Channel
50% 4% 3% 23% 0% 17% 3%
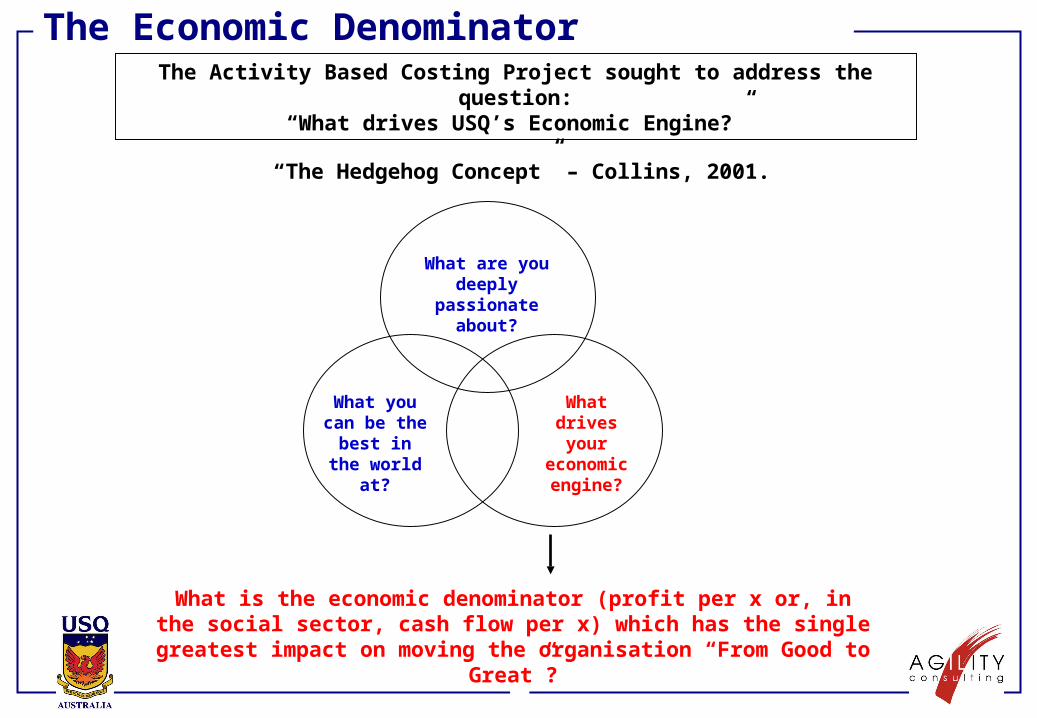
The Economic DenominatorThe Activity Based Costing Project sought to address the question:
“What drives USQ’s Economic Engine?”
What are you deeply passionate
about?
What you can be the best in the world at?
What is the economic denominator (profit per x or, in the social sector, cash flow per x) which has the single greatest impact on moving the organisation
“From Good to Great”?
What drives your
economic engine?
“The Hedgehog Concept” – Collins, 2001.

MethodologyABC attempts to link the inputs of the University (people, premises, technology and consumables) with the outputs teaching courses and programs and research. A typical cost architecture and model data sources are shown below.
FacultiesFaculties
RESOURCES ACTIVITIES COST OBJECTS
AcademicSupport
AcademicSupport
AdministrationSupport
AdministrationSupport
MarketingMarketing
Research SupportResearch Support
SupportingStudent
SupportingStudent
ResearchingResearching
Enrolling StudentsEnrolling Students
Providing LibraryServices
Providing LibraryServices
ACC 1100ACC 1100
SCC1123SCC1123
Courses
B. BusB. Bus
B. ScB. Sc
B. ArtsB. Arts
M. BusM. Bus
M. ScM. Sc
M. IBM. IB
Programs
Research
InternationalOnshore
InternationalOnshore
InternationalOffshore
InternationalOffshore
DomesticHECS
DomesticHECS
DomesticFee PayingDomestic
Fee Paying
Students
LibraryLibrary
Finance, IT, HRFinance, IT, HR
Providing CorporateServices
Providing CorporateServices
Liaising with Students
Liaising with Students
TimeSurveys
Floorspace / Timetabling
Systems
GrantsGrants
PublicationsPublications
HRD CompletionsHRD Completions
BusinessSustainingBusiness
Sustaining
Leadership
Govern
Strategy
Compliance
FinancialSystems
PayrollSystem
FacilitiesFacilities
Preparing Lectures
Delivering Lectures
Assessing Students
Preparing Lectures
Delivering Lectures
Assessing Students
Preparing Lectures
Delivering Lectures
Assessing Students
Preparing Lectures
Delivering Lectures
Assessing Students
Preparing LecturesPreparing Lectures
Delivering LecturesDelivering Lectures
Assessing StudentsAssessing Students
StudentRecordsSystem
TimetablingSystem
Delivery Modes

Model Demonstration Resource Costs are assigned to Activities based on statistical drivers. The cost of Academic Salaries, for example, is assigned to activities based on Salary Weighted Time Survey results as shown below.

The USQ cumulative “Course Contribution Cliff” is shown below. The courses on the left are the most profitable with the courses on the right being the least profitable.
0
5
10
15
20
25
30
$M
537 Courses 528 Courses
$10M in value is eroded by 200 courses
$10M in value is eroded by 200 courses
2003 Results: Course Contribution Cliff

The contribution from teaching from each of the Faculties is shown below. The size of the bubble represents the number of enrolments. Faculties below the x-axis are providing a negative contribution.
2003 Results by Faculty
Key:
2,000 20,000Enrolments Enrolments
Key:
2,000 20,000Enrolments Enrolments
-2
0
2
4
6
8
0 10 20 30 40
Revenue ($M)
Co
ntr
ibu
tio
n (
$M) Faculty of Arts
Faculty of Business
Faculty of Education
Faculty of Engineering andSurveying
Faculty of Sciences
Contribution Margin = 15%

The contribution from teaching from each of the modes is shown below. The size of the Bubble represents the number of enrolments. Modes below the x-axis are providing a negative contribution.
2003 Results by Delivery Mode
Key:
2,000 20,000Enrolments Enrolments
Key:
2,000 20,000Enrolments Enrolments
-8
-4
0
4
8
12
(20) 0 20 40 60
Revenue ($M)
Co
ntr
ibu
tio
n (
$M)
Educational Partners - Off Shore
Educational Partners - On Shore
Off Campus - On-Line
Off Campus - Standard
On Campus - Toowoomba
On Campus - Wide Bay
Contribution Margin = 15%

(500)
(400)
(300)
(200)
(100)
0
100
200
300
400
(500) 0 500 1,000 1,500 2,000 2,500 3,000
Bretten
Canterbury
Informatics - Malaysia
Informatics - Singapore
Kangda College
SALO
Segi Group
STI - Shanghai
STI - Taiwan
ZUCC
Other
Educational partner results are shown below. The size of the bubble represents the number of enrolments. Partners below the x-axis are providing a negative contribution.
Revenue ($000)
Co
ntr
ibu
tio
n (
$000
)
20%
10%
(10%)
(20%)(30%)
Target Contribution Margin - 15%
Break Even
(40%)
45Partners Key:
250 2000Enrolments Enrolments
Key:
250 2000Enrolments Enrolments
2003 Results by Educational Partner
Note: Construction of this level of detail from the ABC Model result requires further analysis outside of the model.
Note: Construction of this level of detail from the ABC Model result requires further analysis outside of the model.

Performance Management
The EconomicDenominator
The EconomicDenominator
DepartmentContribution
DepartmentContribution
CourseLevel
Management
CourseLevel
Management
For USQ the economic denominator is the“Course Contribution Margin”
Course contribution targets will be set for each Faculty/ Department
A framework is being developed to address possiblecourse /program rationalization

EducationalPartners
EducationalPartners USQ has changed its Learning Management System
for online delivery and is now investigating an open source/open standards based approach
Performance Management (cont’d)
An Educational Partner Model is being developed addressing such issues as:
• Pricing model;• Standard Contract; and• “Partner non-performance” escape clauses

The University is in the process of setting targets for all output groups (Teaching, Research, Commercial, Community, etc).
University ExampleTotal Revenue $130M
Revenue from Teaching $110M
Return @ 5% = Net Profit $6M
Add: Investment in Research $10M
Add: Strategic Projects $8M
Required Contribution From Teaching $24M
Baseline Teaching Margin = 22% (24/110 100)
Course contribution is the Economic Denominator. Well structured programs with a reasonable sized student cohort deliver a 30% - 40% Contribution Margin
The Economic Denominator

With course contribution as the economic denominator, USQ is committed to reducing the number of courses which provide a negative contribution, thus “Trimming the Tail off the Whale”.
0
5
10
15
20
25
30
$M
537 Courses 528 Courses
The Economic Denominator

Model Utilisation and Enhancement
•The Activity Based Costing Model is a journey, not a destination
•Current enhancements include: Calculating program contribution; Deployment of model reporting and analysis; Data collection of time surveys online
•Data is to be refreshed annually
•The use of the ABC Model for budgetary allocation purposes is via the Budget Management Committee, which is chaired by the VC