Embed Size (px)
Citation preview

www.elsevier.com/locate/apcatb
Applied Catalysis B: Environmental 56 (2005) 57–68
Activity and stability of low-content gold–cerium oxide catalysts
for the water–gas shift reaction
Qi Fu1, Weiling Deng, Howard Saltsburg, Maria Flytzani-Stephanopoulos*
Department of Chemical and Biological Engineering, Tufts University, Medford, MA 02155, USA
Received 23 February 2004; received in revised form 7 July 2004; accepted 9 July 2004
Available online 12 October 2004
Abstract
We report here on the high activity and stability of low-content gold–cerium oxide catalysts for the water–gas shift reaction (WGS). These
catalysts are reversible in cyclic reduction–oxidation treatment up to 400 8C, are non-pyrophoric, and are thus potential candidates for
application to hydrogen generation for fuel cell power production. Low-content (0.2–0.9 at.%) gold–ceria samples were prepared by single-
pot synthesis by the urea gelation/coprecipitation method; and by sodium cyanide leaching of high-content (2–8 at.%) gold–ceria materials
prepared by various techniques. The low-content gold–ceria catalysts are free of metallic gold nanoparticles. Gold is present in oxidized form,
as verified by a variety of analytical techniques. However, these materials display the same WGS activity as the high-content gold ones, and
remain free of gold nanoparticles after use in a reaction gas stream composed of 11% CO–26% H2O–26% H2–7% CO2–balance He up to
300 8C. We show that the determining factor for the retention of active gold in ceria is the surface properties of the latter. Measurements of
lattice constant expansion indicate gold ion substitution in the ceria lattice. The turnover frequency of WGS under the assumption of fully
dispersed gold is the same for a variety of low-content gold–ceria preparations. The stability of gold–ceria in various gas compositions and
temperatures was good. The most serious stability issue is formation of cerium hydroxycarbonate in shutdown operation.
# 2004 Elsevier B.V. All rights reserved.
Keywords: Gold catalysts; Nanocrystalline cerium oxide; Water–gas shift reaction; Fuel cells; Cyanide leaching; Hydrogen generation; Stability of gold–
ceria catalysts
1. Introduction
The water–gas shift (WGS) reaction is an integral part of
fuel processing for the production of hydrogen. When
hydrogen is used for fuel cell power generation, the WGS
catalysts should be both active and stable in cyclic operation
and in exposure to air and condensed water, and of course,
economical. The state-of-the-art low-temperature WGS
catalyst in chemical plants is Cu–ZnO [1]. However, this
type catalyst is very sensitive to temperature excursions,
pyrophoric if exposed to air, and requires very careful pre-
activation. It has been assessed unsuitable for application to
PEM fuel cells, especially for use in transportation. WGS
* Corresponding author. Tel.: +1 617 6273048; fax: +1 617 6273991.
E-mail address: [email protected] (M. Flytzani-Stephanopoulos).1 Present address: Cabot Corporation, Albuquerque, NM, USA.
0926-3373/$ – see front matter # 2004 Elsevier B.V. All rights reserved.
doi:10.1016/j.apcatb.2004.07.015
catalysts based on nanocrystalline cerium oxide (ceria) have
been investigated in recent years as alternatives to Cu–ZnO
for fuel cell applications [2–6]. They are non-pyrophoric and
can be used without activation [5]. It is well known that
platinum metals (PM) supported on cerium oxide in the
three-way automotive catalyst enhance the low-temperature
WGS reaction and are much more active than PM/alumina
[2,7]. Previous work in our laboratory has shown that Cu-
and other transition metal-containing nanocrystalline cerias
are active and stable catalysts in low- and high-temperature
redox reactions [5,6,8–13]. Cu–ceria was found active for
WGS over a wide temperature window [5]. The reducibility
and catalytic activity of CeO2 are significantly enhanced by
the presence of a small amount of a transition metal, which
does not have to be a platinum group metal. Platinum was
the earliest case demonstrated of a metal additive having a
considerable effect on ceria reducibility [14]. Among the
Q. Fu et al. / Applied Catalysis B: Environmental 56 (2005) 57–6858
metal–ceria systems examined in the literature, Au–ceria is a
particularly active and stable catalyst for low-temperature
CO oxidation [10,11,15], methane oxidation [10,11], and the
WGS reaction [6,12,13,16].
The literature of fine gold particles supported on
reducible oxides has focused on the gold particle size and
properties [17–19]. However, it is possible that the oxide
support is much more important than given credit to date
[6,12,13,16]. Little is known about the interaction of Au
with ceria that might be responsible for the observed high
activity. We recently reported that nonmetallic gold and
platinum species on ceria are associated with the active sites
for the water–gas shift reaction [6]. In the present work, we
further examine the gold–ceria interaction and evaluate the
catalyst under realistic operating conditions.
2. Experimental
2.1. Catalyst preparation and characterization
Lanthana- or gadolinia-doped ceria and undoped ceria
materials were prepared by the urea gelation/coprecipitation
(UGC) method [5]. Gold–ceria samples were prepared by
deposition precipitation (DP), coprecipitation (CP) and the
above UGC method [5], as described in detail elsewhere
[12].
Leaching of gold from calcined gold–ceria samples took
place in an aqueous solution of 2% NaCN under O2 gas
sparging at room temperature. Sodium hydroxide was added
to keep the pH at �12. Cyanide leaching is a very fast
process. The remaining amount of gold is almost the same
after 1 or 24 h. This is a well-known process used to extract
gold during gold mining [20]. The leaching process is also
very selective. No cerium or lanthanum was found in the
leachate, as examined by ICP. No sodium was found in the
leached samples, as examined by ICP and XPS. Cyanide
leaching removed �90% of the gold from the parent gold–
ceria samples. After leaching, the color of gold–ceria
catalysts changed from dark blue to greenish yellow. The
leachate solution was colorless. Leached samples were
washed by deionized water three times; then dried in a
vacuum oven for 10 h, and heated in air at 400 8C for 2 h.
All reagents used in catalyst preparation were ana-
lytical grade. The samples reported here are denoted as
aAu–CL or CG (z), where a is the gold content in atomic
percent, 100 � (Au/MWAu)/(Au/MWAu + Ce/MWCe + La or
Gd/MWLa or Gd); CL is 10 at.% La-doped ceria, CG is 10 or
30 at.% Gd-doped ceria; z is the method of preparation: CP,
DP or UGC. The calcination temperature was typically
400 8C. The calcination temperature, T, of the ceria support
used to prepare DP samples is also included in the
parentheses, e.g. aAu–CL (DP, T). T was typically 400 or
650 8C.
The BET surface area was measured by single-point
N2 adsorption/desorption cycles in a Micromeritics Pulse
ChemiSorb 2705 flow apparatus. Bulk composition analysis
of the catalyst was conducted in an inductively coupled
plasma optical emission spectrometer (ICP-OES, Leeman
Labs Inc.).
XRD analysis was performed in a Rigaku 300 instrument
with a rotating anode generator and a monochromatic
detector. Cu Ka1 radiation was used with a power setting of
60 kV and 300 mA. The mean crystallite size was
determined according to the Scherrer equation [21] and
the lattice parameter, a, was calculated from ceria h1 1 1i or
h2 2 0i reflections by the equation:
a ¼ffiffiffiffiffiffiffiffiffiffiffiffiffiffiffiffiffiffiffiffiffiffiffiffih2 þ k2 þ l2
p l
2 sin u
� �
The software TOPAS (Bruker) was used to perform profile
fitting, lattice parameter refinement and microstructure ana-
lysis.
A Kratos AXIS Ultra Imaging X-ray Photoelectron
Spectrometer with a resolution of 0.1 eV was used to
determine the atomic metal ratios of the surface region and
the metal oxidation state of selected catalysts. Samples were
in powder form and were pressed on a double-side adhesive
copper tape. All measurements were carried out at room
temperature without any sample pre-treatment. An Al Ka X-
ray source was used in this work. All binding energies were
adjusted to the C 1s peaks at 285 eV. An adjacent neutralizer
was used to minimize the static charge on the samples.
Scanning transmission electron microscopy (STEM)
analyses were performed in a Vacuum Generators HB603
STEM equipped with a X-ray microprobe of 0.14 nm
optimum resolution for energy dispersive X-ray spectro-
scopy (EDX). The sample powder was dispersed on a copper
grid coated with a carbon film and elemental maps were
obtained on a 128 � 128 data matrix.
High-resolution transmission electron microscopy
(HRTEM) analyses were performed on a JEOL 2010
instrument, operating at 200 kV with a lanthanum hex-
aboride cathode. The sample powder was suspended in
isopropyl alcohol using an ultrasonic bath and deposited on a
carbon coated 200 mesh Cu grid.
2.2. Apparatus and experimental procedures
Temperature-programmed reduction by hydrogen (H2-
TPR) and carbon monoxide (CO-TPR) was conducted in a
Micromeritics Pulse ChemiSorb 2705 instrument equipped
with a thermal conductivity detector and coupled with an on-
line residual gas analyzer (MKS-model RS-1) to detect CO,
CO2, H2, H2O and O2.
The as-prepared catalysts in fine powder form were first
oxidized in a 20% O2/He gas mixture (50 cm3/min (NTP)) at
350 8C for 30 min, cooled down to room temperature and
then purged with pure helium (Grade 5). The sample was
then heated at a rate of 5 8C/min from room temperature to
900 8C in a 20% H2/N2 or 10 % CO/He gas mixture (50 cm3/
Q. Fu et al. / Applied Catalysis B: Environmental 56 (2005) 57–68 59
min (NTP)). The CO/He gas stream passed through a
hydrocarbon trap (Alltech) to remove any traces of
hydrocarbons from the mixture. In cyclic CO-TPR experi-
ments, heating was stopped at 400 8C, and was followed by
exposure of the catalyst to a 20% O2/He gas mixture
(50 cm3/min (NTP)) at 350 8C. The subsequent cooling and
heating process was as described above.
WGS reaction tests and kinetics measurements were
conducted at atmospheric pressure with the catalyst in
powder form (<150 mm). A quartz tube (OD = 1 or 0.5 cm)
with a porous quartz frit supporting the catalyst was used as a
packed-bed flow reactor. All samples were used in the as
prepared form without activation. Water was injected into
the flowing gas stream by a calibrated syringe pump and
vaporized in the heated gas feed line before entering the
reactor. A condenser filled with ice was installed at the
reactor exit to collect water. The feed and product gas
streams were analyzed by a HP-6890 gas chromatograph
(GC) equipped with a thermal conductivity detector (TCD).
A Carbosphere (Alltech) packed column (1.8 m �0.318 cm) was used to separate H2, CO, CH4 and CO2.
The production rate of CO2 was used to calculate the
reaction rate:
rate ðmol=g sÞ ¼ Noutt � COout
2 Nint � COin
2
Wcat
where Nint or Nout
t is the total molar flow rate in mol/s of feed
or product gas stream at dry condition, COin2 or COout
2 is the
molar fraction of CO2 in the feed or product gas stream at
dry condition, and Wcat is the catalyst weight in grams. Since
Noutt cannot be monitored continuously, Nout
t is expressed as
Nint ðCOin
2 þ COinÞ=ðCOout2 þ COoutÞ, where N in
t was mea-
sured before reaction and the concentration of CO and CO2
were measured by GC. The rate based on CO consumption
was equal to the rate of CO2 production. No methane was
produced under any of the reaction conditions used in this
work.
3. Results and discussion
3.1. Fresh catalyst characterization
Table 1 shows the physical properties of doped and
undoped ceria prepared by UGC; and the properties of gold-
containing cerias. Doping of ceria with La2O3 was used in
our previous work to stabilize the crystal growth of ceria
[9,12,13]. Here we show that doping ceria with gadolinia,
Gd2O3, is equally effective. The ionic radii of both La3+
(0.116 nm) and Gd3+ (0.105 nm) are bigger than Ce4+
(0.097 nm) [7]. Their substitution in the ceria lattice
increases the lattice constant a, as is clearly shown in
Table 1. Of course, for charge neutrality, oxygen ion
vacancies (one per two trivalent cations substituted) are
created in the thus doped ceria.
The physical properties of the as prepared and leached
samples are compared in Table 1. The surface areas,
crystallite sizes of ceria, and lattice constants all remained
almost the same after leaching and heat treating the samples
at the same conditions as the parent materials. The amount of
residual gold in the leached gold–ceria samples was less than
1 at.%, and was about 10% of the original amount of gold in
the parent samples. Low-content gold–ceria and doped ceria
samples were also prepared by one-pot synthesis by the
UGC method. The properties of these materials are also
shown in Table 1.
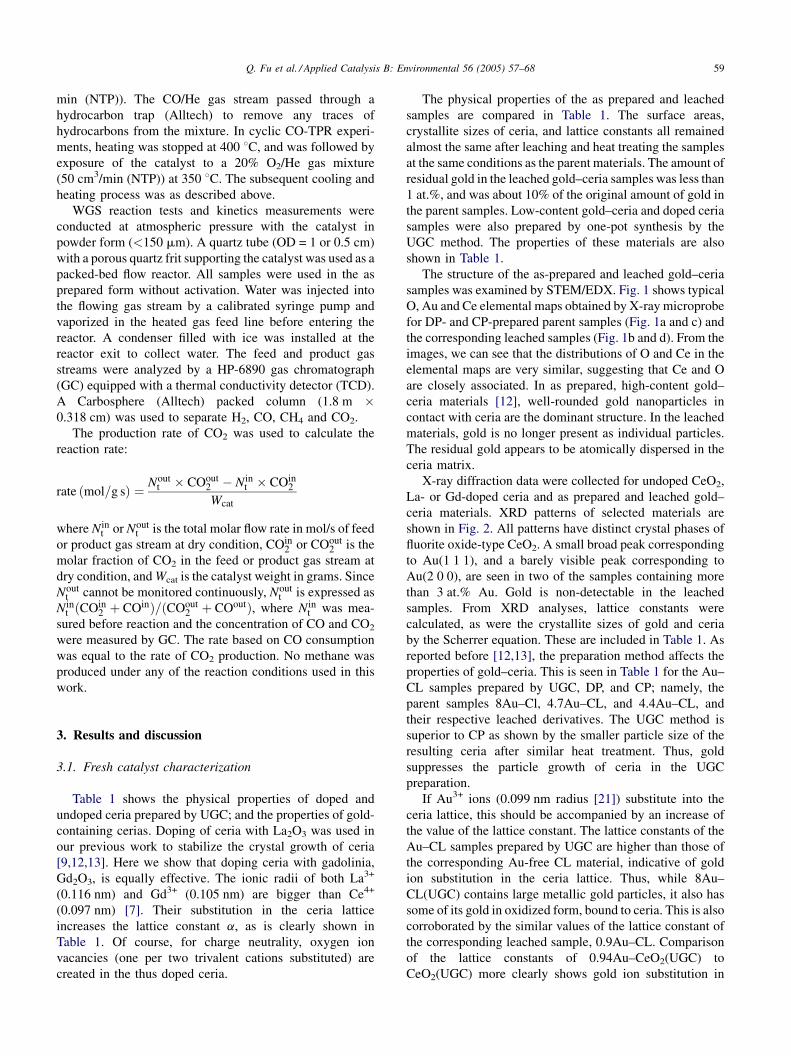
The structure of the as-prepared and leached gold–ceria
samples was examined by STEM/EDX. Fig. 1 shows typical
O, Au and Ce elemental maps obtained by X-ray microprobe
for DP- and CP-prepared parent samples (Fig. 1a and c) and
the corresponding leached samples (Fig. 1b and d). From the
images, we can see that the distributions of O and Ce in the
elemental maps are very similar, suggesting that Ce and O
are closely associated. In as prepared, high-content gold–
ceria materials [12], well-rounded gold nanoparticles in
contact with ceria are the dominant structure. In the leached
materials, gold is no longer present as individual particles.
The residual gold appears to be atomically dispersed in the
ceria matrix.
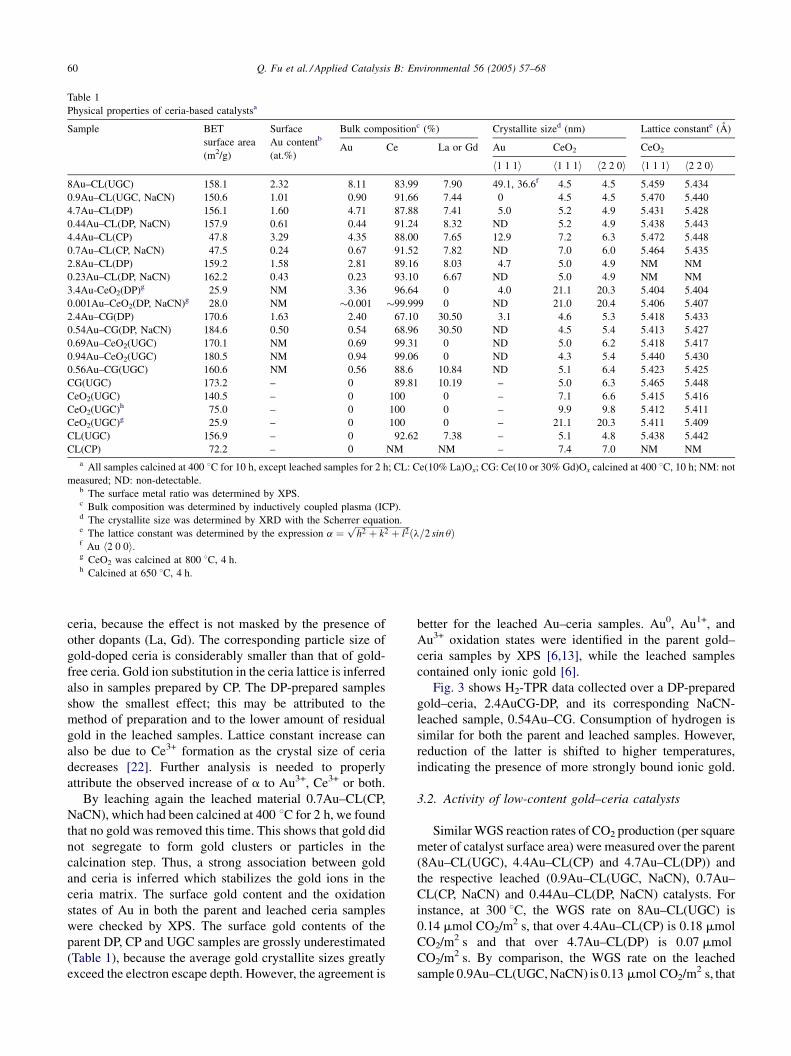
X-ray diffraction data were collected for undoped CeO2,
La- or Gd-doped ceria and as prepared and leached gold–
ceria materials. XRD patterns of selected materials are
shown in Fig. 2. All patterns have distinct crystal phases of
fluorite oxide-type CeO2. A small broad peak corresponding
to Au(1 1 1), and a barely visible peak corresponding to
Au(2 0 0), are seen in two of the samples containing more
than 3 at.% Au. Gold is non-detectable in the leached
samples. From XRD analyses, lattice constants were
calculated, as were the crystallite sizes of gold and ceria
by the Scherrer equation. These are included in Table 1. As
reported before [12,13], the preparation method affects the
properties of gold–ceria. This is seen in Table 1 for the Au–
CL samples prepared by UGC, DP, and CP; namely, the
parent samples 8Au–Cl, 4.7Au–CL, and 4.4Au–CL, and
their respective leached derivatives. The UGC method is
superior to CP as shown by the smaller particle size of the
resulting ceria after similar heat treatment. Thus, gold
suppresses the particle growth of ceria in the UGC
preparation.
If Au3+ ions (0.099 nm radius [21]) substitute into the
ceria lattice, this should be accompanied by an increase of
the value of the lattice constant. The lattice constants of the
Au–CL samples prepared by UGC are higher than those of
the corresponding Au-free CL material, indicative of gold
ion substitution in the ceria lattice. Thus, while 8Au–
CL(UGC) contains large metallic gold particles, it also has
some of its gold in oxidized form, bound to ceria. This is also
corroborated by the similar values of the lattice constant of
the corresponding leached sample, 0.9Au–CL. Comparison
of the lattice constants of 0.94Au–CeO2(UGC) to
CeO2(UGC) more clearly shows gold ion substitution in
Q. Fu et al. / Applied Catalysis B: Environmental 56 (2005) 57–6860
Table 1
Physical properties of ceria-based catalystsa
Sample BET
surface area
(m2/g)
Surface
Au contentb
(at.%)
Bulk compositionc (%) Crystallite sized (nm) Lattice constante (A)
Au Ce La or Gd Au CeO2 CeO2
h1 1 1i h1 1 1i h2 2 0i h1 1 1i h2 2 0i8Au–CL(UGC) 158.1 2.32 8.11 83.99 7.90 49.1, 36.6f 4.5 4.5 5.459 5.434
0.9Au–CL(UGC, NaCN) 150.6 1.01 0.90 91.66 7.44 0 4.5 4.5 5.470 5.440
4.7Au–CL(DP) 156.1 1.60 4.71 87.88 7.41 5.0 5.2 4.9 5.431 5.428
0.44Au–CL(DP, NaCN) 157.9 0.61 0.44 91.24 8.32 ND 5.2 4.9 5.438 5.443
4.4Au–CL(CP) 47.8 3.29 4.35 88.00 7.65 12.9 7.2 6.3 5.472 5.448
0.7Au–CL(CP, NaCN) 47.5 0.24 0.67 91.52 7.82 ND 7.0 6.0 5.464 5.435
2.8Au–CL(DP) 159.2 1.58 2.81 89.16 8.03 4.7 5.0 4.9 NM NM
0.23Au–CL(DP, NaCN) 162.2 0.43 0.23 93.10 6.67 ND 5.0 4.9 NM NM
3.4Au-CeO2(DP)g 25.9 NM 3.36 96.64 0 4.0 21.1 20.3 5.404 5.404
0.001Au–CeO2(DP, NaCN)g 28.0 NM �0.001 �99.999 0 ND 21.0 20.4 5.406 5.407
2.4Au–CG(DP) 170.6 1.63 2.40 67.10 30.50 3.1 4.6 5.3 5.418 5.433
0.54Au–CG(DP, NaCN) 184.6 0.50 0.54 68.96 30.50 ND 4.5 5.4 5.413 5.427
0.69Au–CeO2(UGC) 170.1 NM 0.69 99.31 0 ND 5.0 6.2 5.418 5.417
0.94Au–CeO2(UGC) 180.5 NM 0.94 99.06 0 ND 4.3 5.4 5.440 5.430
0.56Au–CG(UGC) 160.6 NM 0.56 88.6 10.84 ND 5.1 6.4 5.423 5.425
CG(UGC) 173.2 – 0 89.81 10.19 – 5.0 6.3 5.465 5.448
CeO2(UGC) 140.5 – 0 100 0 – 7.1 6.6 5.415 5.416
CeO2(UGC)h 75.0 – 0 100 0 – 9.9 9.8 5.412 5.411
CeO2(UGC)g 25.9 – 0 100 0 – 21.1 20.3 5.411 5.409
CL(UGC) 156.9 – 0 92.62 7.38 – 5.1 4.8 5.438 5.442
CL(CP) 72.2 – 0 NM NM – 7.4 7.0 NM NM
a All samples calcined at 400 8C for 10 h, except leached samples for 2 h; CL: Ce(10% La)Ox; CG: Ce(10 or 30% Gd)Ox calcined at 400 8C, 10 h; NM: not
measured; ND: non-detectable.b The surface metal ratio was determined by XPS.c Bulk composition was determined by inductively coupled plasma (ICP).d The crystallite size was determined by XRD with the Scherrer equation.e The lattice constant was determined by the expression a ¼
ffiffiffiffiffiffiffiffiffiffiffiffiffiffiffiffiffiffiffiffiffiffiffiffiffih2 þ k2 þ l2
pðl=2 sin uÞ
f Au h2 0 0i.g CeO2 was calcined at 800 8C, 4 h.h Calcined at 650 8C, 4 h.
ceria, because the effect is not masked by the presence of
other dopants (La, Gd). The corresponding particle size of
gold-doped ceria is considerably smaller than that of gold-
free ceria. Gold ion substitution in the ceria lattice is inferred
also in samples prepared by CP. The DP-prepared samples
show the smallest effect; this may be attributed to the
method of preparation and to the lower amount of residual
gold in the leached samples. Lattice constant increase can
also be due to Ce3+ formation as the crystal size of ceria
decreases [22]. Further analysis is needed to properly
attribute the observed increase of a to Au3+, Ce3+ or both.
By leaching again the leached material 0.7Au–CL(CP,
NaCN), which had been calcined at 400 8C for 2 h, we found
that no gold was removed this time. This shows that gold did
not segregate to form gold clusters or particles in the
calcination step. Thus, a strong association between gold
and ceria is inferred which stabilizes the gold ions in the
ceria matrix. The surface gold content and the oxidation
states of Au in both the parent and leached ceria samples
were checked by XPS. The surface gold contents of the
parent DP, CP and UGC samples are grossly underestimated
(Table 1), because the average gold crystallite sizes greatly
exceed the electron escape depth. However, the agreement is
better for the leached Au–ceria samples. Au0, Au1+, and
Au3+ oxidation states were identified in the parent gold–
ceria samples by XPS [6,13], while the leached samples
contained only ionic gold [6].
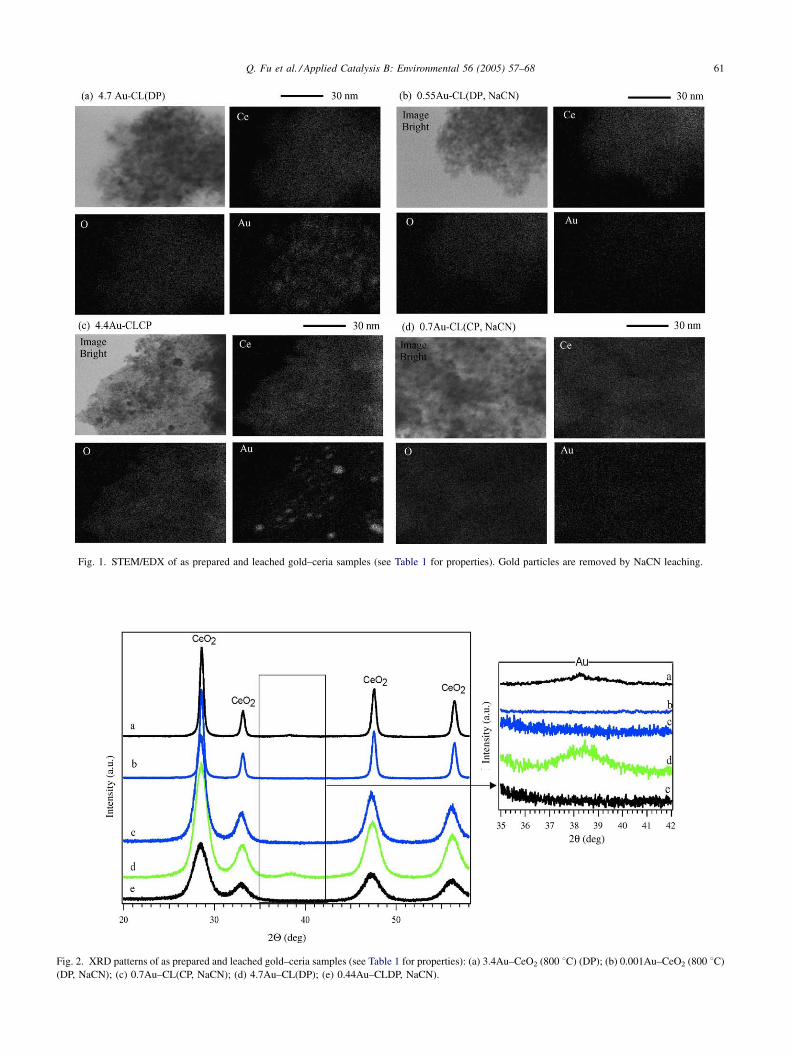
Fig. 3 shows H2-TPR data collected over a DP-prepared
gold–ceria, 2.4AuCG-DP, and its corresponding NaCN-
leached sample, 0.54Au–CG. Consumption of hydrogen is
similar for both the parent and leached samples. However,
reduction of the latter is shifted to higher temperatures,
indicating the presence of more strongly bound ionic gold.
3.2. Activity of low-content gold–ceria catalysts
Similar WGS reaction rates of CO2 production (per square
meter of catalyst surface area) were measured over the parent
(8Au–CL(UGC), 4.4Au–CL(CP) and 4.7Au–CL(DP)) and
the respective leached (0.9Au–CL(UGC, NaCN), 0.7Au–
CL(CP, NaCN) and 0.44Au–CL(DP, NaCN) catalysts. For
instance, at 300 8C, the WGS rate on 8Au–CL(UGC) is
0.14 mmol CO2/m2 s, that over 4.4Au–CL(CP) is 0.18 mmol
CO2/m2 s and that over 4.7Au–CL(DP) is 0.07 mmol
CO2/m2 s. By comparison, the WGS rate on the leached
sample 0.9Au–CL(UGC, NaCN) is 0.13 mmol CO2/m2 s, that
Q. Fu et al. / Applied Catalysis B: Environmental 56 (2005) 57–68 61
Fig. 1. STEM/EDX of as prepared and leached gold–ceria samples (see Table 1 for properties). Gold particles are removed by NaCN leaching.
Fig. 2. XRD patterns of as prepared and leached gold–ceria samples (see Table 1 for properties): (a) 3.4Au–CeO2 (800 8C) (DP); (b) 0.001Au–CeO2 (800 8C)
(DP, NaCN); (c) 0.7Au–CL(CP, NaCN); (d) 4.7Au–CL(DP); (e) 0.44Au–CLDP, NaCN).
Q. Fu et al. / Applied Catalysis B: Environmental 56 (2005) 57–6862
Fig. 3. H2-TPR profiles of 2.4% Au–Ce (30% Gd)Ox prepared by deposi-
tion–precipitation and its NaCN-leached derivative, 0.54% Au–Ce (30%
Gd)Ox. Test condition: 20% H2/N2, 50 cm3/min (STP); 5 8C/min. Catalysts
were pretreated in 20% O2/He at 350 8C for 30 min.
over 0.7Au–CL(CP, NaCN) is 0.16 mmol CO2/m2 s and that
over 0.44Au–CL(DP, NaCN) is 0.10 mmol CO2/m2 s. The
apparent activation energy of the reaction was the same for
parent and leached catalyst samples, 47.0 � 2.7 kJ/mol for
UGC samples, 47.8� 1.5 kJ/mol for the DP samples and 36.8
� 0.9 kJ/mol for the CP samples. Therefore, from the activity
tests, we can conclude that metal gold nanoparticles do not
participate in the water–gas shift reaction.
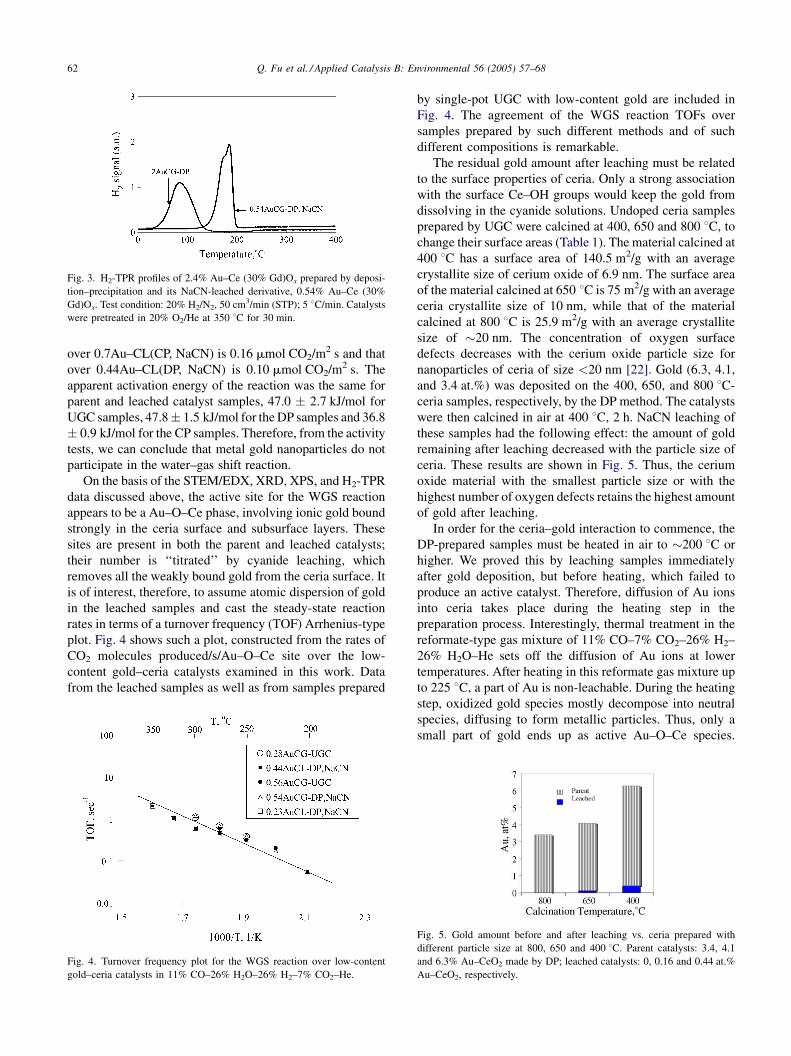
On the basis of the STEM/EDX, XRD, XPS, and H2-TPR
data discussed above, the active site for the WGS reaction
appears to be a Au–O–Ce phase, involving ionic gold bound
strongly in the ceria surface and subsurface layers. These
sites are present in both the parent and leached catalysts;
their number is ‘‘titrated’’ by cyanide leaching, which
removes all the weakly bound gold from the ceria surface. It
is of interest, therefore, to assume atomic dispersion of gold
in the leached samples and cast the steady-state reaction
rates in terms of a turnover frequency (TOF) Arrhenius-type
plot. Fig. 4 shows such a plot, constructed from the rates of
CO2 molecules produced/s/Au–O–Ce site over the low-
content gold–ceria catalysts examined in this work. Data
from the leached samples as well as from samples prepared
Fig. 4. Turnover frequency plot for the WGS reaction over low-content
gold–ceria catalysts in 11% CO–26% H2O–26% H2–7% CO2–He.
by single-pot UGC with low-content gold are included in
Fig. 4. The agreement of the WGS reaction TOFs over
samples prepared by such different methods and of such
different compositions is remarkable.
The residual gold amount after leaching must be related
to the surface properties of ceria. Only a strong association
with the surface Ce–OH groups would keep the gold from
dissolving in the cyanide solutions. Undoped ceria samples
prepared by UGC were calcined at 400, 650 and 800 8C, to
change their surface areas (Table 1). The material calcined at
400 8C has a surface area of 140.5 m2/g with an average
crystallite size of cerium oxide of 6.9 nm. The surface area
of the material calcined at 650 8C is 75 m2/g with an average
ceria crystallite size of 10 nm, while that of the material
calcined at 800 8C is 25.9 m2/g with an average crystallite
size of �20 nm. The concentration of oxygen surface
defects decreases with the cerium oxide particle size for
nanoparticles of ceria of size <20 nm [22]. Gold (6.3, 4.1,
and 3.4 at.%) was deposited on the 400, 650, and 800 8C-
ceria samples, respectively, by the DP method. The catalysts
were then calcined in air at 400 8C, 2 h. NaCN leaching of
these samples had the following effect: the amount of gold
remaining after leaching decreased with the particle size of
ceria. These results are shown in Fig. 5. Thus, the cerium
oxide material with the smallest particle size or with the
highest number of oxygen defects retains the highest amount
of gold after leaching.
In order for the ceria–gold interaction to commence, the
DP-prepared samples must be heated in air to �200 8C or
higher. We proved this by leaching samples immediately
after gold deposition, but before heating, which failed to
produce an active catalyst. Therefore, diffusion of Au ions
into ceria takes place during the heating step in the
preparation process. Interestingly, thermal treatment in the
reformate-type gas mixture of 11% CO–7% CO2–26% H2–
26% H2O–He sets off the diffusion of Au ions at lower
temperatures. After heating in this reformate gas mixture up
to 225 8C, a part of Au is non-leachable. During the heating
step, oxidized gold species mostly decompose into neutral
species, diffusing to form metallic particles. Thus, only a
small part of gold ends up as active Au–O–Ce species.
Fig. 5. Gold amount before and after leaching vs. ceria prepared with
different particle size at 800, 650 and 400 8C. Parent catalysts: 3.4, 4.1
and 6.3% Au–CeO2 made by DP; leached catalysts: 0, 0.16 and 0.44 at.%
Au–CeO2, respectively.

Q. Fu et al. / Applied Catalysis B: Environmental 56 (2005) 57–68 63
Fig. 6. Steady-state WGS reaction rates measured in 11% CO–26% H2O–
26% H2–7% CO2–He. Solid triangles: 4.7Au–CL(DP); open triangles:
leached 0.44Au–CL(DP, NaCN); solid circles: 0.62Au–TiO2(DP), reference
catalyst type A from World Gold Council; solid squares: 2.02Au–
Fe2O3(CP), reference catalyst type C from World Gold Council; open
squares: leached 0.73Au–Fe2O3(CP, NaCN).
The identification of Au ions [6], along with the increased
amount of surface oxygen in the leached samples, Ref. [6]
and Fig. 3, argues in favor of lattice substitution. Annealing
of ceria effectively reduces the number of its oxygen defects.
As can be seen in Table 1 and Fig. 5, large-sized, 800 8C-
treated ceria particles do not retain gold after leaching, and
are inactive at low temperatures. Hence, oxide surfaces with
a high number density of oxygen defects are needed to
prepare an active catalyst.
The WGS reaction activity of gold–ceria was compared
to reference gold catalysts purchased from the World Gold
Council. Fig. 6 shows Arrhenius-type plots for the steady-
state WGS reaction rates over the 4.7Au–CL(DP) sample; its
leached derivative, 0.44 Au–CL(NaCN); two gold reference
catalysts, type A (1.5 wt.% Au/TiO2, prepared by DP) and
type C (5.0 wt.% Au/Fe2O3, prepared by coprecipitation).
The gold loading is expressed in at.% in all samples shown in
Fig. 6. Also shown in Fig. 6 is the rate measured over type C
catalyst after leaching it in NaCN solution. Notably, the
leached form of this reference catalyst, after removal of
approximately two thirds of its gold loading by NaCN, was
of comparable activity to its parent. Hence, iron oxide also
binds gold strongly, similar to ceria. On the other hand, type
A sample lost all of its gold and all its activity after leaching.
Table 2
Physical properties of Au–ceria after different thermal treatments
Sample Support calculated temperature (8C)
CeO2 (UGC) 800 8C, 4 h
Ce(La)O2 (UGC) 800 8C, 4 h
0.44 Au–CL(DP, NaCN) 400 8C, 10 h
0.44Au–CL(DP, NaCN) 400 8C, 10 h
0.14Au–CL(DP, NaCN)a
4.7Au–CL(DP) 400 8C, 10 h
4.7Au–CL(DP) 400 8C, 10 h
0.2Au–CL(DP, NaCN)b
a Re-leached with NaCN from 0.44Au–CL(DP, NaCN) (properties shown inb Leached from the parent catalyst 4.7Au–CL(DP) (properties shown in the r
We attribute this to the method of preparation and the low-
surface area of the titania support.
3.3. Stability of gold–ceria catalysts
3.3.1. Annealing in air
We have found in previous work that certain dopants,
such as lanthana, stabilize ceria and prevent its sintering
[9,12]. As can be seen in Table 2, the surface area of CeO2
calcined at 800 8C is only 25.9 m2/g if undoped, while that
of La-doped ceria is 43.6 m2/g. Remarkably, the surface area
of leached Au–ceria, which contains only 0.44% Au, is
61.1 m2/g, after the 800 8C thermal treatment. Re-leaching
the 800 8C-treated sample reduced the Au amount from 0.44
to 0.14%. In another case, further annealing of 4.7Au–
CL(DP) at 800 8C for 4 h, decreased its surface area from
156.1 to 44.3 m2/g. Leaching this sample by NaCN reduced
the gold content to 0.2% and increased the surface area to
61.3 m2/g. Thus, not only is gold stabilized in the ceria
matrix, but also the embedded Au suppresses the sintering of
ceria.
3.3.2. Stability in WGS reaction conditions
Catalyst stability evaluation is important both to improve
our fundamental understanding of the activity, and to enable
practical catalyst designs. Zalc et al. [23] reported a rapid
first-order deactivation of Pt–ceria catalysts under reaction
conditions and attributed it to over-reduction of ceria; further
claiming that ceria-based catalysts are not suitable for WGS
in fuel processing. Similar deactivation of Pt–CeO2 catalysts
was reported by Ghenciu [24]. Wang et al. [25] conducted
accelerated aging of Pd/ceria in different gas mixtures. They
found that only aging the catalyst in CO gas led to
deactivation and argued that deactivation is induced by
metal particles agglomeration in the presence of CO, which
can be avoided by proper catalyst design to improve the
metal-support interaction that stabilizes the palladium metal
particles.
The stability of gold–ceria catalysts under WGS
conditions has not been adequately addressed in the
literature. Kim and Thompson [26] observed a fast and
considerable (�50%) loss of activity in their gold–ceria
catalyst, which was initially more active than a high activity
Catalyst calculated temperature (8C) BET surface area (m2/g)
25.9
43.6
400 8C, 2 h 157.9
800 8C, 4 h 61.1
400 8C, 2 h 61.5
400 8C, 10 h 156.1
800 8C, 4 h 44.3
400 8C, 2 h 61.3
the row, immediately above), which was heated at 800 8C, 4 h.
ow, immediately above), which was heated at 800 8C for 4 h.

Q. Fu et al. / Applied Catalysis B: Environmental 56 (2005) 57–6864
Table 3
Surface area and ceria particle size changes after WGS reactiona
Sample Surface area (m2/g) Particle sizeb (nm)
Fresh Used Fresh Used
Au h1 1 1i CeO2 h1 1 1i CeO2 h2 2 0i Au h1 1 1i CeO2 h1 1 1i CeO2 h2 2 0i4.7Au–CL(DP) 156.1 131.1c 5.0 5.2 4.9 7.2c 5.7c 4.7c
128.4d 6.2d 5.3d 4.9d
0.44Au–CL(DP, NaCN) 157.9 129.9c ND 5.2 4.9 NDc 6.4c 6.2c
NDe 5.4e 5.2e
4.7Au–CL(DP, 650) 82.7 71.6f 4.6 7.1 6.9 6.8f 7.3f 7.2f
3.8Au–CL(CP) 71.8 61.3f 6.7 5.8 5.3 7.2f 7.0f 6.4f
8Au–CL(UGC) 158.1 118.7c 49.1, 36.6g 4.5 4.5 65.1c, 59.4cg 5.0c 4.8c
a All catalysts are as prepared and calcined at 400 8C; ND: non-detectable; NM: not measured.b Determined by XRD, using the Scherrer equation.c Used in 5% CO–15% H2O–35% H2–He for 100 h; space velocity 15,000 h1; reaction temperature: 250 8C.d Used in 2% CO–10% H2O–He for 70 h, space velocity 80,000 h1; temperature range: 150–350 8C.e Used in 11% CO–26% H2O–7% CO2–26% H2–He for 100 h, temperature: 300 8C.f Used in 7% CO–38% H2O–11% CO2–40% H2–He for 120 h, temperature range: 150–350 8C.g Au h2 0 0i.
Fig. 7. Stability of gold-ceria WGS catalysts (see Table 1 for properties).
Space velocity: 15,000 h1 (NTP); 5% CO–15% H2O–35% H2–He; reac-
tion temperature: 250 8C. Diamonds: 8Au–CL(UGC); crosses: 4.7Au–
CL(DP); squares: 0.44Au–CL(DP, NaCN); all catalysts calcined at
400 8C (see Table 1 for properties).
commercial Cu–Zn–Al catalyst. They attributed this to loss
of active sites by either carbonates or hydrocarbons formed
during the WGS reaction. In the present work, we conducted
different tests to check the stability of Au–ceria over a wide
range of temperatures and different WGS gas compositions.
In a 120 h long stability test of the 4.7Au–CL(DP, 650)
sample (Table 3) at 300 8C, the catalytic activity remained
almost the same in a reformate-type gas mixture containing
7% CO–38% H2O–11% CO2–40% H2–He (space velocity
6000 h1 (NTP)). No significant changes were observed in
the conversion of CO (around 60%) during this period.
Catalyst characterization after this test, found that the ceria
crystallite size had increased only slightly, while the gold
crystallite size grew by 47% to 6.8 nm (Table 3). The total
surface area had changed from 82.7 to 71.6 m2/g cat.
Three catalyst samples: 8Au–CL(UGC), 4.7Au–CL(DP),
and 0.44Au–CL(DP, NaCN), were tested in a gas mixture
containing 5% CO–15% H2O–35% H2–He, at 250 8C and at
a space velocity of 15,000 h1 (NTP) for 100 h. The CO
conversion vs. time plot is shown in Fig. 7. The conversion
dropped �20% in the first 10 h and was then stabilized with
very slow further decay. The surface area of both the parent
and the leached DP-samples after 100 h on-stream were
similar, �130 m2/g cat.
Table 3 shows the surface areas and crystallite sizes of
gold and ceria in the as prepared and used Au–CL samples.
Growth of crystallite size of gold and ceria is seen in the used
catalysts. As discussed above, the gold crystallite size has
little effect on the catalytic activity. Therefore, the initial
activity loss is not due to the growth of gold particles.
However, it is possible that the growth of ceria crystallite
size weakens the interaction of Au and ceria. The surface
area dropped 20 � 5%, after use in various reaction gas
mixture and temperatures. The surface area loss is in
agreement with the long-term activity loss shown in Fig. 7.
From these results, we may attribute the initial activity loss
to surface area loss of ceria as a result of exposure of the
catalyst to the WGS reaction mixture.
The oxidation state of gold may be affected by the
reactant gas composition. Recently, Guzman and Gates [27]
prepared cationic gold on MgO crystals and reported that
Au3+ is reduced to Au1+ and subsequently Au0 in reducing
atmospheres even at room temperature. Au1+ and Au0 were
formed and Au3+ disappeared after exposure of the
supported Au3+ complex to a mixture of CO and O2.
In the present work, we found cationic Au in all gold–
ceria samples prepared by various techniques, and after use
in the WGS environment for many hours. XPS analysis of
Au–ceria catalysts after 15 h use in the reaction gas mixture
of 11% CO–26% H2O–7% CO2–26% H2–He (at the
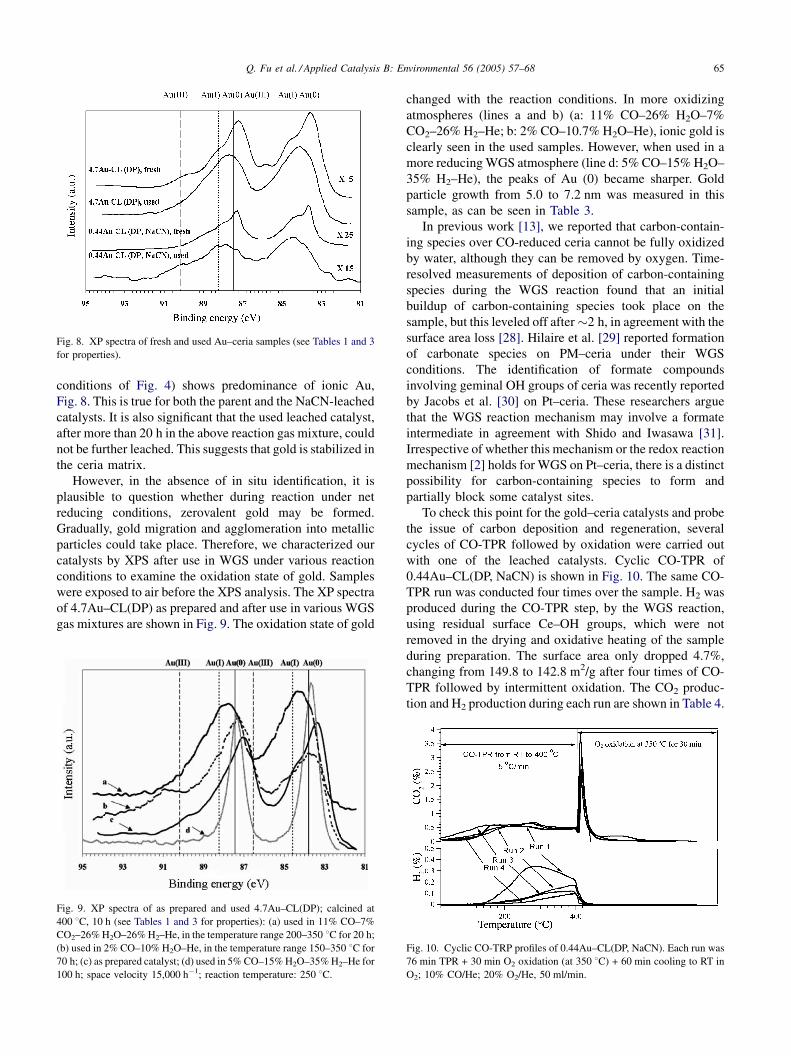
Q. Fu et al. / Applied Catalysis B: Environmental 56 (2005) 57–68 65
Fig. 8. XP spectra of fresh and used Au–ceria samples (see Tables 1 and 3
for properties).
conditions of Fig. 4) shows predominance of ionic Au,
Fig. 8. This is true for both the parent and the NaCN-leached
catalysts. It is also significant that the used leached catalyst,
after more than 20 h in the above reaction gas mixture, could
not be further leached. This suggests that gold is stabilized in
the ceria matrix.
However, in the absence of in situ identification, it is
plausible to question whether during reaction under net
reducing conditions, zerovalent gold may be formed.
Gradually, gold migration and agglomeration into metallic
particles could take place. Therefore, we characterized our
catalysts by XPS after use in WGS under various reaction
conditions to examine the oxidation state of gold. Samples
were exposed to air before the XPS analysis. The XP spectra
of 4.7Au–CL(DP) as prepared and after use in various WGS
gas mixtures are shown in Fig. 9. The oxidation state of gold
Fig. 9. XP spectra of as prepared and used 4.7Au–CL(DP); calcined at
400 8C, 10 h (see Tables 1 and 3 for properties): (a) used in 11% CO–7%
CO2–26% H2O–26% H2–He, in the temperature range 200–350 8C for 20 h;
(b) used in 2% CO–10% H2O–He, in the temperature range 150–350 8C for
70 h; (c) as prepared catalyst; (d) used in 5% CO–15% H2O–35% H2–He for
100 h; space velocity 15,000 h1; reaction temperature: 250 8C.
changed with the reaction conditions. In more oxidizing
atmospheres (lines a and b) (a: 11% CO–26% H2O–7%
CO2–26% H2–He; b: 2% CO–10.7% H2O–He), ionic gold is
clearly seen in the used samples. However, when used in a
more reducing WGS atmosphere (line d: 5% CO–15% H2O–
35% H2–He), the peaks of Au (0) became sharper. Gold
particle growth from 5.0 to 7.2 nm was measured in this
sample, as can be seen in Table 3.
In previous work [13], we reported that carbon-contain-
ing species over CO-reduced ceria cannot be fully oxidized
by water, although they can be removed by oxygen. Time-
resolved measurements of deposition of carbon-containing
species during the WGS reaction found that an initial
buildup of carbon-containing species took place on the
sample, but this leveled off after �2 h, in agreement with the
surface area loss [28]. Hilaire et al. [29] reported formation
of carbonate species on PM–ceria under their WGS
conditions. The identification of formate compounds
involving geminal OH groups of ceria was recently reported
by Jacobs et al. [30] on Pt–ceria. These researchers argue
that the WGS reaction mechanism may involve a formate
intermediate in agreement with Shido and Iwasawa [31].
Irrespective of whether this mechanism or the redox reaction
mechanism [2] holds for WGS on Pt–ceria, there is a distinct
possibility for carbon-containing species to form and
partially block some catalyst sites.
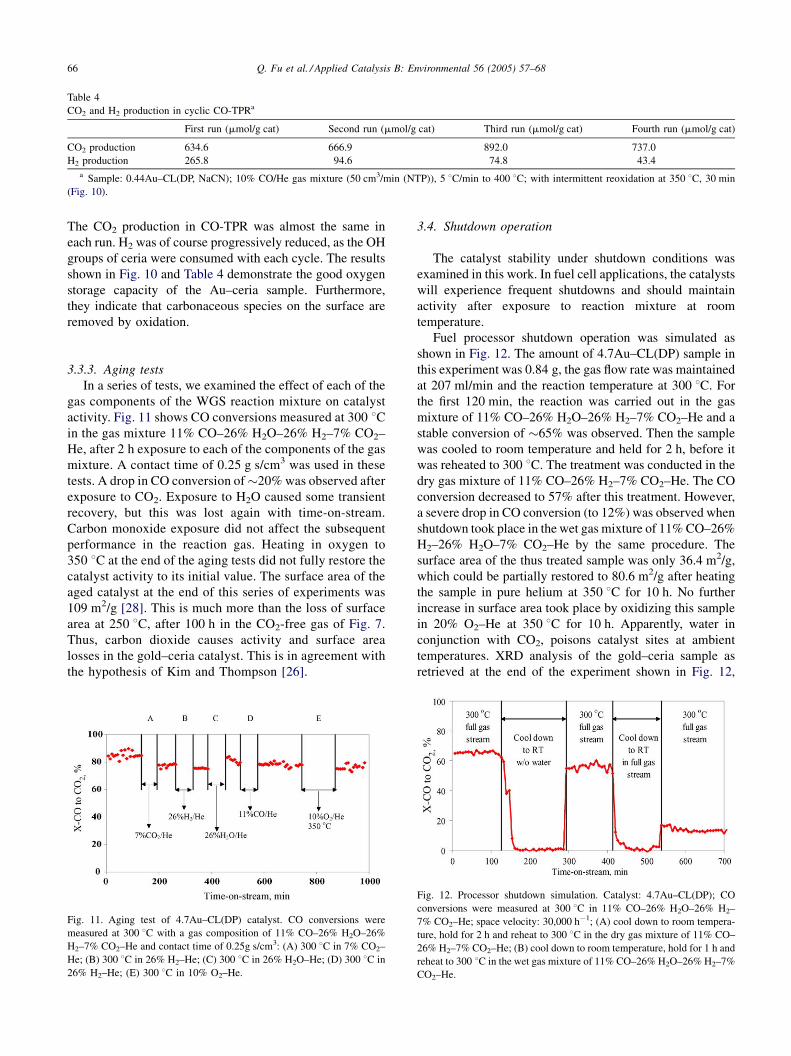
To check this point for the gold–ceria catalysts and probe
the issue of carbon deposition and regeneration, several
cycles of CO-TPR followed by oxidation were carried out
with one of the leached catalysts. Cyclic CO-TPR of
0.44Au–CL(DP, NaCN) is shown in Fig. 10. The same CO-
TPR run was conducted four times over the sample. H2 was
produced during the CO-TPR step, by the WGS reaction,
using residual surface Ce–OH groups, which were not
removed in the drying and oxidative heating of the sample
during preparation. The surface area only dropped 4.7%,
changing from 149.8 to 142.8 m2/g after four times of CO-
TPR followed by intermittent oxidation. The CO2 produc-
tion and H2 production during each run are shown in Table 4.
Fig. 10. Cyclic CO-TRP profiles of 0.44Au–CL(DP, NaCN). Each run was
76 min TPR + 30 min O2 oxidation (at 350 8C) + 60 min cooling to RT in
O2; 10% CO/He; 20% O2/He, 50 ml/min.
Q. Fu et al. / Applied Catalysis B: Environmental 56 (2005) 57–6866
Table 4
CO2 and H2 production in cyclic CO-TPRa
First run (mmol/g cat) Second run (mmol/g cat) Third run (mmol/g cat) Fourth run (mmol/g cat)
CO2 production 634.6 666.9 892.0 737.0
H2 production 265.8 94.6 74.8 43.4
a Sample: 0.44Au–CL(DP, NaCN); 10% CO/He gas mixture (50 cm3/min (NTP)), 5 8C/min to 400 8C; with intermittent reoxidation at 350 8C, 30 min
(Fig. 10).
The CO2 production in CO-TPR was almost the same in
each run. H2 was of course progressively reduced, as the OH
groups of ceria were consumed with each cycle. The results
shown in Fig. 10 and Table 4 demonstrate the good oxygen
storage capacity of the Au–ceria sample. Furthermore,
they indicate that carbonaceous species on the surface are
removed by oxidation.
3.3.3. Aging tests
In a series of tests, we examined the effect of each of the
gas components of the WGS reaction mixture on catalyst
activity. Fig. 11 shows CO conversions measured at 300 8Cin the gas mixture 11% CO–26% H2O–26% H2–7% CO2–
He, after 2 h exposure to each of the components of the gas
mixture. A contact time of 0.25 g s/cm3 was used in these
tests. A drop in CO conversion of �20% was observed after
exposure to CO2. Exposure to H2O caused some transient
recovery, but this was lost again with time-on-stream.
Carbon monoxide exposure did not affect the subsequent
performance in the reaction gas. Heating in oxygen to
350 8C at the end of the aging tests did not fully restore the
catalyst activity to its initial value. The surface area of the
aged catalyst at the end of this series of experiments was
109 m2/g [28]. This is much more than the loss of surface
area at 250 8C, after 100 h in the CO2-free gas of Fig. 7.
Thus, carbon dioxide causes activity and surface area
losses in the gold–ceria catalyst. This is in agreement with
the hypothesis of Kim and Thompson [26].
Fig. 11. Aging test of 4.7Au–CL(DP) catalyst. CO conversions were
measured at 300 8C with a gas composition of 11% CO–26% H2O–26%
H2–7% CO2–He and contact time of 0.25g s/cm3: (A) 300 8C in 7% CO2–
He; (B) 300 8C in 26% H2–He; (C) 300 8C in 26% H2O–He; (D) 300 8C in
26% H2–He; (E) 300 8C in 10% O2–He.
3.4. Shutdown operation
The catalyst stability under shutdown conditions was
examined in this work. In fuel cell applications, the catalysts
will experience frequent shutdowns and should maintain
activity after exposure to reaction mixture at room
temperature.
Fuel processor shutdown operation was simulated as
shown in Fig. 12. The amount of 4.7Au–CL(DP) sample in
this experiment was 0.84 g, the gas flow rate was maintained
at 207 ml/min and the reaction temperature at 300 8C. For
the first 120 min, the reaction was carried out in the gas
mixture of 11% CO–26% H2O–26% H2–7% CO2–He and a
stable conversion of �65% was observed. Then the sample
was cooled to room temperature and held for 2 h, before it
was reheated to 300 8C. The treatment was conducted in the
dry gas mixture of 11% CO–26% H2–7% CO2–He. The CO
conversion decreased to 57% after this treatment. However,
a severe drop in CO conversion (to 12%) was observed when
shutdown took place in the wet gas mixture of 11% CO–26%
H2–26% H2O–7% CO2–He by the same procedure. The
surface area of the thus treated sample was only 36.4 m2/g,
which could be partially restored to 80.6 m2/g after heating
the sample in pure helium at 350 8C for 10 h. No further
increase in surface area took place by oxidizing this sample
in 20% O2–He at 350 8C for 10 h. Apparently, water in
conjunction with CO2, poisons catalyst sites at ambient
temperatures. XRD analysis of the gold–ceria sample as
retrieved at the end of the experiment shown in Fig. 12,
Fig. 12. Processor shutdown simulation. Catalyst: 4.7Au–CL(DP); CO
conversions were measured at 300 8C in 11% CO–26% H2O–26% H2–
7% CO2–He; space velocity: 30,000 h1; (A) cool down to room tempera-
ture, hold for 2 h and reheat to 300 8C in the dry gas mixture of 11% CO–
26% H2–7% CO2–He; (B) cool down to room temperature, hold for 1 h and
reheat to 300 8C in the wet gas mixture of 11% CO–26% H2O–26% H2–7%
CO2–He.

Q. Fu et al. / Applied Catalysis B: Environmental 56 (2005) 57–68 67
Fig. 13. Shutdown simulation using gold–ceria, 0.57 at.% Au–Ce (10%
La)Ox, and gold–titania, 0.62 at.% Au/TiO2. Gas composition: 11% CO–
26% H2O–26% H2–7% CO2–He; space velocity: 50,000 h1; #: World Gold
Council, reference catalyst type A: 1.5 wt.% Au/TiO2.
revealed the presence of cerium hydroxycarbonate,
CeCO3OH. A more detailed study is necessary to examine
deactivation as a function of the water content in the gas. A
potential engineering solution for stationary hydrogen
generators is to divert the water flow into the heating/cooling
system, and conduct shutdown in the non-condensable gas
mixture only.
Fig. 13 compares the shutdown effect on the CO
conversion over a 0.57 at.% Au–CL catalyst prepared by
NaCN leaching from a DP-parent material not included in
Table 1 [32] and the 0.62 at.% Au–TiO2 (ref. catalyst type A,
from the World Gold Council; WGS activity shown in Fig.
6). The latter shows stable activity after shutdown in the full
gas mixture. However, it is inferior to the gold–ceria
catalyst, as shown by its much lower steady-state CO
conversion at 300 8C prior to shutdown. Efforts to stabilize
the ceria surface are deemed important for the development
of the next generation water–gas shift catalysts.
4. Summary/conclusions
In this work, we examined the activity and stability of
Au–ceria catalysts under realistic water–gas shift reaction
conditions. Metallic gold nanoparticles as well as ionic gold
were found in gold–ceria catalysts. Leaching with NaCN
solutions, removed all the gold species that were weakly
bound on ceria. This included all the metal Au nanoparticles.
The leached samples contained only a small fraction of the
original amount of gold in the form of cations, apparently
bound in the ceria lattice as Au–O–Ce species. Au ion
substitution in ceria was suggested by a measurable lattice
constant expansion of the crystal.
Similar rates of CO2 production by the water gas shift
reaction were measured over the parent and leached gold–
ceria catalysts. The extra gold present in the parent material
does not increase the rate; nor does it change the activation
energy of the reaction. Reaction rates scale with the amount
of gold present in the leached samples. They also scale with
the amount of gold present in low-content gold–ceria
samples prepared by single-pot UGC synthesis. These
findings hold true for undoped ceria as well as for La- or Gd-
doped nanocrystalline cerias.
The number of active sites was found to correlate well
with the properties of the support oxide, namely the ceria
surface area and crystallite size. For the Au–ceria catalysts
prepared by DP, the smaller the crystallite size of ceria, the
larger the amount of gold retained after leaching. Large-
sized ceria particles produced by annealing at 800 8C did not
retain any gold after leaching. The method of preparation
affects the catalyst properties. Gelation or coprecipitation
techniques can be suitably developed to prepare a catalyst
with a large concentration of active sites.
Gold–ceria catalysts are stable at low-temperature WGS
reaction conditions. Through strong interaction with the
Ce–O species, gold ions are stabilized in the ceria matrix.
Furthermore, the incorporation of Au into ceria can suppress
the sintering of ceria at temperatures as high as 800 8C.
Initial loss of activity under reaction conditions is small, and
correlates well with a concomitant loss of ceria surface area
in the reaction mixture. Gas composition plays an important
role in controlling the oxidation state of gold, but this is a
complex function of the gas composition–temperature effect
on the ceria surface reduction/oxidation. Shutdown opera-
tion in the full gas stream has identified a stability problem
due to cerium oxide—hydroxycarbonate formation. This
needs to be properly addressed.
A general conclusion from this work is that the active
sites for the WGS reaction on gold–ceria and potentially
other Au-oxide systems, as well as other metals on ceria [6]
are nonmetallic. Phases involving metal cations and the
oxide support, M–O–Ce, appear to do the catalysis. Whether
this holds true for other oxidation reactions on oxide-
supported metals is worth pursuing in future work. This
opens the field to new catalyst designs involving metal ions
in oxide supports, and potentially new cost-effective catalyst
solutions to meet the needs of the hydrogen economy in the
near future.
Acknowledgement
The financial support of this work by the NSF/EPA,
Grant No. CTS-9985305 and by the NSF Nanotechnology
Interdisciplinary Research Team (NIRT) Grant No.
0304515, is gratefully acknowledged.
References
[1] D.S. Newsome, Catal. Rev. Sci. Eng. 21 (1980) 275.
[2] T. Bunluesin, R.J. Gorte, G.W. Graham, Appl. Catal. B 15 (1998) 107.

Q. Fu et al. / Applied Catalysis B: Environmental 56 (2005) 57–6868
[3] S. Hilaire, X. Wang, T. Luo, R.J. Gorte, J. Wagner, Appl. Catal. A:
Gen. 215 (2001) 271.
[4] S.L. Swartz, M.M. Seabaugh, C.T. Holt, W.J. Dawson, Fuel Cell Bull.
30 (2001) 7.
[5] Y. Li, Q. Fu, M. Flytzani-Stephanopoulos, Appl. Catal. B 27 (2000) 179.
[6] Q. Fu, H. Saltsburg, M. Flytzani-Stephanopoulos, Science 301 (2003)
935, published online 3 July (10.1126/science.1085721).
[7] A. Trovarelli (Ed.), Catalysis by Ceria and Related Materials,
Catalytic Science Series, vol. 2, Imperial College Press, London,
2002.
[8] T. Zhu, L. Kundakovic, A. Dreher, M. Flytzani-Stephanopoulos, Catal.
Today 50 (2) (1999) 381.
[9] L. Kundakovic, M. Flytzani-Stephanopoulos, J. Catal. 179 (1998) 203.
[10] W. Liu, M. Flytzani-Stephanopoulos, J. Catal. 153 (1995) 304.
[11] W. Liu, M. Flytzani-Stephanopoulos, J. Catal. 153 (1995) 317.
[12] Q. Fu, A. Weber, M. Flytzani-Stephanopoulos, Catal. Lett. 77 (1–3)
(2001) 87.
[13] Q. Fu, S. Kudriavtseva, H. Saltsburg, M. Flytzani-Stephanopoulos,
Chem. Eng. J. 93 (2003) 41.
[14] H.C. Yao, Y.F. Yu Yao, J. Catal. 86 (1984) 254.
[15] S. Gardner, G. Hoflund, D. Schryer, J. Schryer, B. Upchurch, E. Kielin,
Langmuir 7 (1991) 2135.
[16] D. Andreeva, V. Idakiev, T. Tabakova, L. Ilieva, P. Falaras, A.
Bourlinos, A. Travlos, Catal. Today 72 (1–2) (2002) 51.
[17] M. Haruta, N. Yamada, T. Kobayashi, S. Iijima, J. Catal. 115 (1989)
301.
[18] M. Valden, X. Lai, D.W. Goodman, Science 281 (1998) 1647.
[19] G.C. Bond, D.T. Thompson, Gold Bull. 33 (2) (2000) 41.
[20] N. Hedley, H. Tabachnik, Chemistry of Cyanidation, American
Cyanamid Company, Wayne, NJ, 1968.
[21] L. Minervini, M.O. Zacate, R.W. Grimes, Solid State Ionics 116
(1999) 339.
[22] F. Zhang, S.-W. Chan, J.E. Spanier, E. Apak, Q. Jin, R.D. Robinson,
I.P. Herman, Appl. Phys. Lett. 80 (1) (2002) 127.
[23] J.M. Zalc, V. Sokolovskii, D.G. Loffler, J. Catal. 206 (2002) 169.
[24] F. Ghenciu, Curr. Opin. Solid State Mater. Sci. 6 (5) (2002) 389.
[25] X. Wang, R.J. Gorte, J.P. Wagner, J. Catal. 212 (2002) 225.
[26] C.H. Kim, L. Thompson, Preprints Symp. ACS, Div. Fuel Chem. 48
(1) (2003) 233.
[27] J. Guzman, B.C. Gates, J. Phys. Chem. B 107 (2003) 2242.
[28] Q. Fu, Ph.D. Dissertation, Department of Chemical and Biological
Engineering, Tufts University, Medford, MA, 2004.
[29] S. Hilaire, X. Wang, T. Luo, R.J. Gorte, J. Wagner, Appl. Catal. A:
Gen. 215 (2001) 271.
[30] G. Jacobs, L. Williams, U. Graham, G.A. Thomas, D.E. Sparks, B.H.
Davis, Appl. Catal. A: Gen. 252 (2003) 107.
[31] T. Shido, Y. Iwasawa, J. Catal. 141 (1993) 71.
[32] W. Deng, Ph.D. Thesis, Tufts University, in preparation.
![Antioxidant Cerium Oxide Nanoparticles in Biology and … · Antioxidant Cerium Oxide Nanoparticles in Biology ... dermal burn cream (Flammacerium) [5] ... Antioxidant Cerium Oxide](https://img.pdfslide.us/doc/110x75/5ade477c7f8b9ae1408e286b/antioxidant-cerium-oxide-nanoparticles-in-biology-and-cerium-oxide-nanoparticles.jpg)