Embed Size (px)
Citation preview
© Chicago Botanic Garden 1
Activity 1.3: Are All Plants Created Equal? What factors may affect rates of photosynthesis and cellular respiration?
Grades 10 – 12 Total Time: Five to six class periods (for all parts of activity) Description: Part 1: Introduction to Photosynthesis (Optional: if students have not yet covered photosynthesis.) Students make observations of stomata and compare the stomata from different plants. Students discuss their results and draw conclusions about why stomata are important for photosynthesis, how carbon dioxide gets into the plant, and how plants then get the carbon they need to make sugar. Part 2: Photosynthesis and Cellular Respiration Students explore the factors that may affect rates of photosynthesis and cellular respiration. Students will design experiments to test, describe, and explain the cyclical relationship between photosynthesis and cellular respiration. Students generate hypotheses about the relationship between photosynthesis and cellular respiration. They collect data using electronic collection probes to determine the amount of CO2 and O2 produced by different plants under different conditions. Students then analyze that data and draw conclusions about how plants affect the atmosphere. National Science Education Standards: A1c Use technology and mathematics to improve
investigations and communications. A1d Formulate and revise scientific explanations and
models using logic and evidence. C5b The energy for life primarily derives from the sun.
Plants capture energy by absorbing light and using it to form strong (covalent) chemical bonds between the atoms of carbon-containing (organic) molecules
Materials: Part 1 Leaf Pigment Station • Beakers (10) • Acetone (2) • Assorted leaves • Mortar & pestle, or other way to
crush leaves (4-5) • Strips of filter paper (one per
student or per group) • Tape Chloroplast Station • Microscopes (1 per group) • Chloroplast slides Stomata Station • Empty slides (15) • Clear tape • One desert and one tropical plant
(suggested: jade and pothos plants) • Microscopes • Yarn (to flag branches with nail
polish) • Nail polish Part 2 • Electronic CO2 and O2 probes, and
appropriate data-collection apparatus
• Clear plastic bottles that are impervious to oxygen (PVC barbeque sauce bottles are a good, inexpensive option, as are clear pharmaceutical-grade bottles)
• Computers with internet access • Access to outdoor area with
different types of plants and conditions
AAAS Benchmarks: 4C/H1 Plants on land and under water alter the Earth's atmosphere by removing carbon dioxide
from it, using the carbon to make sugars and releasing oxygen. This process is responsible for the oxygen content of the air.
© Chicago Botanic Garden 2
Guiding Questions: • What are the equations for photosynthesis and respiration? • What factors affect the rate of photosynthesis and respiration? Vocabulary/Background Photosynthesis is a chemical process that converts carbon dioxide into organic compounds, especially sugars, using the energy from sunlight. Photosynthesis occurs in plants, algae, and many species of bacteria. In plants, algae, and cyanobacteria, photosynthesis uses carbon dioxide and water, releasing oxygen as a waste product. Photosynthesis is vital for all aerobic life on Earth. In addition to maintaining normal levels of oxygen in the atmosphere, photosynthesis is the source of energy for nearly all life on Earth, either directly, through primary production, or indirectly, when consumers eat and get energy from their food. Photosynthesis is also the source of the carbon in all the organic compounds within organisms' bodies. Photosynthesis begins when energy from light is absorbed by proteins called photosynthetic reaction centers that contain chlorophyll. In plants, these proteins are held inside organelles called chloroplasts, while in bacteria they are embedded in the plasma membrane. Some of the light energy gathered by chlorophyll is stored in the form of adenosine triphosphate (ATP). The rest of the energy is used to remove electrons from a substance such as water. These electrons are then used in the reactions that turn carbon dioxide into organic compounds. Stomata are microscopic pores on the surface (epidermis) of plants. Each is surrounded by a pair of specialized epidermal cells called guard cells, which act as turgor pressure-driven valves that open and close the pores in response to given environmental conditions. The presence of countless numbers of stomata is critical for plant function. Typically, the plant epidermis is tightly sealed by wax-coated, interlocking, epidermal pavement cells, which protect the plant body from the dry atmosphere and UV-rays. At the same time plants must be able to exchange carbon dioxide and oxygen, for photosynthesis and respiration. Stomata act as a gateway for efficient gas exchange and water movement from the roots through the vascular tissue to the atmosphere. Transpiration via stomata supplies water and minerals to the entire plant system. When a plant encounters adverse environmental conditions, such as drought, a plant hormone called abscisic acid triggers stomata to shut tightly in order to prevent plants from dehydration and wilting. Turgor is the state of being turgid; the rigid or fullness of a cell due to high water content as a result of differing solute concentrations between a semi-permeable membrane.
Respiration is one of the key ways a cell gains useful energy to fuel cellular changes. Cellular respiration is the set of the metabolic reactions and processes that take place in the cells of organisms to convert biochemical energy from nutrients into adenosine triphosphate (ATP). The reactions involved in respiration are catabolic reactions that involve the redox reaction (oxidation of one molecule and the reduction of another).
© Chicago Botanic Garden 3
Transpiration is the evaporation of water from plants. It occurs chiefly at the leaves while their stomata are open for the passage of CO2 and O2 during photosynthesis. Environmental factors affect the rate of transpiration, such as:
• Light – plants transpire more rapidly in the light than in the dark. This is largely because light stimulates the opening of the stomata. Light also speeds up transpiration by warming the leaf.
• Temperature – Plants transpire more rapidly at higher temperatures because water evaporates more rapidly as the temperature rises. At 30 degrees Centigrade, a leaf may transpire three times as fast as it does at 20 degrees C.
• Humidity – The rate of diffusion of any substance increases as the difference in concentration of the substances in the two regions increases. When the surrounding air is dry, diffusion of water out of the leaf occurs more rapidly.
• Wind – When there is no breeze, the air surrounding a leaf becomes increasingly humid, thus reducing the rate of transpiration. When a breeze is present, the humid air is carried away and is replaced by drier air.
• Soil water – A plant cannot continue to transpire rapidly if its water loss is not made up for by replacement from the soil. When absorption of water by the roots fails to keep up with the rate of transpiration, loss of turgor occurs, and the stomata close. This immediately reduces the rate of transpiration (as well as that of photosynthesis). If the loss of turgor extends to the rest of the leaf and stem, the plant wilts.
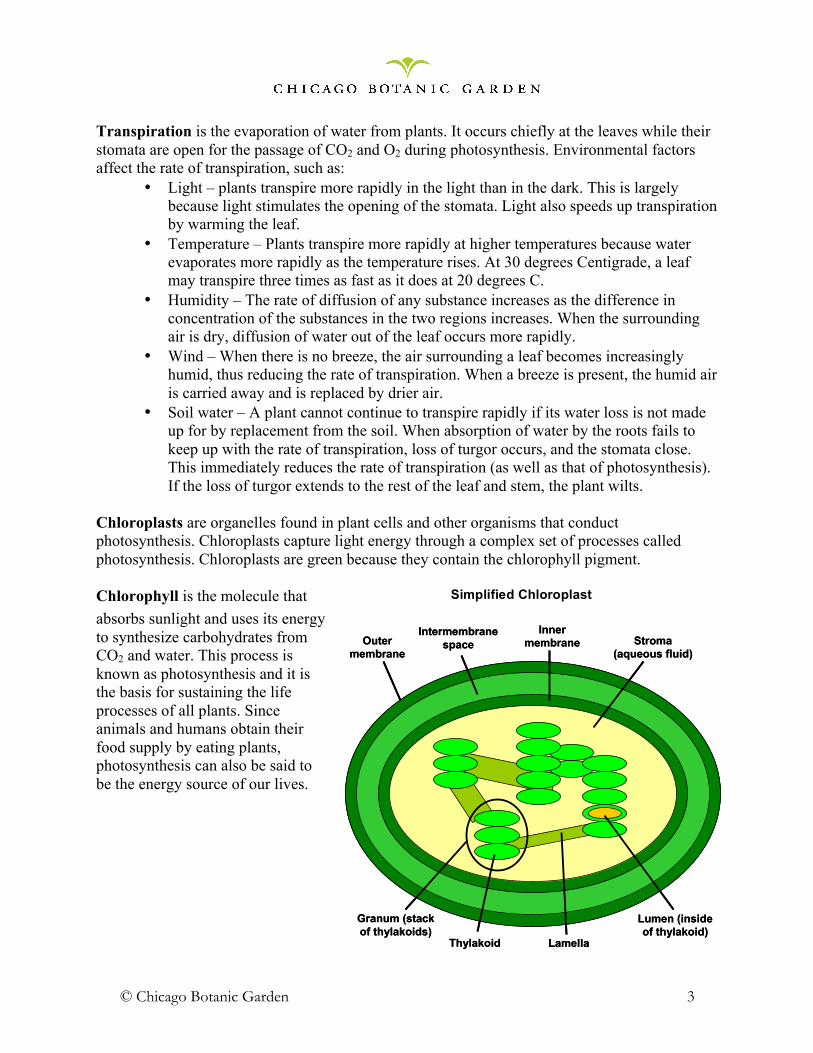
Chloroplasts are organelles found in plant cells and other organisms that conduct photosynthesis. Chloroplasts capture light energy through a complex set of processes called photosynthesis. Chloroplasts are green because they contain the chlorophyll pigment. Chlorophyll is the molecule that absorbs sunlight and uses its energy to synthesize carbohydrates from CO2 and water. This process is known as photosynthesis and it is the basis for sustaining the life processes of all plants. Since animals and humans obtain their food supply by eating plants, photosynthesis can also be said to be the energy source of our lives.
Simplified Chloroplast
Outer membrane
Intermembranespace
Inner membrane Stroma
(aqueous fluid)
Lumen (inside of thylakoid)
LamellaThylakoid
Granum (stack of thylakoids)
Outer membrane
Intermembranespace
Inner membrane Stroma
(aqueous fluid)
Lumen (inside of thylakoid)
LamellaThylakoid
Granum (stack of thylakoids)
© Chicago Botanic Garden 4
Part 1: Introduction to Photosynthesis Part 1: Introduction to Photosynthesis (Optional. If students have not yet covered photosynthesis.) Students will review the photosynthesis equation, observe stomata and chloroplasts in plant cells, and examine leaf pigments using chromatography Students make observations of stomata and compare the stomata from different plants. Students discuss their results and draw conclusions about why stomata are important for photosynthesis, how plants get the carbon they use to make sugar and how carbon dioxide gets from the air to inside of the plant. Time: One class period Pre-Activity Preparation • Apply nail polish to the underside of the
leaves you will use for the stomata lab.
Materials: Part 1 Leaf Pigment Station • Beakers (10) • Acetone (2) • Assorted leaves • Mortar & pestle, or other way to crush leaves
(4-5) • Strips of filter paper (one per student or per
group) • Tape Chloroplast Station • Microscopes (1 per group) • Chloroplast slides Stomata Station • Empty slides (15) • Clear tape • One desert and one tropical plant
(suggested: jade and pothos plants) • Microscopes • Yarn (to flag branches with nail polish) • Nail polish
Procedure 1. Begin the class with the question: What are some things we know about photosynthesis?
(Record on the board.) 2. Ask students, “Did you ever wonder how scientists figured out photosynthesis and put all the
pieces together?” We're going to get to know some of the key players in the process of photosynthesis by visiting some activity stations. At each station you will find a card with instructions to observe a demonstration or perform some experiment. When we've visited all the stations we'll put the pieces together.
3. Divide students into lab groups. Set Up Leaf Pigments (Part 1) 4. Have each group chose one type of leaf to test for pigments. Students should rip the leaf into
small pieces, and use the mortar and pestle to grind them into little pieces. Make sure the cells are broken to release the pigments.
5. Have the students make a prediction drawing before continuing. The students should add
crushed leaves to a beaker (~1 tablespoon). Pour 1 tablespoon of acetone into the beaker. Explain that we will return to observe the results later. Add description of placing the filter paper in the beaker.

© Chicago Botanic Garden 5
Stomata 6. Hand out the “Stomata Leaf Peel” instructions and explain how to do the stomata leaf peel
and view it under the microscope. The students will use a piece of tape to peel off the top layer of the leaf so that the “skin” of the plant is stuck to the tape. They will then place the tape onto a microscope slide and use the microscope to look at the leaf surface for stomata.
7. Students will compare the stomata from desert (jade) and rainforest (pothos) plants. Students
should count and record how many stomata they see on each leaf type, note the distance between stomata, and note if they are open or closed in their lab book or on their worksheet.
8. Have students share their results with the entire class. Discuss the results. Possible questions
might include: • Were there different amounts of stomata on each plant? Why might that be? • Why are stomata important for photosynthesis? • How does a plant get the carbon dioxide it uses to make sugars? • How does the carbon dioxide get from the air inside of the plant?
9. Explain that there are little pores on the surface of the plant called stomata. The stomata open
and close with water pressure – two guard cells filled with fluid will swell and create an opening between them for air (and water) to pass through. Two guard cells that have no fluid or water pressure will collapse and the opening will close allowing no or little air to pass.
Chloroplasts 10. Have students look at the slides for green chloroplasts. Students should sketch and label a
cell in their journal. Possible questions: • Where are the chloroplasts located in the cells? • Are they arranged the same way in every leaf? • What might explain the different arrangements? • What is the chloroplast’s role in photosynthesis?
Return to Leaf Pigments (Part 2) 11. Have students take the filter strip out of the beaker. Each student should sketch and label the
results in their journal, and label the pigments. Possible questions: • Which wavelengths of light are the pigments absorbing? (Hint: It absorbs the opposite
color from what you see.)
12. Explain that plant leaves are different colors because of pigments. These are the molecules that actually absorb the sunlight and get excited by the energy from the sunlight. They pass this energy on and on in a long (and very complicated!) process that results in the creation of a sugar molecule = photosynthesis.
Photo = Light Synthesis = to make or put together
There are two main chlorophyll molecules – chlorophyll a and chlorophyll b.
© Chicago Botanic Garden 6
Carotenoids are the pigments that cause yellow and orange colors in plants. You can tie this into the coloration of leaves, the layers of a forest, and why plants at the bottom layer of a forest often have colors other than green – reds, whites, etc. The sunlight is filtered by the trees and the other top layer plants. The wavelengths that get to the bottom are different from those at the top so they must have different pigments to absorb those other wavelengths and still photosynthesize.
Conclusion 13. Bring the students back together as a group. Review the processes of photosynthesis and
cellular respiration. Write the equation for each process on the board and ask students how the rate of each process could be measured (note: the rate of photosynthesis can be measured by carbon dioxide production, and the rate of respiration could be measured by oxygen production).
Carbon dioxide + water + sunlight sugar + oxygen + water (from air) (from soil)
6CO2 + 12H2O + light energy C6H12O6 + 6O2 + 6H2O
Possible questions: • What is on the left side of the equation? On the right side? • What is the plant doing if oxygen is being produced? • What is the plant doing if carbon dioxide is being produced? • What would you predict the conditions around the plant to be if it is
photosynthesizing? Respiring?
14. In closing, have students summarize the role of each part of the leaf in photosynthesis.
© Chicago Botanic Garden 7
Part 2: Photosynthesis and Cellular Respiration Description: Students explore the factors that may affect rates of photosynthesis and cellular respiration. Students will design experiments to test, describe, and explain the cyclical relationship between photosynthesis and cellular respiration. Students generate hypotheses on the relationship between photosynthesis and cellular respiration. They collect data using electronic collection probes to determine the amount of CO2 and O2 produced by different plants under different conditions. Students then analyze that data and draw conclusions about how plants affect the atmosphere. Time: Four class periods total (one class period to generate hypotheses and discuss/practice procedures, two class periods to collect data, one period to input data, analyze it, and draw conclusions). This schedule is flexible and may be modified based on the ability level of students (e.g. some in-class activities could be turned into homework assignments instead).
Materials: Part 2 • Electronic CO2 and O2
probes, and appropriate data-collection apparatus.
• Clear plastic bottles that are impervious to oxygen (PET plastic beer bottles should have oxygen scavengers; PVC barbeque sauce bottles are also a good option, as are clear pharmaceutical-grade bottles)
• Computers with internet access
Guiding Questions • What is the relationship between plants and greenhouse gases? • How do plants interact with the atmosphere? Teacher Notes Students should be familiar with the products and reactants of photosynthesis and cellular respiration as well as the anatomical features of plants that facilitate these processes (stomata, chloroplasts, mitochondria, etc.). They should also know how to write a hypothesis. Lastly, students should be familiar with how to record and process data using electronic probes (Pasco or Vernier). If electronic probes are not available, rates of photosynthesis can be measured by placing leaf discs in syringes filled with sodium bicarbonate solution. Syringes can be placed different distances from a light source and rates of photosynthesis will be measured as leaf discs begin to float due to oxygen production. Leaf discs could be made from different species of plants, different ages, different locations, etc. Photosynthesis and cell respiration in plants can also be measured qualitatively by dropping iodine onto a leaf and observing whether there is a positive (purple) color change to indicate the presence of starch. In order for students to have ownership of this experiment, it is recommended that students be allowed to test their own scenarios. However, some scenarios will produce better results than others. It is recommended that the teacher guide students to test the following scenarios: plant in full sun vs. plant in partial/full shade, leaf on top of plant vs. leaf on bottom of plant, small leaf vs. large leaf on same plant, small leaf vs. large leaf on different plants, and comparison between different species such as two different herbaceous plants, annuals and perennials, herbaceous and woody plants, shade-tolerant species and shade-intolerant species.

© Chicago Botanic Garden 8
Although many factors that are more difficult to test such as temperature and relative humidity will affect rates of photosynthesis and various unforeseen factors may influence rates as well, it can be reasonably predicted that the scenarios mentioned above will produce the following results: ! Full sun vs. partial/full shade – The plant in full sun will have a higher rate of
photosynthesis. (It should be noted that the increase in temperature in the microenvironment near the leaf could potentially decrease the rate of photosynthesis if stomata become closed.) Plants that are performing photosynthesis at a higher rate should also be consuming glucose at a higher rate as well. However, the amount of CO2 being produced may be difficult to measure if stomata are closed due to high temperatures.
! Leaf on top of plant vs. leaf on bottom of plant – The leaf on the top should have a higher
rate of photosynthesis because it receives more light. Therefore, the leaves on the top should be performing cellular respiration at a higher level as well. The teacher may wish to use this opportunity to discuss adaptations that plants have to maximize the amount of filtered light that is absorbed by leaves on the bottom of the organism. For example, young tree saplings usually have larger leaves than adults, and leaves at the bottom of a tree are often shaped to maximize surface area available for light absorption. In some cases, these leaves do not resemble the shape that is typical of that particular species.
! Small leaf vs. large leaf – The large leaf should have a higher rate of photosynthesis due to
its larger surface area that is available for light absorption. Large leaves may release more CO2 as well, but this could also be attributed to the large number of cells included in the sample.
! Comparison between different species – Results for these tests will vary depending on many
different factors. However, annuals should have higher rates of photosynthesis and cellular respiration than perennials because they devote so much energy to above-ground growth. Herbaceous plants should have higher rates than woody plants since the herbaceous plants that grow naturally near a school tend to be weeds. Shade-tolerant species (such as maple, ash, and elm) should have higher rates than shade-intolerant species (such as oak and hickory) if the two are growing in the shade. If the two are both growing in full sun, then it is possible that shade-intolerant would have higher rates or that they would be equal.
Pre-Activity Preparation • To purchase plastic bottles if necessary: http://www.bottles.us/index.asp
Larger bottles are recommended to fit a variety of leaf sizes. You may also use PET plastic beer bottles, PVC barbeque sauce bottles, or clear pharmaceutical-grade bottles.
• Identify an outside area that has a variety of plants and conditions (shade, sun etc.). School grounds or a local park should be fine.
• Review Student Handouts. A handout entitled “Are All Plants Created Equal? Investigating Rates of Photosynthesis and Cellular Respiration” will be distributed to each student to use

© Chicago Botanic Garden 9
during the experiment. Pages are written for use with Vernier Labquests and respective probes and may need to be modified if other probes/data-collection devices are used.
• During the activity, be certain to monitor the battery life on each Labquest carefully. If possible, units should be charged in between classes or students should be grouped in such a way that successive classes will be able to collect data on the same day.
Procedure DAY 1 1. Pass out the student handout “Are all Plants Created Equal? Investigating Rates of
Photosynthesis and Cellular Respiration.” Have students independently respond to the following question: “What factors may affect rates of photosynthesis and cellular respiration?”
• Students should answer questions in their journals, then pair up and share responses. • Then, lead the class in a whole-group discussion of their answers. You can use
student responses to guide the next question, or lead students to think about the factors that will be investigated.
2. Pose the next question: “How might photosynthesis rates be different in the following
situations: 1) plant in full sun vs. plant in partial shade 2) leaf on top of plant vs. leaf on bottom of plant 3) small leaf vs. large leaf 4) plants near the school vs. plants far away from school 5) tree vs. flower or grass?”
• Students should answer questions in their journals, then pair up and share responses. • Then, lead the class in a whole-group discussion of their answers. After the whole-
group discussion, students may need to revise their responses on the student handout.
3. Now that the class is familiar with how photosynthesis might be affected in the aforementioned scenarios, direct students to think about how cellular respiration in the same plant may be affected by those scenarios as well.
• Students should answer questions in their journals, then pair up and share responses. • Then, lead the class in a whole- group discussion of their answers. After the whole-
group discussion, students may need to revise their responses on the student handout. 4. Based on class discussion and their own opinions, students construct hypotheses for each
scenario that will be tested. • Scenarios to be tested will vary based on ability of students, time constraints, and the
environment outside of school.
5. Discuss how the experiment will be conducted the following day and demonstrate how to use lab equipment.
• Emphasize that only one variable should be tested at a time. When any test is conducted, the students should make every effort possible to ensure that all other factors between the two test plants are kept constant. Example: When testing a plant in full sun vs. a plant in partial sun, two herbaceous plants should be used that have roughly the same size leaves.
© Chicago Botanic Garden 10
• Students should practice using probes by testing class plants and/or their own breath
if time permits
6. Lead the class in a “Summary Go-Round” in which each student explains one of the factors that will be tested or part of the experiment procedure. For homework, students will decide what locations and organisms they wish to test and also generate a flow map (flow chart) that describes their unique experimental procedure.
DAY 2 1. Introduction: Collect student flow maps and review them while students meet with lab
partners and discuss plan of action. 2. Quickly review experimental procedures and then distribute lab materials to each group. 3. Students will collect data on school grounds according to the procedure described in the
student handout. • Data can be electronically recorded, but students should also write down data on their
handout. • Both photosynthesis and cellular respiration tests should be conducted sequentially at the
same site before moving to a new site. • Students should focus on collecting data for one comparison before moving to another.
(For example, take all data for full-sun leaf, then collect all data for partial-sun leaf.)
4. When students are done, collect and count all equipment. 5. Closure: Lead the class in a discussion of the experiment thus far. What went well? What
improvements can be made? Students should think about these questions overnight and be prepared to modify their procedure accordingly the next day.
DAY 3 1. Open the class by reviewing what went well yesterday and also address student suggestions
for improvement, then distribute materials to each group. 2. Students will collect data according to procedure outlined for Day 2 above. 3. Closure: Lead the class in a brief discussion of the overall experiment. What went well?
What problems were encountered? Were they surprised by any results? Students should be instructed to come to class the next day prepared to share data via Google Docs or some other Web 2.0 application. • Depending on ability level of students and the technology situation of the school, students
could be instructed to enter data into Google Docs for homework. If pressed for time, another option would be for students to upload data by a certain time and draw conclusions for homework.
© Chicago Botanic Garden 11
DAY 4 1. Introduction: Briefly review experiment with students and discuss preliminary findings and
engage students in a discussion regarding the purpose of taking baseline CO2 and O2 readings before starting their experiment. Some questions might be: • Why did I ask you to take baseline CO2 and O2 readings before starting your experiment?
o Responses will vary, but teacher should steer students to the correct answer. These data were taken to see what quantity of these gases was already present in the atmosphere.
• So, what does that say about the data that we recorded? o Responses will vary, but again teacher should steer students to the correct
answer. Some of the CO2 and/or O2 that we measured was most likely already in the atmosphere. We need to find out how much the plants produced.
• So, how are we going to do that? o Student: We should subtract the amount that was already in the atmosphere
from the amount that we recorded. Whatever is left over should be the amount that was made by the plant (note: these values will go in table “Adjusted Amount of CO2 and O2 Produced By Plants in Various Conditions” on the student handout).
2. Students will access their Google Docs account or other Web 2.0 application and upload their
individual data. They should then make the appropriate adjustments to their data as dictated by the class discussion regarding the baseline CO2 and O2 data. These adjustments should be recorded on their student handouts and also on their Google Docs or other Web 2.0 application data table. • While waiting for the entire class to upload data, individual groups could analyze their
own data and answer appropriate questions in their student handouts. • Once all data are uploaded, students should use data to draw conclusions and answer
questions found in student handouts.
3. Lead class in a discussion of data. The class will draw conclusions regarding the effects of each tested factor on photosynthesis and cellular respiration.
4. Closure: Have students complete an exit slip by answering the following statement: List three
factors that affect the rates of photosynthesis and cellular respiration and explain the effect of each factor. For homework, students will complete their “Are All Plants Created Equal? Investigating Rates of Cellular Respiration and Photosynthesis” handouts.
Assessment: Student understanding of learning goals and concepts will be assessed via exit slip, class discussions, and completion of student handouts.
Extensions: 1. Rates of cellular respiration could be measured using inert seeds and germinating seeds. 2. Another experiment that explores the relationship between photosynthesis and cellular
respiration involves placing various combinations of aquatic snails and Elodea into test tubes
© Chicago Botanic Garden 12
filled with water and bromthymol blue indicator. There are many variations of this experiment readily available online such as this one from NASA Quest (http://quest.nasa.gov/smore/teachers/act10.html), or this one from Flinn Scientific (http://www.flinnsci.com/documents/demopdfs/biology/bf0141.00.pdf).
3. Rates of alcoholic fermentation could be observed by combining yeast solutions and a variety
of common products such as sugar water, soft drinks, sports drinks, and energy drinks into test tubes and measuring the amount of CO2 that is produced.
4. Students could take GPS readings at each data point, enter data into a GIS program or
Google Maps, and determine if geographical features affect rates of photosynthesis and cellular respiration. Students could also record phenological data that could be entered into Project BudBurst for each plant that is studied. This experiment could also be conducted at a local forest preserve. Students could compare rates of respiration in understory trees and ground-level plants, edge plants vs. interior plants, forest plants and prairie plants, etc. If time permits, students could also collect a second set of data for each factor, either from different leaves on the same plant or from a different plant entirely.
! Sweeney, Diane and Williamson, Brad. Biology: Exploring Life Laboratory Manual,
Teacher’s Edition. “Photo Finish Lab” Needham, MA, 2003 ! Sweeney, Diane and Williamson, Brad. Biology: Exploring Life Laboratory Manual,
Teacher’s Edition. “Leaf Prints Lab” Needham, MA, 2003 ! Greenberg, Jon. BSCS Biology 8th Edition. “Investigation 5B - Rates of Respiration”
Chicago, IL, 2001
5. Another day could be used to discuss photosynthesis on a global level to enforce the “study locally, but think globally” theme of the project. The teacher could lead the class in a discussion of factors that affect photosynthesis worldwide such as CO2 concentration, ground cover, temperature, light intensity etc. Students could study graphs of CO2 data and predict the cause of seasonal fluctuations. They could also look at net primary productivity data and discuss its links to photosynthesis, light, temperature, precipitation, etc., by adding layers of data and looking for patterns.

© Chicago Botanic Garden 13
NAME ________________________ DATE _____________ PERIOD __________
ARE ALL PLANTS CREATED EQUAL? INVESTIGATING RATES OF PHOTOSYNTHESIS AND CELLULAR RESPIRATION
Photosynthesis is the most important chemical reaction for all life on Earth, followed closely by cellular respiration. If there were no photosynthetic bacteria to pump oxygen into the atmosphere billions of years ago, life as we know would most likely not exist. If relatives of those bacteria, along with algae, and plants did not pump oxygen into the atmosphere right now, animals would likely not be here. Nor would we all exist if your mitochondria were not able to break down the glucose that was so kindly made for you by a tasty autotroph. Although both of these chemical reactions are related and just about all life forms on Earth have to perform them, they do not always occur the same way in all organisms. There are a wide variety of factors that can influence the rates of both photosynthesis and cellular respiration. You will investigate some of these factors in this experiment by studying the variety of plant life that exists around our school. PRE-LAB 1. What factors may affect rates of photosynthesis and cellular respiration? Explain why you
think these factors affect photosynthesis and cellular respiration. 2. In the table below, list the factors that you want to test OR list the factors that your teacher
has provided. Predict how you think each factor will affect rates of photosynthesis and record your predictions below.
Factor How It Will Affect Photosynthesis How It Will Affect Cellular Respiration
© Chicago Botanic Garden 14
3. Now that you have discussed how you think each factor will affect photosynthesis, predict how each factor will affect cellular respiration. Record your predictions on the chart above.
4. Now it is time to turn your predictions into hypotheses. Be sure to write a hypothesis for each
factor that you will test, include both photosynthesis and cellular respiration, and use the proper hypothesis format as required by your teacher.
Factor Hypothesis
PROCEDURE 1. Once outside, turn ON your Labquest and insert the CO2 probe into one of the channels on the top of
the Labquest. Insert the O2 probe into a different channel. Your Labquest should display data for both gases simultaneously on its screen.
2. Wait 30 seconds for your probes to stabilize. The amount of CO2 and O2 displayed on your screen right now will act as a baseline reading. Record these values in the DATA section of this handout.
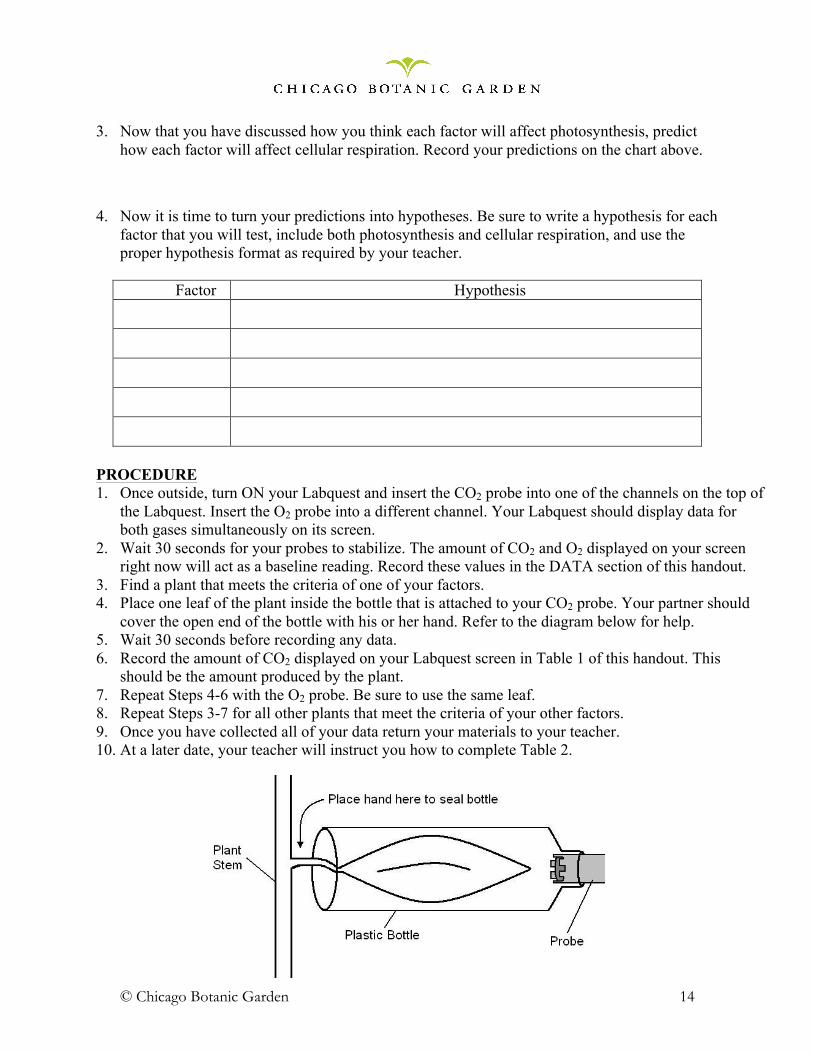
3. Find a plant that meets the criteria of one of your factors. 4. Place one leaf of the plant inside the bottle that is attached to your CO2 probe. Your partner should
cover the open end of the bottle with his or her hand. Refer to the diagram below for help. 5. Wait 30 seconds before recording any data. 6. Record the amount of CO2 displayed on your Labquest screen in Table 1 of this handout. This
should be the amount produced by the plant. 7. Repeat Steps 4-6 with the O2 probe. Be sure to use the same leaf. 8. Repeat Steps 3-7 for all other plants that meet the criteria of your other factors. 9. Once you have collected all of your data return your materials to your teacher. 10. At a later date, your teacher will instruct you how to complete Table 2.
© Chicago Botanic Garden 15
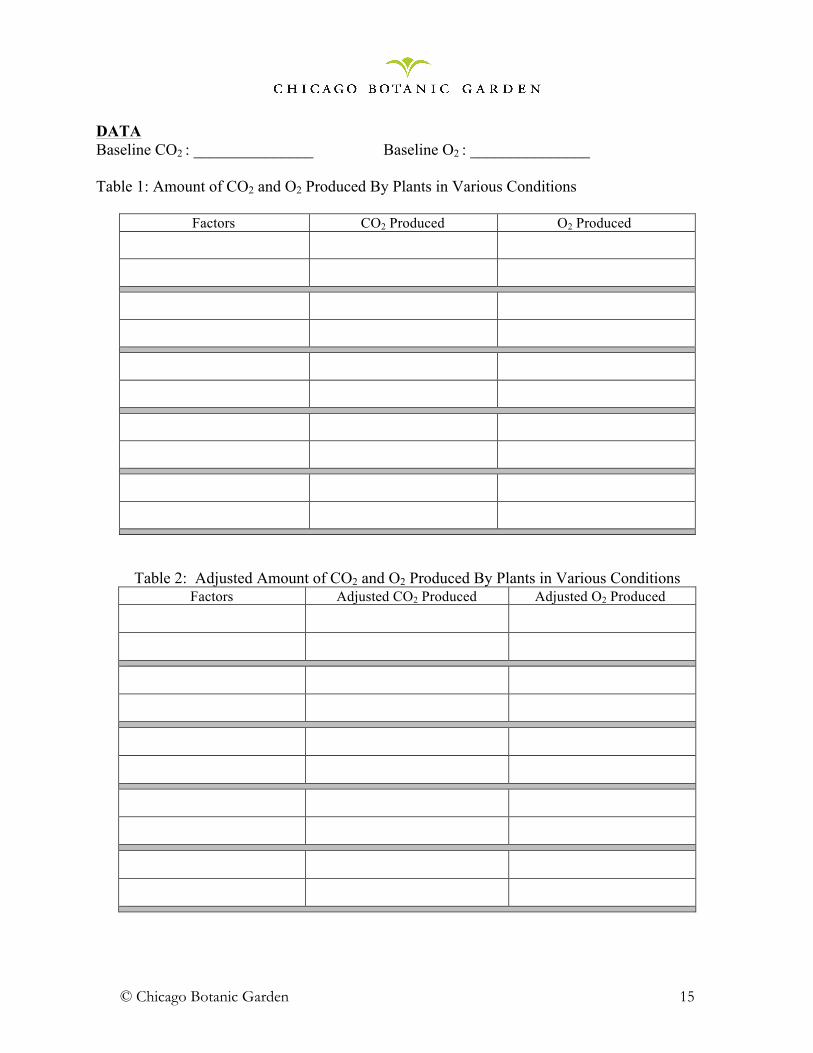
DATA Baseline CO2 : _______________ Baseline O2 : _______________ Table 1: Amount of CO2 and O2 Produced By Plants in Various Conditions
Factors CO2 Produced O2 Produced
Table 2: Adjusted Amount of CO2 and O2 Produced By Plants in Various Conditions Factors Adjusted CO2 Produced Adjusted O2 Produced

© Chicago Botanic Garden 16
ANALYSIS 1. Were any of your hypotheses supported by your findings? Please explain using actual data
from the experiment in your answer. 2. Choose any three of the factors that you tested and explain the results of this experiment
using scientific concepts that we have discussed so far in class. Be sure to explain all of the data for each factor and be sure to actually describe the connection between your data and the scientific concept.
3. What can you conclude about the effect of each factor tested on the rates of both
photosynthesis and cellular respiration? 4. Why did you use a bottle to cover each leaf that was tested? Why was the bottle clear? Why
was it important that the bottle was impermeable to gases?

© Chicago Botanic Garden 17
5. During any experiment, it is important to test only one variable at a time. How did you make sure to test only one variable at a time during this experiment? Give a specific example. How would your data and conclusion have been different if you did not do this? Please explain your answer.
6. Although you tried your best to only test one variable at a time, do you think you actually
DID control every variable between the two plants that you tested for each factor? What are two examples of variables that you could not have controlled? How do you think these variables affected your data? What could be done about this for future experiments?
7. Why did you have to take baseline CO2 and O2 data prior to beginning your experiment?
How would your data have been affected if you had not done this first? Please explain your answer.
8. Why did you have to wait 30 seconds before recording data from each leaf? How would your
data have been affected if you had not done this first? Please explain your answer.
© Chicago Botanic Garden 18
NAME __________Teacher answer key ____________ DATE _____________ PERIOD
ARE ALL PLANTS CREATED EQUAL? INVESTIGATING RATES OF PHOTOSYNTHESIS & CELLULAR RESPIRATION
Photosynthesis is the most important chemical reaction for all life on Earth, followed closely by cellular respiration. If there were no photosynthetic bacteria to pump oxygen into the atmosphere billions of years ago, life as we know would most likely not exist. If relatives of those bacteria, along with algae, and plants did not pump oxygen into the atmosphere right now, animals would likely not be here. Nor would we all exist if your mitochondria were not able to break down the glucose that was so kindly made for you by a tasty autotroph. Although both of these chemical reactions are related and just about all life forms on Earth have to perform them, they do not always occur the same way in all organisms. There are a wide variety of factors that can influence the rates of both photosynthesis and cellular respiration. You will investigate some of these factors in this experiment by studying the variety of plant life that exists around our school. PRE-LAB 1. What factors may affect rates of photosynthesis and cellular respiration? Explain why you
think these factors affect photosynthesis and cellular respiration.
Answers will vary 2. In the table below, list the factors that you want to test OR list the factors that your teacher
has provided. Predict how you think each factor will affect rates of photosynthesis and record your predictions below.
Factor How It Will Affect Photosynthesis How It Will Affect Cellular Respiration
3. Now that you have discussed how each factor will affect photosynthesis, predict how each
factor will affect cellular respiration. Record your predictions above.
Answers will vary

© Chicago Botanic Garden 19
NAME __________Teacher answer key ____________ DATE _____________ PERIOD Now it is time to turn your predictions into hypotheses. Be sure to write a hypothesis for each factor that you will test, include both photosynthesis and cellular respiration, and use the proper hypothesis format as required by your teacher.
Factor Hypothesis
Answers will vary
PROCEDURE 1. Once outside, turn ON your Labquest and insert the CO2 probe into one of the channels on
the top of the Labquest. Insert the O2 probe into a different channel. Your Labquest should display data for both gases simultaneously on its screen.
2. Wait 30 seconds for your probes to stabilize. The amount of CO2 and O2 displayed on your screen right now will act as a baseline reading. Record these values in the DATA section of this handout.
3. Find a plant that meets the criteria of one of your factors. 4. Place one leaf of the plant inside the bottle that is attached to your CO2 probe. Your partner
should cover the open end of the bottle with his or her hand. Refer to the diagram below for help.
5. Wait 30 seconds before recording any data. 6. Record the amount of CO2 displayed on your Labquest screen in Table 1 of this handout.
This should be the amount produced by the plant. 7. Repeat Steps 4-6 with the O2 probe. Be sure to use the same leaf. 8. Repeat Steps 3-7 for all other plants that meet the criteria of your other factors. 9. Once you have collected all of your data return your materials to your teacher. 10. At a later date, your teacher will instruct you how to complete Table 2.

© Chicago Botanic Garden 20
NAME __________Teacher answer key ____________ DATE _____________ PERIOD DATA Baseline CO2 : _______________ Baseline O2 : _______________ Table 1: Amount of CO2 and O2 Produced By Plants in Various Conditions
Factors CO2 Produced O2 Produced
Table 2: Adjusted Amount of CO2 and O2 Produced By Plants in Various Conditions
Factors Adjusted CO2 Produced Adjusted O2 Produced

© Chicago Botanic Garden 21
NAME __________Teacher answer key ____________ DATE _____________ PERIOD ANALYSIS 1. Were any of your hypotheses supported? Please explain using actual data from the
experiment in your answer. Answers will vary
2. Choose any three of the factors that you tested and explain the results of this experiment using scientific concepts that we have discussed so far in class. Be sure to explain all of the data for each factor and be sure to actually describe the connection between your data and the scientific concept.
Answers will vary
See lesson plan for possible explanations of observations. 3. What can you conclude about the effect of each factor tested on the rates of both
photosynthesis and cellular respiration?
Answers will vary See lesson plan for possible explanations of observations.
4. Why did you use a bottle to cover each leaf that was tested? Why was the bottle clear? Why was it important that the bottle was impermeable to gases?
It was important to cover each leaf with a bottle to ensure that only the gases being produced by the leaf were recorded. If we did not use a bottle it would be difficult to measure the gases produced by the leaf because gases from the surrounding atmosphere would have constantly flowed across the probe and replaced those being produced by the leaf. We most likely would have recorded a value similar to our baseline data. The bottle had to be clear in order for sunlight to reach the plant so that it could still perform photosynthesis and produce oxygen for the photosynthesis portion of the experiment. It was important that the bottle was impermeable to gases for two reasons. The first reason was so the gases in the atmosphere did not penetrate and lead to inaccurate data and the second was so the gases produced by the leaf would not leave the bottle but would rather accumulate and produce a reading on the probe.
5. During any experiment, it is important to test only one variable at a time. How did you make
sure to test only one variable at a time during this experiment? Give a specific example. How would your data and conclusion have been different if you did not do this? Please explain your answer.
Answers will vary. One possible example is:
One way in which we made sure to test only one variable at a time was when we tested the effect of the amount of light on photosynthesis rates. We tested one plant in full sun and then
© Chicago Botanic Garden 22
NAME __________Teacher answer key ____________ DATE _____________ PERIOD another plant in the shade. We made sure to test two plants that were the same species and about the same height, which we think means they are the same age. Both plants were goldenrod and were about 3 feet tall. The plant in the sun was slightly taller, but that could also have been due to the fact that it grew in the sun for the whole summer. If we did not test the same species of plant we may have reached the wrong conclusion regarding the effect of light on photosynthesis rates. For example, if we tested a tree in the sun and then tested goldenrod that was growing in the shade, we may have found that plants perform photosynthesis at a faster rate in the shade because the goldenrod may have produced more oxygen. We would have reached the wrong conclusion because we would have attributed the difference in oxygen production to light levels rather than the differences between trees and flowers. For the most part, trees grow more slowly than flowers, so it is possible that the tree showed a slower rate of photosynthesis simply due to its lifestyle rather than as a response to light levels.
6. Although you tried your best to only test one variable at a time, do you think you actually
DID control every variable between the two plants that you tested for each factor? What are two examples of variables that you could not have controlled? How do you think these variables affected your data? What could be done about this for future experiments?
Answers will vary. One possible example is provided below.
No, we did not actually control every variable between the two plants that we tested because this is simply not possible, especially when comparing two plants in the natural world outside of our school. Two examples of variables that we could not control that may have affected our data are the age of the plants and the leaf size of different plant species. When we tested the effect of light levels on photosynthesis, we tried to use the same species of plant, but we could not find two plants that were exactly the same height. So, it is possible that the shorter of the two plants was actually younger and therefore may have performed photosynthesis faster than the older plant. The shorter plant was growing in the sun, so although one would think that being in full sun would increase rates of photosynthesis, part of the increase may be attributed to the young age of the plant. We also tried to test the difference in photosynthesis rates between a flower and a tree. We found that the tree had a greater rate of photosynthesis, but this could have been because the size of the tree’s leaf was much larger than that of the flower. We could not find a tree and a flower with the same size leaves. In order to fix this for future experiments, we could conduct more trials with many different types of plants as long as the two factors were the same. Although this could potentially introduce more uncontrolled variables to the experiment, it would be useful to see if the same results are observed in each trial. If so, then we could draw a reasonably accurate conclusion. We could also grow plants under controlled conditions leading up to the experiment and then introduce them to experimental conditions only before we are to test them. This could eliminate many uncontrollable variables.

© Chicago Botanic Garden 23
NAME __________Teacher answer key ____________ DATE _____________ PERIOD 7. Why did you have to take baseline CO2 and O2 data prior to beginning your experiment?
How would your data have been affected if you had not done this first? Please explain your answer.
We took baseline data prior to beginning the experiment because we had to know the concentrations of oxygen and carbon dioxide in the atmosphere under normal conditions so that we could compare this to the concentrations when we conducted our experiments. If we had not done this, then we would have assumed that all of the gases we measured in our experiment were produced by the plants, when in fact some were already present in the atmosphere. This would have caused us to make incorrect conclusions. For example, we would have thought that plants living in the shade have higher rates of photosynthesis and cellular respiration than they really do because the amount of gases measured would have been quite large.
8. Why did you have to wait 30 seconds before recording data from each leaf? How would your
data have been affected if you had not done this first? Please explain your answer.
We had to wait 30 seconds before recording data from each leaf because we needed to let the probes stabilize and we also needed to wait for the gas exchange between the plant and the atmosphere to “catch up” to us. If we recorded data immediately after placing the leaf inside the bottle, there may not have been enough of a difference in gas concentrations for the probe to detect. By waiting 30 seconds, we allowed the plant enough time to perform photosynthesis and cellular respiration and release enough gases for the probe to detect a measurable difference. If we did not do this, then our experimental data would most likely not have been all that much different from the baseline data that we recorded at the beginning of our experiment and we would not have been able to draw any conclusions about the effect of various conditions on the rates of photosynthesis and cellular respiration.