Embed Size (px)
Citation preview
0
PRELIMINARY.
ACTIVIST INVESTORS AND PERFORMANCE IN VENTURE CAPITAL AND
PRIVATE EQUITY FUNDS
ADAIR MORSE1
University of Chicago, Booth School of Business
February, 2012
Abstract
Anecdotes suggest that large, activist investors (in particular, large pension funds and sovereign wealth funds) influence the decisions of managers of venture capital and buyout funds (collectively, PE funds). Using a dataset of Sovereign Wealth Fund (SWF) investments, I identify deal and exit linkages between activist investors and the portfolio companies of PE funds in which the SWF passively invest via PE funds. Deal and exit linkages occur in 3.4 and 2.2 percent of portfolio companies, respectively, and two-thirds of PE funds have at least one of these types of linkages. PE funds with deal linkages perform 2.3 percentage points worse in IRR, and those with exit linkages perform 5.8 percentage points better. These results are robust across return selection tests and using varying benchmarks and placebo tests. I discuss the magnitude of the results and offer portfolio company exit distribution tests to understand the mechanism. Activist SWF investors seem to offer floors in bailing-out poorly-performing companies in their home regions. In other regions, activism results in lower returns to other investors investing alongside a SWF in PE funds.
1 I thank Daniel Bergstresser, Alexander Dyck, Steve Kaplan and Richard Townsend for helpful comments, as well as seminar participants at the Econometric Society Winter Meetings, Emory, Chicago Booth, the NBER Entrepreneurship Summer Meetings, and Yale. I also thank Robert Reavis, Jennifer Kwok, Cristina Simpetru, Ana Paula Testolini, and Tony Zhang for excellent research assistance. Financial support was generously provided by Center for Research in Securities Prices, the Initiative on Global Markets, the Polsky Center of Private Equity, and the James S. Kemper Family Foundation.
1
I. Introduction
The limited partner (LP) structure that dominates the venture capital and private equity
fund markets (collectively, PE funds) provides long-horizon investors (the “LPs”) with
opportunities to invest passively in the private equity asset class. LPs are “limited” not just in a
liability sense, but also in a sense of being deemed passive investment for tax purposes. In
theory, LPs provide passive capital to PE fund managers, who in turn are very active in
screening, investing in, and engaging with portfolio companies, realizing returns on these
relatively illiquid investments in a ten-year (contracted) horizon.
The premise of this study is that sometimes “passive” LPs have a say in the sourcing of
deals, adding value, and exiting decisions made by PE fund managers. To simplify matters, one
can think of LPs having a say in one of two dimensions, influence in PE fund decisions
concerning entrepreneur or portfolio company selection or operations (“deal influence”) or
influence concerning the exiting of the portfolio company position (“exit influence”). The
question that this paper asks is whether these situations of influence carry PE fund performance
implications.
As a motivating perspective on the question, imagine being the investment officer of a
city pension. You choose to invest as a LP in PE fund alongside a large, LP investor. This LP is
activist in making direct private company investments and participating in public company
governance and strategy. As the city asset manager, do you think twice about the activism of the
other LP? Should you be worried that the activist LP might influence the PE fund to its own
advantage, and that the PE fund allows this equilibrium because of the LP’s deep pockets?
The timing of the research is not coincidental. Until the 2000s, PE fund investment was
largely a U.S. phenomenon. PE dealmaking has since globalized with PE funds adapting to new
2
contract environments (Lerner and Schoar, 2005; Kaplan, Martel and Stromberg, 2006). One
possible implication to this globalization is that the opening of new environments for investment
creates value to information aggregation if markets are informationally less efficient.
Another facet of the timing of the research comes from the changing nature of long-
horizon LPs. Motivating this study are anecdotes of activism by two investor classes, sovereign
wealth funds and large pension funds (perhaps somewhat ironically since the passive structure
emerged to accommodate pensions (Gompers and Lerner, 1996)). As in-house expertise to
evaluate and pick the best private equity and hedge funds has increased, these large, long-horizon
investors find themselves wondering why they need to lose rents to middlemen. Dyck and
Pomorski (2011) document evidence of the 3X rule in pension management: external
management costs three times the price of internally managing funds. For a depiction of pension
activism, Cooke (2003) details the activities of the Canadian Public Pension Investment Board,
which internally manages its portfolio across numerous asset classes. As an example of influence
activism by a pension fund, consider the case of Steven Rattner. In order to get the contract to
manage the assets of the New York State pension fund, Rattner’s private equity firm Quadrangle
arranged for one of its entrepreneur portfolio companies to distribute a film produced by the
brother of the New York State pension fund’s chief investment officer (New York Times,
January 3, 2011). “Chooch”, the film, took in a total of $30,792 in revenues.
The timing is also related to the emergence of sovereign wealth funds (SWF) as a new
class of investors. Because SWF capital grows with oil or export revenues (as opposed to
financial returns), cash for investment can amass quickly and grow even when the world stock
markets are in decline, which makes it a very attractive investor class for private equity funds,
along the lines of Lerner and Schoar (2004). Furthermore, like large pension funds, Dyck and
3
Morse (2010) document that sovereign wealth funds are activist in particular industries, often
holding controlling stake in direct investments.
If the goal of the paper is to ask whether conflicts of interest and favoritism in delegated
asset management implies losses to other investors, then a natural first question is how it can
persist. Large investors may provide valuable reputation or efficiency benefits to PE funds, and
then the question becomes whether PE funds keep internalize these benefits (Berk and Green,
2004) or offset them against their own rents as in traditional coinvestment opportunities in PE
fund unvesting. Conversely, however what looks like conflicts of interest may actually be an
alignment of incentives if large, activist investors are proprietors of information. I discuss these
ideas in the next setion.
The paper begins by documenting the activism of LPs in terms of linkages between large
investors and PE fund portfolio companies (both buyout and venture). I focus solely on SWFs as
the large investor because of data availability. I use the dataset of SWF holdings of Dyck and
Morse (2010), which has the individual company holdings, for publicly-traded and privately-held
firms, as well as PE fund investments for the twenty largest SWFs. I look up the portfolio
companies for each of the PE funds in which the SWF invests as an LP and then use manual
search procedures to capture linkages between the SWF (or the SWF’s direct private
investments) and the portfolio companies in which the SWF invests passively through a PE
fund.2
I find a deal linkage between a LP SWF and a portfolio company in 54 percent of PE
funds and 3.6 percent of portfolio companies. Likewise, I find an exit linkage in 30 percent of PE
funds and 2.2 percent of portfolio companies.
2 The search procedure has two pieces – (i) doing manual Google and Factiva searches between each portfolio company of the PE funds and the SWF itself and (ii) doing Lexis-Nexis scraping searches between each of the portfolio companies of the PE funds and each of the SWF direct equity holdings (public and private).

4
What are the effects of activism on PE fund performance? PE funds with a company deal
linkage perform 2.3 percent worse in excess IRR (excess over a benchmark). PE funds with an
exit linkage to a SWF, however, perform 2.3 percent better in excess IRR, which is a story
consistent with results in Chen, Gompers, Kovner and Lerner (2010). Evidence suggests that
SWFs directly or indirectly set favorable “floors” to portfolio company performance in wanting
to keep firms in business.
I show robustness of these results to a battery of tests dealing with sample selection and
the observability selection of PE funds with returns. The results are robust to benchmarking
against returns of CalPERS, a similarly large, long-horizon, state investor as the SWFs and
pensions. Placebo results using “chance” linkages between the Alaska Permanent Fund (a
passive investor) and portfolio companies have no return impact.
The rest of the paper proceeds as follows. Section I presents the data, consisting of three
parts, the sovereign wealth fund sample, the influence measures and the outcome measures.
Section II discusses some theoretic underpinnings as to how activism can persist if it represents a
conflict of interest in delegated capital management. Section III describes the different samples
and data sets and presents statistics of performance and activism linkages. Section IV reports the
paper results, showing the relation of linkages to PE fund performance as well as portfolio
company performance. Section V comments on the results, offering a discussion of the
magnitude as it relates to the direct effect of activism versus other interpretations. Also in section
V, I discuss observability robustness tests. Finally, section VI concludes.
5
II. Theoretical Arguments
Presumably, when a SWF or pension fund influences a PE decision, it does so to
maximize its own returns or objectives. These objectives may or may not represent a conflict of
interest with the other LP investors, but I begin under the presumption that it does. The actions I
have in mind are, for example, SWFs encouraging VC investment in startups when the SWF’s
other direct holding stand to benefit from the entrepreneurial activity, when the SWF cares about
the development of a sector in a local economy, or when the entrepreneur is a friend with SWF
managers. Because PE fund managers act in a repeated game with LP investors, it is worth
thinking about how a PE fund manager could maintain reputation if allowing a large influence to
exert such influence.
Favoritism in delegated management may persist because the large investors increase the
efficiency of PE fund managers’ time. Having large LP investment shortens the time needed for
fund raising, thereby freeing up PE manager time for value adding to portfolio companies.
Likewise, by ensuring the fund fills or fills quickly, the SWF may increase the reputational
capital of the PE firm that in turn spills over to benefit the portfolio company. Under any of these
scenarios, the small LP should be willing to allow the SWF to have a larger slice of the profits
pie.
Another possibility stems from behavioral extensions to the Grossman/Hart/Moore
property rights literature. What if small LPs invest with a reference point entitlement to returns,
rather than an absolute one? We know that PE funds (in particular VC funds) exhibit
performance persistence (Kaplan and Schoar, 2005). Hochberg, Ljungqvist, and Vissing-
Jorgensen (2010) offer a theoretical explanation based on information asymmetry and getting
access to the best funds. The small pension manager who wants to invest in this asset class may
6
just be content with access to a PE fund that reaches some reference point return in the spirit of
Hart (2008) or a reference return indexed to some benchmark as in Hart (2009). The small LP
may consider the fact that the large LP investors may extract more private benefits to be just a
part of the cost to getting into a PE fund.
It is worth noting that it is not a new application that there is favoritism in delegated
management. PE funds have always provided their large LPs with a little extra icing on the cake,
usually in the form of coinvestment opportunities (investing directly in portfolio companies
alongside the PE fund without fees) or amended contract terms. The baseline justification is just
economies of scale in fundraising. But, what differs here is the implication of who sacrifices.
When a large LP gets a better contract with the PE firm or gets coinvestment opportunities, the
main implication is foregone intermediation fees to the PE firm. The returns impact to the other
LPs will be minimal, if any. Conversely, in my story of activism, the transfer of rents is from the
small LPs to the large, activist LP, not from the PE firm to the activist LP. Berk and Green
(2004) (for mutual funds) suggest that the higher ability intermediaries will increase their own
returns to the point that investor returns become eroded to the competitive position. Allowing
activism may be a mechanism to achieve this goal. Thus, PE funds surely have a limit as to how
much preference they are willing to allocate to these large, activist LPs, related to the size, speed,
or reputation value of having these large pools of capital participate in the PE fund.3
Activist LP influence in PE funds does not necessarily represent a conflict of interest.
Activist LPs have access to private information and private networks that may generate superior
performance for portfolio companies. It is not hard to imagine how a large SWF or pension fund
3 Would it be possible for PE funds to punish large investors for activism that destroys value? This is not likely. SWFs play in a repeated game with PE fund managers, but PE mangers cannot credibly commit to not accept SWF money in the future if the SWF provides bad leads, just as providers of capital cannot credibly commit to not buy sovereign bonds after country default in the influential work of Bulow and Rogoff (1989). Thus, the reputation does not mitigate SWF’s incentives to look after their own objective.
7
could enhance performance. The SWF might have access to proprietary deal flow, might use its
networks to create revenue opportunities for new ventures, mitigate finance or regulation
frictions for portfolio companies, or might facilitate strategic sales. Lastly, SWFs may serve as a
secondary buyer for failed investments to the extent that the SWF has a vested interest in the
outcome of the portfolio company. Under these stories, all LPs in the PE fund should benefit
from the presence of an activist LP.
But the equilibrium question here is why the activist LP does not keep all the rents?
Three possibilities seem reasonable. For a SWF to keep the rents of its private information, it
would have to be the sole equity financier. SWFs may use PE funds to dissipate idiosyncratic
risk or to lever up the position. SWFs may also want to take advantage of the value added input
and monitoring of the portfolio company provided by PE fund managers. Finally, SWFs may use
PE funds to itself build networks for other activities.
III. Data & Statistics
III.a. SWFs, PE Funds and Portfolio Companies Data
The sample of Sovereign Wealth Funds (SWFs) is that of Dyck and Morse (2010);
namely, state-owned investment vehicles with over US$10 billion in assets as of 2007 which
invest in risky assets and have no short or medium term pension obligations. Dyck and Morse
collect the individual company holdings (public equity and private equity) of each of these
SWFs, combining to $1.2 trillion in holdings. The existence of these data are essential for what I
am doing, as I exploit operational and ownership links between these companies held directly by
the SWF and portfolio companies held indirectly by the SWF via the PE funds.
8
For each SWF, I identify investments in PE funds and then the portfolio companies of the
PE funds. To do so, I start with five databases: Galante’s Directory of Alternative Investments,
Capital IQ, Thomson One Banker, Preqin, and Zawya Dow Jones. I supplement the PE fund
investment data with information on SWF websites and the SWF Institute website and by
searching Google and regional news sources looking for LP investments.4
Of an initial list of the twenty SWFs, thirteen have LP investments in private equity
funds. Combined, these thirteen SWF invest in 241 PE funds. I exclude 6 fund of funds such
that my final sample is 234 PE funds. Table 1 shows the distribution of 234 PE funds by SWF,
which are geographically located either in the Middle East (e.g., Kuwait Investment Authority,
Abu Dhabi Investment Authority) or in Asia (e.g., Government of Singapore Investment
Corporation, Malaysia Khazanah Fund). The only SWF not in the Middle East or Asia is the
Alaska Permanent Fund (“Alaska”).
Likewise, I
supplement the portfolio company data available in the databases by searching for additional
portfolio companies on the PE firm site and in regional news sources and Google.
Alaska is a special case, in that it outsources its asset management to specializing asset
managers and is known to be passive (Institutional Investor, August 30, 2010). Alaska holds a
portfolio with both LP private equity fund investments and a very diversified portfolio of public
equities. 5
4 In most instances, the data included details on the specific fund in which the SWF invested as an LP; however, in a few cases only the fund family was given. For these, I attribute the investment to a particular fund within the family based on investment dates.
Because Alaska holds stock in so many companies, it is very likely that Alaska has
linkages between its direct holdings and the portfolio companies in which it invests indirectly.
5 Alaska is a SWF of nearly $30 billion, funded by the flow of oil in the State. As of 2008, Alaska held a diversified portfolio of 3,836 public equities in addition to 66 open LP investments in private equity funds. Over all years in the sample back to 1995, Alaska invested in 6,502 public equities and 71 funds.
9
But, there is no reason to expect these chance linkages to result in a differential performance for
the PE fund. Thus, I treat Alaska as a placebo investor.
My main sample of SWFs without Alaska consists of 163 PE funds and 2,274 underlying
portfolio companies. Table 1 also shows the percentage of these funds which are venture capital
as opposed to buyout, the average and median PE fund size6
I later introduce and motivate two additional samples which are included as the bottom
rows of Table 1. I use the CalPERS portfolio of PE funds as a robustness benchmark for returns,
and the randomly-selected set of PE funds as an exit distribution benchmark.
, and the range of vintage years.
These statistics vary quite a bit by SWF, and therefore my benchmarking of performance to the
vintage - venture/buyout - geography level will be important.
In Table 2, I report industry and geography characteristics of the portfolio company
investments. Table 2 aggregates the information to three samples, the SWFs (from now on
excluding Alaska), Alaska, and the random sample. The industry distribution does not differ
widely by sample. The geographic distribution, however, shows that portfolio companies’
locations reflect a home bias of the SWFs. Overall, the SWFs invest 15.8% in Asia (the Asian
SWFs invest 16.7% in Asia) and 7.3% in the Middle East (the Middle Eastern SWFs invest
11.8% in the Middle East). One would expect that if investors are activist, they should invest
with a home bias. Hochberg and Rauh (2011) show this pattern for pension funds. What is
perhaps a bit surprising is that the investments are not more home biased. I later return to the
home bias to see whether any linkages and performance results are solely in the home region. (I
am going to find that the exit results are very home-centric but that the deal linkage activism
results are general across regions.)
6 I am missing fund size for 23 of the 234 PE funds. After Table 1, I replace missing fund sizes with the vintage-venture/buyout average.
10
III.b. PE Fund Performance Data
The best measure of performance for a PE fund is the fund internal rate of return (IRR). I
collect PE fund IRRs from Preqin. Although IRRs are the natural starting point, they suffer from
a reporting selection bias (better performing funds report on average).7
Also from Preqin, I collect the multiple-of-invested-capital. This performance metric has
no time value of money concept, but is used widely by private equity funds raising capital. It is
calculated as simply the money the PE fund gets out of portfolio company exits divided by the
money the fund put into the companies. The metric is inferior to the IRR, but I use it because the
fill of PE fund multiples of invested capital is slightly better than that of the IRRs.
Of the 163 SWF PE
funds and 71 Alaska PE funds, Preqin only has performance for 66 and 52 of them respectively.
This selection bias should be less of a problem for my analysis in that I compare PE fund
performance within the set of funds reporting, but nevertheless, I augment my analysis to include
other metrics.
For both of these measures, I construct an excess performance measure (excess IRR and
excess multiple), where excess is defined as performance above a PE fund benchmark. I
construct the benchmark from Preqin data of the median return of all PE funds in Preqin by
vintage year (the year the PE fundraising closed), venture-versus-buyout, and geography. To
ensure that I have sufficient funds to calculate benchmark performance, I construct geography at
the level of North America, Europe, and the rest of the world. Since it takes some time for PE
funds to invest and harvest these illiquid investments, and return calculations early in a fund life
7 For example, Kaplan and Schoar (2005), Sorenson (2010), Kaplan, et al. (2011), INCOMPLETE LIST
11
are not considered trustworthy,8
One might argue that the benchmark of all PE funds includes PE funds not appropriate
for the portfolio of activist investors like SWFs or large (often state) pension funds. In particular,
very large investors will say that they do not have time to evaluate every possible small
investment and thus scale and clarity of strategy may matter. For robustness, I compare the
performance benchmarked to CalPERS investments in PE funds. CalPERS reports returns on
these investments (and not surprisingly, returns thus usually appear in Preqin as well).
Benchmarking against CalPERS should bias estimates toward zero, as evidence suggests that
CalPERS is itself activist.
my primary returns analysis limits the sample to PE funds with
vintages of at least five years old.
9
To get away from any biases of using Preqin data, I also construct proxy measures of PE
fund-level performance, building from prior literature. (See, for example, Kaplan and Schoar
(2005); Lerner, Schoar and Wongsunwai (2007); and Hochberg, Ljungqvist and Vissing-
Jorgensen (2010).) These measures are whether or not a follow-on fund is raised (follow-on), the
lapse in years between funds (years lapse of follow-on), and the oversubscription percentage of
the follow-on fund (oversubscription follow-on).
To construct these measures, I do manual searches in Capital IQ, Thomson and Galante
for follow-on fund in the same series as the PE fund in the sample. The word “series” is
important, meaning that a PE fund named MY_FUND II might be followed by MY_FUND III.
However, MY_FUND III could not be the follow-on fund to MY_FUND Asia II. I cutoff this
analysis as of 2008, because the average length of time between funds is two to three years.
8 Add literature on J-curve. 9 Footnote anecdotes that I have. I manually look up each CalPERS fund to determine if it is a private equity (equity) fund, dropping the hedge funds and private equity distressed debt funds.
12
Table 3 reports performance statistics by the samples (SWF, Alaska, and CalPERS).
Univariate comparisons across the samples will not be terribly informative here, since the
vintage and venture/buyout choice of the investment varies quite a bit by investor sample.
Nevertheless, it is worth noting that CalPERS has performed better than Alaska, which has
performed better than the SWFs.
III.c. Exit Data for Portfolio Companies
In addition to performance at the PE fund level, I analyze performance at the portfolio
company level, which is appealing if I claim to be establishing a causal relation between investor
activism and performance. I need to be able to show some evidence that the mechanism is as I
claim. It is possible that PE funds that allow activism to happen are, for example, those most
distracted by maximizing the size of their firm, and my linkages are just be an artifact. This
would be in itself interesting. It may in fact be likely that what I find is some combination of the
stories. Thus, it matters to my design whether any performance differentials trace back to the
portfolio companies where the activism happens.
Tracking portfolio company returns is not feasible in a meaningful way, since portfolio
companies rarely reveal the capital invested and the returns to that capital. I instead use a
performance metric which I can construct. I look up the exit type of each portfolio company in
my sample under the view that, in general, portfolio companies that IPO performed better than
those that sold to a company, which is better than having a secondary buyout, which is better
than going out of business.
I start categorizing exits by looking up the portfolio companies individually in Thomson
One Banker and Capital IQ. If the company is publicly traded, I know that the company exited
13
via an IPO. I check to make sure that the date of the IPO corresponds to when the company
would have been in the PE fund lifespan. If the portfolio company exited via a sale or a
secondary buyout to management or another private equity group, it usually the case that one of
the databases records this transaction. Thomson and Capital IQ also sometimes record if the
company is defunct; however here the data are less consistent. If I find no information in the
database, but the company is listed in the database, my first clue to the company being out of
business is if the url for the company is no longer operative. Finally, I do exhaustive Google and
Factiva searches for exit or out of business information. When I fail to find information, I code
the portfolio company as still being in the portfolio. I do not evaluate these as exits.
In order to benchmark these exits, I need a benchmark distribution. To my knowledge,
exit distribution data are not readily available except for some survey evidence that may have
compliance selection. I need exits data that are comparable to mine and for which I know the
vintage and type of PE to control for other factors influencing exit. Thus, I create a random
portfolio of PE funds.
I randomly select 70 PE funds (to match the size of Alaska’s original list) that match my
distribution of SWFs in vintage and type (venture or not). I discard these funds which are debt
funds, fund of funds or funds that have no portfolio companies, leaving me with 48 PE funds.
The statistics appear in Table 1. My random sample picks funds that are on average smaller than
the funds in which these large investing vehicles invest. I then lookup the exits for each portfolio
company for my random sample.
Table 4 tabulates these exits. Columns 3, 6, and 9 are the most relevant since I ignore the
companies still in the portfolio. However, it is worth checking how often I find a resolution of
portfolio companies (1 minus the percent of the portfolio companies which are still in the
14
portfolio) to speak to observability. For the SWFs, I observe a resolution of 55% of the portfolio
companies with vintage over five years. For Alaska, that percentage is much smaller. I find exit
resolution for 51 percent of the portfolio companies. This is about the same order of magnitude
as that for the SWFs. Because I might be concerned that the missing exit resolutions could be
systematically different across portfolios or systematic to some type of performance across
samples, I provide the distribution of the investment year into these portfolio companies at the
bottom of Table 4. This distribution is at least reassuring that most of these companies could be
indeed in the PE fund portfolio.
Turning to the more interesting aspect of the table, columns 3 reports that of those that
did exit in the SWF sample, 59% of the companies exited via a strategic sale, 18.5% closed shop,
15.1% IPOed, and 7.4% were resolved via a secondary buyout to another PE firm. The placebo
Alaska, has a much more equal distribution across exits. The random sample benchmark saw
55.6% sell, 21.8% close shop, 12.8% be bought out, and only 9.8% IPO. Herein again, however,
the vintage and venture/buyout type of these funds will matter in a multivariate setting.
III.d. Linkages Defined and Data
I measure activism by the existence of linkages between SWFs and PE fund portfolio
companies. I divide these linkages into two dimensions, what I loosely term “deal linkages” and
“exit linkages”.10
I use the word “deal” broadly to mean overlap of SWFs and portfolio companies in either
the selection or the operations of companies. Because the coding of these linkages could be
10 Another portfolio company decision to consider is that SWF might force an industry or geography tilt in portfolio company selection. One could imagine a situation in which a SWF wanted to gain exposure to a market and used a PE fund and its operational expertise to generate spillovers to its overall active strategy or to its passive diversification of investments. We consider this an outcome measure (in a subsequent draft).
15
argued to be subjective, I want to be explicit for the relationships for which I look. Figure 1
panels A and B depict some of these relationships.
First, the SWF or its managers may have a previous people or investment link with a
portfolio company. The portfolio company may be a venture of a former employee of the SWF,
board members of the portfolio company may be related to the SWF through past executive
positions one of the SWF companies, or the SWF or one of its holdings may have an ownership
stake in the portfolio company. Figure 1, panel A depicts the people linkages of this type. These
deal linkages all concern potential SWF activism in the selection of portfolio companies. An
important feature of these selection linkages is that I only code them as being a linkage if the
relationship between the SWF and portfolio company is ex ante to the PE fund investment in the
portfolio company. Co-investment, which is investing alongside the PE fund in the portfolio
companies, is not an ex ante linkage. Relatedly, I also code a deal linkage to exist if a SWF
invests in two PE funds which syndicate investment into a single portfolio company.
The other type of deal linkage I look for is when SWFs are involved in operations of the
portfolio companies, depicted in Figure 1, panel B. A member of the SWF may be appointed to
the portfolio company board. Or, importantly, companies which are owned by SWFs may have a
key upstream or downstream relation with the portfolio company.
The other set of linkages I look for are exit linkages. Exit linkages are when the SWF,
one of its direct holdings, or another PE fund in which the SWF invests as an LP buys the
portfolio company from the PE fund.
To identify Deal and Exit Linkages, I implemented a four-step process. The first step is to
cross-reference all of the SWF direct holdings with the names of the portfolio company, looking
for companies in which the SWF had an ownership stake prior to an investment by a PE fund.
16
The second step is to do manual searches of news articles in Factiva and Google. I search for any
hit with both the name of the SWF (or one of its investing vehicles) and the name of the portfolio
companies in which the SWF invests indirectly through the PE fund. In Factiva, which only
brings up exact hits, I read all resulting news articles in all news sources covered by Factiva. In
Google, I analyze the first two pages of results; for most searches, this included all of the results.
In reading the article, I code the existence of a linkage if any of the people, operations, or ex ante
investment scenarios described above exist. Especially in Google, I have to ensure that the hit
represented meaningful content of a relationship and not just artifacts of the names of both
search terms being in broad lists.
A weakness in this methodology is that in searching for links between the SWF and
portfolio companies, I might miss linkages between SWF direct-owned companies and the
portfolio companies. Thus, I augment the search with a scraping algorithm to extract connections
in Lexis-Nexis. An algorithm searches the name of each portfolio company in which a particular
SWF indirectly invests with each of that SWF’s direct holdings. (This was millions of cross-
referenced searches, which is why I scraped it.) The majority of the searches resulted in no hits.
Where I had a hit, I read all the articles for relationships.1112
The final step to fund linkages focuses on identifying additional linkages in exits. For the
companies that exit by a sale or secondary buyout, I record which company or PE fund bought it.
I then cross-reference whether the acquirer was in the direct holdings of the SWF (or the SWF
11 We encountered a difficulty with Lexis-Nexis in the process of this procedure and had to finish the process in Google for half of Alaska and half of the GIC portfolio companies. The process was not identical, as we had to filter through many more hits and in the end had only limited usable results. However, in as much as the proportion of searches for GIC and Alaska (the two largest PE fund investors) were about the same, I do not think this slight selection should interfere with results. My results are robust to the smaller sample of hits, which favors finding links for Alaska compared to the other SWFs. 12 An argument can be made that there is subjectivity in the coding of whether or not a deal or link linkage exists. I provide the taxonomy of resulting linkage types as panel B of Table 5, which can hopefully dispel this concern. [forthcoming… this part of the table is dated and does not include all of the linkages uncovered].

17
itself) or, for a secondary buyout, if the acquiring PE fund is also a fund in which the SWF
invests. Table 5 presents the linkages statistics.
IV. Results
IV.a. PE Fund Returns Results
Table 6 is the main returns results. Column 1 reports estimates from regressing the PE
fund Excess IRR on Deal and Exit Linkages for all PE funds with a SWF investor and a vintage
age of 5 years or more. Taking the coefficients at face value, activism is Deal Linkages has a
negative and significant influence on Excess IRR leading to a PE fund performance decrease of
2.263 percentage points in IRR. Conversely, activism in Exit Linkages has a positive and
significant impact, leading to a PE fund increase of 5.796 percentage points.
Column 2 adds in the Alaska linkages (as a separate dependent variable) and the Alaska
PE fund observations. I use Alaska as a placebo, in the sense that I know Alaska’s linkages
reflect coincidence rather than activism since its asset class portfolios are managed by distinct
remote managers. But, perhaps my methodology of collecting linkages picks up something
special about PE funds that is not related to activism but rather a characteristic of my design or of
the types of PE funds large, sovereign investors choose. I find this not to be the case. The Alaska
linkages never lead to significant returns results (columns 2, 4, 5, 6, 7, 8).
The remaining columns of Table 6 are robustness tests of these columns 1 and 2 results to
different samples and performance measures. In columns 3 and 4, the dependent variable is
Excess Multiple of Invested Capital. The results are materially similar. Deal linkages lead to
lower performance and Exit Linkages lead to higher performance, with a slightly larger sample

18
size. Columns 5-8 address the possibility that multicollinearity among the two linkage measures
is driving the result. I throw out the thirteen PE funds with both a Deal and a Exit Linkage and
then estimate the effects for Deal and Exit Linkages separately. Although the coefficients
become more imprecisely measured, the results look similar. Finally, in columns 9 and 10, I
change the vintage age minimum to 3 and 7 years (rather than my default of 5 year) for
robustness. The shorter age cutoff ( 3 years) provides me with a larger sample, but the estimates
are more noisy. The magnitude of the results increases in the stringency of the age cutoff,
perhaps as attenuation bias does down.
Table 7 tests whether my results are robust to a different benchmark, in particular, a
benchmark calibrated by similarly large, quasi-sovereign, long-horizon investor, namely,
CalPERS. Instead of using Excess IRR as my dependent variable, I use the native Net IRR. I
include dummy variables for each vintage year and each geography (6 regions), and saturate the
model as much as I can by interacting year and geography with the venture indicator. Then, I
include all the observations of PE funds for CalPERS. The idea is to let the CalPERS
observations help to calibrate the fixed effects for year and geography, by being venture or not,
and then ask whether linkages still affect performance.13
Table 7 reports that the effect of linkage activism is unchanged from Table 6. Columns
1, 3, and 5 exclude Alaska, and columns 3-6 allow for CalPERS and Alaska fixed effects
(“alphas”) in PE Fund selection, just to ensure that I am not just loading a difference in PE fund
picking onto the linkages variables. Across the first four columns, a Deal Linkage results in
approximately a 4.1 percentage point decrease in performance, and an Exit Linkage results in a
13 An alternative method would be to calculate the vintage-geography-venture return averages in CalPERS and test the linkages against this benchmark, similar to Table 6. I choose this less standard method to exploit the observation count for more precision in the estimates.

19
4.8 percentage point increase in PE fund performance, consistent with the pattern of my main
result of the prior table.
The idea in columns 5 and 6 of Table 7 is to make sure that I am not benchmarking off
the other PE funds chosen by the SWF investor. I toss out all PE funds in which the SWF invests
passively (with neither type of linkage). The results are unchanged.
IV.b. PE Fund Proxy Returns (Follow-On Variables) Results
To summarize the prior subsection, the main results (column 1 of Table 6) were that Deal
Linkages result in 2.3 lower overall PE fund return and Exit Linkages result in 5.8 higher overall
PE fund return. Alaska, a placebo, is not associated with any abnormal returns. The results from
Table 7 suggest that the main IRR are robust to different benchmarks and samples.
However, all of these results are cast in the problem of a possible selection bias in Preqin.
Preqin only has returns for a portion of the overall sample, and although I benchmark against PE
funds with the same selection bias, I may not be able to generalize outside of the “within” the
selection sample.
Thus, Table 8 estimates the effect of linkages on three additional measures of PE fund
performance. The dependent variables in columns 1, 2, and 3 are, respectively, the existence of a
follow-on fund (an indicator), the size of the follow-on fund (in $ millions and including $0 for
no follow-on) and the oversubscription rate of the follow-on conditional on not being “still
raising” and there being a follow-on. I include the $0 follow-on in the second dependent variable
to capture both the intensive and extensive margins and to not parse down the sample (as in the
third dependent variable).
20
Perhaps it is most instructive to start in Panel B of Table 8, where I test how well these
variables correlate with Excess IRR and Excess Multiple of Invested Capital. I put these Preqin
excess returns variables on the right hand side, only so that I can control for the size of the
original fund when the dependent variable is the size of the follow-on. All of the proxy variables
for PE fund returns are positively significant. What I am most interested in, however, is amount
of variation explained (ignoring differences in sample sizes at the moment). What panel B
suggests to me is that the follow-on size variable will be the most informative, to the extent it
absorbs more of the variation with Preqin returns.
Returning to panel A of Table 8, I find that the relationship between Exit Linkages and
positive returns is significant across the three first columns (and generally consistent in the
columns which have the very limited sample in columns 5-8). The Deal Linkages variable is
negative across all rows but not significant. In column 2, the follow-on size variable which I
prefer from the panel B results, the p-value is 0.118.
I interpret these results as consistent with my main returns results.
IV.c. Exit Results & Magnitude
The results that Deal and Exit Linkages result in 2.3 lower and 5.8 higher PE fund
returns, respectively, seem robust but perhaps large. The mean count of linkages per PE fund,
conditional on their being a link, is 1.7 for Deal Linkages and 1.4 for Exit linkages. Thus, to see
these sort of PE fund-level return differentials and to attribute the entire effect to the portfolio
companies which are linked, it must be that performance of these linked companies have vastly
different performance. A rough back of the envelope calculation, assuming 10 equally-sized
portfolio companies per PE fund suggest that the 1.7 portfolio companies with Deal Linkages
21
would need to have abnormal negative performance of 13.3 percentage points (in IRR) to yield
PE fund excess return of –2.3. Likewise, the 1.4 portfolio companies with Exit Linkages would
need a positive abnormal performance of 16.4 percentage points.
These figures are not out of the ballpark for private equity companies. However, turning
to the exits performance may help in interpretation. Table 9, panel A reports a system of
estimations (seemingly unrelated estimation) of the likelihood of one of the four exits – IPO,
sale, buyout, or out of business. The main result is estimation 1 of panel A. Estimation 2
reproduces the Preqin sample, and panel B uses a multinomial logit for robustness. I can only run
exit estimations for the Deal Linkages, since the exit linkages imply their own result (sales and
buyouts).
The important aspect of my empirical design of Table 9 is that I control for PE fund fixed
effects. In other words, I am comparing exits within a given PE fund. Do the portfolio companies
with a linkage in a PE fund do better than the other portfolio companies in the same PE fund? I
also include fixed effects for company investment year, company region, and company industry,
as well as the interaction of venture with investment year, industry and region fixed effects.
I find that companies with Deal Linkages are 0.14 more likely to exit via a strategic sale.
Half of this effect is due to companies not going out of business. The residual appears to be
slight decreasing in IPO-ing (not significant). These exits occur more slowly on average.
Ignoring the portfolio companies not yet exited, the average exit for non-linked portfolio
companies held by SWF is 4.0 years. For portfolio companies with Deal Linkages, the exit time
is 4.85 years. The same numbers are approximately true for just looking at the length of time for
22
the sale exits. Thus, the Deal Linked exits are slower. This in and of itself is nearly sufficient to
generate some large IRR differentials.14
V. Conclusion
This paper documents the influence that large investors exhibit over PE fund decisions.
Influence comes in the form of operational or selection linkages between investors and portfolio
companies and exit linkages to investors observed when portfolio companies are close out of PE
fund portfolios. In economic magnitude terms, large investors influence 3.6 percent of portfolio
company deals and 2.3 percent of portfolio company exits.
While Exit Linkages result in 5.8 percent higher PE fund IRRs, deal linkages result in 2.3
percentage points lower PE fund IRRs. These results appear to be robust across different
samples, different benchmarks, and different measures of returns, including proxy measures
relating to future fundraising as suggested by the literature. To generate these magnitudes, the
portfolio companies with deal linkages must perform 13.3 percentage points worse in IRR,
companies with exit linkages must perform 16.4 better in IRR.
The mechanism of the Exit Linkages results seem somewhat straightforward: SWFs
appear to bail out companies, especially those regionally connected to the SWF, by using buyout
and acquisitions of their own direct holdings. These are favorable “floors” set by SWFs wanting
to keep firms in business. The private incentives and networks of SWF pay off for other LP
investors in this arena.
14 I am trying to compile some evidence as to whether the exit sales of deal-linked portfolio companies are at a lower valuation, although this is a tall data task. Also in a future draft I hope to do a more systematic analysis as to whether the time differential is sufficient to explain the overall performance loss due to linkages, and to look for any gauges (raising new funds, etc.) for evidence on distraction of the large PE funds.

23
The mechanism of the deal linkages is a bit more complex. I document that deal linkage
companies are 14 percent more likely to exit via a sale. These sales take nearly a year longer.
This time different would results in a significant difference in IRR if the valuations were the
same or lower.
Taken together, I find that while deal linkages impair performance, exit linkages offer
floors, overall lowering the risk profile of the PE fund. If the question we undertook was whether
LP investors should pay attention to selection of other LP investors in a PE fund, particularly
active LP investors, the answer is yes. But, the details of when and where having activist
investors is good and bad may matter more than “if”.
24
References
Bulow, Jeremy I. and Kenneth Rogoff, 1989. "Sovereign Debt: Is to Forgive to Forget?"
American Economic Review, 79 (1) , 43-50.
Chen, Henry, Paul Gompers, Anna Kovner, and Josh Lerner, 2010. “Buy local? The Geography
of Venture Capital.” Journal of Urban Economics, 67, 90-102.
Cooke, Murray, 2003. “The Canada Pension Plan Goes to Market.” Canadian Review of Social
Policy/Revue Canadienne de politique sociale, Issue 51, 126-131.
Dyck, Alexander and Adair Morse, 2010. “Sovereign Wealth Fund Portfolios.” University of
Chicago Working Paper.
Gompers, Paul, and Josh Lerner, 1996. “The Use of Covenants: An Empirical Analysis of
Venture Partnership Agreements.” Journal of Law and Economics, 39, 463-498.
Hochberg, Yael V., Alexander Ljungqvist and Yang Lu, 2007. “Whom You Know Matters:
Venture Capital Networks and Investment Performance .” Journal of Finance, Vol. 62 (1), 251-
301.
Hochberg, Yael V., Alexander Ljungqvist, and Annette Vissing-Jørgensen, 2010. “Informational
Hold-Up and Performance Persistence in Venture Capital.” Working paper, Northwestern
University and New York University.
Hochberg, Yael and Joshua Rauh, 2011. “Local Overweighting and Underperformance:
Evidence from Limited Partner Private Equity Investments.” Kellogg Working Paper
Kaplan, Steven N., Frederic Martel, and Per Strömberg, 2007. “How do legal differences and
experience affect financial contracts?” Journal of Financial Intermediation, 16, 273-311.
25
Kaplan, Steven N., and Antoinette Schoar, 2005. “Private Equity Performance: Returns,
Persistence, and Capital Flows.” Journal of Finance, 60, 1791-1823.
Korteweg, Arthur, and Morten Sorensen, 2010. "Risk and Return Characteristics of Venture
Capital-Backed Entrepreneurial Companies." The Review of Financial Studies 23, (10), 3738-
3772.
Lerner, Josh, and Antoinette Schoar, 2004. “The illiquidity puzzle: theory and evidence from
private equity.” Journal of Financial Economics, 72, 3-40.
Lerner, Josh, and Antoinette Schoar, 2005.“Does Legal Enforcement Affect Financial
Transactions? The Contractual Channel in Private Equity.” Quarterly Journal of Economics,
120, 223-246.
Lerner, Josh, Antoinette Schoar, and Wan Wongsunwai, 2007. “Smart Institutions, Foolish
Choices: The Limited Partner Performance Puzzle.” Journal of Finance, 62, 731-764.
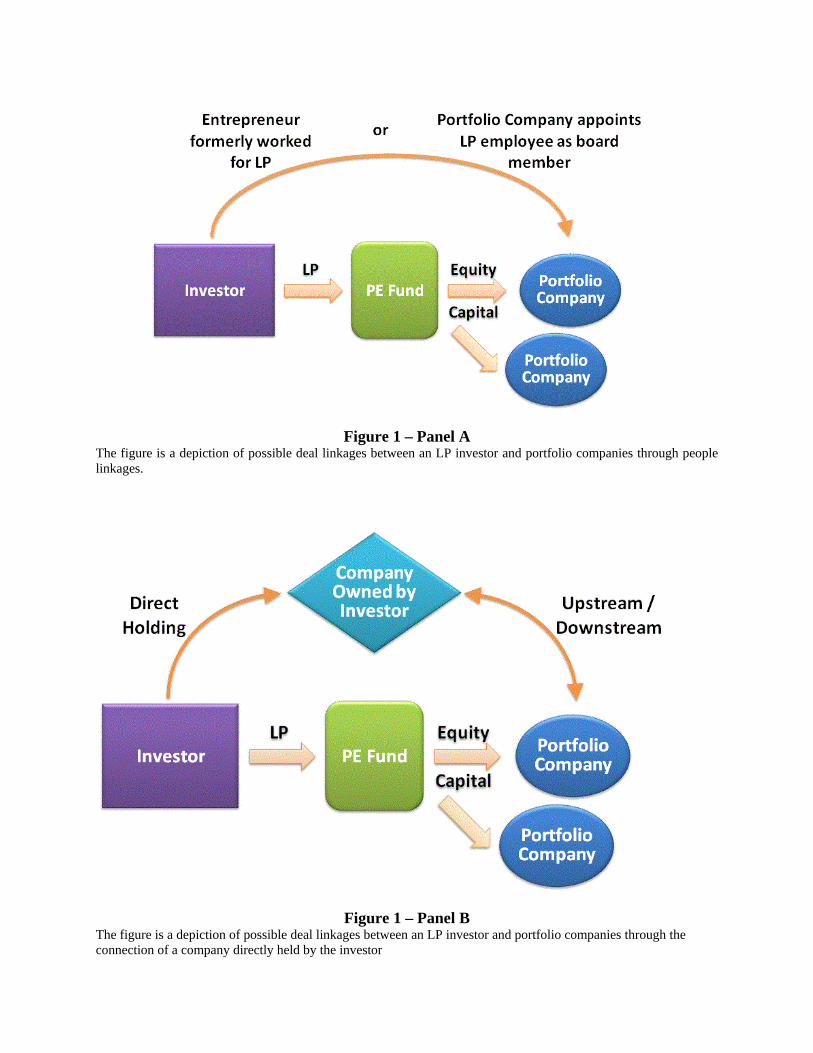
Figure 1 – Panel A The figure is a depiction of possible deal linkages between an LP investor and portfolio companies through people linkages.
Figure 1 – Panel B The figure is a depiction of possible deal linkages between an LP investor and portfolio companies through the connection of a company directly held by the investor
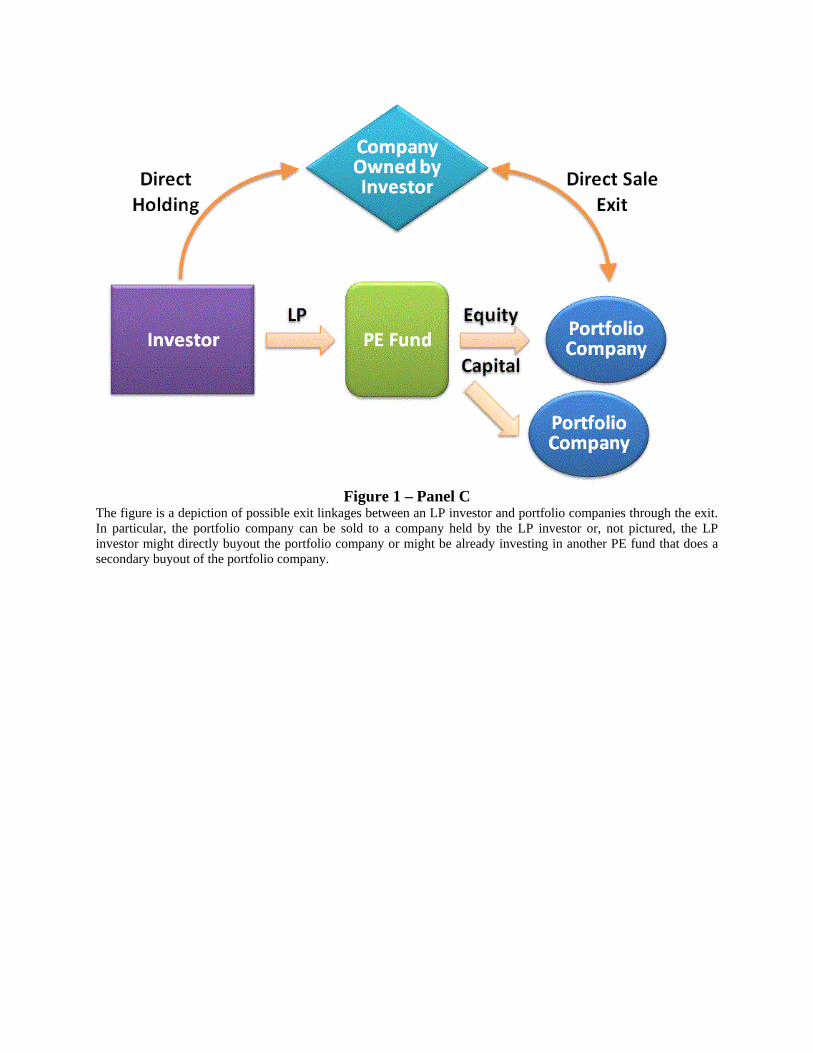
Figure 1 – Panel C
The figure is a depiction of possible exit linkages between an LP investor and portfolio companies through the exit. In particular, the portfolio company can be sold to a company held by the LP investor or, not pictured, the LP investor might directly buyout the portfolio company or might be already investing in another PE fund that does a secondary buyout of the portfolio company.
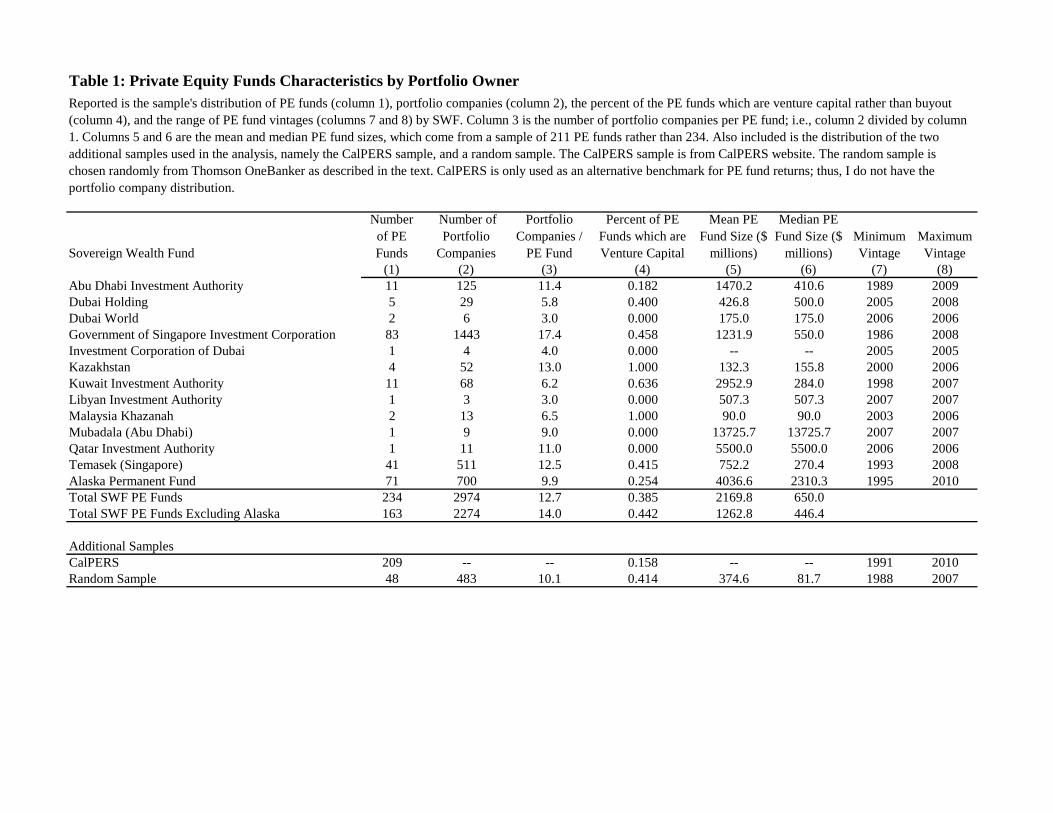
Table 1: Private Equity Funds Characteristics by Portfolio Owner
Sovereign Wealth Fund
Number of PE Funds
Number of Portfolio
Companies
Portfolio Companies /
PE Fund
Percent of PE Funds which are Venture Capital
Mean PE Fund Size ($
millions)
Median PE Fund Size ($
millions)Minimum Vintage
Maximum Vintage
(1) (2) (3) (4) (5) (6) (7) (8)Abu Dhabi Investment Authority 11 125 11.4 0.182 1470.2 410.6 1989 2009Dubai Holding 5 29 5.8 0.400 426.8 500.0 2005 2008Dubai World 2 6 3.0 0.000 175.0 175.0 2006 2006Government of Singapore Investment Corporation 83 1443 17.4 0.458 1231.9 550.0 1986 2008Investment Corporation of Dubai 1 4 4.0 0.000 -- -- 2005 2005Kazakhstan 4 52 13.0 1.000 132.3 155.8 2000 2006Kuwait Investment Authority 11 68 6.2 0.636 2952.9 284.0 1998 2007Libyan Investment Authority 1 3 3.0 0.000 507.3 507.3 2007 2007Malaysia Khazanah 2 13 6.5 1.000 90.0 90.0 2003 2006Mubadala (Abu Dhabi) 1 9 9.0 0.000 13725.7 13725.7 2007 2007Qatar Investment Authority 1 11 11.0 0.000 5500.0 5500.0 2006 2006Temasek (Singapore) 41 511 12.5 0.415 752.2 270.4 1993 2008Alaska Permanent Fund 71 700 9.9 0.254 4036.6 2310.3 1995 2010Total SWF PE Funds 234 2974 12.7 0.385 2169.8 650.0Total SWF PE Funds Excluding Alaska 163 2274 14.0 0.442 1262.8 446.4
Additional SamplesCalPERS 209 -- -- 0.158 -- -- 1991 2010Random Sample 48 483 10.1 0.414 374.6 81.7 1988 2007
Reported is the sample's distribution of PE funds (column 1), portfolio companies (column 2), the percent of the PE funds which are venture capital rather than buyout (column 4), and the range of PE fund vintages (columns 7 and 8) by SWF. Column 3 is the number of portfolio companies per PE fund; i.e., column 2 divided by column 1. Columns 5 and 6 are the mean and median PE fund sizes, which come from a sample of 211 PE funds rather than 234. Also included is the distribution of the two additional samples used in the analysis, namely the CalPERS sample, and a random sample. The CalPERS sample is from CalPERS website. The random sample is chosen randomly from Thomson OneBanker as described in the text. CalPERS is only used as an alternative benchmark for PE fund returns; thus, I do not have the portfolio company distribution.
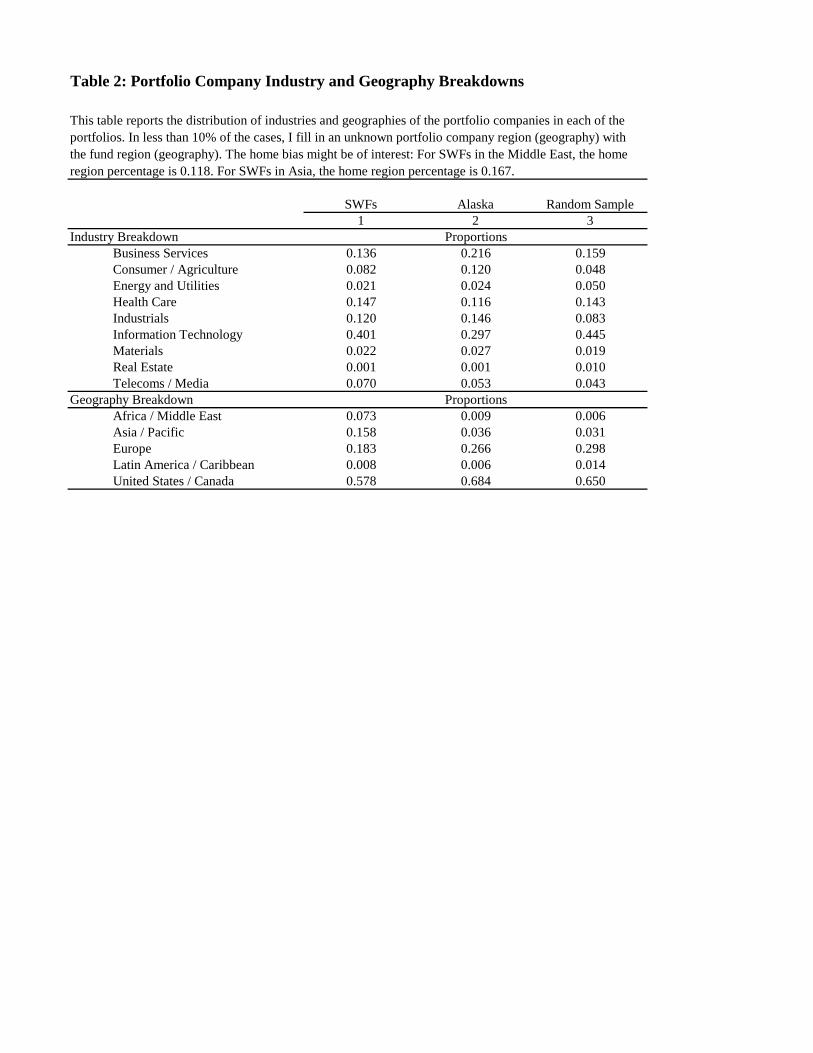
Table 2: Portfolio Company Industry and Geography Breakdowns
SWFs Alaska Random Sample1 2 3
Industry BreakdownBusiness Services 0.136 0.216 0.159Consumer / Agriculture 0.082 0.120 0.048Energy and Utilities 0.021 0.024 0.050Health Care 0.147 0.116 0.143Industrials 0.120 0.146 0.083Information Technology 0.401 0.297 0.445Materials 0.022 0.027 0.019Real Estate 0.001 0.001 0.010Telecoms / Media 0.070 0.053 0.043
Geography BreakdownAfrica / Middle East 0.073 0.009 0.006Asia / Pacific 0.158 0.036 0.031Europe 0.183 0.266 0.298Latin America / Caribbean 0.008 0.006 0.014United States / Canada 0.578 0.684 0.650
Proportions
Proportions
This table reports the distribution of industries and geographies of the portfolio companies in each of the portfolios. In less than 10% of the cases, I fill in an unknown portfolio company region (geography) with the fund region (geography). The home bias might be of interest: For SWFs in the Middle East, the home region percentage is 0.118. For SWFs in Asia, the home region percentage is 0.167.
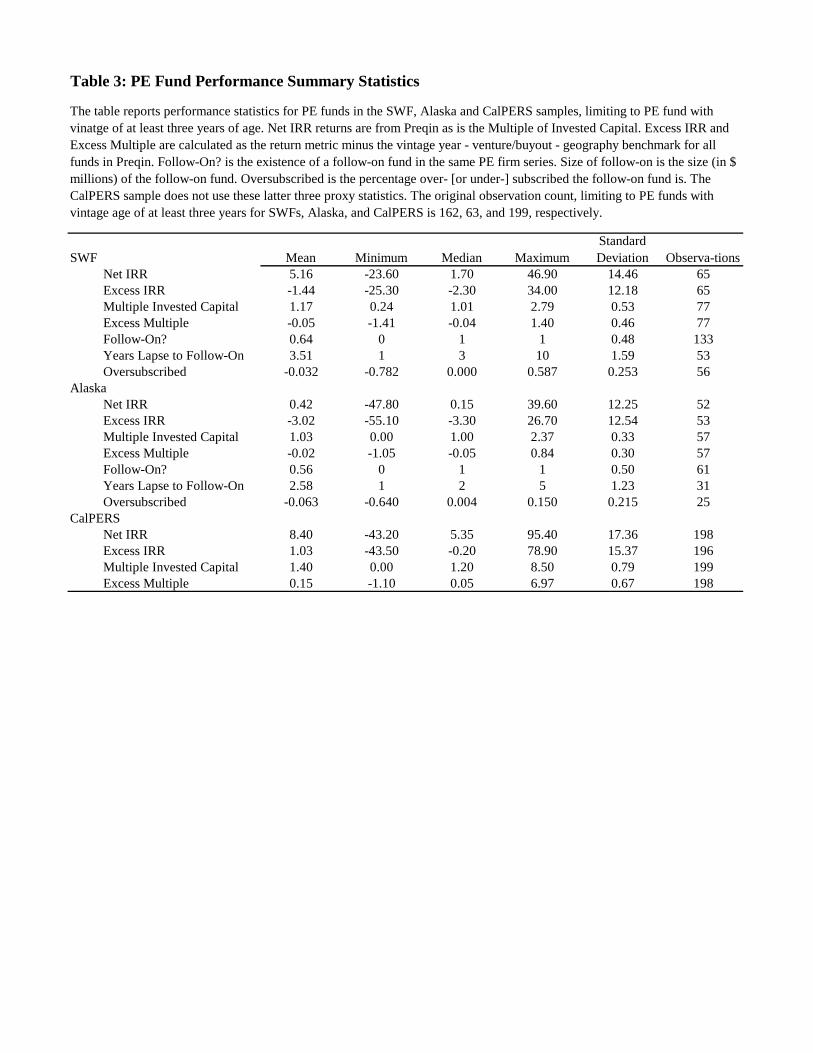
Table 3: PE Fund Performance Summary Statistics
SWF Mean Minimum Median MaximumStandard Deviation Observa-tions
Net IRR 5.16 -23.60 1.70 46.90 14.46 65Excess IRR -1.44 -25.30 -2.30 34.00 12.18 65Multiple Invested Capital 1.17 0.24 1.01 2.79 0.53 77Excess Multiple -0.05 -1.41 -0.04 1.40 0.46 77Follow-On? 0.64 0 1 1 0.48 133Years Lapse to Follow-On 3.51 1 3 10 1.59 53Oversubscribed -0.032 -0.782 0.000 0.587 0.253 56
AlaskaNet IRR 0.42 -47.80 0.15 39.60 12.25 52Excess IRR -3.02 -55.10 -3.30 26.70 12.54 53Multiple Invested Capital 1.03 0.00 1.00 2.37 0.33 57Excess Multiple -0.02 -1.05 -0.05 0.84 0.30 57Follow-On? 0.56 0 1 1 0.50 61Years Lapse to Follow-On 2.58 1 2 5 1.23 31Oversubscribed -0.063 -0.640 0.004 0.150 0.215 25
CalPERSNet IRR 8.40 -43.20 5.35 95.40 17.36 198Excess IRR 1.03 -43.50 -0.20 78.90 15.37 196Multiple Invested Capital 1.40 0.00 1.20 8.50 0.79 199Excess Multiple 0.15 -1.10 0.05 6.97 0.67 198
The table reports performance statistics for PE funds in the SWF, Alaska and CalPERS samples, limiting to PE fund with vinatge of at least three years of age. Net IRR returns are from Preqin as is the Multiple of Invested Capital. Excess IRR and Excess Multiple are calculated as the return metric minus the vintage year - venture/buyout - geography benchmark for all funds in Preqin. Follow-On? is the existence of a follow-on fund in the same PE firm series. Size of follow-on is the size (in $ millions) of the follow-on fund. Oversubscribed is the percentage over- [or under-] subscribed the follow-on fund is. The CalPERS sample does not use these latter three proxy statistics. The original observation count, limiting to PE funds with vintage age of at least three years for SWFs, Alaska, and CalPERS is 162, 63, and 199, respectively.
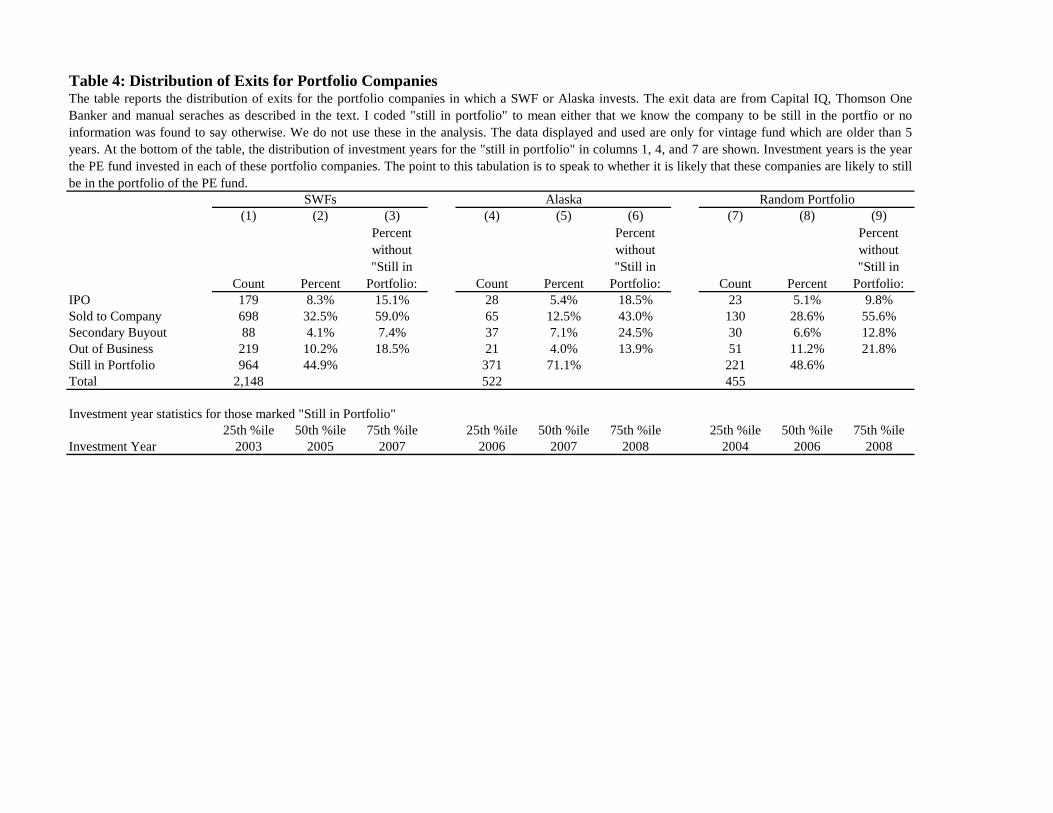
Table 4: Distribution of Exits for Portfolio Companies
(1) (2) (3) (4) (5) (6) (7) (8) (9)
Count Percent
Percent without "Still in
Portfolio: Count Percent
Percent without "Still in
Portfolio: Count Percent
Percent without "Still in
Portfolio:IPO 179 8.3% 15.1% 28 5.4% 18.5% 23 5.1% 9.8%Sold to Company 698 32.5% 59.0% 65 12.5% 43.0% 130 28.6% 55.6%Secondary Buyout 88 4.1% 7.4% 37 7.1% 24.5% 30 6.6% 12.8%Out of Business 219 10.2% 18.5% 21 4.0% 13.9% 51 11.2% 21.8%Still in Portfolio 964 44.9% 371 71.1% 221 48.6%Total 2,148 522 455
Investment year statistics for those marked "Still in Portfolio"25th %ile 50th %ile 75th %ile 25th %ile 50th %ile 75th %ile 25th %ile 50th %ile 75th %ile
Investment Year 2003 2005 2007 2006 2007 2008 2004 2006 2008
The table reports the distribution of exits for the portfolio companies in which a SWF or Alaska invests. The exit data are from Capital IQ, Thomson OneBanker and manual seraches as described in the text. I coded "still in portfolio" to mean either that we know the company to be still in the portfio or noinformation was found to say otherwise. We do not use these in the analysis. The data displayed and used are only for vintage fund which are older than 5years. At the bottom of the table, the distribution of investment years for the "still in portfolio" in columns 1, 4, and 7 are shown. Investment years is the yearthe PE fund invested in each of these portfolio companies. The point to this tabulation is to speak to whether it is likely that these companies are likely to stillbe in the portfolio of the PE fund.
SWFs Random PortfolioAlaska
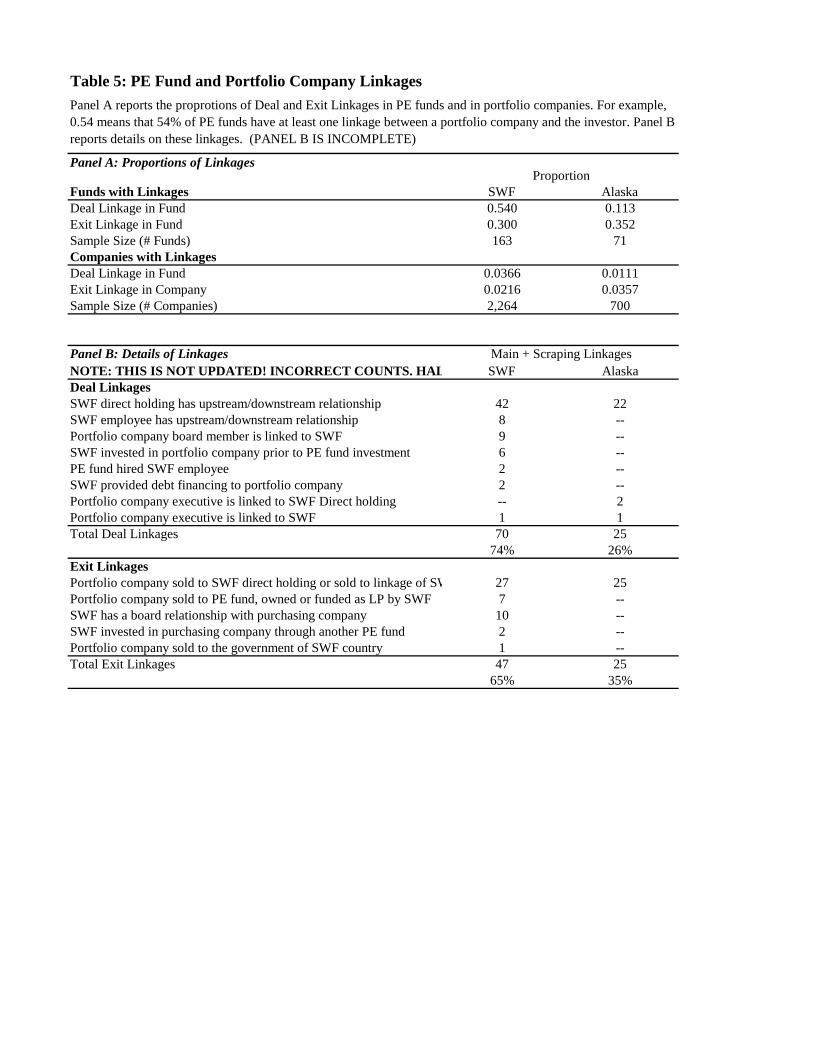
Table 5: PE Fund and Portfolio Company Linkages
Panel A: Proportions of Linkages
Funds with Linkages SWF AlaskaDeal Linkage in Fund 0.540 0.113Exit Linkage in Fund 0.300 0.352Sample Size (# Funds) 163 71Companies with LinkagesDeal Linkage in Fund 0.0366 0.0111Exit Linkage in Company 0.0216 0.0357Sample Size (# Companies) 2,264 700
Panel B: Details of LinkagesNOTE: THIS IS NOT UPDATED! INCORRECT COUNTS. HAL SWF AlaskaDeal LinkagesSWF direct holding has upstream/downstream relationship 42 22SWF employee has upstream/downstream relationship 8 --Portfolio company board member is linked to SWF 9 --SWF invested in portfolio company prior to PE fund investment 6 --PE fund hired SWF employee 2 --SWF provided debt financing to portfolio company 2 --Portfolio company executive is linked to SWF Direct holding -- 2Portfolio company executive is linked to SWF 1 1Total Deal Linkages 70 25
74% 26%Exit LinkagesPortfolio company sold to SWF direct holding or sold to linkage of SW 27 25Portfolio company sold to PE fund, owned or funded as LP by SWF 7 --SWF has a board relationship with purchasing company 10 --SWF invested in purchasing company through another PE fund 2 --Portfolio company sold to the government of SWF country 1 --Total Exit Linkages 47 25
65% 35%
Main + Scraping Linkages
Panel A reports the proprotions of Deal and Exit Linkages in PE funds and in portfolio companies. For example, 0.54 means that 54% of PE funds have at least one linkage between a portfolio company and the investor. Panel B reports details on these linkages. (PANEL B IS INCOMPLETE)
Proportion
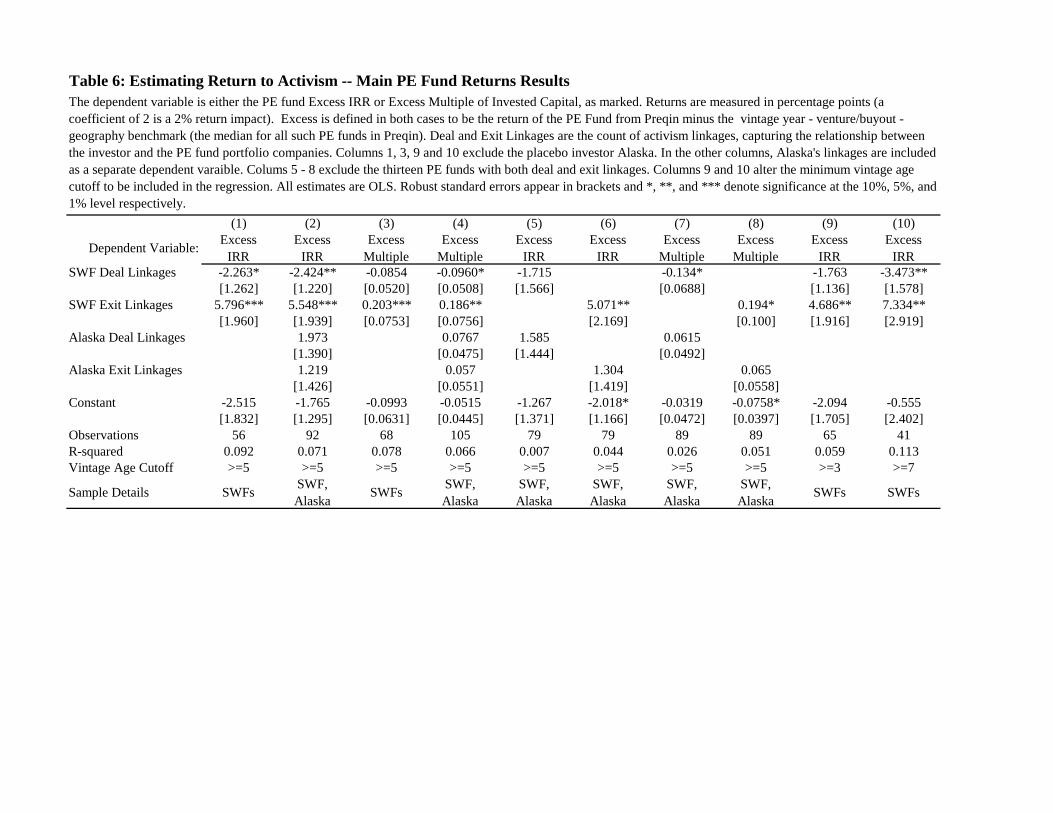
Table 6: Estimating Return to Activism -- Main PE Fund Returns Results
(1) (2) (3) (4) (5) (6) (7) (8) (9) (10)
Dependent Variable: Excess IRR
Excess IRR
Excess Multiple
Excess Multiple
Excess IRR
Excess IRR
Excess Multiple
Excess Multiple
Excess IRR
Excess IRR
SWF Deal Linkages -2.263* -2.424** -0.0854 -0.0960* -1.715 -0.134* -1.763 -3.473**[1.262] [1.220] [0.0520] [0.0508] [1.566] [0.0688] [1.136] [1.578]
SWF Exit Linkages 5.796*** 5.548*** 0.203*** 0.186** 5.071** 0.194* 4.686** 7.334**[1.960] [1.939] [0.0753] [0.0756] [2.169] [0.100] [1.916] [2.919]
Alaska Deal Linkages 1.973 0.0767 1.585 0.0615[1.390] [0.0475] [1.444] [0.0492]
Alaska Exit Linkages 1.219 0.057 1.304 0.065[1.426] [0.0551] [1.419] [0.0558]
Constant -2.515 -1.765 -0.0993 -0.0515 -1.267 -2.018* -0.0319 -0.0758* -2.094 -0.555[1.832] [1.295] [0.0631] [0.0445] [1.371] [1.166] [0.0472] [0.0397] [1.705] [2.402]
Observations 56 92 68 105 79 79 89 89 65 41R-squared 0.092 0.071 0.078 0.066 0.007 0.044 0.026 0.051 0.059 0.113Vintage Age Cutoff >=5 >=5 >=5 >=5 >=5 >=5 >=5 >=5 >=3 >=7
Sample Details SWFs SWF, Alaska SWFs SWF,
AlaskaSWF, Alaska
SWF, Alaska
SWF, Alaska
SWF, Alaska SWFs SWFs
The dependent variable is either the PE fund Excess IRR or Excess Multiple of Invested Capital, as marked. Returns are measured in percentage points (a coefficient of 2 is a 2% return impact). Excess is defined in both cases to be the return of the PE Fund from Preqin minus the vintage year - venture/buyout - geography benchmark (the median for all such PE funds in Preqin). Deal and Exit Linkages are the count of activism linkages, capturing the relationship between the investor and the PE fund portfolio companies. Columns 1, 3, 9 and 10 exclude the placebo investor Alaska. In the other columns, Alaska's linkages are included as a separate dependent varaible. Colums 5 - 8 exclude the thirteen PE funds with both deal and exit linkages. Columns 9 and 10 alter the minimum vintage age cutoff to be included in the regression. All estimates are OLS. Robust standard errors appear in brackets and *, **, and *** denote significance at the 10%, 5%, and 1% level respectively.
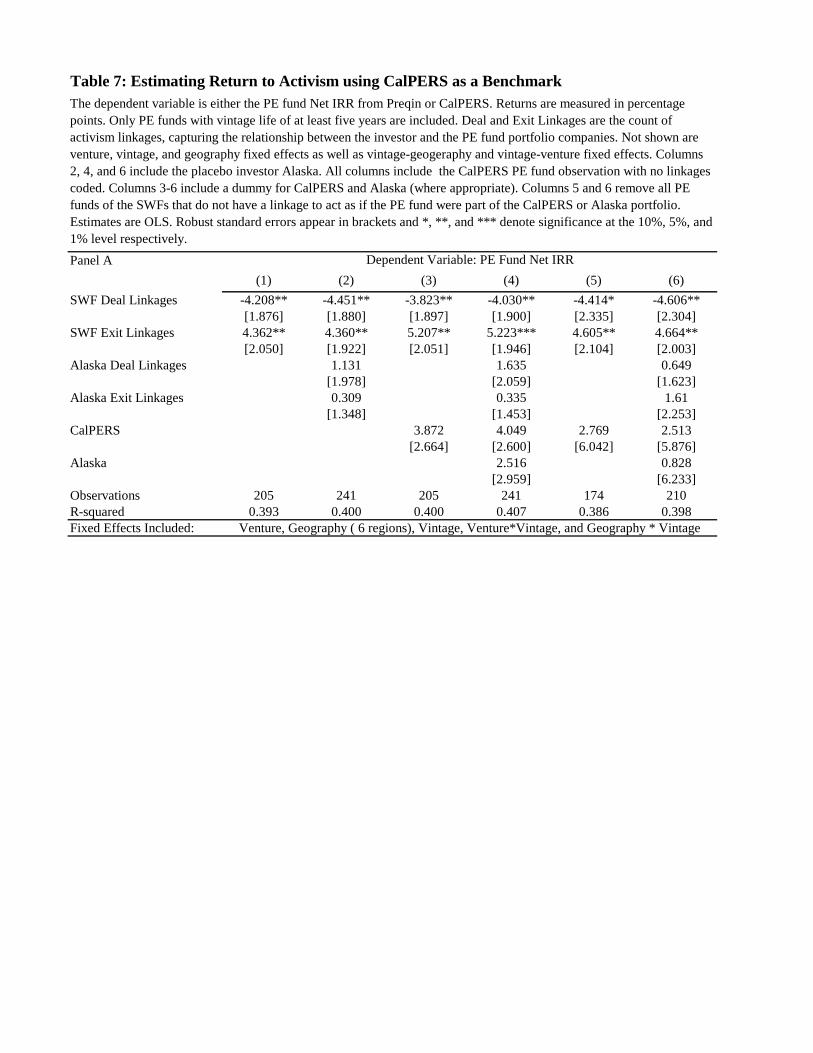
Table 7: Estimating Return to Activism using CalPERS as a Benchmark
Panel A(1) (2) (3) (4) (5) (6)
SWF Deal Linkages -4.208** -4.451** -3.823** -4.030** -4.414* -4.606**[1.876] [1.880] [1.897] [1.900] [2.335] [2.304]
SWF Exit Linkages 4.362** 4.360** 5.207** 5.223*** 4.605** 4.664**[2.050] [1.922] [2.051] [1.946] [2.104] [2.003]
Alaska Deal Linkages 1.131 1.635 0.649[1.978] [2.059] [1.623]
Alaska Exit Linkages 0.309 0.335 1.61[1.348] [1.453] [2.253]
CalPERS 3.872 4.049 2.769 2.513[2.664] [2.600] [6.042] [5.876]
Alaska 2.516 0.828[2.959] [6.233]
Observations 205 241 205 241 174 210R-squared 0.393 0.400 0.400 0.407 0.386 0.398Fixed Effects Included:
Dependent Variable: PE Fund Net IRR
The dependent variable is either the PE fund Net IRR from Preqin or CalPERS. Returns are measured in percentage points. Only PE funds with vintage life of at least five years are included. Deal and Exit Linkages are the count of activism linkages, capturing the relationship between the investor and the PE fund portfolio companies. Not shown are venture, vintage, and geography fixed effects as well as vintage-geogeraphy and vintage-venture fixed effects. Columns 2, 4, and 6 include the placebo investor Alaska. All columns include the CalPERS PE fund observation with no linkages coded. Columns 3-6 include a dummy for CalPERS and Alaska (where appropriate). Columns 5 and 6 remove all PE funds of the SWFs that do not have a linkage to act as if the PE fund were part of the CalPERS or Alaska portfolio. Estimates are OLS. Robust standard errors appear in brackets and *, **, and *** denote significance at the 10%, 5%, and 1% level respectively.
Venture, Geography ( 6 regions), Vintage, Venture*Vintage, and Geography * Vintage
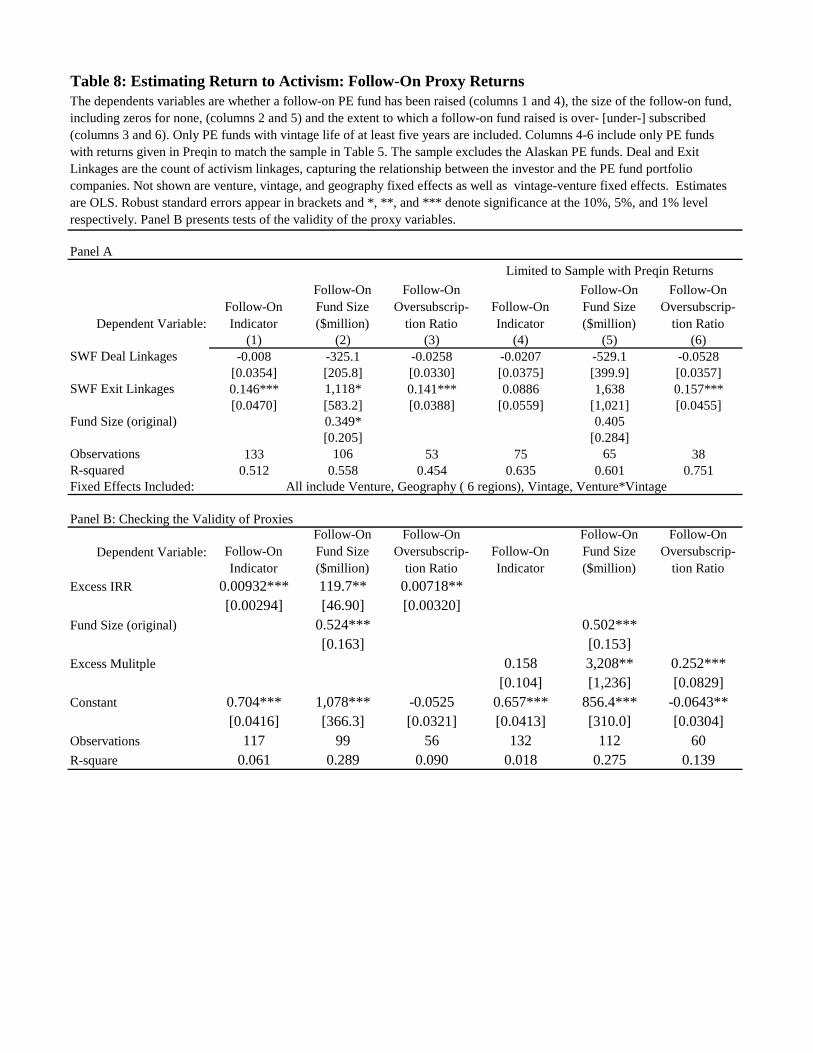
Table 8: Estimating Return to Activism: Follow-On Proxy Returns
Panel A
Dependent Variable:Follow-On Indicator
Follow-On Fund Size ($million)
Follow-On Oversubscrip-
tion RatioFollow-On Indicator
Follow-On Fund Size ($million)
Follow-On Oversubscrip-
tion Ratio(1) (2) (3) (4) (5) (6)
SWF Deal Linkages -0.008 -325.1 -0.0258 -0.0207 -529.1 -0.0528[0.0354] [205.8] [0.0330] [0.0375] [399.9] [0.0357]
SWF Exit Linkages 0.146*** 1,118* 0.141*** 0.0886 1,638 0.157***[0.0470] [583.2] [0.0388] [0.0559] [1,021] [0.0455]
Fund Size (original) 0.349* 0.405[0.205] [0.284]
Observations 133 106 53 75 65 38R-squared 0.512 0.558 0.454 0.635 0.601 0.751Fixed Effects Included:
Panel B: Checking the Validity of Proxies
Dependent Variable: Follow-On Indicator
Follow-On Fund Size ($million)
Follow-On Oversubscrip-
tion RatioFollow-On Indicator
Follow-On Fund Size ($million)
Follow-On Oversubscrip-
tion RatioExcess IRR 0.00932*** 119.7** 0.00718**
[0.00294] [46.90] [0.00320]Fund Size (original) 0.524*** 0.502***
[0.163] [0.153]Excess Mulitple 0.158 3,208** 0.252***
[0.104] [1,236] [0.0829]Constant 0.704*** 1,078*** -0.0525 0.657*** 856.4*** -0.0643**
[0.0416] [366.3] [0.0321] [0.0413] [310.0] [0.0304]Observations 117 99 56 132 112 60R-square 0.061 0.289 0.090 0.018 0.275 0.139
All include Venture, Geography ( 6 regions), Vintage, Venture*Vintage
Limited to Sample with Preqin Returns
The dependents variables are whether a follow-on PE fund has been raised (columns 1 and 4), the size of the follow-on fund, including zeros for none, (columns 2 and 5) and the extent to which a follow-on fund raised is over- [under-] subscribed (columns 3 and 6). Only PE funds with vintage life of at least five years are included. Columns 4-6 include only PE funds with returns given in Preqin to match the sample in Table 5. The sample excludes the Alaskan PE funds. Deal and Exit Linkages are the count of activism linkages, capturing the relationship between the investor and the PE fund portfolio companies. Not shown are venture, vintage, and geography fixed effects as well as vintage-venture fixed effects. Estimates are OLS. Robust standard errors appear in brackets and *, **, and *** denote significance at the 10%, 5%, and 1% level respectively. Panel B presents tests of the validity of the proxy variables.
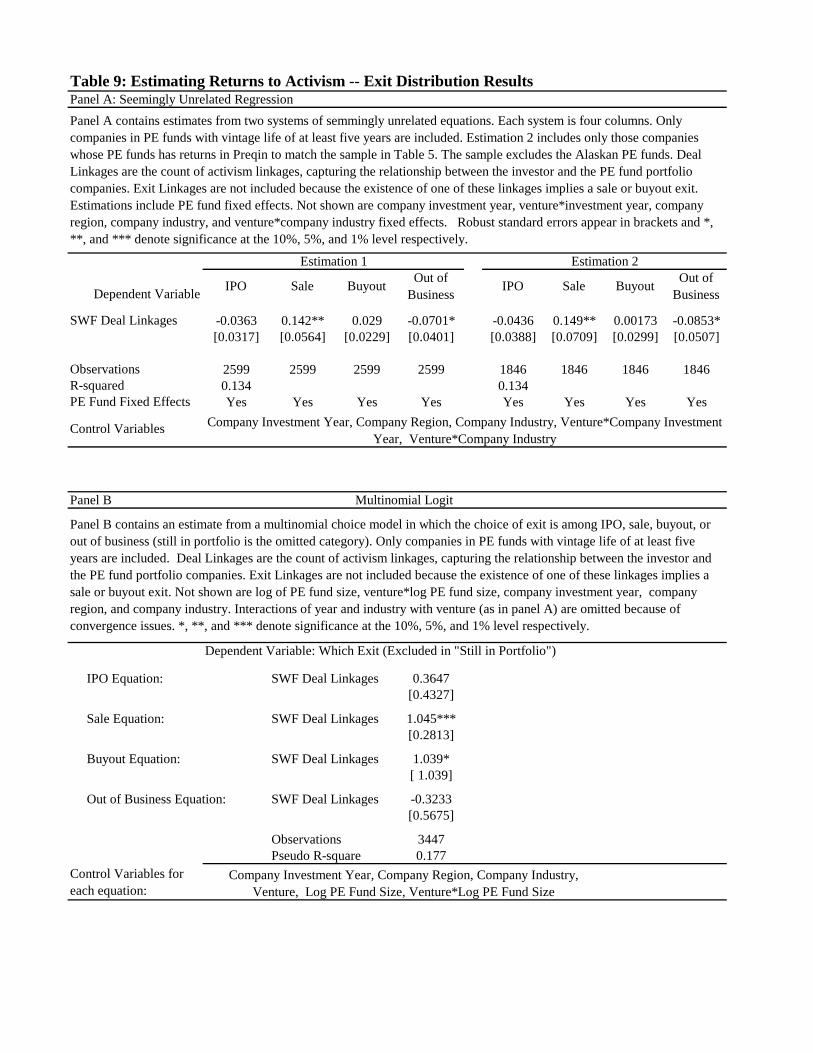
Table 9: Estimating Returns to Activism -- Exit Distribution ResultsPanel A: Seemingly Unrelated Regression
Dependent Variable IPO Sale Buyout Out of Business IPO Sale Buyout Out of
Business
SWF Deal Linkages -0.0363 0.142** 0.029 -0.0701* -0.0436 0.149** 0.00173 -0.0853*[0.0317] [0.0564] [0.0229] [0.0401] [0.0388] [0.0709] [0.0299] [0.0507]
Observations 2599 2599 2599 2599 1846 1846 1846 1846R-squared 0.134 0.134PE Fund Fixed Effects Yes Yes Yes Yes Yes Yes Yes Yes
Control Variables
Panel B
Dependent Variable: Which Exit (Excluded in "Still in Portfolio")
IPO Equation: SWF Deal Linkages 0.3647[0.4327]
Sale Equation: SWF Deal Linkages 1.045***[0.2813]
Buyout Equation: SWF Deal Linkages 1.039*[ 1.039]
Out of Business Equation: SWF Deal Linkages -0.3233[0.5675]
Observations 3447Pseudo R-square 0.177
Control Variables for each equation:
Panel A contains estimates from two systems of semmingly unrelated equations. Each system is four columns. Only companies in PE funds with vintage life of at least five years are included. Estimation 2 includes only those companies whose PE funds has returns in Preqin to match the sample in Table 5. The sample excludes the Alaskan PE funds. Deal Linkages are the count of activism linkages, capturing the relationship between the investor and the PE fund portfolio companies. Exit Linkages are not included because the existence of one of these linkages implies a sale or buyout exit. Estimations include PE fund fixed effects. Not shown are company investment year, venture*investment year, company region, company industry, and venture*company industry fixed effects. Robust standard errors appear in brackets and *, **, and *** denote significance at the 10%, 5%, and 1% level respectively.
Panel B contains an estimate from a multinomial choice model in which the choice of exit is among IPO, sale, buyout, or out of business (still in portfolio is the omitted category). Only companies in PE funds with vintage life of at least five years are included. Deal Linkages are the count of activism linkages, capturing the relationship between the investor and the PE fund portfolio companies. Exit Linkages are not included because the existence of one of these linkages implies a sale or buyout exit. Not shown are log of PE fund size, venture*log PE fund size, company investment year, company region, and company industry. Interactions of year and industry with venture (as in panel A) are omitted because of convergence issues. *, **, and *** denote significance at the 10%, 5%, and 1% level respectively.
Company Investment Year, Company Region, Company Industry, Venture*Company Investment Year, Venture*Company Industry
Company Investment Year, Company Region, Company Industry, Venture, Log PE Fund Size, Venture*Log PE Fund Size
Estimation 1 Estimation 2
Multinomial Logit